


Abstract
Rifampicin is a commonly used broad-spectrum antibiotic in aquaculture, but its pharmacokinetics in fish remain poorly understood, making it difficult to accurately assess the risk of its residues. The research examined how rifampicin is distributed across tissues and its elimination kinetics in Carassius auratus gibelio after a single intraperitoneal injection at a dose of 1.5 mg/kg. A precise and dependable ultra-performance liquid chromatography–tandem mass spectrometry (UPLC-MS/MS) technique was created and confirmed for measuring rifampicin in eight different tissues (muscle, liver, kidney, intestine, bile, pancreas, spleen, and brain) over a period of 456 h. Pharmacokinetic parameters were determined using a non-compartmental approach, and molecular docking was utilized to examine interactions with crucial ADME proteins such as PEPT1, CYP3A65, and P-gp. Rifampicin quickly spread to the enterohepatic system, showing the greatest concentration in the intestine (Maximum plasma concentration, Cmax 1525.85 ng/mL, Area under the concentration–time curve, AUC0-t 185,614.68 ng·h/mL) and bile, then in the liver and pancreas. The elimination half-lives differed significantly across tissues, with the brain having the longest at 90.75 h and the spleen at 88.88 h, while the kidney had the shortest at 46.70 h. The muscle showed a low peak concentration of 150.24 ng/mL but had a prolonged retention time with a half-life of 68.28 h and a mean residence time of 113.50 h, suggesting a residue profile characterized by low concentration and long retention. Enterohepatic recirculation was suggested by the multiphasic elimination curves observed in bile and intestine. The strong binding affinities of rifampicin to PEPT1 (–7.736 kcal/mol), CYP3A65 (–7.575 kcal/mol), and P-gp (–7.013 kcal/mol) were revealed through molecular docking, providing insight into the tissue-specific uptake, metabolism, and efflux. These results show that rifampicin remains in muscle tissue for long durations even with minimal accumulation, emphasizing the importance of careful residue monitoring. The combined pharmacokinetic and molecular docking method provides a useful framework for comprehending how xenobiotics are processed in fish, aiding in the scientific regulation of rifampicin in aquaculture.
1. Introduction
Rifampicin is a semisynthetic broad-spectrum bactericide that blocks the peptide reaction of peptidyltransferase, thereby blocking peptide chain elongation. It interferes with bacterial protein synthesis to achieve the effect of antibacterial sterilization [1]. In aquaculture, rifampicin is commonly used for the prevention and treatment of bacterial diseases caused by pathogenic bacteria, including fulminant hemorrhagic disease, bacterial gill-rot disease, white-mouth disease, red-skin disease, and other typical bacterial infections. It is also applied to control fulminant red-leg disease, bacterial enteropathy, yellow head disease, cloudy eye disease, muscle necrosis and other syndromes in shrimp, crab and shellfish caused by bacterial and viral pathogens [2,3,4,5]. Since rifampicin can be administered throughout the whole breeding cycle of aquatic animals such as fish, shrimp, crab and shellfish, covering both the seedling conservation period and the grow-out period, it has been widely used in aquaculture industry.
However, excessive use of rifampicin will lead to detectable drug residues in aquatic products after biological accumulation, which poses a potential threat to the quality and safety of aquatic products [6]. Meanwhile, the unabsorbed fraction of rifampicin by farmed aquatic organisms will be metabolized and excreted into the surrounding environment, becoming an emerging environmental pollutant and causing severe risks to human health and ecological safety [7,8,9]. Previous studies have demonstrated that long-term accumulation of rifampicin in human body can induce significant hepatotoxicity, leading to cholestasis-dominant liver injury [10,11,12]. For this reason, many countries and international organizations have listed rifampicin in the restricted category of veterinary drugs and formulated corresponding maximum residue limits (MRLs) for its application.
In China, the use of rifampicin in aquaculture has been officially prohibited [13,14]. In the current effective national risk monitoring plan for veterinary drug residues in aquatic products, the national standard GB 31656.23-2025, which came into force in September 2025, has officially included rifampicin as a newly added monitoring indicator [15]. Routine sampling inspection for this residue is now carried out relying on the general high-resolution mass spectrometry screening system and UPLC-MS/MS platform. In recent years, continuous surveillance has confirmed the occurrence of rifampicin residues in commercial aquatic products, which creates considerable hidden risks to the quality and safety of aquaculture products. Against this background, the present study selected Carassius auratus gibelio (allogynogenetic silver crucian carp) as the experimental subject, and systematically investigated the pharmacokinetic characteristics and tissue distribution profiles of rifampicin in multiple fish tissues after drug administration using ultra-performance liquid chromatography-tandem mass spectrometry (UPLC-MS/MS). The metabolic pathway of rifampicin in allogynogenetic silver crucian carp was further elucidated. This study is expected to provide fundamental data support for the aquatic ecological risk assessment of rifampicin and the supervision of drug residues in aquatic products.
2. Materials and Methods
2.1. Microorganisms and Chemicals
Rifampicin standard (purity ≥ 98.0%) was purchased from the National Institutes for Food and Drug Control. Acetonitrile and methanol (chromatographic grade) were obtained from TEDIA Company (USA). Formic acid (mass spectrometric grade) was supplied by Merck KGaA (Germany). Ammonium acetate (analytical grade) was purchased from Sinopharm Chemical Reagent Co., Ltd. Ultrapure water (18.2 MΩ·cm resistivity) was freshly prepared using a Milli-Q ultrapure water system (Millipore, USA). The HLB solid phase extraction cartridges (60 mg/3 mL) were acquired from Waters Corporation (USA).
2.2. Instrumentation
ACQUITY ultra-performance liquid chromatograph (Waters Corporation, USA); Quattro Preemier XE triple quadrupole tandem mass spectrometer (Waters Corporation, USA); LPD2550 multi-tube vortex mixer (Leput Scientific Instrument Co., Ltd.); Avanti JXN-30 high-speed refrigerated centrifuge (Coulter Trading Co., Ltd.); IKA T10 homogenizer (basic, IKA Werke, Germany); ZD-85 constant temperature oscillator (Changzhou Guohua Electric Appliance Co., Ltd.); R-210 rotary evaporator (Büchi, Switzerland); Nitrogen Evaporator 112 (Organomation Associates Inc., USA); analytical balance (Mettler Toledo ME204, precision 0.1 mg, Mettler Toledo, Switzerland); 0.22 µm organic microporous filter membrane (Shanghai Anpel Experimental Technology Co., Ltd.). Solid-phase extraction (SPE) cartridge (Oasis HLB, 200 mg, 6 mL, Waters Corporation, USA).
2.3. Experimental Animals
Healthy adult allogynogenetic silver crucian carp (Carassius auratus gibelio) with uniform physiological status were selected as the experimental subjects in this study [16,17,18]. All experimental individuals were artificially farmed commercial freshwater fish from a single breeding batch, with an initial average body weight of 150 g ± 10 g and average body length of 15 cm ± 2 cm. No individuals with body surface damage, deformity or abnormal swimming behavior were included. All fish were purchased from a traceable standardized aquatic product stall at Lingjiatang Wholesale Market in Changzhou, Jiangsu Province, which can be traced back to a local standardized aquaculture base in Changzhou. This sampling strategy eliminated the interference of physiological differences between wild individuals or fish from different breeding batches on the subsequent pharmacokinetic results.
After being transported back to the laboratory, all experimental fish were immediately transferred to independent 500 L recirculating temperature-controlled aquariums for a 7-day acclimation period. No artificial compound feed was provided throughout the 7-day acclimation period or for an additional 24 h immediately prior to drug administration in order to completely empty residual food from the gastrointestinal tract and eliminate baseline interference from feed matrix in subsequent rifampicin residue analysis. During the entire fasting period, fully aerated, dechlorinated municipal tap water (aerated ≥ 24 h to remove residual chlorine) was continuously supplied via the recirculating system; water flow was not interrupted at any time. Key water quality parameters were monitored in real time via an online monitoring system. The water temperature was stably maintained at 25 °C ± 1 °C, which is the optimal metabolic temperature for Carassius auratus gibelio, ensuring that the metabolic rate of fish remained within the normal physiological range during the pharmacokinetic experiment. The pH value of the water was controlled at 7.0 ± 0.5 to avoid acid-base stress that would impair the normal function of metabolic organs such as liver and kidney. A high-power continuous aeration device was used to maintain the dissolved oxygen concentration in water at ≥ 6.0 mg/L, so that no hypoxia stress occurred during the whole acclimation period.
A 12 h light/12 h dark photoperiod simulated by incandescent lamps was applied during the acclimation phase to mimic the light rhythm of natural aquaculture environment. The activity status of experimental fish was observed at fixed time points every morning and evening, including swimming posture, feeding response and body surface mucus secretion. Individuals with pathological symptoms such as body surface hyperemia, swimming imbalance, floating head and lateral turning were removed in time. The concentrations of ammonia nitrogen and nitrite in water were monitored daily to ensure that all water quality indicators met the requirements of Water Quality Standard for Freshwater Aquaculture (NY 5051-2001) [19]. After the 7-day acclimation, 3 blank crucian carp without drug administration were randomly selected, and their muscle, liver and kidney tissues were collected for UPLC-MS/MS baseline screening. No detectable rifampicin residue was found in all blank tissues. Finally, experimental individuals with homogeneous physiological status and good health were selected for the subsequent formal drug administration experiment, which minimized the systematic error caused by individual differences in the determination of pharmacokinetic parameters.
2.4. Experimental Design
2.4.1. In Vivo Animal Study
Drug administration and tissue dissection: Healthy Carassius auratus gibelio (150 ± 15 g body weight, 15 ± 2 cm total length) were acclimated under standard laboratory conditions (water temperature 25 ± 1 °C, dissolved oxygen ≥ 6.0 mg/L, pH 7.2 ± 0.3) for one week prior to experimentation and fasted for 24 h before the trial. A total of 60–70 fish were used in the experiment. At each of the 14 sampling time points (see below), three independent fish were euthanized and dissected; ‘triplicate’ in this study therefore refers to three individual fish per time point, each of which was processed and analyzed separately. Fish were housed in separate recirculating aquaria after dosing to maintain independence of experimental units. Each fish constituted the experimental unit for all statistical and pharmacokinetic analyses. Although a formal a priori power calculation was not performed, n = 3 independent biological replicates per time point is consistent with established practice in fish pharmacokinetic studies [17,18,20], and the measured inter-individual coefficient of variation (CV) was generally below 15%, supporting the adequacy of the replication. Rifampicin was dissolved in sterile physiological saline (0.9% NaCl) to prepare a stock solution at a concentration of 0.24 mg/mL. Each fish received a single intraperitoneal injection into the ventral region anterior to the pelvic fin base at an angle of approximately 45° with the needle directed cephalad. The injection volume was individually calculated based on the actual body weight of each specimen, typically 1.0 ± 0.2 mL per fish, to maintain a standardized dosage of 1.5 mg per kg body weight (mg/kg bw). The injection site was gently compressed with a sterile cotton swab immediately after administration to prevent leakage, and any fish exhibiting abnormal behavior or injection failure were excluded from the study.
Tissue sampling was conducted at 12, 24, 36, 48, 72, 96, 120, 144, 168, 216, 264, 312, 384, and 456 h post-injection. These 14 time points were selected on the basis of previous fish pharmacokinetic studies of similar antibiotics [17,18,20] and a pilot experiment. Early time points (12–48 h) densely bracket the observed maximum concentration (Tmax) values (12–36 h across tissues) and adequately characterize the distribution phase; intermediate points (72–168 h) capture the post-peak mono- or multiphasic decline; and late points (216–456 h) extend to approximately five times the longest terminal half-life observed (90.75 h in brain), ensuring reliable characterization of the terminal elimination phase. The AUC0–t/AUC0–∞ ratio exceeded 0.95 for all tissues (Table 1), confirming that the sampling schedule captured >95% of total drug exposure. At each designated time point, three fish per group were euthanized and promptly dissected on ice. The target tissues, including kidney, spleen, bile, pancreas, liver, intestine, brain, and muscle, were rapidly excised, rinsed with pre-chilled sterile physiological saline to remove residual blood, blotted dry with absorbent paper, and precisely weighed (to the nearest 0.001 g) on an analytical balance. Each tissue sample was immediately transferred into individually labeled 2 mL cryogenic vials, snap-frozen in liquid nitrogen, and subsequently stored at −80 °C until further homogenization, extraction, and analytical determination. Unextracted frozen tissues were stored at −80 °C in the dark for up to 4 weeks prior to analysis, with stability verified as described in Section 3.1.6. All procedures were performed under strict aseptic and low-temperature conditions, with all instruments pre-cooled, to ensure the integrity and stability of rifampicin in the tissue matrices for subsequent pharmacokinetic analysis [20].
Table 1.
Pharmacokinetic parameters of rifampicin in eight tissues of Carassius auratus gibelio following intraperitoneal administration at a dose of 1.5 mg/kg bw (data are expressed as means; n = 3 biological replicates per time point; concentrations are normalized to tissue mass as ng/g; error terms are reported in the main text where appropriate).
Tissue sample pretreatment: Frozen tissue samples (1.00 g, weighed to the nearest 0.001 g) were accurately transferred into individual 12 mL polypropylene centrifuge tubes. To each tube, 1 mL of extraction solvent composed of acetonitrile and ultrapure water (7:3, v/v) was added. The samples were immediately vortex-mixed for 1 min, then homogenized on ice using an IKA T10 Ultra-Turrax homogenizer at 20,000 rpm for 30 s, repeated twice with 30 s cooling intervals on ice to avoid thermal degradation of the analyte, to ensure thorough wetting of the tissue matrix, followed by ultrasonic extraction in a bath-type ultrasonicator for 10 min at ambient temperature to facilitate efficient release of analytes from the tissue. The resulting homogenate was then centrifuged at 6000 r/min for 5 min at 4 °C to separate the supernatant from the solid residue. The upper supernatant layer was carefully decanted using a disposable glass pipette and transferred into a pre-weighed rotary evaporation flask. The remaining pellet was subjected to a second extraction cycle with an additional 1 mL of the same acetonitrile–water solution (7:3, v/v) using an identical vortex–ultrasonic–centrifugation procedure. The second supernatant was pooled with the first extract in the same rotary evaporation flask to maximize analyte recovery. The combined extracts were concentrated to dryness under reduced pressure (≤0.06 MPa) using a rotary evaporator (R-210, Buchi, Switzerland) maintained at 40 °C in a water bath with residual solvent subsequently removed under a gentle stream of high-purity nitrogen gas at 40 °C. The dried residue was reconstituted in 5 mL of HPLC-grade acetonitrile, vortexed for 1 min, and ultrasonicated for an additional 1 min to ensure complete dissolution and homogeneity of the reconstituted solution.
Prior to solid-phase extraction (SPE), an HLB cartridge (Waters Oasis HLB, 200 mg, 6 mL) was pre-conditioned sequentially with 5 mL of methanol followed by 5 mL of ultrapure water, and subsequently activated with 5 mL of HPLC-grade acetonitrile to equilibrate the sorbent bed. The reconstituted sample extract (approximately 5 mL) was loaded onto the activated cartridge under gravity at a controlled flow rate (approximately 1 mL/min). The cartridge was then washed with 2 mL of ultrapure water to remove polar matrix interferences, followed by elution of the retained analytes with 5 mL of HPLC-grade acetonitrile. The eluate was carefully collected in a 15 mL polypropylene centrifuge tube and evaporated to dryness under a gentle stream of high-purity nitrogen gas at 40 °C using a nitrogen blow-down concentrator (112, Organomation Associates Inc., USA). The dried eluate was reconstituted in 1.0 mL of the initial HPLC mobile phase, vortexed vigorously for 1 min to ensure complete re-dissolution, and filtered through a 0.22 µm organic-phase microporous membrane filter directly into an HPLC autosampler vial. The prepared final extracts were stored at 4 °C in the autosampler tray and analyzed within 24 h by HPLC-MS/MS to minimize potential analyte degradation.
Calculation of tissue concentrations: Tissue concentrations of rifampicin were back-calculated from the measured concentration in the final injected extract using the following equation: Ctissue (ng/g) = (Cmeas × Vrecon × DF)/Wtissue, where Cmeas is the analyte concentration in the final reconstituted extract determined by UPLC-MS/MS against a matrix-matched calibration curve (ng/mL); Vrecon is the final reconstitution volume (1.0 mL); DF is any additional dilution factor (DF = 1 in the present study); and Wtissue is the accurately weighed mass of tissue extracted (g). Tissue concentrations are reported as ng/g (equivalent to ng/mL, assuming tissue density ≈ 1 g/mL).
2.4.2. UPLC-MS/MS Detection Conditions
Liquid Chromatographic Conditions: Chromatographic column, Waters ACQUITY UPLC BEH C18 column (2.1 mm × 100 mm, 1.7 μm) or equivalent; column temperature: 40 °C; mobile phase A, ultrapure water containing 0.1% formic acid and 2 mM ammonium acetate, mobile phase B, acetonitrile. The gradient elution procedure was set as follows, 0–2.5 min, B increased linearly from 10% to 90%; 2.5–5.5 min, maintained at 90% B; 5.5–6.0 min, B decreased linearly to 10%; 6.0–8.0 min, maintained at 10% B for column equilibrium. The flow rate was 0.20 mL/min, and the injection volume was 10 μL [21,22].
Mass Spectrometric Conditions: The mass spectrometric parameters were optimized in positive electrospray ionization (ESI+) mode under multiple reaction monitoring (MRM) mode. The capillary voltage was set at 3.5 kV, the desolvation gas temperature was 380 °C, the cone gas flow rate was 50 L/h, and the desolvation gas (nitrogen, 99.99% purity) flow rate was 800 L/h. For rifampicin, the precursor ion was set at m/z 823.1, with the quantitative product ion at m/z 790.9 acquired at a collision energy of 20 V, and the confirmatory product ion at m/z 398.9 obtained at a collision energy of 25 V. The cone voltage was uniformly maintained at 18 V for all transitions [23,24].
2.4.3. Data Analysis and Pharmacokinetic Parameter Estimation
Processing and statistical evaluation of analytical data: The raw data acquired from UPLC-MS/MS analysis were processed using MassLynx V software. The preprocessing workflow encompassed peak detection, peak alignment, noise reduction, and signal normalization. Peak area data corresponding to rifampicin in both calibration standard solutions and biological samples were extracted and tabulated. Subsequently, the residual concentrations of rifampicin across different tissue specimens were determined via the area normalization approach, which effectively accounted for potential matrix effects and instrumental fluctuations.
Compartmental pharmacokinetic modeling and tissue distribution assessment: Pharmacokinetic parameters of rifampicin in various tissues at different time points were statistically analyzed using PKSolver software (version 2.0, China Pharmaceutical University, Nanjing, China) [25]. A non-compartmental model (NCA) was employed to calculate the key pharmacokinetic parameters, including the maximum plasma concentration (Cmax), time to reach maximum concentration (Tmax), area under the concentration-time curve from zero to infinity (AUC0–∞), terminal elimination half-life (t1/2), and mean residence time (MRT). The corresponding pharmacokinetic curves were subsequently generated to visualize the absorption, distribution, and elimination profiles of rifampicin across different tissues. Furthermore, combined with the established general metabolic pathways of the drug, the principal metabolic routes of rifampicin in Carassius auratus gibelio were systematically elucidated, providing a comprehensive understanding of its in vivo biotransformation and disposition characteristics.
Statistical methods: The experimental unit for all statistical analyses was the individual fish. Pharmacokinetic parameters are reported as arithmetic mean ± standard deviation (SD) for n = 3 independent biological replicates. For comparisons of pharmacokinetic parameters across tissues, one-way analysis of variance (ANOVA) was applied, with a significance level set at α = 0.05. All statistical analyses were performed in SPSS 26.0 (IBM Corp., Armonk, NY, USA).
Molecular docking methodology: To investigate the tissue-specific accumulation, systemic transport, metabolic transformation, and residue behavior of rifampicin in Carassius auratus gibelio, a comprehensive molecular docking simulation was performed. Ligand preparation, the three-dimensional structure of rifampicin (CID: 5381226; molecular formula C43H58N4O12; molecular weight 822.95 Da) was retrieved from PubChem in SDF format and converted to PDBQT format using Open Babel 3.1.1. Protonation states at physiological pH (7.4) were assigned, and Gasteiger partial charges were computed. The lipophilicity (cLogP ≈ 3.67) was calculated using the XLogP3 algorithm. Assessment against Lipinski’s Rule of Five (Ro5) showed that rifampicin violates two of the five classical criteria (molecular weight > 500 Da; hydrogen-bond acceptors = 14 > 10), while satisfying hydrogen-bond donors (n = 5 ≤ 5), cLogP (<5), and rotatable bonds (n = 5 ≤ 10). Such deviations are common for macrocyclic antibiotics and do not preclude docking analysis, as rifampicin is a well-characterized ligand of multiple ADME proteins; however, the Ro5 violation should be borne in mind when interpreting binding affinity values.
Protein preparation. The protein structures used in this study were selected on the basis of sequence homology to Carassius auratus gibelio proteins and the availability of high-resolution experimental structures in the Protein Data Bank (PDB). The full details are as follows: (i) PEPT1 (SLC15A1), the intestinal oligopeptide uptake transporter. (ii) CYP3A65, a zebrafish cytochrome P450 3A isoform orthologous to fish CYP3A. None of the three structures represents a native Carassius auratus gibelio experimental structure, and this limitation is explicitly discussed in Section 4. For each receptor, bound ligands, water molecules, and co-crystallized ions were removed; polar hydrogens were added; Kollman united-atom charges were assigned; and non-polar hydrogens were merged using AutoDockTools-1.5.7. Docking parameters and validation [26,27,28,29,30,31,32]. Molecular docking was performed using AutoDock Vina version 1.2.5 [33,34], which employs an empirical scoring function combining Gaussian steric terms, a hydrophobic contact term, a hydrogen-bonding term, and a torsional entropy penalty. The exhaustiveness parameter was set to 20; the number of output binding modes (num_modes) was 20; and the energy range for clustering was 4 kcal/mol. For each protein–ligand complex, 20 independent conformers (poses) were generated, and the pose with the lowest binding free energy (ΔG, kcal/mol) was selected as the representative binding mode, followed by cluster analysis with a 2.0 Å RMSD cutoff to assess pose convergence. The predicted binding free energy ΔG was decomposed into the following components as reported by AutoDock Vina: (i) intermolecular energy, consisting of (ii) the van der Waals + hydrogen-bond + desolvation energy term and (iii) the electrostatic energy term; plus (iv) the torsional (entropic) penalty for ligand rotatable bonds.
Protein–ligand interaction profiles, including conventional hydrogen bonds, hydrophobic contacts (alkyl, π-alkyl, π–π stacking), π-cation interactions, salt bridges, and van der Waals contacts, were characterized using the PLIP (Protein–Ligand Interaction Profiler) 2023 web server [35] and BIOVIA Discovery Studio Visualizer 2021 (Dassault Systèmes). Key references [33,34,35,36,37,38,39] have been added to the reference list to support the methodological description. It is important to note that molecular docking provides only a static computational prediction of binding pose and approximate affinity; it does not directly establish transport activity, or in vivo functional relevance. The docking results presented here are therefore interpreted as a structural rationale for generating mechanistic hypotheses that warrant further experimental validation.
3. Results and Discussion
3.1. Method Validation
A systematic validation of the UPLC-MS/MS method was performed following the US FDA Bioanalytical Method Validation guidance and the European Commission Decision 2002/657/EC criteria for veterinary drug residue analysis. Full validation (linearity, accuracy, precision, recovery, LOD, LOQ, and stability) was performed in muscle matrix, as muscle is the principal edible tissue and the primary target for residue monitoring. Selectivity was assessed in all eight tissue matrices, and matrix effects were quantified in all eight tissues at three concentration levels. Matrix-matched calibration curves were used throughout to correct for any residual matrix effect.
3.1.1. Linearity and Calibration Curve
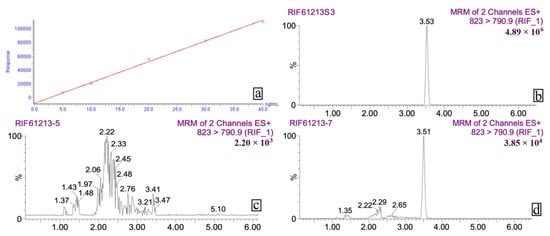
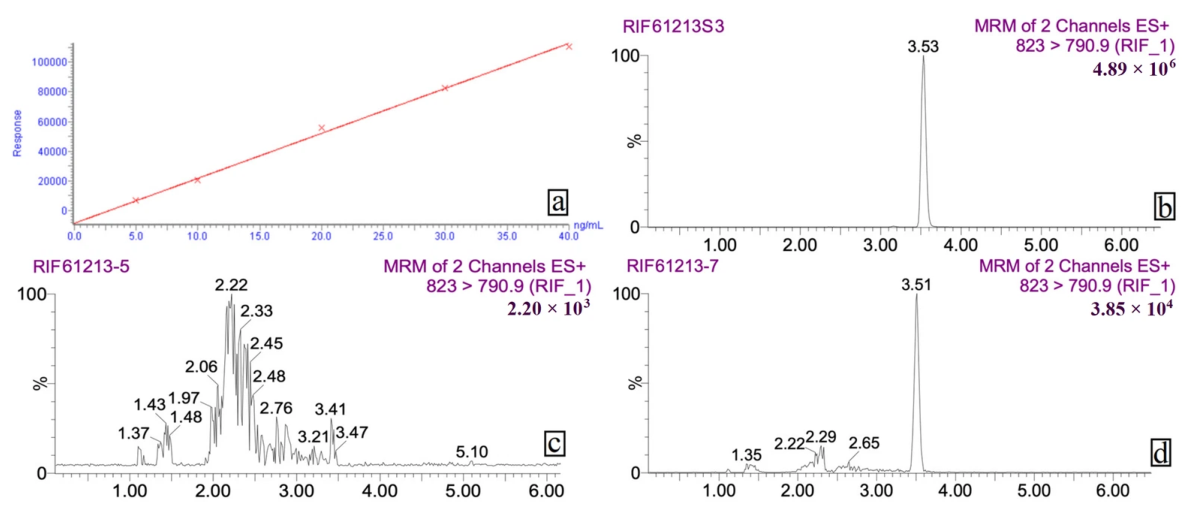
The external standard method was used for quantification. Working standard solutions with concentrations of 5.0, 10, 20, 30, and 40 ng/mL were created by serially diluting the rifampicin stock standard in methanol. Under the optimized chromatographic conditions, each concentration was analyzed three times, and a calibration curve was created by plotting the peak area (y) against the mass concentration (x, ng/mL). The method demonstrated excellent linearity within the concentration range of 5.0 to 40 ng/mL, with a regression equation of y = 3027.01x – 8490.85 and a correlation coefficient (r2) of 0.9956. The calibration range effectively encompassed the real residual concentrations of rifampicin in different tissue samples, facilitating further quantitative analysis.
3.1.2. Selectivity
To assess potential endogenous interference at the retention time of rifampicin, blank tissue samples (muscle, liver, kidney, intestine, bile, pancreas, spleen, and brain) from six different Carassius auratus gibelio batches were processed following the sample preparation procedure. No interfering peaks with a signal-to-noise ratio greater than 3 were observed at the retention time of rifampicin (approximately 3.5–3.6 min) in any of the blank samples, indicating that the method possesses high selectivity and that endogenous matrix components do not compromise the accurate identification or quantification of the target analyte.
3.1.3. Matrix Effect Evaluation
Matrix effects were evaluated using the post-extraction spiking method. Rifampicin standard solutions at three concentration levels (10, 20, and 40 ng/mL) were prepared in both neat solvent and blank tissue extracts, and the matrix effect (ME%) was calculated as: ME% = (peak area in matrix/peak area in solvent) × 100%. Across the eight tissue types studied, ME values varied from –12.3% to +8.7%, i.e., within the generally accepted ±15% tolerance for bioanalytical methods, suggesting that the matrix-induced effects were minor and unlikely to greatly impact quantitative precision. Matrix-matched calibration curves were used to account for any possible matrix interference during the quantification of tissue samples.
3.1.4. Limits of Detection (LOD) and Quantification (LOQ)
The LOD and LOQ were established by examining a range of low-concentration standard solutions made in a blank tissue matrix, with LOD and LOQ characterized by signal-to-noise ratios (S/N) of 3 and 10, respectively. Across the eight tissues, LODs ranged from 0.3 to 0.5 ng/g, and LOQs ranged from 1.0 to 1.5 ng/g; a uniform LOQ of 1.0 ng/g was adopted for all tissues to ensure reporting consistency. These sensitivity values are adequate for analyzing trace residues of rifampicin in tissue samples at concentrations relevant to food-safety monitoring.
3.1.5. Recovery and Precision
To evaluate the method’s accuracy and precision, blank Carassius auratus gibelio muscle matrix was spiked with rifampicin at concentrations of 5, 20, and 40 ng/g. For each spiking level, six parallel samples were prepared and analyzed following the established method. Recovery was determined using the formula: Recovery% = (measured concentration/spiked concentration) × 100%. Intra-day precision, assessed by within-run RSD, was measured by analyzing six samples on the same day, whereas inter-day precision, evaluated by between-run RSD, involved conducting the experiment over three consecutive days with six samples each day. The average recoveries at the three levels of spiking were ranged from 84.7% to 91.6%, with intra-day RSD values ranging from 2.6% to 4.2% and inter-day RSD values from 4.5% to 6.8%. The method demonstrated satisfactory accuracy and precision for quantifying rifampicin in real samples, as all validation parameters met the acceptance criteria for veterinary drug residue analysis (recovery 70–120%,RSD ≤ 15%). We acknowledge that full multi-day precision and accuracy were determined in muscle matrix only, with other matrices validated for selectivity and matrix effect; this is acknowledged as a limitation in Section 4.
3.1.6. Stability Assessment
The rifampicin stock solution, with a concentration of 1 mg/mL in methanol, was kept at –20 °C away from light, and portions were diluted to 20 ng/mL for analysis on days 0, 7, 15, and 30. The peak areas remained stable over 30 days with an RSD of 4.8% (n = 4). Working standard solutions (5.0–40 ng/mL) stored at 4 °C in the dark were analyzed at 0, 2, 4, 8, 12, and 24 h, and the peak area variation was less than 5% (RSD = 3.9%), indicating adequate stability for routine analytical workflows. Samples spiked with matrix at low (2 ng/g), medium (5 ng/g), and high (10 ng/g) concentrations were kept in the dark at room temperature (25 °C) and analyzed at intervals of 0, 2, 4, 8, 12, and 24 h. The concentrations measured at each time point compared to 0 h ranged from –4.7% to +3.5%, –3.2% to +3.8%, and –3.5% to +3.1% for the three levels, respectively, indicating that the samples were stable for 24 h at room temperature. Frozen tissue samples stored at −80 °C for up to 4 weeks showed no measurable degradation compared with freshly processed samples (deviation < 5%), supporting the stability of rifampicin under the storage conditions used.
In summary, the established UPLC-MS/MS method suggests high selectivity, satisfactory sensitivity, good accuracy and precision, and sufficient stability for the intended applications, making it well suited for the precise determination of rifampicin concentrations in various tissues in subsequent pharmacokinetic studies. Representative chromatograms (standard, blank, and incurred sample) are shown in Figure 1.
Figure 1.
Analytical performance for the determination of rifampicin in tissue samples: (a) standard calibration curve of rifampicin; (b) representative chromatogram of a rifampicin standard solution; (c) chromatogram of a blank tissue sample; (d) chromatogram of an actual tissue sample showing the detected rifampicin peak.
3.2. Pharmacokinetic and Elimination Profiles of Rifampicin in Various Tissues
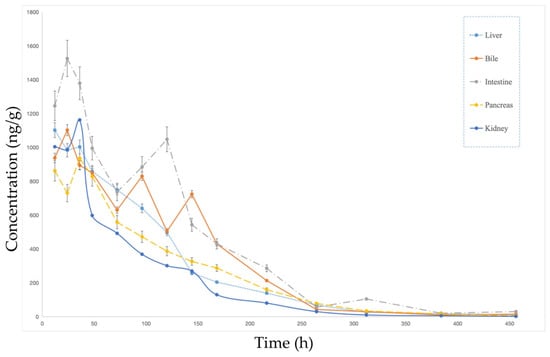
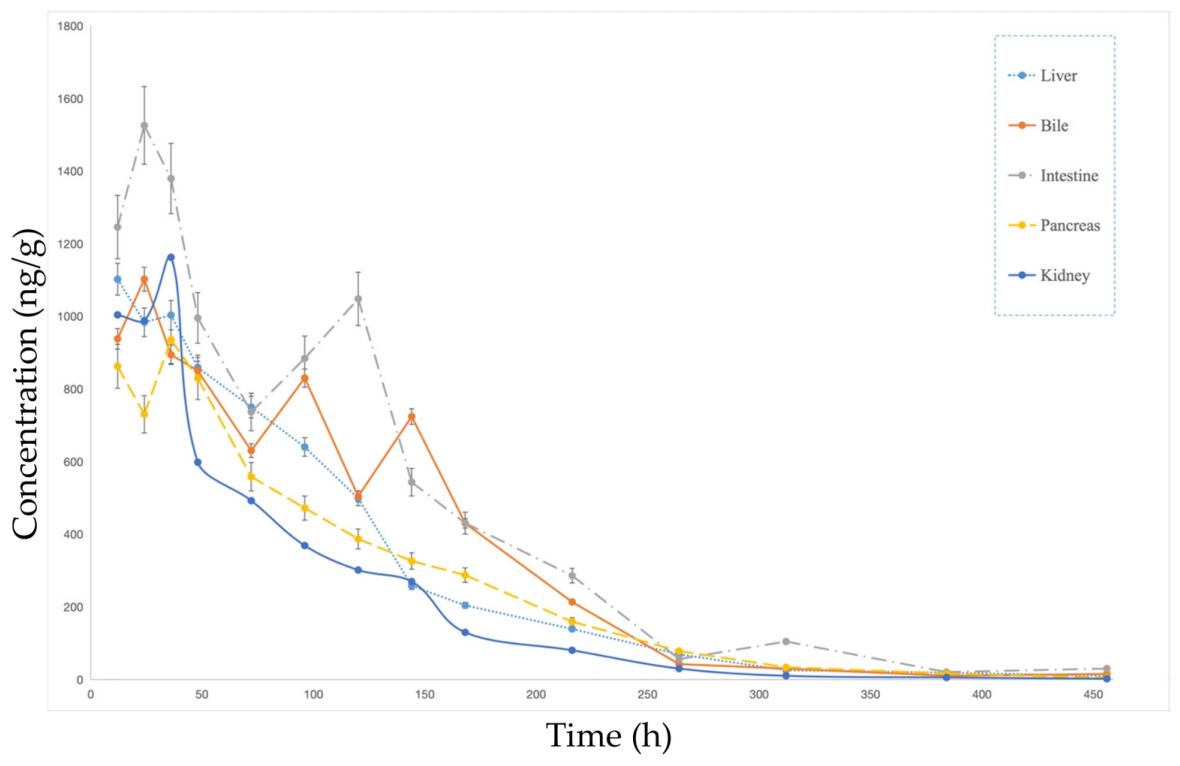
After being administered intraperitoneally, rifampicin showed markedly heterogeneous distribution and elimination patterns in the eight tissues studied. Table 1 and Figure 2 illustrate that drug concentrations were significantly higher in the liver, intestine, bile, and pancreas, with peak levels Cmax of 1102.34, 1245.97, 1525.85, and 862.58 ng/mL, respectively. The highest Cmax values were recorded in bile and intestine, suggesting that rifampicin is rapidly distributed to the enterohepatic system via the portal circulation following intraperitoneal injection, with biliary excretion likely constituting a major elimination pathway. The area under the concentration-time curve AUC0-t values in these tissues were considerably greater than those in other tissues (liver: 124,702.98; intestine: 185,614.68; pancreas: 112,272.06 ng/mL·h), indicating that these organs represent the primary sites of drug distribution and metabolism.
Figure 2.
Tissue elimination profiles of rifampicin in kidney, bile, pancreas, liver, and intestine of Carassius auratus gibelio following intraperitoneal administration (1.5 mg/kg). Data points represent the mean ± SD of n = 3 independent biological replicates.
Analysis of the concentration-time profiles indicated that drug levels in the liver, intestine, bile, and pancreas reached their highest within 12 to 24 h after administration, then gradually decreased. Significantly, the concentration-time profiles for bile and intestine showed multiphasic elimination patterns, marked by variations or extended plateaus during the decline phase instead of a straightforward monoexponential decay. This finding is consistent with the hypothesis that rifampicin may undergo enterohepatic recirculation, in which drug excreted into bile is reabsorbed from the intestine, prolonging systemic residence; however, direct evidence for enterohepatic recirculation (e.g., from bile-duct cannulation) is not available in the present study, and this explanation therefore remains a working hypothesis. In the liver, the concentration-time curve showed a steady decrease after reaching its peak, aligning with the liver’s function as a constant site for drug metabolism and elimination. The pancreatic profile was similar to the liver’s, exhibiting monophasic slow elimination, but with a somewhat quicker clearance rate.
Elimination half-lives t1/2 varied considerably among tissues, with prolonged values observed in bile (58.51 h), liver (60.64 h), intestine (66.82 h), and pancreas (50.06 h), corroborating the gradual decline reflected in the concentration-time profiles. In contrast, the kidney exhibited a relatively shorter t1/2 (46.70 h) and the lowest mean residence time MRT0-inf (78.62 h) among all tissues. The renal concentration–time curve displayed a relatively rapid monophasic decline following a Cmax of 1162.72 ng/g at 36 h, suggesting that the kidney may serve as a principal excretory organ with comparatively faster drug clearance; the substantial renal exposure (AUC0–t = 94,092.00 ng·h/g) further supports the contribution of urinary excretion to total clearance.
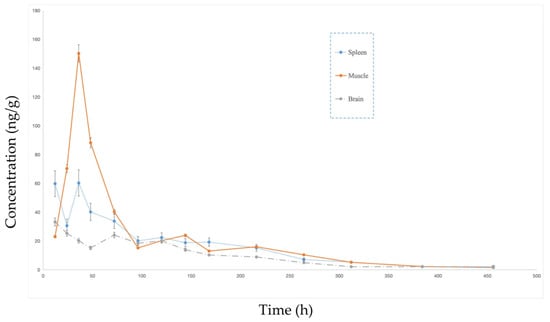
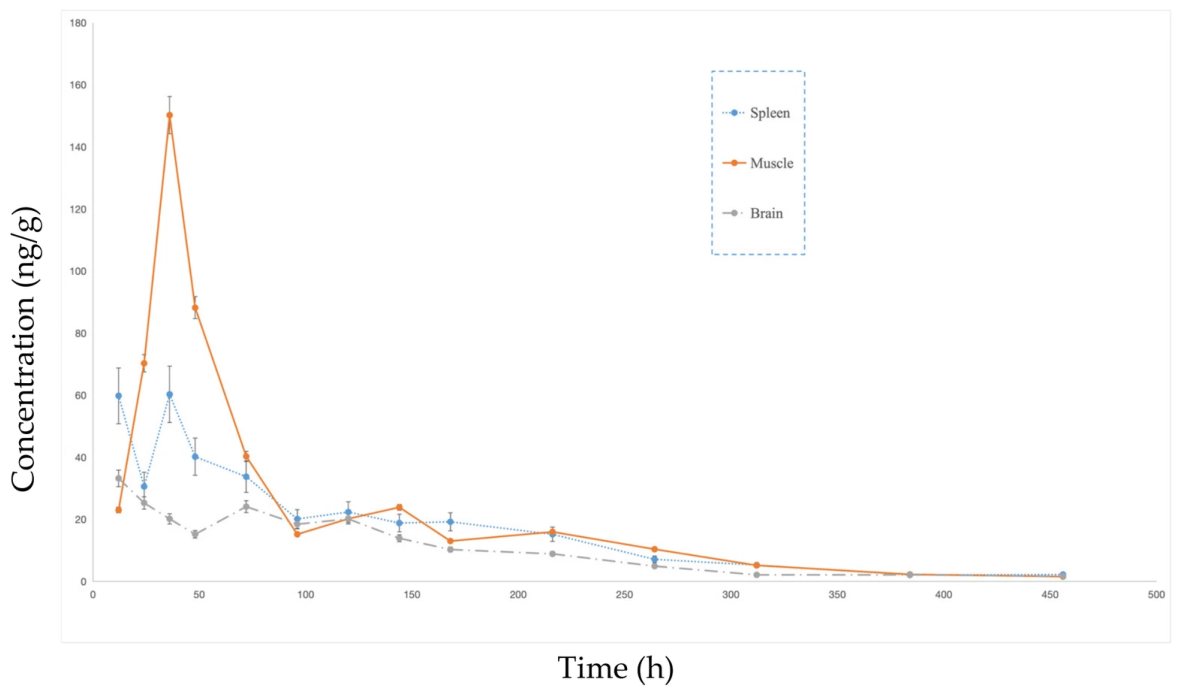
The spleen and brain tissues exhibited the lowest terminal elimination rate constants λz of 0.00780 h−1 and 0.00764 h−1, respectively, corresponding to the longest t1/2 values (88.88 h and 90.75 h) and the most protracted MRT (140.04 h and 150.02 h). As shown in Figure 3, the concentration-time profiles for these tissues displayed an extremely gradual decline after peaking, with no discernible rapid elimination phase, indicating that drug elimination from the spleen and brain is exceptionally slow, which may be attributable to drug sequestration by splenic immune cells and restricted efflux across the blood–brain barrier.
Figure 3.
Elimination profiles of rifampicin in muscle, spleen, and brain tissues of Carassius auratus gibelio following intraperitoneal administration (1.5 mg/kg), characterized by lower initial tissue concentrations and prolonged retention. Data points represent the mean ± SD of n = 3 independent biological replicates.
In muscle tissue, although the Cmax (150.24 ng/mL) was substantially lower than that in the major distribution tissues, the concentration-time curve exhibited a slow monophasic decline after peaking at 36 h, with a prolonged t1/2 (68.28 h) and mean residence time (MRT, 113.50 h), characteristic of a “low-concentration, long-retention” profile. This kinetic pattern indicates that despite the relatively low extent of rifampicin accumulation in muscle, its persistently slow elimination results in sustained drug concentrations over an extended period, underscoring the importance of muscle as a target tissue for residue monitoring in aquatic products.
Furthermore, the highest AUC0-t values were observed in bile (145,919.52 ng/mL·h) and intestine (185,614.68 ng/mL·h), which, together with the prolonged t1/2 and multiphasic fluctuations in the concentration-time curves of these tissues, provide compelling evidence for the existence of an enterohepatic recirculation pathway for rifampicin in Carassius auratus gibelio. The recirculation of the drug is likely a factor in its prolonged elimination from the organism.
To summarize, the distribution of rifampicin in tissues and its elimination kinetics in Carassius auratus gibelio are defined by these characteristics: (1) The liver, intestine, bile, and pancreas showed the highest distribution, with exposure levels significantly exceeding those in other tissues and concentration-time profiles indicating a slow decline after peaking or fluctuating elimination; (2) As the primary organ for metabolism, the liver, along with biliary excretion as a significant elimination route, shows multiphasic elimination curves in bile and intestine, suggesting enterohepatic recirculation; (3) Rapid monophasic clearance is observed in the kidney, whereas the spleen and brain have notably slow elimination, evident from their leveled-off decline curves; (4) Despite low accumulation, muscle tissue exhibits a slow and sustained elimination with an extended half-life, making it a key focus for residue risk evaluation. These results lay the groundwork for refining dosing schedules and understanding how rifampicin residues are eliminated in aquaculture.
3.3. Molecular Docking Results and Correlative Analysis with Tissue Distribution
Integrating the molecular docking results of rifampicin with PEPT1 (PDB ID: 7PN1), CYP3A65PDB ID: 1W0F), and P-gp (P-glycoprotein, PDB ID:6QEE) into the observed tissue distribution and elimination profiles provides a mechanistic interpretation of the organ-specific disposition of this drug in Carassius auratus gibelio. The results presented below are computational predictions that should be interpreted as a mechanistic framework for generating testable hypotheses rather than as demonstrated biological mechanisms. The three-dimensional crystal/homology -modeled structures used are detailed in Section 2.4.3 and summarized in Table 2.
Table 2.
Summary of protein targets used for molecular docking, template structures, and docking energetics.
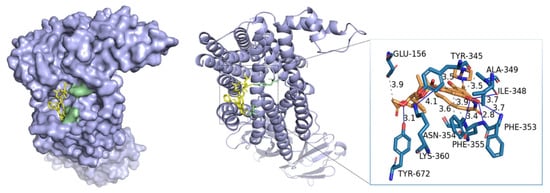
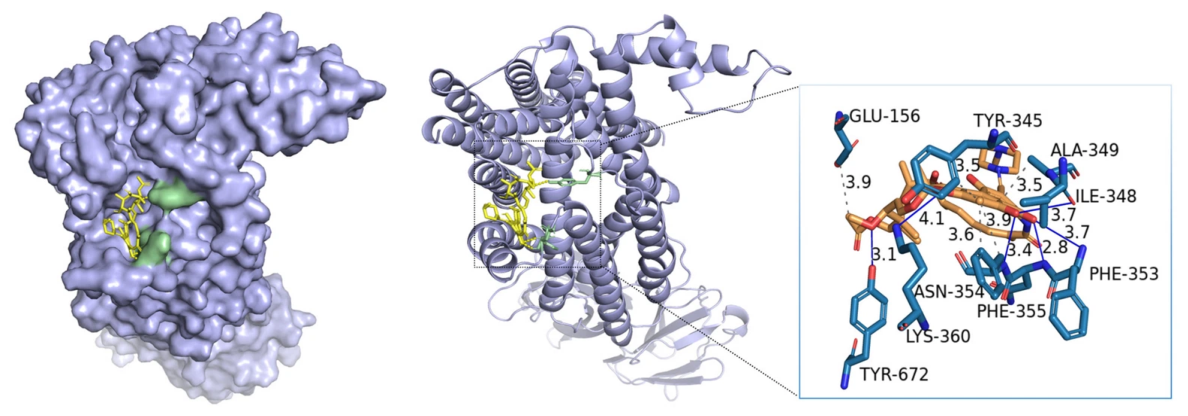
The most significant binding affinity of rifampicin to the intestinal uptake transporter PEPT1 (−7.736 kcal/mol, Ki = 2.14 μM) implies that the drug might be efficiently absorbed by intestinal epithelial cells via active transport mediated by PEPT1, as illustrated in Figure 4. The predicted binding pose of rifampicin places the ansamycin ring within the central substrate-binding cavity of PEPT1. Interaction analysis using PLIP identified three conventional hydrogen bonds and five hydrophobic contacts, together with multiple van der Waals contacts. This discovery aligns closely with the notably high exposure levels seen in the intestinal tissue (Cmax = 1245.97 ng/mL, AUC0-t = 185,614.68 ng/mL·h). The high levels of PEPT1 on the apical side of enterocytes explain why rifampicin accumulates much more in the intestine than in other tissues. Additionally, the high affinity for PEPT1 is associated with the generally swift reaching of peak concentrations in most tissues (Tmax = 12–24 h), implying that PEPT1-mediated rapid uptake might support early tissue distribution of the drug.
Figure 4.
Molecular docking of rifampicin with PEPT1: predicted three-dimensional binding pose within the binding cavity; two-dimensional ligand–protein interaction diagram showing hydrogen bonds and hydrophobic contacts.
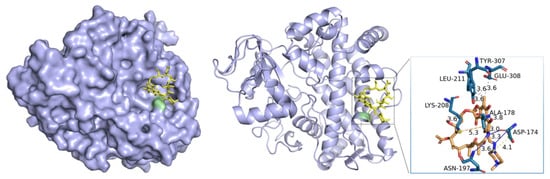
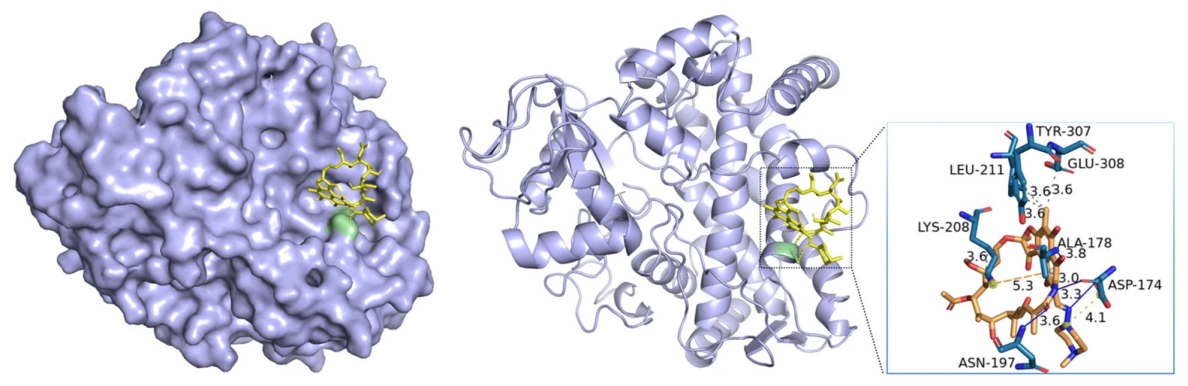
Rifampicin also exhibits a considerable binding affinity for CYP3A65 (−7.575 kcal/mol, Ki = 2.80 μM), the predicted binding mode places the naphthoquinone moiety of rifampicin in proximity to the heme iron. PLIP analysis identified two conventional hydrogen bonds, one π-cation interaction, seven hydrophobic contacts, and extensive van der Waals contacts with the I-helix and F–G loop residues. Hydrophobic interactions again predominated, as illustrated in Figure 5. The docking outcome corresponds closely with the liver pharmacokinetic profile of the drug. Being the main organ for metabolism, the liver shows a gradual and continuous decrease in drug levels after reaching the peak, with an AUC0-t of 124,702.98 ng/mL·h and an extended elimination half-life of 60.64 h. The prolonged half-life probably indicates that the enzymatic metabolism by CYP3A65 is a rate-limiting factor, limiting the overall clearance of rifampicin from liver tissue. Furthermore, the elevated levels of CYP3A65 in the liver of fish provide additional insight into the significant exposure and extended retention seen in this organ.
Figure 5.
Molecular docking of rifampicin with CYP3A65: predicted binding mode in the active site relative to the heme group; two-dimensional interaction diagram showing hydrogen bonds and hydrophobic contacts.
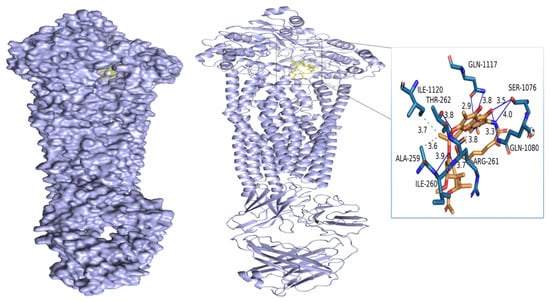
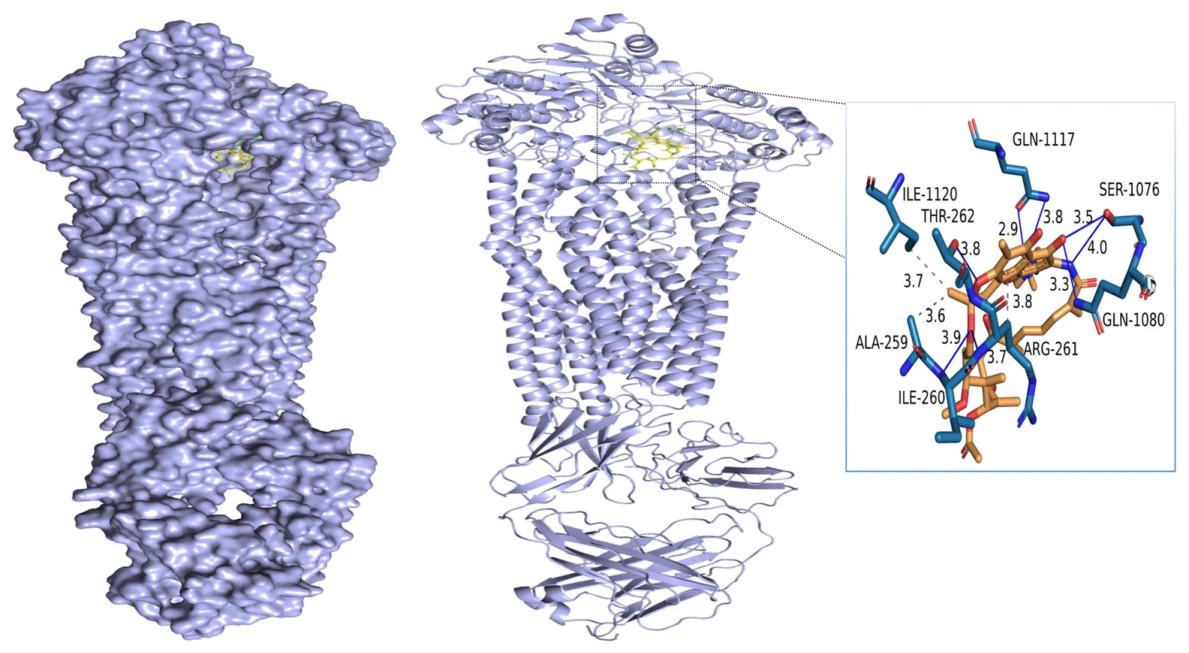
Rifampicin’s binding energy to P-glycoprotein (P-gp) was determined to be −7.013 kcal/mol, Ki = 7.23 μM the weakest affinity among the three targets but still in the range suggestive of a specific interaction. PLIP analysis identified three hydrogen bonds, eight hydrophobic contacts, and extensive van der Waals interactions, as shown in Figure 6. One minor unfavorable acceptor–acceptor clash was detected between the C8-hydroxyl group of rifampicin and the side-chain carbonyl oxygen of Gln990 (hydrogen bonds), contributing a small unfavorable energy term consistent with the slightly lower (less negative) ΔG for this complex relative to PEPT1 and CYP3A65. The predicted affinity of rifampicin for P-gp provides a structural basis for hypothesizing that P-gp-mediated efflux may contribute to the observed multiphasic elimination patterns in bile and intestine and to the restricted brain distribution. P-gp is abundantly expressed on the canalicular membrane of hepatocytes, the apical membrane of enterocytes, the apical membrane of renal proximal tubule cells, and the luminal membrane of brain capillary endothelial cells. Efflux by P-gp at these sites could contribute to biliary excretion, intestinal secretion, renal tubular secretion, and blood–brain barrier restriction, respectively—a pattern that is qualitatively consistent with the observed kinetic profiles (rapid renal clearance, low brain Cmax = 33.23 ng/mL, multiphasic intestinal profile). However, as with PEPT1 and CYP3A65, this proposed mechanism remains a docking-based prediction, and it does not exclude contributions from other transporters.
Figure 6.
Molecular docking of rifampicin with P-gp: predicted binding pose within the inward-open transmembrane drug-binding pocket; two-dimensional interaction diagram showing hydrogen bonds, hydrophobic contacts, and one minor unfavorable contact with Gln990.
Taking the docking predictions together with the pharmacokinetic data, it is tempting to speculate that the combined action of PEPT1-like uptake, CYP3A-like metabolism, and P-gp-like efflux may contribute to the tissue-specific distribution and elimination patterns observed. However, we strongly caution that the present data are correlative and do not establish a causal chain from molecular binding events to in vivo kinetics. The integrative pharmacokinetic–docking analysis should be viewed as a multi-scale hypothesis-generating framework that provides a structural rationale for the observed data and that motivates future mechanistic studies (e.g., transporter inhibition experiments, gene expression profiling, in vitro metabolism assays) in Carassius auratus gibelio.
4. Conclusions
This study systematically characterizes the pharmacokinetics and tissue distribution of rifampicin in Carassius auratus gibelio, employing a validated UPLC-MS/MS technique along with non-compartmental analysis and molecular docking simulations. Rifampicin exhibits pronounced enterohepatic tropism, with the highest drug exposure observed in the intestine, bile, liver, and pancreas. Multiphasic elimination curves in bile and intestine were suggestive of enterohepatic recirculation, which may prolong the overall residence time of the drug; however, direct experimental confirmation (e.g., bile-duct cannulation) was not performed, and enterohepatic recirculation therefore remains a hypothesis. Notably, although muscle tissue accumulates rifampicin at relatively low concentrations (Cmax 150.24 ng/mL), it displays the slowest elimination kinetics among all edible tissues (t1/2 68.28 h, MRT 113.50 h), underscoring its “low-concentration, long-retention” profile and positioning muscle as the most critical matrix for routine residue surveillance and dietary risk assessment. Molecular docking predicted binding affinities of rifampicin to PEPT1 (intestinal uptake, –7.736 kcal/mol), CYP3A65 (liver metabolism, –7.575 kcal/mol), and P-gp (efflux transporter, –7.013 kcal/mol). The interplay among these proteins-PEPT1-driven absorption, CYP3A65-catalyzed biotransformation, and P-gp-facilitated efflux—provides a mechanistic rationale for the observed tissue-specific distribution, prolonged hepatic retention, and restricted brain penetration.
Considering risk management, the extended elimination half-life and enduring muscle residues imply that a considerable withdrawal period is essential for consumer safety. However, the present pharmacokinetic data were obtained under controlled laboratory conditions using a single intraperitoneal dose in fasted fish. Such a design is not field-representative of aquaculture practice, in which rifampicin (where used) is typically administered orally via medicated feed, often repeatedly, and to fish of varying sizes held under diverse temperature and husbandry conditions. As a result, the present data should be regarded as reference values for tissue distribution and elimination kinetics under a well-defined experimental condition; they cannot be directly extrapolated to establish maximum residue limits (MRLs) or regulatory withdrawal periods for oral or multi-dose field use. Establishing such regulatory endpoints will require dedicated multi-dose oral studies conducted under conditions approximating practical aquaculture.
Several limitations of the present study should be explicitly acknowledged: Limited biological replication, n = 3 independent fish per time point may limit statistical power for detecting subtle inter-individual variability and for robust estimation of terminal elimination parameters in some tissues. Method validation, full multi-day precision and accuracy were assessed in muscle matrix only; other matrices were validated for selectivity and matrix effect. Future multi-matrix validation would further strengthen the method. Single-dose intraperitoneal design, as discussed above, i.p. dosing is not directly representative of oral medication in aquaculture, and the resulting pharmacokinetic parameters cannot be directly used to derive MRLs or withdrawal periods without further oral/multi-dose studies. Reliance on molecular docking for mechanistic interpretation, docking provides only computational predictions of binding pose and approximate affinity. The protein structures used are not native Carassius auratus gibelio structures (mammalian/zebrafish templates with 54–63% sequence identity in the functional domains were used as surrogates), and functional validation (enzyme kinetics, transport assays, protein expression data) is required to test the hypothesized roles of PEPT1, CYP3A65, and P-gp.
Despite these limitations, the present work fills a critical data gap regarding rifampicin pharmacokinetics in fish, provides a validated analytical tool suitable for multi-tissue residue monitoring, and offers a mechanistic docking framework that can guide future experimental studies. The integrated pharmacokinetic–docking workflow can be extended to other veterinary drugs to facilitate a more mechanistic understanding of xenobiotic disposition in aquatic organisms.
Author Contributions
Conceptualization, L.Y.; Methodology, X.Z. and L.Y.; Software, L.Y.; Validation, S.Z.; Formal analysis, L.Y.; Resources, F.Z.; Data curation, S.Z.; Writing—original draft, S.Z.; Writing—review and editing, S.Z.; Visualization, S.Z.; Supervision, X.Z.; Project administration, X.Z.; Funding acquisition, F.Z. All authors have read and agreed to the published version of the manuscript.
Funding
This research received no external funding.
Data Availability Statement
The original contributions presented in this study are included in the article. Further inquiries can be directed to the corresponding author. This study only used conventional farmed edible gibel carp (Carassius auratus gibelio) as the research object. All experimental operations conform to the national aquaculture operation specifications and the 3R principle of experimental animal welfare, and no experimental operations that cause unnecessary harm to animals are involved. This study has been approved by the Institutional Review Board (IRB).
Acknowledgments
The authors gratefully acknowledge Changzhou University for providing the laboratory facilities.
Conflicts of Interest
Author Falu Zheng was employed by the Yangtze River Pharmaceutical Group Jiangsu Zilong Pharmaceutical. The remaining authors declare that the research was conducted in the absence of any commercial or financial relationships that could be construed as a potential conflict of interest. The Yangtze River Pharmaceutical Group Jiangsu Zilong Pharmaceutical had no role in the design of the study; in the collection, analyses, or interpretation of data; in the writing of the manuscript, or in the decision to publish the results.
References
- Gilman, K.H.S.; Zhang, Y.; Lau, T.C.K.; Lau, R.W.T.; Ho, P.L.; Yew, W.W.; Tsui, S.K.W.; Cheng, V.C.C.; Yuen, K.Y.; Yam, W.C. Mutations outside the rifampicin resistance-determining region associated with rifampicin resistance in Mycobacterium tuberculosis. J. Antimicrob. Chemother. 2011, 66, 730–733. [Google Scholar] [CrossRef] [Scilit]
- Yu, H.; Chen, L.; Wu, Y.; Dai, W.; Chen, M.; Chen, Y.; Liu, L.; Wang, J.; Huang, X.; Chen, K.; et al. Liposome of a synergistic combination of HDP-mimicking polymer and rifampicin for treating bacterial infections in aquaculture via oral administration. Sci. China Mater. 2025, 68, 1259–1270. [Google Scholar] [CrossRef] [Scilit]
- Nayak, P.; Panigrahy, N.; Rathore, S.K.; Pattanayak, B.; Dwibedy, S.K. Prevalence of multidrug-resistant gram-negative bacteria carrying mcr genes in freshwater aquaculture systems of Southern Odisha, India. Folia Microbiol. 2026. [Google Scholar] [CrossRef] [Scilit]
- Previti, A.; Biondi, V.; Bruno, F.; Castelli, G.; Pugliese, M.; Vitale, F.; Padalino, B.; Passantino, A. Text mining and topic modeling insights on fish welfare and antimicrobial use in aquaculture. BMC Vet. Res. 2025, 21, 225. [Google Scholar] [CrossRef] [Scilit]
- Hamburg, K.; Bay, C.; Burhenne, J.; Weiss, J.; Stingl, J.C.; Theile, D. Rifabutin boosts rifampicin accumulation in THP-1-derived M2 macrophages by inhibiting P-glycoprotein efflux activity. Arch. Toxicol. 2026, 100, 2535–2541. [Google Scholar] [CrossRef] [Scilit]
- Akhova, A.V.; Nesterova, L.Y.; Tkachenko, A.G. Effect of Biogenic Polyamines on Rifampicin Accumulation in Escherichia coli Cells. Microbiology 2024, 94, 515–523. [Google Scholar] [CrossRef] [Scilit]
- Cocker, D.; Mwapasa, T.; Grabic, R.; Grabicová, K.; Staňová, A.V.; Chidziwisano, K.; Roberts, A.P.; Morse, T.; Feasey, N.A.; Singer, A.C. Environmental hazards from pollution of antibiotics and resistance-driving chemicals in an urban river network from Malawi. npj Antimicrob. Resist. 2025, 3, 85. [Google Scholar] [CrossRef] [Scilit]
- Das, M.; Ojha, A.K.; Dolma, K.G.; Majumdar, T.; Sarmah, P.; Hazarika, S.; Modi, D.; Gogoi, D.; Das, S.; Ramamurthy, T. Monitoring the potential dissemination of antimicrobial resistance in foods, environment, and clinical samples: A one health prospective. Food Sci. Biotechnol. 2025, 34, 803–813. [Google Scholar] [CrossRef] [Scilit]
- Das, M.K.; Das, S.; Srivastava, P.K. An overview on the prevalence and potential impact of antimicrobials and antimicrobial resistance in the aquatic environment of India. Environ. Monit. Assess. 2023, 195, 1015. [Google Scholar] [CrossRef] [Scilit]
- Kumar Basattikoppalu Puttegowda, S.; Anjanappa, P.; Prithviraj Hadya Krishna, T.; Shrestha, Y. A rare case of nephrotic syndrome and arterial thrombosis following long-term rifampicin therapy. Wien. Klin. Wochenschr. 2026, 138, 638–641. [Google Scholar] [CrossRef] [Scilit]
- de Santana, L.M.; da Silva Leite, J.M.; Nadvorny, D.; de Jesus Oliveira, A.C.; Rodrigues, R.R.L.; da Franca Rodrigues, K.A.; de La Roca Soares, M.F.; Soares-Sobrinho, J.L. Rifampicin Polymeric Nanoparticles for Tuberculosis: Molecular Dynamics, Physicochemical Characterization and Cytotoxicity. J. Pharm. Innov. 2026, 21, 135. [Google Scholar] [CrossRef] [Scilit]
- Ogunmoyole, T.; Ola-Awe, A.M.; Fatile, O.G. Ethanolic extract of Mucuna pruriens leaves ameliorates carbon tetrachloride and rifampicin-induced hepatotoxicity and nephrotoxicity in wistar albino rat. BMC Complement Med. Ther. 2021, 21, 282. [Google Scholar] [CrossRef] [Scilit]
- Zhu, S.H.; Zhang, Y.K.; Liu, Z.X.; Qian, B.C.; Li, B.; Liao, X.Q. Determination of rifampicin in fishery products by ultra performance liquid chromatography tandem mass spectrometry with dispersive solid phase extraction. Fish. Sci. 2020, 39, 425–430. (In Chinese) [Google Scholar] [CrossRef] [Scilit]
- Li, S.Y.; Wang, Y.; Ding, X. Rapid Determination Method for Rifampicin Residues in Aquatic Products by Ultra High Performance Liquid Chromatography Tandem Mass Spectrometry. CN107941980A, 20 April 2018. (In Chinese) [Google Scholar]
- National Health Commission of the People’s Republic of China. Determination of Rifampicin Residues in Aquatic Products by Liquid Chromatography-Tandem Mass Spectrometry [S]; National Health Commission of the People’s Republic of China: Beijing, China, 2025. (In Chinese) [Google Scholar]
- Luo, L.J.; Zhou, Y.X.; Ren, X.X.; Li, B.-J.; Xu, Z.-X.; Hua, J.-H.; Han, J.; Zhou, B. Application of small model fish in chemical toxicology research. Acta Hydrobiol. Sin. 2025, 49, 102515. (In Chinese) [Google Scholar] [CrossRef] [Scilit]
- Ling, H.; Miao, T.Y.; Wang, Y.; Xiang, Y.; Hu, K.; Fang, W. Metabolism and distribution of enrofloxacin in Carassius auratus gibelio, water and sediment after medicated feed administration in simulated aquaculture system. J. Fish. China 2023, 47, 162–171. (In Chinese) [Google Scholar]
- Zhu, X.M.; Liu, Y.T.; Yang, Q.H.; Ning, X.; Shaochun, L.; Jing, D.; Yi, S.; Xiaohui, A. Pharmacokinetics and tissue distribution of enrofloxacin emulsion in tilapia. Freshw. Fish. 2021, 51, 42–48. (In Chinese) [Google Scholar] [CrossRef]
- Ministry of Agriculture and Rural Affairs of the People’s Republic of China. Water Quality for Non-pollution Agricultural Products: Freshwater Aquaculture Water [S]; Ministry of Agriculture and Rural Affairs of the People’s Republic of China: Beijing, China, 2001. (In Chinese) [Google Scholar]
- Zhang, Z.; Yang, L.; Ao Jin, H.; Wang, Y.X.; Teng, Q.Q.; Meng, Q.; Cai, Z.Q. Residual and pharmacokinetic behavior of berberine in Carassius auratus under intraperitoneal injection conditions by HPLC-Q-TOF/MS. J. Chromatogr. B 2025, 1254, 124507. [Google Scholar] [CrossRef] [Scilit]
- Zhou, C.; Xia, H.; Hu, Y.; Chen, X.; Zou, Q.; Xu, X.; Jiang, Z.-L. Development and validation of a UPLC-MS/MS method for the quantification of asciminib and its pharmacokinetic interaction and metabolic stability with shikonin. BMC Pharmacol. Toxicol. 2025, 26, 216. [Google Scholar] [CrossRef] [Scilit]
- Zhou, Z.; Wu, X.; Wei, Q.; Liu, Y.; Liu, P.; Ma, A.; Zou, F. Development and validation of a hydrophilic interaction liquid chromatography–tandem mass spectrometry method for the simultaneous determination of five first-line antituberculosis drugs in plasma. Anal. Bioanal. Chem. 2013, 405, 6323–6335. [Google Scholar] [CrossRef] [Scilit]
- Aqil, M.; Bishnoi, M.; Chauhan, M.K. Swift and Precise Determination of Rifampicin by RP-HPLC Technology Development in Pharmaceuticals. Iran. J. Sci. 2023, 47, 1137–1144. [Google Scholar] [CrossRef] [Scilit]
- Xavier, R.M.; Pal, D.; Sukumaran, B.; Ananda, M.; Jangra, A.; Nagappan, K.; Babu, B.; Mani, D. Bioanalytical Method Development for Simultaneous Estimation of Standard First-Line Anti-Tuberculosis Drugs in Human Plasma Using Liquid Chromatography-Tandem Mass Spectrometry. Chromatographia 2026, 89, 563–578. [Google Scholar] [CrossRef] [Scilit]
- Zhang, Y.; Huo, M.R.; Shaofei Xie, J.P. PKSolver: An add-in program for pharmacokinetic and pharmacodynamic data analysis in Microsoft Excel. Comput Methods Programs Biomed. 2010, 99, 306–314. [Google Scholar] [CrossRef] [Scilit]
- Liu, Y.T.; Zhang, G.D.; Yang, Y.B.; Zhou, S.; Dong, J.; Yang, Q.H.; Xu, N.; Ai, X.H. Artemisinin alters disposition regularities of enrofloxacin and its metabolite ciprofloxacin in channel catfish (Ictalurus punetaus) following combined oral administration. Aquaculture 2023, 572, 739466. [Google Scholar] [CrossRef] [Scilit]
- Feenstra, K.A.; De Graaf, C.; Vermeulen, N.P.E. Cytochrome P450 Protein Modeling and Ligand Docking. In Drug-Drug Interactions; Informa Healthcare: London, UK, 2008. [Google Scholar]
- Lagares, L.M.; Minovski, N.; Alfonso, A.Y.C. Homology Modeling of the Human P-glycoprotein (ABCB1) and Insights into Ligand Binding through Molecular Docking Studies. Int. J. Mol. Sci. 2020, 21, 4058. [Google Scholar] [CrossRef] [Scilit]
- Sajid, A.; Lusvarghi, S.; Chufan, E.E. Evidence for the critical role of transmembrane helices 1 and 7 in substrate transport by human P-glycoprotein (ABCB1). PLoS ONE 2018, 13, e204693. [Google Scholar] [CrossRef] [Scilit]
- Bhattacharya, R.; Chatterjee, A.; Chatterjee, S. Commonly used surfactants sodium dodecyl sulphate, cetylpyridinium chloride and sodium laureth sulphate and their effects on antioxidant defence system and oxidative stress indices in Cyprinus carpio L.: An integrated in silico and in vivo approach. Environ. Sci. Pollut. Res. 2022, 29, 30622–30637. [Google Scholar] [CrossRef] [Scilit]
- Thomas, J.R.; Frye, W.J.E.; Robey, R.W. Progress in characterizing ABC multidrug transporters in zebrafish. Drug Resist. Updat. 2024, 72, 101035. [Google Scholar] [CrossRef] [Scilit]
- Hamburg, K.; Bay, C.; Burhenne, J.; Weiss, J.; Stingl, J.C.; Theile, D. THP-1-derived polarized macrophages differ by drug transporter transcriptomics, P-glycoprotein activity and rifampicin uptake kinetics. Arch. Toxicol. 2026, 100, 1377–1389. [Google Scholar] [CrossRef] [Scilit]
- Trott, O.; Olson, A.J. AutoDock Vina: Improving the speed and accuracy of docking with a new scoring function, efficient optimization, and multithreading. J. Comput Chem. 2010, 31, 455–461. [Google Scholar] [CrossRef] [Scilit]
- Eberhardt, J.; Santos-Martins, D.; Tillack, A.F.; Forli, S. AutoDock Vina 1.2.0: New docking methods, expanded force field, and python bindings. J. Chem. Inf. Model. 2021, 61, 3891–3898. [Google Scholar] [CrossRef] [Scilit]
- Salentin, S.; Schreiber, S.; Haupt, V.J.; Adasme, M.F.; Schroeder, M. PLIP: Fully automated protein–ligand interaction profiler. Nucleic Acids Res. 2015, 43, W443–W447. [Google Scholar] [CrossRef] [Scilit]
- Morris, G.M.; Huey, R.; Lindstrom, W.; Sanner, M.F.; Belew, R.K.; Goodsell, D.S.; Olson, A.J. AutoDock4 and AutoDockTools4: Automated docking with selective receptor flexibility. J. Comput Chem. 2009, 30, 2785–2791. [Google Scholar] [CrossRef] [Scilit]
- Friesner, R.A.; Banks, J.L.; Murphy, R.B.; Halgren, T.A.; Klicic, J.J.; Mainz, D.T.; Repasky, M.P.; Knoll, E.H.; Shelley, M.; Perry, J.K.; et al. Glide: A new approach for rapid, accurate docking and scoring. 1. Method and assessment of docking accuracy. J. Med. Chem. 2004, 47, 1739–1749. [Google Scholar] [CrossRef] [Scilit]
- Pagadala, N.S.; Syed, K.; Tuszynski, J. Software for molecular docking: A review. Biophys. Rev. 2017, 9, 91–102. [Google Scholar] [CrossRef] [Scilit]
- Laskowski, R.A.; Swindells, M.B. LigPlot+: Multiple ligand–protein interaction diagrams for drug discovery. J. Chem. Inf. Model. 2011, 51, 2778–2786. [Google Scholar] [CrossRef] [Scilit]

Disclaimer/Publisher’s Note: The statements, opinions and data contained in all publications are solely those of the individual author(s) and contributor(s) and not of MDPI and/or the editor(s). MDPI and/or the editor(s) disclaim responsibility for any injury to people or property resulting from any ideas, methods, instructions or products referred to in the content. |
© 2026 by the authors. Licensee MDPI, Basel, Switzerland. This article is an open access article distributed under the terms and conditions of the Creative Commons Attribution (CC BY) license.