


Abstract
Six tight sandstone cores from the Shaximiao and Xujiahe formations in Well Dongpo 1, Qingshen Block, Sichuan Basin, were investigated using micro-CT imaging, NMR-monitored spontaneous imbibition experiments, and complementary high-pressure mercury intrusion porosimetry (HPMI) data to examine the relationship between pore–throat structure and imbibition behavior and develop a kinetic model of imbibition-height evolution. Cumulative-frequency matching of HPMI and NMR data provided an equivalent-size calibration for one core, enabling comparison of NMR signal changes across calibrated size ranges. Based on capillary imbibition theory, the model incorporated a pore–throat size-distribution parameter, a capillary-pressure correction factor, and an empirical height-dependent pressure correction. The cores exhibited multiscale structures comprising relatively large pores connected through finer throats, with marked differences in pore connectivity. Imbibition-front advancement was generally rapid at early times and slowed thereafter, but imbibition height, water uptake, and mass-based pore-space utilization did not vary proportionally. Within the six-core dataset, final relative imbibition height and NMR signal fraction were positively associated with gas permeability. Under the adopted calibration, the small equivalent size range exhibited a faster early increase in normalized NMR signal and a final value closer to its saturated reference. The proposed model captured the overall slowing of front advancement and yielded lower temporal holdout prediction errors than the Lucas–Washburn and capillary–gravity models for all six cores, although it underestimated continued late-stage advancement in several cores. These findings distinguish front advancement from internal pore filling in the investigated tight sandstones and provide a model for quantitatively describing imbibition-height evolution.
1. Introduction
With continued advances in unconventional oil and gas exploration and development, tight sandstone gas has become an important source of reserve additions and production growth in China. The Upper Triassic Xujiahe Formation and Middle Jurassic Shaximiao Formation in the Sichuan Basin contain widely distributed tight sandstone gas reservoirs with substantial resources. These reservoirs are characterized by low porosity and permeability, fine pore–throat sizes, and strong heterogeneity [1,2]. During reservoir water invasion or exposure to hydraulic-fracturing fluids, water, as the wetting phase, spontaneously enters the pore space under capillary forces and displaces gas. This process affects both the migration extent of the water phase and gas recovery. Water retained in fine pore–throats can reduce effective gas permeability and cause water trapping [3,4]. Tight sandstones commonly contain multiscale pore–throat systems comprising relatively large pores connected by fine throats, together with locally poorly connected pore spaces. Fine throats provide strong capillary forces but also impose substantial flow resistance, whereas larger pores serve as the main fluid-storage spaces. Their filling efficiency depends on adjacent throat size and pore-network connectivity. Consequently, pore–throat size distribution, configuration, and spatial connectivity jointly control the imbibition rate, front height, and final degree of water filling [5,6,7]. Clarifying these controls is essential for understanding gas–water two-phase flow and assessing water-blocking risks in tight sandstone reservoirs.
In recent years, numerous studies have investigated spontaneous imbibition in tight sandstones using gravimetric measurements, CT scanning, and nuclear magnetic resonance (NMR). Wang et al. [7] combined CT and NMR to analyze the water-gas spontaneous imbibition process in heterogeneous sandstone gas reservoirs, pointing out that pore structure and spatial distribution of clay minerals affect the water-phase invasion rate and its distribution along the core. Ren et al. [8] utilized NMR to compare the dynamic and static imbibition characteristics of tight sandstones, revealing differential changes in fluid signals within pores of different scales. Jiang et al. [9] combined high-precision gravimetric measurements with NMR to investigate the imbibition and displacement characteristics of mixed-wet tight sandstones, thereby quantitatively evaluating fluid recovery from different pore types. Tang et al. [10] used an NMR signal-calibration method to quantify oil–water imbibition in tight sandstones, converting the total NMR signal into oil volume through regression and comparing oil recovery across different pore-size ranges. Zhang et al. [11] used pore-scale two-phase flow simulations to investigate water flooding in sandstone, showing that coordination number and pore–throat aspect ratio influence displacement and snap-off events, thereby affecting residual oil distribution. Existing studies have shown that spontaneous imbibition in tight sandstones typically follows a two-stage pattern consisting of rapid early-stage advancement followed by late-stage deceleration, with pronounced differences among pore sizes. However, most existing studies use water uptake, recovery efficiency, or total NMR signal as primary evaluation indicators. The relationships among macroscopic imbibition-front advancement, overall water uptake, and water-phase invasion into pore–throats of different sizes remain insufficiently understood. Moreover, different experimental techniques operate at different scales and have distinct applicability ranges. Establishing quantitative relationships between pore–throat size and dynamic water-phase invasion through the joint calibration of multiple experimental datasets therefore requires further investigation.
In terms of theoretical research, the classical Lucas–Washburn model approximates porous media as equivalent capillary bundles. When neglecting gravity and complex pore–throat structure effects, the imbibition height or liquid uptake volume exhibits an approximately linear relationship with the square root of time. This theory can describe the early-stage imbibition process controlled by capillary force and viscous resistance. However, its assumptions of a single equivalent pore–throat radius and ideal capillary bundles make it difficult to reflect the actual characteristics of multiscale pore–throat systems and strongly heterogeneous pore networks in tight sandstones [12]. Qin et al. [13] demonstrated through studies from pore scale to Darcy scale that pore heterogeneity, non-wetting phase trapping, and non-equilibrium wetting dynamics can significantly alter the imbibition front advancement behavior. Malenica et al. [14] further showed through pore-scale direct numerical simulations that pore–throat contraction and expansion, capillary barriers, interface readjustment, and gas-phase trapping can all cause actual imbibition processes to deviate from the ideal capillary model. These developments show that pore-scale models can resolve structural and interfacial processes beyond the classical capillary-bundle approximation, while requiring detailed pore geometry and wettability inputs. More recently, Wang et al. [15] evaluated an image-based dynamic pore-network model against measured imbibition rates and residual saturations in three sandstone types, while examining the influence of effective contact-angle distributions. For a reduced height-based formulation, the challenge is to retain a tractable connection with measured structure while assessing parameter constraints and predictive performance separately from curve fitting.
To address these gaps, six tight sandstone core samples from Well Dongpo 1 in the Qingshen Block, Sichuan Basin, were investigated using high-pressure mercury intrusion porosimetry (HPMI), micro-CT imaging, and NMR-monitored spontaneous imbibition experiments. The experimental analysis jointly examines imbibition-front advancement, water uptake, and pore filling to distinguish the spatial extent of water migration from the degree of water occupation within the pore space. HPMI–NMR cumulative-frequency matching was used to relate relaxation time to an equivalent pore–throat size scale and examine water-phase invasion across different size ranges. For kinetic modeling, two modifications were introduced within a classical capillary imbibition framework. First, a pore–throat size-distribution parameter, defined as the pore-volume-weighted mean of reciprocal pore–throat radius, was used to represent the capillary contributions of multiple size ranges instead of relying on a single representative radius. A capillary-pressure correction factor was introduced to adjust this statistical estimate of the effective capillary driving pressure. Second, an empirical pressure correction proportional to imbibition height was introduced within the macroscopic pressure balance. Together with the hydrostatic and Darcy viscous terms, this correction provides a tractable description of the progressive slowing of front advancement. The contribution of this study lies in linking multiscale pore–throat characterization to an effective imbibition-height model while distinguishing front advancement from internal pore filling. The model was evaluated through structure-based calibration, temporal holdout prediction, comparisons with classical baselines, and parameter uncertainty analysis.
2. Core Characteristics and Experimental Methods
2.1. Study Area and Core Samples
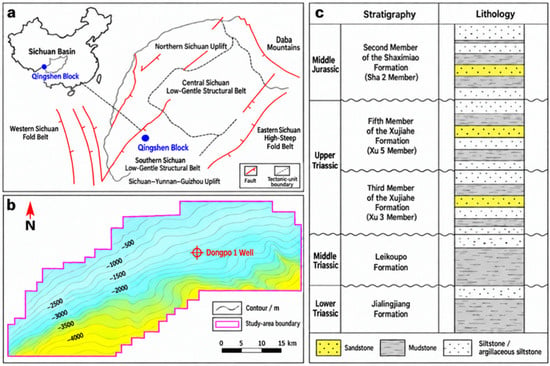
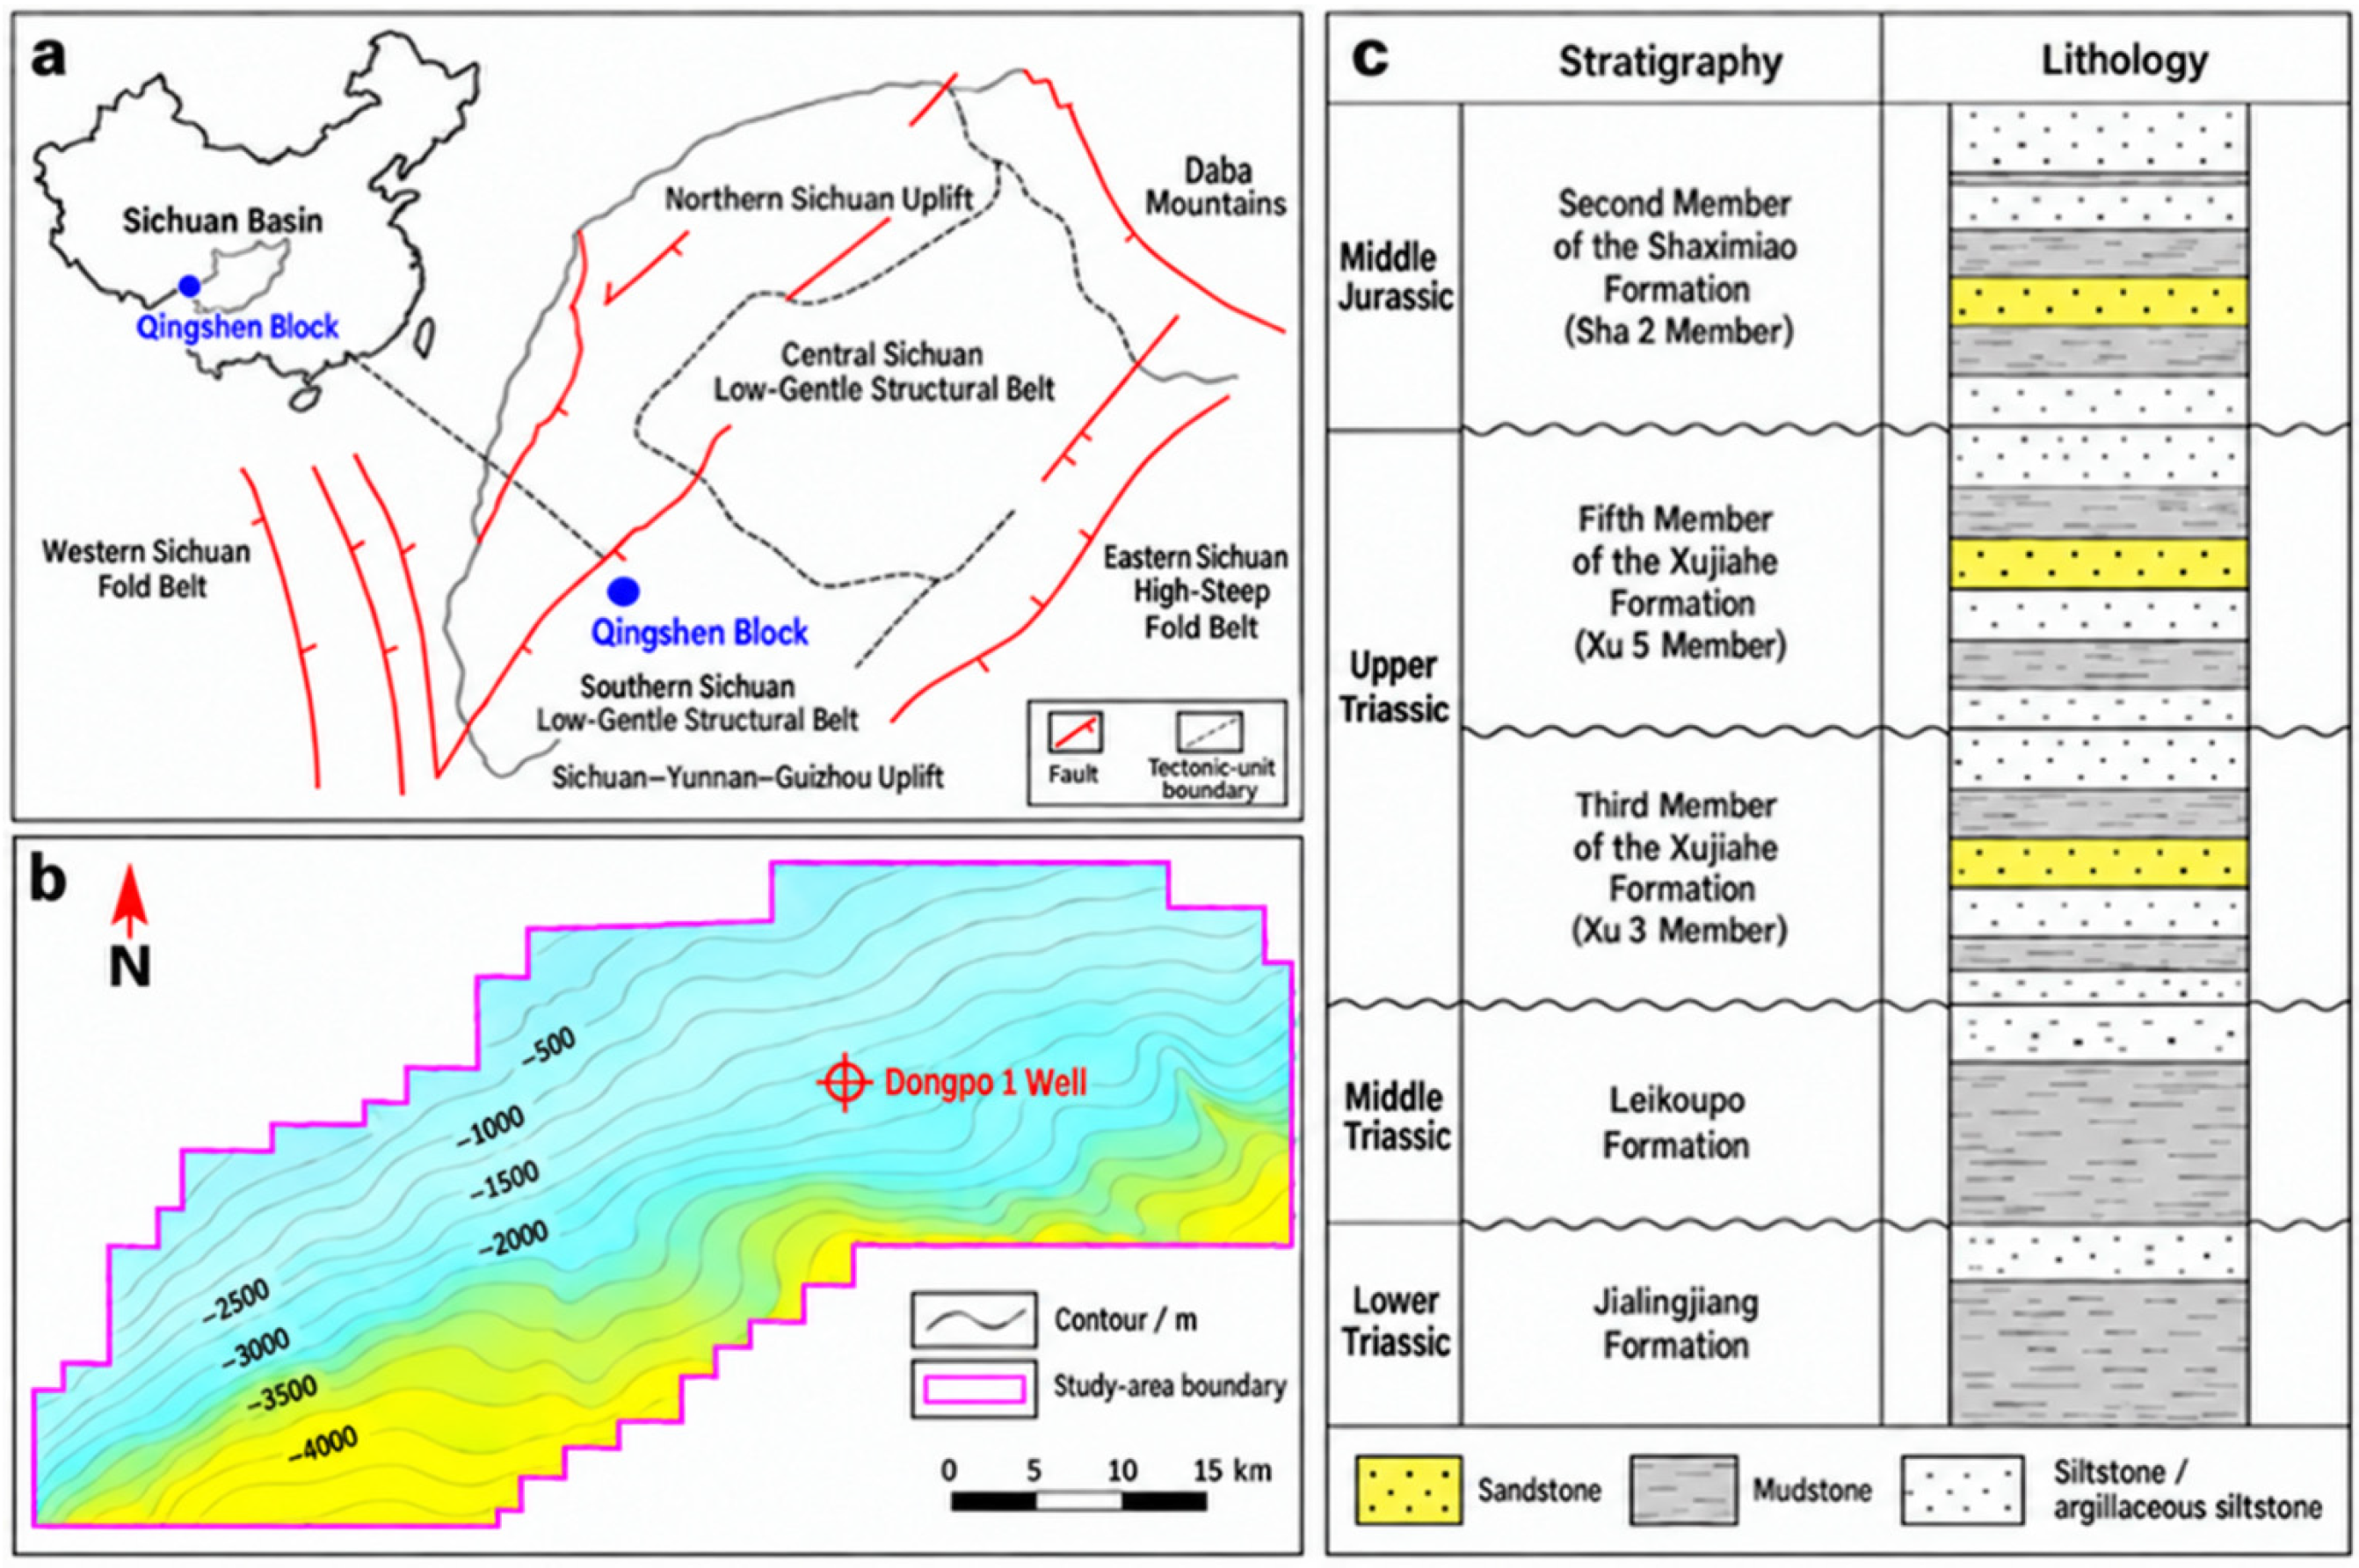
As shown in Figure 1, the study area is located in the Qingshen Block of the Sichuan Basin, and Well Dongpo 1 was selected as the target well. Since the Late Triassic, the Sichuan Basin has undergone a transition from a marine cratonic basin to a continental foreland basin. Multiple large-scale gentle structural belts have formed within the basin, developing two important sets of continental tight sandstone strata: the Upper Triassic Xujiahe Formation and the Middle Jurassic Shaximiao Formation [16,17,18]. During the depositional period of the Shaximiao Formation, the basin mainly developed fluvial-delta-lacustrine depositional systems. Fluvial channel sand bodies were widely distributed, providing the material basis for the formation of tight sandstone reservoirs. The Xujiahe Formation is dominated by continental clastic rock deposits, developing depositional systems such as alluvial fans, fluvial systems, braided river deltas, and lakes. Sandstone and mudstone frequently interbed vertically, resulting in strong reservoir heterogeneity [19,20].
Figure 1.
Tectonic setting and stratigraphic–lithologic characteristics of the Qingshen Block. (a) Location of the Qingshen Block within the Sichuan Basin and regional tectonic divisions; (b) Structural contour map of the study area showing the location of Well Dongpo 1, with colors from blue to yellow indicating decreasing structural elevation; (c) Stratigraphic–lithologic column.
Well Dongpo 1 vertically penetrated multiple sandstone intervals in the Shaximiao Formation and the Xujiahe Formation. Tight sandstone samples from the second member of the Shaximiao Formation (Sha 2 Member), the third member of the Xujiahe Formation (Xu 3 Member), and the fifth member of the Xujiahe Formation (Xu 5 Member) were selected for this study. The Shaximiao-2 Member is dominated by fluvial-channel sand bodies composed mainly of feldspathic lithic sandstone and lithic feldspathic sandstone. The reservoir space mainly consists of residual intergranular pores and secondary pores formed by the dissolution of unstable minerals such as feldspar [17]. The Xujiahe-3 and Xujiahe-5 Members belong to a continental clastic depositional system. Their sandstone reservoirs have undergone strong compaction, cementation, and dissolution alteration, exhibiting diverse pore types but relatively small effective pore–throat sizes. The effectiveness and connectivity of reservoir space are jointly controlled by sedimentary fabric and diagenesis [20]. Differences in depositional environment, degree of burial diagenesis, and pore–throat configuration among these intervals provide a suitable basis for comparing pore–throat structures and their controls on spontaneous water imbibition.
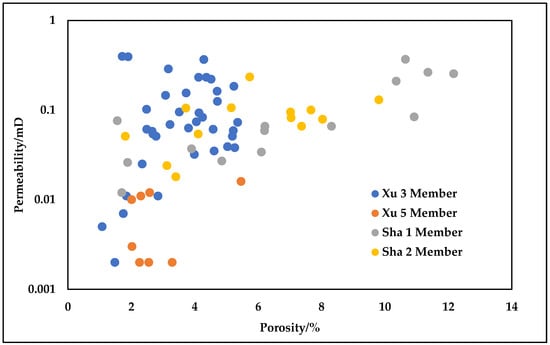
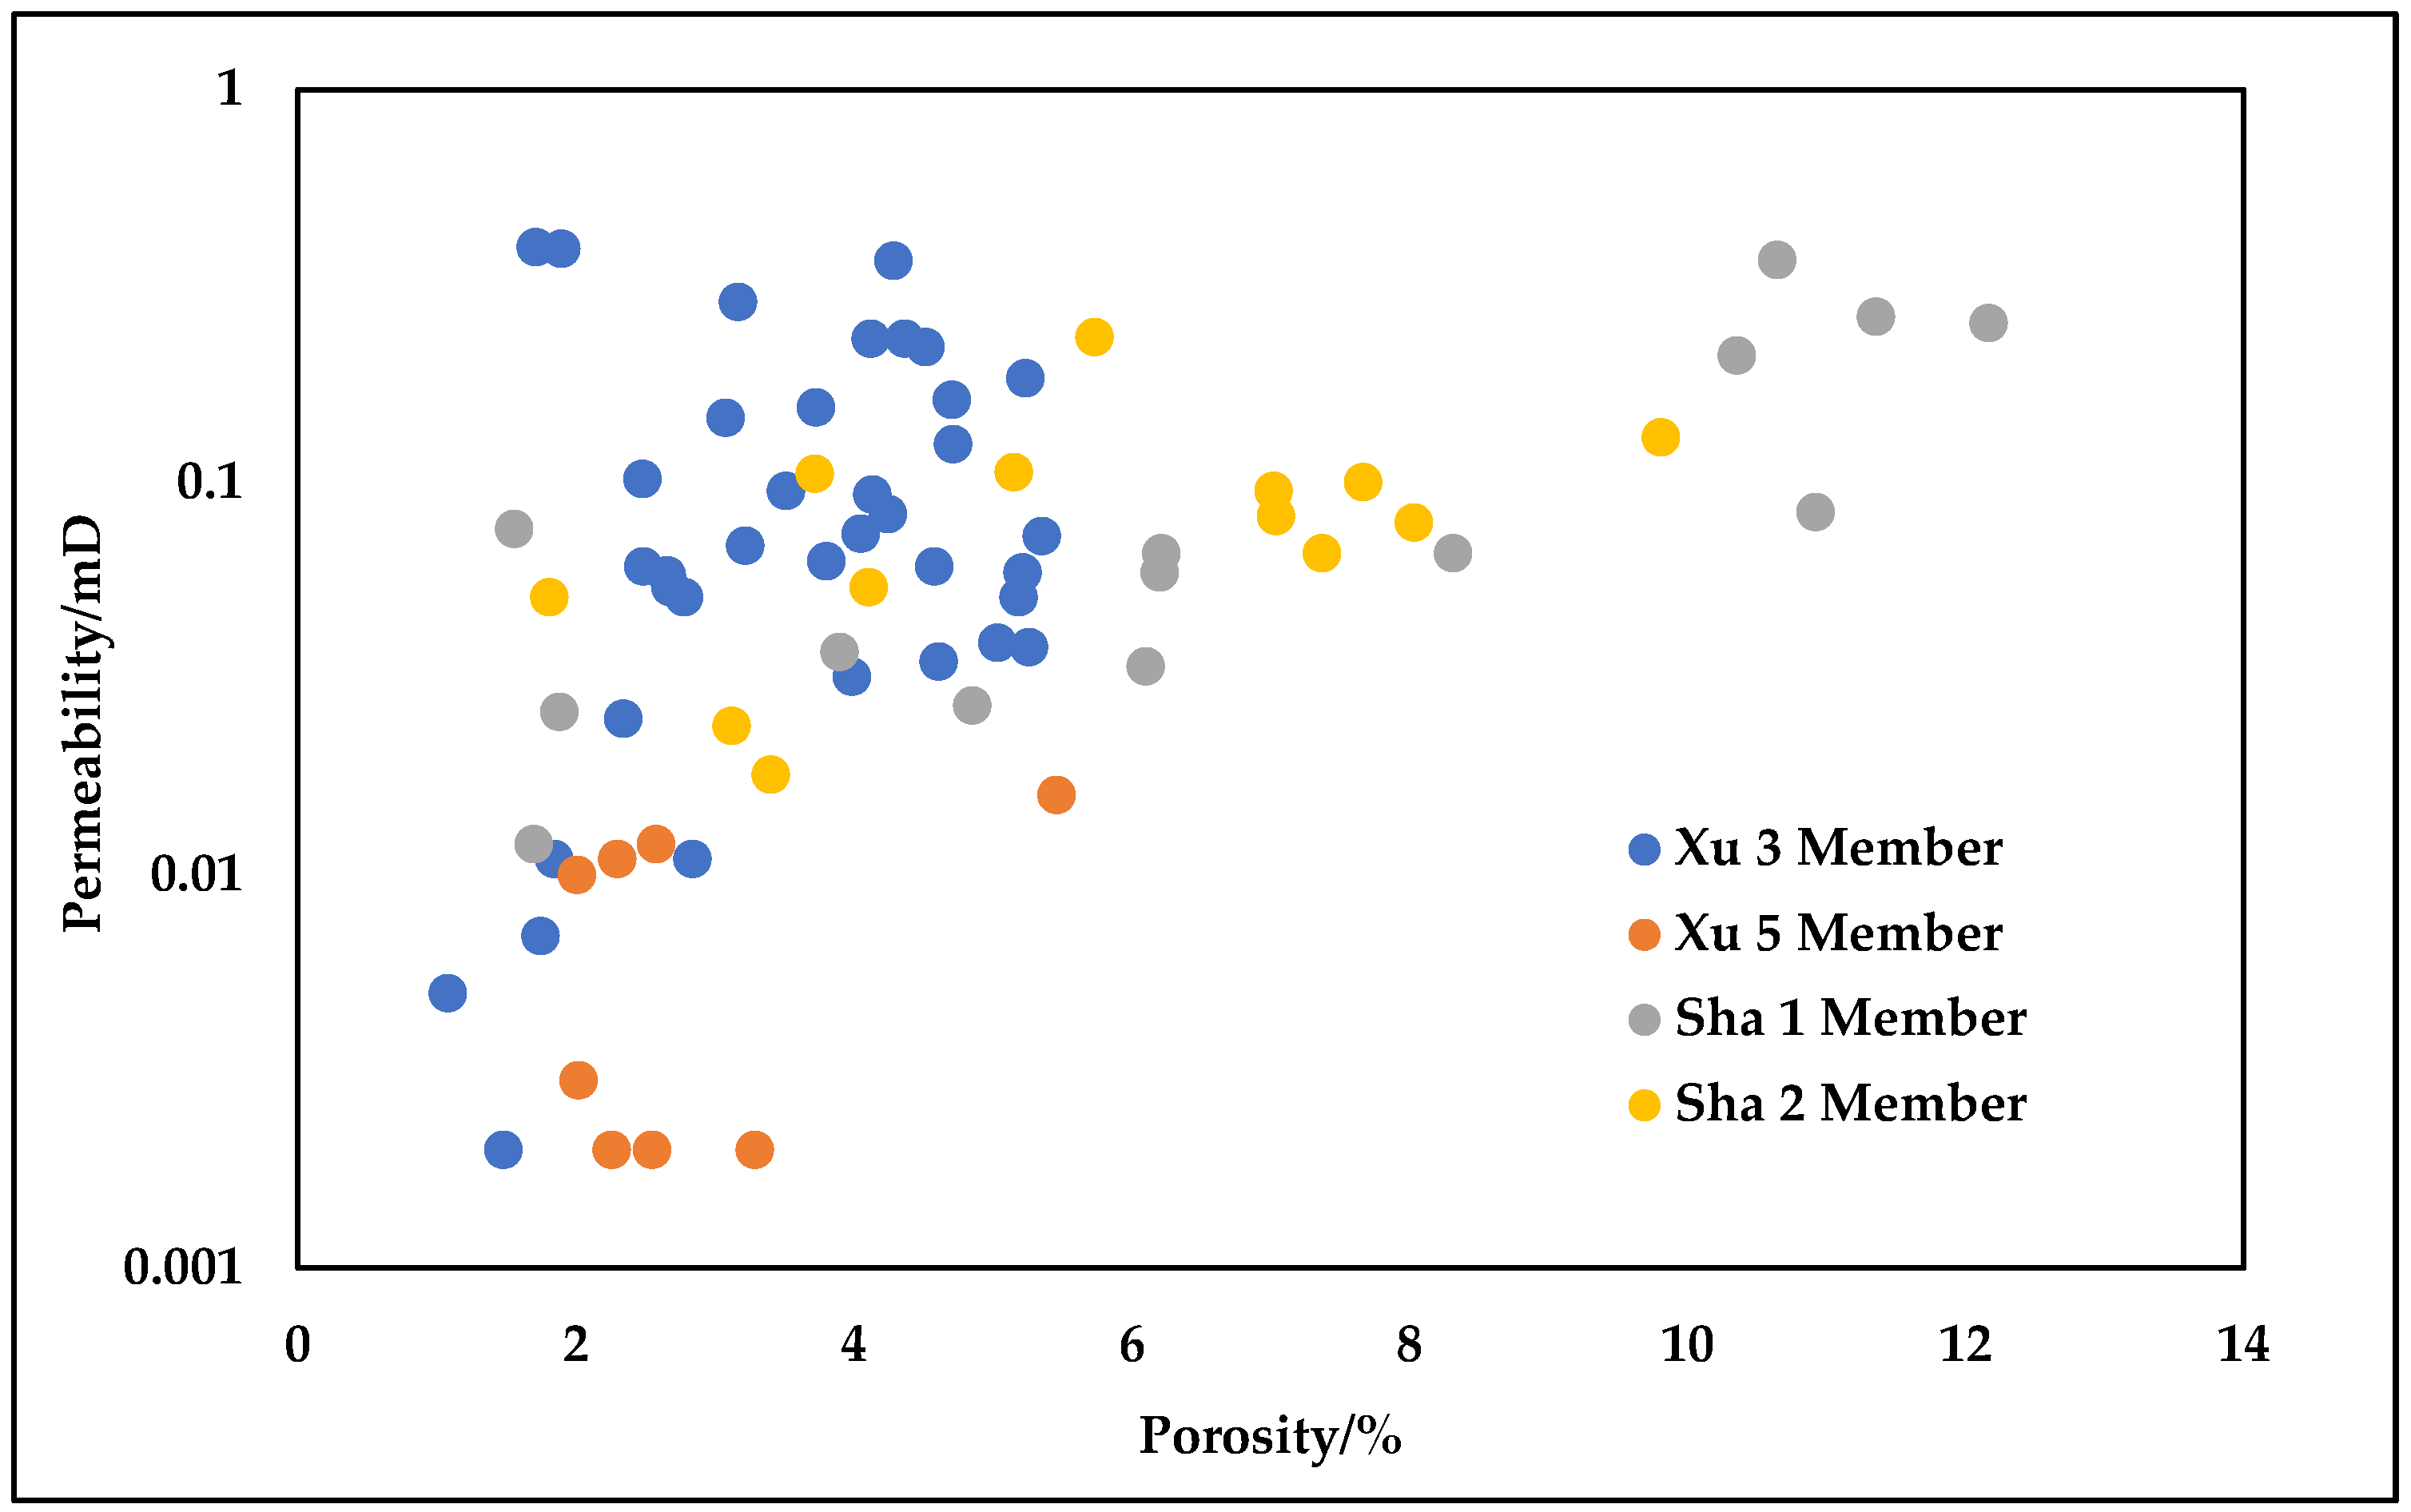
To clarify the physical property distribution characteristics of reservoirs at different intervals in Well Dongpo 1, the porosity and gas permeability of core samples from the 1st member of the Shaximiao Formation (Sha 1 Member), the 2nd member of the Shaximiao Formation (Sha 2 Member), the 3rd member of the Xujiahe Formation (Xujiahe-3 Member), and the 5th member of the Xujiahe Formation (Xu 5 Member) were statistically analyzed. The results are shown in Figure 2.
Figure 2.
Porosity and gas permeability of core samples from different stratigraphic intervals in Well Dongpo 1.
As shown in Figure 2, the porosity of core samples from different intervals in Well Dongpo 1 is mainly distributed in the range of 1.0–6.0%, and the gas permeability is generally lower than 1.0 mD, exhibiting typical characteristics of low porosity and low permeability. The data points from different intervals are relatively scattered, among which the physical properties of core samples from the 3rd member of the Xujiahe Formation vary over a relatively wide range, while the cores from the 2nd member of the Shaximiao Formation generally exhibit relatively higher porosity and permeability.
Based on the stratigraphic distribution and porosity–permeability characteristics described above, six sandstone core plugs from the Xu 3, Xu 5, and Sha 2 members were selected for integrated pore–throat characterization and spontaneous imbibition experiments. As summarized in Table 1, the selected samples cover different porosity–permeability combinations, allowing comparisons of imbibition behavior among cores with contrasting reservoir properties. Four cores from the Xu 3 Member (Cores 14, 16, 23, and 33) were used to examine within-interval differences in pore–throat structure and imbibition behavior. Cores 16 and 23 were used for structure-based model calibration with their respective mercury-intrusion distributions. Temporal holdout prediction was examined for all six cores. Core 51 from the Xu 5 Member and Core 77 from the Sha 2 Member extended the experimental and model comparisons to contrasting stratigraphic intervals. Because only one core was investigated from each of these two intervals, the cross-interval results are treated as sample-specific comparisons rather than evidence of interval-wide representativeness.
Table 1.
Properties of the six core samples.
2.2. Pore–Throat Structure Characterization Experiments
2.2.1. High-Pressure Mercury Intrusion Porosimetry (HPMI) Experiment
High-pressure mercury intrusion porosimetry (HPMI) was employed to characterize the pore–throat structure of tight sandstones. The dried core samples were placed in an AutoPore V 9600 mercury intrusion porosimeter (Micromeritics Instrument Corporation, Norcross, GA, USA), evacuated, and then subjected to stepwise increasing mercury injection pressure. After reaching the maximum pressure, the pressure was gradually reduced to obtain a complete mercury intrusion–extrusion capillary pressure curve. The maximum mercury injection pressure in the experiment was approximately 414 MPa, with mercury surface tension taken as 0.485 N/m and contact angle as 130°. Based on the Washburn equation, the capillary pressure was converted to pore–throat radius. Combined with the intrusion–extrusion curves and pore–throat radius distribution, parameters such as displacement pressure, maximum mercury saturation, median pore–throat radius, and mercury extrusion efficiency were obtained to characterize the pore–throat size, connectivity, and heterogeneity of the core samples.
2.2.2. CT Scanning and Pore Network Extraction
Micro-CT scanning was performed using a MicroXCT-400 scanner (Xradia, Inc., Pleasanton, CA, USA) on dried specimens approximately 2 mm in diameter to characterize local three-dimensional pore structure. These small specimens were distinct from the approximately 2.5 cm diameter core plugs used in the imbibition experiments and listed in Table 1. The scanning voltage and power were 200 kV and 20 W, respectively, and the nominal scanning resolution specified in the test reports was 1 μm. The recorded number of scan frames ranged from 2300 to 2400. The reconstructed image matrices were 2400 × 2400 × 2400 voxels for Core 14, 2300 × 2300 × 2300 voxels for Cores 16, 23, 33, and 51, and 2300 × 2300 × 2400 voxels for Core 77. The reconstructed grayscale images were processed by noise reduction, grayscale correction, and threshold segmentation to distinguish pore space from the rock matrix and construct three-dimensional pore models.
Based on the three-dimensional pore structure model, a pore network was extracted to represent the complex pore space as an equivalent topological structure composed of pores and throats. Parameters such as total porosity, connected porosity, pore radius, throat radius, pore coordination number, and throat length were statistically analyzed, and the proportion of connected pore volume was calculated. These parameters were used to characterize the pore–throat size, spatial connectivity, and structural heterogeneity of tight sandstones.
2.3. NMR-Coupled Imbibition Experiments
The core sample was oven-dried to a constant weight and cooled, after which its initial mass and NMR T2 spectrum in the dry state were measured. The core was then placed vertically in a container filled with simulated formation water, with the bottom surface of the core in contact with the liquid, to establish bottom-up spontaneous imbibition conditions. During the experiment, the liquid level was kept constant, and the core mass and imbibition front height were recorded at predetermined time intervals.
At the selected measurement times, the cores were briefly removed and liquid adhering to their outer surfaces was quickly wiped off. Low-field nuclear magnetic resonance (LF-NMR) measurements were performed at room temperature using a MacroMR12-150H-I large-bore NMR imaging and analysis system (Suzhou Niumag Analytical Instrument Corporation, Suzhou, China) to obtain T2 spectra at the corresponding imbibition time points. Changes in total NMR signal amplitude and its distribution across T2 intervals were used to track the evolution of the water-associated NMR response during imbibition. Meanwhile, combined with the variations in core mass increment and imbibition front height over time, the imbibition rate, water uptake capacity, and water-phase migration characteristics of the tight sandstone were analyzed. The water-saturated reference state was prepared by evacuating the cores for 6 h, followed by water saturation at 15 MPa for at least 8 h. The mass and NMR T2 spectrum measured in this state provided the saturated reference values for calculating mass-based pore-space utilization and normalized NMR indices.
3. Physical Properties and Pore–Throat Structure Characteristics of Tight Sandstone
3.1. Pore–Throat Structure Characterized by HPMI
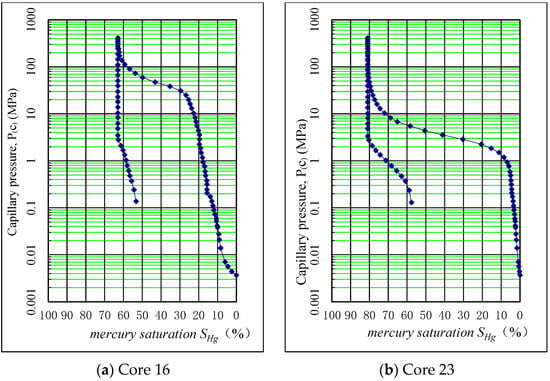
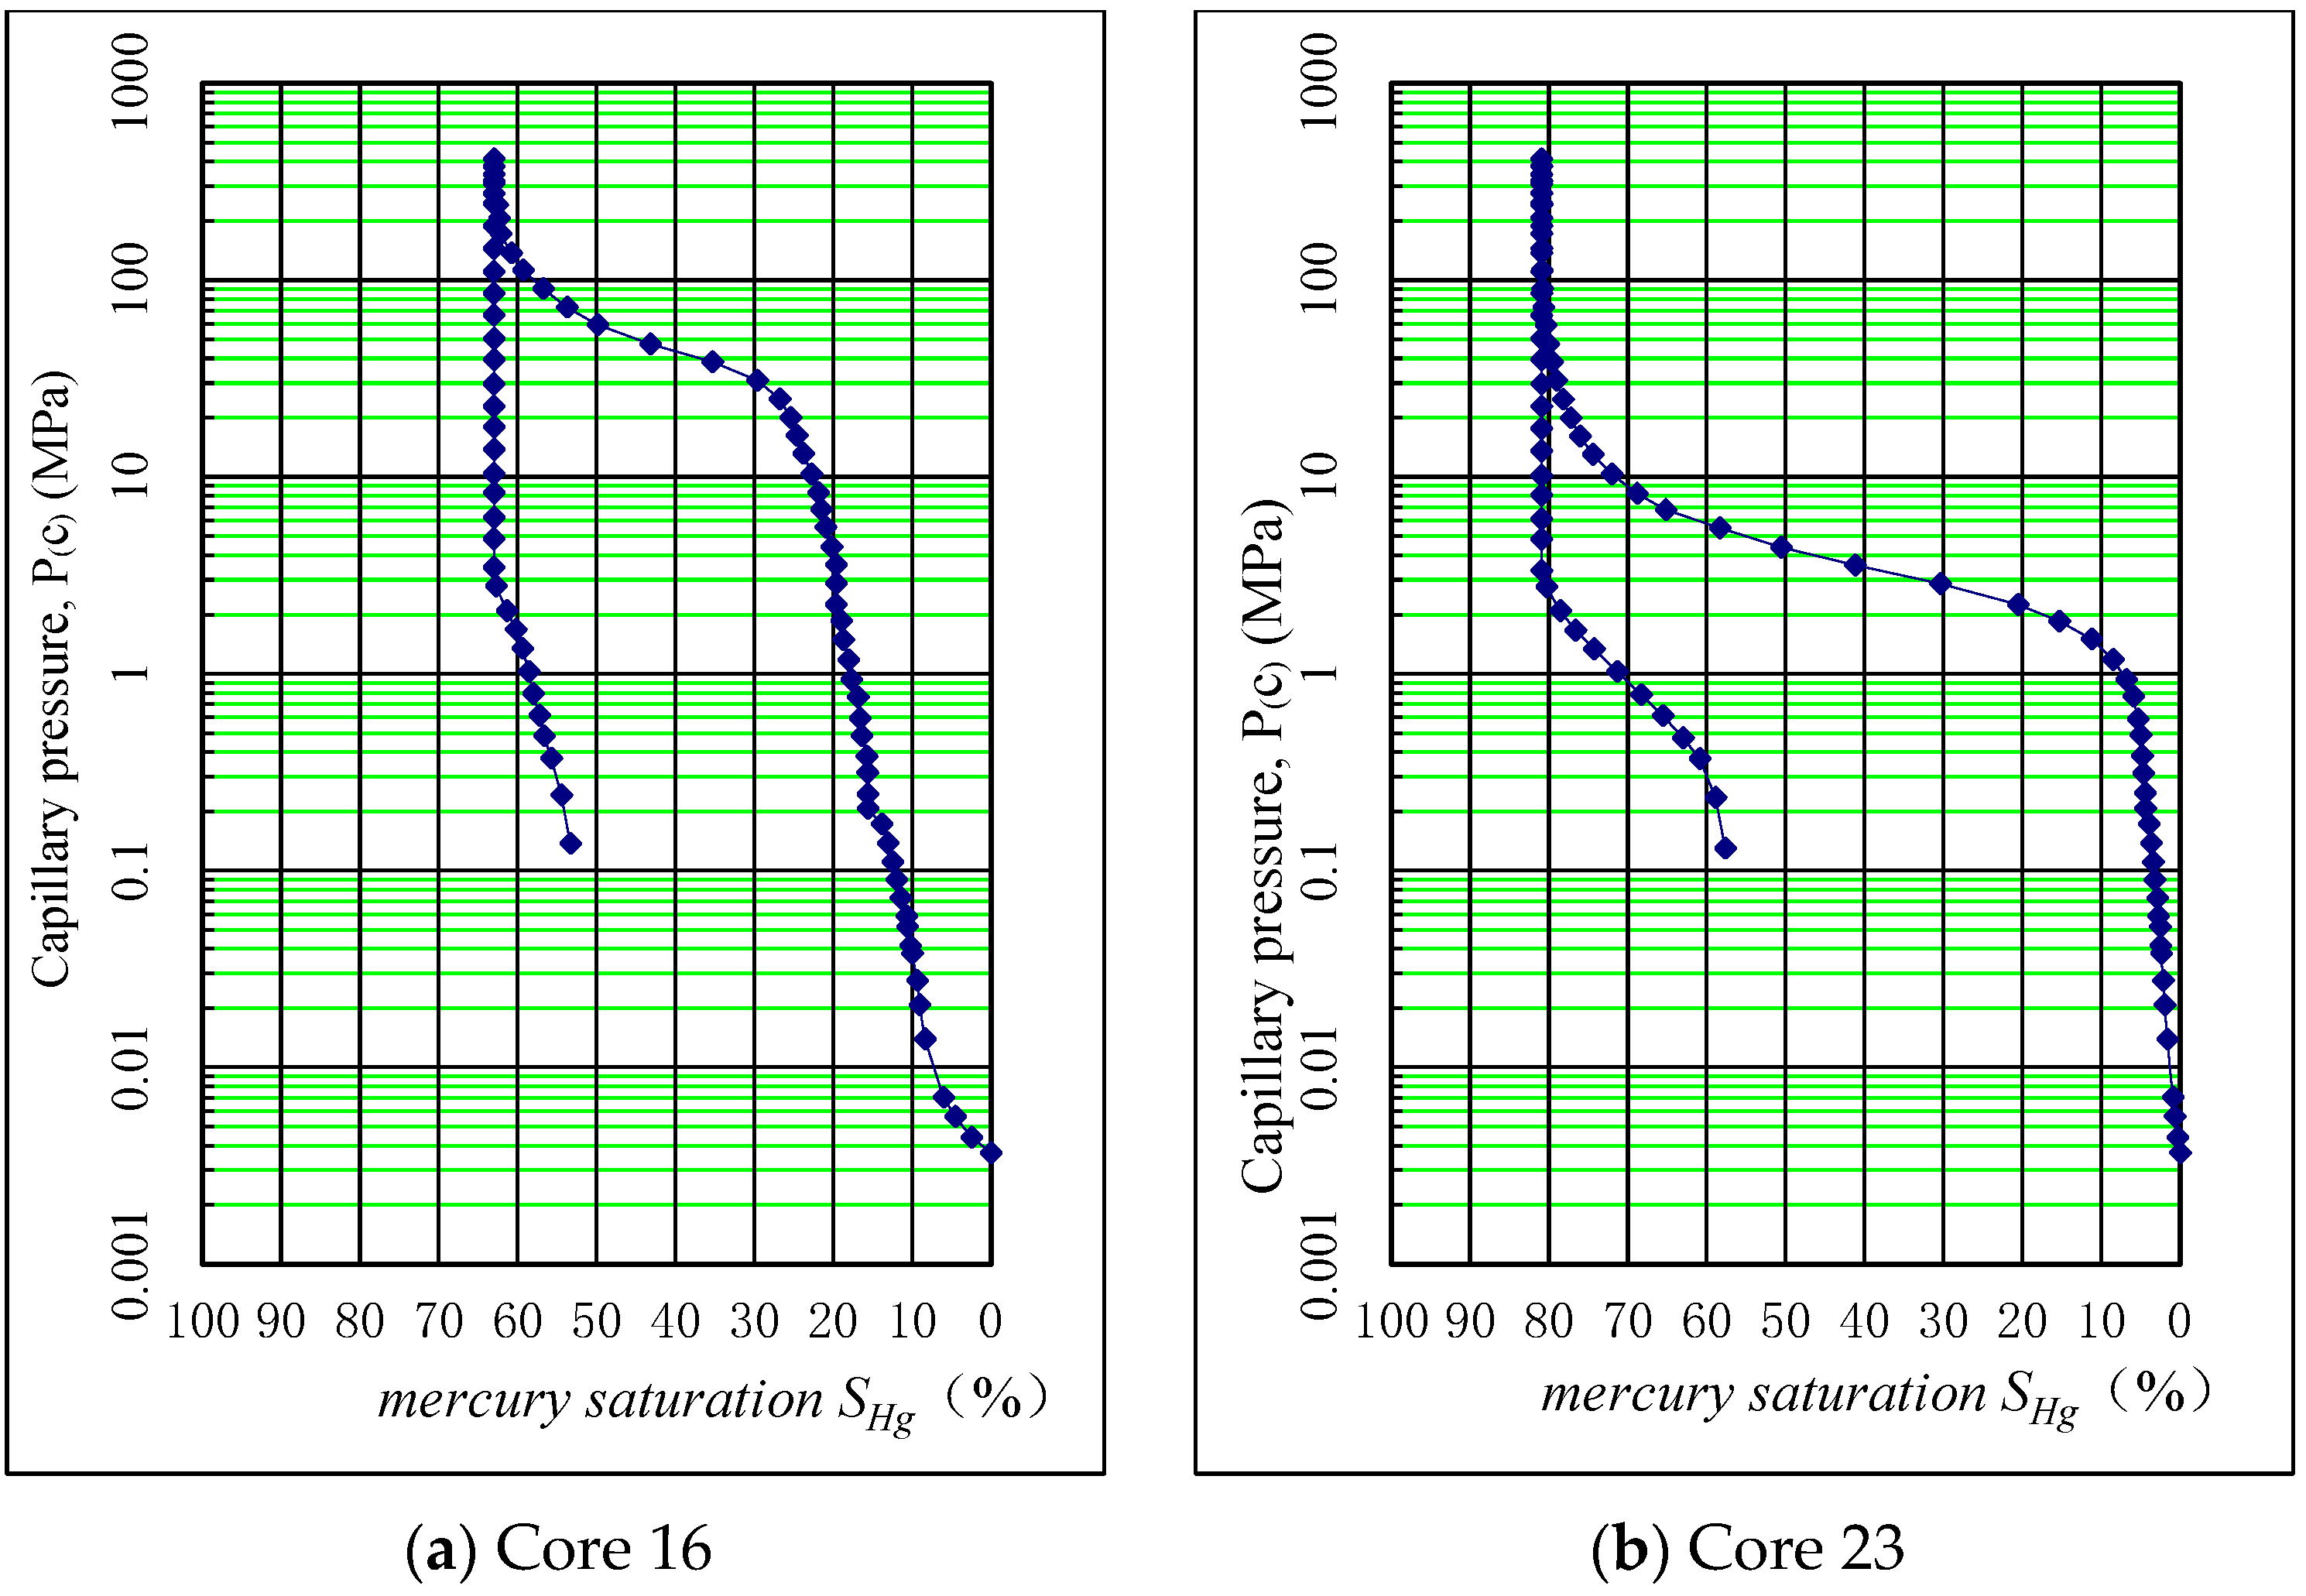
The mercury intrusion–extrusion curves of Cores 16 and 23 span a broad pressure range and exhibit pronounced hysteresis (Figure 3). At the low-pressure stage, the increase in mercury saturation is relatively small; as the capillary pressure increases, the mercury saturation continues to rise, indicating that the pore–throat size distribution of the core samples is relatively broad and that the connectivity of the pore space is primarily controlled by fine throats. After pressure release, a considerable amount of mercury remains trapped within the pores, reflecting the relatively complex pore–throat configurations of the cores, with locally developed “ink-bottle”-shaped pores characterized by large pore bodies and narrow throats, which impose certain restrictions on the fluid withdrawal process.
Figure 3.
Mercury intrusion–extrusion capillary pressure curves for Cores 16 and 23. (a) Core 16; (b) Core 23. Blue diamonds represent measured data points, and blue solid lines connect the data points to show the intrusion–extrusion paths. Green lines are auxiliary gridlines for the logarithmic pressure axis.
The high-pressure mercury intrusion porosimetry (HPMI) results for Core 16 exhibit an intrusion curve that is overall shifted toward the high-pressure region. At the low-pressure stage, the mercury saturation increase is relatively small and only becomes significant after capillary pressure reaches relatively high values, indicating that the effective connected throats are relatively fine and that fluid entry into the pore space requires overcoming considerable capillary resistance. In contrast, Core 23 shows obvious mercury intrusion at relatively low capillary pressures, suggesting that larger-scale effective throats are relatively developed, and that its pore accessibility and connectivity are superior to those of Core 16. However, the residual mercury saturation of Core 23 after mercury extrusion is relatively high, indicating a pronounced size contrast between larger pores and fine throats, with strong mercury retention occurring during the pressure release process. These results indicate that relatively high permeability primarily reflects well-developed effective flow pathways but does not necessarily imply that fluids within the pore space can be completely displaced.
3.2. Three-Dimensional Pore Structure Characteristics Based on CT Scanning
The micro-CT statistical results indicate that the pore–throat structure parameters of the six core samples exhibit pronounced differences. Specifically, the average pore radius ranges from 4.69 μm to 25.20 μm, the average throat radius ranges from 2.62 μm to 13.08 μm, the average throat length ranges from 16.86 μm to 67.73 μm, the proportion of connected pore volume ranges from 38.25% to 85.90%, and the number of identified pores ranges from 2675 to 93,119. The wide distribution ranges of these parameters indicate that the cores exhibit strong heterogeneity in terms of pore–throat scale, spatial configuration, and connectivity. The micro-CT results should be interpreted within the limits of the reported spatial resolution of 1 μm. The connected pore-volume fractions describe the proportion of segmented pore volume belonging to connected clusters within the scanned volumes, rather than the connectivity of the entire pore space. Fine pores and narrow throats below the effective detection limit may not be resolved, and partial-volume effects and segmentation thresholds can influence the identification of small features. Unresolved throats may connect pores that appear isolated in the reconstructed images; therefore, the reported connectivity is dependent on imaging resolution and segmentation. These results are used to characterize the three-dimensional organization of the resolvable pore space and are interpreted alongside HPMI data to assess the multiscale pore–throat structure. The CT specimens were 2 mm in diameter, whereas the imbibition plugs were approximately 2.5 cm in diameter. The CT-derived parameters therefore describe local pore geometry and connectivity within the imaged volumes. They provide complementary structural information but do not establish quantitative representativeness for the entire plugs. Accordingly, these parameters were not used directly as whole-core inputs to the kinetic model.
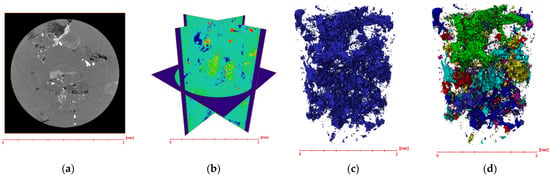
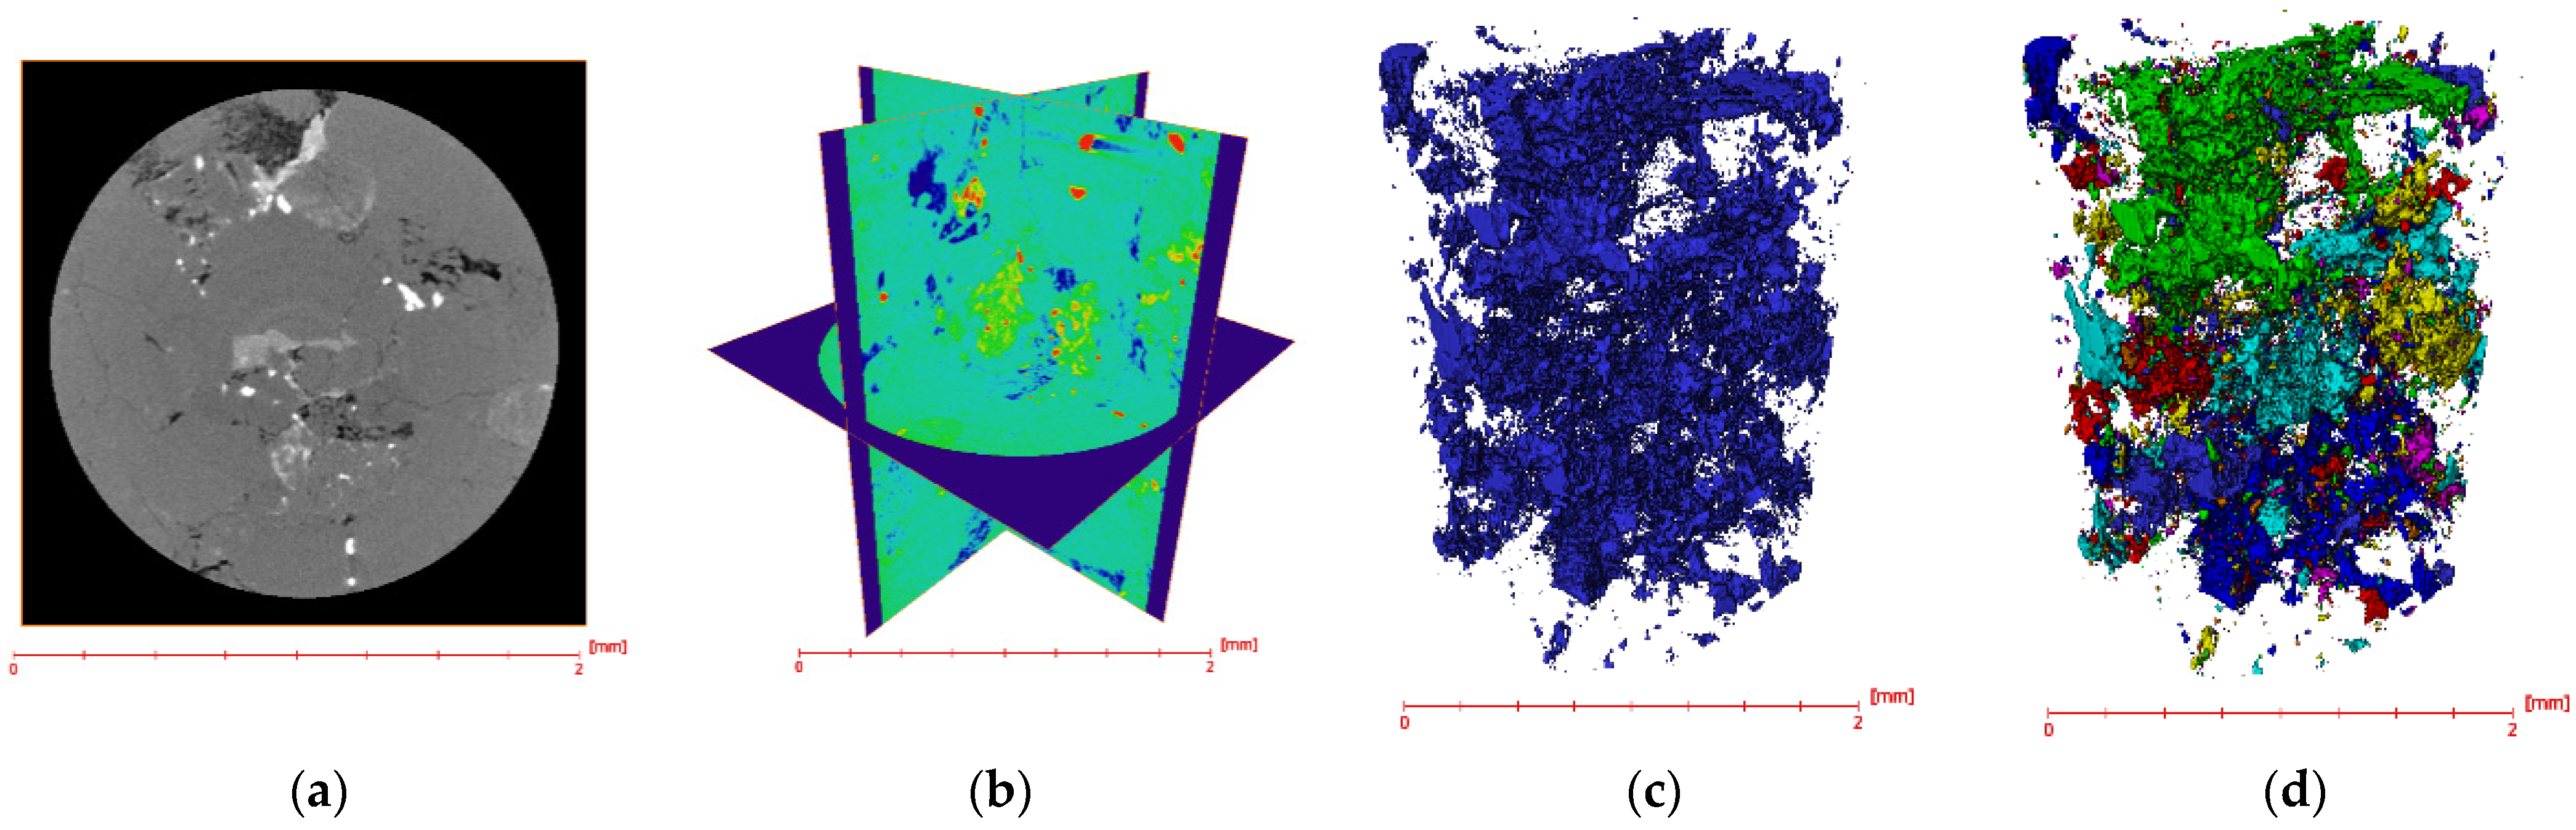
Figure 4 illustrates the pore morphology and spatial connectivity resolved by micro-CT for Core 23. Core 23 has an average pore radius of 17.60 μm, an average throat radius of 7.80 μm, an average throat length of 48.22 μm, and a connected pore-volume fraction of 85.90%, indicating a high degree of connectivity within the CT-resolved pore space. From the cross-sections and XYZ-direction slices, it can be observed that the pores are not uniformly distributed within the rock matrix; they are relatively concentrated in local regions and exhibit irregular spot-like and cluster-like morphologies. The number, morphology, and density of pores also vary across slices in different directions, reflecting pronounced directional differences and heterogeneity in the pore space. Furthermore, the three-dimensional reconstruction results reveal that the internal pores of Core 23 are interconnected, forming a dominant pore network with good continuity. The connected pore space is dominated by a single major cluster, accompanied by a small number of isolated pores and smaller locally connected clusters. The reconstruction shows a dominant connected pore cluster together with smaller disconnected clusters, indicating spatially heterogeneous connectivity within the imaged volume.
Figure 4.
Micro-CT slices and reconstructed pore structure of Core 23. (a) Cross-section of the core, with grayscale variations reflecting differences in X-ray attenuation; (b) XYZ-direction slices displayed using a false-color representation of CT grayscale values; (c) Three-dimensional pore space shown in blue; (d) Connected pore clusters distinguished by different colors.
High-pressure mercury intrusion porosimetry (HPMI) and micro-CT exhibit strong complementarity in terms of characterization scale. HPMI primarily reflects the fine throats that control fluid migration and their size distribution, whereas micro-CT focuses on revealing the three-dimensional distribution of larger pores, connected pores, and preferential pathways. The results of both methods indicate that the studied cores contain a multiscale pore–throat system composed of larger pores, fine throats, and locally poorly connected pore spaces. Among them, the larger pores provide the primary storage space for fluids, effective throats control the communication between pores, and fine throats can either generate capillary driving forces or increase the resistance to water-phase migration. The combination of pores and throats at different scales results in pronounced differences among the cores in terms of storage space volume and pore connectivity.
4. Dynamic Characteristics of Spontaneous Imbibition and Pore-Scale Water-Phase Migration
4.1. Changes in Imbibition Height and Water Uptake
The relative imbibition height was used to describe the advancement of the imbibition front relative to the core length. Mass-based pore-space utilization was defined as the water mass absorbed through spontaneous imbibition divided by the water mass retained in the fully water-saturated reference state. It therefore measures the fraction of the reference water-storage capacity attained during imbibition:
where Hr is the relative imbibition height, %; Ht is the imbibition height at time t, cm; L is the core length, cm; Dt is the mass-based pore-space utilization at time t, %; and mt, m0, and ms are the core masses at time t, in the dry state, and in the fully water-saturated state, respectively, g.
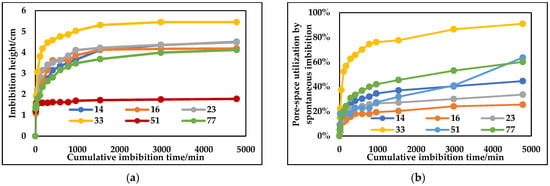
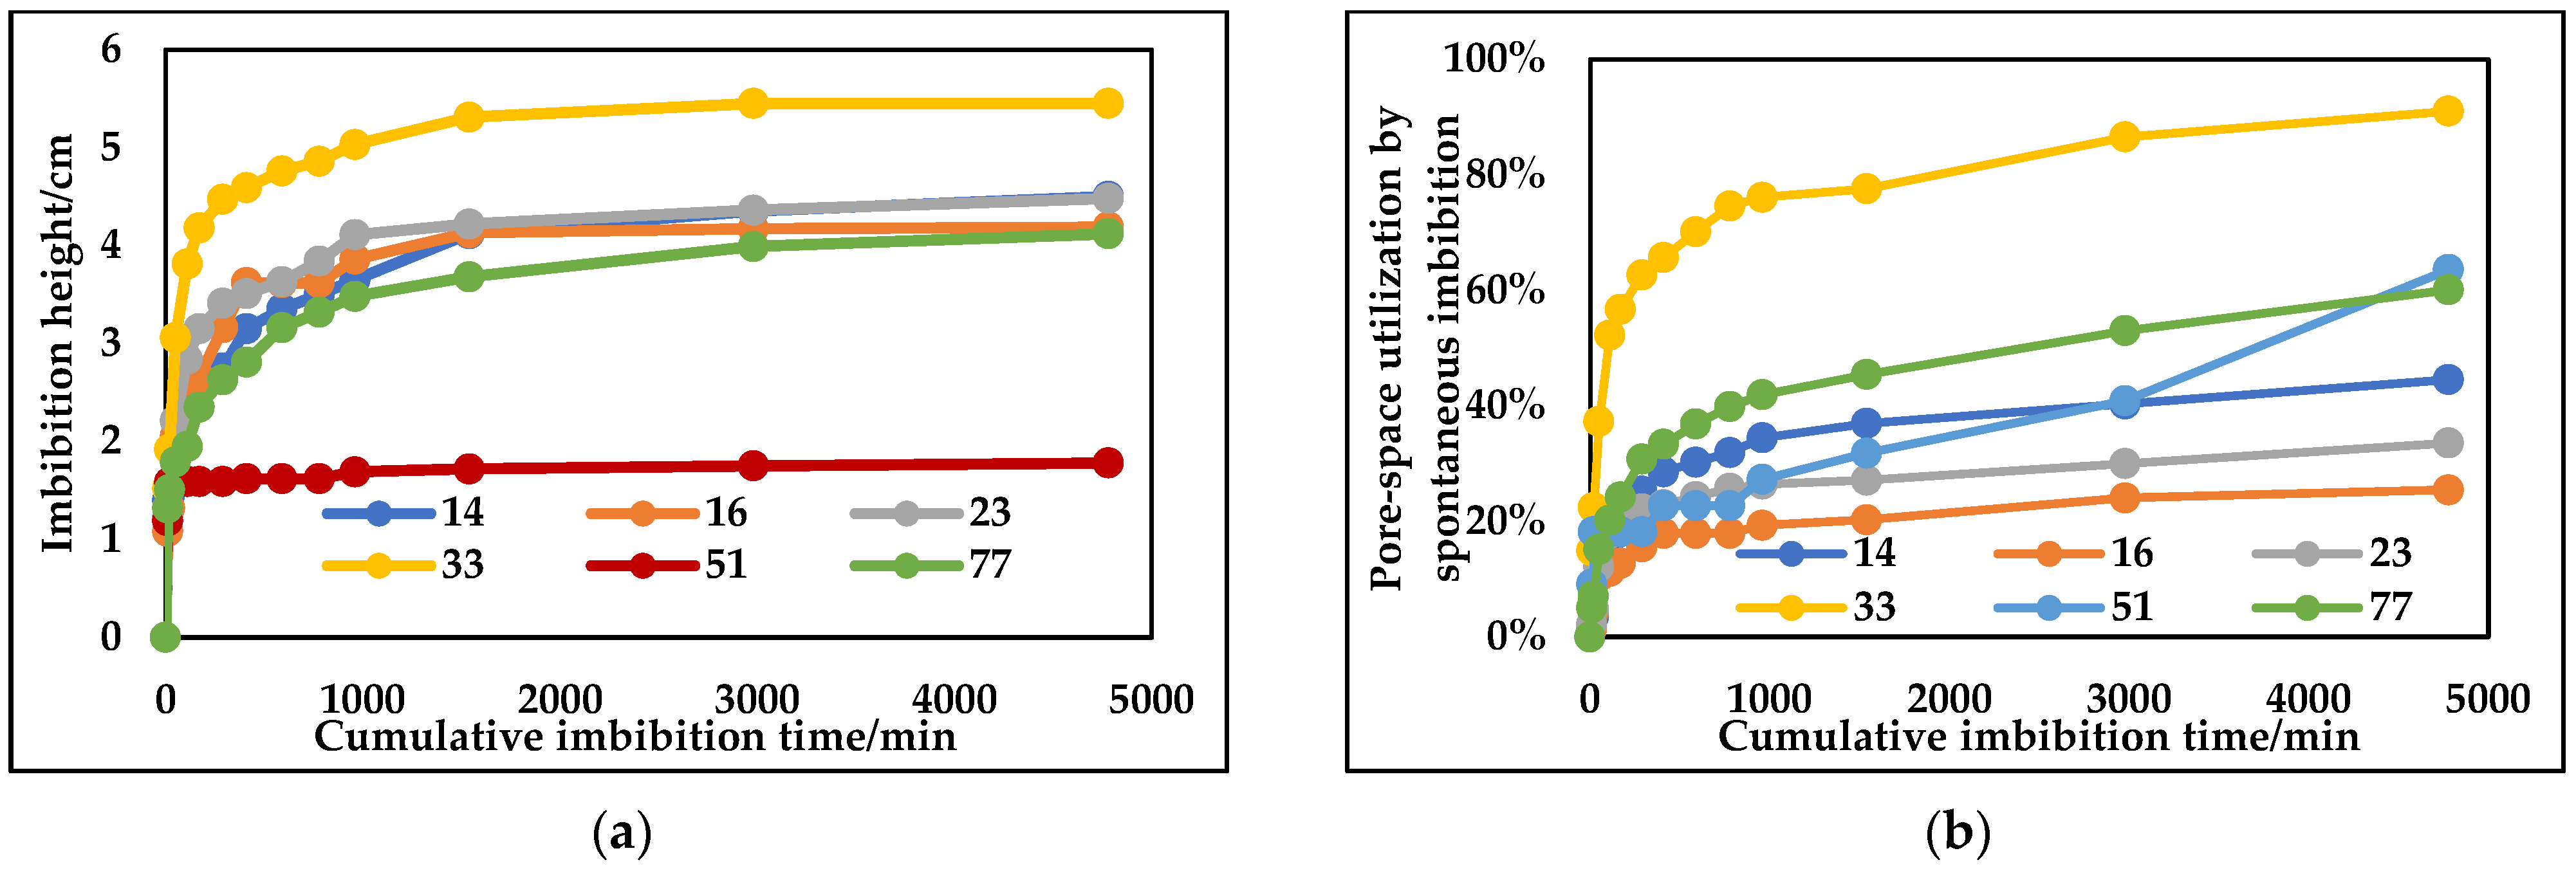
All six cores showed rapid initial front advancement followed by slower height increases (Figure 5). At 10 min of imbibition, the imbibition front had risen to 1.08–1.52 cm. By 290 min, the imbibition height of each core had increased to 2.63–4.47 cm, indicating that the main advancement process of the spontaneous imbibition front was concentrated in the early stage of the experiment. The declining advancement rate is consistent with the increasing hydrostatic contribution and the longer flow path through the wetted region. At 4780 min, the front in Core 33 had reached the core top. The final heights were 4.50, 4.19, 4.48, 1.78, and 4.12 cm for Cores 14, 16, 23, 51, and 77, respectively.
Figure 5.
Evolution of imbibition height and mass-based pore-space utilization in six cores. (a) Imbibition height versus time for different core samples; (b) Temporal evolution of spontaneous-imbibition pore-space utilization for different core samples.
Water uptake of all core samples generally increased continuously with imbibition time; however, water uptake was not necessarily proportional to imbibition height. At 4780 min, the increases in water mass for Cores 14, 16, 23, 33, 51, and 77 were 0.53, 0.54, 0.47, 0.61, 0.14, and 1.19 g, respectively, corresponding to mass-based pore-space utilization values of 44.54%, 25.47%, 33.57%, 91.04%, 63.64%, and 60.10%. Core 77 exhibited the highest water uptake, but its mass-based pore-space utilization was lower than that of Core 33, showing that greater absolute uptake did not correspond to a larger fraction of the saturated reference capacity. Core 33 absorbed 0.61 g of water and attained 91.04% of that reference capacity by the end of the experiment. Therefore, imbibition height, water uptake, and pore-space utilization by spontaneous imbibition characterize the migration range of the water phase, actual water-absorption capacity, and degree of pore-space utilization, respectively. Together, these parameters enable a comprehensive evaluation of the spontaneous imbibition capacity of different core samples.
4.2. Evolution of the NMR Signal Amplitude
To quantitatively characterize the evolution of the water-phase NMR signal within the core pore space during spontaneous imbibition, the NMR signal increment at each imbibition time and its proportion relative to that under pressure-saturated conditions were calculated after subtracting the baseline signal of the dry core:
where St, S0, and Ss denote the total NMR signal amplitudes at time t, in the dry state, and in the fully water-saturated reference state, respectively. Rt is the spontaneous-imbibition NMR signal fraction, defined as the dry-baseline-corrected signal at time t normalized by that in the fully water-saturated reference state. It describes the extent of water-associated NMR signal development relative to the reference state. Unlike Dt, which is calculated from water mass, Rt is calculated from the NMR response under the adopted acquisition and processing conditions. Its interpretation as a water-volume fraction requires a proportional relationship between the measured signal and water volume. The two indicators therefore provide complementary measures of water uptake and pore filling, but their numerical values are not assumed to be identical or used interchangeably.
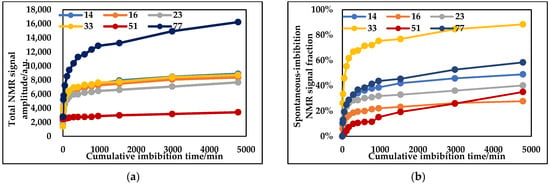
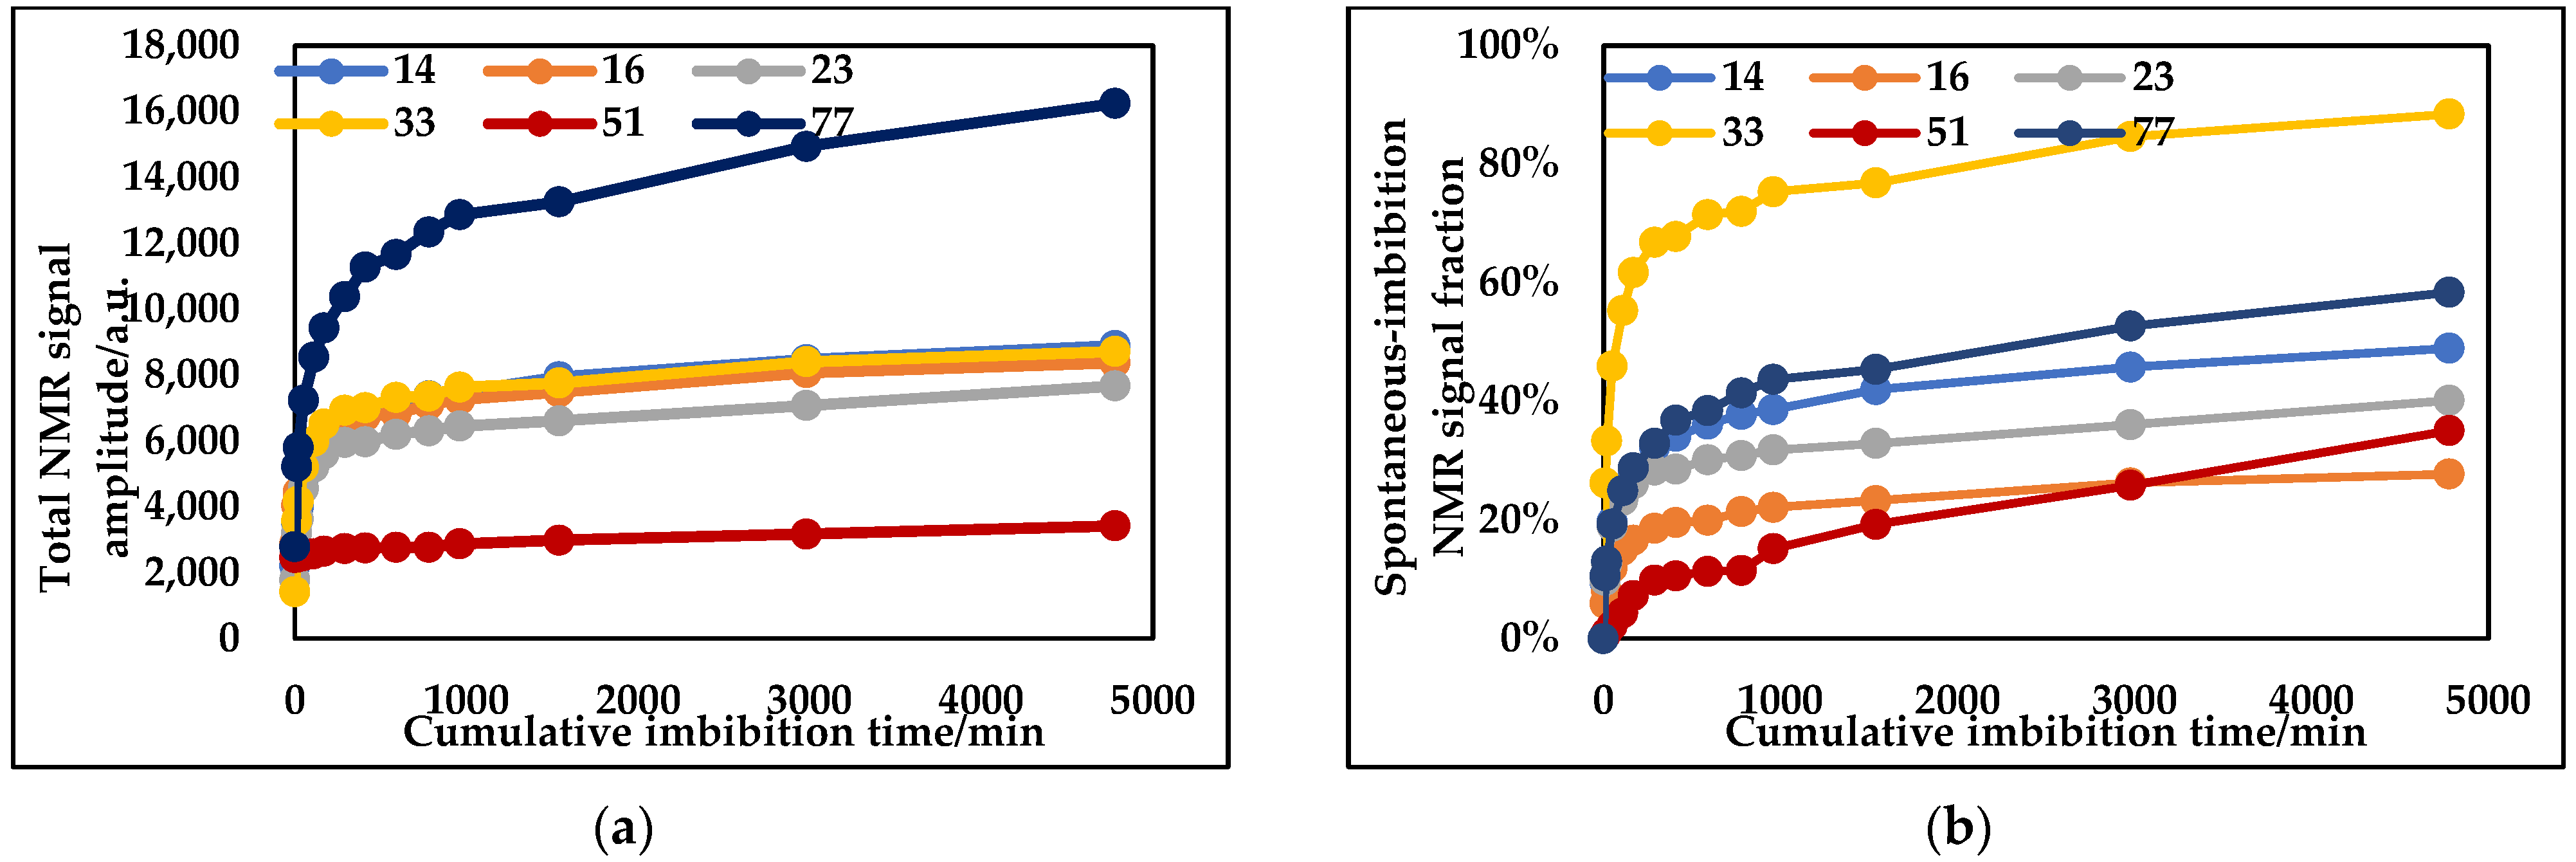
As shown in Figure 6, the total NMR signal amplitudes of all six cores increased with imbibition time, although marked differences were observed in both the rate of signal increase and the final signal increment. During the early stage of imbibition, the NMR signals of Cores 14, 16, 23, 33, and 77 increased rapidly, reaching 19.39%, 21.19%, 24.41%, 29.64%, and 18.06% of their respective final signal increments at 10 min. By 290 min, these cores had attained 56.34–75.57% of their final NMR signal increments, showing that more than half of the measured signal increase occurred during the first 290 min. The rate of NMR signal increase declined as imbibition proceeded, indicating slower development of the water-associated response at later times. By 1540 min, the cores had attained 77.76–86.87% of their final signal increments, after which the signal variations gradually stabilized. In contrast, Core 51 attained only 1.46% and 28.10% of its final NMR signal increment at 10 and 290 min, respectively, indicating slower early-stage signal development than in the other five cores.
Figure 6.
Evolution of NMR signals during spontaneous imbibition in six cores. (a) Temporal evolution of the total NMR signal amplitude; (b) Spontaneous-imbibition NMR signal fraction versus time.
At 4780 min, the NMR signal increments ranged from 970.45 to 13,456.96, and the spontaneous-imbibition NMR signal fractions ranged from 27.77% to 88.45%, indicating marked differences in the water-associated NMR response among the cores. Core 77 exhibited the largest signal increment, consistent with its highest gravimetrically measured water uptake. Core 33 attained an NMR signal fraction of 88.45%, showing that its imbibition-induced signal approached the fully water-saturated reference signal; its mass-based pore-space utilization was 91.04%. These two indicators both suggest relatively extensive water filling, although their values differ. Core 16 exhibited the lowest NMR signal fraction, indicating that its imbibition-induced signal remained well below its saturated reference. Core 51 showed the smallest signal increment and slow early-stage signal growth, which, together with its low imbibition height, indicates limited water invasion. Absolute signal increments and normalized signal fractions should also be distinguished: the former describe the magnitude of signal growth, whereas the latter account for differences in each core’s saturated reference signal.
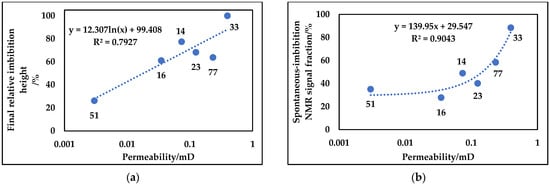
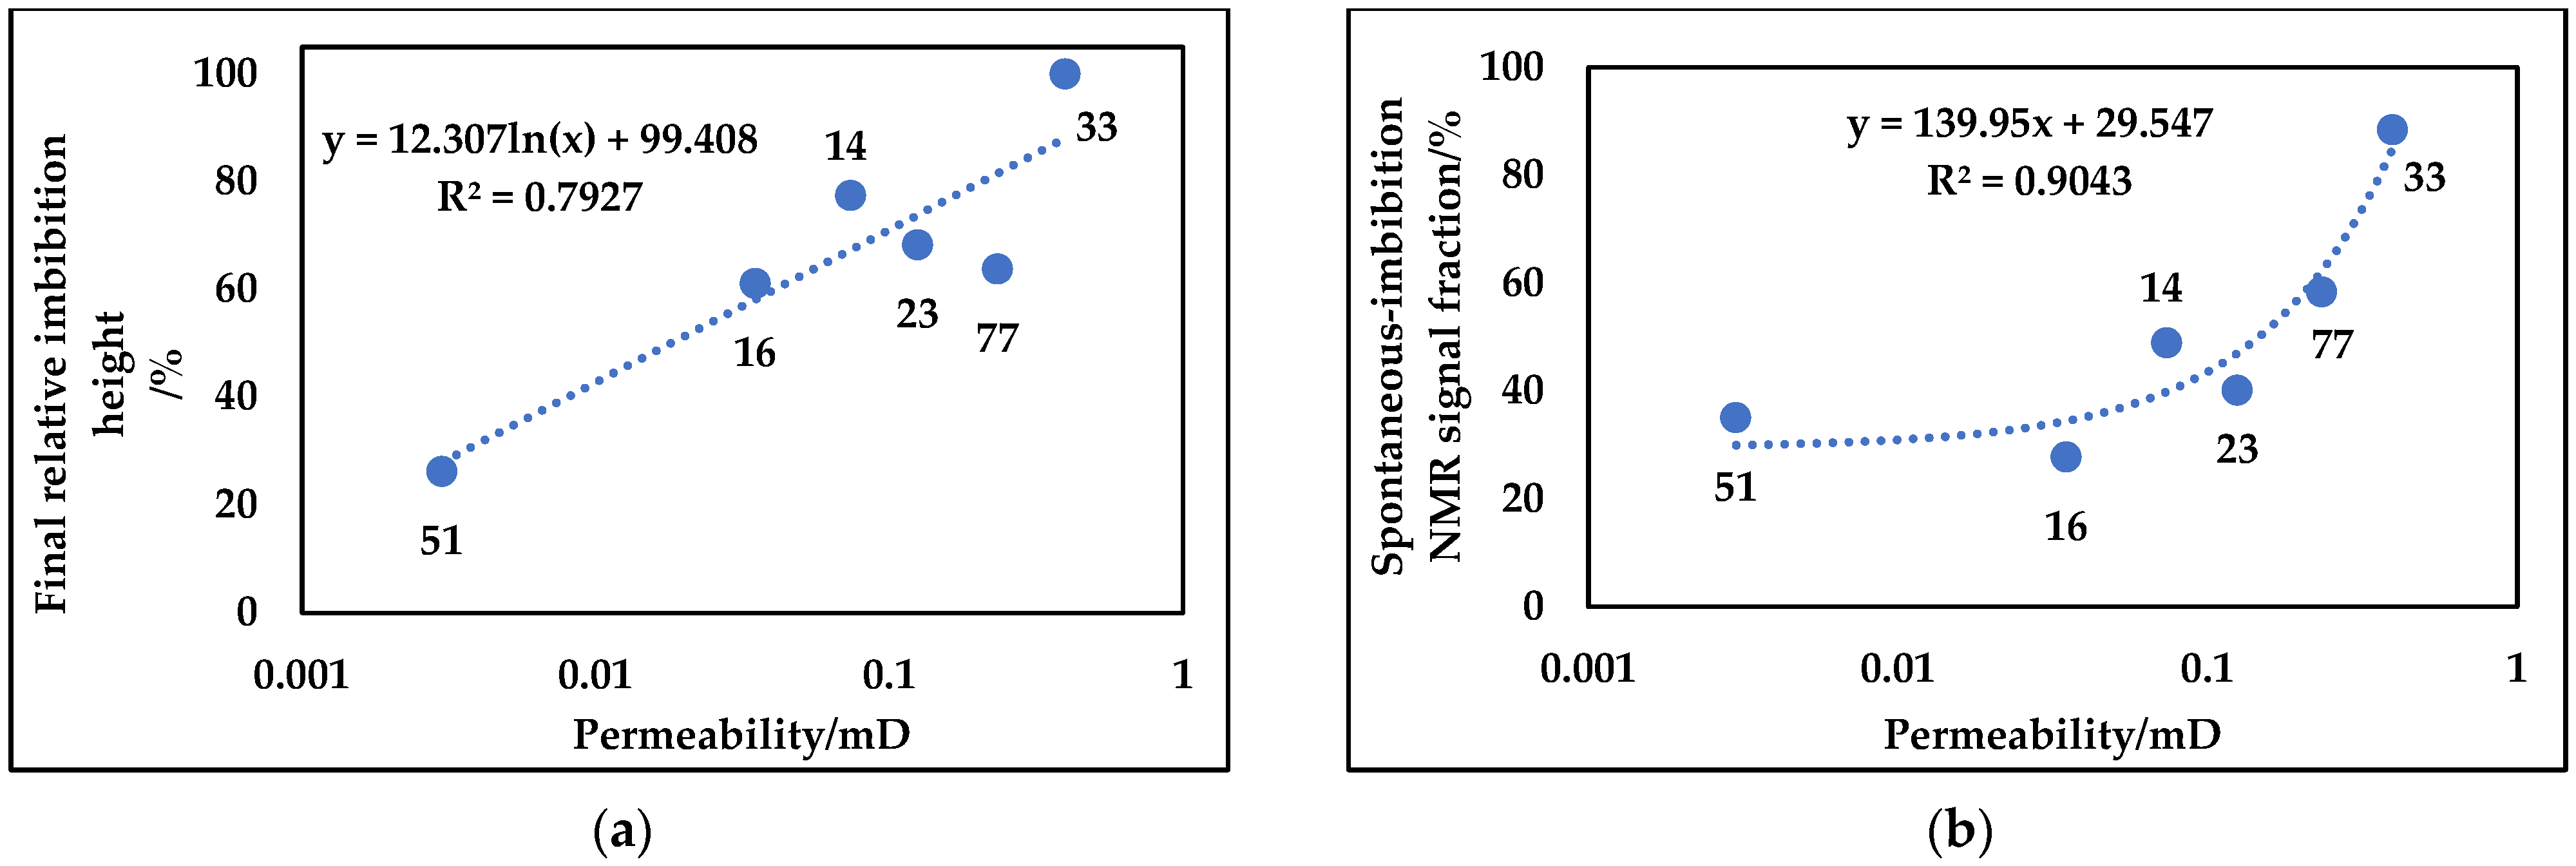
To examine the relationship between gas permeability and spontaneous imbibition, the final relative imbibition height and spontaneous-imbibition NMR signal fraction at 4780 min were compared with gas permeability, as shown in Figure 7. These indicators describe water-front advancement and the normalized water-associated NMR response, respectively.
Figure 7.
Relationships of gas permeability with final relative imbibition height and NMR signal fraction. (a) Relationship between permeability and final relative imbibition height; (b) Relationship between permeability and spontaneous-imbibition NMR signal fraction. Blue circles represent experimental data, and blue dotted lines indicate regression fits. Numbers beside the circles identify the core samples.
Among the six investigated cores, both the final relative imbibition height and the spontaneous-imbibition NMR signal fraction generally increased with gas permeability (Figure 7). Least-squares regression gave an R2 of 0.7927 for relative height against ln[k/(1 mD)] and an R2 of 0.9043 for NMR signal fraction against permeability. With both response variables expressed as percentages, the fitted slopes were 12.31 percentage points per unit increase in ln[k/(1 mD)] and 139.95 percentage points per mD, respectively. Assuming independent, normally distributed residuals with constant variance, their 95% confidence intervals were 3.57–21.05 and 76.73–203.16, respectively, using a t distribution with four degrees of freedom.
The positive slopes describe the observed association within this sample set, while the broad intervals indicate uncertainty in its magnitude. When each core was omitted in turn and the regressions were refitted, R2 ranged from 0.408 to 0.941 for relative height and from 0.682 to 0.948 for NMR signal fraction. The height relationship was particularly sensitive to Core 51, whereas the NMR relationship was particularly sensitive to Core 33. Core 51 exhibited limited front advancement, while the front in Core 33 reached the core top and its NMR signal fraction attained 88.45%. These contrasts are consistent with differences in water-accessible flow pathways, but permeability, pore geometry, connectivity, and wettability were not varied independently. Their individual contributions therefore remain unresolved by these correlations.
4.3. Water-Phase Invasion Across Different Equivalent Pore–Throat Size Ranges
High-pressure mercury intrusion porosimetry and NMR provide complementary information on the pore structure of tight sandstones. Previous studies have examined the application of NMR T2 spectra to pore-size characterization and the integration of NMR with mercury intrusion measurements [21,22]. In this study, cumulative-frequency matching was used to establish an empirical relationship between T2 and the HPMI-derived pore–throat radius, providing an equivalent size scale for analyzing the NMR spectra. In this section, “equivalent pore–throat size” refers to the size scale assigned to the NMR T2 spectrum through cumulative-frequency matching with the HPMI-derived pore–throat radius distribution. The terms “small”, “medium”, and “large” therefore denote calibrated size ranges used to compare the NMR signal changes during imbibition, rather than separately identified pore bodies or throats.
Under the fast-diffusion regime, when transverse relaxation is dominated by surface relaxation, the transverse relaxation time (T2) is related to the pore surface area and pore volume as follows:
where ρ2 is the transverse surface relaxivity, S is the fluid-contacting pore surface area, and V is the corresponding fluid volume. Under the assumptions underlying Equation (4), T2 reflects the surface-to-volume ratio of the fluid-occupied pore space and also depends on surface relaxivity. HPMI, by contrast, assigns an entry radius from the pressure required for mercury to access the connected pore space. A large pore body accessed through a narrow throat can therefore contribute to the intrusion volume assigned to that throat-entry radius. The two measurements provide related but distinct structural information. Variations in surface relaxivity and pore shielding further affect their correspondence [23]. A power-law function was consequently used as an empirical mapping between T2 and equivalent mercury-entry radius:
where rc is the equivalent mercury-entry radius in μm, T2 is expressed in ms, C is the empirical conversion coefficient with units of μm·ms−1/n, and n is dimensionless.
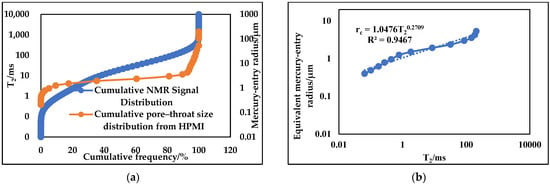
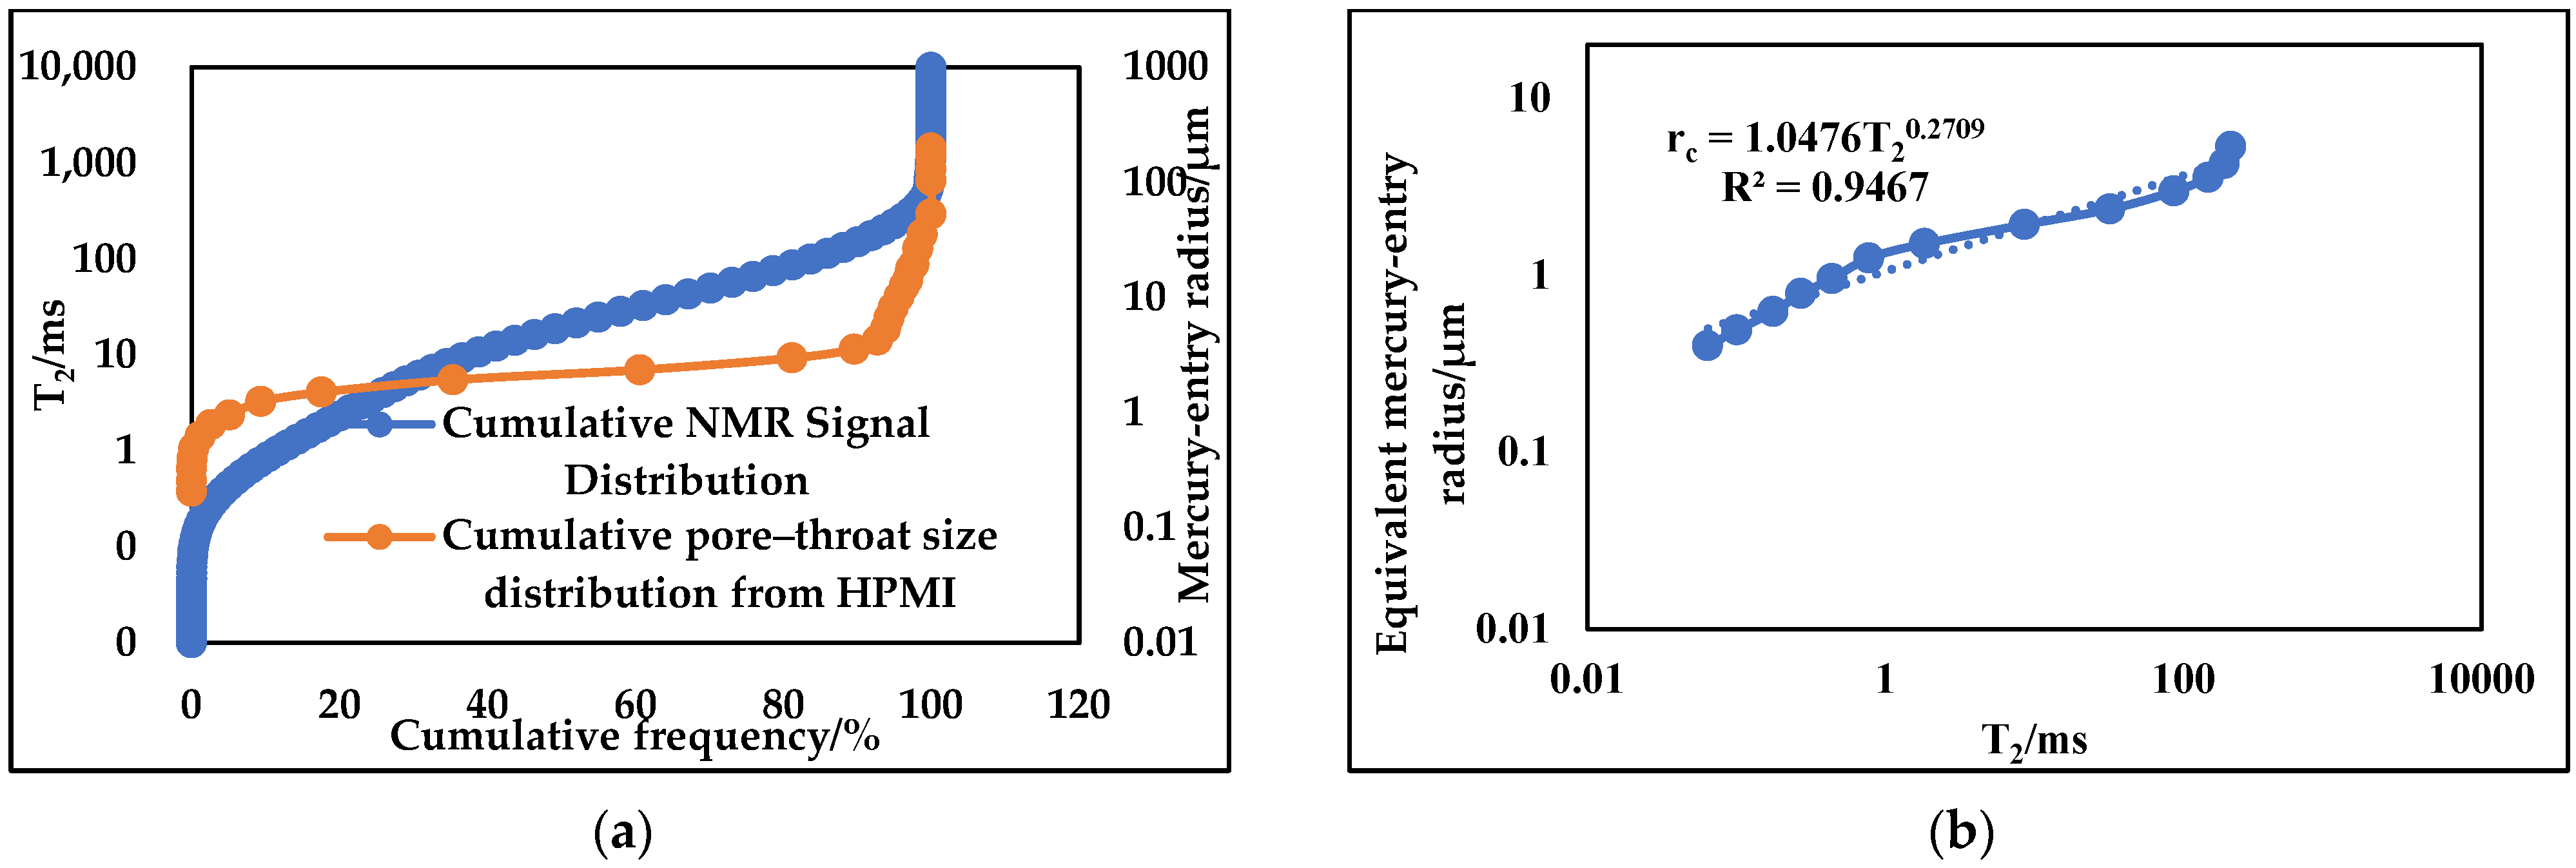
For Core 23, the cumulative distributions of mercury-entry radius and NMR transverse relaxation time T2 were constructed from the corresponding measurements. Values at equal cumulative frequencies were paired and fitted using a power-law function to establish an empirical equivalent-size relationship for this core:
The fitted relationship yielded an R2 of 0.9467, describing the empirical correspondence between T2 and equivalent pore–throat radius for Core 23. The fitted parameters were C = 1.0476 and n = 3.6914. The cumulative distributions obtained from high-pressure mercury intrusion and NMR measurements and the corresponding pore–throat size fitting results are shown in Figure 8a and Figure 8b, respectively. This relationship was used to define the equivalent size ranges for the NMR analysis of Core 23. Its coefficients were not treated as universal conversion parameters for the other cores, because the correspondence between relaxation time and mercury-entry radius depends on the pore structure and surface relaxation characteristics of the sample.
Figure 8.
HPMI–NMR equivalent-size calibration for Core 23. (a) Cumulative distributions of mercury-entry radius and T2; (b) Empirical relationship between T2 and equivalent mercury-entry radius.
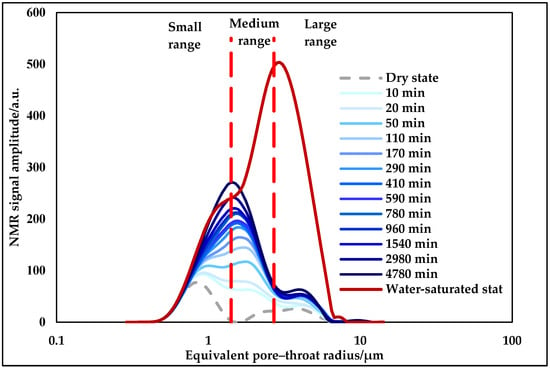
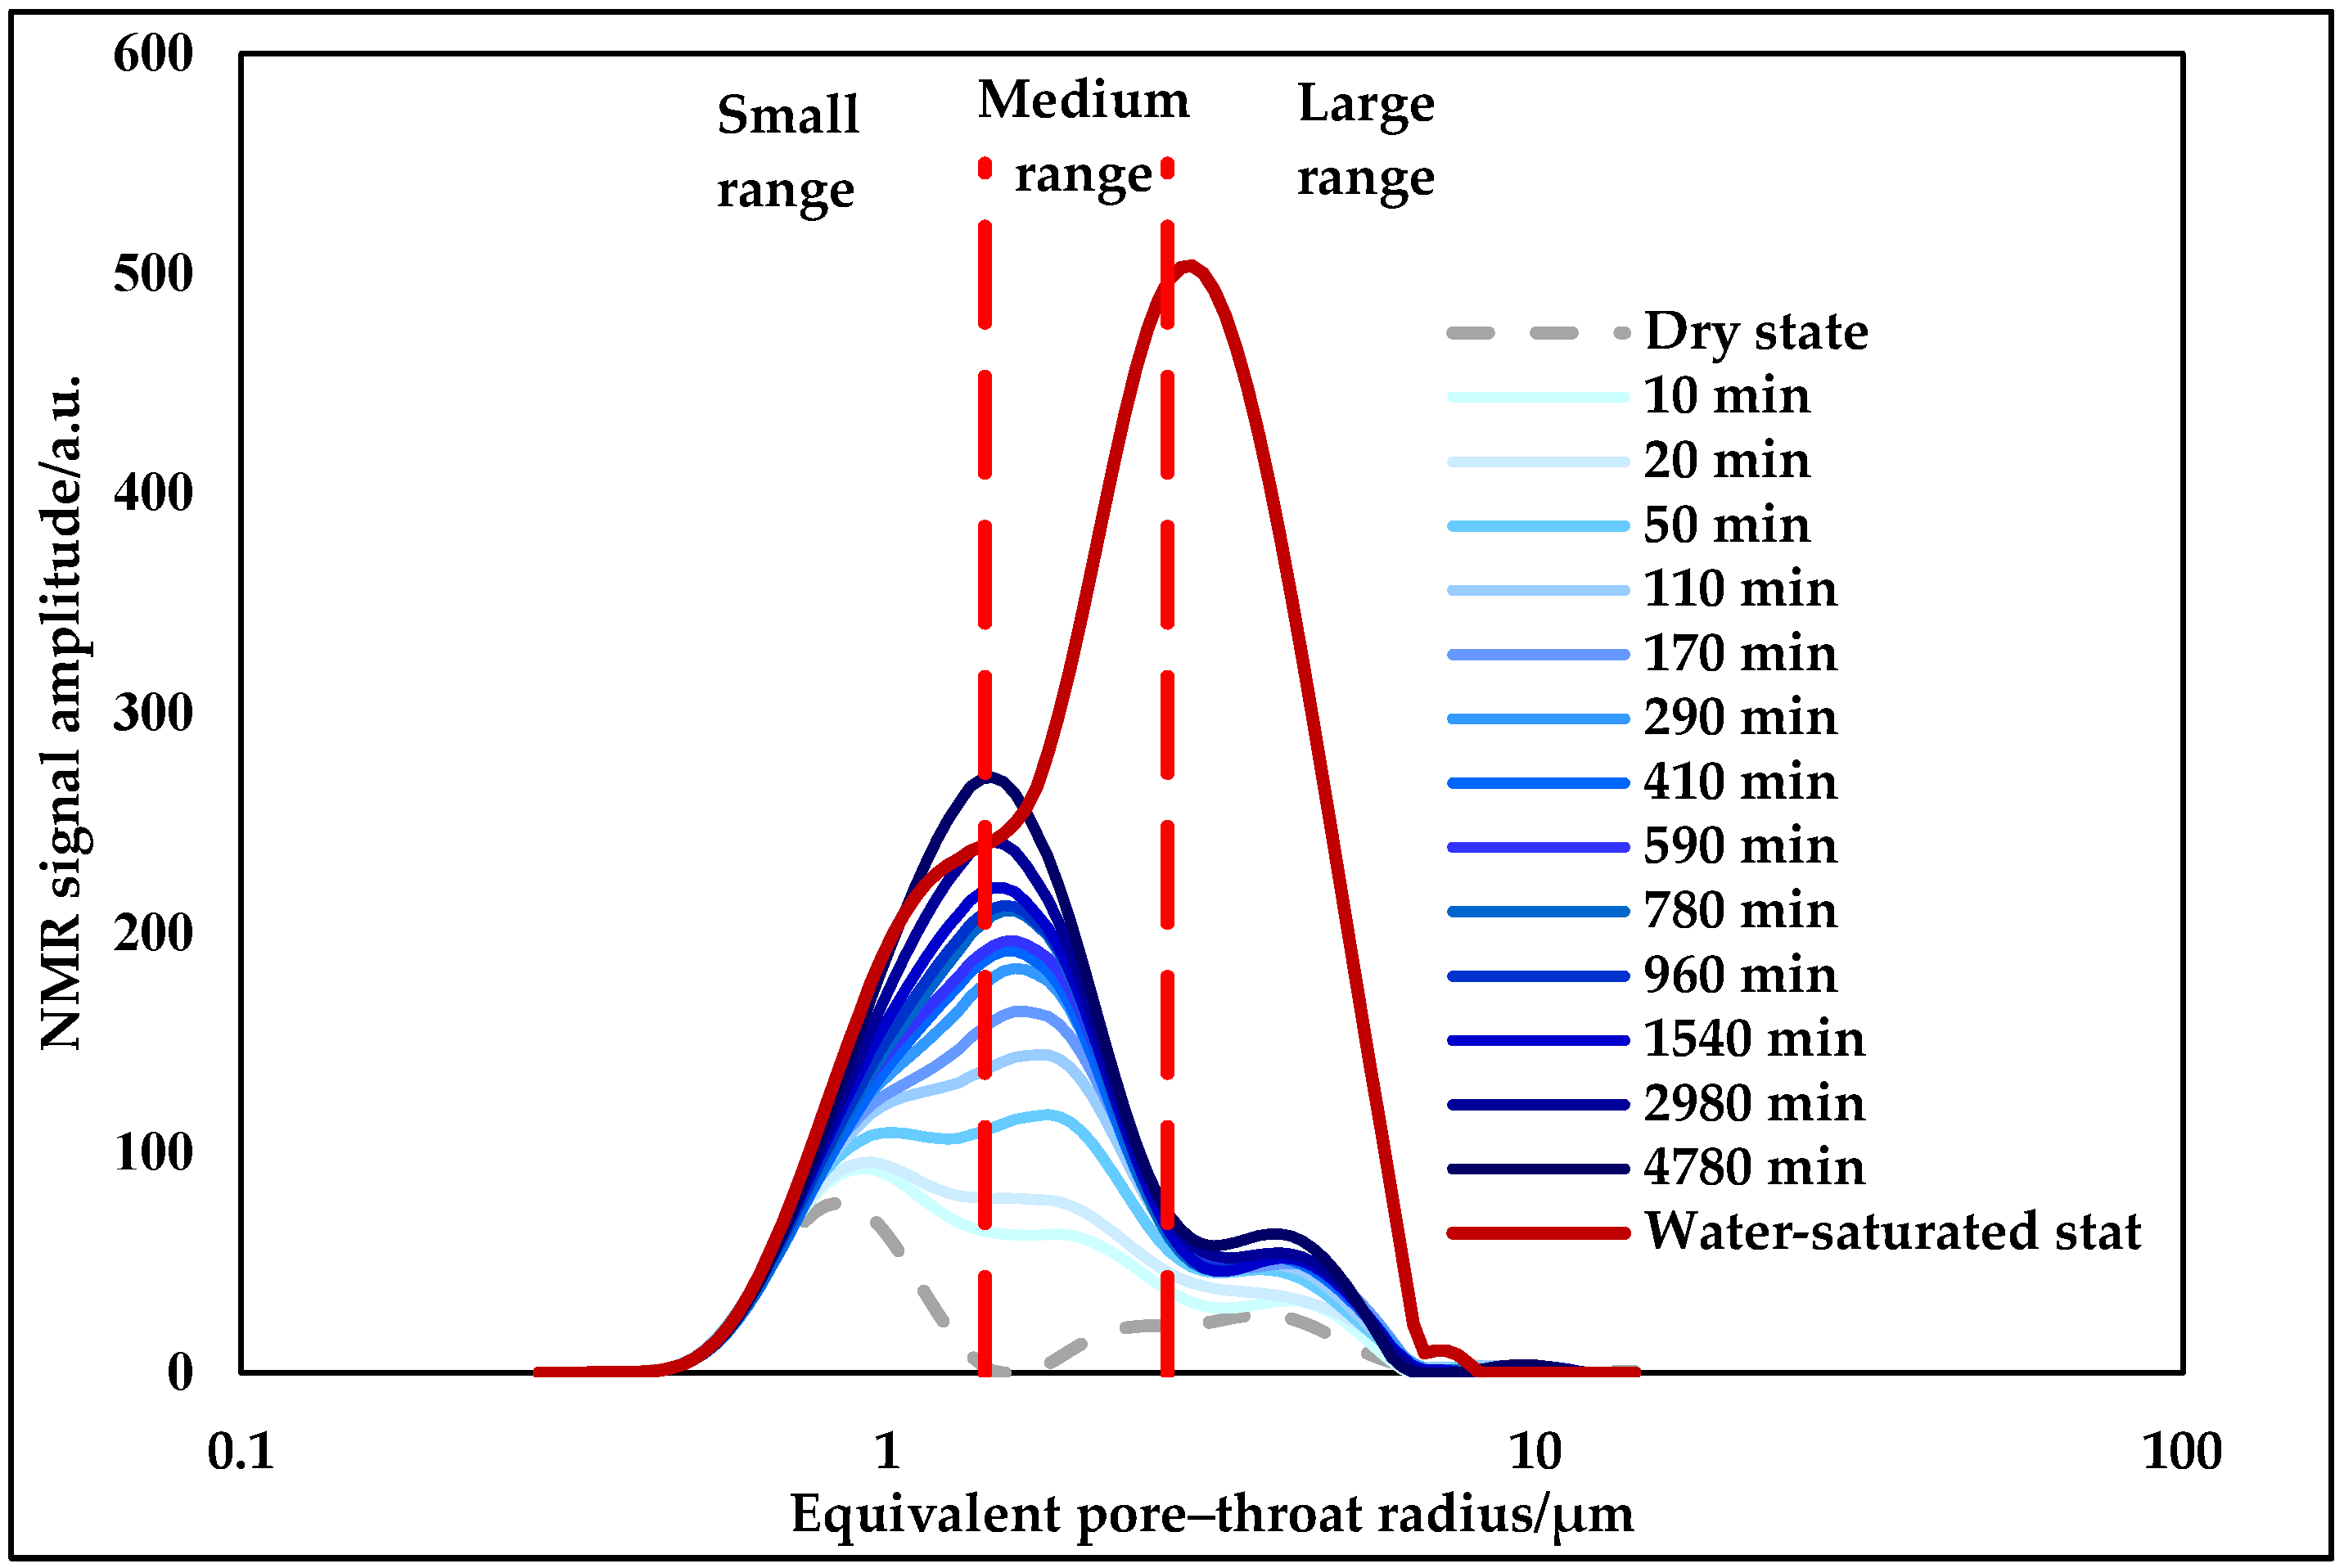
Using the calibrated relationship between T2 and equivalent pore–throat radius, the NMR T2 spectrum of Core 23 was divided into three size ranges. With reference to previously reported pore–throat size classification methods for sandstone reservoirs in the Sichuan Basin, T2 values of 3 and 33 ms were selected as the boundaries between different pore–throat size ranges [24,25]. Substitution of these values into Equation (6) yielded corresponding pore–throat radii of 1.41 and 2.70 μm, respectively. Accordingly, the calibrated size ranges were designated as small (r < 1.41 μm), medium (1.41 μm ≤ r ≤ 2.70 μm), and large (r > 2.70 μm), as shown in Figure 9. This classification was used for the analysis of Core 23. The size boundaries established from the saturated reference spectrum were held fixed when evaluating the imbibition spectra. This comparison assumes that changes in relaxation behavior do not substantially redistribute the signal among the selected T2 ranges. Because fluid configuration and the wetted surface-to-volume ratio can change during partial filling, the resulting increments are interpreted as water-associated signal development within fixed equivalent size ranges, rather than direct measurements of the invasion sequence of individual throats.
Figure 9.
Equivalent size ranges used to analyze the NMR spectra of Core 23.
Following calibration, the NMR signal changes during imbibition were evaluated within each equivalent pore–throat size range. The signal increment relative to the dry state was normalized by the corresponding signal difference between the fully water-saturated and dry states:
where Ei(t) is the normalized NMR signal increment in equivalent pore–throat size range i at time t, expressed as a percentage; Ai(t) is the NMR signal amplitude in that range at time t; and Ai,dry and Ai, sat are the corresponding signal amplitudes in the dry and fully water-saturated states, respectively. The subscripts s, m, and l denote the small, medium, and large equivalent size ranges, respectively.
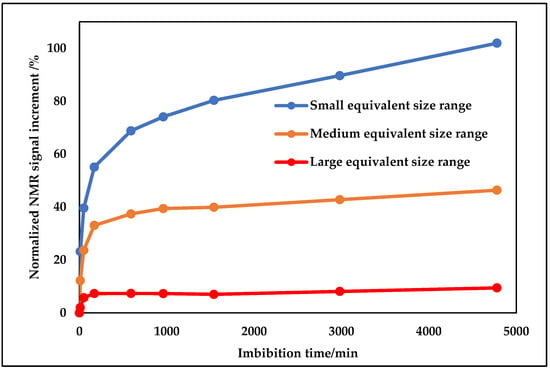
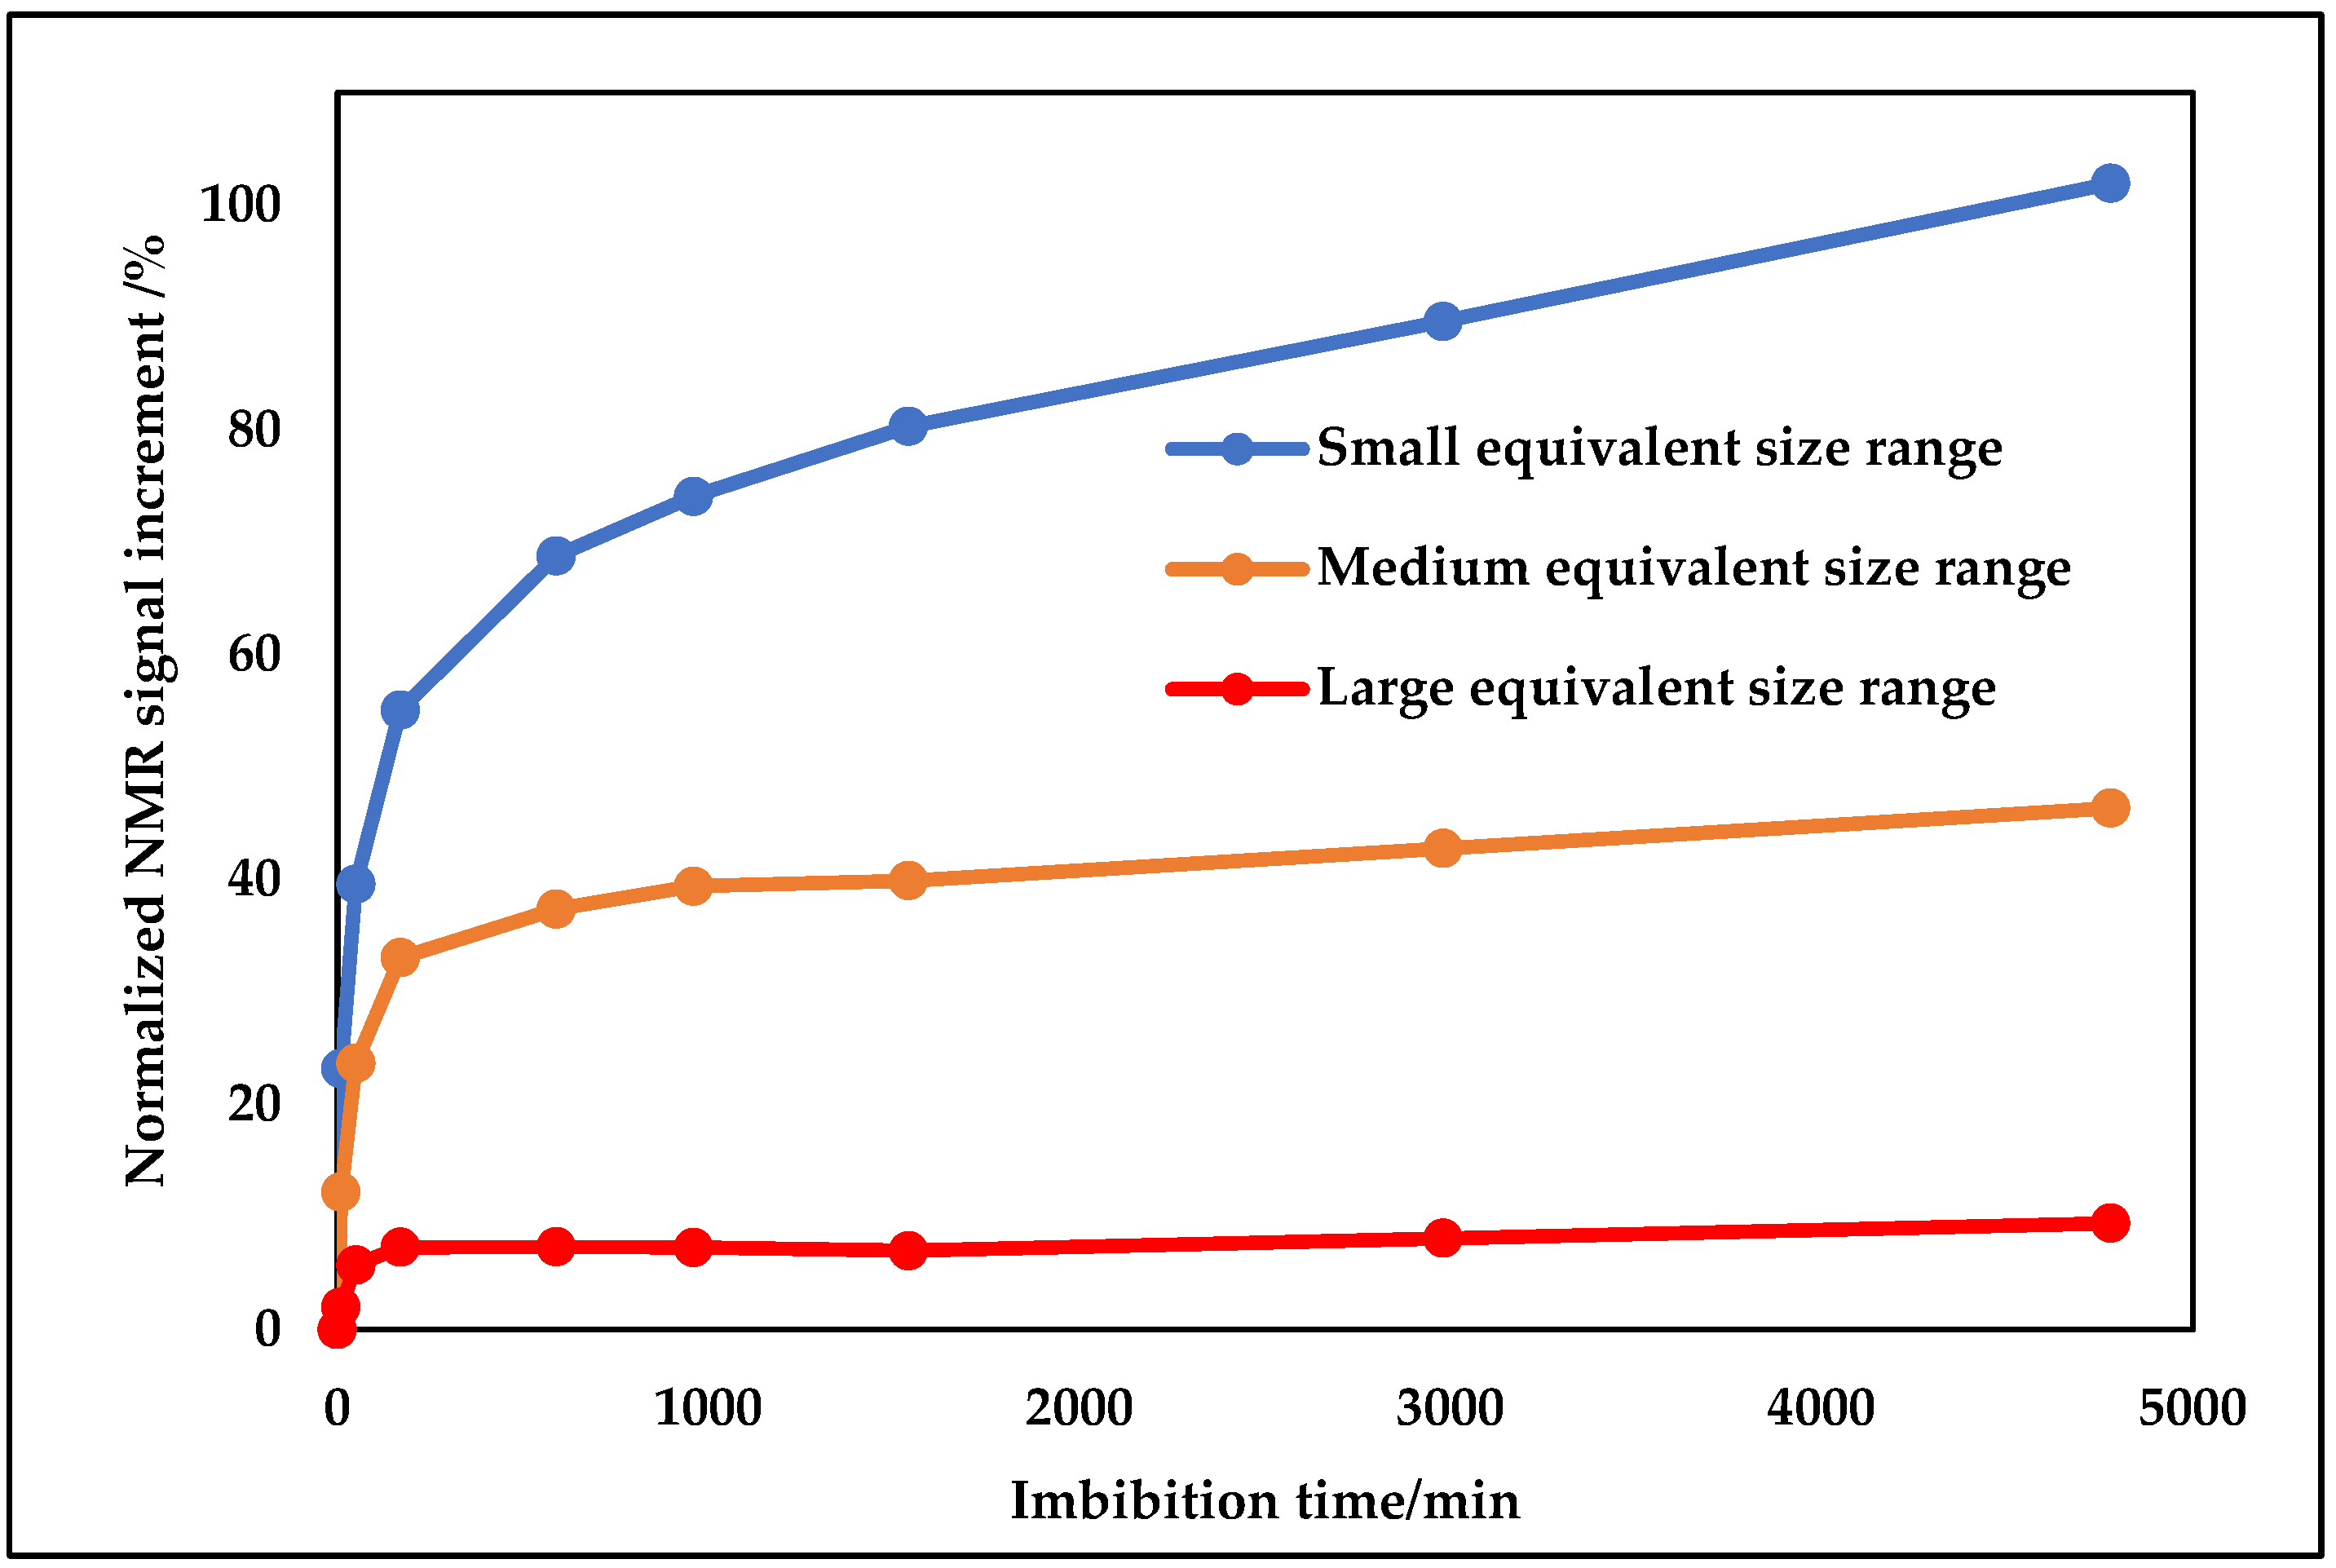
The NMR T2 spectra were divided into the calibrated equivalent size ranges, and the normalized signal increments were calculated using Equation (7), as shown in Figure 10. At 10 min, the normalized increments in the small, medium, and large ranges were 23.23%, 12.23%, and 2.01%, respectively, corresponding to dry-baseline-corrected signal increments of 545.52, 772.48, and 120.91 a.u. The small range therefore approached its saturated reference more rapidly, although the medium range exhibited the largest absolute signal increase at this early time.
Figure 10.
Normalized NMR signal increments in the equivalent size ranges of Core 23.
At 4780 min, the signal increments in the small, medium, and large ranges reached 2393.25, 2930.48, and 570.32 a.u., respectively, compared with saturated reference increments of 2348.07, 6317.98, and 6014.31 a.u. The corresponding normalized values were 101.92%, 46.38%, and 9.48%. The small-range signal was thus close to its saturated reference, whereas substantial differences remained in the medium and large ranges. In particular, the medium and large ranges had comparable reference increments, but the large range exhibited a much smaller signal increase during imbibition. These results indicate less extensive water-associated NMR signal development in the large equivalent size range under the experimental conditions.
5. Pore–Throat Structural Controls and a Kinetic Model for Spontaneous Imbibition
5.1. Kinetic Model for Spontaneous Imbibition
The pore–throat characterization results presented above show that the tight sandstones from Well Dongpo 1 in the Qingshen Block exhibit a wide pore–throat size distribution and pronounced heterogeneity. Because capillary pressure is closely related to pore–throat size, a single representative pore–throat radius cannot adequately characterize the actual capillary effects within a multiscale pore–throat system. Previous studies have extended the classical capillary-bundle model by incorporating parameters such as pore-size distribution, pore-space fractal characteristics, flow-path tortuosity, and pore geometry. These studies demonstrated that the multiscale nature of pore–throat structures significantly affects both the rate and equilibrium behavior of spontaneous imbibition [26,27]. Therefore, based on classical spontaneous imbibition theory, a pore–throat size-distribution parameter was introduced to provide a statistically equivalent representation of the capillary effects of pore–throats at different scales. A kinetic model was then formulated by combining a statistical representation of capillary effects with an empirical correction for additional influences on imbibition-front advancement.
The pore space of the core was represented as a statistical pore–throat system composed of pore–throats of different sizes. According to the Young–Laplace equation, the capillary pressure generated by an individual pore–throat is inversely proportional to its radius. For tight sandstones with a continuous pore–throat size distribution, the first negative moment of the pore–throat radius distribution was introduced to integrate the contributions of pore–throats of different sizes to capillary action. Accordingly, the multiscale pore–throat capillary-structure parameter was defined as follows:
where Λ is the capillary-structure parameter, m−1; rj is the representative radius of size interval j, m; and ΔFj is the normalized intrusion-volume increment assigned to that interval, with the increments summing to unity. For the structure-based calculations, these quantities were obtained from the corresponding mercury-intrusion distributions. Because Λ weights the reciprocal radius, smaller radii contribute more strongly to this index. It provides a statistical reference for estimating capillary effects, rather than a direct measurement of the dynamic water–gas capillary pressure.
However, pore–throats in actual cores commonly exhibit tortuosity, constrictions and expansions, corner spaces, and variations in local connectivity. Dynamic pore-network studies have shown that main-meniscus advancement, corner-film flow, and flow partitioning among different pore–throats are jointly controlled by local pore–throat morphology and network connectivity [28]. Generalized capillary-flow models show that pore-size distribution, aperture shape, and flow-path tortuosity influence spontaneous imbibition [27]. Here, Λ provides a reference capillary-pressure estimate based on the measured distribution of mercury-entry radii. A dimensionless factor ξ is introduced to adjust this estimate to the effective driving pressure governing front advancement. Its interpretation is therefore tied to the adopted structural representation and contact-angle assumption. The classical Washburn model assumes constant capillary pressure and idealized capillaries and can adequately describe early-stage front advancement governed by capillary forces and viscous resistance. However, it remains limited in characterizing late-stage imbibition in complex porous media. Recent studies have divided capillary rise in porous media into an early classical regime and a long-term anomalous regime, demonstrating that late-stage front advancement may deviate from the classical square-root-of-time relationship because of changes in local saturation, capillary pressure, and permeability [29]. Using micro-CT imaging and micromodel experiments, Geistlinger et al. [30] found that pore-scale heterogeneity, surface roughness, and wettability jointly control interfacial displacement and capillary trapping during two-phase flow. Based on three-dimensional pore–throat models, Zheng et al. [31] further revealed interfacial reconfiguration, liquid-film evolution, and snap-off of the nonwetting phase controlled by pore–throat geometry. Dynamic pore-network simulations further show that capillary pressure and relative permeability during spontaneous imbibition can depart from their quasi-static relationships [13]. To represent the resulting departure from a constant-pressure capillary-bundle description, an additional pressure correction βH is included in the height-based model. This term gives a linear decrease in the net driving pressure with increasing height, with β expressed in Pa·m−1. The linear form is adopted as an empirical closure; the velocity-dependent viscous pressure drop remains represented separately by the Darcy term. Its contribution is evaluated by comparison with the otherwise identical formulation with β = 0. Under a one-dimensional sharp-front approximation, the invaded region is represented by an effective wetted column of height H. Taking porosity as the nominal storage coefficient, conservation of liquid volume gives q = φdH/dt, where q is the Darcy flux. This approximation represents front advancement without resolving the spatial variation in water saturation behind the front. With constant nominal permeability, Darcy’s law gives the viscous pressure drop across the wetted column as μqH/k, or φμH(dH/dt)/k.
The effective capillary driving pressure is balanced by the hydrostatic pressure difference ΔρgH, the viscous pressure drop, and the empirical pressure correction βH. Substituting the flux–front relationship into this pressure balance gives:
where β is the effective additional pressure-gradient coefficient, Pa·m−1; σ is the gas–water interfacial tension, N/m; θ is the contact angle, °; Δρ is the density difference between the imbibing water phase and the gas phase within the core pore space, kg/m3; g is the gravitational acceleration, m/s2; H is the imbibition height, m; φ is the core porosity, dimensionless; μ is the viscosity of the imbibing water phase, Pa·s; k is the core permeability, m2; and dH/dt is the advancement rate of the imbibition front, m/s. The effective capillary driving pressure is denoted by Peff = 2ξσcosθΛ and has units of Pa. The height–time response constrains this product rather than ξ, Λ, and cosθ separately. When Λ is specified and θ is prescribed, ξ can be calculated from the calibrated effective pressure; otherwise, Peff is retained as the calibration parameter. This equivalent parameterization leaves the governing equation unchanged. The factor ξ is a multiplicative correction to the reference capillary-pressure estimate and is not restricted to the interval from zero to unity. A value greater than unity indicates an upward adjustment of that estimate rather than direct evidence of enhanced pore-network connectivity. The coefficient β is likewise an effective pressure correction, rather than an independently measured viscous resistance.
All quantities in the governing equation are expressed in SI units. Since ξ and cosθ are dimensionless, σ has units of N m−1, and Λ has units of m−1, the effective capillary driving term has units of Pa. Both Δρg and β have units of Pa·m−1, so their products with H also have units of Pa. The viscous term φμH(dH/dt)/k likewise has units of Pa. Accordingly, Equation (9) is dimensionally consistent, Equation (10) gives a height in meters, and the integrated expression in Equation (11) gives time in seconds.
For constant parameters, the asymptotic equilibrium height predicted by the model is defined as follows. This quantity is distinct from the height measured at the end of a finite-duration experiment.
Using the equilibrium height He defined in Equation (10), Equation (9) can be rearranged as
Taking the onset of imbibition as t = 0 and H = 0 as the initial condition, separation of variables and integration give
The integral is evaluated by writing the integrand as
Integration between zero and H then gives the following implicit relationship between imbibition height and time:
Equation (11) is an exact implicit integral of Equation (9) under the stated initial condition, with the model parameters held constant. No approximation is introduced in this integration, and the imbibition height is obtained by numerical inversion at each specified time. To express the model in dimensionless form, the dimensionless height and time are defined as
Equation (11) then becomes
τ = −ln(1 − η) − η, 0 ≤ η < 1
The limiting behavior also clarifies how the height observations constrain the parameters. For fixed φ and k, the early-time coefficient depends on Peff, whereas the equilibrium height depends on Peff/(Δρg + β). The subsequent curvature of the height–time response therefore provides information on β beyond that available from the leading square-root relationship. When observations cover only the early stage, the two-parameter description is less strongly constrained. The final height of a finite-duration experiment is not assumed to equal the asymptotic equilibrium height.
For a positive effective capillary pressure and a positive combined pressure gradient, Equation (11) describes monotonic front advancement toward the equilibrium height. At early times, when H is much smaller than He, the leading term of the logarithmic expansion gives H2 ≈ 2k Peff t/(φμ), recovering the classical square-root-of-time dependence. As H approaches He, the advancement rate decreases toward zero, and the remaining height difference approaches zero exponentially. The full implicit expression is used throughout the calculations, so no transition time between the early and late regimes needs to be prescribed. These limiting behaviors describe the rapid initial rise and subsequent slowing predicted by the model. The formulation applies before the front reaches the upper boundary of the core; when He exceeds the core length, evolution after arrival at the core top lies outside the scope of the height-based description.
5.2. Model Calibration and Temporal Prediction Assessment
- (1)
- Structure-Based Calibration
Cores 16 and 23 were used to examine whether a shared parameter pair could describe two cores from the Xu 3 Member. For each core, Λ was calculated from its own mercury-intrusion distribution, yielding 1.0288 × 10⁶ m−1 for Core 16 and 4.5910 × 10⁵ m−1 for Core 23. These structural inputs were calculated directly from the respective mercury-intrusion distributions, independently of the NMR conversion in Equation (6). The measured porosity and permeability were held fixed. Water viscosity, gas–water interfacial tension, and the water–gas density difference were set to 0.001 Pa·s, 0.072 N/m, and 1000 kg/m3, respectively. A contact angle of 0° was used as a reference condition for parameter calibration. This choice does not establish complete water wettability for the investigated cores; the reported ξ values are conditional on the assumed contact angle. Imbibition height was calculated by numerical inversion of Equation (11).
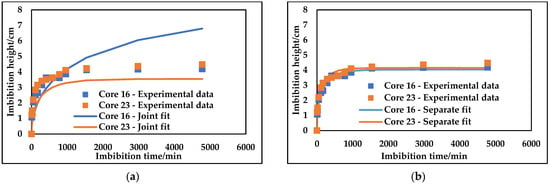
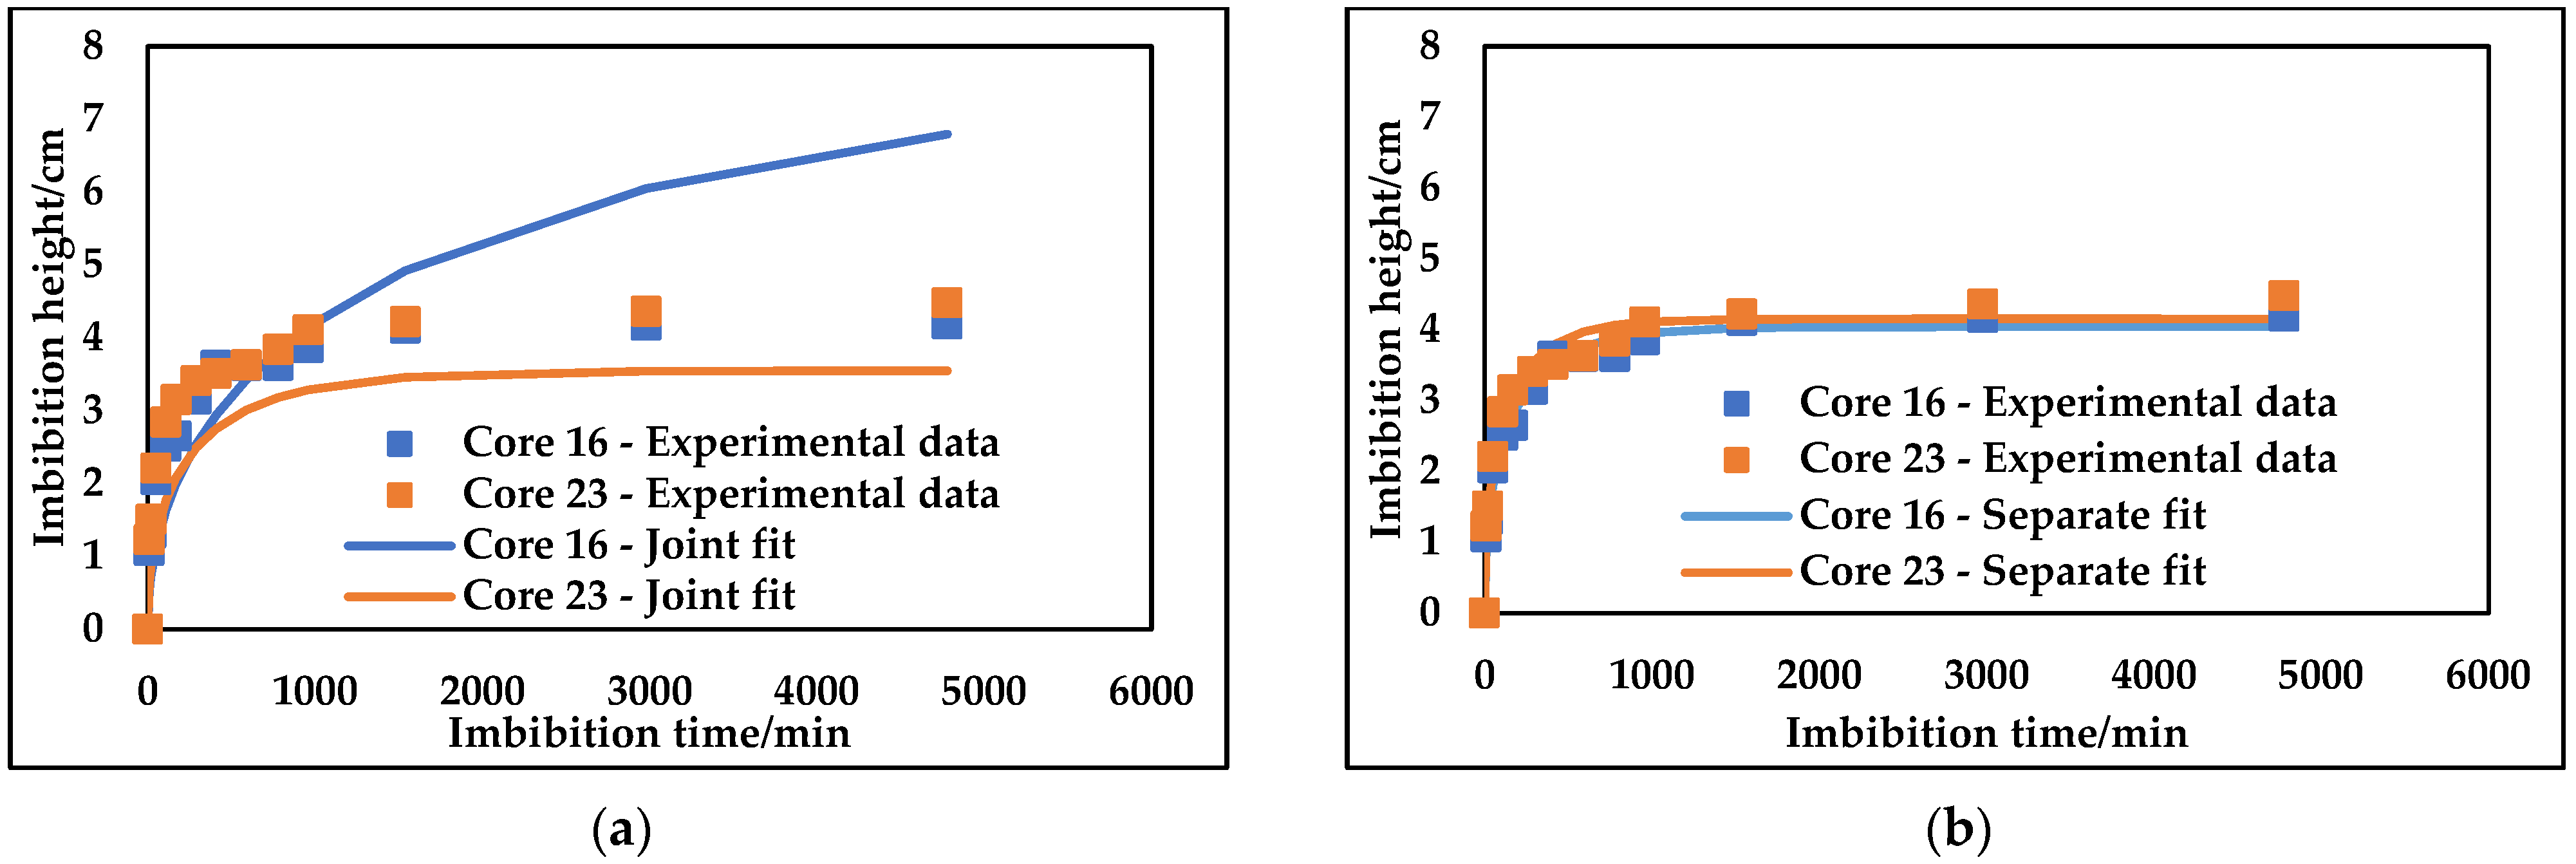
The shared-parameter fit yielded ξ = 0.2130 and β = 3.87 × 10⁵ Pa·m−1, with a pooled R2 of 0.14 and an RMSE of 0.95 cm. Separate calibration yielded ξ = 0.7160 and β = 2.61 × 10⁶ Pa·m−1 for Core 16, and ξ = 0.6102 and β = 9.62 × 10⁵ Pa·m−1 for Core 23. The corresponding R2 values were 0.98 and 0.96, with RMSE values of 0.15 and 0.20 cm, respectively. As shown in Figure 11, separate calibration better represented the two measured responses. The prescribed initial point H(0) = 0 was excluded from the error statistics. These results support core-specific calibration but do not establish a common parameter pair for the Xu 3 Member. The influence of the contact-angle assumption was examined for Cores 16 and 23 using illustrative angles of 0°, 30°, 45°, and 60°. With ξ, β, and Λ held constant, the capillary driving pressure decreases with cosθ, reducing the equilibrium height predicted by Equation (10). Increasing θ from 0° to 60° reduced the calculated equilibrium height from 4.04 to 2.02 cm for Core 16 and from 4.15 to 2.08 cm for Core 23.
Figure 11.
Joint and separate model calibration for Cores 16 and 23. (a) Joint fitting with shared parameters; (b) Separate fitting with core-specific parameters.
When the effective capillary driving pressure is instead constrained by the measured height–time response, the same model curves can be retained by scaling the correction factor as ξ(θ) = ξ(0)/cosθ, with β unchanged. At 60°, ξ becomes 1.4320 for Core 16 and 1.2205 for Core 23. Thus, the height data constrain the combined contribution of structural correction and wettability through ξcosθ. The calibrated ξ should therefore be interpreted together with the assumed contact angle, while the selected angles serve as sensitivity scenarios rather than measured wettability conditions.
- (2)
- Temporal Holdout Assessment and Baseline Comparison
Temporal prediction was examined for all six cores using the effective capillary driving pressure Peff and the coefficient β defined in Section 5.1. For each core, parameters were estimated from the nonzero height observations up to 590 min and then held fixed when calculating subsequent heights. The later observations did not enter the calibration objective. This retrospective temporal holdout assessment tests prediction beyond the calibration period, rather than parameter transfer to an entirely uncalibrated core.
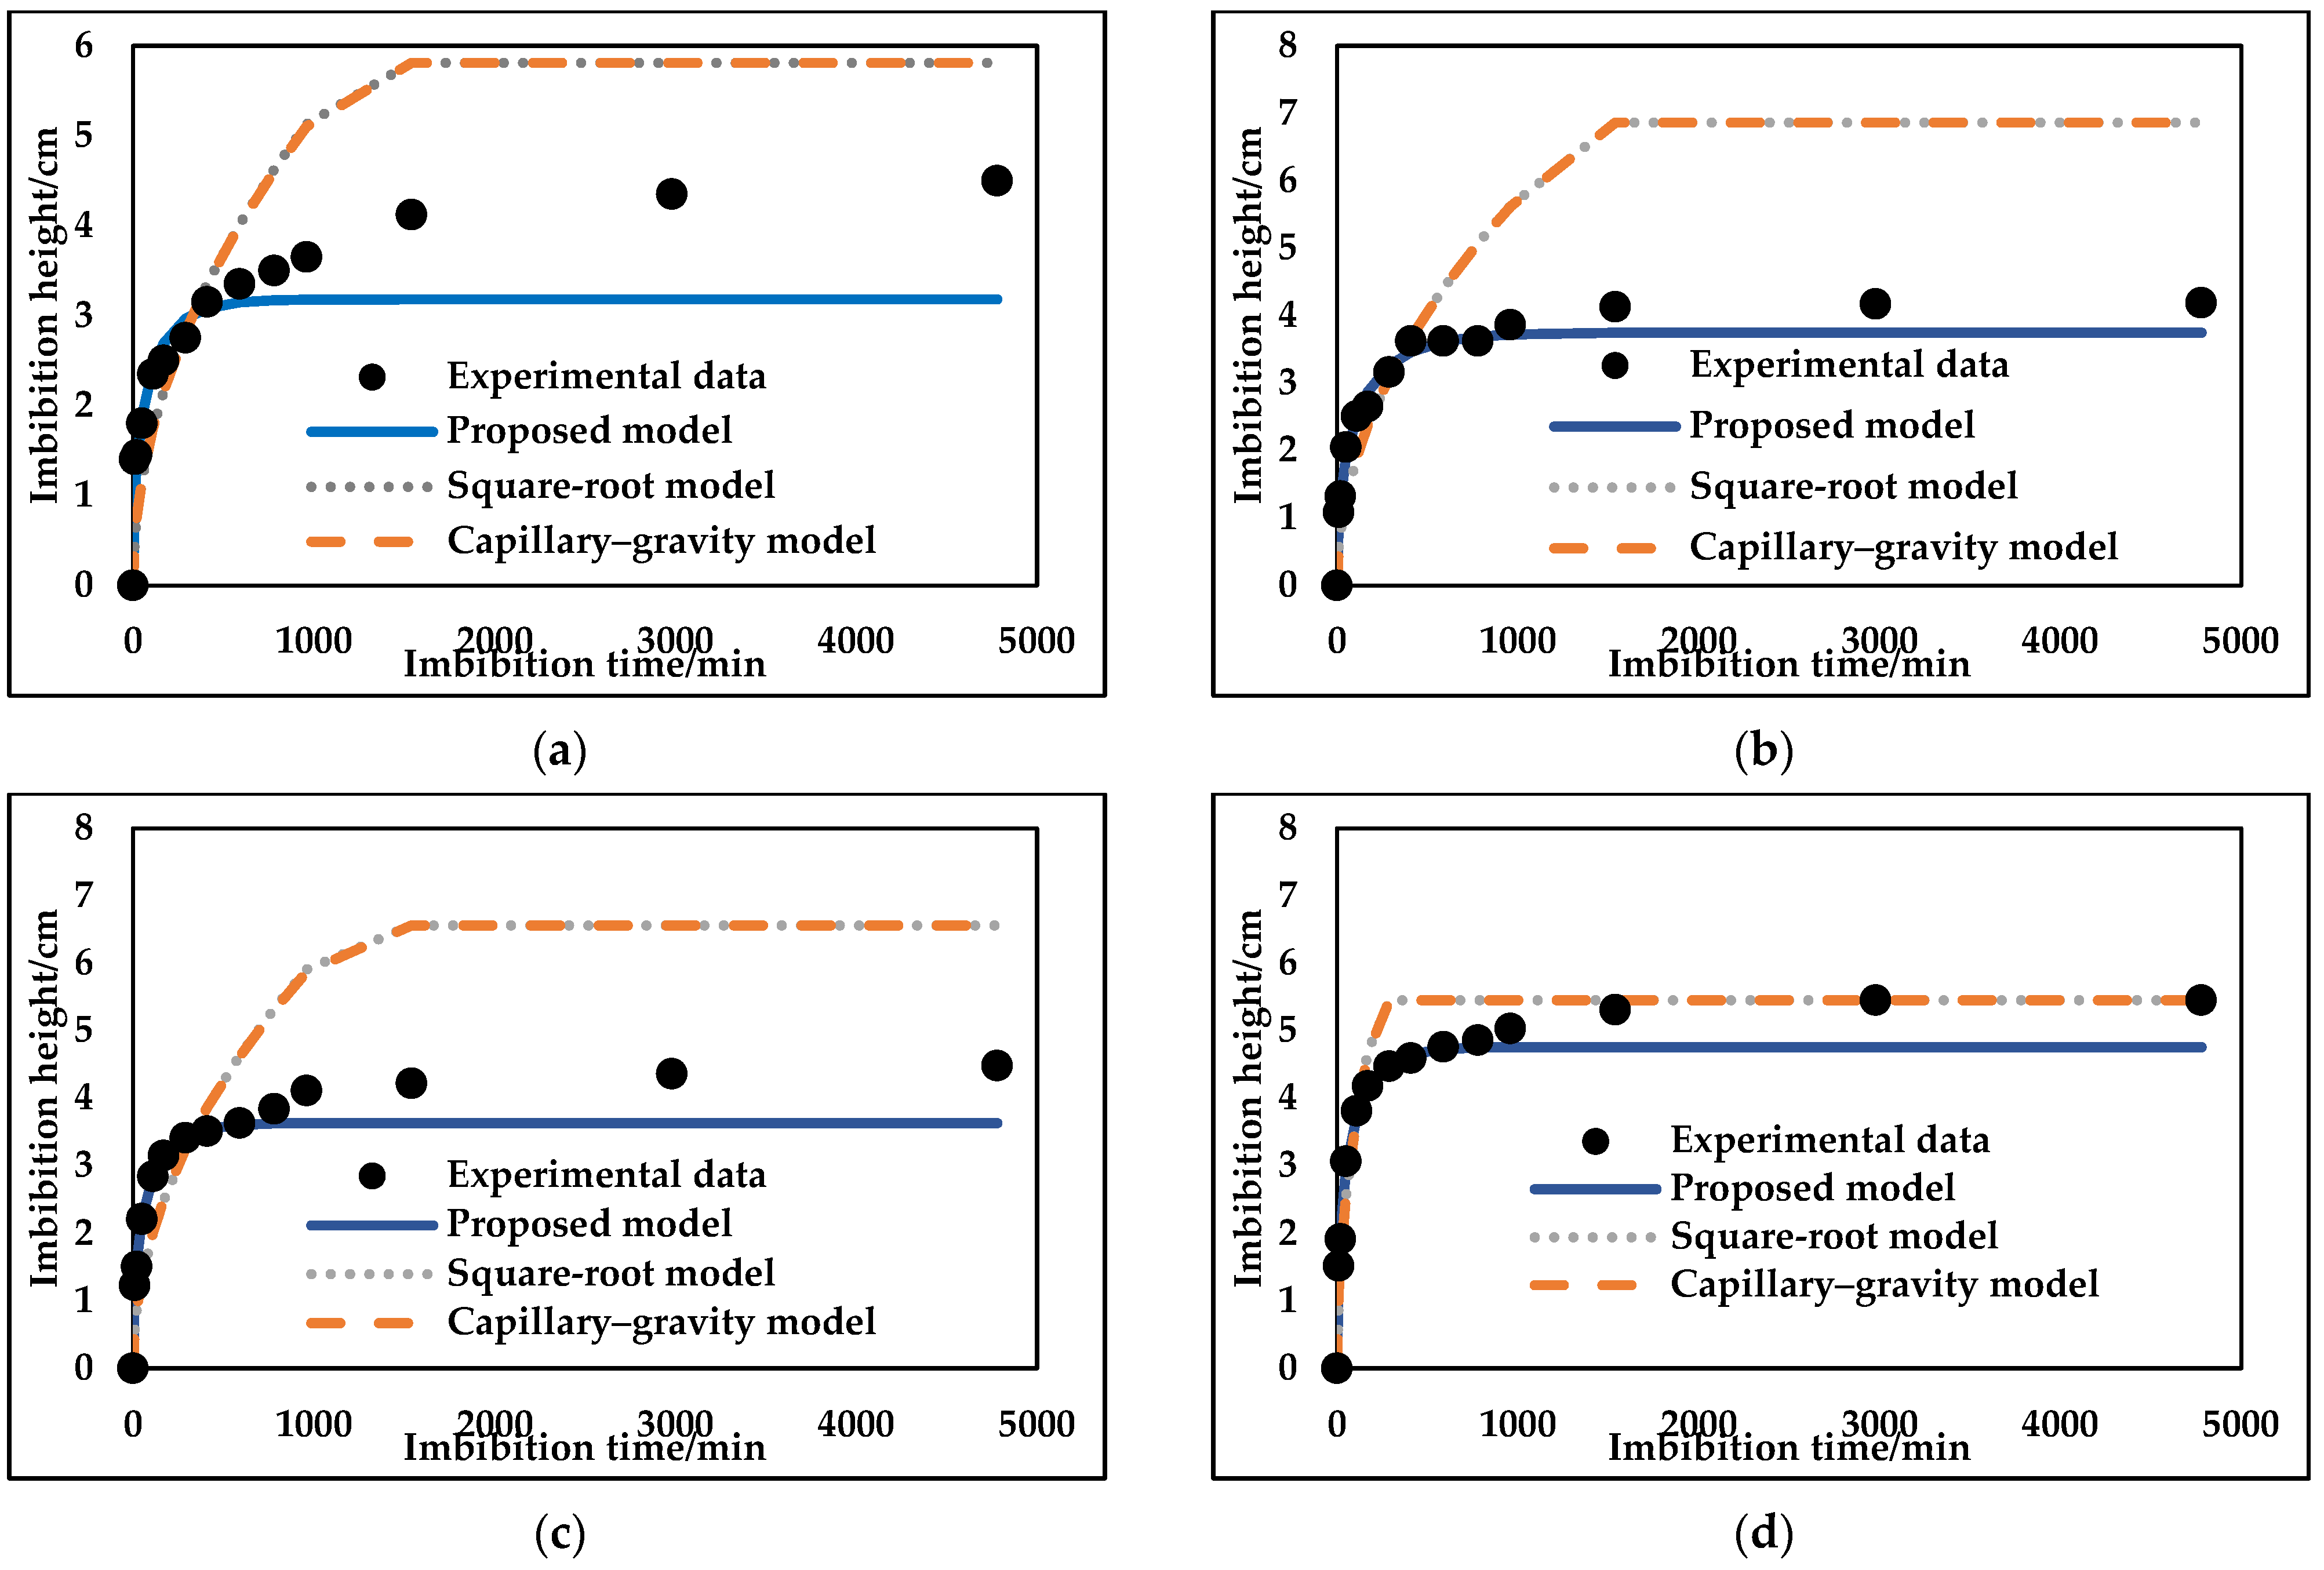
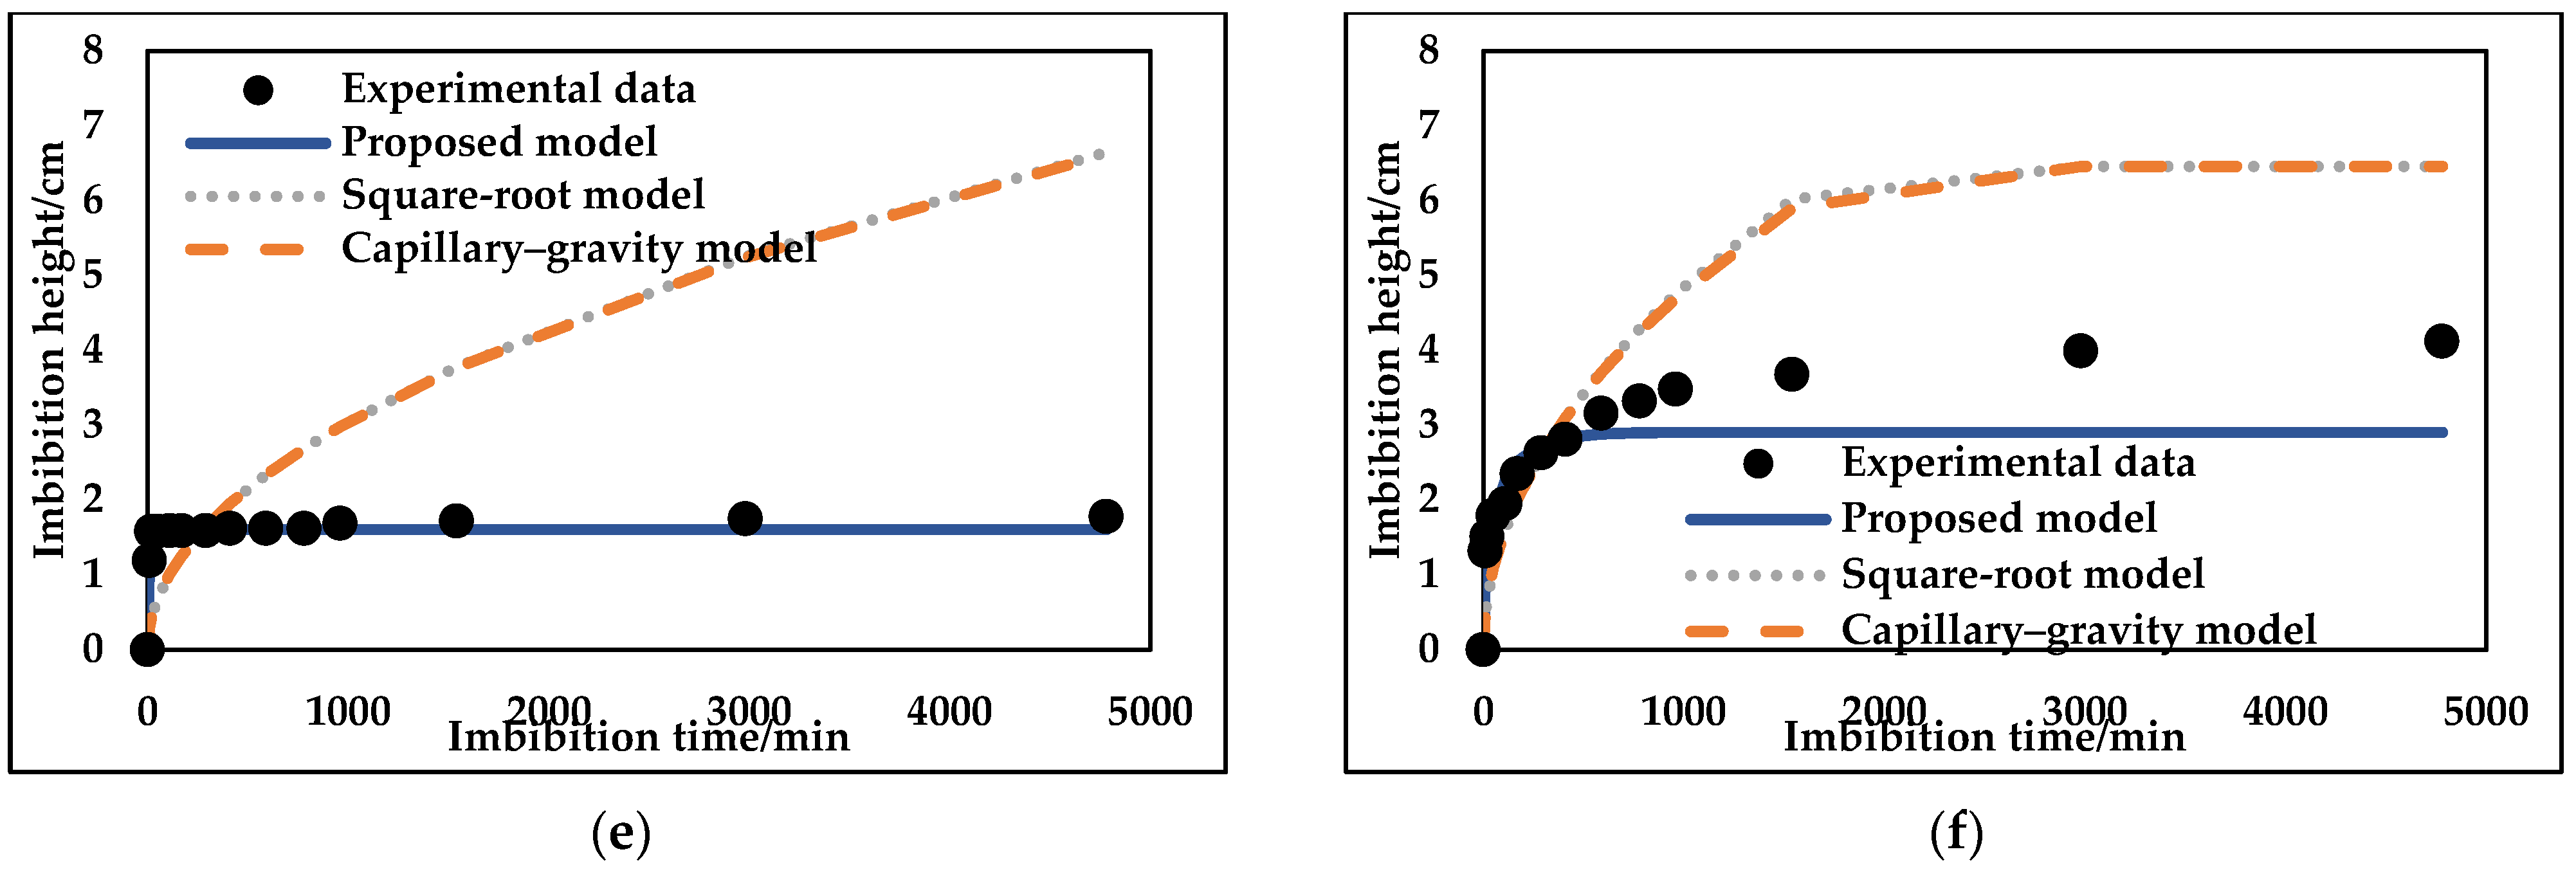
The proposed model was compared with the classical Lucas–Washburn square-root relationship, H = a√t, and the capillary–gravity formulation obtained by setting β = 0 in Equation (9). The coefficient a and the effective capillary pressure of the gravity model were estimated from the same calibration observations. All models used the same initial condition and core properties. To account for the finite observation domain, the observable height was limited to the core length during calibration and error evaluation. This boundary treatment does not represent the physical evolution after the front reaches the core top. For Core 33, the final two observations equaled its confirmed length of 5.45 cm and were retained as upper-boundary observations, separate from the pre-arrival height statistics.
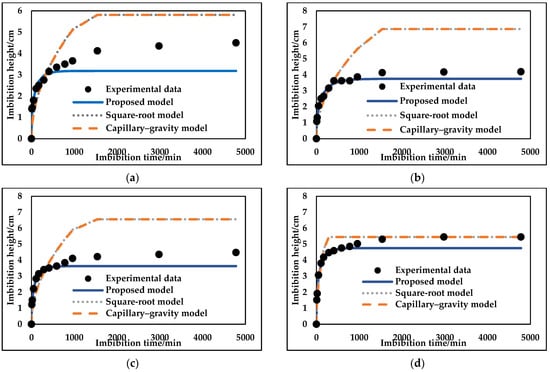
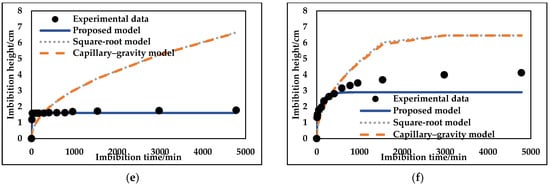
The holdout results are shown in Figure 12 and summarized in Table 2. The proposed model yielded RMSE values of 0.931, 0.333, 0.615, 0.365, 0.118, and 0.870 cm for Cores 14, 16, 23, 33, 51, and 77, respectively. These errors were lower than those of the two selected classical baselines for this split. Nevertheless, continued late-stage advancement was underestimated in several cores, particularly Cores 14 and 77. For Core 33, the early calibration gave an asymptotic height of approximately 4.75 cm, below the core length of 5.45 cm, and therefore failed to predict the observed arrival at the upper boundary. The prediction error varied among the cores. Normalizing the holdout RMSE by the final measured height in the evaluation period gave values of 7.9% and 13.7% for Cores 16 and 23, respectively, compared with 20.7% and 21.1% for Cores 14 and 77. The larger errors in Cores 14 and 77 coincided with continued late-stage height increases that were underestimated by the constant-parameter model. Thus, the formulation captured the overall slowing of front advancement, while the persistent late-stage growth was less well represented.
Figure 12.
Temporal holdout prediction of imbibition height for six cores. (a) Core 14; (b) Core 16; (c) Core 23; (d) Core 33; (e) Core 51; (f) Core 77.
Table 2.
Holdout prediction errors for the three imbibition models using observations up to 590 min for calibration.
Figure 12 compares the measured imbibition heights with calculations from the proposed model and the two baseline models for all six cores. Symbols represent experimental measurements, and lines show model calculations. For each core, parameters were calibrated using observations up to 590 min and held fixed when predicting subsequent heights.
The dependence on calibration duration was examined using additional cutoffs of 290 and 960 min. For Cores 14, 16, 23, 51, and 77, the proposed model retained lower holdout RMSE values than both baselines at all three cutoffs. Core 33 showed a different response: its holdout RMSE was 0.265 cm for the proposed model and 0.593 cm for both baselines with calibration up to 290 min, whereas the corresponding errors were 0.448 and 0.140 cm with calibration up to 960 min. The latter comparison contained only one pre-arrival holdout observation.
Parameter uncertainty was examined using the profile-likelihood approach of Raue et al. [32]. The analysis used He and B = Δρg + β, which provide an equivalent parameterization of the governing equation. At each fixed value of one parameter, the other was reoptimized against the complete pre-arrival height record. Under an independent Gaussian residual assumption with constant but unknown variance, the approximate 95% intervals for He were 3.88–4.21 cm for Core 16 and 3.95–4.37 cm for Core 23. The corresponding intervals for β were (2.11–3.26) × 106 Pa·m−1 and (0.72–1.31) × 106 Pa·m−1. These bounded intervals indicate that the observations constrain the effective parameter combinations within the adopted model.
For these two cores, Λ was obtained from their respective mercury-intrusion measurements, while ξ was calculated from the calibrated effective pressure under the prescribed contact angle. The contact-angle analysis illustrates the remaining dependence of ξ on wettability. Likewise, the use of fixed nominal permeability means that changes in effective wetting-phase mobility can influence the calibrated pressure parameters. The resulting values characterize the height response under the adopted model assumptions; their predictive value is assessed separately through the temporal holdout calculations.
The results therefore support a semi-empirical description of imbibition height, with the late-stage deviations defining the limits of its present predictive scope.
6. Conclusions
- (1)
- Micro-CT characterization of six tight sandstone specimens, together with HPMI measurements for Cores 16 and 23, revealed differences in pore geometry, connectivity, and mercury-entry size distributions. The results indicate a multiscale pore–throat system comprising relatively large pores connected through finer throats. The CT-derived connectivity describes the pore space resolved within the scanned volumes and should be interpreted within the limits of imaging resolution.
- (2)
- Spontaneous imbibition generally exhibited rapid early-stage front advancement followed by slower growth. Imbibition height, water uptake, and mass-based pore-space utilization did not vary proportionally among the investigated cores, indicating that front advancement and internal pore filling describe distinct aspects of imbibition. Final relative height and NMR signal fraction were positively associated with gas permeability within the six-core dataset, although the estimated relationships were sensitive to individual samples. The normalized NMR signal provided complementary information on water invasion and remained distinct from the mass-based measure.
- (3)
- HPMI–NMR cumulative-frequency matching established an empirical relationship between T2 and equivalent mercury-entry radius for Core 23. Within this calibration, the smaller equivalent size range exhibited a faster early increase and a higher final normalized NMR signal increment than the medium and large ranges. These observations indicate nonuniform water invasion across the calibrated size ranges, but do not independently resolve the respective roles of pore bodies and throats.
- (4)
- A kinetic model incorporating a pore–throat size-distribution parameter, a capillary-pressure correction factor, and an empirical height-dependent pressure correction was developed to describe imbibition-height evolution. With parameters calibrated using observations up to 590 min, the model yielded lower temporal holdout errors than the Lucas–Washburn and capillary–gravity baselines for all six cores. Additional calibration cutoffs generally preserved this advantage for five cores. Continued late-stage advancement was underestimated in several cores, and arrival at the top of Core 33 was not captured. These results support the model’s ability to describe the overall slowing of imbibition-front advancement in the investigated cores from Well Dongpo 1, while identifying limitations in its late-stage predictions.
Author Contributions
Conceptualization, H.H., Y.X. and Z.B.; methodology, H.H., Y.X., F.F. and S.G.; investigation, Y.X., F.F., S.D., P.S., S.G., S.S., K.J. and X.Z.; resources, Z.B., S.D., P.S., G.S., S.G., G.L. and X.Z.; formal analysis, H.H., Y.X., G.S., K.J. and Y.W.; data curation, Y.X., F.F., P.S., S.S., K.J. and Y.W.; visualization, Y.X., S.S. and Y.W.; writing—original draft preparation, H.H. and Y.X.; writing—review and editing, H.H., Z.B., F.F., S.D., G.S. and G.L.; supervision, Z.B.; project administration, Z.B., S.D., G.L. and X.Z. All authors have read and agreed to the published version of the manuscript.
Funding
This research was funded by the Oil & Gas Major Project (Grant No. 2025ZD1406800, Grant No. 2025ZD1404301); the Chongqing Municipal Education Commission Science and Technology Research Plan Project (KJQN202301537); the General Program of Chongqing Natural Science Foundation (CSTB2022NSCQ-MSX1423); the General Program of Chongqing Natural Science Foundation (CSTB2025NSCQ-GPX0934).
Data Availability Statement
The data supporting the findings of this study are available from the corresponding author upon reasonable request. The data are not publicly available due to confidentiality restrictions.
Conflicts of Interest
Authors Shouwei Deng, Peng Song, Guoxiang Sun, Shichao Guo, Shuo Song, Kexin Jia, Guodong Liu, and Xin Zhang were employed by the Exploration and Development Research Institute, PetroChina Jilin Oilfield Company. The remaining authors declare that the research was conducted in the absence of any commercial or financial relationships that could be construed as a potential conflict of interest.
References
- Pan, H.; Jiang, Y.; Zhu, X.; Deng, H.; Song, L.; Wang, Z.; Li, M.; Zhou, Y.; Feng, L.; Yuan, Y.; et al. Evaluation of geological sweet spots in fluvial tight sandstone gas: A case study of the first submember of the second member of the Jurassic Shaximiao Formation, central Sichuan Basin. Oil Gas Geol. 2024, 45, 471–485. [Google Scholar]
- Lin, Y.M.; Lei, W.; Miao, W.J. Practice of geology and engineering integration in deep tight gas development: A case study of the Xujiahe Formation in western Sichuan Basin. China Pet. Explor. 2024, 29, 21–30. [Google Scholar]
- Xiao, Y.; You, Z.; Du, Z.; He, Y.; Zheng, J.; Yuan, Y.; Wang, L. Review on spontaneous imbibition mechanisms in gas–water systems: Impacts on unconventional gas production and CO2 geo-sequestration. Gas Sci. Eng. 2024, 131, 205466. [Google Scholar] [CrossRef] [Scilit]
- Zhang, K.; Liu, X.F.; Wang, D.B.; Zheng, B.; Chen, T.H.; Wang, Q.; Bai, H.; Yao, E.D.; Zhou, F.J. A review of reservoir damage during hydraulic fracturing of deep and ultra-deep reservoirs. Pet. Sci. 2024, 21, 384–409. [Google Scholar] [CrossRef] [Scilit]
- Chang, B.; Tong, Q.; Cao, C.; Zhang, Y. Effect of pore-throat structure on movable fluid and gas–water seepage in tight sandstone from the southeastern Ordos Basin, China. Sci. Rep. 2025, 15, 7714. [Google Scholar] [CrossRef] [Scilit] [PubMed]
- Yang, C.; Yang, E. Mineral composition and pore structure on spontaneous imbibition in tight sandstone reservoirs. Sci. Rep. 2025, 15, 7504. [Google Scholar] [CrossRef] [Scilit] [PubMed]
- Wang, M.; Wang, R.; Yuan, S.; Zhou, F. A pore-scale study on the dynamics of spontaneous imbibition for heterogeneous sandstone gas reservoirs. Front. Energy Res. 2023, 11, 1135903. [Google Scholar] [CrossRef] [Scilit]
- Ren, W.; Ma, C.; Huang, X.; Gu, W.; Chen, Y.; Liu, X. Dynamic and static imbibition characteristics of tight sandstone based on NMR. Geoenergy Sci. Eng. 2023, 229, 212052. [Google Scholar] [CrossRef] [Scilit]
- Jiang, Z.; Li, G.; Zhao, P.; Zhou, Y.; Mao, Z.; Liu, Z. Study on spontaneous imbibition and displacement characteristics of mixed-wet tight sandstone reservoir based on high-precision balance and NMR method. Fuel 2023, 345, 128247. [Google Scholar] [CrossRef] [Scilit]
- Tang, H.; Di, K.; Zhang, L.; Guo, J.; Zhang, T.; Tian, Y.; Zhao, Y. Tight oil imbibition based on nuclear magnetic resonance signal calibration method. Pet. Reserv. Eval. Dev. 2024, 14, 402–413. [Google Scholar] [CrossRef]
- Zhang, Q.; Yang, Y.; Wang, D.; Sun, H.; Zhong, J.; Yao, J.; Lisitsa, V. Correlations of residual oil distribution with pore structure during the water flooding process in sandstone reservoirs. Adv. Geo-Energy Res. 2024, 12, 113–126. [Google Scholar] [CrossRef] [Scilit]
- Cai, J.; Jin, T.; Kou, J.; Zou, S.; Xiao, J.; Meng, Q. Lucas–Washburn equation-based modeling of capillary-driven flow in porous systems. Langmuir 2021, 37, 1623–1636. [Google Scholar] [CrossRef] [Scilit] [PubMed]
- Qin, C.Z.; Wang, X.; Hefny, M.; Zhao, J.; Chen, S.; Guo, B. Wetting dynamics of spontaneous imbibition in porous media: From pore scale to Darcy scale. Geophys. Res. Lett. 2022, 49, e2021GL097269. [Google Scholar] [CrossRef] [Scilit]
- Malenica, L.; Zhang, Z.; Angst, U. Towards improved understanding of spontaneous imbibition into dry porous media using pore-scale direct numerical simulations. Adv. Water Resour. 2024, 194, 104840. [Google Scholar] [CrossRef] [Scilit]
- Wang, X.; Qin, C.; Guo, B.; Pop, S.; Tian, J. Experimental validation of an image-based dynamic pore-network model for spontaneous imbibition in sandstones. Adv. Water Resour. 2025, 195, 104859. [Google Scholar] [CrossRef] [Scilit]
- Yang, C.L.; Su, N.; Rui, Y.R.; Zheng, Y.; Wang, X.B.; Zhang, Y.Q.; Jin, H. Gas accumulation conditions and exploration potential of tight gas reservoir of the Middle Jurassic Shaximiao Formation in Sichuan Basin. China Pet. Explor. 2021, 26, 98–109. [Google Scholar]
- Yang, Y.; Xie, J.R.; Cao, Z.L.; Wen, L.; Wang, X.J.; Xiao, Y.; Yang, J.; Tang, Q.S.; Tang, D.H.; Li, M.Q.; et al. Forming conditions and key technologies for exploration and development of large tight sandstone gas reservoirs in Shaximiao Formation, Tianfu gas field of Sichuan Basin. Acta Pet. Sin. 2023, 44, 917–932. [Google Scholar]
- Zhu, R.K.; Zhao, X.; Liu, L.H.; Wang, X.S.; Zhang, N.; Guo, H.L.; Song, L.H. Depositional system and favorable reservoir distribution of Xujiahe Formation in Sichuan Basin. Pet. Explor. Dev. 2009, 36, 46–55. [Google Scholar] [CrossRef] [Scilit]
- Zhao, F.; Liu, L.; Zhu, S.Y.; Li, L.; Qiu, Y.C.; Xu, S.L.; Zheng, C.; Wang, Z.W.; Li, D.; Zhang, R. Provenance-sedimentary pattern and paleogeographic evolution of the Xujiahe Formation in the eastern Sichuan Basin. Nat. Gas Geosci. 2024, 35, 972–987. [Google Scholar]
- Liu, H.Y.; Liu, M.J.; Xiao, Y.; Zeng, Q.G.; Song, L.K.; Cao, J.X.; Wang, J.X.; Li, T.L.; Liang, C. Differential accumulation characteristics and main controlling factors of tight sandstone gas in the Jurassic Shaximiao Formation, central Sichuan Basin. Nat. Gas Geosci. 2024, 35, 1014–1030. [Google Scholar]
- Lyu, C.; Ning, Z.; Wang, Q.; Chen, M. Application of NMR T2 to pore size distribution and movable fluid distribution in tight sandstones. Energy Fuels 2018, 32, 1395–1405. [Google Scholar] [CrossRef] [Scilit]
- Xiao, D.; Lu, Z.; Jiang, S.; Lu, S. Comparison and integration of experimental methods to characterize the full-range pore features of tight gas sandstone: A case study in Songliao Basin of China. J. Nat. Gas Sci. Eng. 2016, 34, 1412–1421. [Google Scholar] [CrossRef] [Scilit]
- Jiang, Z.; Zhu, Y.; Li, P.; Wang, Y.; Xiang, J. Applicability of Nuclear Magnetic Resonance Experiment in Analyzing Pore and Fluid Distribution Characteristics of Tight Sandstone: A Case Study in the Julu Area, Bohai Bay Basin, China. ACS Omega 2023, 8, 43903–43919. [Google Scholar] [CrossRef] [Scilit] [PubMed]
- Xia, X.Y.; Jiang, Y.P. Evaluation method for tight sandstone reservoirs based on pore–throat distributions derived from NMR logging: A case study of Member 2 of the Shaximiao Formation in Q area, Sichuan Basin. Offshore Oil 2019, 39, 47–54. [Google Scholar]
- Xiang, X.B.; Sima, L.Q.; Wang, L.; Li, J.; Guo, Y.H.; Zhang, H. Pore fluid division and effective pore size calculation of shale gas reservoir: A case study of Longtan Formation in Sichuan Basin. Lithol. Reserv. 2021, 33, 137–146. [Google Scholar]
- Cai, J.; Hu, X.; Standnes, D.C.; You, L. An analytical model for spontaneous imbibition in fractal porous media including gravity. Colloids Surf. A Physicochem. Eng. Asp. 2012, 414, 228–233. [Google Scholar] [CrossRef] [Scilit]
- Cai, J.; Perfect, E.; Cheng, C.L.; Hu, X. Generalized modeling of spontaneous imbibition based on Hagen–Poiseuille flow in tortuous capillaries with variably shaped apertures. Langmuir 2014, 30, 5142–5151. [Google Scholar] [CrossRef] [Scilit] [PubMed]
- Zhao, J.; Zhang, G.; Wu, K.; Qin, F.; Fei, L.; Derome, D.; Carmeliet, J. Dynamic pore network modeling of imbibition in real porous media with corner film flow. Langmuir 2024, 40, 7364–7374. [Google Scholar] [CrossRef] [Scilit] [PubMed]
- Siddique, J.I.; Anderson, D.M. Capillary rise in partially saturated rigid porous media. J. Fluid Mech. 2024, 988, A36. [Google Scholar] [CrossRef] [Scilit]
- Geistlinger, H.; Golmohammadi, S.; Zulfiqar, B.; Schlüter, S.; Segre, E.; Holtzman, R. The interplay between pore-scale heterogeneity, surface roughness, and wettability controls trapping in two-phase fluid displacement in porous media. Geophys. Res. Lett. 2024, 51, e2023GL106197. [Google Scholar] [CrossRef] [Scilit]
- Zheng, J.; Qi, X.; Gong, W.; Bian, Y.; Ju, Y. Investigating snap-off behavior during spontaneous imbibition in 3D pore-throat model by pseudopotential lattice Boltzmann method. Adv. Water Resour. 2024, 190, 104751. [Google Scholar] [CrossRef] [Scilit]
- Raue, A.; Kreutz, C.; Maiwald, T.; Bachmann, J.; Schilling, M.; Klingmüller, U.; Timmer, J. Structural and practical identifiability analysis of partially observed dynamical models by exploiting the profile likelihood. Bioinformatics 2009, 25, 1923–1929. [Google Scholar] [CrossRef] [Scilit] [PubMed]

Disclaimer/Publisher’s Note: The statements, opinions and data contained in all publications are solely those of the individual author(s) and contributor(s) and not of MDPI and/or the editor(s). MDPI and/or the editor(s) disclaim responsibility for any injury to people or property resulting from any ideas, methods, instructions or products referred to in the content. |
© 2026 by the authors. Licensee MDPI, Basel, Switzerland. This article is an open access article distributed under the terms and conditions of the Creative Commons Attribution (CC BY) license.