


Abstract
Chinese hamster ovary (CHO) cells are widely used host cells for therapeutic antibody production. Identifying and alleviating bottlenecks in the antibody secretion process in CHO cells is important for improving antibody productivity. However, secretion bottlenecks are often antibody- or cell line-specific, and their identification and validation based solely on experimental approaches can be time-consuming and costly. Computational approaches combined with experimental data could facilitate the identification of secretion bottlenecks. In this study, a kinetic model of the antibody secretion process was developed, and its parameters were optimized using Particle Swarm Optimization (PSO) to describe intracellular and extracellular concentration changes of antibodies and intermediates quantified during translation inhibition in CHO cell lines producing trastuzumab, rituximab, or bevacizumab. The proposed model successfully reproduced the concentration changes of antibodies and assembly intermediates in all three cell lines. Parameter optimization suggested the presence of previously unobserved intracellular molecular species, such as HC2 and HC2LC. The estimated initial flux of fully assembled IgG secretion into the extracellular space was 1.68–1.99 times higher in CHO cells producing trastuzumab and rituximab than in those producing bevacizumab, based on the interquartile spread of parameter estimates across accepted PSO runs. Furthermore, the reaction rate constants for this secretion step were highest in CHO cells producing rituximab, with values 1.80–3.95 times higher than those in cells producing trastuzumab and bevacizumab. These results suggest a relatively high extracellular secretion capacity in CHO cells producing rituximab, consistent with the experimental results. The optimized parameters enabled the evaluation of specific secretion reactions and suggested potential secretion bottlenecks. Although further improvement in parameter identifiability and model refinement is required, the results of this study improve the systematic understanding of the antibody secretion process and may facilitate the rational quantitative identification of secretion bottlenecks and the development of CHO cell lines with improved antibody productivity.
1. Introduction
In recent years, the biopharmaceutical market has been growing steadily, with a projected compound annual growth rate (CAGR) of 8.87% from 2025 to 2030 [1]. Notably, antibody drugs accounted for approximately 80% of the total global sales of protein-based biopharmaceuticals in 2021 [2], highlighting their importance as a therapeutic modality. Chinese hamster ovary (CHO) cells, which can perform human-like post-translational modifications, are the predominant host cell line used for therapeutic antibody production. Among mammalian cell-based biopharmaceuticals approved between 2018 and 2022, 89% were produced using CHO cells as the host cell line [2]. Improving antibody productivity in CHO cells is essential to meet the anticipated rise in demand for antibody drugs and to reduce manufacturing costs.
Various approaches have been taken to enhance antibody production in CHO cells, including culture process optimization and cell line development strategies [3,4,5,6,7], as well as optimization of the post-translational secretion process, such as overexpression of transport-related proteins like Sar1A and ERGIC53, and folding-related proteins like binding immunoglobulin protein (BiP) and protein disulfide isomerase (PDI) [8,9,10,11]. However, these effects are often inconsistent across antibodies and cell lines [8,9,10,11], highlighting the need to identify and alleviate cell line- and antibody-specific secretion bottlenecks [12,13]. Previous research generated CHO cell lines with knockdowns of several secretion pathway proteins [13]. Following chemical inhibition of translation and vesicle transport, temporal changes in intracellular IgG and intermediate concentrations were found to differ depending on the knocked-down protein and antibody species, suggesting these observations could provide insights into antibody-specific secretion bottlenecks. However, much of this information is qualitative, making it difficult to determine which specific reaction steps drive the observed changes. Although numerous studies have investigated secretion bottlenecks [14,15,16,17], a general framework for systematically identifying secretion bottlenecks remains lacking. Furthermore, studies analyzing the secretion processes of cell lines producing difficult-to-express antibodies have proposed multiple potential bottlenecks, highlighting the challenge of identifying the primary limiting factor among these candidates [18]. To date, modulating the secretion process has primarily been evaluated experimentally, and the effects of these modifications cannot be assessed until the engineered cell lines are evaluated for antibody production. As a result, conducting the entire process solely through experimental approaches, from bottleneck identification to validation, is time-consuming, labor-intensive, and costly.
Integrating computational approaches with experimental approaches for evaluating antibody secretion in CHO cells would facilitate the rational identification of secretion bottlenecks. In particular, mechanistic modeling offers a promising approach for systematically identifying rate-limiting steps in the secretory pathway and predicting the effects of pathway modifications in CHO cells [19]. Such models allow for abstraction and simplification of the biological processes of interest and have been applied to CHO cells, including metabolic models [20], antibody glycosylation models [21], and cell growth models [22]. Data-driven models have also recently garnered attention, as they can improve predictive performance by incorporating complex or previously uncharacterized relationships that are difficult to describe using conventional mechanistic models alone [23,24]. However, data-driven models tend to have a “black box” nature, making it difficult to provide a mechanistic interpretation of the obtained results [25]. Furthermore, the predictive capability of such models depends on the quantity and quality of the training data [25]. In bioprocess research, obtaining sufficient experimental data for model training remains challenging because large datasets are often required, whereas available experimental data are limited [23]. For this reason, mechanistic models, which allow for direct interpretation of the underlying mechanisms, continue to play an important role.
Mechanistic modeling of antibody assembly and vesicular transport began with studies on mouse hybridoma cells by Bibila and Flickinger [26,27,28,29], and antibody biosynthesis models have also been proposed for CHO cells [30]. These models have been applied to identify potential bottlenecks through sensitivity analysis and to simulate fed-batch culture processes [31]. However, despite the importance of the secretion process for antibody production efficiency in CHO cells, relatively few mechanistic models have focused on this process [26,27,28,29,30,31], and most lack measurements of antibody intermediates, such as HC2 and HC2LC. Previous antibody secretion models constructed in hybridoma cells [26] did track these intermediates, but considered only their forward assembly, leaving uncertainty in the estimated parameters and predicted dynamics. To address this limitation, model construction and validation require experimental data that capture the temporal behavior of antibody assembly intermediates, including their potential reverse or alternative reactions. Such data are needed to develop a kinetic model that can quantitatively evaluate secretion bottlenecks across antibodies and cell lines.
In this study, the concentration profiles obtained following inhibition of translation in CHO cell lines producing three different antibodies (trastuzumab, rituximab, and bevacizumab) were used to develop a kinetic model of the antibody secretion pathway for quantitative evaluation of antibody secretion dynamics in CHO cells. The model describes the dynamics of the quantified intermediates and IgG, as well as unquantified species predicted from the experimental results. Rather than predicting independent experimental conditions, the model is intended to provide a quantitative framework for interpreting the experimentally observed dynamics and identifying potential rate-limiting steps, offering an alternative to conventional approaches based solely on experimental evaluation of specific secretion steps. The proposed model may contribute to the development of rational strategies for identifying and alleviating antibody-specific secretion bottlenecks.
2. Materials and Methods
2.1. Cell Lines and Cell Culture
Three CHO-K1-derived antibody-producing cell lines producing trastuzumab, rituximab, and bevacizumab [13] were used in this study. These cell lines were termed CHO-Trsz, CHO-Ritx, and CHO-Bvcz, respectively. Cells were cultured in BalanCD CHO Growth A (Irvine Scientific, Costa Mesa, CA, USA) supplemented with 6 mM L-glutamine (Fujifilm Wako Pure Chemical Corporation, Osaka, Japan) and 15 μg mL−1 puromycin (InvivoGen, San Diego, CA, USA) in 125 mL Erlenmeyer shake flasks (Corning, Corning, NY, USA) with a working volume of 20 mL. The cultures were maintained at 37 °C, 5% CO2, and 80% humidity, with agitation at 140 rpm and an orbital diameter of 25 mm using a Climo-Shaker ISF1-XC (Kühner, Birsfelden, Switzerland). The initial seeding density for each cell line was 5 × 10⁵ cells mL−1. The viable cell concentration, cell viability, and cell diameter were measured using a VI-CELL BLU Cell Viability Analyzer (Beckman Coulter, Brea, CA, USA).
2.2. Cycloheximide Chase Assay
CHO-Trsz, CHO-Ritx, and CHO-Bvcz cells were seeded at 20 × 105 cells mL−1 and cultured in 125 mL Erlenmeyer shake flasks with a working volume of 30 mL under the culture conditions described in Section 2.1. To analyze dynamic changes in antibody and intermediate profiles, cycloheximide (CHX), a reversible translation inhibitor, was added to inhibit translation and suppress the production of new antibody chains. 50 μg mL−1 of cycloheximide (Nacalai Tesque, Kyoto, Japan) was added to each cell line, and 1 mL of each culture sample was collected at 0, 1, 2, 4, 6, and 8 h after CHX addition. The viable cell concentration, viability, and cell diameter were measured at each time point. Each sample was then centrifuged at 10,000× g for 2 min at 4 °C to separate the supernatant from the cell pellet. The cell pellets were lysed with RIPA buffer (Nacalai Tesque, Kyoto, Japan) containing 1% (v/v) protease inhibitor cocktail (Nacalai Tesque, Kyoto, Japan). The lysates were centrifuged at 17,900× g for 2 min at 4 °C, and the soluble fraction was used in subsequent experiments.
2.3. Quantification of Intracellular Antibodies and Intermediates
Intracellular IgG and its intermediates within the cell lysates from Section 2.2 were quantified via capillary electrophoresis-based non-reducing and reducing Western blotting using the Jess Automated Western Blot System (Jess; ProteinSimple, San Jose, CA, USA), according to the manufacturer’s protocol. Total protein concentration of the lysates was measured using the Pierce BCA Protein Assay Kit (Thermo Fisher Scientific, Rockford, IL, USA) according to the manufacturer’s protocol. Lysates collected at 0, 1, 2, 4, 6, and 8 h post-CHX addition and the standards were loaded onto a 12–230 kDa Jess separation module (ProteinSimple, Minneapolis, MN, USA) to separate intracellular IgG and its intermediates by molecular weight. The IgG and its intermediates were detected using Rabbit Anti-Human IgG H&L (HRP) (ab6759) (Abcam, Cambridge, UK) as the primary antibody, diluted at 1:200, and Anti-Rabbit Detection Module (ProteinSimple, Minneapolis, MN, USA) as the secondary antibody. Intracellular IgG and its intermediates were quantified using Compass for SW software (v6.2.0) (ProteinSimple, Minneapolis, MN, USA) by applying Gaussian peak fitting to the respective separated peak areas. Three independent flask cultures were analyzed separately (n = 3), and the relative values were calculated based on the peak area of the standard, Monoclonal Antibody Solution, AIST-MAB (NMIJ RM 6208-a; AIST, Tsukuba, Japan).
2.4. Quantification of Antibody Concentration in Culture Supernatant
The concentration of secreted IgG was quantified using a sandwich enzyme-linked immunosorbent assay (ELISA). 96-well plates (Corning, Corning, NY, USA) were coated with goat anti-human IgG-Fc Fragment Affinity Purified (100 μL well−1, 2 μg mL−1; Bethyl Laboratories, Montgomery, TX, USA) in Coating Solution (SeraCare Life Sciences, Milford, MA, USA) and incubated for 1 h at 37 °C. The coating buffer was discarded, and the plates were blocked with 300 μL of 1% (v/v) bovine serum albumin (BSA) in phosphate-buffered saline (PBS) for 30 min at 37 °C. The plates were washed three times with washing buffer (0.05% (v/v) Tween-20, 0.9% (v/v) NaCl in PBS), and the standards and the samples were added to the wells. The plates were incubated for 1 h at 37 °C. The plates were washed three times with the washing buffer and incubated with Goat anti-Human IgG-Fc Fragment HRP Conjugated (100 μL well−1, 0.29 μg mL−1; Bethyl Laboratories, Montgomery, TX, USA) in 1% (v/v) BSA/PBS for 30 min at 37 °C. After washing, 100 μL of peroxidase substrate solution (50% (v/v) KPL ABTS Peroxidase Substrate Solution A (SeraCare Life Sciences, Gaithersburg, MD, USA), 50% (v/v) KPL Peroxidase Substrate Solution B (SeraCare Life Sciences, Gaithersburg, MD, USA)) was added to each well, and the plates were incubated for 90 s at room temperature (RT). The reaction was then stopped by adding 100 μL of KPL ABTS Peroxidase Stop Solution (SeraCare Life Sciences, Gaithersburg, MD, USA), and absorbance was measured at 405 nm using a NivoTM Multimode Plate Reader (PerkinElmer, Waltham, MA, USA).
2.5. Quantification of mRNA
The copy numbers of HC and LC mRNA were quantified by digital PCR (dPCR) to determine the LC-to-HC mRNA ratio in each cell line. Total RNA was extracted from the three cell lines using the FastGene RNA Premium Kit (Nippon Genetics, Tokyo, Japan). To account for variation in RNA recovery and cDNA synthesis efficiency, cell lysates prepared from 50 × 105 cells during the exponential growth phase were spiked with RNA reference material (RNA500-B, NMIJ CRM 6204-b; National Institute of Advanced Industrial Science and Technology, Tsukuba, Japan) at a final concentration of 0.02 fmol μL−1 before RNA extraction. Subsequently, cDNA was synthesized from total RNA extracted according to the manufacturer’s protocol using the PrimeScript 1st Strand cDNA Synthesis Kit (Takara Bio, Kusatsu, Japan). mRNA was quantified using the Absolute Q™ DNA Digital PCR Master Mix (5X) (A52490; Thermo Fisher Scientific, Vilnius, Lithuania) and the QuantStudio™ Absolute Q™ digital PCR system (Thermo Fisher Scientific, Rockford, IL, USA), in accordance with the manufacturer’s protocol. The primers and probes used for dPCR are shown in Table A1 and Table A2.
2.6. Calculation and Statistical Analysis
The total protein mass and cellular volume have been reported to be linearly correlated [32,33]. Therefore, the intracellular concentration of antibodies and their intermediates was calculated from the amount of target protein quantified by Jess, the total protein amount loaded into the Jess capillaries, and the average cellular volume. The cellular volume was estimated from the cell diameter measured using VI-CELL BLU at the time of pellet collection, assuming spherical cells.
The LC-to-HC mRNA ratio in the cell lysate was calculated using Equation (1):
where and represent the concentrations of LC and HC mRNA determined by dPCR, respectively. The specific IgG production rate and specific growth rate were calculated from the IgG concentrations measured during the exponential growth phase (days 0–3 for CHO-Trsz and CHO-Ritx; days 0–4 for CHO-Bvcz), where the specific growth rate was constant [34]. A two-tailed unpaired t-test was used for statistical analysis.
2.7. Specific Growth Rate During CHX Chase Assay
Previous studies have shown that CHX suppresses cell proliferation [35]. However, this suppression involves multiple intracellular regulatory mechanisms, making it difficult to explicitly model the effect of CHX on cell proliferation. Therefore, the temporal profile of the specific growth rate (μ) was approximated using a simple exponential decay function, as described in Equation (2), and incorporated into the growth dilution term of the secretion kinetic model.
By substituting Equation (2), the ordinary differential equation for the viable cell concentration is expressed as,
Integrating Equation (3) yields Equation (4), which describes the predicted viable cell concentration, X, at time t, during the CHX chase assay. Equation (4) was used to estimate parameters by fitting the model to the measured viable cell concentrations.
and were optimized using the method described in Appendix B.
2.8. Construction of the Antibody Secretion Kinetic Model
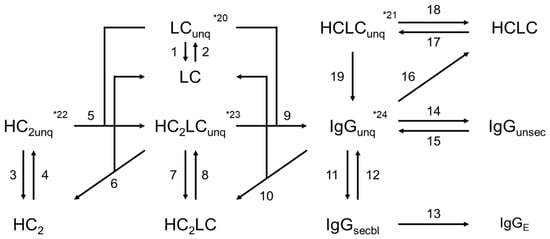
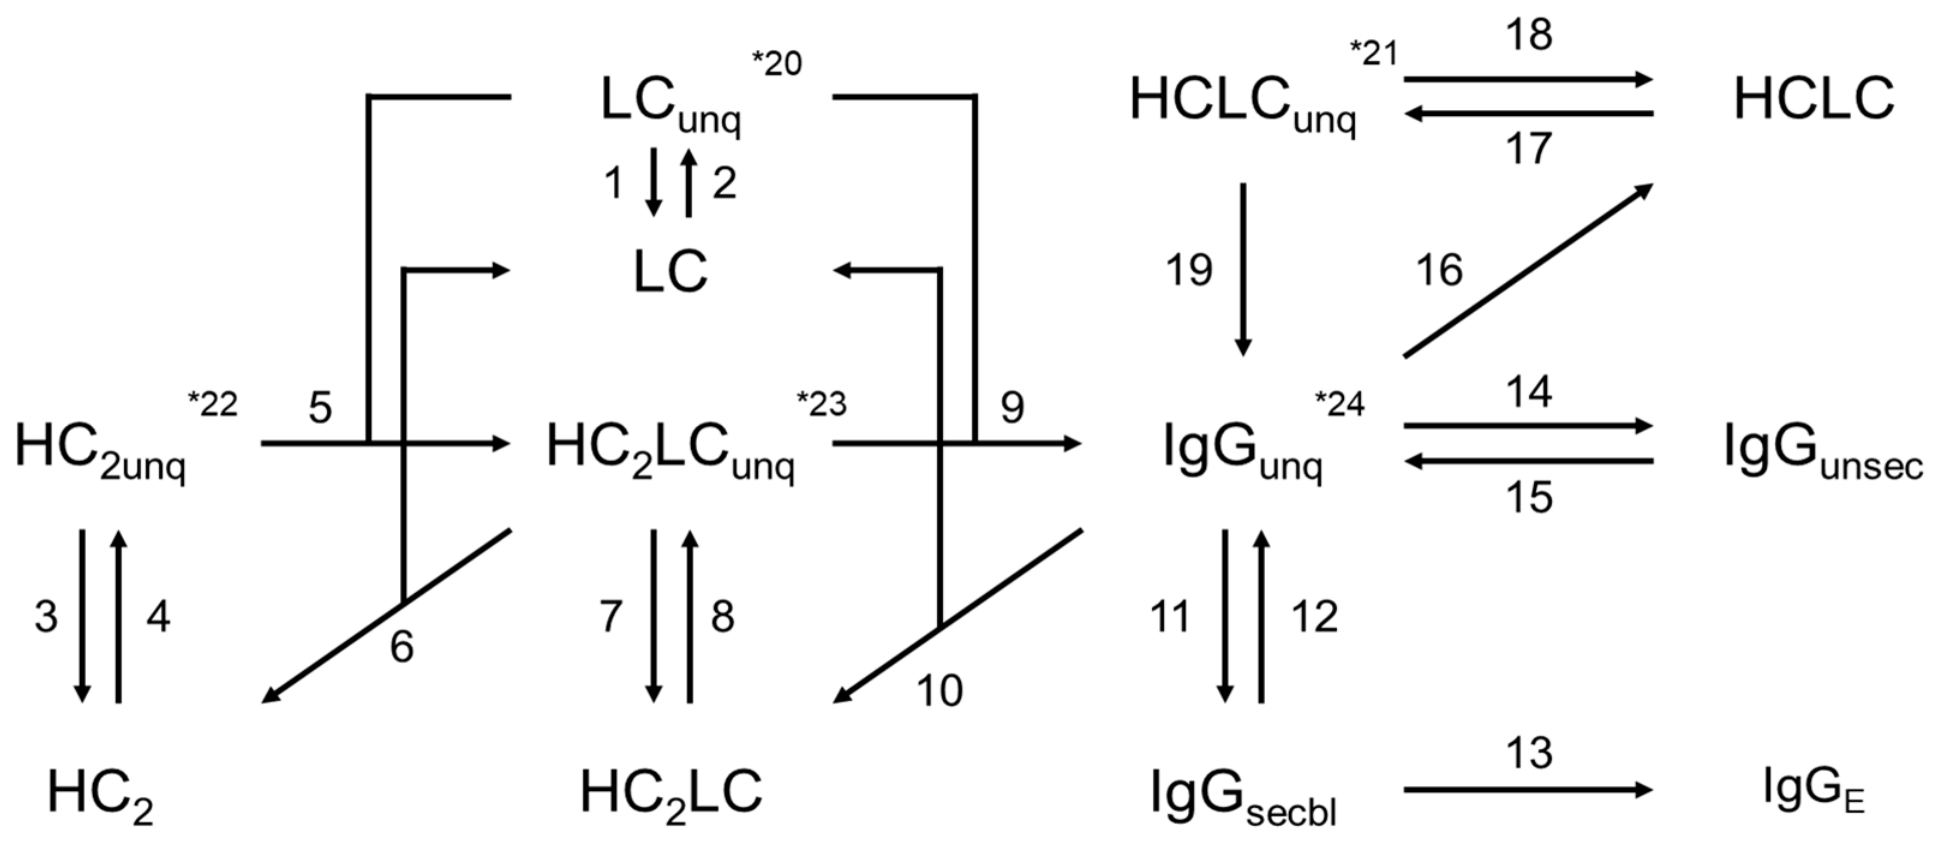
The antibody secretion kinetic model was developed based on previously reported antibody biosynthesis models using ordinary differential equations to describe the secretion process [30]. The present model was expanded to describe the concentration changes of the intracellular secretable IgG (IgGsecbl), unsecretable IgG (IgGunsec), quantified intermediates (LC, HCLC, HC2, HC2LC), unquantified IgG (IgGunq) and intermediates (LCunq, HCLCunq, HC2unq, HC2LCunq), as well as the extracellular IgG (IgGE) (Equations (A2)–(A13)). Figure 1 shows the flowchart of the proposed secretion process model.
Figure 1.
Flowchart of the secretion process model constructed in this study. The numbers indicate the respective reactions. * indicates irreversible reactions, such as the degradation of molecular species. Molecular species with the subscript “unq” represent species that could not be quantified experimentally. IgGsecbl and IgGunsec represent secretable and non-secretable IgG, respectively. IgGE represents extracellular antibodies.
The model construction incorporated the following mechanistic assumptions:
- •
- CHX is a reversible translation inhibitor that has been shown to rapidly inhibit translation in CHO cells [36]. In the present model, translation was assumed to be completely inhibited following CHX addition, and the specific translation rates of HC and LC polypeptide chains were set to 0 for simplicity.
- •
- HC undergoes translation and interchain disulfide bond formation simultaneously and, in the case of IgG1, is assembled into heavy-chain dimers (HC2) [37]. Therefore, following CHX-induced translation inhibition, HC2 formation was also assumed to cease, and assembly between free HC monomers was not considered.
- •
- During antibody assembly, intermediate complexes are formed through interactions with accessory factors such as BiP and PPIase [38,39,40]. Assembly was assumed to proceed via such intermediates, whose molecular weights remain unknown and therefore could not be quantified in this study.
- •
- It has been reported that enzymes such as PDI cause the rearrangement of improper disulfide bonds [10,11]. Furthermore, previous models have described the cleavage of IgG into half-antibodies (HCLC) [30,31]. Based on these observations, IgGunq and HC2LCunq were assumed to undergo disulfide bond cleavage to generate the corresponding free intermediates, which can subsequently re-enter the assembly pathway.
- •
- The possible loss of intermediates and antibodies through aggregation or degradation was considered. However, because these processes are also likely to involve interactions with protein-folding factors [15,41], they were assumed to proceed via unquantified intermediate states.
- •
- The secretion rate of fully assembled antibodies was assumed to be proportional to the concentration of intracellular free IgG (IgGI). However, a fraction of IgG, representing misfolded antibodies or antibodies with incomplete glycosylation, was assumed to lack secretion capacity [9]. The proportion of these non-secretable antibodies (IgGunsec) within the total quantified intracellular IgG (IgGI = IgGsecbl + IgGunsec) was defined as runsec.
- •
- Although secretion of LC and LC dimers (LC2) has been reported [30], these pathways were combined with irreversible processes, such as LC aggregation and degradation, since they could not be experimentally distinguished in this study.
Since IgGsecbI and IgGunsec cannot be experimentally quantified separately and are measured only as their total amount, their sum, IgGI, was used as the model output. Model parameters were optimized using Particle Swarm Optimization (PSO) [42] by minimizing the loss function defined in Equation (5). The PSO was implemented using the PSO function in the pyswarm module. Since the number of particles and iterations affect both optimization performance and computational cost, several combinations of these settings were evaluated. Based on the point at which further increases produced only marginal improvements in the optimization results, 200 particles and 30 iterations were selected (Appendix F). Since PSO is a stochastic optimization algorithm and may converge to local optima, 100 independent optimizations were performed using these settings to obtain 100 optimized parameter sets.
Here represents the experimentally measured quantitative value at time t, and represents the predicted value at time t, simulated from the model.
3. Results and Discussion
3.1. Characterization of the Antibody Secretion Process Through Experimental Methods
3.1.1. Analysis of Specific Productivity in Three Antibody-Producing CHO Cells
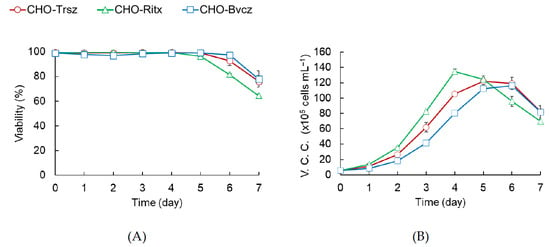
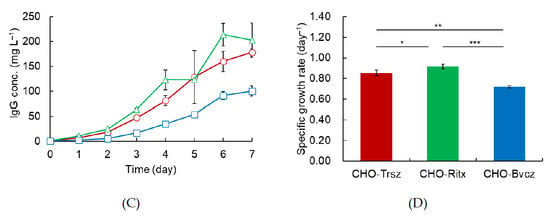
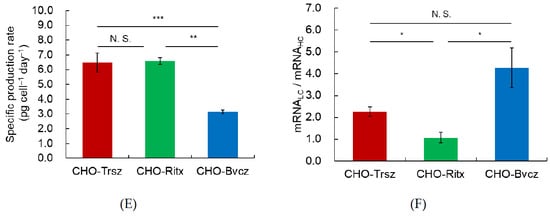
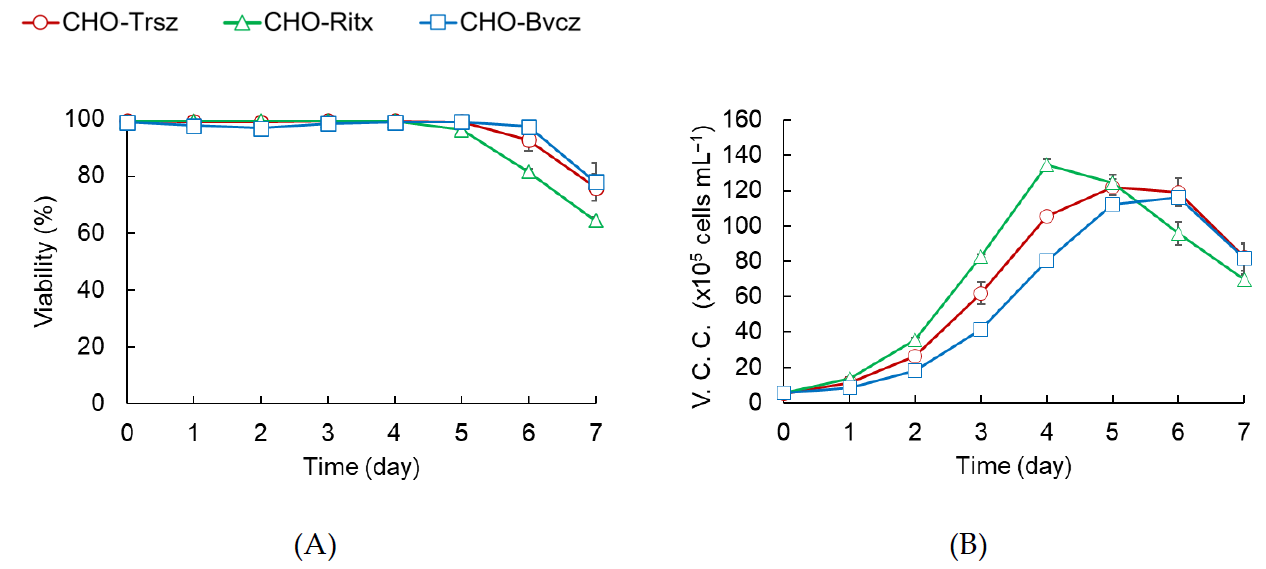
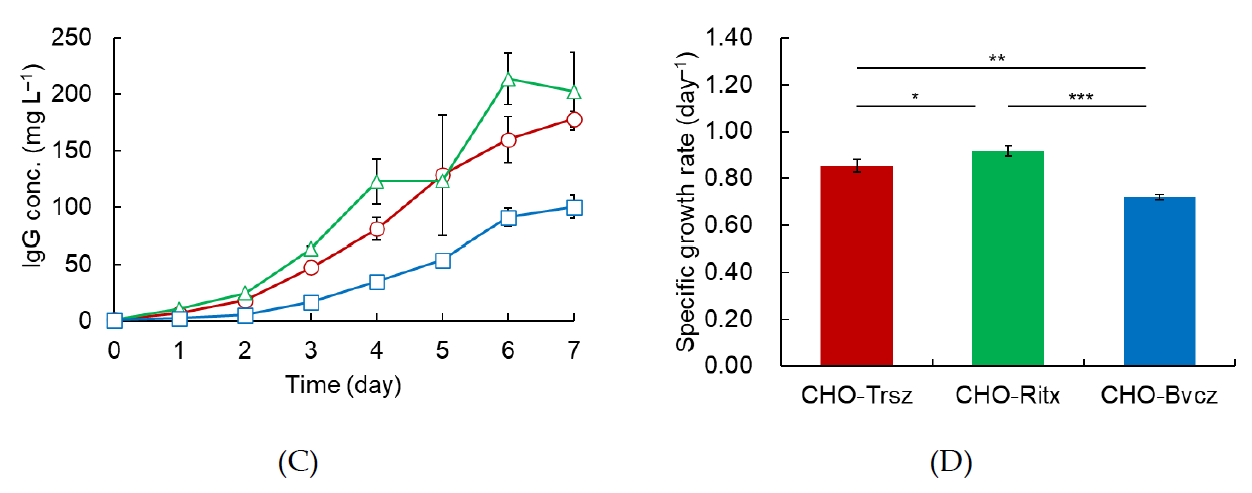
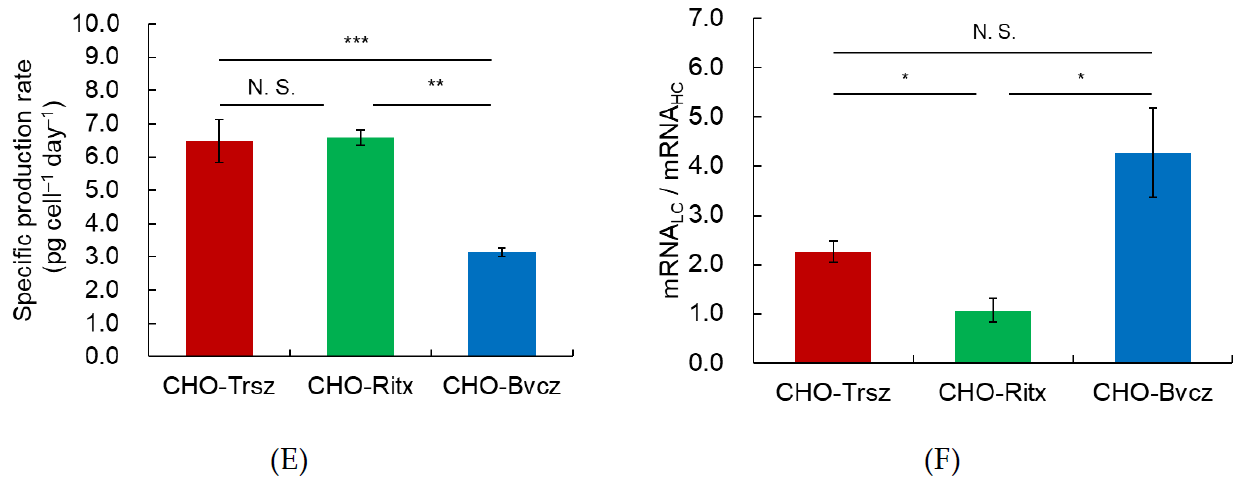
All three cell lines maintained viability above 96% until day 5 (Figure 2A). CHO-Ritx exhibited the highest viable cell density and extracellular antibody concentration from days 1 to 4 (Figure 2B,C). However, the viable cell concentration of CHO-Ritx began to decline on day 5, and antibody accumulation temporarily plateaued. This may be attributed to the depletion of essential nutrients required for cell growth and antibody production, such as glutamine. To quantitatively compare the growth characteristics of the three cell lines, the specific growth rates during the exponential growth phase were calculated. The specific growth rates during the exponential growth phase were 0.853, 0.918, and 0.720 day−1 for CHO-Trsz, CHO-Ritx, and CHO-Bvcz, respectively (Figure 2D). The specific production rates during the exponential growth phase were 6.48, 6.58, and 3.15 pg cell−1 day−1, respectively (Figure 2E), with CHO-Bvcz exhibiting significantly lower specific productivity than the other two cell lines.
Figure 2.
Comparison of growth, productivity, and LC-to-HC mRNA ratios among CHO-Trsz, CHO-Ritx, and CHO-Bvcz during flask batch cultures. (A) Viability. (B) Viable cell concentration. (C) Extracellular IgG concentration. (D) Specific growth rate during the exponential growth phase (days 0–3 or 4), during which the specific growth rate remained constant. (E) Specific IgG production rate during the exponential growth phase (days 0–3 or 4). (F) LC-to-HC mRNA ratio during the exponential growth phase. The error bars represent the standard error of the mean from three independent cultures (n = 3). A two-tailed unpaired t-test was used for statistical analysis. The significance threshold was set at p < 0.05. No correction for multiple comparisons was performed. * p < 0.05, ** p < 0.005, *** p < 0.0005, N.S., not significant.
To investigate whether differences in productivity were associated with HC and LC expression, HC and LC mRNA levels were quantified by dPCR using cells harvested during the exponential growth phase. The LC-to-HC mRNA ratio exceeded 1 in all three cell lines, indicating that LC mRNA was more abundant than HC mRNA (Figure 2F). Previous studies have shown that a higher LC DNA copy number relative to HC is beneficial for antibody production [43], suggesting that the higher LC mRNA abundance observed here may similarly contribute to the high antibody expression levels of these cell lines.
3.1.2. Quantification of Antibody Dynamics During Chase Assay
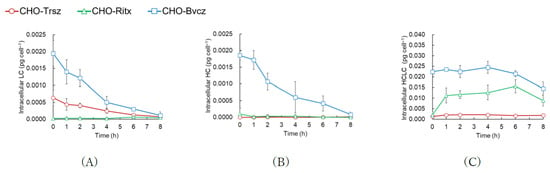
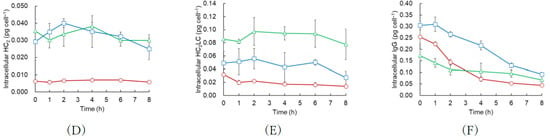
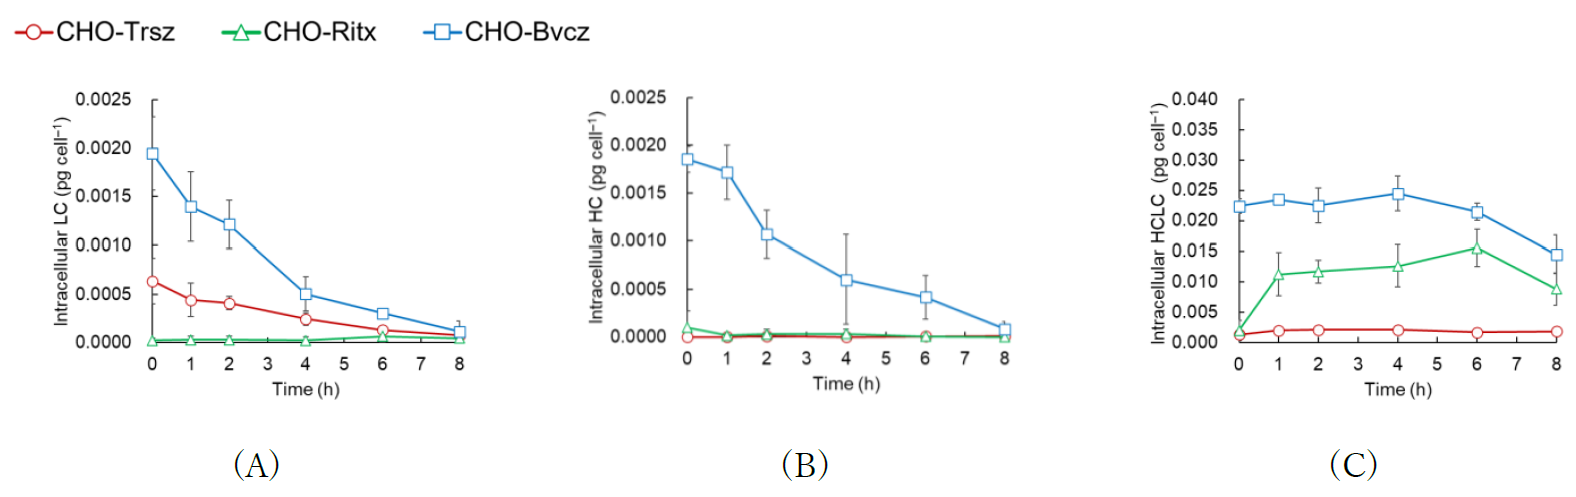
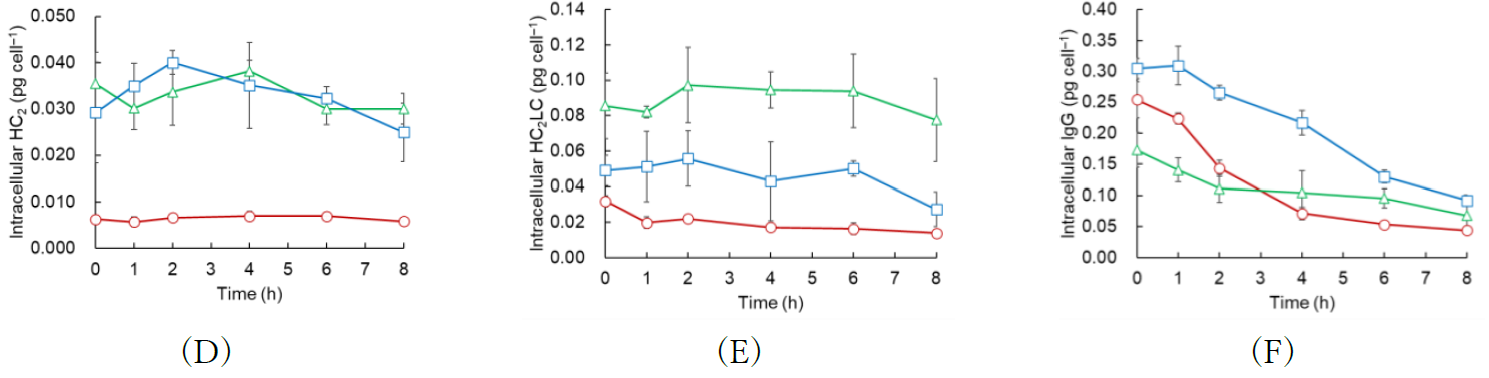
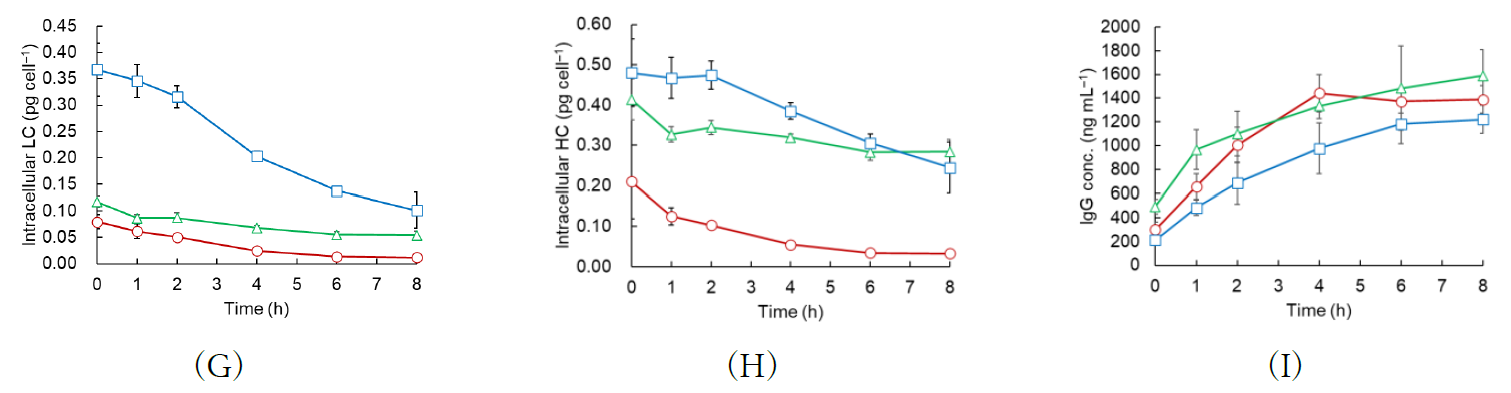
Changes in the concentrations of intracellular antibodies, antibody intermediates, and extracellular antibodies were analyzed following translation inhibition by CHX in the three CHO cell lines. Analysis of cell lysates under non-reducing conditions showed that 8 h after CHX addition, the intracellular LC and HC concentrations in CHO-Bvcz had decreased to 5.85% and 4.46% of their initial concentrations, respectively. In contrast, intracellular LC in CHO-Trsz decreased to 11.7% of its initial concentration. In CHO-Ritx, both HC and LC levels were substantially diminished, whereas HC was minimally detected in CHO-Trsz (Figure 3A,B). Furthermore, HC and LC concentrations were less than one-tenth of those of the expected assembly intermediates (HC2 and HC2LC) and fully assembled IgG. Although some multimeric intermediates such as HCLC in CHO-Ritx and HC2 in CHO-Bvcz showed a transient increase, none exhibited a consistent temporal trend throughout the assay (Figure 3C–E). The concentrations of the same intermediates differed markedly among the three cell lines. In contrast with multimeric intermediates, intracellular antibody concentrations decreased in all three cell lines (Figure 3F). However, in CHO-Bvcz, intracellular IgG levels remained stable for 1 h after CHX addition before subsequently decreasing. These results are consistent with a previous report in which time-dependent changes in intracellular antibody and intermediate concentrations following translation inhibition differed among CHO cell lines producing different antibodies [13].
Figure 3.
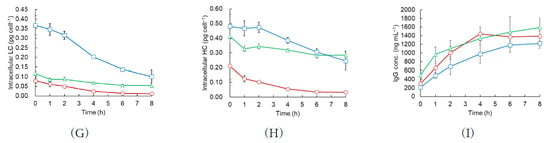
Intracellular and extracellular concentrations of IgG and antibody intermediates in CHO-Trsz, CHO-Ritx, and CHO-Bvcz following CHX addition. The intracellular concentrations of (A) LC, (B) HC, (C) HCLC, (D) HC2, (E) HC2LC, and (F) IgG were quantified from non-reducing cell lysates after the addition of CHX. (G) LC and (H) HC concentrations were quantified using cell lysates under reducing conditions after the addition of CHX. (I) Extracellular IgG concentrations were quantified in the culture supernatant after CHX addition by ELISA. The cultures were sampled at 0, 1, 2, 4, 6, and 8 h after CHX addition. The y-axis represents concentration. The error bars represent the standard error of the mean from three independent cultures (n = 3).
Analysis of the same samples under reducing conditions showed that LC concentrations in CHO-Bvcz were 1.87 to 4.60 times higher than in the other two cell lines (Figure 3G). HC concentrations were higher in CHO-Bvcz and CHO-Ritx than in CHO-Trsz. The HC concentration between CHO-Bvcz and CHO-Ritx became comparable after 6 h (Figure 3H). HC concentration under reducing conditions decreased exponentially in CHO-Trsz, whereas the decline was less pronounced in CHO-Ritx. Furthermore, CHO-Bvcz exhibited stable HC concentrations for the first 2 h before declining. During the Chase assay, the extracellular antibody concentration plateaued after 4 h for CHO-Trsz, whereas extracellular antibody concentrations continued to increase throughout the assay in CHO-Ritx and CHO-Bvcz (Figure 3I).
3.1.3. Comparative Analysis of Intracellular IgG and Intermediates Under Reducing and Non-Reducing Conditions
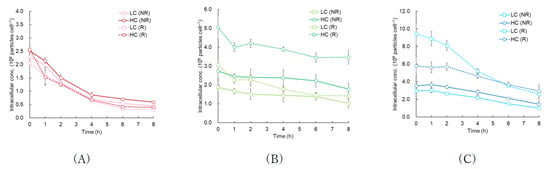
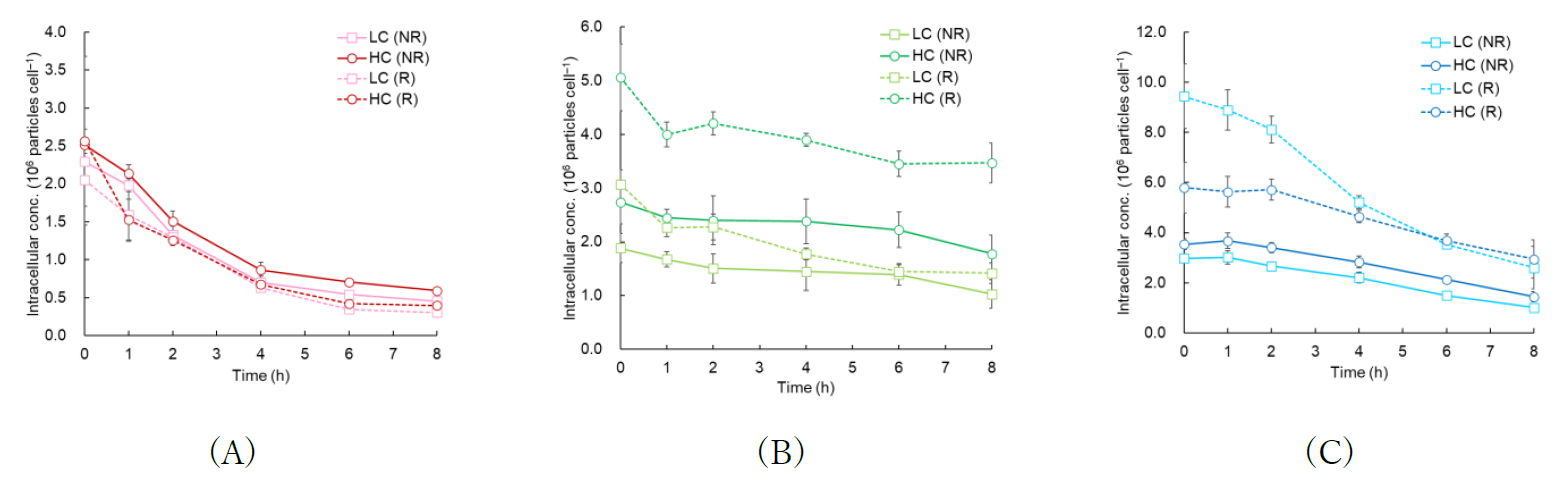
To further characterize antibody dynamics, the number of HC and LC molecules per cell was estimated from the concentrations of intracellular IgG and IgG intermediates measured under non-reducing conditions using the method described in Appendix E. The ratio of LC-to-HC molecules under reducing conditions at 0 h was 0.800, 0.606, and 1.63 for CHO-Trsz, CHO-Ritx, and CHO-Bvcz, respectively, indicating that LC was more abundant than HC in CHO-Bvcz, whereas HC was more abundant than LC in the other two cell lines. This is consistent with the LC mRNA-to-HC mRNA ratio shown in Figure 2F, which was highest in CHO-Bvcz and lowest in CHO-Ritx. Therefore, the intracellular LC-to-HC molecular ratio may be associated with the relative abundance of LC and HC mRNAs, and the optimal relative expression levels of LC and HC may vary depending on the antibody being produced.
For CHO-Trsz, no significant differences in the concentration of HC or LC were observed between reducing and non-reducing conditions (Figure 4A). Furthermore, the estimated HC and LC molecular numbers exhibited nearly identical trends. As shown in Figure 3D,E, the intracellular concentrations of assembly intermediates, such as HC2 and HC2LC, were lower in CHO-Trsz than in the other two cell lines. These results suggest that the intracellular antibody pool in CHO-Trsz consists predominantly of fully assembled IgG, with relatively few assembly intermediates or antibody-related species, such as aggregates or hetero-oligomers.
Figure 4.
Comparison of intracellular HC and LC molecular numbers during chase assay in (A) CHO-Trsz, (B) CHO-Ritx, and (C) CHO-Bvcz. Cultures were sampled at 0, 1, 2, 4, 6, and 8 h after CHX addition. “NR” represents the HC and LC molecular concentrations calculated from the concentrations of IgG and assembly intermediates quantified under non-reducing conditions. “R” represents the HC and LC molecular numbers quantified under reducing conditions. The error bars represent the standard error of the mean from three independent cultures (n = 3).
For CHO-Ritx, the estimates of HC and LC under reducing conditions at 0 h were 1.84 and 1.63 times higher than those estimated under non-reducing conditions, respectively. The HC and LC molecular numbers estimated from the reducing condition at 0 h were greater than those estimated under non-reducing conditions (Figure 4B). As shown in Figure 3D,E, CHO-Ritx had higher concentrations of antibody intermediate than CHO-Trsz. The intermediate concentrations were quantified from band intensities relative to those of IgG standards with known concentrations, assuming that the detection antibody exhibits the same affinity for both the intermediates and fully assembled IgG. However, improperly folded or partially assembled antibody intermediates may have lower affinity for the detection antibody than fully assembled IgG. Consequently, the concentrations of these intermediates under non-reducing conditions may have been underestimated. This underestimation could, at least in part, explain the discrepancy between the HC and LC molecular numbers estimated under reducing and non-reducing conditions. However, for LC in CHO-Ritx, although the molecular number estimated under reducing conditions was higher than that estimated under non-reducing conditions at 0 h, the two values converged by 6 h (Figure 4B). If the discrepancy between reducing and non-reducing conditions were solely attributable to differences in detection antibody affinity, the concentrations of LC-containing intermediates, particularly HC2LC, would be expected to decrease over time, accompanied by an increase in the proportion of fully assembled IgG within the cells. However, no substantial decrease in HC2LC concentration was observed (Figure 3E).
In CHO-Bvcz, the estimates of HC and LC concentration under reducing conditions at 0 h were 1.64 and 3.17 times higher than those determined under non-reducing conditions, respectively. A notable amount of LC was not detected under non-reducing conditions (Figure 4C). The LC concentration estimated under reducing conditions decreased more rapidly than that of HC at the beginning of the chase assay and then exhibited kinetics similar to those of HC after 4 h. Antibody-producing cells have been reported to accumulate IgG aggregates intracellularly as Russell bodies [44]. In addition, IgG dimers, trimeric and higher-order IgG aggregates, and LC aggregates have been detected in culture supernatants [18,45], suggesting that similar species may also exist intracellularly. Furthermore, during antibody assembly, intermediate complexes are formed through interactions with molecular chaperones and folding enzymes, such as BiP and PPIase. Because these complexes have molecular weights different from those of the antibody species quantified in this study, they would not be detected if they are not dissociated during sample preparation. Hence, additional intracellular antibody species that cannot be quantified under non-reducing conditions may be present.
The differences in the rates of HC and LC concentration decrease observed under the reducing and non-reducing conditions in CHO-Ritx and CHO-Bvcz (Figure 4B,C) suggest the presence of multiple unobserved molecular species that undergo distinct intracellular processing. In CHO-Ritx, unobserved molecular species involving LC may undergo degradation or secretion within a few hours, whereas those involving HC may remain relatively stable and be retained intracellularly. In CHO-Bvcz, these observations may indicate the presence of LC-containing aggregate species that are relatively rapidly degraded or secreted, as well as aggregate species containing both HC and LC that have greater stability.
3.2. Quantitative Evaluation of the Antibody Secretion Processes Using Antibody Secretion Kinetic Model
As described in Section 3.1.3, the analysis of the time-dependent changes in intracellular antibody species, antibody intermediates, and extracellular IgG following translation inhibition suggested the potential presence of aggregates and additional intracellular species that could not be directly quantified. Previous studies have qualitatively inferred bottlenecks in the antibody secretion process based on temporal profiles of these measured species [13]. To quantitatively interpret these dynamics, the antibody biosynthesis process, including the assembly intermediates, intracellular IgG, and secreted IgG, was described using a kinetic model. The model parameters were estimated by nonlinear regression using the experimentally measured time courses of intracellular antibodies and intermediates, as well as extracellular antibodies following translation inhibition with CHX treatment.
Although only a subset of the molecular species involved in antibody biosynthesis, such as HC2 and HC2LC, can be measured experimentally, the model incorporates unobserved intermediate states to account for the observed concentration profiles. Previous studies have shown that protein-folding factors such as protein disulfide isomerase (PDI) and BiP assist antibody folding and assembly [38,39,40], while misfolded secretory proteins are degraded through the endoplasmic reticulum-associated degradation (ERAD) pathway [15]. In addition, the experimental results (Figure 4) suggested the existence of unquantified intracellular species. Accordingly, the model assumes that some antibody assembly, degradation, and cleavage reactions proceed via unquantified intermediate states formed through binding interactions. These unquantified states do not represent experimentally identified molecular species or specific protein complexes. Rather, they are hypothetical intermediates introduced to reproduce the observed time courses of intracellular IgG and antibody intermediates. Therefore, these components should be interpreted as collective representations of intracellular states involving protein-folding factors and quality-control mechanisms.
The concentration changes of each molecular species, including the unquantified intracellular species, were described using a system of ordinary differential equations consisting of 12 equations containing 24 reaction rate constants (Equations (A2)–(A13)). The estimated reaction rate constants were used as indicators of potential secretion bottlenecks. An additional six parameters, comprising the initial concentrations of five unquantified species and the initial ratio of secretable intracellular IgG, were introduced, resulting in a total of 30 parameters. These parameters were optimized using PSO, as described in Section 2.8, to reproduce the time-course profiles of the concentrations of intracellular antibodies and intermediates (LC, HCLC, HC2, HC2LC) quantified from non-reducing cell lysates during the chase assay (Figure 3A,C–F), and the concentration of extracellular antibodies (Figure 3I).
3.2.1. Best Model Fit
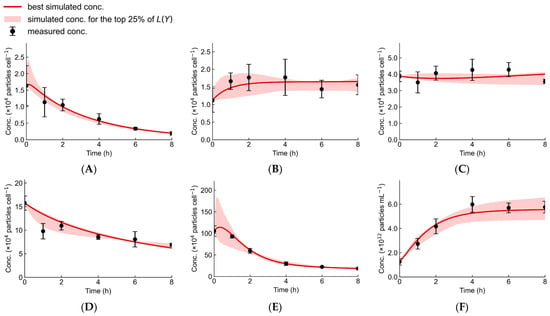
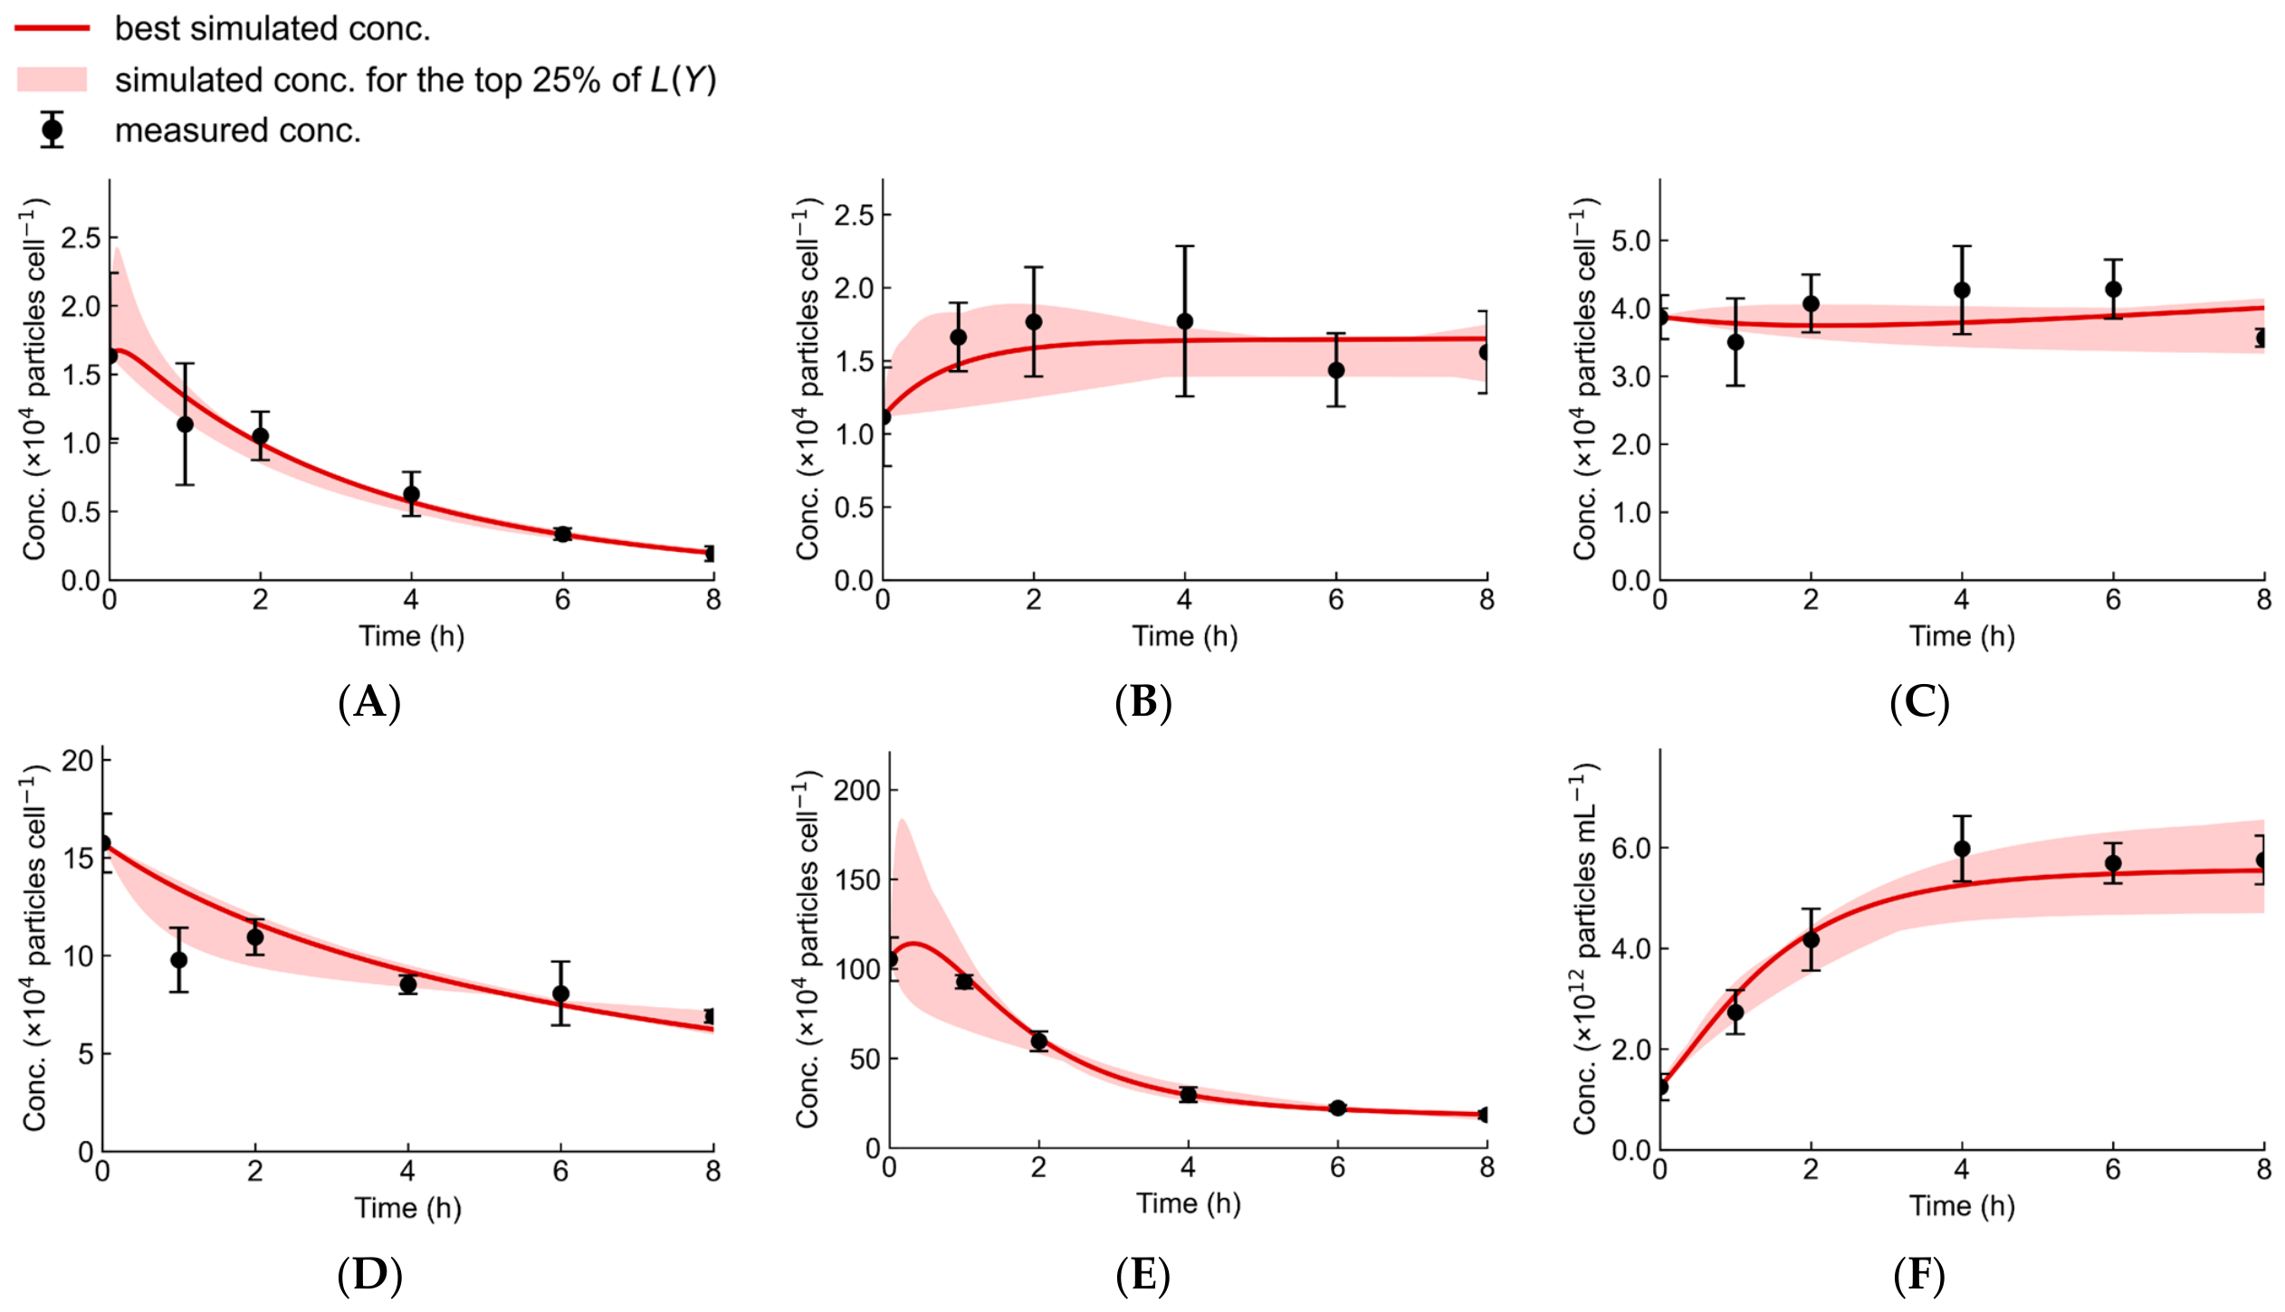
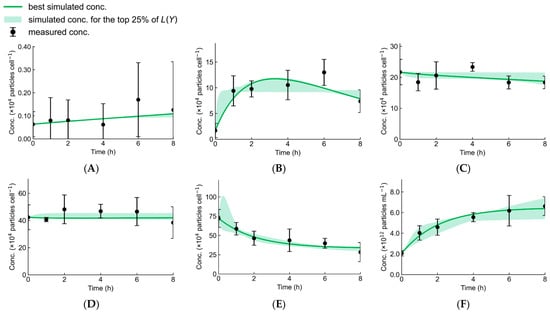
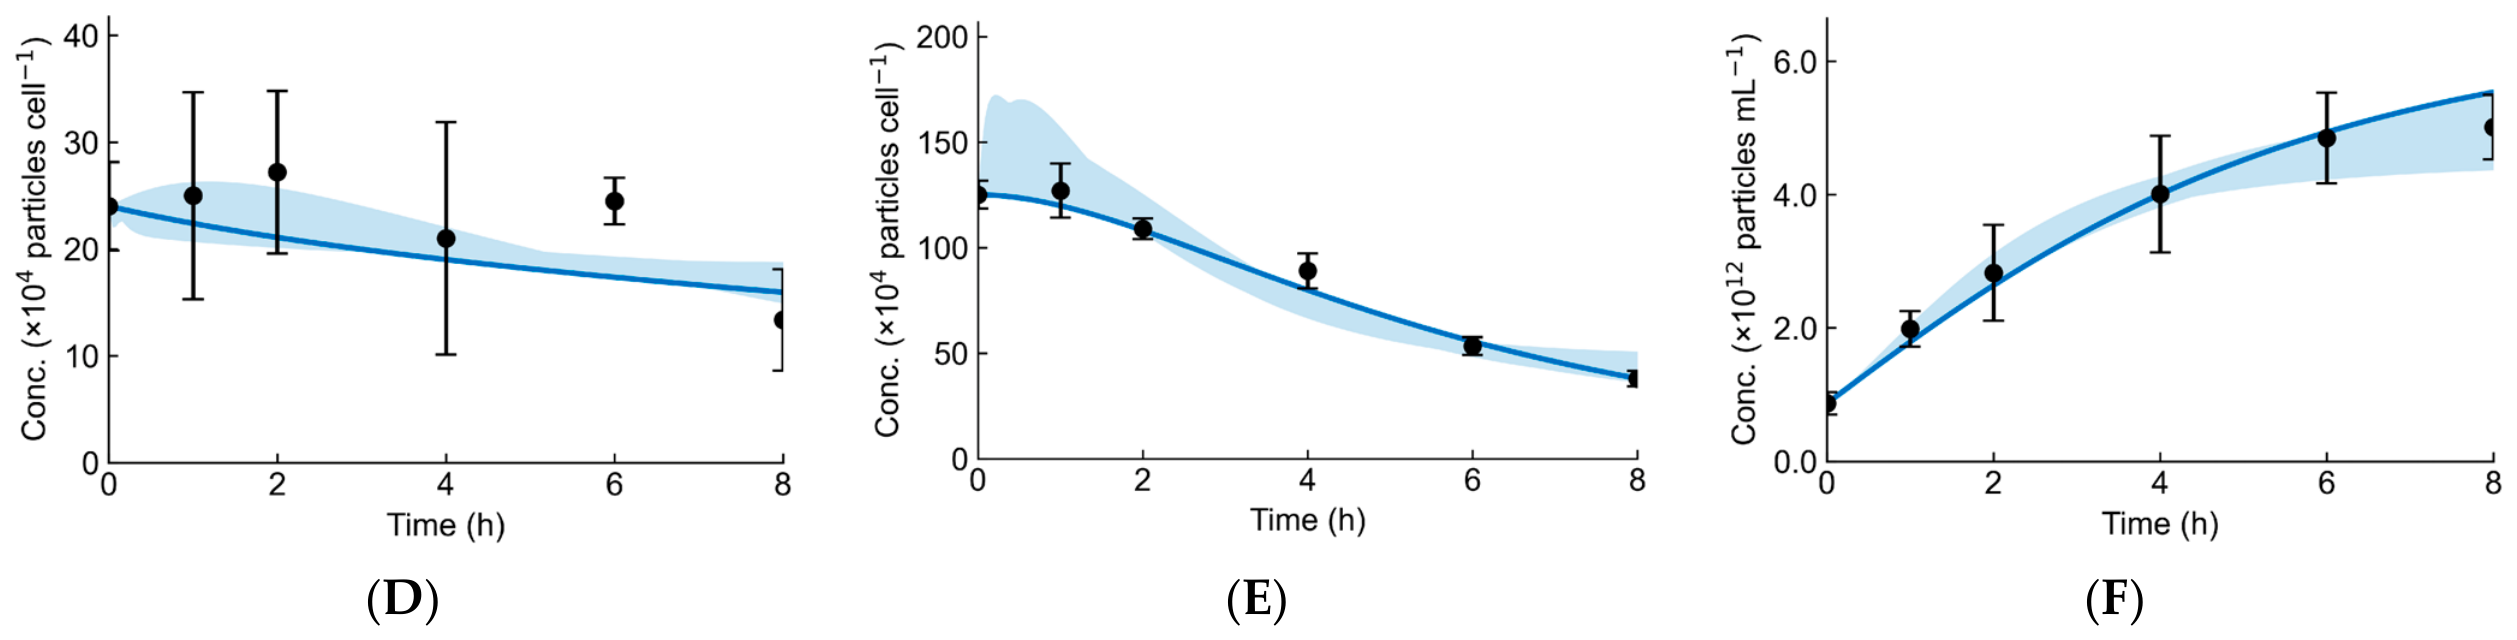
Figure 5, Figure 6 and Figure 7 show the predicted concentration changes of intracellular and extracellular antibodies and intermediates using the parameter set that yielded the lowest loss function (L(Y)) among the 100 independent optimization runs for each cell line.
Figure 5.
Predicted intracellular and extracellular antibody and intermediate concentrations during chase assay in CHO-Trsz cells, simulated using the best parameter set obtained from 100 independent optimization runs. (A) LC, (B) HCLC, (C) HC2, (D) HC2LC, (E) intracellular IgG (IgGI), and (F) extracellular IgG (IgGE). Solid lines represent the model predictions. Symbols represent the experimental data. The error bars represent the standard error of the mean from three independent cultures (n = 3). The band represents the range of concentrations estimated from the parameter sets corresponding to the lowest 25% of loss values obtained from 100 independent optimization runs. The loss values obtained from 100 independent optimization runs were split into two groups. Only the optimization runs belonging to the lower-loss group were included in the analysis.
Figure 6.
Predicted intracellular and extracellular antibody and intermediate concentrations during chase assay in CHO-Ritx cells, simulated using the best parameter set obtained from 100 independent optimization runs. (A) LC, (B) HCLC, (C) HC2, (D) HC2LC, (E) intracellular IgG (IgGI), and (F) extracellular IgG (IgGE). Solid lines represent the model predictions. Symbols represent the experimental data. The error bars represent the standard error of the mean from three independent cultures (n = 3). The band represents the range of concentrations estimated from the parameter sets corresponding to the lowest 25% of loss values obtained from 100 independent optimization runs. The loss values obtained from 100 independent optimization runs were split into two groups. Only the optimization runs belonging to the lower-loss group were included in the analysis.
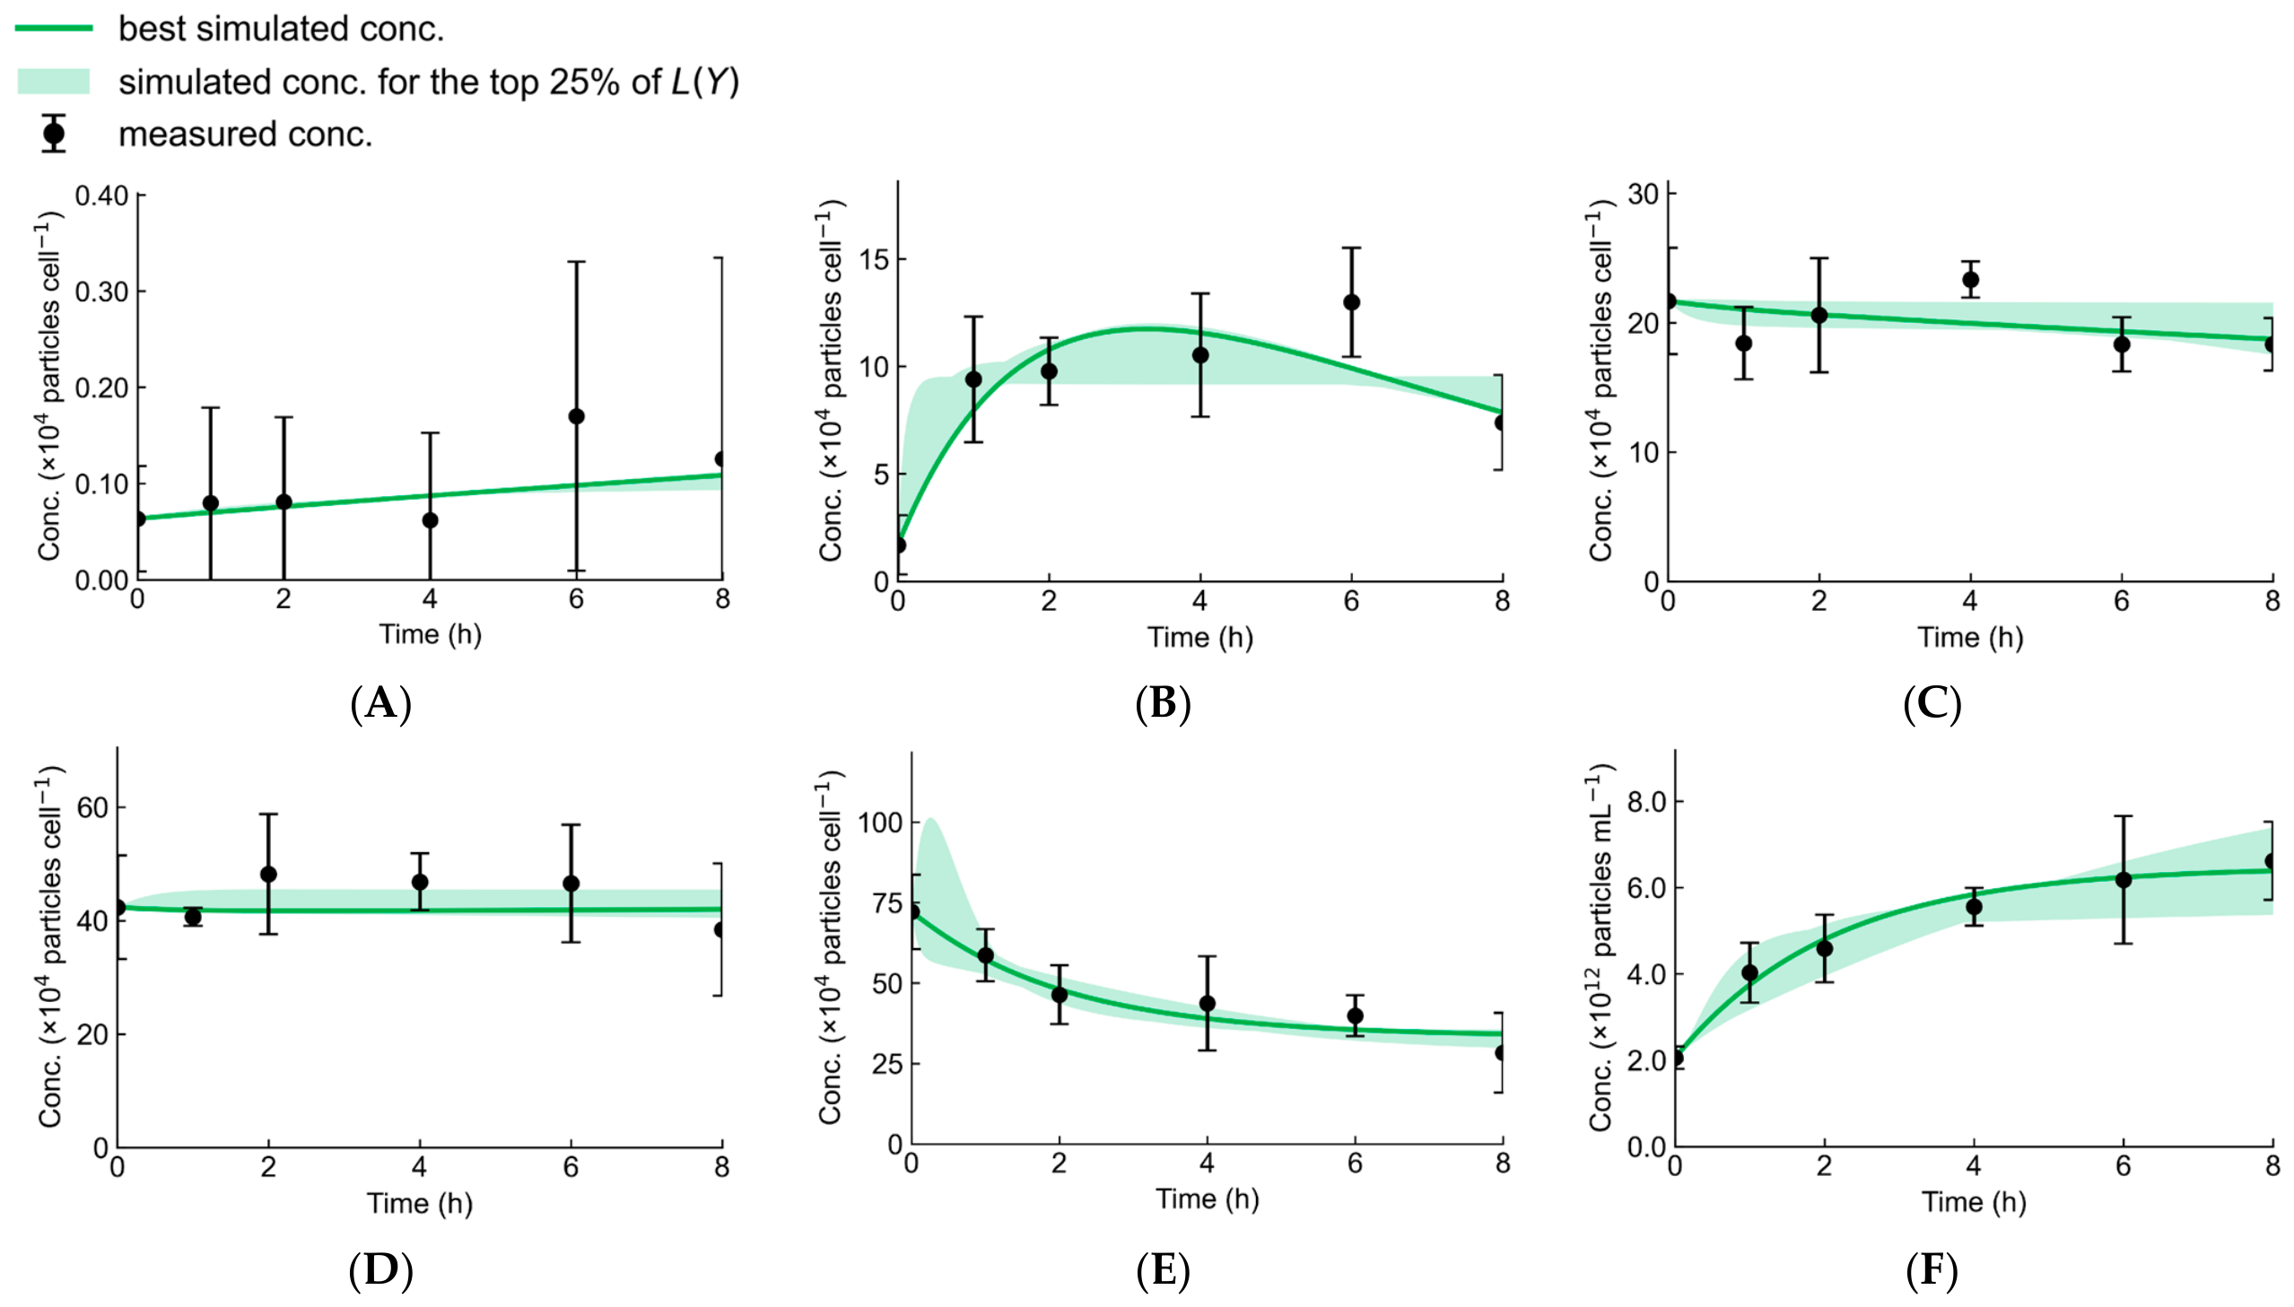
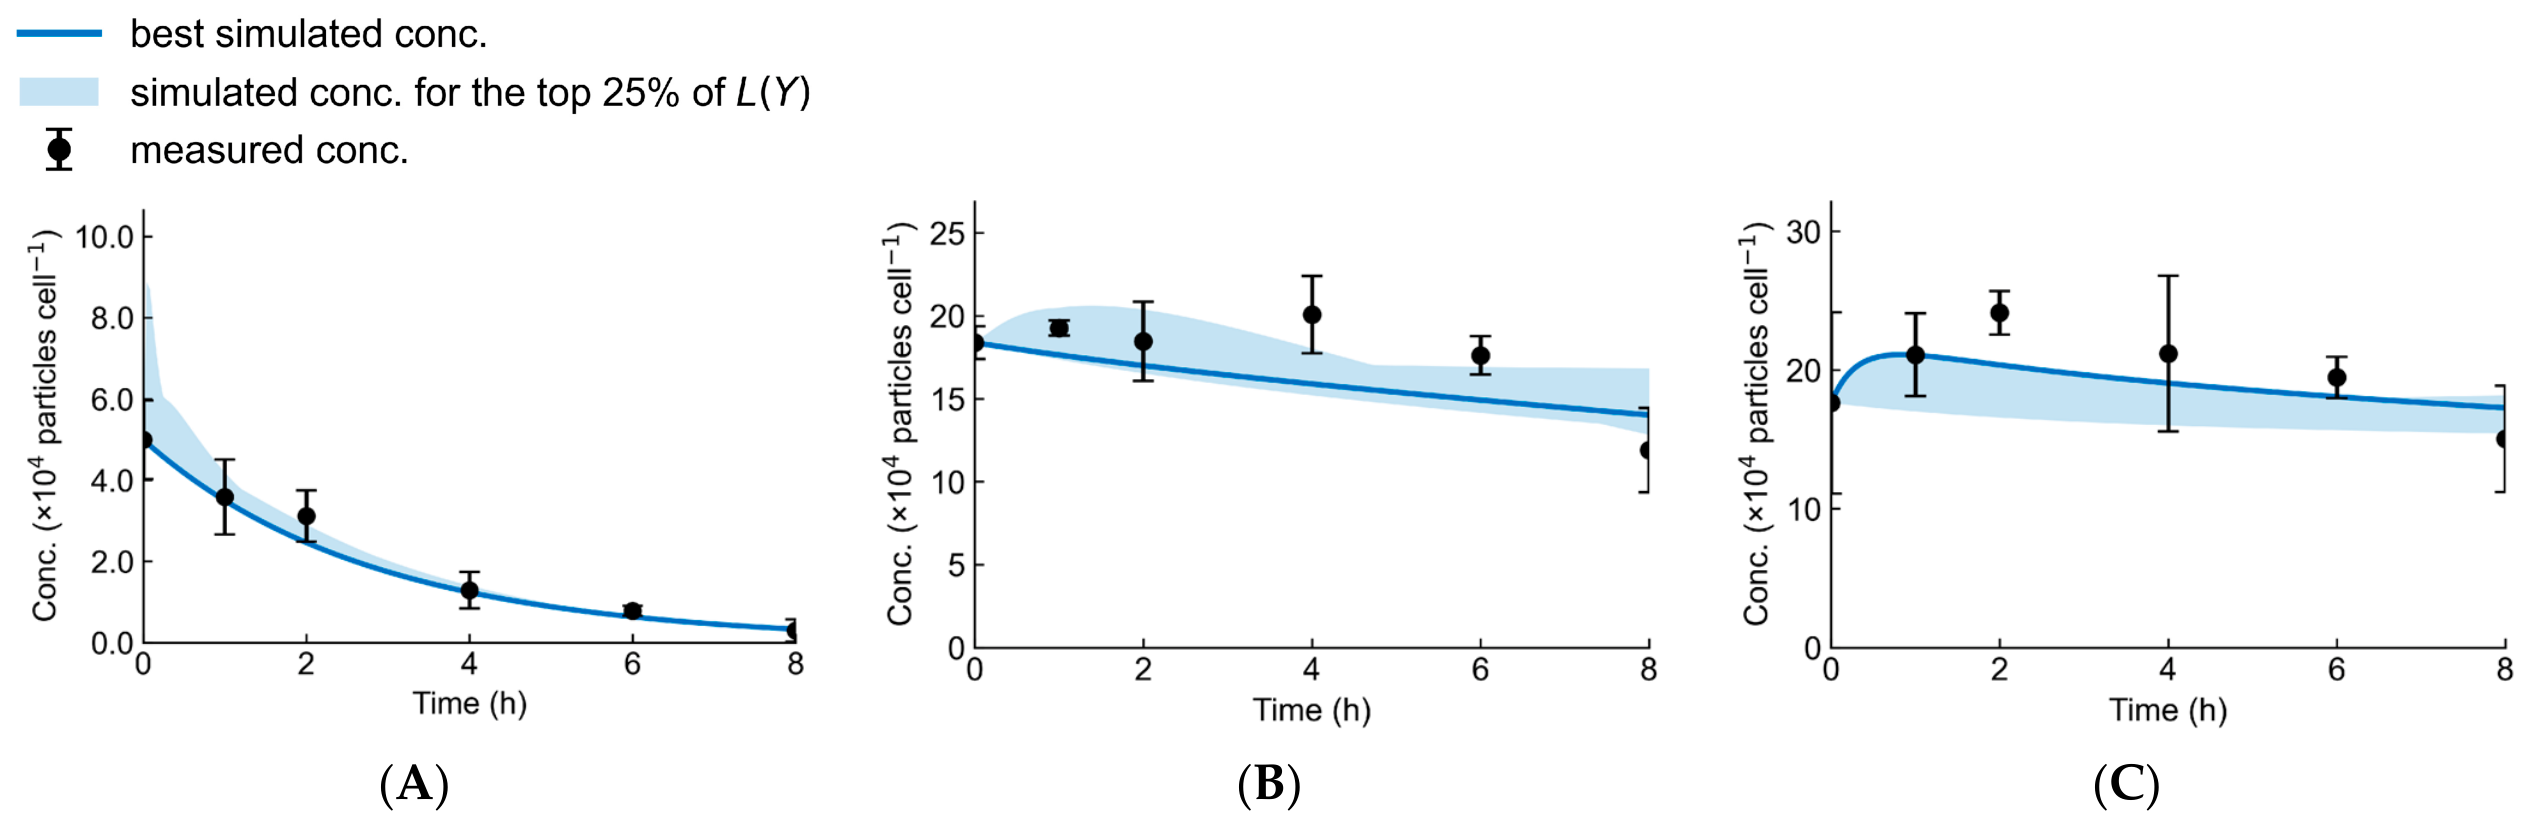
Figure 7.
Predicted intracellular and extracellular antibody and intermediate concentrations during chase assay in CHO-Bvcz cells, simulated using the best parameter set obtained from 100 independent optimization runs. (A) LC, (B) HCLC, (C) HC2, (D) HC2LC, (E) intracellular IgG (IgGI), and (F) extracellular IgG (IgGE). Solid lines represent the model predictions. Symbols represent the experimental data. The error bars represent the standard error of the mean from three independent cultures (n = 3). The band represents the range of concentrations estimated from the parameter sets corresponding to the lowest 25% of loss values obtained from 100 independent optimization runs.
In CHO-Trsz, it captured the plateau in HC2 concentration (Figure 5C), the decrease in HC2LC concentration (Figure 5D), and the plateau in extracellular IgG concentration after 4 h (Figure 5F). In CHO-Ritx, the model accurately reproduced the plateau in HC2LC concentration (Figure 6D) as well as the changes in intracellular and extracellular IgG concentrations (Figure 6E,F). In CHO-Bvcz, the model reproduced the exponential decrease in LC concentration (Figure 7A), the gradual decline in intracellular IgG concentration after 1 h of CHX treatment (Figure 7E), and the continuous increase in extracellular antibody concentration throughout the assay (Figure 7F). The model predicted a transient increase in intracellular IgG concentration immediately after CHX addition in CHO-Trsz, followed by a decrease within several tens of minutes (Figure 5E). Because the concentration changes between the measurement time points were not directly quantified, the predicted trajectories between these points were not directly validated by the available experimental data. When the number of estimated parameters is large relative to the number of experimental data points, the model behavior between measurement points may not be sufficiently constrained by the data. Therefore, caution should be exercised when interpreting such transient or rapid concentration changes.
For all cell lines, the model predictions generally reproduced the quantified concentration profiles of each molecular species over time. This indicates that the proposed model adequately describes the experimental time-course data, including those of antibody intermediates such as HC2 and HC2LC, which had not been considered previously. At some time points, the model predictions deviated from the experimental measurements, including the HC2LC concentration at 1 h in CHO-Trsz (Figure 5D), the HCLC concentration at 6 h in CHO-Ritx (Figure 6B), and the HC2 concentration at 2 h in CHO-Bvcz (Figure 7C). However, substantial variability was observed in some experimental measurements, as exemplified by the LC concentration in CHO-Ritx (Figure 6A), indicating that the reproducibility and/or quantitative precision of the measurements may have limited the accuracy of model fitting. It is also worth noting that, because the loss function is based on relative squared error (Equation (5)), the contribution of each measurement is normalized by its experimental value. Therefore, measurements with lower experimental concentrations can have a greater influence on the overall loss. Increasing the number of biological replicates and improving the precision of the quantitative methods may reduce experimental measurement uncertainty and further improve model fitting and predictive performance.
3.2.2. Quantitative Evaluation of the Secretion Process
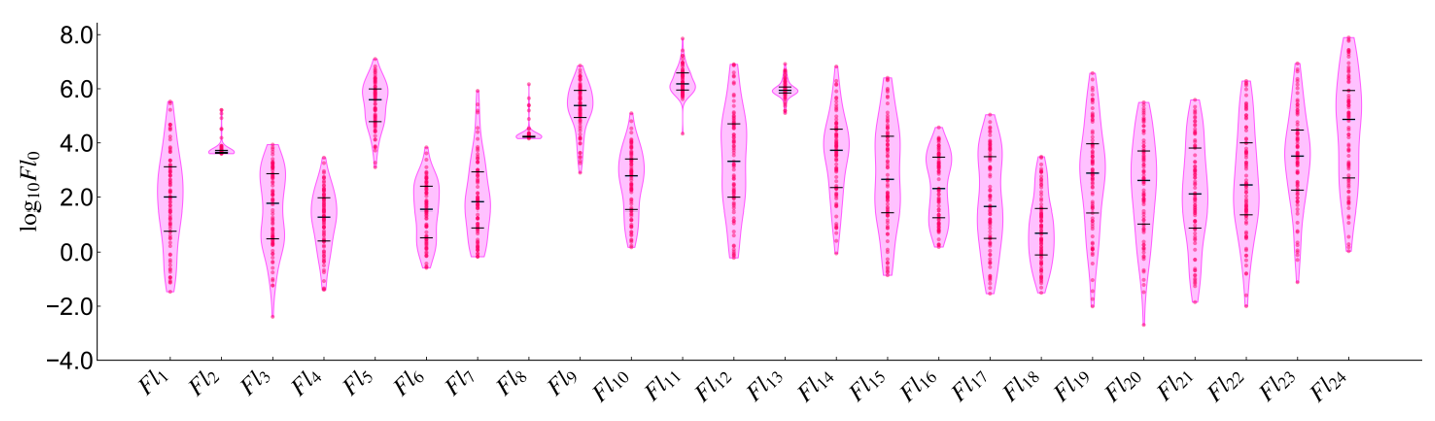
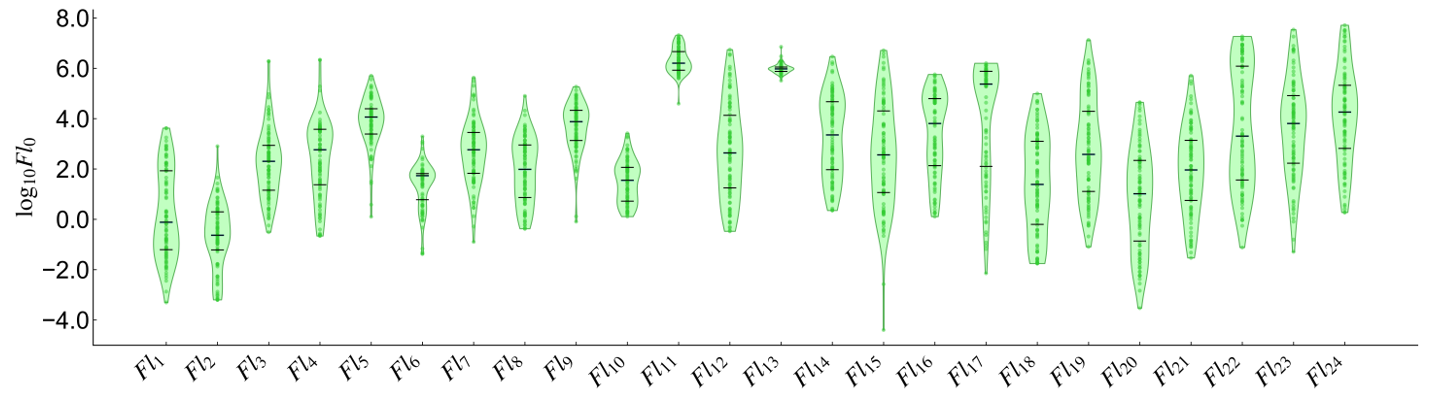
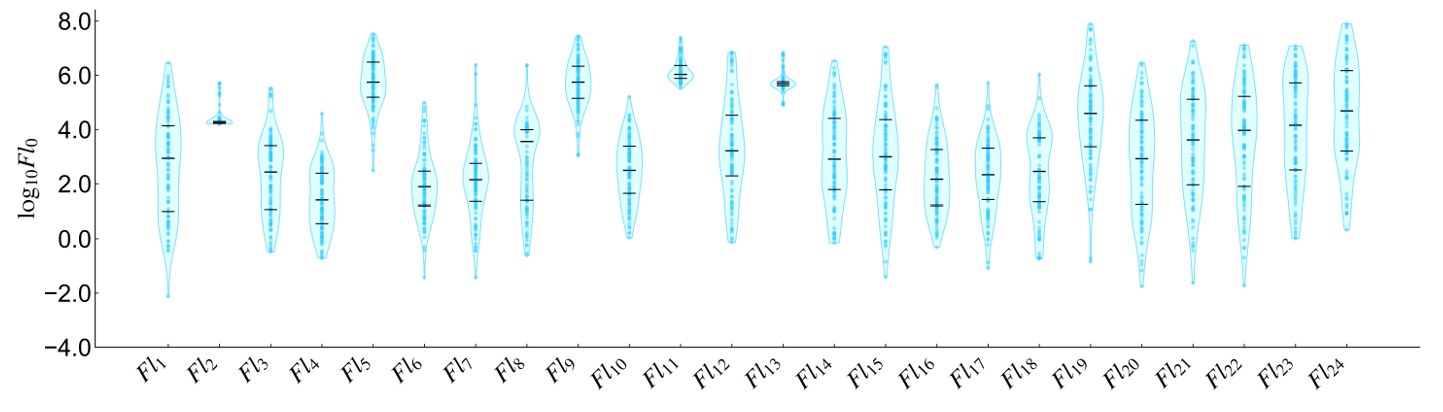
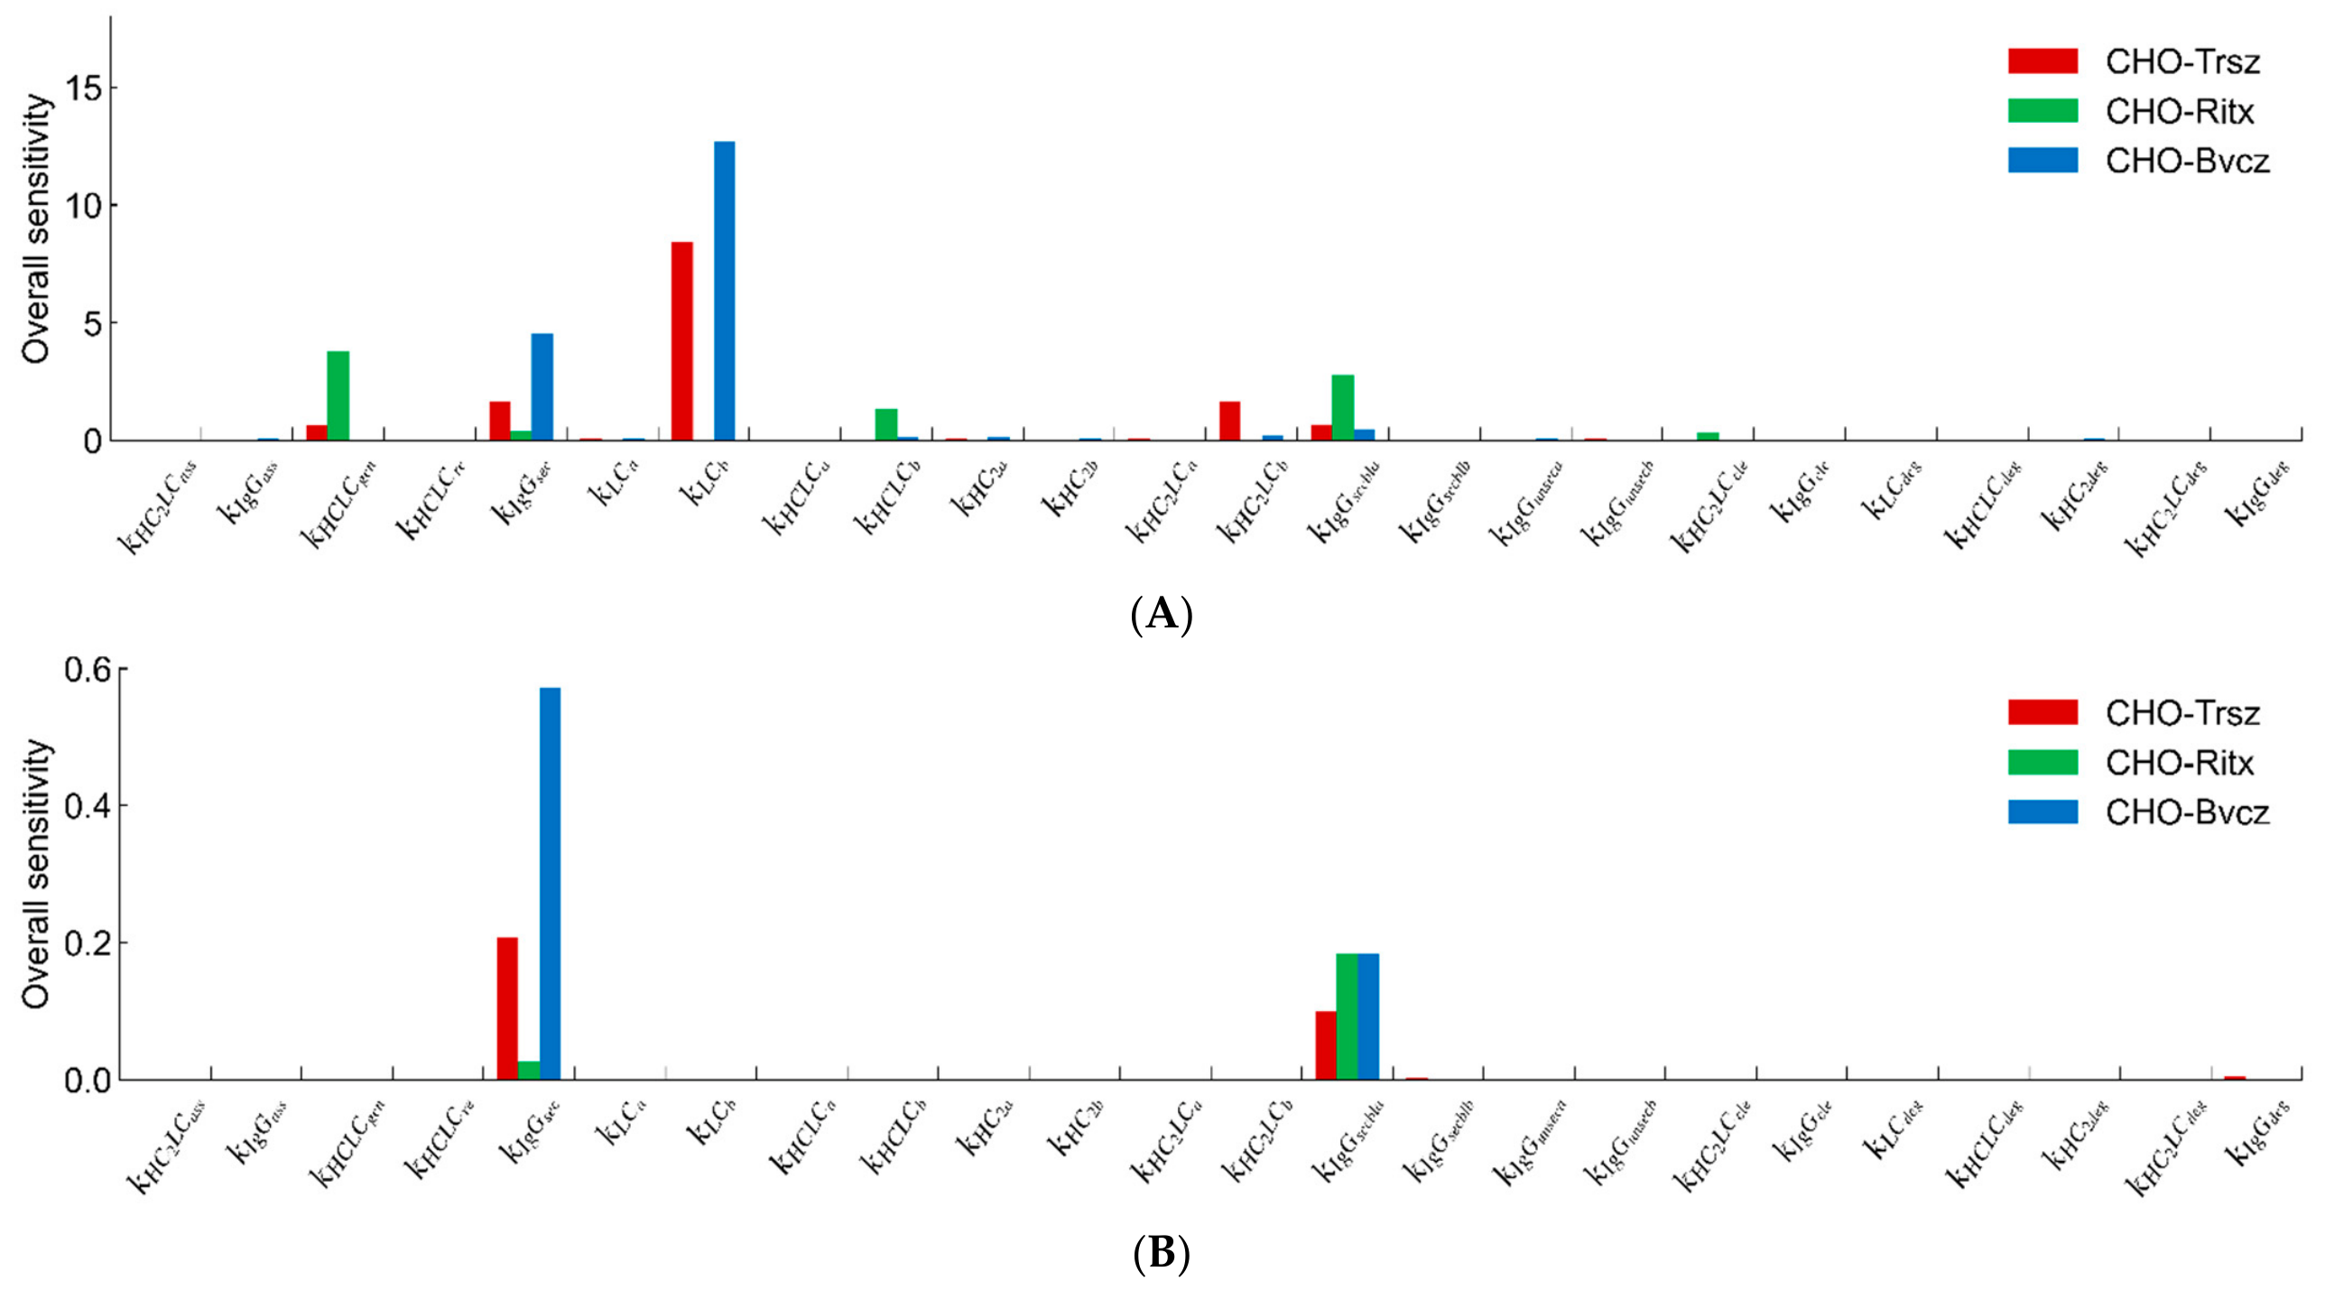
A total of 100 independent optimization runs were performed, and the resulting solutions were analyzed collectively to evaluate trends in the estimated parameters and fluxes. The distribution of loss values, L(Y), showed two clearly separated groups for CHO-Trsz and CHO-Ritx, whereas CHO-Bvcz showed no clear separation (Figure A2). Based on these separations, 85 runs yielded L(Y) ≤ 1.69 and the remaining 15 runs yielded L(Y) ≥ 2.61 for CHO-Trsz. For CHO-Ritx, 94 runs yielded L(Y) ≤ 1.45 and the remaining six runs yielded L(Y) ≥ 1.87. For CHO-Bvcz, all 100 runs yielded L(Y) ≤ 1.73. For subsequent analyses, only the parameter sets corresponding to the lower-loss group were used for CHO-Trsz and CHO-Ritx, as these provided a better fit to the experimental data, whereas all 100 runs were used for CHO-Bvcz. The estimated initial flux of mature IgG secretion into the extracellular space (Fl130) was comparable between CHO-Trsz and CHO-Ritx, with first quartile, median, and third quartile values of (69.5, 87.0, 115) and (74.9, 95.2, 111) × 104 particles cell−1 h−1, respectively. However, the first quartile, median, and third quartile values for CHO-Trsz and CHO-Ritx were 1.68–1.99 times higher than those of CHO-Bvcz based on the interquartile spread of parameter estimates across accepted PSO runs (Figure A6). Furthermore, the corresponding reaction rate constants for this reaction () were highest in CHO-Ritx, with values 1.80–3.95 times higher than those of CHO-Trsz and CHO-Bvcz, based on their first quartile, median, and third quartile values (Figure A4). Sensitivity analysis revealed that has a relatively high sensitivity compared to other parameters (Figure A7A), indicating that it is well constrained by the available data. Furthermore, is highly sensitive to extracellular IgG concentration (IgGE) (Figure A7B). This supports the use of and Fl130 (the product of and IgGsecbl at 0 h) to evaluate the secretion bottleneck. The higher observed in CHO-Ritx is consistent with this, suggesting it has the highest extracellular secretion capacity among the three cell lines. This aligns with previous studies in which Sar1A was overexpressed in these three cell lines [8,13]. While Sar1A overexpression increased the specific productivity of CHO-Trsz and CHO-Bvcz, it decreased the specific productivity of CHO-Ritx, suggesting that CHO-Ritx possesses relatively high secretory capacity. From these results, it can be inferred that for transport processes following the ER, the smaller the , the greater the bottleneck in the corresponding process. For relatively small values of , increasing the flux through overexpression of proteins that promote vesicular transport may increase the specific antibody production rate. Alternatively, knockdown of proteins that negatively regulate ER-to-Golgi transport, such as TBC1D20, may also alleviate these bottlenecks. TBC1D20 inactivates active Rab1, which promotes transport between the ER and the Golgi apparatus, and its knockdown may improve antibody productivity. Such alternative approaches may also help alleviate bottlenecks.
Despite the higher secretion rate constant in CHO-Ritx, the predicted secretion rate was nearly identical to that of CHO-Trsz. This discrepancy may be attributed to the larger fraction of intracellular antibodies lacking secretory capacity in CHO-Ritx. The estimated runsec (Figure A3) was lower in CHO-Trsz than in CHO-Ritx. The median values ranged from 0.192 to 0.368 for CHO-Trsz, whereas those of CHO-Ritx ranged from 0.408 to 0.539. This suggests that CHO-Trsz has a larger fraction of intracellular secretable IgG. Although post-translational modifications, such as glycosylation, were not incorporated into the present model, insufficient glycosylation may contribute to increased runsec and reduced secretion capacity. Furthermore, since the exchange between IgGunsec and IgGunq (Fl14, 15) (Figure A6) was estimated to occur at a slower flux than that of the normal secretory pathway for IgG (Fl13), it is believed that the proportion of these that are produced and reused is low. These findings demonstrate that model construction and parameter optimization enable quantitative evaluation of extracellular secretion capacity without the need for experimental perturbation of the secretion pathway.
In the assembly pathway from HC2 to IgG, the estimated initial fluxes (Fl50 and Fl90) were markedly lower in CHO-Ritx than in the other two cell lines, with first quartile, median, and third quartile values ranging from approximately 1/25 to 1/123 of those observed in CHO-Trsz and CHO-Bvcz (Figure A6). However, sensitivity analysis of extracellular IgG (IgGE) showed that the reaction rate constants related to assembly ( and ) had low sensitivity, with little effect on IgGE (Figure A7B). This suggests that the low estimated assembly fluxes should be interpreted with caution, as varying these low-sensitivity parameters could still provide similarly good fits. The sensitivity analysis in Figure A7 evaluates the sensitivity of only one parameter at a time, whereas improving assembly would change and simultaneously. Therefore, grouping parameters related to similar processes or performing sensitivity analysis with simultaneous parameter variation may allow a more accurate assessment of their influence. In addition, profile likelihood analysis may enable a more detailed analysis of parameter uncertainty. The use of CHX in the chase assay should also be considered when interpreting the model results. The present model assumes complete translation inhibition following CHX addition, which represents a potential limitation of the analysis. Although CHX has been shown to rapidly inhibit translation in CHO cells [35,36], a complete inhibition of translation does not occur. In addition, CHX may affect cellular processes beyond translation, which could influence the observed concentration profiles. Therefore, the estimated parameters and identified bottlenecks should be interpreted with these potential effects of CHX in mind. Although concentration profiles experimentally obtained from a CHX chase assay are required, the proposed modeling framework can evaluate the secretion process of other antibodies and cell lines without resorting to iterative cell engineering techniques. Compared with conventional approaches based solely on experimental cell engineering, this model may enable more efficient evaluation of the secretion process. Furthermore, applying this approach to difficult-to-express antibodies, next-generation antibodies such as bispecific antibodies, and other host cell systems may further broaden its applicability.
As discussed in Section 3.1.3, CHO-Ritx and CHO-Bvcz likely contain intracellular antibody species that were not explicitly represented in the present model. Previous studies have reported the formation of intracellular IgG dimers, higher-order aggregates, and light-chain aggregates in IgG1-producing CHO cells, some of which are subsequently secreted [45]. Incorporating the formation, degradation, and secretion of these aggregates may enable a more comprehensive representation of the antibody secretion process, thereby facilitating a more accurate evaluation of bottlenecks in the antibody secretion pathway. However, such model refinement will require experimental methods capable of accurately identifying and quantifying these molecular species. Furthermore, although the three clones examined in this study each expressed a different antibody, the observed differences may not be solely attributable to antibody-specific mechanisms, but could also reflect clone-to-clone variability independent of the antibody produced. Analyzing multiple clones expressing the same antibody would help determine whether the observed secretion bottlenecks arise from clonal differences or from antibody-specific properties.
Another limitation is the relatively large number of parameters compared with the available experimental observations. Reducing the number of estimated parameters may improve parameter identifiability. For example, the estimated initial flux of the cleavage reactions (Fl60 and Fl100) (Figure A6) were less than 1% of those of the mature IgG secretion reaction flux (Fl130) in all three cell lines. Likewise, several fluxes in which HC2 and HC2LC transition from an unquantified state to a quantified state (Fl3, Fl7) and the flux in which HCLC transitions to an unquantified state (Fl18) were also less than 1% in all cell lines. These observations suggest that some reactions may have only a minor influence on the observed concentration profiles and could potentially be omitted, thereby reducing the model parameters without substantially compromising model performance. However, removing these reactions would also eliminate mechanistic pathways required to explain experimentally observed changes in intermediate concentrations. For example, when BFA was added to inhibit vesicular transport between the ER and the Golgi, it was shown that in some clones of CHO-Trsz with secretory-related proteins knocked down, the intracellular concentrations of HC2 and HC2LC increased significantly [13]. While ignoring certain reactions and reducing the number of parameters can sometimes improve identifiability and lead to quantitative evaluation, this may result in a model that deviates from reality, potentially reducing its validity and generalizability. Another approach would be to increase the diversity of concentration change data and the number of measurement points, which could lead to more stable optimization and improve the quantitative identification of secretion bottlenecks. For example, by adding newly observed data on concentration changes in intracellular LC2, extracellular LC, and LC2, as well as the reactions associated with them, it may be possible to gain new insights into LC-related concentration changes. Furthermore, although not analyzed in this study, analyses of aggregates and glycan modifications might provide additional information regarding IgG secretion and aggregation. Additionally, using data on changes in the intracellular and extracellular concentrations of antibodies and intermediates when BFA is added in place of CHX to inhibit vesicular transport, either in conjunction with the current analysis or as a validation, could provide further constraints and enable the identification of parameters involved in the assembly reaction. However, incorporating additional experimental data will also require refinement of the model structure. For example, when using data from the BFA assay, unlike the chase assay, an interpretation of the translation rate is required. While it might be easy to incorporate this by assuming constant translation efficiency, BFA inhibits vesicular transport, causing secretory proteins, including IgG, to accumulate within the ER. This triggers the UPR, leading to a decrease in translation efficiency. Thus, it is necessary to introduce variables related to translation and appropriately represent changes in the translation rate.
Overall, further refinement of both the experimental measurements and the model structure will be necessary to improve parameter identifiability while maintaining biological processes. Such advances should enable more quantitative evaluation of antibody secretion and facilitate the rational identification of secretion bottlenecks in CHO cells.
4. Conclusions
This study focused on modeling the antibody secretion process in CHO cells, which has been insufficiently studied to date, and developed a kinetic model of the antibody secretion pathway. The proposed model integrates kinetic modeling with experimental data, providing an alternative to conventional validation methods based solely on experimental approaches. The model successfully reproduced changes in intracellular and extracellular antibody concentrations, as well as antibody assembly intermediates, following translation inhibition. Furthermore, for certain reactions, such as antibody secretion, the estimated reaction rate constants and initial flux suggest that secretion bottlenecks can be identified based on these quantitative indices. These predictions were consistent with previous studies in which secretion bottlenecks were experimentally alleviated. Therefore, the proposed model has the potential to facilitate the rational identification of secretion bottlenecks while reducing reliance on trial-and-error cell engineering. However, challenges remain in parameter identifiability, particularly for assembly-related processes, limiting the ability to quantitatively evaluate the entire antibody secretion pathway. Future refinement of the model through the appropriate modification of the modeled reactions and incorporation of additional experimental data may improve parameter identifiability and enable more reliable identification of secretion bottlenecks. Such improvements could facilitate the rational development of CHO cell lines with higher specific productivity.
Author Contributions
Conceptualization, A.S., S.J.O., Y.T., N.Y.-A. and T.O.; Methodology, A.S.; Software, A.S.; Formal Analysis, A.S.; Investigation, A.S.; Resources, T.O.; Data Curation, A.S.; Writing—Original Draft Preparation, A.S.; Writing—Review and Editing, A.S., S.J.O., Y.T., N.Y.-A. and T.O.; Visualization, A.S.; Supervision, S.J.O., Y.T., N.Y.-A. and T.O.; Funding Acquisition, T.O. All authors have read and agreed to the published version of the manuscript.
Funding
This research was funded by the Developing Key Technologies for Discovering and Manufacturing Pharmaceuticals Used for Next-Generation Treatments Program of the Japan Agency for Medical Research and Development (AMED), grant number JP21ae0121014, and by MEXT/JSPS KAKENHI, grant number JP22H00276.
Data Availability Statement
The original contributions presented in this study are included in the article. Further inquiries can be directed to the corresponding author.
Conflicts of Interest
The authors declare no conflicts of interest.
Appendix A. List of Primers and Probes
Table A1.
List of Primers.
Table A2.
List of Probes.
Appendix B. Optimization of the Specific Growth Rate Parameters
Initial parameter values were determined from the specific growth rate and growth inhibition timescale of untreated CHO cells. The search range for each parameter was set from 0.01 to 100 times each initial value. Parameter optimization was performed using the least_squares function in the scipy.optimize module by fitting the following loss function to the viable cell concentration obtained during the CHX chase assay.
Appendix C. Ordinary Differential Equations for the Antibody Secretion Kinetic Model
The total amounts of LC and HC at time t () are expressed by Equations (A14) and (A15).
Furthermore, the rates of change of the and at time t are given by Equations (A16) and (A17).
These equations verify mass conservation of HC and LC across synthesis, assembly, and secretion.
Appendix D. Mathematical Notations Used to Describe the Secretion Process
Table A3.
Definitions, Units, and Biological Meaning of Model Variables and Parameters.
Appendix E. Estimation of the Number of Molecules
The total number of HC and LC molecules per cell, based on quantitative values in the non-reducing condition, was calculated using Equation (A18):
where represents the concentration of the antibody or intermediate molecular species Y, calculated from samples prepared under non-reducing conditions at time t; is the number of HC or LC molecules contained in a single molecule of Y; is the molecular weight of Y; and is Avogadro’s number.
The total number of HC and LC molecules per cell, based on quantitative values in the reducing condition, was calculated using Equation (A19):
Appendix F. Implementation of Particle Swarm Optimization
To determine the optimal number of iterations and swarm size for PSO, two evaluations were performed using the CHO-Trsz experimental data:
- •
- PSO was performed with 50 iterations, 50 trials, and a swarm size of 200.
- •
- PSO was performed with three swarm sizes (100, 200, and 400), 50 trials, and 50 iterations.
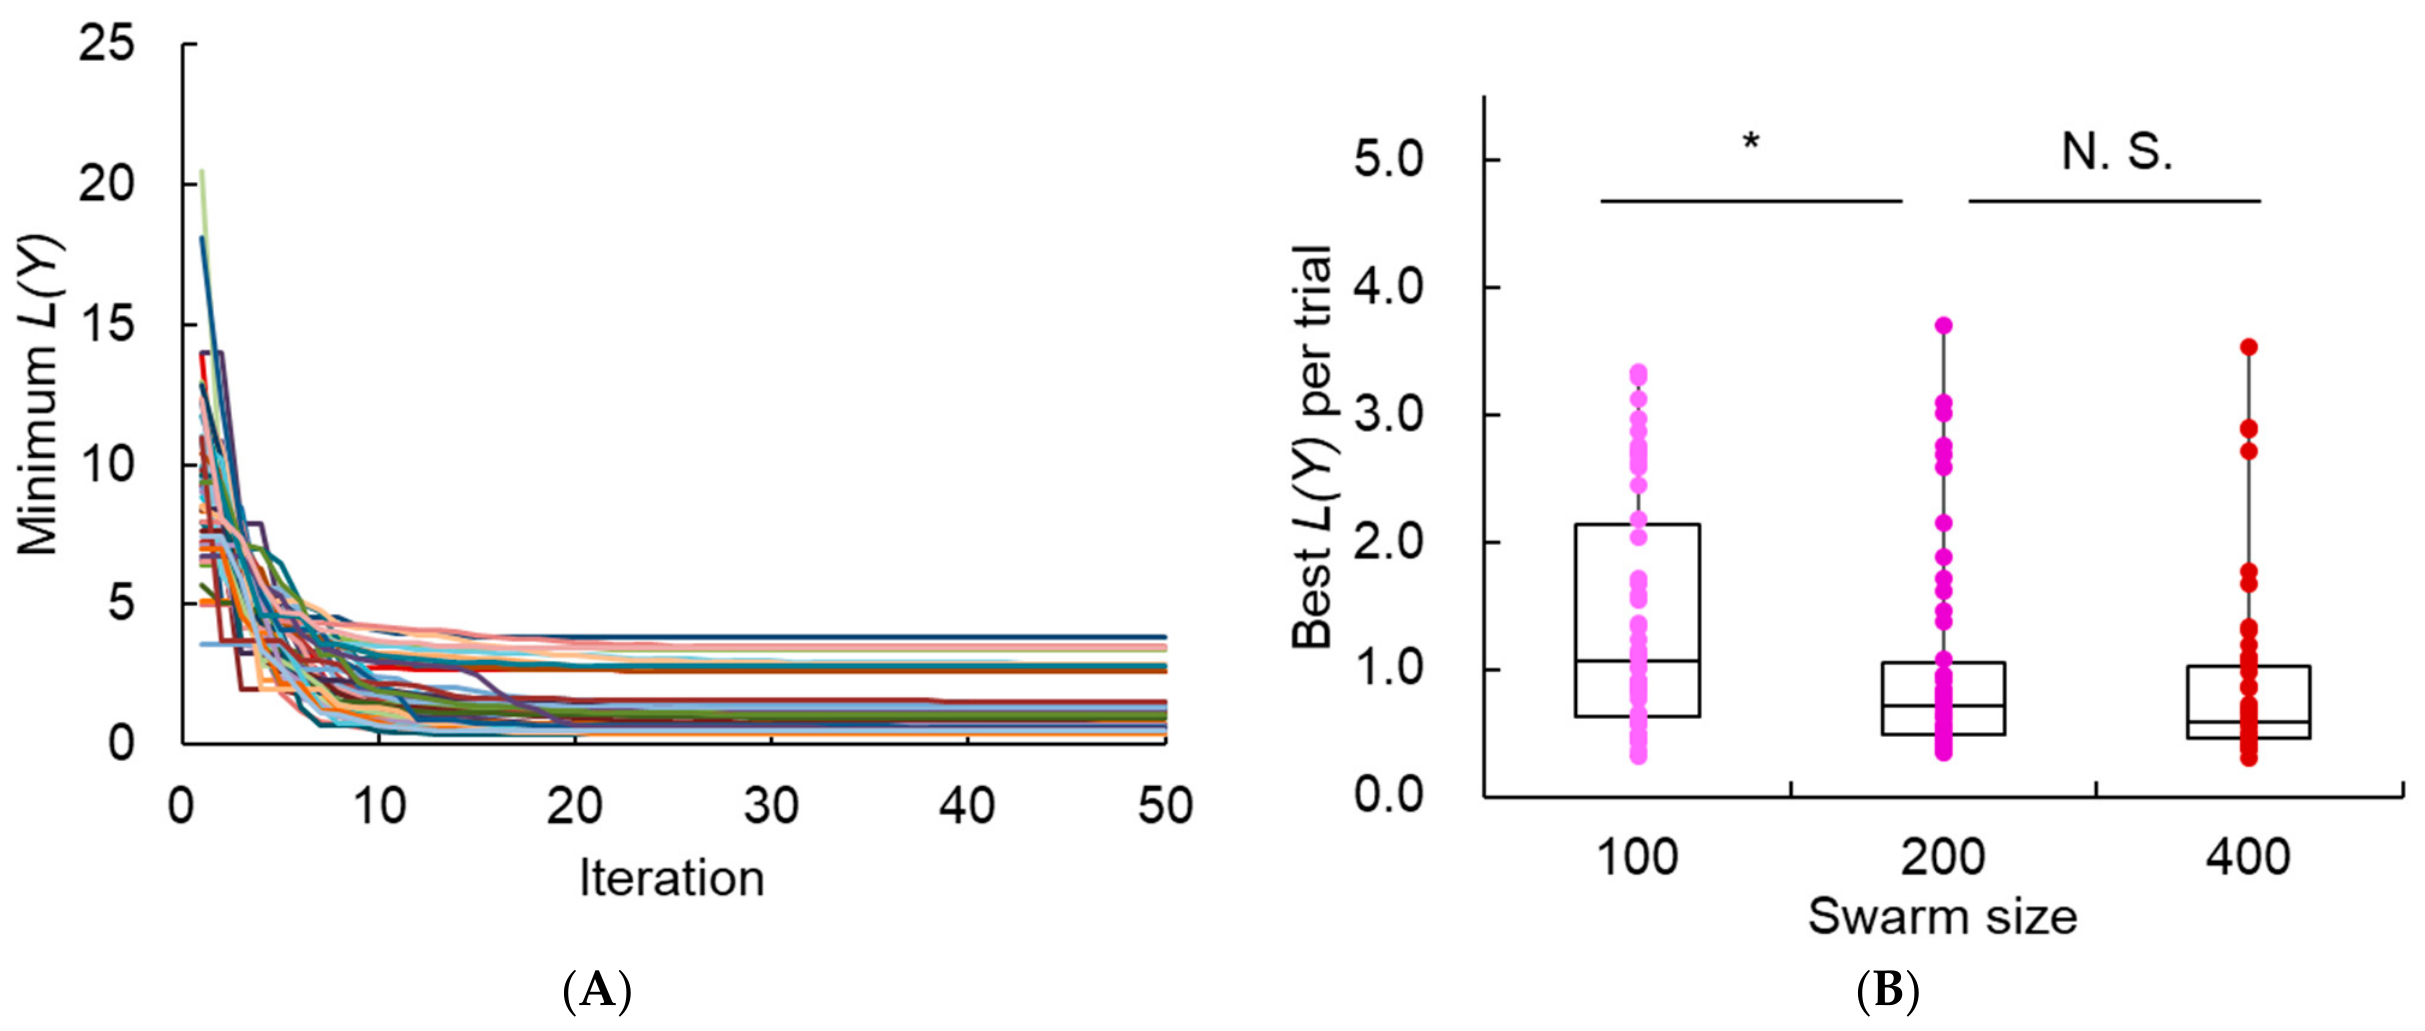
The results showed that the value of the loss function, L(Y), changed rapidly between 0 and approximately 10 iterations, whereas little change was observed after 30 iterations (Figure A1A). Furthermore, the Brunner–Munzel test [46] was performed on the distributions of L(Y) obtained with different swarm sizes (Figure A1B). A significant difference was observed between swarm sizes of 100 and 200, whereas no significant difference was observed between 200 and 400. Therefore, the number of iterations and swarm size were set to 30 and 200, respectively.
Figure A1.
PSO results for determining the number of iterations and swarm size using CHO-Trsz experimental data. (A) Minimum L(Y) at each iteration across 50 independent PSO trials with 50 iterations. (B) Minimum L(Y) across 50 independent PSO trials for swarm sizes of 100, 200, and 400. Statistical significance was assessed using the Brunner–Munzel test with a threshold of p < 0.05. * p < 0.05, N.S., not significant.
The search range for the 30 parameters of the secretion model was set as indicated in Table A4. Parameter optimization was performed using PSO by fitting the model to the experimental data obtained from the CHX chase assay.
Table A4.
Lower and Upper Search Bounds for the 30 Parameters of the Secretion Model.
Appendix G. Distribution of the Multiple Optimization Runs
Figure A2.
Distribution of the loss values (L(Y)) obtained from 100 optimization runs using the experimental concentration change data of intracellular and extracellular IgG and intermediates for CHO-Trsz, CHO-Ritx, and CHO-Bvcz.
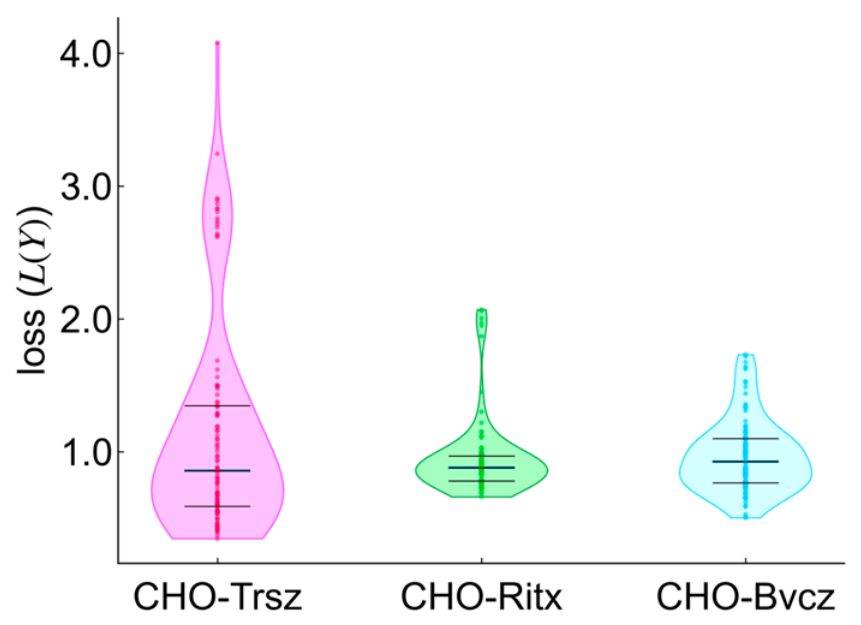
Figure A3.
Distribution of the optimized non-secretable antibody values () obtained from independent optimization runs using the experimental concentration change data for CHO-Trsz, CHO-Ritx, and CHO-Bvcz, respectively. For cases where the distribution of loss values obtained from 100 independent optimization runs was split into two groups, only the optimization runs belonging to the lower-loss group were included in the analysis.
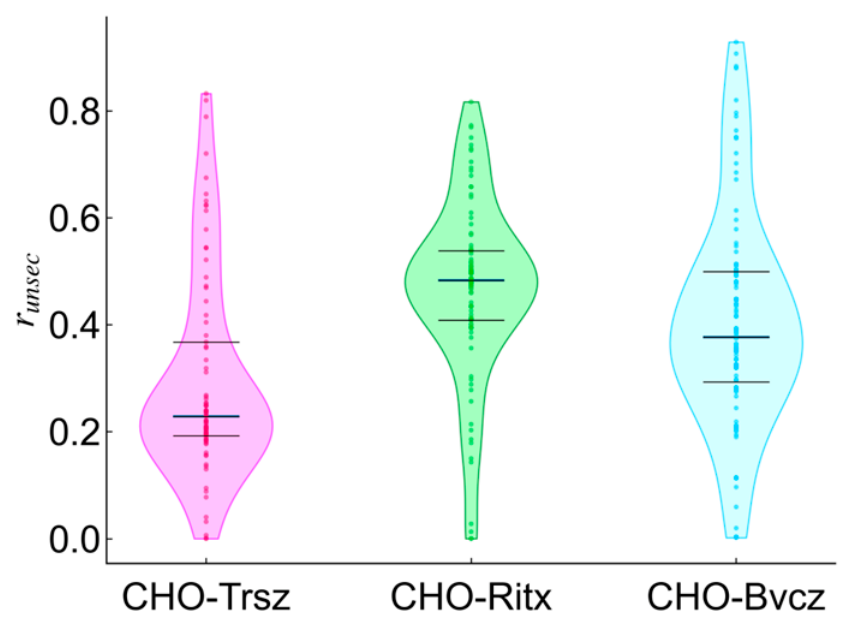
Figure A4.
Distribution of the optimized reaction rate constants (k) obtained from independent optimization runs using the experimental concentration change data for (A) CHO-Trsz, (B) CHO-Ritx, and (C) CHO-Bvcz. The unshaded plots indicate first-order reaction rate constants, while the shaded plots indicate second-order reaction rate constants. For cases where the distribution of loss values obtained from 100 independent optimization runs was split into two groups, only the optimization runs belonging to the lower-loss group were included in the analysis.
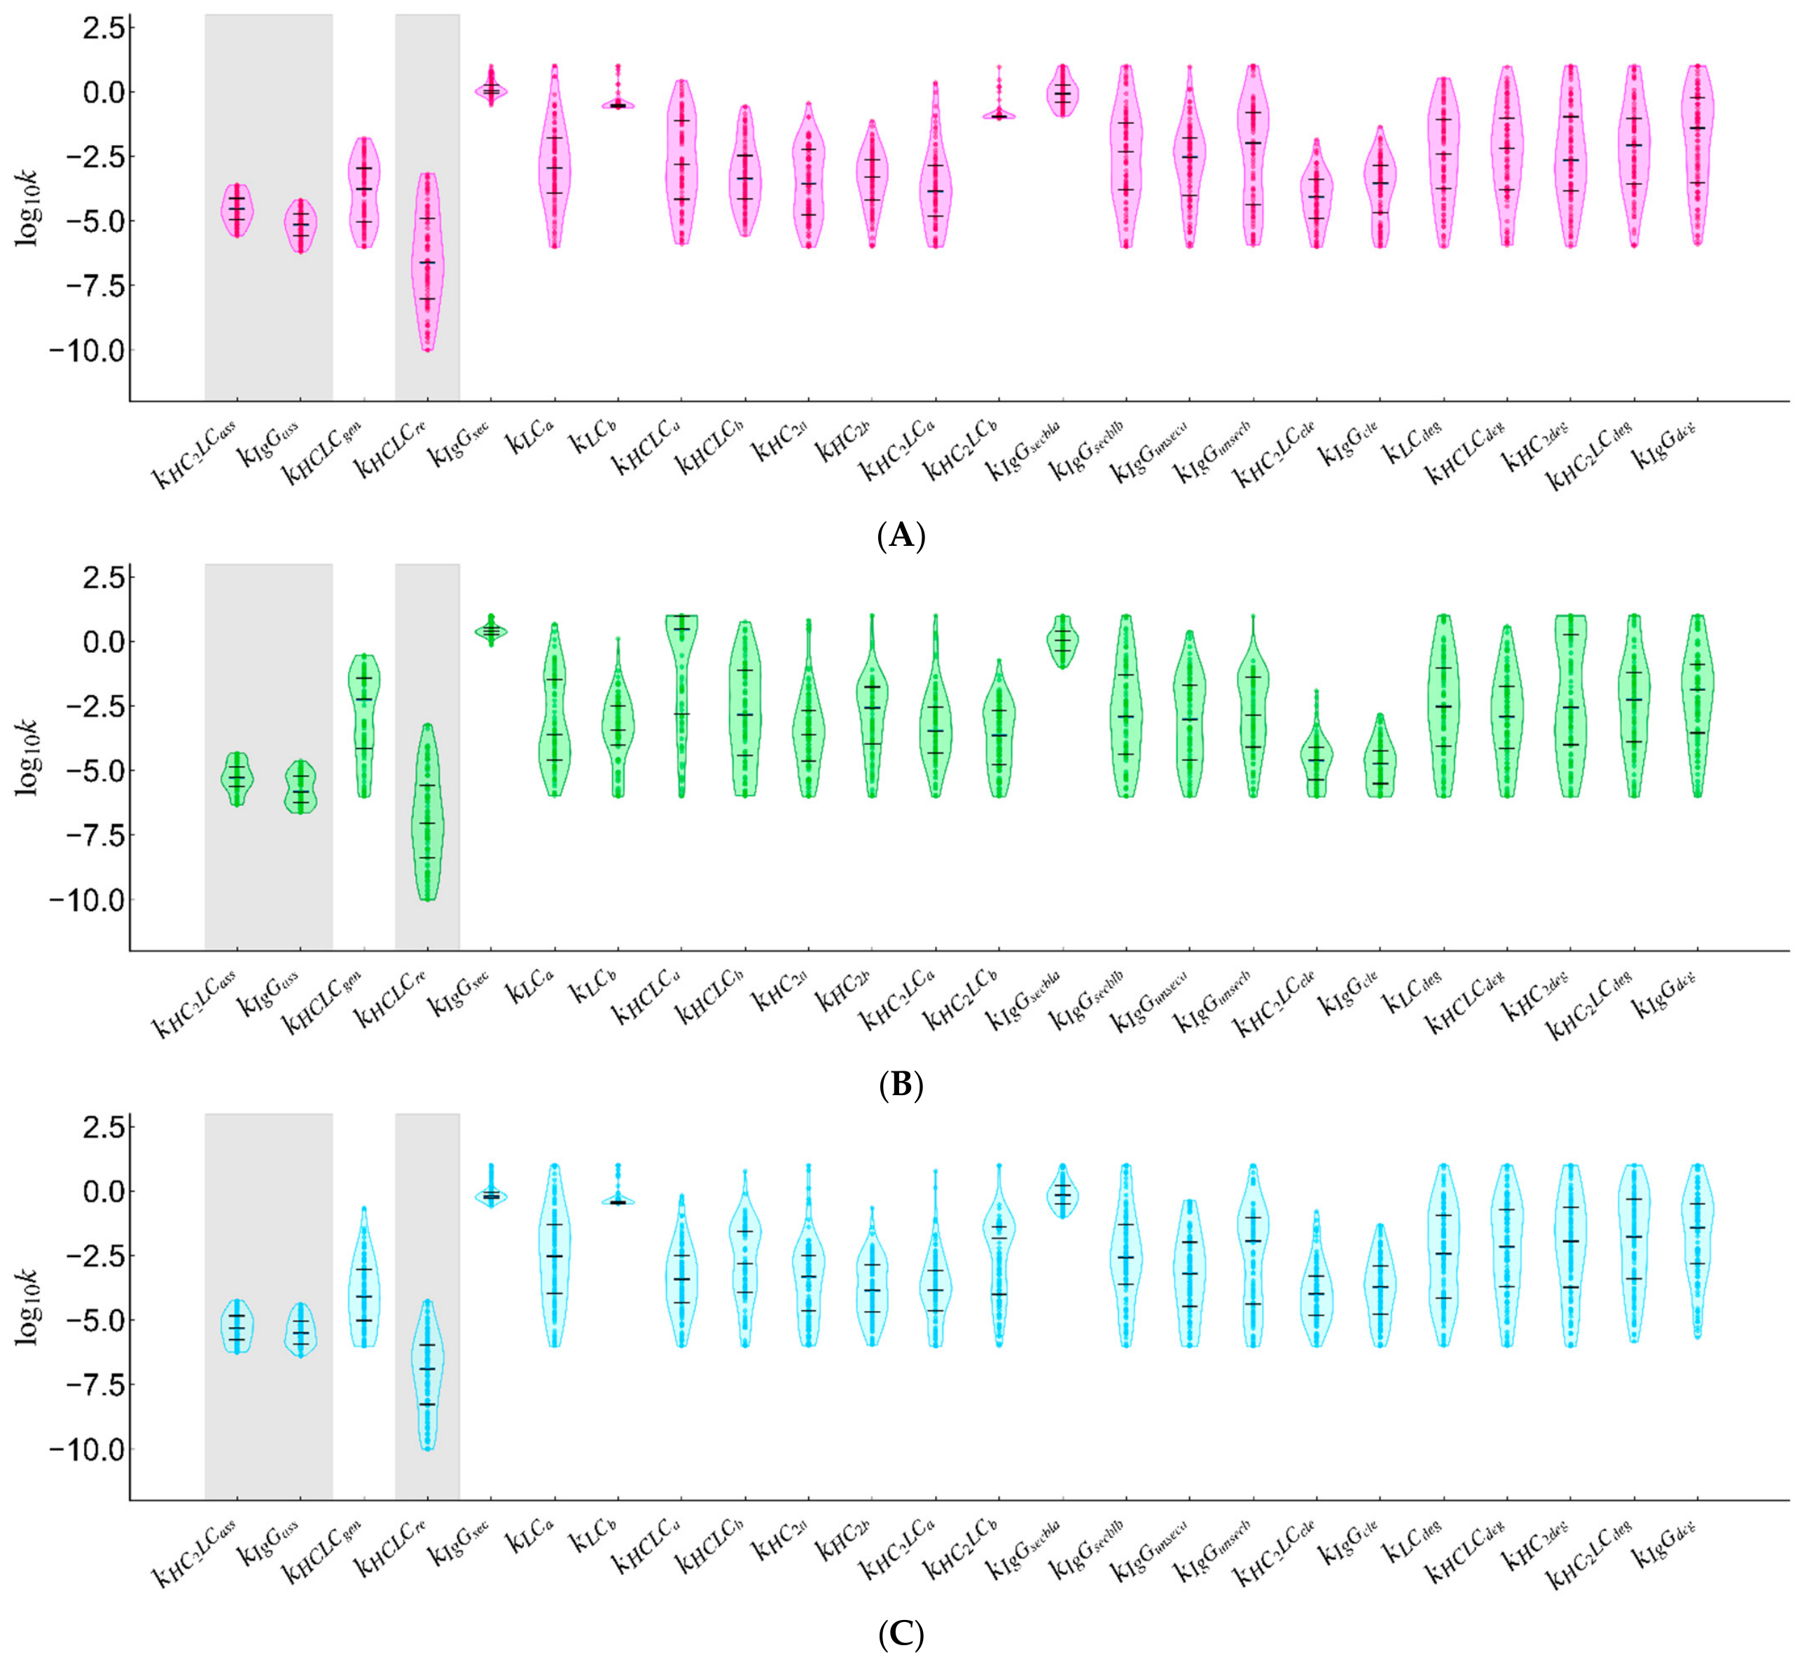
Figure A5.
Distribution of the optimized initial concentrations of non-quantifiable antibodies and intermediates (LCunq, HCLCunq, HC2unq, HC2LCunq, IgGunq) obtained from independent optimization runs using the experimental concentration change data for (A) CHO-Trsz, (B) CHO-Ritx, and (C) CHO-Bvcz. For cases where the distribution of loss values obtained from 100 independent optimization runs was split into two groups, only the optimization runs belonging to the lower-loss group were included in the analysis.
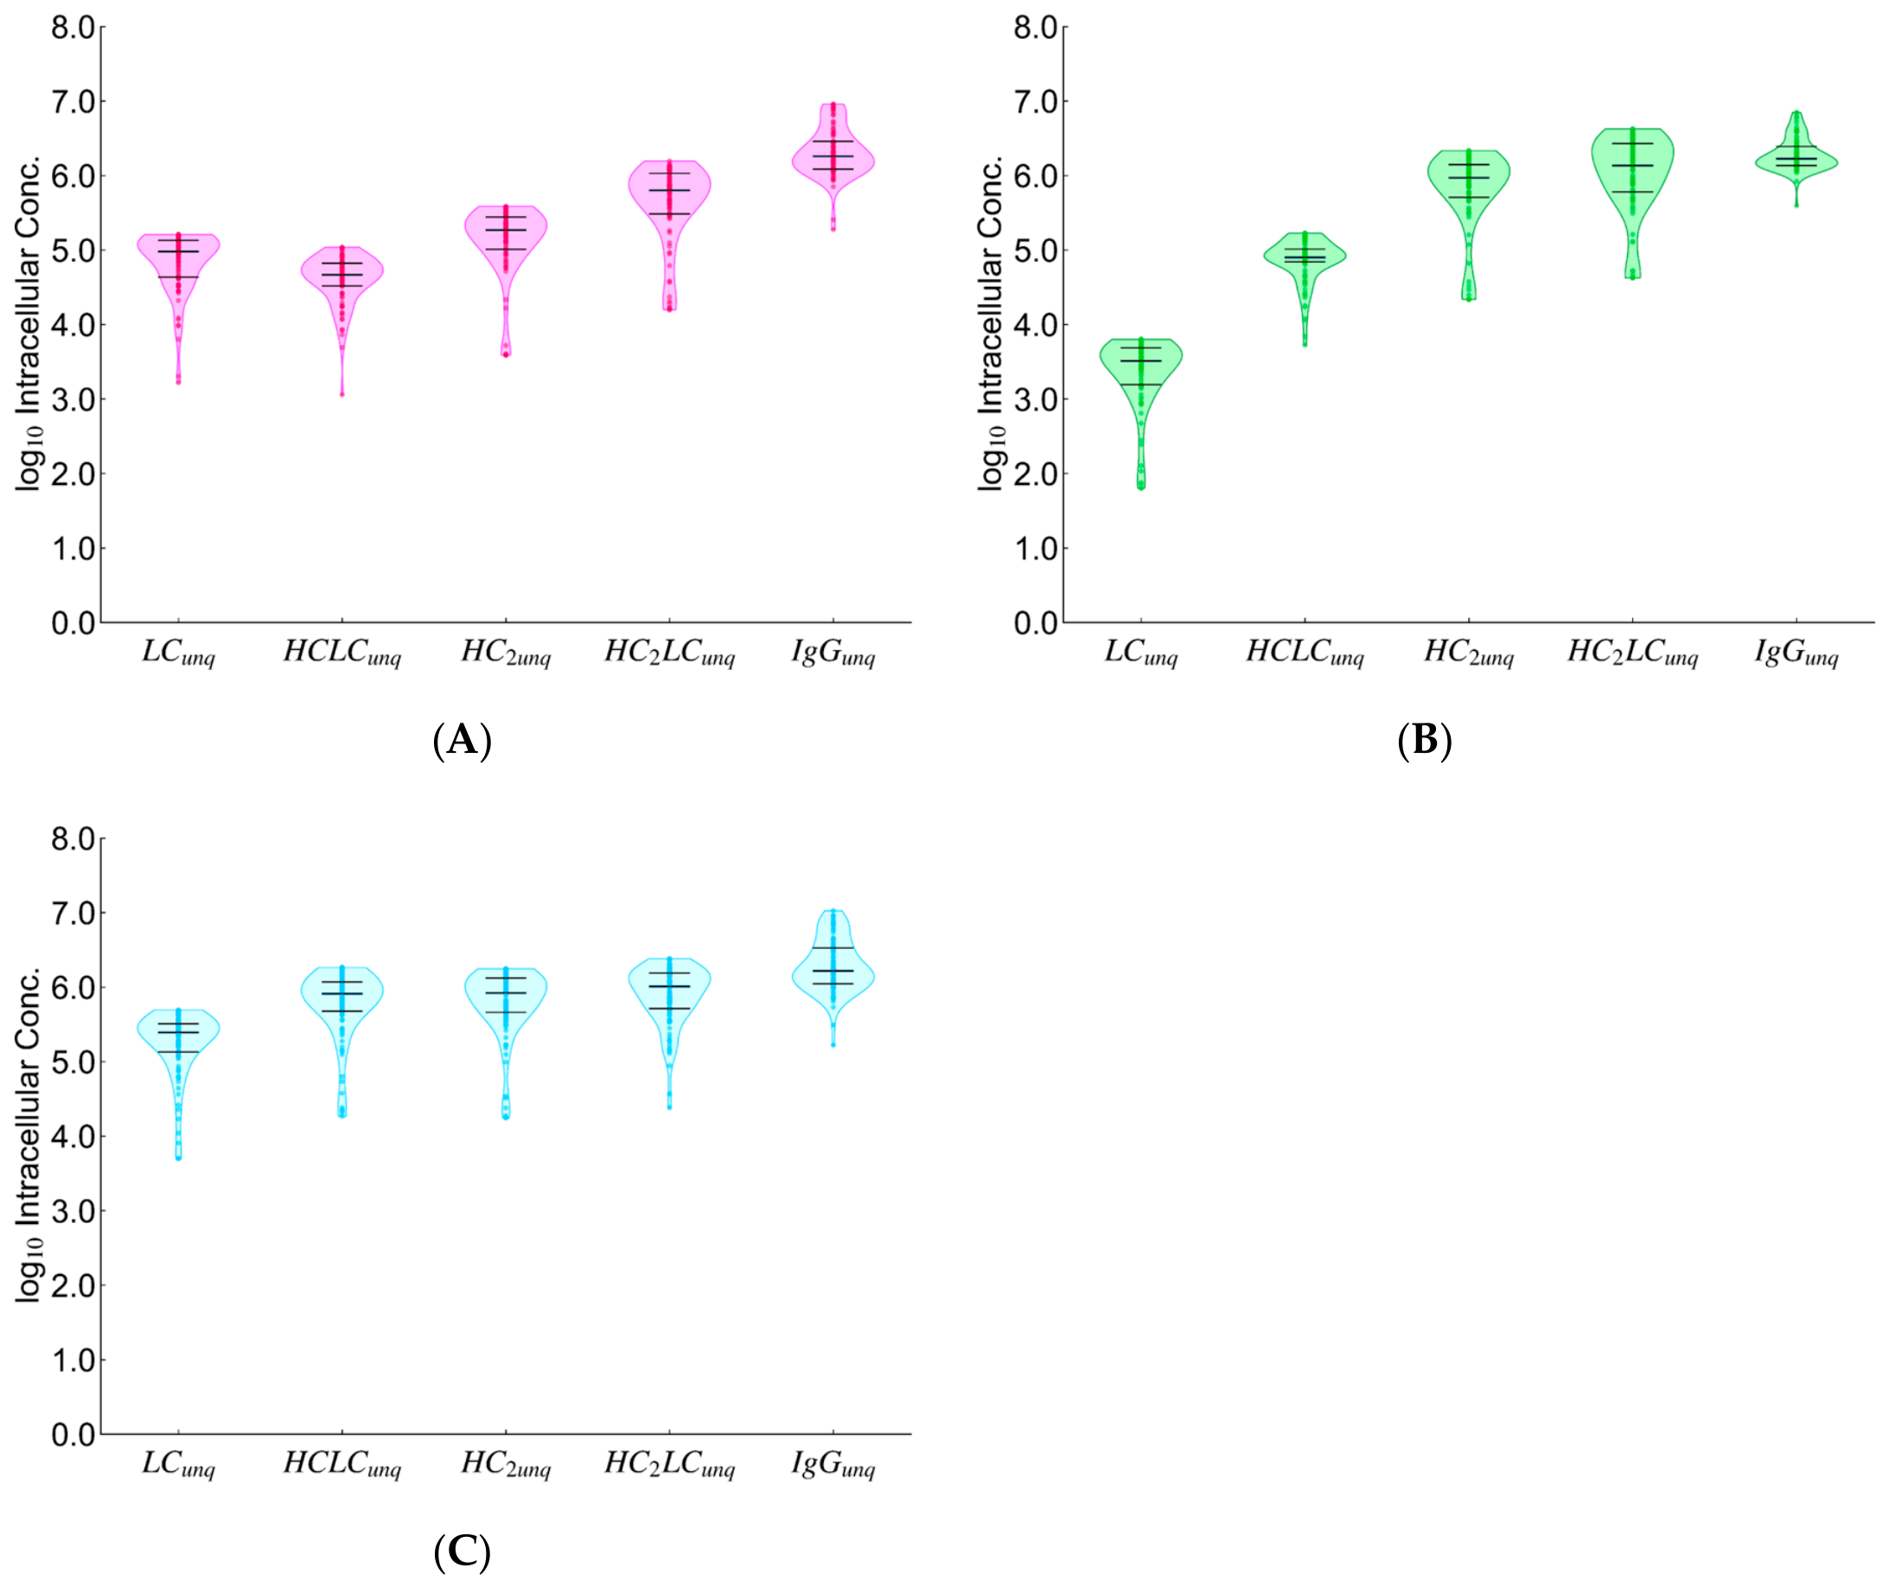
Figure A6.
Distribution of the initial reaction rates estimated from the optimized reaction rate constants (Figure A3, Figure A4 and Figure A5) and the quantified intracellular antibody and initial intermediate concentrations (Figure 3A–F). The vertical axis shows the natural logarithm of the initial reaction rates. The numbers associated with each Fl correspond to the reaction numbers in Figure 1.
Appendix H. Sensitivity Analysis
A local sensitivity analysis [47] was performed to identify the parameters with the greatest influence on the model output. The dimensionless sensitivity coefficient at time with respect to parameter was defined by Equation (A20), and the corresponding sensitivity analysis objective function by Equation (A21).
Using a first-order Taylor expansion with a small perturbation , Equation (A22) was obtained.
With = 0.01, Figure A6A shows , the sum of the sensitivity coefficients for reaction rate constants at t = 0, 1, 2, 4, 6 and 8 h across all quantified components within the model (LC, HCLC, HC2, HC2LC, IgGI, and IgGE). Figure A6B shows the corresponding sum for extracellular secreted IgG (IgGE), .
Figure A7.
Sum of local sensitivity coefficients at t = 0, 1, 2, 4, 6, and 8 h, obtained by varying each of the 24 reaction rate constant parameters by ±1% for (A) all observed components used in model construction (LC, HCLC, HC2, HC2LC, IgGI, IgGE) and (B) extracellularly secreted IgG (IgGE), alone.
References
- Cunha, D.R.; Quinaz, M.B.; Segundo, M.A. Biopharmaceutical analysis—Current analytical challenges, limitations, and perspectives. Anal. Bioanal. Chem. 2026, 418, 373–394. [Google Scholar] [CrossRef] [Scilit] [PubMed]
- Walsh, G.; Walsh, E. Biopharmaceutical benchmarks 2022. Nat. Biotechnol. 2022, 40, 1722–1760. [Google Scholar] [CrossRef] [Scilit] [PubMed]
- Li, F.; Vijayasankaran, N.; Shen, A.; Kiss, R.; Amanullah, A. Cell culture processes for monoclonal antibody production. mAbs 2010, 2, 466–479. [Google Scholar] [CrossRef] [Scilit] [PubMed]
- Kaufman, R.J.; Sharp, P.A. Amplification and expression of sequences cotransfected with a modular dihydrofolate reductase complementary dna gene. J. Mol. Biol. 1982, 159, 601–621. [Google Scholar] [CrossRef] [Scilit] [PubMed]
- Bebbington, C.R.; Renner, G.; Thomson, S.; King, D.; Abrams, D.; Yarranton, G.T. High-level expression of a recombinant antibody from myeloma cells using a glutamine synthetase gene as an amplifiable selectable marker. Nat. Biotechnol. 1992, 10, 169–175. [Google Scholar] [CrossRef] [Scilit] [PubMed]
- Running Deer, J.; Allison, D.S. High-level expression of proteins in mammalian cells using transcription regulatory sequences from the Chinese hamster EF-1alpha gene. Biotechnol. Prog. 2004, 20, 880–889. [Google Scholar] [CrossRef] [Scilit] [PubMed]
- Brown, A.J.; Sweeney, B.; Mainwaring, D.O.; James, D.C. Synthetic promoters for CHO cell engineering. Biotechnol. Bioeng. 2014, 111, 1638–1647. [Google Scholar] [CrossRef] [Scilit] [PubMed]
- Tsunoda, Y.; Yamano-Adachi, N.; Koga, Y.; Omasa, T. Sar1A overexpression in Chinese hamster ovary cells and its effects on antibody productivity and secretion. J. Biosci. Bioeng. 2024, 138, 171–180. [Google Scholar] [CrossRef] [Scilit] [PubMed]
- Kirimoto, Y.; Yamano-Adachi, N.; Koga, Y.; Omasa, T. Effect of co-overexpression of the cargo receptor ERGIC-53/MCFD2 on antibody production and intracellular IgG secretion in recombinant Chinese hamster ovary cells. J. Biosci. Bioeng. 2023, 136, 400–406. [Google Scholar] [CrossRef] [Scilit] [PubMed]
- Borth, N.; Mattanovich, D.; Kunert, R.; Katinger, H. Effect of increased expression of protein disulfide isomerase and heavy chain binding protein on antibody secretion in a recombinant CHO cell line. Biotechnol. Prog. 2005, 21, 106–111. [Google Scholar] [CrossRef] [Scilit] [PubMed]
- Mohan, C.; Lee, G.M. Effect of inducible co-overexpression of protein disulfide isomerase and endoplasmic reticulum oxidoreductase on the specific antibody productivity of recombinant Chinese hamster ovary cells. Biotechnol. Bioeng. 2010, 107, 337–346. [Google Scholar] [CrossRef] [Scilit] [PubMed]
- Torres, M.; Hussain, H.; Dickson, A.J. The secretory pathway—The key for unlocking the potential of Chinese hamster ovary cell factories for manufacturing therapeutic proteins. Crit. Rev. Biotechnol. 2023, 43, 628–645. [Google Scholar] [CrossRef] [Scilit] [PubMed]
- Tsunoda, Y.; Somatani, A.; Yoshiike, C.; Mitoma, S.; Yamano-Adachi, N.; Omasa, T. Artificial induction of bottlenecks in the endoplasmic reticulum for rational improvement of antibody secretion in Chinese hamster ovary cells. N. Biotechnol. 2026, 94, 136–147. [Google Scholar] [CrossRef] [Scilit] [PubMed]
- Le Fourn, V.; Girod, P.A.; Buceta, M.; Regamey, A.; Mermod, N. CHO cell engineering to prevent polypeptide aggregation and improve therapeutic protein secretion. Metab. Eng. 2014, 21, 91–102. [Google Scholar] [CrossRef] [Scilit] [PubMed]
- Mathias, S.; Wippermann, A.; Raab, N.; Zeh, N.; Handrick, R.; Gorr, I.; Schulz, P.; Fischer, S.; Gamer, M.; Otte, K. Unraveling what makes a monoclonal antibody difficult-to-express: From intracellular accumulation to incomplete folding and degradation via ERAD. Biotechnol. Bioeng. 2020, 117, 5–16. [Google Scholar] [CrossRef] [Scilit] [PubMed]
- Barzadd, M.M.; Lundqvist, M.; Harris, C.; Malm, M.; Volk, A.L.; Thalén, N.; Chotteau, V.; Grassi, L.; Smith, A.; Abadi, M.L.; et al. Autophagy and intracellular product degradation genes identified by systems biology analysis reduce aggregation of bispecific antibody in CHO cells. N. Biotechnol. 2022, 68, 68–76. [Google Scholar] [CrossRef] [Scilit] [PubMed]
- Yang, Y.X.; Li, Q.; Li, W.D.; Wang, T.Y.; Feng, H.G. Factors and Mechanisms Affecting the Secretion of Recombinant Protein in CHO Cells. Curr. Pharm. Biotechnol. 2023, 24, 391–400. [Google Scholar] [CrossRef] [Scilit] [PubMed]
- Kaneyoshi, K.; Kuroda, K.; Uchiyama, K.; Onitsuka, M.; Yamano-Adachi, N.; Koga, Y.; Omasa, T. Secretion analysis of intracellular “difficult-to-express” immunoglobulin G (IgG) in Chinese hamster ovary (CHO) cells. Cytotechnology 2019, 71, 305–316. [Google Scholar] [CrossRef] [Scilit] [PubMed]
- Almquist, J.; Cvijovic, M.; Hatzimanikatis, V.; Nielsen, J.; Jirstrand, M. Kinetic models in industrial biotechnology—Improving cell factory performance. Metab. Eng. 2014, 24, 38–60. [Google Scholar] [CrossRef] [Scilit] [PubMed]
- Nolan, R.P.; Lee, K. Dynamic model of CHO cell metabolism. Metab. Eng. 2011, 13, 108–124. [Google Scholar] [CrossRef] [Scilit] [PubMed]
- Kotidis, P.; Jedrzejewski, P.; Sou, S.N.; Sellick, C.; Polizzi, K.; Del Val, I.J.; Kontoravdi, C. Model-based optimization of antibody galactosylation in CHO cell culture. Biotechnol. Bioeng. 2019, 116, 1612–1626. [Google Scholar] [CrossRef] [Scilit] [PubMed]
- Shirsat, N.; Mohd, A.; Whelan, J.; English, N.J.; Glennon, B.; Al-Rubeai, M. Revisiting Verhulst and Monod models: Analysis of batch and fed-batch cultures. Cytotechnology 2015, 67, 515–530. [Google Scholar] [CrossRef] [Scilit] [PubMed]
- Chiu, K.C.; Du, D. A neural ordinary differential equation model for predicting the growth of Chinese Hamster Ovary cell in a bioreactor system. Biotechnol. Bioprocess Eng. 2025, 30, 100–115. [Google Scholar] [CrossRef] [Scilit]
- Richter, J.; Wang, Q.; Lange, F.; Thiel, P.; Yilmaz, N.; Solle, D.; Zhuang, X.; Beutel, S. Machine Learning-Powered Optimization of a CHO Cell Cultivation Process. Biotechnol. Bioeng. 2025, 122, 1153–1164. [Google Scholar] [CrossRef] [Scilit] [PubMed]
- Rogers, A.W.; Vega-Ramon, F.; Lane, A.; Martin, P.; Zhang, D. Interpretable-AI-Based Model Structural Transfer Learning to Accelerate Bioprocess Model Construction. Biotechnol. Bioeng. 2025, 122, 2819–2831. [Google Scholar] [CrossRef] [Scilit] [PubMed]
- Bibila, T.; Flickinger, M.C. A structured model for monoclonal antibody synthesis in exponentially growing and stationary phase hybridoma cells. Biotechnol. Bioeng. 1991, 37, 210–226. [Google Scholar] [CrossRef] [Scilit] [PubMed]
- Bibila, T.A.; Flickinger, M.C. A model of interorganelle monoclonal antibody transport and secretion in mouse hybridoma cells. Biotechnol. Bioeng. 1991, 38, 767–780. [Google Scholar] [CrossRef] [Scilit] [PubMed]
- Bibila, T.A.; Flickinger, M.C. Use of a structured kinetic model of antibody synthesis and secretion for optimization of antibody production systems: I. Steady-state analysis. Biotechnol. Bioeng. 1992, 39, 251–261. [Google Scholar] [CrossRef] [Scilit] [PubMed]
- Bibila, T.A.; Flickinger, M.C. Use of a structured kinetic model of antibody synthesis and secretion for optimization of antibody production systems: II. Transient analysis. Biotechnol. Bioeng. 1992, 39, 262–272. [Google Scholar] [CrossRef] [Scilit] [PubMed]
- O’Callaghan, P.M.; McLeod, J.; Pybus, L.P.; Lovelady, C.S.; Wilkinson, S.J.; Racher, A.J.; Porter, A.; James, D.C. Cell line-specific control of recombinant monoclonal antibody production by CHO cells. Biotechnol. Bioeng. 2010, 106, 938–951. [Google Scholar] [CrossRef] [Scilit] [PubMed]
- McLeod, J.; O’Callaghan, P.M.; Pybus, L.P.; Wilkinson, S.J.; Root, T.; Racher, A.J.; James, D.C. An empirical modeling platform to evaluate the relative control discrete CHO cell synthetic processes exert over recombinant monoclonal antibody production process titer. Biotechnol. Bioeng. 2011, 108, 2193–2204. [Google Scholar] [CrossRef] [Scilit] [PubMed]
- Milo, R. What is the total number of protein molecules per cell volume? A call to rethink some published values. Bioessays 2013, 35, 1050–1055. [Google Scholar] [CrossRef] [Scilit] [PubMed]
- Liu, X.; Oh, S.; Kirschner, M.W. The uniformity and stability of cellular mass density in mammalian cell culture. Front. Cell Dev. Biol. 2022, 10, 1017499. [Google Scholar] [CrossRef] [Scilit] [PubMed]
- López-Meza, J.; Araíz-Hernández, D.; Carrillo-Cocom, L.M.; López-Pacheco, F.; Rocha-Pizaña, M.d.R.; Alvarez, M.M. Using simple models to describe the kinetics of growth, glucose consumption, and monoclonal antibody formation in naive and infliximab producer CHO cells. Cytotechnology 2016, 68, 1287–1300. [Google Scholar] [CrossRef] [Scilit] [PubMed]
- Kaneyoshi, K.; Uchiyama, K.; Onitsuka, M.; Yamano, N.; Koga, Y.; Omasa, T. Analysis of intracellular IgG secretion in Chinese hamster ovary cells to improve IgG production. J. Biosci. Bioeng. 2019, 127, 107–113. [Google Scholar] [CrossRef] [Scilit] [PubMed]
- Dadehbeigi, N.; Dickson, A.J. Application of a nonradioactive method of measuring protein synthesis in industrially relevant Chinese hamster ovary cells. Biotechnol. Prog. 2013, 29, 1043–1049. [Google Scholar] [CrossRef] [Scilit] [PubMed]
- Bergman, L.W.; Kuehl, W.M. Co-translational modification of nascent immunoglobulin heavy and light chains. J. Supramol. Struct. 1979, 11, 9–24. [Google Scholar] [CrossRef] [Scilit] [PubMed]
- Lee, Y.K.; Brewer, J.W.; Hellman, R.; Hendershot, L.M. BiP and immunoglobulin light chain cooperate to control the folding of heavy chain and ensure the fidelity of immunoglobulin assembly. Mol. Biol. Cell 1999, 10, 2209–2219. [Google Scholar] [CrossRef] [Scilit] [PubMed]
- Feige, M.J.; Groscurth, S.; Marcinowski, M.; Shimizu, Y.; Kessler, H.; Hendershot, L.M.; Buchner, J. An unfolded CH1 domain controls the assembly and secretion of IgG antibodies. Mol. Cell 2009, 34, 569–579. [Google Scholar] [CrossRef] [Scilit] [PubMed]
- Jansen, G.; Määttänen, P.; Denisov, A.Y.; Scarffe, L.; Schade, B.; Balghi, H.; Dejgaard, K.; Chen, L.Y.; Muller, W.J.; Gehring, K.; et al. An interaction map of endoplasmic reticulum chaperones and foldases. Mol. Cell Proteom. 2012, 11, 710–723. [Google Scholar] [CrossRef] [Scilit] [PubMed]
- Tang, D.; Sandoval, W.; Lam, C.; Haley, B.; Liu, P.; Xue, D.; Roy, D.; Patapoff, T.; Louie, S.; Snedecor, B.; et al. UBR E3 ligases and the PDIA3 protease control degradation of unfolded antibody heavy chain by ERAD. J. Cell Biol. 2020, 219, e201908087. [Google Scholar] [CrossRef] [Scilit] [PubMed]
- Kennedy, J.; Eberhart, R. Particle swarm optimization. In Proceedings of the ICNN’95—International Conference on Neural Networks, Perth, WA, Australia, 27 November–1 December 1995; IEEE: New York, NY, USA, 1995; Volume 4, pp. 1942–1948. [Google Scholar] [CrossRef] [Scilit]
- Schlatter, S.; Stansfield, S.H.; Dinnis, D.M.; Racher, A.J.; Birch, J.R.; James, D.C. On the optimal ratio of heavy to light chain genes for efficient recombinant antibody production by CHO cells. Biotechnol. Prog. 2005, 21, 122–133. [Google Scholar] [CrossRef] [Scilit] [PubMed]
- Stoops, J.; Byrd, S.; Hasegawa, H. Russell body inducing threshold depends on the variable domain sequences of individual human IgG clones and the cellular protein homeostasis. Biochim. Biophys. Acta 2012, 1823, 1643–1657. [Google Scholar] [CrossRef] [Scilit] [PubMed]
- Senga, Y.; Doi, M.; Onitsuka, M.; Honda, S. Live-cell imaging to analyze intracellular aggregation of recombinant IgG in CHO cells. Cell Chem. Biol. 2022, 29, 120–132.e4. [Google Scholar] [CrossRef] [Scilit] [PubMed]
- Brunner, E.; Munzel, U. The Nonparametric Behrens-Fisher Problem: Asymptotic Theory and a Small-Sample Approximation. Biom. J. 2000, 42, 17–25. [Google Scholar] [CrossRef]
- Miao, H.; Xia, X.; Perelson, A.S.; Wu, H. On identifiability of nonlinear ODE models and applications in viral dynamics. SIAM Rev. 2011, 53, 3–39. [Google Scholar] [CrossRef] [Scilit] [PubMed]
Disclaimer/Publisher’s Note: The statements, opinions and data contained in all publications are solely those of the individual author(s) and contributor(s) and not of MDPI and/or the editor(s). MDPI and/or the editor(s) disclaim responsibility for any injury to people or property resulting from any ideas, methods, instructions or products referred to in the content. |
© 2026 by the authors. Licensee MDPI, Basel, Switzerland. This article is an open access article distributed under the terms and conditions of the Creative Commons Attribution (CC BY) license.