


Abstract
Oil–water displacement in sandstone is commonly simulated with fixed absolute permeability, although pore pressure changes can modify effective stress and the connected pore-throat network. This study proposed a sequential hydro-mechanical workflow that links incompressible oil–water flow, Biot effective stress, and an exponential permeability update. A five-state deterministic numerical dataset generated from the converged hydro-mechanical simulations over a mean effective stress range of 0.20 to 18.84 MPa, rather than from independent experimental measurements, was used to calibrate the stress-dependent permeability relationship, and a transparent one-dimensional waterflood screening model was then used to evaluate its flow consequences under a fixed pressure difference. Effective permeability decreased from 1.50 × 10⁻¹³ to 1.33 × 10⁻¹³ m2, a reduction of 11.3%, and was described by a stress sensitivity coefficient of 0.00639 MPa−1 (R2 = 0.992). In the screening calculation, this change reduced the mean total rate from 48.0 to 41.7 m3 d−1, delayed water breakthrough from 24.4 to 27.5 d, and lowered 45 d cumulative oil production from 1227 to 1203 m3. These results show how even moderate stress sensitivity can change rate- and time-based interpretations of oil–water displacement. The two-phase calculation is a reproducible sensitivity case, not a field forecast; sandstone-specific relative permeability, capillary pressure, and coupled simulator validation remain required.
1. Introduction
Waterflooding is one of the most widely applied methods for pressure maintenance and oil displacement in sandstone reservoirs, and its macroscopic behavior is commonly described using Darcy-scale multiphase-flow formulations [1]. In conventional reservoir simulation, absolute permeability is often treated as a stationary rock property, whereas phase mobility evolves mainly through saturation-dependent relative permeability and capillary pressure. During production and water injection, however, pore pressure variation changes the stress carried by the rock skeleton and can consequently modify the hydraulic properties of the reservoir. According to poroelastic theory, pore pressure contributes directly to effective stress, establishing a fundamental coupling among fluid flow, deformation, and transport capacity [2,3]. This coupling implies that permeability can evolve continuously during reservoir operation even when deformation remains within the small-strain regime.
Stress-dependent permeability has been widely observed in sandstone and other porous reservoir rocks. Increasing effective stress compresses compliant pores, closes microcracks, and constricts connected pore throats, thereby reducing the cross-sectional area and connectivity of the dominant flow paths [4,5,6,7,8,9,10,11,12,13,14,15,16,17,18]. Because hydraulic conductance is particularly sensitive to pore-throat dimensions and network connectivity, permeability commonly responds more strongly to stress than bulk porosity [5,8,12,13,14,15,16,17,18]. The magnitude of this response depends on initial permeability, pore geometry, mineral composition, clay content, microfracture abundance, and loading path [6,9,10,11,12,13,14,15,16,17,18]. Reservoir-scale heterogeneity can further amplify this behavior. Multi-factor geological characterization of tight sandstone has shown that natural fractures exhibit pronounced multiscale and multistage distributions and can form preferential flow networks [19], while simulations based on a natural Devonian sandstone fracture network demonstrated that the magnitude and orientation of in situ stress can reorganize connected flow paths and alter equivalent permeability [20]. These observations emphasize that the hydraulic response of sandstone is governed by both matrix pore-throat deformation and the stress dependence of connected high-conductivity pathways.
Several constitutive relationships have therefore been proposed to describe stress-sensitive permeability, including power law, logarithmic, and exponential formulations [5,9,12,21]. Exponential closures are particularly convenient for reservoir calculations because they relate permeability directly to effective stress variation through a stress sensitivity coefficient. Laboratory and numerical studies have shown that such coefficients are strongly dependent on rock fabric and stress path and therefore require reservoir-specific calibration. CT-based observations of fractured rock also show that increasing confining pressure can reduce fracture aperture and equivalent permeability and that the permeability response may exhibit nonlinear loading behavior and incomplete recovery during unloading [22]. Coupled thermal–hydraulic–mechanical simulations have similarly demonstrated that introducing stress-sensitive permeability changes the predicted transport capacity of fractured reservoirs [23]. Together, these studies support the use of stress-dependent permeability as a dynamic hydraulic property while also indicating that a fitted stress coefficient should be interpreted within its calibration range and loading condition.
The influence of stress sensitivity becomes more consequential in multiphase displacement because changes in pore structure can affect both absolute permeability and rock–fluid flow functions. Oil–water and gas–water experiments have reported stress-related variations in relative permeability and capillary behavior [24,25,26]. In Berea sandstone, increasing effective confining stress has been shown to modify porosity, absolute permeability, relative permeability, and capillary pressure, confirming a direct link between geomechanical deformation and multiphase transport [25,26]. From a reservoir engineering perspective, the observable consequence also depends on the operating constraint. Under rate control, permeability reduction mainly increases the pressure gradient required to maintain the specified injection rate. Under pressure control, permeability reduction decreases throughput and shifts displacement events such as front propagation and water breakthrough in calendar time. Consequently, a fixed-permeability model may bias the interpretation of rate decline, breakthrough timing, and cumulative oil production when pore pressure changes are sufficiently large to modify effective stress.
Flow geomechanics coupling can be represented using fully coupled or sequential numerical strategies [27,28,29]. Fully coupled formulations solve the flow and mechanical equations simultaneously, whereas sequential schemes exchange pore pressure, stress, deformation, and hydraulic properties between separate solution steps. The importance of this interaction has also been demonstrated in related geomechanical settings. Numerical simulations of hydraulic fracturing have shown that pore fluid pressure and the in situ stress field interact and jointly control fracture propagation [30], and studies of natural fracture networks and fractured geothermal reservoirs have shown that stress redistribution can reorganize flow pathways and modify bulk hydraulic behavior [20,22,23]. For sensitivity analysis focused on permeability evolution, sequential coupling provides a transparent framework in which the contribution of stress-dependent absolute permeability can be isolated before additional stress-dependent relative permeability and capillary pressure effects are introduced.
Previous studies have established the stress sensitivity of sandstone permeability, proposed various stress–permeability constitutive relationships, and demonstrated the importance of flow geomechanics coupling in porous and fractured reservoirs. However, the flow consequences of stress-dependent absolute permeability are often embedded within broader coupled responses involving changes in relative permeability, capillary pressure, fracture conductivity, or other transport properties. Consequently, the specific contribution of absolute permeability evolution to pressure-controlled oil–water displacement, including its effects on throughput, breakthrough timing, and fixed-time cumulative production, remains less clearly isolated. In addition, a transparent connection between a calibrated stress–permeability relationship, its use in a controlled one-dimensional displacement analysis, and its spatial application to a heterogeneous reservoir permeability field requires clearer formulation. The contribution of the present study is therefore to provide a controlled sequential numerical workflow in which the stress-dependent absolute permeability response is calibrated from deterministic hydro-mechanical states, its isolated influence on pressure-controlled waterflood behavior is quantified, and the same constitutive relationship is applied locally to examine stress-induced permeability redistribution in a heterogeneous reservoir field.
To address this gap, this study develops a sequential hydro-mechanical numerical workflow focused specifically on stress-dependent absolute permeability. Five deterministic numerical states spanning a mean effective stress range of 0.20 to 18.84 MPa are used to calibrate the permeability response. Representative permeability values derived from these states are introduced into a one-dimensional pressure-controlled waterflood model while relative permeability, fluid properties, initial saturation, and capillary pressure treatment are held fixed. The resulting changes in total flow rate, displacement front propagation, breakthrough timing, cumulative oil production, and injected pore volume are then quantified. In parallel, the same calibrated constitutive relationship is applied locally to a heterogeneous reservoir permeability field to evaluate spatial stress-induced permeability redistribution. These calculations share a common constitutive parameterization and are intended as linked numerical sensitivity analyses rather than as a fully coupled multiscale simulation.
2. Materials and Methods
2.1. Numerical Framework and Study Design
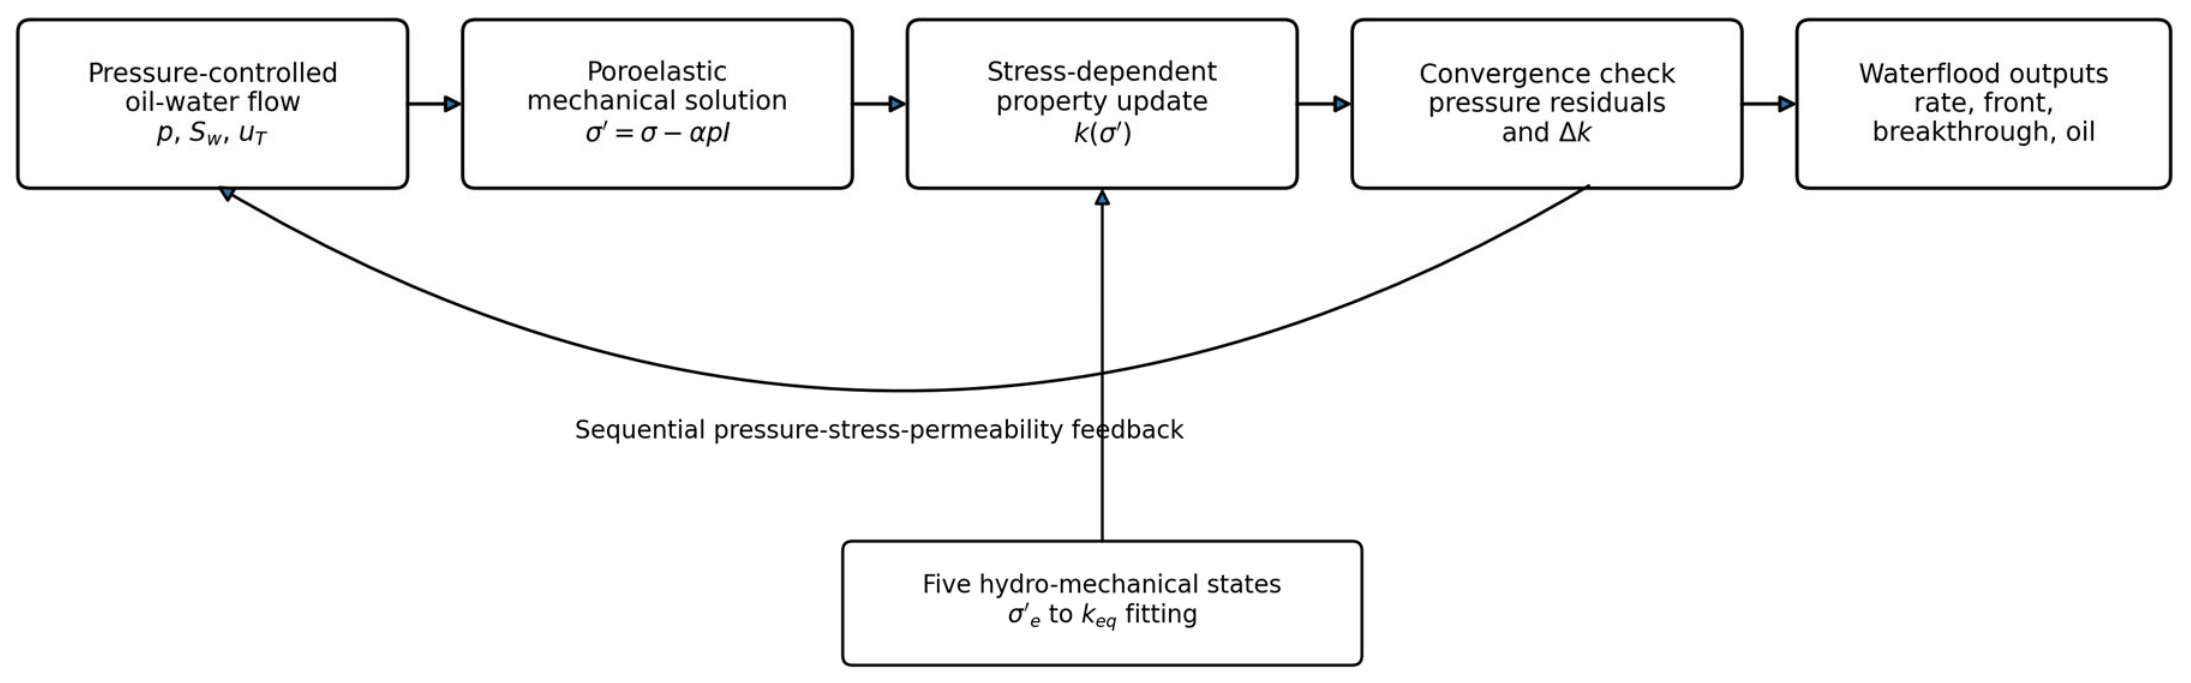
A sequential hydro-mechanical workflow was developed to quantify how stress-sensitive absolute permeability modifies oil–water displacement in sandstone. The workflow contains two calculation levels. First, a finite-element hydro-mechanical model was used to resolve pore pressure, effective stress, deformation, and equivalent permeability under a series of loading states. Five converged states covering an effective stress range of 0.20 to 18.84 MPa were then used to calibrate an exponential permeability–stress relationship. Second, the calibrated permeability law was introduced into a transparent one-dimensional waterflood model operated at a fixed pressure difference. Relative permeability functions, fluid properties, initial saturation, and capillary pressure treatment were kept unchanged between stress cases so that the resulting differences in rate, front propagation, breakthrough time, and cumulative oil production could be attributed to the change in absolute permeability (Figure 1).
The numerical components of this study are linked through a shared stress-dependent permeability parameterization. The hydro-mechanical model provides the converged mean effective stress and equivalent permeability states used to calibrate k(σ′m). The one-dimensional waterflood model subsequently uses representative scalar permeability values derived from these converged states, whereas the reservoir-scale calculation applies the same constitutive relationship locally to a heterogeneous permeability field. No direct mesh-to-mesh transfer or explicit spatial upscaling is performed among the representative hydro-mechanical model, the reservoir-scale field, and the one-dimensional waterflood model. These calculations therefore represent linked numerical analyses through a common constitutive relationship.
The sandstone skeleton was treated as a small-strain, isotropic poroelastic solid, and the fluid phases were assumed immiscible, incompressible, and isothermal. Mechanical failure, grain crushing, fracture propagation, and irreversible plastic compaction were excluded. The analysis therefore addresses permeability changes associated with poroelastic stress redistribution within the investigated stress interval. The permeability relation was applied only within the calibrated range and was not extrapolated to higher stresses.
Figure 1.
Sequential hydro-mechanical workflow used to evaluate stress-dependent permeability and its consequence for pressure-controlled oil–water displacement in sandstone.
2.2. Sandstone Hydro-Mechanical Model
2.2.1. Two-Phase Flow Formulation
Oil and water were represented as immiscible incompressible phases in a water-wet sandstone. For each phase α ∈ {o,w}, mass conservation was combined with Darcy flow. The governing equations are
where ϕ is porosity; the phase-specific quantities ρ, S, u, μ, and p denote density, saturation, Darcy velocity, dynamic viscosity, and pressure, respectively; q is the source or sink term; k is absolute permeability; and kr is relative permeability. Phase saturations and capillary pressure satisfy
So + Sw = 1, pc(Sw) = po − pw
Equation (3) was retained in the general formulation to preserve the standard two-phase flow structure. In the pressure-controlled screening calculation described in Section 2.4, capillary pressure was set to zero. This choice isolates the effect of stress-dependent absolute permeability and avoids introducing an uncalibrated sandstone capillary pressure curve. The same relative permeability functions were used for all stress cases.
2.2.2. Mechanical Equilibrium and Effective Stress
The mechanical response was solved under quasi-static equilibrium. For a linear elastic sandstone skeleton, the balance of linear momentum and the small-strain relation can be written as
where σ is the total stress tensor, ρb denotes bulk density, ε is the infinitesimal strain tensor, and u is solid displacement, C is the fourth-order elastic stiffness tensor determined by Young’s modulus and Poisson’s ratio. Fluid pressure was coupled to the mechanical solution through Biot effective stress,
where σ′ is the effective stress tensor, α is the Biot coefficient, p is pore pressure, and I is the identity tensor. The scalar stress measure used for the stress-dependent permeability update was defined as the mean effective stress: , where compression is taken as positive. For the two-dimensional plane strain calculation, the out-of-plane effective stress component determined from the elastic constitutive relation was also included in the evaluation of the stress invariant. The mean effective stress was selected because the stress sensitivity of sandstone permeability considered in this study is primarily associated with volumetric compression, narrowing of connected pore throats, and closure of compliant microcracks.
∇⋅σ + ρbg = 0
σ′ = σ − αpI
The sandstone skeleton was represented as a linear isotropic poroelastic material. A representative Young’s modulus of 24 GPa, a Poisson’s ratio of 0.28, and a Biot coefficient of 0.85 were adopted for the representative sandstone model. The bulk density was set to 2300 kg m−3. The initial pore pressure was 5.65 MPa, and the initial isotropic total stress was 5.0 MPa, with compression taken as positive. The reservoir-scale model incorporated spatially heterogeneous elastic properties, with Young’s modulus ranging approximately from 16 to 32 GPa and Poisson’s ratio from 0.26 to 0.30.
At each loading state, the hydro-mechanical equations were solved using an iterative sequential coupling procedure. Starting from the permeability field of the previous converged state, the flow problem was first solved to obtain the pore pressure field. The calculated pore pressure was then transferred to the mechanical model to determine the effective stress tensor. The mean effective stress was subsequently evaluated from the effective stress tensor and used to update permeability through the stress-dependent constitutive relationship. The updated permeability field was returned to the flow model, and the flow and mechanical calculations were repeated until simultaneous convergence of pore pressure, mean effective stress, and equivalent permeability was achieved. Thus, permeability was iteratively updated within each loading state rather than being updated only once between two successive loading states.
Convergence was assessed from the relative changes between two successive coupling iterations, with tolerances of 10−5, 10−4, and 10−4 for pore pressure, mean effective stress, and equivalent permeability, respectively; a loading state was considered converged when all three criteria were simultaneously satisfied, with a maximum of 50 sequential coupling iterations allowed.
2.2.3. Sandstone Geometry, Boundary Conditions, and Discretization
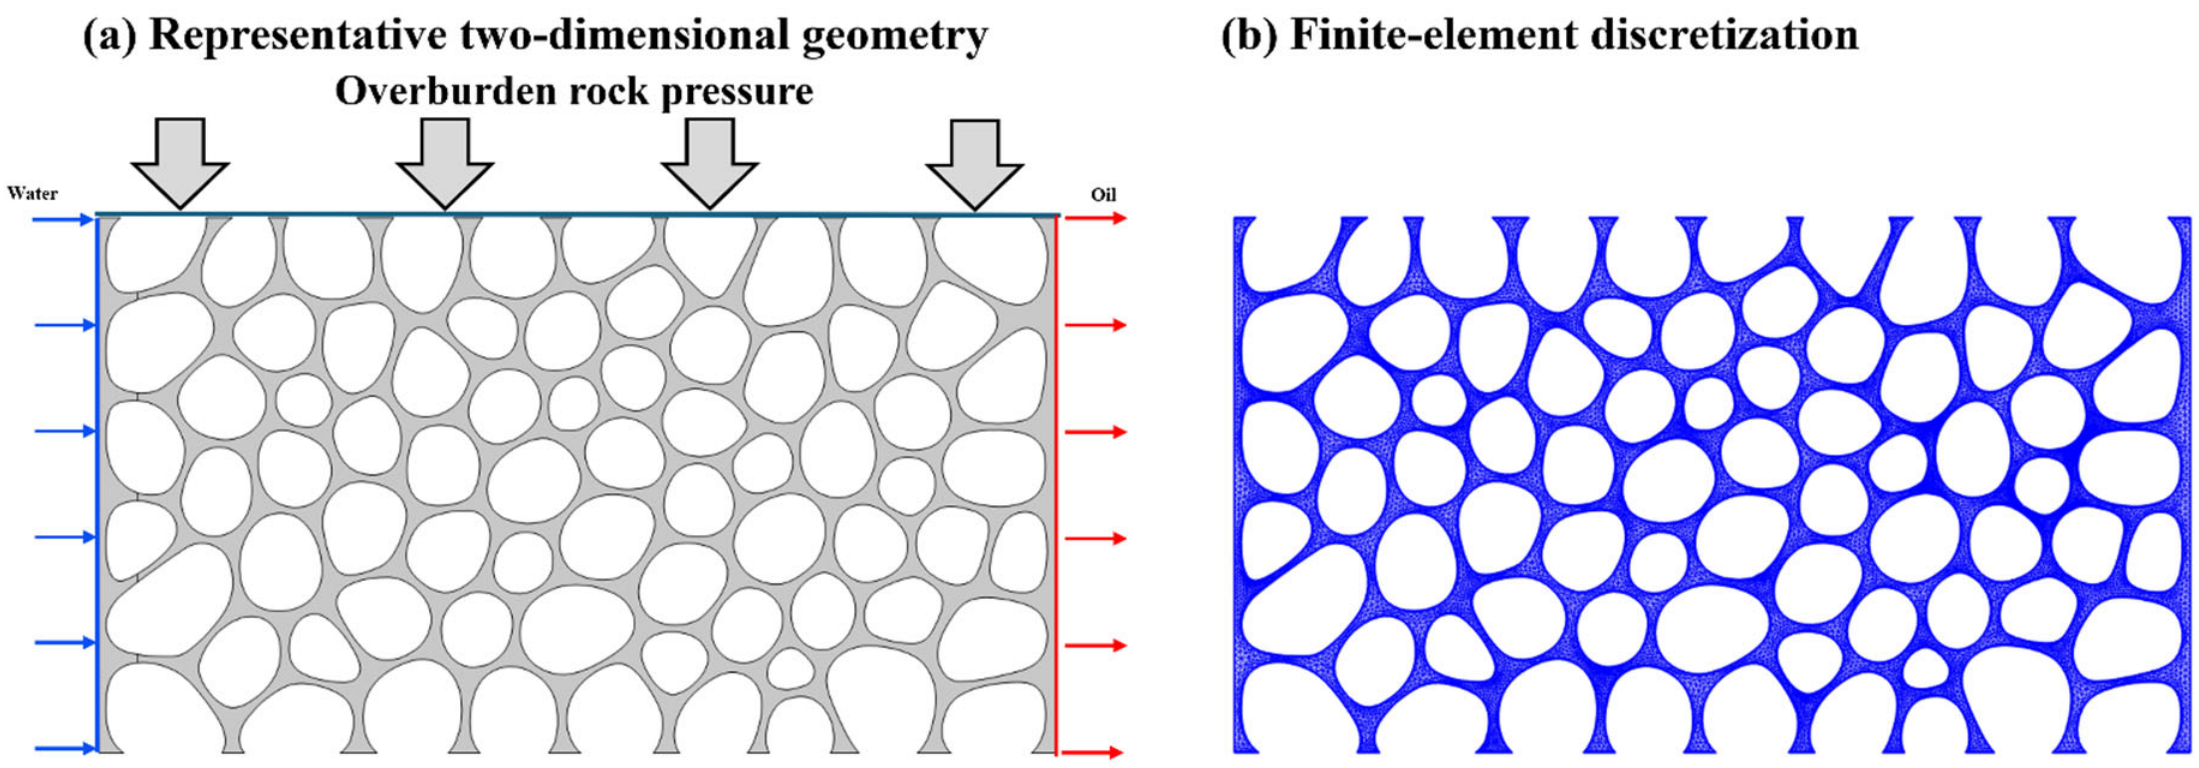
In Figure 2, a two-dimensional representative sandstone domain was used to illustrate the hydro-mechanical calculation. The pore space was represented by a granular geometry with irregular grains and connected intergranular flow channels. Flow was predominantly horizontal. The left boundary acted as the water injection side and the right boundary as the production side, while the upper and lower boundaries were impermeable to normal fluid flux. An overburden load was applied along the top mechanical boundary. Rigid body motion was suppressed by normal displacement constraints on the lower and lateral boundaries. The finite-element mesh was locally refined around narrow pore throats and grain boundaries, where pressure gradients and stress concentrations were expected to be strongest.
The computational domain was discretized using unstructured triangular finite elements. Local mesh refinement was applied around narrow pore throats and grain contact regions. The final mesh contained approximately 52,000 elements and 1.5 × 10⁵ degrees of freedom. The element size ranged from approximately 0.01 to 0.20 mm. A mesh refinement test was conducted using approximately 32,000, 52,000, and 81,000 elements. The variation in equivalent permeability between the intermediate and refined meshes was less than 1.0%, and the intermediate mesh was therefore adopted for the subsequent calculations.
Constant pressure boundary conditions of 6.00 and 5.30 MPa were imposed at the inlet and outlet boundaries, respectively, corresponding to an imposed pressure difference of 0.70 MPa. The upper and lower flow boundaries were impermeable. The initial pore pressure was uniformly set to 5.65 MPa. For the mechanical calculation, external compressive loading was imposed on the upper boundary, while normal displacement constraints were applied to the lower and lateral boundaries to eliminate rigid body motion.
A stationary sequential solution strategy was adopted for each hydro-mechanical loading state. The flow and mechanical equations were solved using the PARDISO direct solver with a relative tolerance of 10−6. At each coupling iteration, the updated pore pressure was transferred to the mechanical calculation through the Biot effective stress formulation, after which the resulting stress field was used to update permeability. Convergence was considered achieved when the relative change in pore pressure was below 10−5 and the relative change in equivalent permeability was below 10−4. A maximum of 50 coupling iterations was allowed for each loading state.
Figure 2.
Representative two-dimensional sandstone geometry and finite-element discretization. The mechanical loading and pressure-driven flow directions are shown schematically.
2.3. Stress-Dependent Permeability Characterization
Equivalent permeability was evaluated from the steady boundary response of the sandstone domain rather than from an arithmetic average of local permeability. For a prescribed pressure difference, the domain-scale permeability was obtained from Darcy inversion,
where the equivalent permeability is obtained from the steady outlet volumetric flow rate Q, flow length L, cross-sectional area A, fluid viscosity μ, and imposed pressure difference Δp. This definition preserves the influence of connected high-conductivity pathways and local bottlenecks on bulk conductance.
The outlet volumetric flow rate Q was calculated by integrating the normal component of the Darcy velocity over the entire outlet boundary. The inlet and outlet pressures were fixed at 6.00 and 5.30 MPa, respectively, giving Δp = 0.70 MPa. For each loading state, the flow field was solved until the pressure field, outlet flow rate, and updated permeability satisfied the prescribed convergence criteria. The converged outlet flow rate was subsequently substituted into Equation (7) to calculate the equivalent permeability.
Five hydro-mechanical states were used to describe the permeability response over the investigated stress range (Table 1). The scalar stress coordinate used in the permeability characterization corresponds to the mean effective stress , calculated from the effective stress tensor according to the definition given in Section 2.2.2. This stress invariant was selected because hydrostatic compression directly controls the volumetric deformation of the sandstone skeleton and the constriction of connected pore throats. It therefore provides a physically appropriate scalar measure for characterizing the stress-dependent permeability response within the elastic loading range investigated here. These five permeability states were generated specifically from the converged hydro-mechanical finite-element simulations at five prescribed loading states in this study and were not obtained from independent laboratory measurements. They therefore represent deterministic numerical responses of the present model and do not contain replicate experimental uncertainty. Matrix porosity is reported as a secondary deformation indicator, whereas the waterflood comparison in Section 2.4 uses a fixed porosity so that the effect of permeability can be isolated.
Table 1.
Stress-dependent sandstone properties used for constitutive fitting.
The permeability conversion used 1 mD = 9.869233 × 10⁻¹⁶ m2.
The stress–permeability relationship was represented by an exponential closure,
where the reference stress is 0.20 MPa. Nonlinear least-squares fitting of the five states gave a stress sensitivity coefficient ck = 0.00639 MPa−1 and a fitted reference permeability kref = 1.494 × 10⁻¹³ m2, with R2 = 0.992. The calibrated relation describes the numerical response over 0.20 to 18.84 MPa. Across this interval, equivalent permeability decreased from 1.50 × 10⁻¹³ m2 to 1.33 × 10⁻¹³ m2, corresponding to an 11.3% reduction.
k(σ′m) = krefexp[−ck(σ′m − σ′m,ref)]
To evaluate the dependence of the fitted response on the selected constitutive form, the same five numerical states were also fitted using a linear relationship, k = 1.4946 × 10⁻¹³ − 8.974 × 10⁻¹⁶σ′m, where k is in m2 and σ′m is in MPa. The linear model yielded R2 = 0.989, compared with R2 = 0.992 for the exponential formulation. Both formulations reproduced the calculated stress–permeability response closely over the investigated interval. The exponential formulation was retained because it provided a slightly higher coefficient of determination, maintained positive permeability, and provided a convenient multiplicative representation of stress sensitivity for the sequential hydro-mechanical coupling.
The fitted stress sensitivity coefficient ck = 0.00639 MPa−1 should therefore be interpreted as a model-specific parameter derived from the present deterministic numerical dataset over the mean effective stress interval of 0.20 to 18.84 MPa. Its direct application to other sandstone formations, pore structures, or substantially different stress ranges requires independent experimental or numerical calibration.
The parameters required in this section are provided in Appendix A.
2.4. Pressure-Controlled Oil–Water Displacement Model
2.4.1. Relative Permeability and Fractional Flow
A one-dimensional finite-volume model was used to quantify the flow consequence of the stress-dependent absolute permeability under a fixed pressure difference. Relative permeability was represented with a Corey-type parameterization. Effective water saturation and phase relative permeabilities were defined as
where irreducible water saturation, residual oil saturation, endpoint relative permeabilities, and Corey exponents are defined by the parameters listed in Table 2. Phase mobilities and the water fractional flow function are
Table 2.
Parameters used in the pressure-controlled oil–water screening calculation.
The same relative permeability curves were applied to all stress cases. Consequently, the screening calculation quantifies changes caused by absolute permeability alone and does not include possible stress dependence of relative permeability or capillary pressure.
2.4.2. Pressure-Controlled Total Flow and Saturation Transport
The domain length was 30 m, and the cross-sectional area was 900 m2. Because the inlet-to-outlet pressure difference was fixed, the total Darcy velocity changed as absolute permeability and saturation-dependent total mobility evolved. For one-dimensional incompressible flow, the total velocity was obtained from the integrated pressure equation,
Water saturation was advanced with a conservative first-order upstream finite-volume scheme,
The initial water saturation was spatially uniform and equal to the irreducible water saturation, Sw(x,0) = Swi = 0.25, 0 < x < L. At the injection boundary x = 0, pure water injection was imposed by setting the injected water fractional flow to unity, fw(0,t) = 1. Consistent with the saturation interval defined by the Corey model, this condition corresponds to an inlet water saturation of Sw(0,t) = 1 − Sor = 0.80, t > 0. At the production boundary x = L, the pressure was prescribed through the fixed inlet-to-outlet pressure difference, while no independent Dirichlet condition was imposed on water saturation. Because the flow direction remained from the injector toward the producer, the outlet saturation flux was evaluated from the upstream interior state. For the first-order finite-volume discretization, fw,N+1/2 = fw(Sw,N), where Sw,N is the water saturation in the last computational cell. This treatment allows saturation to leave the domain convectively without imposing an artificial outlet saturation. First-order upstream weighting was used throughout the domain to maintain monotonicity and local conservation, and its numerical diffusion was evaluated through the cell count sensitivity study described in Section 2.5.
2.4.3. Simulation Parameters and Stress Cases
The baseline parameters are summarized in Table 2. The principal comparison used the low-stress permeability at 0.20 MPa and the high-stress permeability at 18.84 MPa while keeping every other parameter identical. The two permeability values used in the one-dimensional waterflood comparison were taken directly from the converged hydro-mechanical states listed in Table 1. Specifically, k = 1.50 × 10⁻¹³ m2 was assigned to the 0.20 MPa mean effective stress case and k = 1.33 × 10⁻¹³ m2 to the 18.84 MPa case. These values were introduced as spatially uniform scalar absolute permeabilities in the one-dimensional model. The spatially corrected reservoir permeability field shown in Figure 6 was not used as an input to the one-dimensional calculation. The simulation duration was 45 d. Water breakthrough was defined as the first time at which the outlet water fraction reached 0.01, and cumulative oil production was obtained by time integration of the outlet oil rate.
2.5. Numerical Implementation and Verification
The reference one-dimensional grid contained 240 uniform cells. At each time step, phase mobilities were evaluated from the current saturation field, the pressure equation was integrated to obtain the total Darcy velocity, and the water saturation equation was advanced explicitly. The time step was constrained by a Courant number of 0.42 and was capped at 1800 s. Numerical adequacy was assessed using 120, 240, and 480 cells. Water volume conservation was checked from the difference between the change in stored water and the net injected-minus-produced water volume, normalized by cumulative injected water.
The grid sensitivity results are reported in Table 3. Breakthrough time, cumulative oil production, and mean total rate changed only modestly between 240 and 480 cells for both stress cases, while the normalized water balance error remained near machine precision. The 240-cell grid was therefore used for the reported screening results as a balance between accuracy and computational efficiency.
Table 3.
Grid sensitivity and conservation checks for the pressure-controlled waterflood model.
To provide an independent benchmark for the implementation of the one-dimensional two-phase flow equations, the numerical solution was compared with the classical Buckley–Leverett solution under the same assumptions of incompressible fluids, zero capillary pressure, homogeneous porosity, and fixed relative permeability functions. For the fractional flow function defined in Equation (11), the shock-front saturation Swf was determined from the Rankine–Hugoniot condition, The corresponding analytical breakthrough pore volume was obtained from . Using the relative permeability and fluid parameters listed in Table 2, the analytical shock saturation was Swf = 0.574, and the corresponding breakthrough pore volume was PVIbt = 0.408. These analytical quantities were compared with the results obtained using the reference 240-cell numerical grid.
2.6. Evaluation Metrics
Stress sensitivity was quantified using the fitted stress sensitivity coefficient, the percentage reduction in equivalent permeability, and the coefficient of determination of the constitutive fit. The flow consequence was evaluated using four pressure-controlled waterflood metrics: mean total flow rate, displacement front position, water breakthrough time, and cumulative oil production at 45 d. To distinguish changes in displacement dynamics from changes in the elapsed time scale, the two stress cases were additionally compared at equal injected pore volumes. The dimensionless injected pore volume was defined as , where Qin is the inlet volumetric flow rate and ϕAL is the total pore volume of the one-dimensional domain. With L = 30 m, A = 900 m2, and ϕ = 0.10, the total pore volume was 2700 m3. All percentage differences were calculated from unrounded numerical values. Because the five permeability states and the waterflood cases are deterministic numerical calculations, statistical hypothesis testing was not applied. The reported R2 value is used only to describe the agreement between the exponential closure and the five numerical permeability states.
3. Results
3.1. Evolution of Flow and Two-Phase Distribution in Sandstone
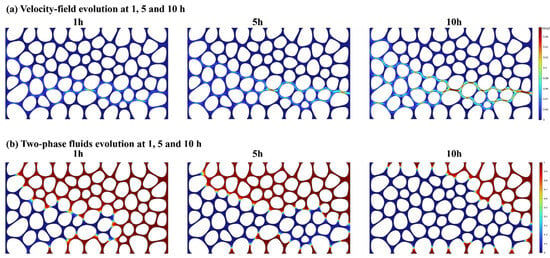
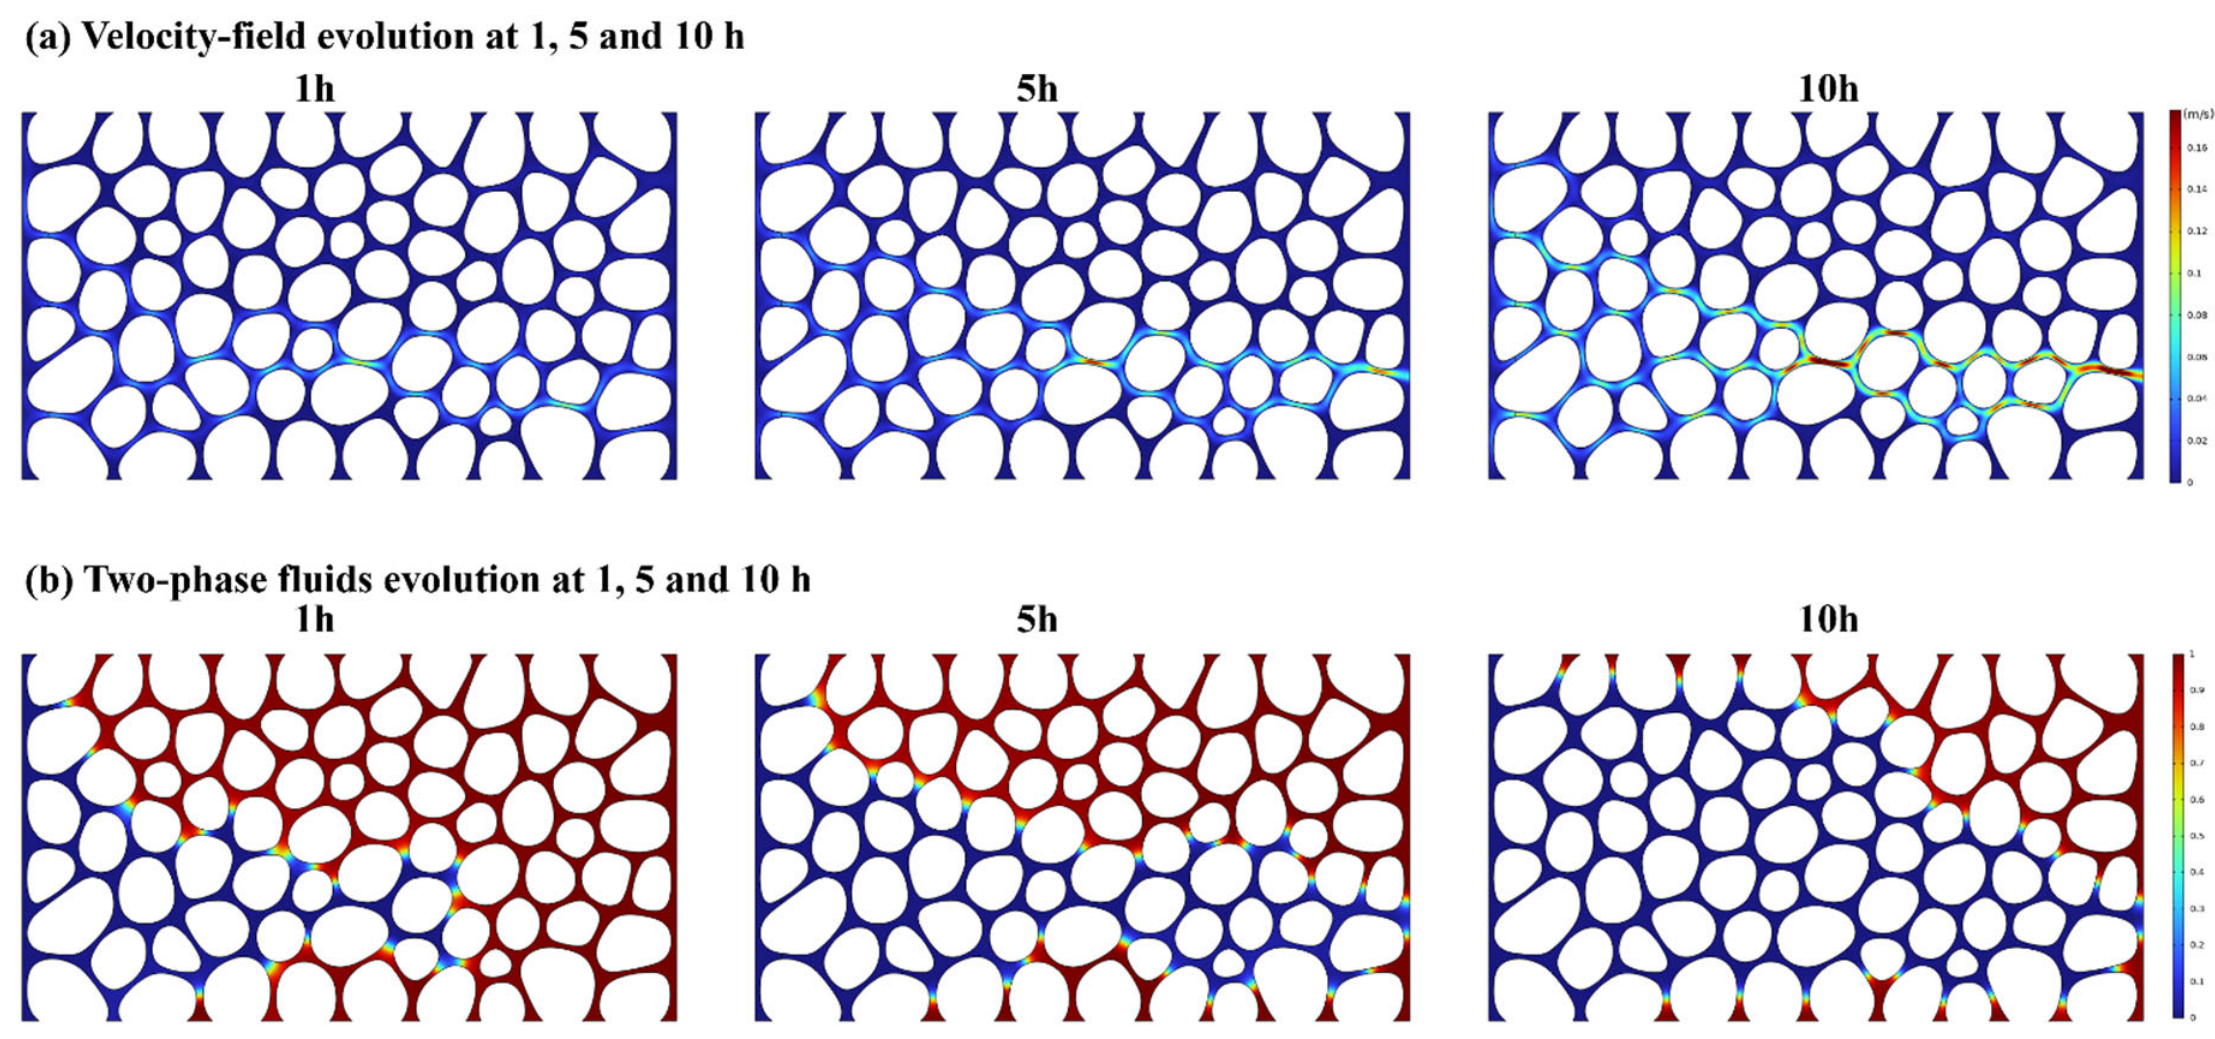
The numerical flow field developed progressively as oil–water displacement proceeded through the sandstone pore space (Figure 3). At 1 h, elevated velocities were confined to a limited number of connected pore throats. By 5 h, the high-velocity zones extended farther into the domain, and by 10 h they formed a more continuous preferential flow network. Local acceleration occurred mainly at narrow throats and converging passages, showing that the bulk flow response was governed by the connectivity of the intergranular pore network rather than by a spatially uniform velocity field.
Figure 3.
Temporal evolution of flow and two-phase displacement in the representative sandstone domain. (a) Velocity magnitude at 1, 5, and 10 h. (b) Corresponding oil–water phase distribution showing preferential invasion through connected pore-throat pathways.
The phase distribution evolved concurrently with the velocity field. The injected water initially occupied pore space adjacent to the inlet and subsequently advanced along preferentially connected channels. The displacement front remained spatially nonuniform as it propagated, while less conductive regions were invaded more slowly. The coupled evolution of velocity and saturation therefore demonstrates that pore-throat connectivity controls both local flow concentration and the advance of the oil–water interface in the representative sandstone domain.
3.2. Stress and Strain Response of the Sandstone Skeleton
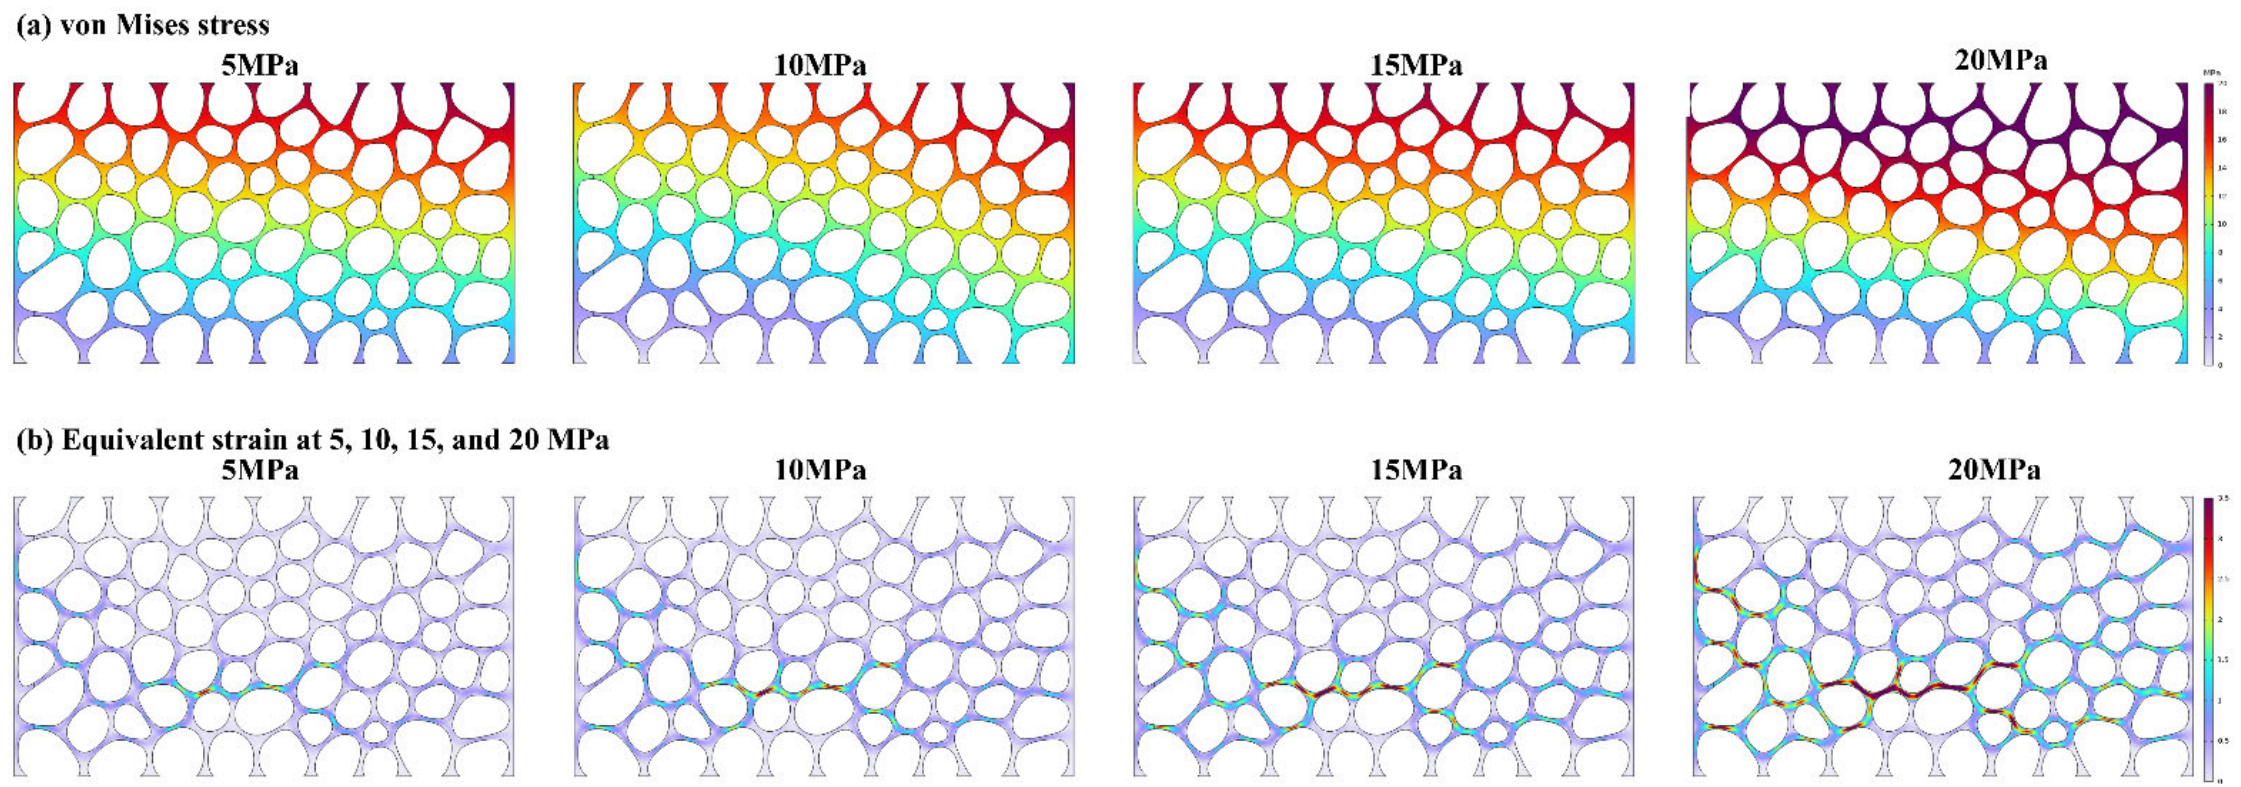
The mechanical response became progressively stronger as the applied load increased from 5 to 20 MPa (Figure 4). The von Mises stress field was spatially heterogeneous, with elevated values concentrated around narrow intergranular contacts and geometrically constrained pore-throat regions. Increasing the applied load raised the overall stress level and intensified local stress concentrations, indicating that the granular sandstone skeleton redistributed external loading nonuniformly at the pore scale.
Figure 4.
Mechanical response of the representative sandstone skeleton under increasing external loading. (a) Von Mises stress and (b) equivalent strain at 5, 10, 15, and 20 MPa. Stress and deformation are concentrated around irregular grain contacts and pore-throat constrictions.
Equivalent strain exhibited stronger localization than the stress field. At 5 MPa, deformation was restricted to a small number of compliant regions, whereas at 15–20 MPa the high-strain zones became more pronounced and extended along connected grain boundary segments. These results show that relatively small regions of the pore structure can accommodate a disproportionate fraction of the deformation. Such localized deformation provides the mechanical basis for stress-sensitive changes in hydraulic conductance, because constriction of critical pore throats can reduce permeability even when the bulk volumetric change remains modest. The von Mises stress shown in Figure 4 is used to visualize the spatial localization of the deviatoric stress field and is not used as the driving variable in the permeability update. The stress-dependent permeability relationship is governed by the mean effective stress , as defined in Section 2.2.2.
3.3. Stress-Dependent Permeability and Porosity
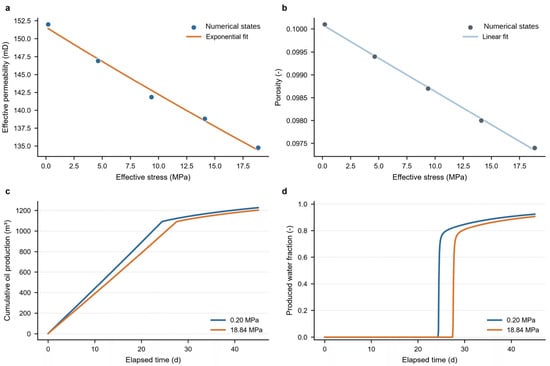
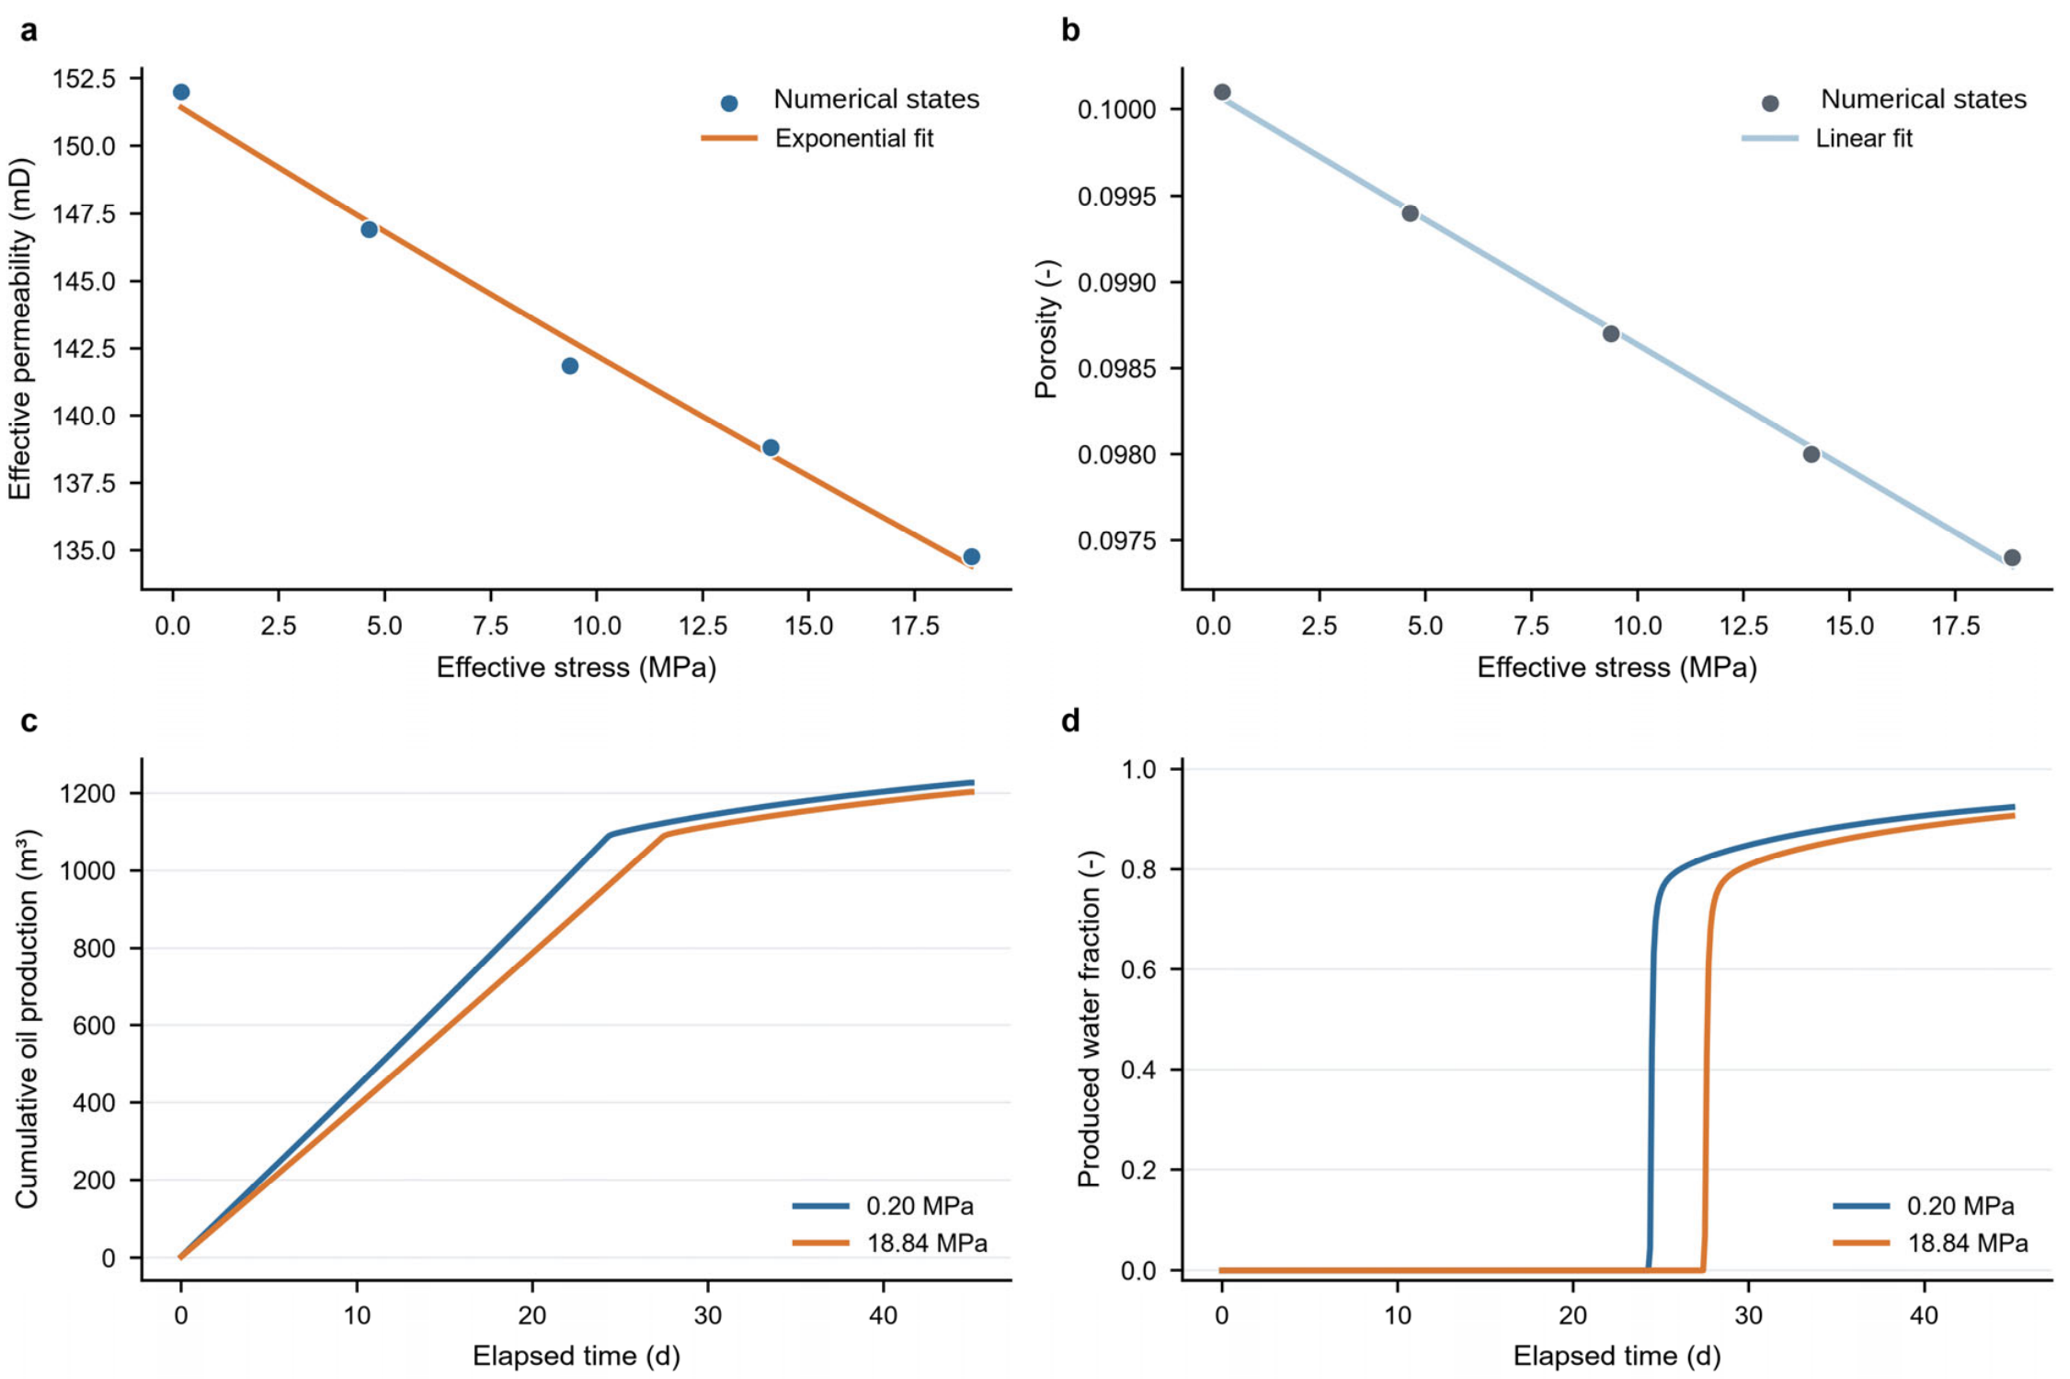
Equivalent permeability decreased monotonically with increasing effective stress (Figure 5a). It declined from 1.50 × 10⁻¹³ m2 (152.0 mD) at 0.20 MPa to 1.33 × 10⁻¹³ m2 (134.8 mD) at 18.84 MPa, corresponding to an 11.3% reduction across the investigated stress interval. The exponential relationship reproduced the five numerical states with a fitted reference permeability of 1.494 × 10⁻¹³ m2 and a stress sensitivity coefficient of 0.00639 MPa−1. The coefficient of determination was R2 = 0.992, indicating a close fit over 0.20–18.84 MPa.
Figure 5.
Stress-dependent sandstone properties and their influence on pressure-controlled oil–water displacement. (a) Effective permeability and exponential fit. (b) Porosity and linear fit. (c) Cumulative oil production under a fixed pressure difference of 0.70 MPa. (d) Produced water fraction for the low and high effective stress cases.
Porosity also decreased with effective stress, from 0.1001 to 0.0974 (Figure 5b). The corresponding relative reduction was approximately 2.7%, and the linear fit gave a slope of −1.45 × 10⁻⁴ MPa−1 with R2 = 0.999. The much larger relative change in permeability than in porosity indicates that flow capacity was more sensitive to stress than bulk pore volume. This response is consistent with permeability being controlled by the narrowest connected pore throats, whose hydraulic conductance can change appreciably even when the overall porosity variation is small.
3.4. Spatial Stress Distribution and Permeability Correction in the Sandstone Reservoir
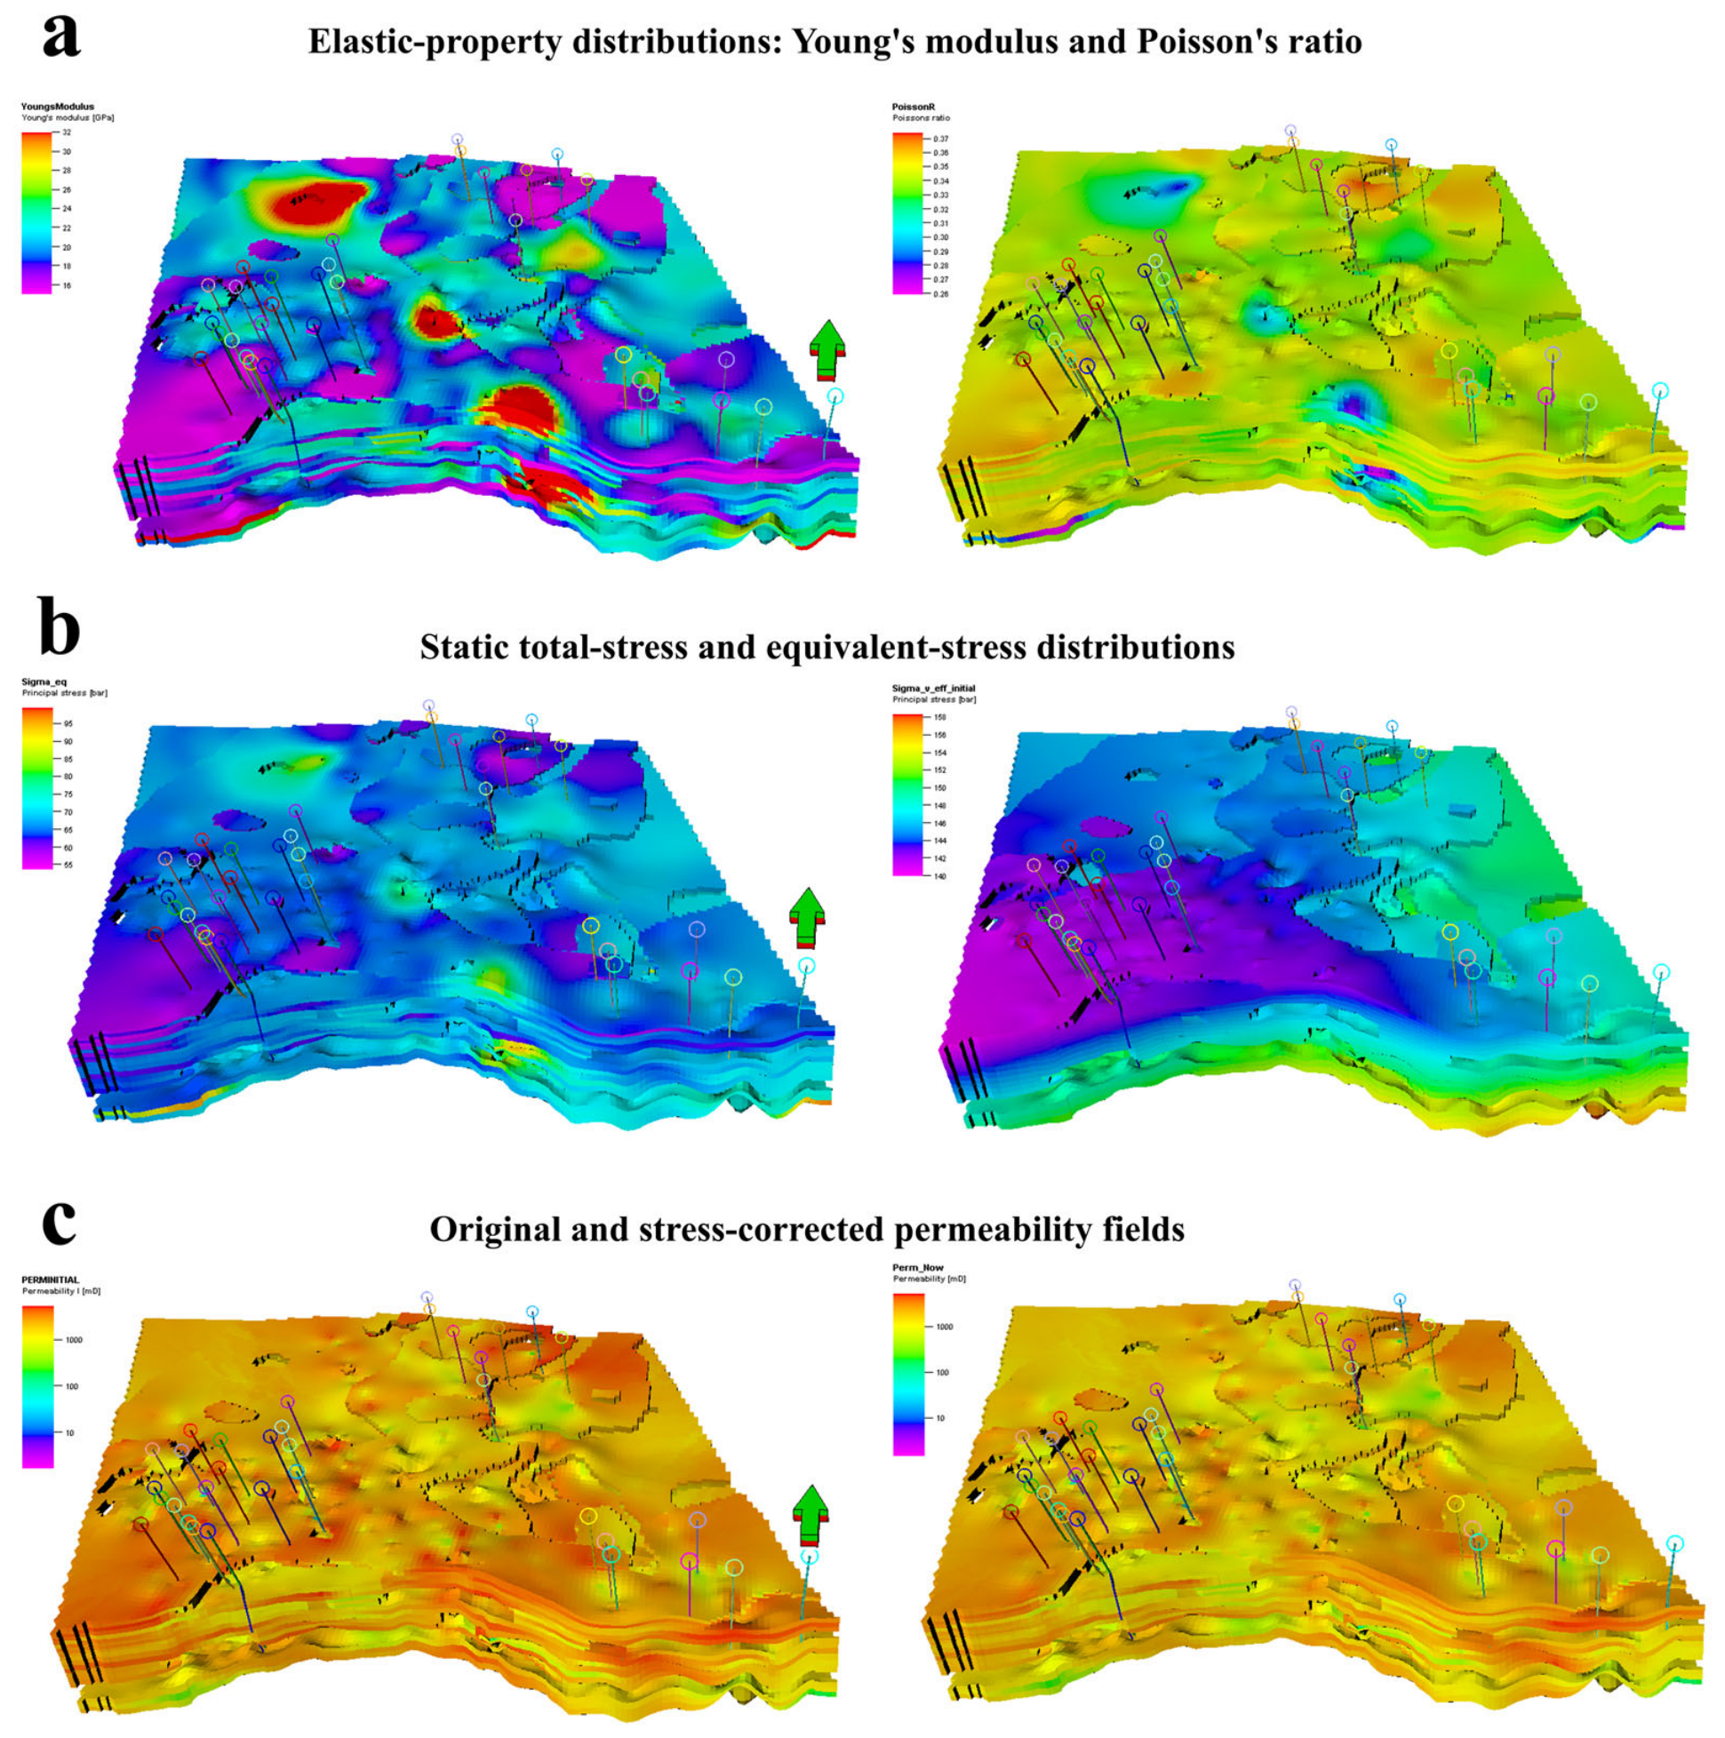
The reservoir-scale sandstone model exhibits clear spatial heterogeneity in both elastic properties and the resulting stress field (Figure 6). Young’s modulus varies appreciably across the domain, whereas Poisson’s ratio shows a comparatively narrower spatial range. This contrast produces a nonuniform mechanical response under the imposed loading conditions. The static total stress field is strongly heterogeneous, and the equivalent stress distribution further identifies zones in which the rock skeleton experiences greater mechanical loading. These results indicate that a single domain-averaged stress value would suppress spatial variations that are relevant to permeability evolution.
For each reservoir cell located at position x, the local stress-corrected permeability was calculated as where k0(x) is the original local permeability at the reference stress state, is the local mean effective stress obtained from the spatial mechanical model, ck = 0.00639 MPa−1, and is the reference mean effective stress used in the constitutive calibration. Equivalently, the local permeability correction factor is , such that kcorr(x) = k0(x)Fk(x).
This multiplicative correction preserves the relative geological ordering of the original permeability field because each cell retains its own initial permeability k0(x), while the magnitude of the permeability reduction is controlled by the local mean effective stress. Cells subjected to higher effective stress therefore receive a smaller correction factor and experience a larger permeability reduction.
Applying the fitted stress–permeability relationship on a cell-by-cell basis modifies the permeability field while preserving its principal geological heterogeneity (Figure 6c). Regions subjected to higher effective stress experience a stronger permeability reduction, whereas lower-stress regions retain a larger fraction of their initial transmissive capacity. The corrected field therefore retains the original high- and low-permeability patterns but exhibits a systematic reduction in hydraulic conductivity where mechanical loading is greater. This spatial correspondence demonstrates how the stress sensitivity identified from the effective stress sequence can be transferred to a heterogeneous sandstone reservoir model and provides the reservoir-scale permeability field used to interpret the subsequent oil–water displacement response.
The spatially corrected permeability field in Figure 6c is used to illustrate how the calibrated stress–permeability relationship modifies a heterogeneous reservoir property field under a spatially variable stress state. This corrected field is not subsequently transferred to the one-dimensional waterflood model. The reservoir-scale spatial correction and the one-dimensional waterflood calculation are therefore two complementary applications of the same calibrated constitutive relationship: the former evaluates spatial permeability redistribution, while the latter isolates the flow consequence of representative hydro-mechanically derived permeability values.
Figure 6.
Reservoir-scale hydro-mechanical properties and stress-dependent permeability correction in the sandstone model. (a) Spatial distributions of Young’s modulus and Poisson’s ratio. (b) Static total stress and equivalent stress. (c) Original and stress-corrected permeability fields. The stress correction preserves the principal permeability heterogeneity while reducing permeability more strongly in higher-stress regions.
3.5. Influence of Stress-Dependent Permeability on Waterflood Performance
Under the same inlet-to-outlet pressure difference of 0.70 MPa, the reduction in permeability produced a clear decline in total throughput. Increasing effective stress from 0.20 to 18.84 MPa reduced the mean total flow rate from 48.0 to 41.7 m3 d−1, equivalent to a decrease of approximately 13.1%. Because the pressure difference was fixed, the lower-permeability case accumulated injected pore volume more slowly, directly changing the calendar time required for the displacement front to traverse the domain.
The change in throughput shifted water breakthrough from 24.4 d at 0.20 MPa to 27.5 d at 18.84 MPa, a delay of approximately 3.1 d or 12.7% (Figure 5d). The produced-water-fraction curve for the high-stress case was therefore displaced toward later time, while its post-breakthrough evolution remained similar in shape because the same relative permeability functions and fluid viscosities were used in both cases. The delayed breakthrough should be interpreted as a consequence of the reduced volumetric throughput under the prescribed pressure difference. Because porosity, relative permeability functions, fluid properties, initial saturation, and capillary pressure treatment were held identical between the two stress cases, the later water arrival does not indicate an improvement in microscopic displacement efficiency. It primarily reflects a slower accumulation of injected pore volume and a corresponding rescaling of the displacement process in calendar time.
The timing difference also affected cumulative production. At 45 d, cumulative oil production decreased from 1227 m3 in the low-stress case to 1203 m3 in the high-stress case, corresponding to a reduction of approximately 1.9% (Figure 5c). The production difference was smaller than the rate difference because the delayed breakthrough in the high-stress case prolonged the low water-cut portion of production. Nevertheless, the reduced transmissive capacity remained dominant over the 45 d simulation period, resulting in lower cumulative oil production at the same calendar time. This fixed-time production difference reflects the slower displacement rate under the high-stress condition and should not be interpreted as evidence of a change in intrinsic microscopic displacement or recovery efficiency.
3.6. Saturation Front Evolution Under Different Effective Stresses
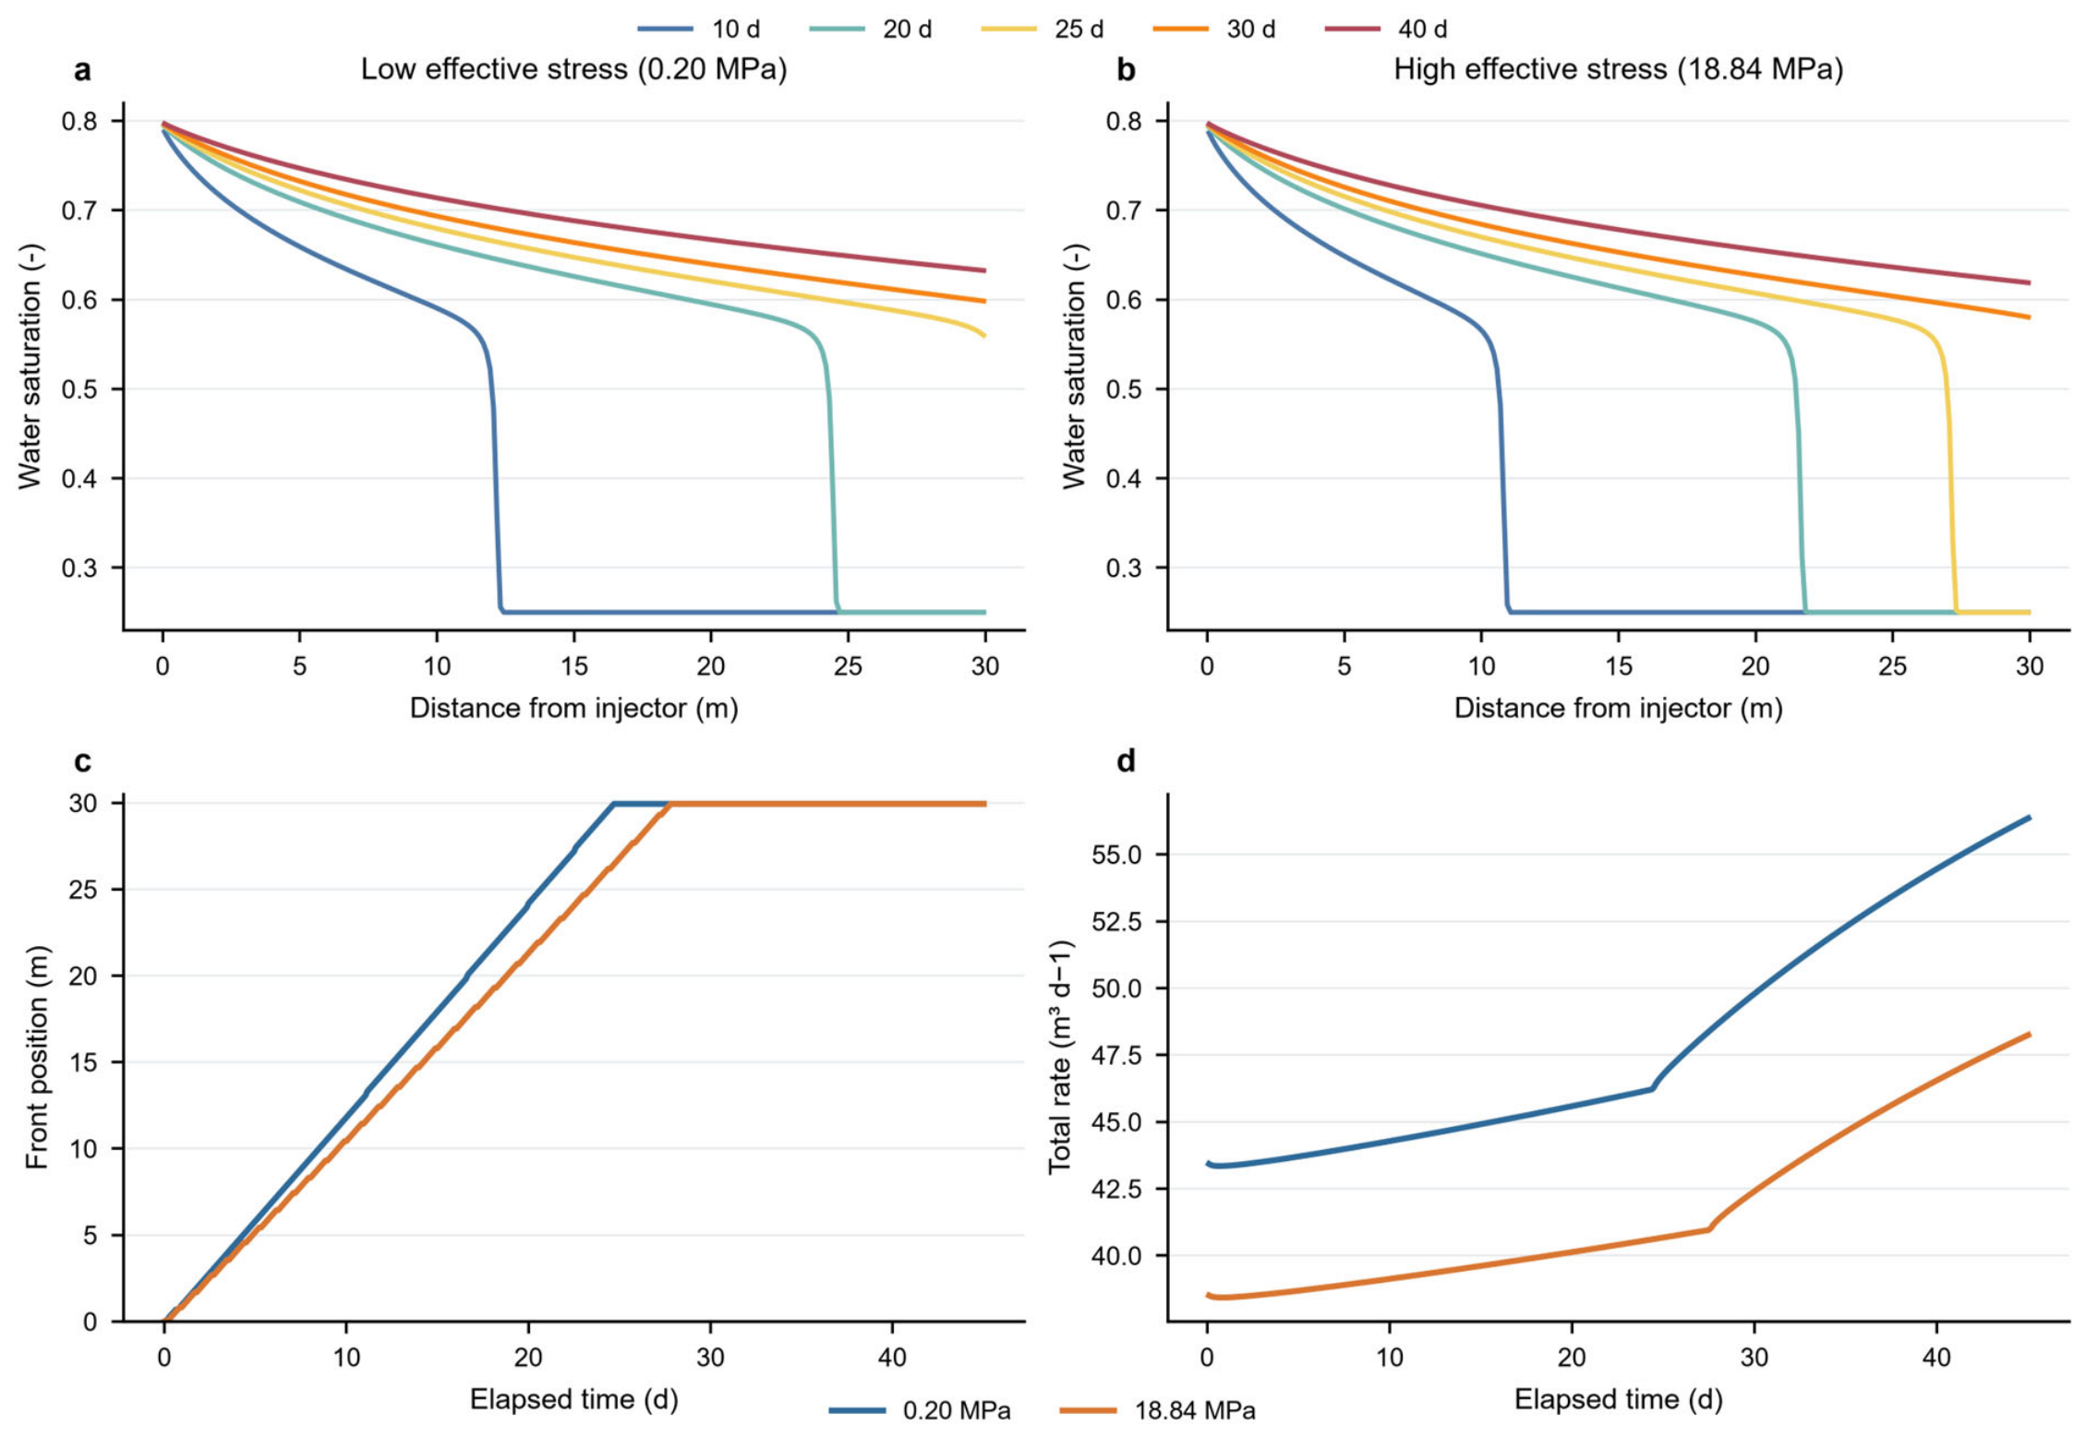
Water saturation profiles further illustrate how the permeability reduction changed displacement timing (Figure 7a,b). At 10 d, the transition front was located at approximately 12 m in the 0.20 MPa case and 11 m in the 18.84 MPa case. By 20 d, the corresponding front positions were approximately 24 and 22 m. At 25 d, the low-stress case had essentially reached the outlet, whereas the high-stress front remained inside the domain. The high-stress case subsequently reached the producer at approximately 27.5 d, consistent with the produced-water-fraction response.
Figure 7.
Oil–water saturation dynamics under low and high effective stress. (a,b) Water saturation profiles at selected times for 0.20 and 18.84 MPa. (c) Water-front position with time. (d) Total flow rate under a fixed pressure difference of 0.70 MPa.
Although the fronts propagated at different speeds, the saturation distributions behind the fronts remained similar because both cases used identical relative permeability curves, viscosity ratio, initial saturation, and capillary pressure treatment. The principal effect of uniform stress-sensitive absolute permeability was therefore a change in the time scale of displacement. Before breakthrough, the front-position curves were approximately linear (Figure 7c), with the lower-permeability case showing a consistently smaller propagation rate.
The total flow rate remained lower throughout the calculation at 18.84 MPa (Figure 7d). In both stress cases, the total rate increased after water occupied a larger fraction of the domain because the prescribed relative permeability functions produced a higher total mobility as the saturation field evolved. The persistent separation between the two rate curves confirms that the stress-induced permeability reduction continued to control pressure-driven throughput after water breakthrough.
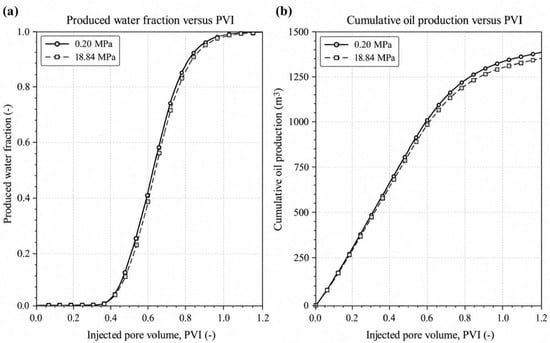
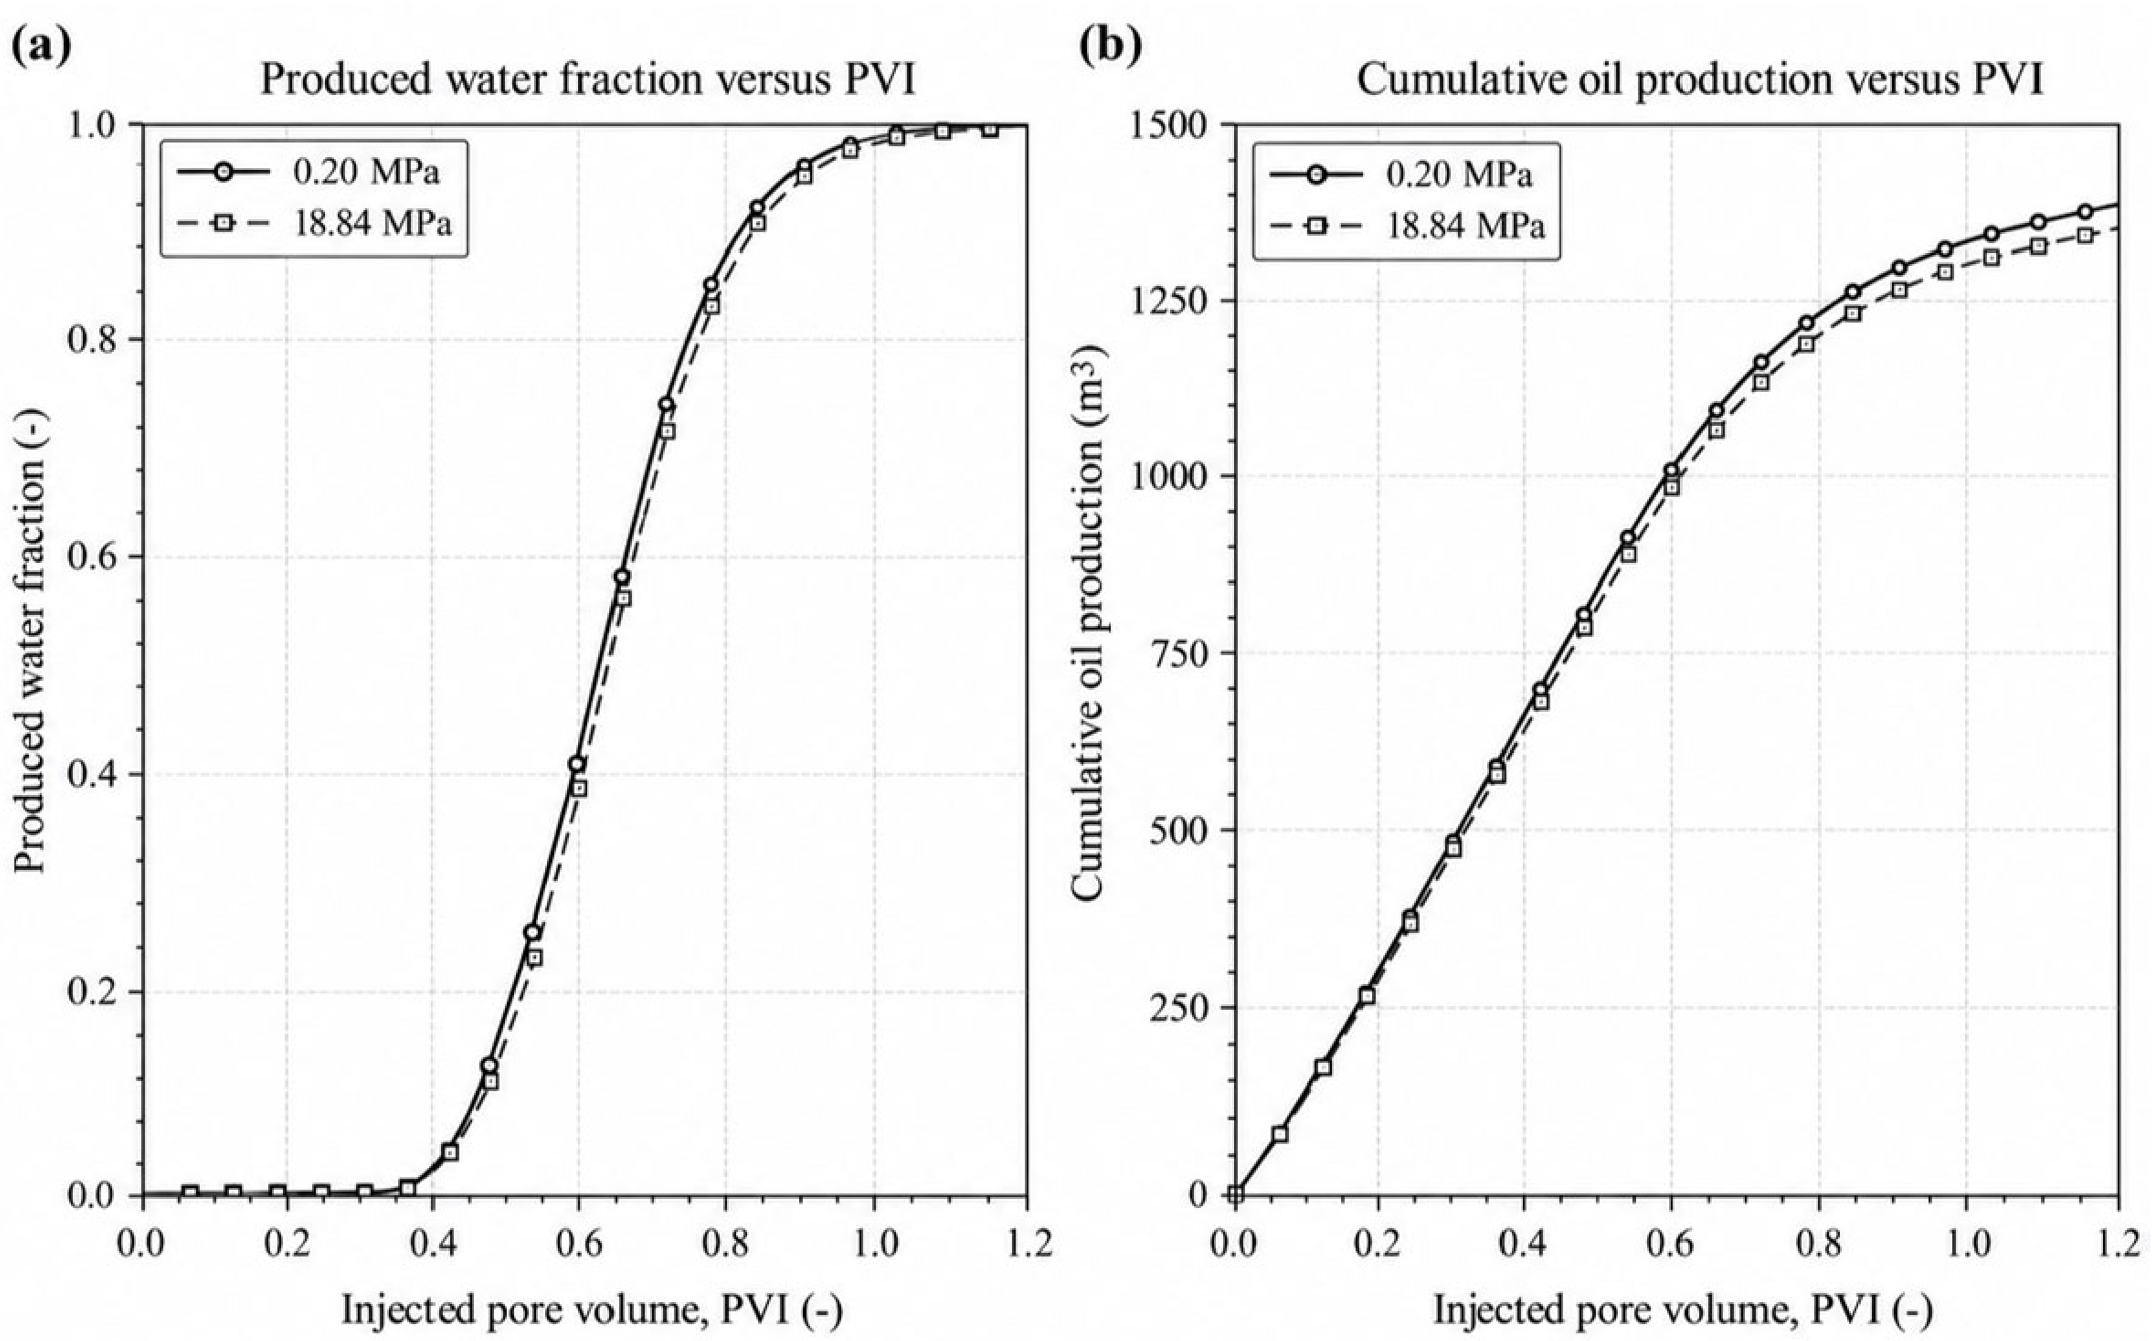
To further separate the displacement state from the elapsed time effect, the two stress cases were compared using injected pore volume as the independent variable. Figure 8 shows the produced-water fraction and cumulative oil production plotted against PVI. When compared at the same injected pore volume, the responses of the low- and high-stress cases become nearly coincident, in marked contrast to their separation when plotted against elapsed time. This confirms that, under the assumptions adopted in the present screening model, the primary consequence of stress-dependent absolute permeability is to alter the rate at which a given displacement state is reached. The delayed breakthrough observed in calendar time therefore reflects reduced throughput rather than enhanced microscopic displacement efficiency.
Figure 8.
Waterflood responses expressed as functions of injected pore volume for the low and high effective stress cases. (a) Produced water fraction versus PVI. (b) Cumulative oil production versus PVI. The close agreement between the two stress cases indicates that stress-dependent absolute permeability primarily modifies the elapsed time scale of displacement under the present model assumptions.
3.7. Benchmark Verification, Grid Convergence, and Mass Conservation
The one-dimensional waterflood solver was first evaluated against the Buckley–Leverett analytical solution. For the parameters used in the screening model, the analytical shock saturation was 0.574, and the corresponding breakthrough pore volume was 0.408 PV. The 240-cell numerical solution predicted breakthrough at approximately 0.402 PV. In addition, at an injected pore volume of 0.30 PV, the analytical shock-front position was x/L = 0.735, compared with x/L = 0.744 from the numerical solution. The relative differences in breakthrough pore volume and front position were approximately 1.5% and 1.2%, respectively. The close agreement confirms that the implemented finite-volume formulation reproduces the expected one-dimensional immiscible displacement behavior under the assumptions adopted in the present model. Grid refinement produced small and ordered changes in the main waterflood metrics. Increasing the number of cells from 240 to 480 changed the breakthrough time from 24.35 to 24.40 d in the low-stress case and from 27.46 to 27.50 d in the high-stress case. The corresponding 45 d cumulative oil production changed from 1227.0 to 1229.7 m3 and from 1203.2 to 1206.1 m3, respectively, equivalent to relative differences of approximately 0.22% and 0.24%. Mean total rate changed by less than 0.7% between the two grids.
The maximum normalized water-balance residual remained below 1.1 × 10⁻¹³ for all reported cases. These numerical differences were substantially smaller than the stress-induced changes in mean flow rate, breakthrough time, and cumulative oil production. The 240-cell grid therefore provides adequate resolution for the pressure-controlled sensitivity calculation and was retained for the reported results.
Overall, increasing effective stress from 0.20 to 18.84 MPa reduced equivalent permeability by 11.3%. Under a fixed pressure difference, this permeability loss translated into a 13.1% reduction in mean total rate, a 12.7% delay in water breakthrough, and a 1.9% decrease in 45 d cumulative oil production. The results demonstrate that moderate stress sensitivity can materially alter rate- and time-based interpretations of oil–water displacement in sandstone even when the relative permeability functions are unchanged. The equal PVI comparison further shows that these differences primarily represent changes in throughput and calendar time evolution and do not provide evidence of improved microscopic displacement efficiency. The Buckley–Leverett comparison verifies the implementation of the one-dimensional two-phase flow solver under the adopted simplifying assumptions; it does not constitute independent validation of the hydro-mechanical model or the stress-dependent permeability relationship.
4. Discussion
4.1. Stress Sensitivity of Permeability in Sandstone
The numerical results demonstrate a clear stress sensitivity of sandstone permeability over the investigated effective stress interval. As effective stress increased from 0.20 to 18.84 MPa, effective permeability decreased from 1.50 × 10⁻¹³ to 1.33 × 10⁻¹³ m2, corresponding to an 11.3% reduction. Over the same interval, porosity decreased only from 0.1001 to 0.0974. The stronger response of permeability relative to porosity is consistent with the pore-scale characteristics of sandstone, in which fluid transport is controlled primarily by the size, connectivity, and tortuosity of the conducting pore-throat network. Moderate compression of compliant grain contacts and narrow throats can therefore produce a measurable loss of hydraulic conductance while causing only a small change in bulk pore volume.
The exponential permeability relation provided a compact description of this response, with a fitted stress sensitivity coefficient c_k = 0.00639 MPa−1 and R2 = 0.992. This coefficient quantifies the permeability change within the investigated stress range and provides a convenient constitutive parameter for hydro-mechanical coupling. Physically, the observed reduction can be associated with progressive narrowing of pore throats, closure of compliant microcracks, and local rearrangement at grain contacts as effective stress increases. Studies of reservoir sandstones have shown that the magnitude of these mechanisms depends on pore structure, clay content, initial permeability, cementation, and loading path. Accordingly, c_k should be regarded as a stress sensitivity parameter for the sandstone system and stress interval considered here, and its extrapolation to substantially different stress states should be avoided without additional calibration.
The results also emphasize the importance of distinguishing total stress from effective stress when evaluating permeability evolution. During production or water injection, pore pressure changes redistribute the stress carried by the solid skeleton, so identical external loading conditions can correspond to different hydraulic states. A permeability model driven only by initial or overburden stress would therefore miss part of the pressure-dependent feedback. The sequential hydro-mechanical formulation used in this study provides a practical way to update permeability from the mechanically resolved state while retaining a transparent connection between pressure, effective stress, and flow capacity. For reservoir applications involving larger pressure fluctuations or cyclic operation, the loading and unloading paths should also be examined because sandstone permeability may exhibit path dependence and incomplete recovery.
4.2. Spatial Stress Heterogeneity and Permeability Redistribution
The spatial results show that the hydro-mechanical response cannot be represented adequately by a single reservoir-averaged stress value. Figure 3 and Figure 4 indicate that pressure transfer, local flow velocity, stress, and strain are spatially nonuniform. Pressure varies relatively smoothly over the domain, whereas velocity becomes concentrated along preferentially connected flow paths. The mechanical field exhibits a similar localization tendency, with stress and strain gradients developing around zones of contrasting stiffness and geometry. These local differences are important because permeability is controlled by the hydraulic continuity of the pore-throat network, so a relatively small mechanically affected region can influence the conductance of a much larger flow path.
The reservoir-scale distributions in Figure 6 further illustrate this spatial coupling. Young’s modulus and Poisson’s ratio vary across the sandstone reservoir, producing a heterogeneous mechanical response under the applied stress state. The calculated total stress and equivalent stress fields consequently show clear spatial variability. After the stress-dependent correction is applied, the major high- and low-permeability patterns remain recognizable, while permeability is reduced more strongly in cells subjected to higher effective stress. This behavior preserves the geological ordering of the original permeability field while introducing a mechanically controlled redistribution of transmissive capacity. The resulting permeability field therefore contains information from both petrophysical heterogeneity and the spatial stress state. The reservoir-scale permeability correction should therefore be interpreted as a spatial application of the calibrated constitutive relationship. It is complementary to the one-dimensional screening calculation and does not represent a direct multiscale transfer of the reservoir permeability field into the waterflood model.
This spatial redistribution has direct implications for reservoir-scale flow. Preferential pathways located in relatively low-stress regions may retain a larger fraction of their original conductivity, whereas high-stress regions may become more restrictive and redirect local flux. Such effects can modify effective anisotropy, interlayer communication, and the contribution of individual high-permeability zones to total reservoir throughput. For sandstone reservoirs with pronounced facies contrasts or directional permeability, stress-sensitive correction should therefore be evaluated on a cell-by-cell or facies-specific basis rather than through a uniform scalar multiplier. Pore-scale and digital rock studies support this interpretation by showing that permeability is particularly sensitive to changes in connected throats and tortuous bottlenecks.
Figure 6 represents the spatial permeability state associated with a specified mechanical condition. For modest pressure changes, such a stress-corrected snapshot can provide a useful first-order estimate of the geomechanical influence on reservoir conductivity. When injection or depletion produces substantial pore pressure redistribution, however, the effective stress field will also evolve. In that situation, pressure, stress, and permeability should be updated sequentially at selected time intervals until the coupled response is adequately converged. This extension is consistent with established sequential flow geomechanics strategies and would allow the spatial permeability field to evolve dynamically during waterflooding.
4.3. Influence of Stress-Dependent Permeability on Oil–Water Displacement
The waterflood calculations demonstrate how the permeability reduction propagates into observable displacement behavior under a fixed pressure difference. When effective stress increased from 0.20 to 18.84 MPa, the mean total rate decreased from 48.0 to 41.7 m3 d−1, a reduction of approximately 13.1%. Because the imposed pressure difference remained unchanged, the lower permeability directly reduced total mobility and slowed the accumulation of injected pore volume. Water breakthrough was consequently delayed from 24.4 to 27.5 d, corresponding to an increase of approximately 12.7%. At 45 d, cumulative oil production decreased from 1227 to 1203 m3, or approximately 1.9%. These different response magnitudes show that permeability controls throughput directly, while breakthrough and cumulative production additionally depend on the evolving saturation state and the selected comparison time.
The delayed breakthrough at higher effective stress should be interpreted carefully. In the present pressure-controlled calculation, later water arrival results primarily from the lower volumetric throughput caused by permeability loss. It does not by itself indicate an improvement in microscopic displacement efficiency or areal sweep. This interpretation is supported by the saturation profiles in Figure 7: the two stress cases display similar profile shapes when compared at comparable injected pore volumes because the same relative permeability functions, viscosity ratio, initial saturation, and capillary pressure assumption are used. The dominant effect of changing absolute permeability is therefore a rescaling of displacement in calendar time.
This distinction is important for reservoir interpretation. Under pressure-controlled operation, stress-sensitive permeability appears mainly through reduced rate, slower front propagation, and delayed production events. Under rate-controlled operation, the same permeability loss would instead be expressed primarily as a larger pressure gradient or higher injection pressure required to sustain the prescribed rate. Ignoring the hydro-mechanical contribution can therefore lead to an incorrect attribution of pressure or timing mismatches to relative permeability, well performance, or saturation behavior alone. For sandstone reservoirs experiencing significant pressure depletion or injection-induced pressure recovery, absolute permeability evolution should be considered explicitly when pressure history and production history are interpreted together.
The present calculations isolate stress-dependent absolute permeability, while the relative permeability curves are held fixed. Laboratory studies indicate that deformation of porous rocks can also influence relative permeability, capillary pressure, irreducible wetting saturation, and phase connectivity. If these rock–fluid functions vary with effective stress, the fractional flow curve itself will change, and the response may extend beyond a simple shift in elapsed time. Future sandstone-specific measurements of oil–water relative permeability and capillary pressure under multiple confining stresses are therefore important for determining whether stress alters displacement efficiency in addition to total flow capacity.
The reported breakthrough times and cumulative oil production are conditional on the use of stress-independent relative permeability functions and zero capillary pressure. These assumptions allow the influence of absolute permeability reduction to be isolated under a fixed pressure difference. Stress-dependent changes in relative permeability could modify phase mobilities and fractional flow behavior, producing differences in breakthrough and oil production beyond the throughput effect considered here. Neglecting capillary pressure further excludes capillary-driven saturation redistribution and capillary end effects. The magnitude and direction of these additional effects cannot be determined from the present calculations. Accordingly, the breakthrough delay from 24.4 to 27.5 d and the approximately 1.9% reduction in cumulative oil production at 45 d should be interpreted as outcomes of the prescribed numerical sensitivity case. The latter is a fixed-time production difference and does not establish a change in ultimate recovery. Quantitative application to a specific sandstone reservoir requires stress-dependent oil–water relative permeability and capillary pressure measurements.
4.4. Model Limitations and Validation Requirements
Several limitations define the current range of interpretation. First, the stress–permeability relation is constrained by five effective stress states between 0.20 and 18.84 MPa. Although the exponential fit is strong within this interval, a larger number of loading states would be required to resolve possible nonlinearity, stress path dependence, and hysteresis. Second, the permeability relation is represented by a scalar effective stress measure. Natural sandstone reservoirs can respond differently to changes in mean stress, deviatoric stress, and directional loading, particularly when bedding, fractures, or anisotropic fabric are present. Future calibration should therefore report the complete stress path and examine directional permeability where appropriate.
Third, the waterflood calculation is one-dimensional and uses stress-independent Corey-type relative permeability curves with capillary pressure neglected. This formulation is suitable for isolating the effect of absolute permeability sensitivity, but it does not resolve gravity segregation, transverse heterogeneity, viscous fingering, capillary end effects, or stress-dependent changes in phase mobility. A two-dimensional or three-dimensional sandstone model should subsequently incorporate measured relative permeability and capillary pressure, together with realistic layering and permeability anisotropy. Fourth, the spatial permeability correction shown in Figure 6 represents a selected geomechanical state. For large pressure changes, dynamic updating of pore pressure, effective stress, deformation, and permeability is required to represent the full feedback during the displacement process. The hydro-mechanical model has not yet been independently validated against sandstone-specific laboratory measurements or an established external coupled benchmark. Accordingly, the five stress–permeability states and the associated permeability corrections should be interpreted as deterministic numerical sensitivity responses within the prescribed material properties, boundary conditions, and effective stress range. They should not be regarded as quantitatively validated predictions for a specific sandstone formation. Independent validation against laboratory measurements of stress-dependent porosity, deformation, and permeability remains necessary before the fitted constitutive parameters are transferred to field-scale prediction.
A practical validation sequence can be established from these limitations. At the core scale, triaxial or hydrostatic loading tests should first quantify sandstone porosity, compressibility, and absolute permeability over the relevant effective stress range, including loading and unloading. Oil–water displacement experiments should then be performed at several confining stresses to determine whether relative permeability, residual oil saturation, and capillary pressure vary systematically with stress. The calibrated constitutive relationships can subsequently be implemented in a two-dimensional or three-dimensional coupled model and tested against pressure drop, production rate, water fraction, and saturation evolution. At reservoir scale, history matching should evaluate pressure and production simultaneously so that changes in absolute permeability are not compensated artificially by adjustments to relative permeability or other flow parameters.
5. Conclusions
This study established a sequential hydro-mechanical framework for evaluating stress-dependent permeability and its influence on oil–water displacement in sandstone. Within the investigated effective stress range of 0.20 to 18.84 MPa, effective permeability decreased from 1.50 × 10⁻¹³ to 1.33 × 10⁻¹³ m2, corresponding to an 11.3% reduction, while the associated porosity decrease was comparatively small. The permeability response was described by an exponential relation with ck = 0.00639 MPa−1 and R2 = 0.992, indicating a moderate and systematic stress sensitivity within the present numerical model and the investigated effective stress range. The spatial analysis showed that mechanical heterogeneity produces nonuniform stress distributions and consequently a nonuniform permeability correction across the reservoir. The stress-corrected permeability field preserved the principal petrophysical heterogeneity while reducing conductivity more strongly in higher-stress regions. This result indicates that reservoir-scale flow capacity is controlled jointly by the original permeability architecture and the evolving geomechanical state, and that spatially resolved correction is more informative than applying a single uniform permeability reduction factor.
Under a fixed pressure difference of 0.70 MPa, the stress-induced permeability reduction decreased the mean total rate from 48.0 to 41.7 m3 d−1, delayed water breakthrough from 24.4 to 27.5 d, and reduced 45 d cumulative oil production from 1227 to 1203 m3. The similar saturation profile shapes at comparable injected pore volumes indicate that, when relative permeability and capillary pressure are held constant, stress-dependent absolute permeability acts mainly by changing the rate at which the displacement process evolves in time. Accordingly, the delayed breakthrough observed in the high-stress case should be interpreted as a time-scale effect associated with reduced throughput and does not demonstrate an improvement in microscopic displacement or recovery efficiency. The Buckley–Leverett benchmark supports the correctness of the one-dimensional two-phase flow implementation, whereas the hydro-mechanical component remains to be validated independently against sandstone-specific experimental data. The present conclusions are therefore restricted to the numerical sensitivity analysis and parameter range investigated in this study.
These production changes should be interpreted as results of a controlled numerical sensitivity case under the prescribed model assumptions, rather than as predictions of field performance. Application to field-scale reservoir prediction requires formation-specific calibration of the stress–permeability relationship, measured relative permeability and capillary pressure data, and validation against reservoir pressure and production observations.
Author Contributions
X.Z.: Writing—original draft, conceptualization; F.L.: writing—original draft; Q.L.: methodology; Y.X.: formal analysis; Y.D.: methodology. All authors have read and agreed to the published version of the manuscript.
Funding
This work was supported by the National Science and Technology Major Project under grant number 2025ZD1403006-04.
Data Availability Statement
The raw data supporting the conclusions of this article will be made available by the authors on request.
Conflicts of Interest
Author Xin Zheng was employed by Gudao Oil Production Plant, Shengli Oilfield Company, SINOPEC. Author Qi Li was employed by the Gas Field Development Division of Changqing Oilfield Branch, CNPC. The remaining authors declare that the research was conducted in the absence of any commercial or financial relationships that could be construed as a potential conflict of interest.
Appendix A. Initial and Boundary Conditions of the Hydro-Mechanical Model
For completeness and reproducibility, the hydraulic and mechanical initial and boundary conditions adopted in the representative sandstone hydro-mechanical model are consolidated in Table A1.
Table A1.
Initial and boundary conditions used in the hydro-mechanical sandstone model.
These conditions were applied consistently in the hydro-mechanical calculations used to obtain the stress-dependent permeability states discussed in Section 2.2 and Section 2.3.
References
- Buckley, S.E.; Leverett, M.C. Mechanism of Fluid Displacement in Sands. Trans. AIME 1942, 146, 107–116. [Google Scholar] [CrossRef] [Scilit]
- Biot, M.A. General Theory of Three-Dimensional Consolidation. J. Appl. Phys. 1941, 12, 155–164. [Google Scholar] [CrossRef] [Scilit]
- Nur, A.; Byerlee, J.D. An Exact Effective Stress Law for Elastic Deformation of Rock with Fluids. J. Geophys. Res. 1971, 76, 6414–6419. [Google Scholar] [CrossRef] [Scilit]
- Bernabé, Y. The Effective Pressure Law for Permeability During Pore Pressure and Confining Pressure Cycling of Several Crystalline Rocks. J. Geophys. Res. 1987, 92, 649–657. [Google Scholar] [CrossRef] [Scilit]
- David, C.; Wong, T.F.; Zhu, W.; Zhang, J. Laboratory Measurement of Compaction-Induced Permeability Change in Porous Rocks: Implications for the Generation and Maintenance of Pore Pressure Excess in the Crust. Pure Appl. Geophys. 1994, 143, 425–456. [Google Scholar] [CrossRef] [Scilit]
- Schutjens, P.M.T.M.; de Ruig, H. The Influence of Stress Path on Compressibility and Permeability of an Overpressurised Reservoir Sandstone: Some Experimental Data. Phys. Chem. Earth 1997, 22, 97–103. [Google Scholar] [CrossRef] [Scilit]
- Zhu, W.; Wong, T.F. The Transition from Brittle Faulting to Cataclastic Flow: Permeability Evolution. J. Geophys. Res. Solid Earth 1997, 102, 3027–3041. [Google Scholar] [CrossRef] [Scilit]
- Morris, J.P.; Lomov, I.N.; Glenn, L.A. A Constitutive Model for Stress-Induced Permeability and Porosity Evolution of Berea Sandstone. J. Geophys. Res. Solid Earth 2003, 108, 2485. [Google Scholar] [CrossRef] [Scilit]
- Davies, J.P.; Davies, D.K. Stress-Dependent Permeability: Characterization and Modeling. SPE J. 2001, 6, 224–235. [Google Scholar] [CrossRef] [Scilit]
- Al-Wardy, W.; Zimmerman, R.W. Effective Stress Law for the Permeability of Clay-Rich Sandstones. J. Geophys. Res. Solid Earth 2004, 109, B04203. [Google Scholar] [CrossRef] [Scilit]
- Li, M.; Bernabé, Y.; Xiao, W.L.; Chen, Z.Y.; Liu, Z.Q. Effective Pressure Law for Permeability of E-bei Sandstones. J. Geophys. Res. Solid Earth 2009, 114, B07205. [Google Scholar] [CrossRef] [Scilit]
- Dou, H.; Zhang, H.; Yao, S.; Zhu, D.; Sun, T.; Ma, S.; Wang, X. Measurement and Evaluation of the Stress Sensitivity in Tight Reservoirs. Pet. Explor. Dev. 2016, 43, 1116–1123. [Google Scholar] [CrossRef] [Scilit]
- Yang, Y.; Zhang, W.; Gao, Y.; Wan, Y.; Su, Y.; An, S.; Sun, H.; Zhang, L.; Zhao, J.; Liu, L.; et al. Influence of Stress Sensitivity on Microscopic Pore Structure and Fluid Flow in Porous Media. J. Nat. Gas Sci. Eng. 2016, 36, 20–31. [Google Scholar] [CrossRef] [Scilit]
- Pimienta, L.; Sarout, J.; Esteban, L.; David, C.; Clennell, M.B. Pressure-Dependent Elastic and Transport Properties of Porous and Permeable Rocks: Microstructural Control. J. Geophys. Res. Solid Earth 2017, 122, 8952–8968. [Google Scholar] [CrossRef] [Scilit]
- Xu, C.; Lin, C.; Kang, Y.; You, L. An Experimental Study on Porosity and Permeability Stress-Sensitive Behavior of Sandstone Under Hydrostatic Compression: Characteristics, Mechanisms and Controlling Factors. Rock Mech. Rock Eng. 2018, 51, 2321–2338. [Google Scholar] [CrossRef] [Scilit]
- Meng, F.; Li, X.; Baud, P.; Wong, T.F. Effective Stress Law for the Permeability and Pore Volume Change of Clayey Sandstones. J. Geophys. Res. Solid Earth 2020, 125, e2020JB019765. [Google Scholar] [CrossRef] [Scilit]
- Wang, F.; Cheng, H. Effect of Tortuosity on the Stress-Dependent Permeability of Tight Sandstones: Analytical Modelling and Experimentation. Mar. Pet. Geol. 2020, 120, 104524. [Google Scholar] [CrossRef] [Scilit]
- Chao, Z.; Ma, G.; Hu, X.; Luo, G. Experimental Research on Stress-Dependent Permeability and Porosity of Compact Sandstone with Different Moisture Saturations. J. Nat. Gas Sci. Eng. 2020, 84, 103639. [Google Scholar] [CrossRef] [Scilit]
- Feng, J.; Chang, L.; Sun, Z.; Zhao, L.; Wu, Y.; Zheng, X.; Meng, F. Geological Model and Characteristics of Discrete Fracture Network in Tight Sandstone Gas Reservoir Constrained by Multi-Factors. J. China Univ. Pet. (Ed. Nat. Sci.) 2016, 40, 18–26. [Google Scholar] [CrossRef]
- Jiang, C.; Wang, X.; Sun, Z.; Lei, Q. The Role of In Situ Stress in Organizing Flow Pathways in Natural Fracture Networks at the Percolation Threshold. Geofluids 2019, 2019, 3138972. [Google Scholar] [CrossRef] [Scilit]
- Teng, T.; Li, Z.; Wang, Y.; Liu, K.; Jia, W. Experimental and Numerical Validation of an Effective Stress-Sensitive Permeability Model Under Hydromechanical Interactions. Transp. Porous Media 2024, 151, 449–467. [Google Scholar] [CrossRef] [Scilit]
- Yang, Y.; Liu, Z.; Sun, Z.; An, S.; Zhang, W.; Liu, P.; Yao, J.; Ma, J. Research on Stress Sensitivity of Fractured Carbonate Reservoirs Based on CT Technology. Energies 2017, 10, 1833. [Google Scholar] [CrossRef] [Scilit]
- Wang, T.; Sun, Z.; Zhang, K.; Jiang, C.; Xin, Y.; Mao, Q. Investigation on Heat Extraction Performance of Fractured Geothermal Reservoir Using Coupled Thermal-Hydraulic-Mechanical Model Based on Equivalent Continuum Method. Energies 2019, 12, 127. [Google Scholar] [CrossRef] [Scilit]
- Al-Quraishi, A.; Khairy, M. Pore Pressure versus Confining Pressure and Their Effect on Oil-Water Relative Permeability Curves. J. Pet. Sci. Eng. 2005, 48, 120–126. [Google Scholar] [CrossRef] [Scilit]
- Haghi, A.H.; Chalaturnyk, R.; Talman, S. Stress-Dependent Pore Deformation Effects on Multiphase Flow Properties of Porous Media. Sci. Rep. 2019, 9, 15004. [Google Scholar] [CrossRef] [Scilit] [PubMed]
- Haghi, A.H.; Talman, S.; Chalaturnyk, R. Consecutive Experimental Determination of Stress-Dependent Fluid Flow Properties of Berea Sandstone and Implications for Two-Phase Flow Modeling. Water Resour. Res. 2020, 56, e2018WR024245. [Google Scholar] [CrossRef] [Scilit]
- Settari, A.; Mourits, F.M. A Coupled Reservoir and Geomechanical Simulation System. SPE J. 1998, 3, 219–226. [Google Scholar] [CrossRef] [Scilit]
- Kim, J.; Tchelepi, H.A.; Juanes, R. Stability and Convergence of Sequential Methods for Coupled Flow and Geomechanics: Fixed-Stress and Fixed-Strain Splits. Comput. Methods Appl. Mech. Eng. 2011, 200, 1591–1606. [Google Scholar] [CrossRef] [Scilit]
- Jha, B.; Juanes, R. Coupled Multiphase Flow and Poromechanics: A Computational Model of Pore-Pressure Effects on Fault Slip and Earthquake Triggering. Water Resour. Res. 2014, 50, 3776–3808. [Google Scholar] [CrossRef] [Scilit]
- Zhang, J.; Li, X.; Wang, C.; Lü, A.; Sun, Z. Numerical Simulation of Rock Formation Stress-Fluid Pressure Coupling and Development of Artificial Fractures during Hydraulic Fracturing of Shale Gas Reservoirs. J. China Univ. Pet. (Ed. Nat. Sci.) 2018, 42, 96–105. [Google Scholar] [CrossRef]

Disclaimer/Publisher’s Note: The statements, opinions and data contained in all publications are solely those of the individual author(s) and contributor(s) and not of MDPI and/or the editor(s). MDPI and/or the editor(s) disclaim responsibility for any injury to people or property resulting from any ideas, methods, instructions or products referred to in the content. |
© 2026 by the authors. Licensee MDPI, Basel, Switzerland. This article is an open access article distributed under the terms and conditions of the Creative Commons Attribution (CC BY) license.