


Abstract
Agricultural compression-ignition engines require decarbonization strategies that can reduce fossil-diesel demand without replacing robust power units already operating in the field. This study experimentally evaluates an autonomous hydrous-ethanol port-fuel-injection retrofit applied to a John Deere PowerTech™ Plus 6068 engine, a six-cylinder, turbocharged, 6.8 L agricultural diesel engine with high-pressure common-rail direct injection and MAR-1/Tier 3 equivalent emission compliance. Brazilian Diesel S10/B14 was retained as the directly injected pilot fuel, while commercial hydrous ethanol was supplied upstream of the cylinders through a FuelTech FT550-controlled low-pressure injection system. Tests were performed at 1200 and 1600 rpm, under 200 and 800 N·m, using ethanol injection pulse widths of 0, 10, and 20 ms. The analysis combines fuel consumption, brake-specific fuel consumption (BSFC), diesel substitution ratio (DSR), energy substitution ratio (ESR), fuel conversion efficiency (FCE), and regulated emissions. The strategy achieved substantial diesel displacement at low load, with DSR and ESR reaching 61.9% and 71.6%, respectively. The most balanced operating point occurred at 1600 rpm and 800 N·m with 20 ms ethanol injection, where DSR and ESR reached 21.1% and 22.9% while FCE varied by only percentage points relative to the diesel-only baseline (35.83% versus 35.80%). CO2 emissions decreased in all dual-fuel cases, with reductions up to 18.0%, and NOx generally decreased by as much as 35.2%. However, CO increased in all dual-fuel cases, and HC increased strongly at low load. At high load, NOx decreased by 7.1% and 13.0% with 10 and 20 ms injection at 1200 rpm, whereas at 1600 rpm, it increased by 23.3% with 10 ms and returned to the baseline level () with 20 ms. These results demonstrate that hydrous-ethanol fumigation is a technically promising retrofit route for Brazilian agricultural diesel engines, provided that future calibration manages the incomplete-combustion penalties while preserving the CO2 and NOx benefits.
1. Introduction
The transition from fossil-derived fuels has become a central requirement for the automotive, heavy-duty transport, stationary power, and agricultural machinery sectors. This pressure is driven by increasingly stringent decarbonization targets, tighter limits on regulated pollutants, and concerns regarding the security and affordability of energy supply. Recent global energy assessments emphasize that energy security and climate action must be addressed jointly, since reducing dependence on volatile fossil-fuel markets requires the accelerated deployment of cleaner technologies and low-emission energy carriers [1]. In this context, different pathways are being explored for mobility and off-road applications, including battery-electric powertrains, hydrogen, ammonia, renewable synthetic fuels, and biofuels. However, for heavy-duty and agricultural applications, where high torque demand, long operating hours, fuel logistics, and equipment lifetime are critical constraints, liquid renewable fuels and retrofit-compatible combustion strategies remain technically relevant for reducing diesel dependence while preserving the robustness of compression-ignition engines [2,3].
The Brazilian energy scenario provides a particularly favorable background for investigating biofuel-based strategies in compression-ignition engines. Although Brazil is a major crude-oil producer, the country still depends on imports to meet part of the domestic demand for oil derivatives, especially diesel. According to the National Agency of Petroleum, Natural Gas, and Biofuels of Brazil (ANP), diesel imports have represented a substantial fraction of domestic diesel demand, with the ratio between imported Diesel A and domestic Diesel B consumption reaching 25% in 2022; ANP monthly market data also indicate that the share of foreign-origin diesel in national sales reached 33.34% in the same year [4]. At the same time, Brazil has one of the most developed biofuel sectors in the world. In 2024, Brazilian ethanol production reached 37.3 billion liters, including 29.7 billion liters from sugarcane and 7.7 billion liters from corn, while biodiesel consumption reached 9.1 billion liters [5]. In addition, ANP reported the commercialization of 21.66 billion liters of hydrous ethanol and 67.25 billion liters of Diesel B in 2024 [6]. This combination of diesel-import exposure, large-scale ethanol availability, and expanding biodiesel mandates has motivated national policies such as RenovaBio, which establishes market-based decarbonization targets for biofuels, and the Green Mobility and Innovation Program (MOVER), which is the current Brazilian industrial policy for the automotive sector and is aligned with decarbonization and technological innovation goals [7,8].
Within this framework, the use of ethanol in compression-ignition engines is an attractive pathway to reduce fossil diesel consumption and mitigate emissions. Ethanol is a renewable, oxygenated fuel with high volatility and a high latent heat of vaporization, properties that can improve mixture preparation and reduce combustion temperatures. These characteristics are particularly relevant for reducing thermal NOx formation, while the partial displacement of diesel can reduce the carbon intensity of the fuel supplied to the engine [3,9,10]. Nevertheless, the direct use of ethanol as the sole fuel in conventional diesel engines is limited by its low cetane number, lower LHV compared with diesel, poor lubricity for diesel high-pressure systems, and miscibility issues when blended directly with diesel [9,11]. Therefore, a more practical approach is to use ethanol as a secondary low-reactivity fuel while maintaining diesel as the high-reactivity pilot fuel responsible for auto-ignition and combustion stabilization.
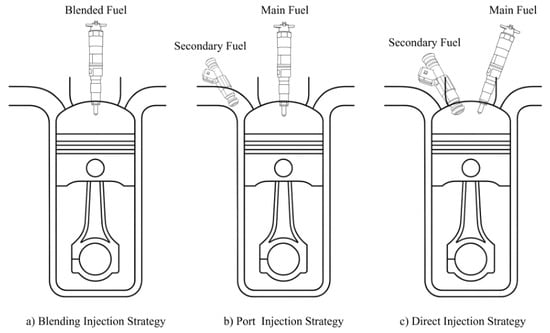
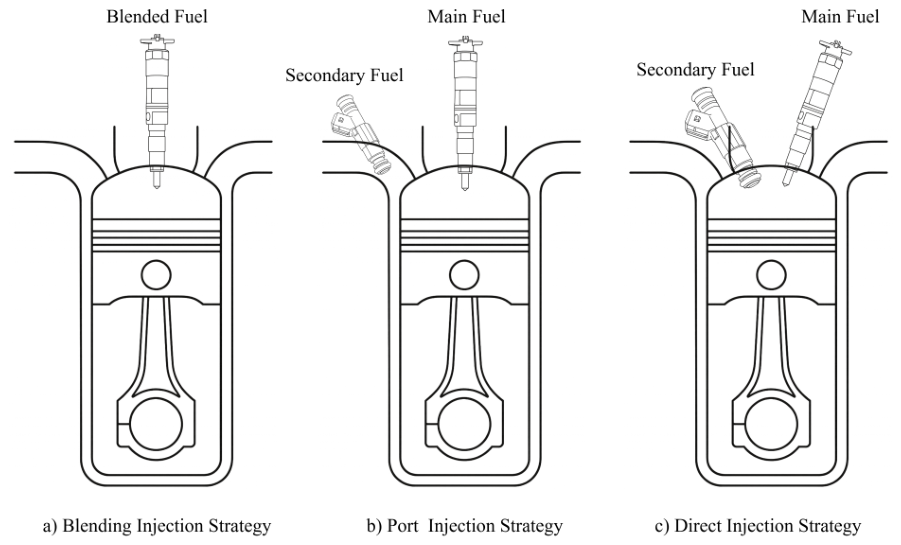
Dual-fuel operation in compression-ignition engines can be implemented through three main strategies, as illustrated in Figure 1. The first approach is fuel blending or emulsification, in which the primary and secondary fuels are mixed before injection. As discussed by Agarwal and by Krishnan et al. [11,12], this method is simple and inexpensive, but it is limited by fuel stability, phase separation, reduced cetane number, and material-compatibility concerns, especially when alcohols are blended with diesel. The second approach is port fuel injection (PFI), also referred to as fumigation, in which the secondary fuel is injected into the intake manifold and premixed with the intake air, while diesel remains directly injected into the cylinder. No, Abrar et al., and Sahu et al. [3,9,13] emphasize that this strategy avoids diesel–ethanol phase-separation problems, allows for independent control of the secondary fuel, and requires fewer hardware changes than dual direct injection; however, it may increase CO and HC emissions under low-load operation because of charge cooling, wall wetting, over-lean regions, and flame quenching. The third approach is direct dual-fuel injection, in which both fuels are injected directly into the combustion chamber. No and Rios et al. [9,14] indicate that this strategy provides the highest degree of control over in-cylinder stratification and combustion phasing, but it requires major cylinder-head modifications, additional high-pressure hardware, and more complex calibration.
Figure 1.
Main dual-fuel injection strategies used in compression-ignition engines: (a) fuel blending or emulsions, (b) port fuel injection or fumigation, and (c) direct dual-fuel injection.
The CO and HC penalties associated with fumigation have well-identified physical causes. Because the premixed ethanol–air charge fills the entire cylinder, part of it is forced into crevice volumes, deposits, and the thermal quench layer adjacent to the relatively cold combustion-chamber walls, where the flame initiated by the diesel pilot cannot propagate. This trapped mixture returns to the cylinder during the expansion stroke, when the gas temperature is already too low for complete post-flame oxidation, and is emitted as unburned HC or partially oxidized CO [15,16,17]. In addition, the high latent heat of vaporization of ethanol cools the charge and reduces the in-cylinder gas temperature, which slows the oxidation of CO to CO2 during expansion [16,18]. These mechanisms are intensified at low load: the large excess of air makes the premixed ethanol–air mixture very lean—possibly too lean to sustain flame propagation; the lower bulk-gas and exhaust temperatures further inhibit oxidation; and poor fuel distribution allows lean-mixture regions to escape unburned into the exhaust [15,16,17]. A fraction of the fumigated charge can also short-circuit directly to the exhaust during the valve-overlap period [15].
Beyond these three basic configurations, advanced low-temperature combustion concepts such as reactivity-controlled compression ignition (RCCI) and direct dual-fuel stratification (DDFS) can be regarded as sub-strategies of dual-fuel operation, defined mainly by how and when the low- and high-reactivity fuels are delivered to the cylinder. In RCCI, the low-reactivity fuel is typically port-injected to form a premixed charge, whereas the high-reactivity fuel is directly injected early in the compression stroke, often in split injections, so that the resulting reactivity stratification controls ignition timing and combustion phasing [9,19]. DDFS extends this concept by injecting both fuels directly into the cylinder and using the injection timing to control the in-cylinder distribution of each fuel, thereby combining the efficiency of RCCI with the high-load capability of partially premixed combustion [20]. These concepts provide a high degree of combustion control, but their implementation requires full authority over the diesel injection timing and multiple-injection schedule and, in the case of DDFS, an additional high-pressure direct injector.
The present work adopts the PFI/fumigation strategy because it is compatible with a retrofit architecture and preserves the original high-pressure common-rail diesel injection system and its factory calibration, which would have to be modified to implement RCCI or DDFS. This choice is particularly important for agricultural engines already operating in the field, where extensive redesign of the cylinder head or replacement of the original fuel system would increase cost and reduce practical applicability. The experimental platform is a John Deere PowerTech™ Plus 6068 compression-ignition engine, a six-cylinder, four-stroke, turbocharged, 6.8 L engine equipped with high-pressure common-rail direct injection and compliant with MAR-1/Tier 3 equivalent standards. The engine family is representative of power units used in Brazilian agricultural machinery, such as tractors and harvesters. Therefore, installing an independent ethanol PFI system on this platform allows the proposed strategy to be evaluated under conditions closer to commercial agricultural use than studies based only on small laboratory engines.
Several studies have investigated ethanol or alcohol addition in diesel engines using blending, PFI, or advanced dual-fuel combustion concepts. Recent reviews show that alcohol-assisted compression-ignition combustion can reduce soot, particulate matter, and NOx emissions but often at the expense of higher CO and HC emissions, particularly at low and medium loads [3,9,14]. Experimental PFI studies have reported that hydrous ethanol port injection can achieve high ethanol mass fractions, although ignition delay, combustion duration, emissions, and economic feasibility are strongly affected by the substitution level and fuel prices [10]. Ethanol port injection combined with exhaust-gas recirculation can reduce NOx and environmental damage costs under selected conditions, while CO, HC, and smoke penalties may increase [21]. Ethanol port-injection timing and delivery rate have also been shown to affect in-cylinder pressure, temperature, and combustion behavior in heavy-duty diesel engines [22]. Other works have explored more advanced or alternative configurations, including renewable diesel fuels with bioethanol in dual-fuel mode for small-scale power generation, ethanol blend and dual-fuel modes in advanced compression-ignition platforms, and bioethanol in intelligent charge compression ignition (ICCI) operation [23,24,25]. These studies confirm the potential of ethanol-assisted diesel combustion, but they also highlight the sensitivity of the results to engine architecture, load, injection strategy, ethanol fraction, and fuel properties.
Although numerous studies have already employed the dual-fuel strategy, recent research continues to explore combinations of different fuels under different operating conditions and in diverse applications. Górski et al. [26] evaluated ethanol–diesel blends containing 10 and 20% ethanol by volume in an AVL 5402 single-cylinder research engine and found that ethanol mainly affected the early stage of combustion, reducing the benefit of the pilot injection; with 20% ethanol, the in-cylinder pressure rise was approximately 25% higher, and the peak mean in-cylinder temperature was up to 60 °C higher than with neat diesel, which tends to favor NOx formation, whereas the ignition delay increased by no more than about 1° crank angle. Rehman and Rashid [27] compared diesel–ethanol and diesel–1-pentanol blends at 15, 25, and 50% by volume in a two-cylinder direct-injection diesel engine and reported that the 25% ethanol blend provided the highest brake thermal efficiency and the lowest BSFC, with ethanol fractions of up to 25% offering the most favorable balance of performance, efficiency, and stability. Adekanbi et al. [28] investigated biodiesel–ethanol blends containing up to 50% ethanol in a production 13.6 L multi-cylinder off-road compression-ignition engine and showed that combustion instability is the main barrier at low load, where measures such as charge-air-cooler bypass and pilot injection were required to obtain stable, diesel-like combustion, while higher ethanol fractions increased the maximum pressure-rise rate. In spark-ignition applications, Zhang et al. [29] combined 50% ethanol–gasoline and butanol–gasoline blends with flash-boiling injection in a constant-volume combustion chamber under cold-start gasoline direct-injection conditions and found that the ethanol blend reduced HC emissions by 42% and NOx by 37.5%. These recent works confirm that the response of alcohol-assisted combustion depends strongly on the fuel combination, engine architecture, and operating condition and that low-load operation remains the most critical regime, which is directly relevant to agricultural engines.
Despite these advances, an important literature gap remains regarding the implementation of an independent hydrous-ethanol PFI system in a commercial-scale agricultural compression-ignition engine operating with Brazilian commercial fuels. Many previous studies were conducted using single-cylinder research engines, generator sets, advanced combustion platforms, or non-agricultural configurations. In addition, the primary diesel fuel used in many investigations does not reflect the current Brazilian Diesel S10 market, where the fuel contains a mandatory and progressively increasing biodiesel fraction; during the present experimental campaign, commercial Diesel S10 corresponded to B14, containing 14% biodiesel by volume, according to the national blending regulation [7]. Therefore, the originality of this study lies in evaluating an independent retrofit ethanol PFI system on a widely used John Deere 6068 agricultural engine using hydrous ethanol and Brazilian Diesel S10/B14. The analysis simultaneously quantifies fuel consumption, brake-specific fuel consumption, fuel conversion efficiency, diesel substitution ratio, energy substitution ratio, and regulated exhaust emissions. This integrated performance–emission assessment provides practical evidence for the feasibility and limitations of ethanol fumigation as a diesel-displacement strategy in the Brazilian agricultural sector.
The scope of this work is also aligned with the United Nations Sustainable Development Goals (SDGs) [30]. The partial substitution of fossil diesel by bioethanol contributes to SDG 7 by increasing the use of renewable energy in the transport and agricultural energy matrix. The development of an independent retrofit injection system contributes to SDG 9 by promoting innovation and technological modernization of existing industrial equipment. The evaluation of pollutant emissions supports SDG 11 by addressing air-quality concerns associated with mobile and off-road combustion sources. The use of nationally produced biofuels and the assessment of fuel-use indicators are related to SDG 12, which emphasizes more responsible consumption and production patterns. Finally, the reduction in fossil-carbon dependence and the evaluation of CO2 emission behavior are connected to SDG 13, which focuses on climate-change mitigation.
The remainder of this paper is organized as follows. Section 2 describes the experimental setup, including the John Deere 6068 engine, the independent ethanol injection system, the dynamometer bench, the exhaust-gas measurement devices, the gravimetric fuel-consumption system, and the test procedure. It also defines the performance parameters used in the analysis, including BSFC, DSR, ESR, and FCE. Section 3 presents and discusses the fuel-consumption, performance, and emission results under diesel-only and dual-fuel operation. Finally, Section 4 summarizes the main findings, identifies the principal performance–emission trade-offs, and indicates the calibration requirements for future optimization of the proposed dual-fuel strategy.
2. Materials and Methods
This section describes the experimental arrangement and the calculation procedure used to evaluate the proposed dual-fuel strategy in the John Deere 6068 compression-ignition engine. The section is divided into three subsections. First, the experimental setup is presented, including the engine, the independent ethanol port-injection system, the dynamometer bench, the exhaust-gas measurement devices, the fuel-consumption measurement system, and the adopted test procedure. Second, the performance parameters used to quantify the fuel-use behavior of the dual-fuel configuration are defined—namely, brake-specific fuel consumption (BSFC), diesel substitution ratio (DSR), energy substitution ratio (ESR), and fuel conversion efficiency (FCE). Third, the experimental uncertainty and statistical analysis are described, including repeated measurements, instrument-level uncertainties, uncertainty propagation, and Welch tests used to evaluate differences relative to the diesel-only baseline.
2.1. Experimental Setup
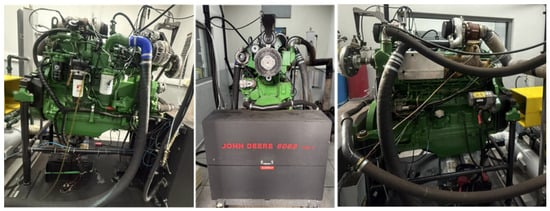
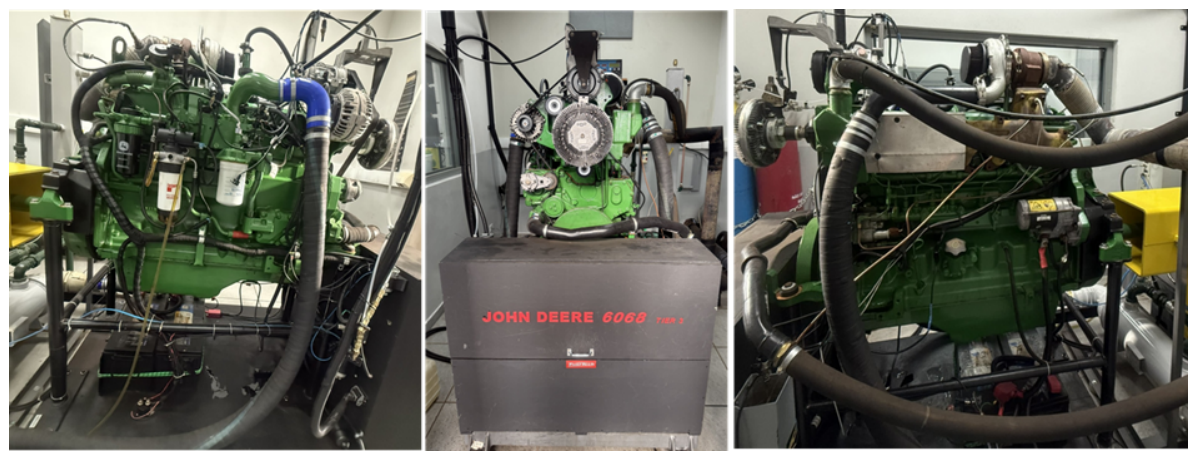
The experimental investigation was performed on a John Deere PowerTech™ Plus 6068 compression-ignition engine installed in a dynamometric test facility. The engine is a six-cylinder, four-stroke, turbocharged diesel engine with air-to-air aftercooling, 6.8 L total displacement, high-pressure common-rail direct injection, and MAR-1/Tier 3 equivalent emission compliance. In Brazil, MAR-1 is the off-road phase of the national PROCONVE emission-control program for new agricultural and road-construction machinery. Established by CONAMA Resolution No. 433/2011, it defines emission limits for engines used in these machines and entered into force in stages beginning in 2015, with the last implementation stage reported for January 2019 [31]. Therefore, the use of a MAR-1/Tier 3 equivalent John Deere engine makes the experimental platform representative of Brazilian regulated agricultural machinery rather than only a generic laboratory diesel engine. The main engine specifications are summarized in Table 1, while Figure 2 shows the engine installed in the dynamometer cell.
Table 1.
John Deere PowerTech™ Plus 6.8 L engine specifications.
Figure 2.
John Deere engine inside the dynamometric testing facility.
2.1.1. Fuel Specification
Two commercial fuels available in Brazil were used in this study: Diesel S10 as the primary fuel and hydrous ethanol as the secondary fuel. Diesel S10 was directly injected into the combustion chamber by the original HPCR system, whereas hydrous ethanol was independently injected into the intake manifold through the port-fuel-injection arrangement described below. According to the ANP [32], Diesel S10 is an ultra-low-sulfur diesel fuel with a maximum sulfur content of 10 mg kg−1. During the experimental campaign, the commercial Diesel S10 used in the tests corresponded to the Brazilian diesel blend available at the pump, which already contained 14% by volume of Fatty Acid Methyl Esters (FAMEs), commonly known as B14 diesel, in accordance with the mandatory national biodiesel-blending regulation. The hydrous ethanol was also used as commercially supplied. No chemical additives, ignition improvers, emulsifiers, or co-solvents were added to either fuel.
For the energy-based calculations, the lower heating values adopted in this work were = 42,500 kJ kg −1 for Diesel S10 and = 26,800 kJ kg −1 for hydrous ethanol. These values were kept consistent with the processed spreadsheet used for the present data reduction and with the official Brazilian reference basis provided by ANP, which publishes conversion factors, densities, and lower heating values for fuels commercialized in Brazil [33].
2.1.2. Independent Ethanol Injection System
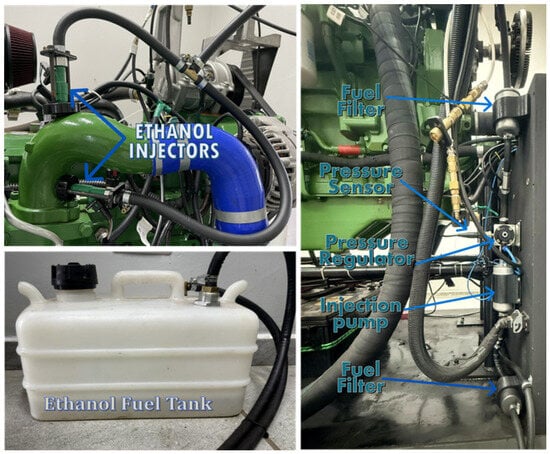
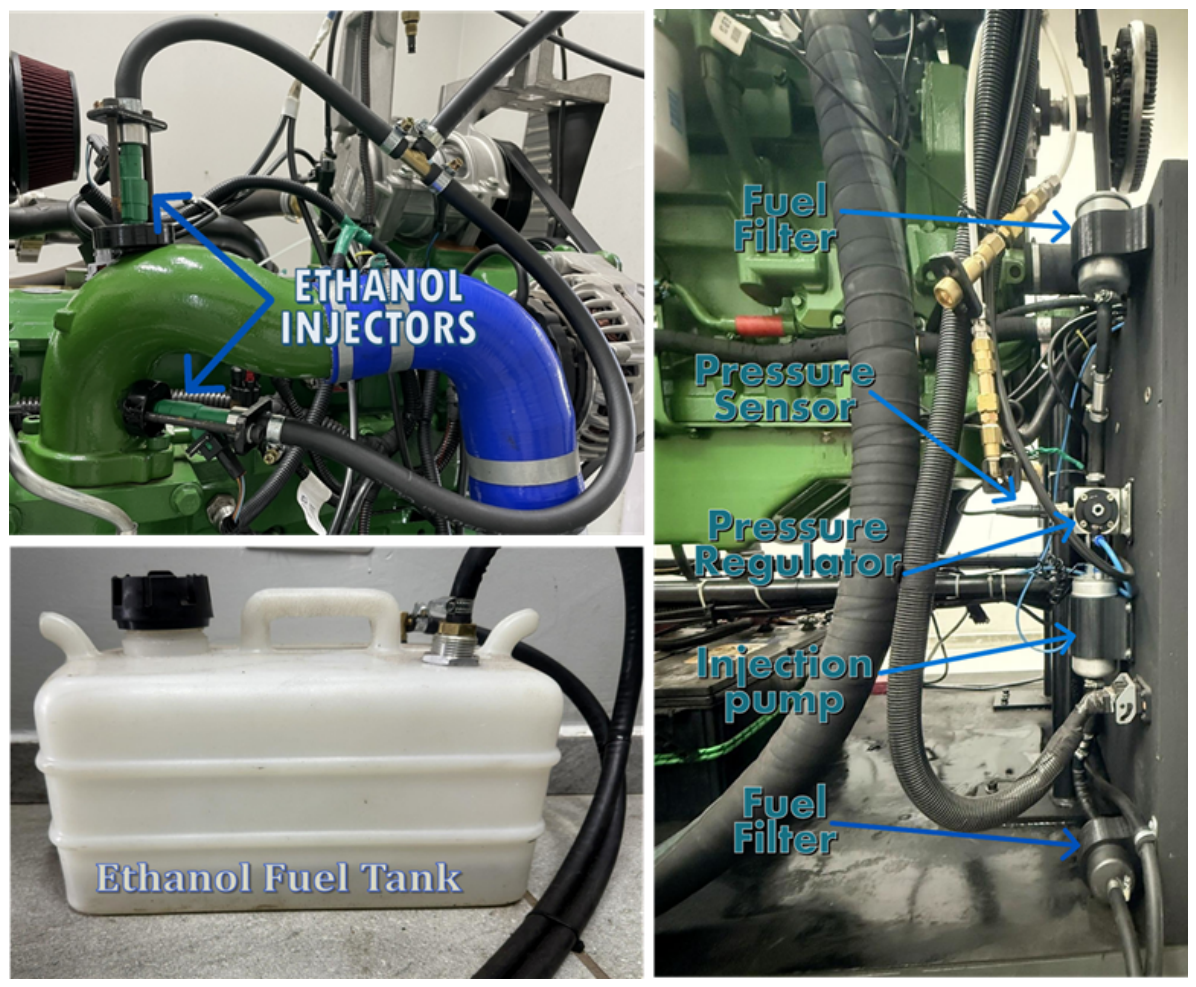
The independent ethanol injection system was designed as a retrofit port-fuel-injection system, keeping the original diesel direct-injection system unchanged. This retrofit architecture was selected to avoid structural modifications to the original engine and to allow ethanol injection to operate without accessing, modifying, or reprogramming the original engine electronic control unit (ECU). The system consists mainly of a FuelTech FT550 programmable ECU [34], Bosch Motorsport EV6 ethanol injectors [35], an ethanol fuel tank, a fuel pump, a pressure regulator, a pressure sensor, fuel filters, and the corresponding fuel lines, as shown in Figure 3. The secondary fuel was introduced upstream of the cylinders, allowing ethanol to mix with the intake air before entering the combustion chamber. Diesel remained responsible for auto-ignition and for stabilizing the combustion process.
Figure 3.
Independent ethanol port-injection system installed on the John Deere 6068 engine.
The FuelTech FT550 ECU was used to control the ethanol injectors independently from the original diesel ECU. This unit allows flexible configuration of fuel maps and injector pulse widths, with a pulse-width resolution of 0.001 ms. It also supports sequential, semi-sequential, and multipoint injection strategies, as well as 2D and 3D injection maps. In the present work, the ethanol system was operated with continuous injection at fixed pulse widths defined by the test matrix. The ECU was also used to monitor auxiliary sensors installed on the engine, including exhaust-gas pressure at the turbocharger inlet, exhaust-gas temperature at the turbocharger inlet and outlet, and the lambda sensor.
The ethanol injector used in this study was a Bosch Motorsport EV6 injector (OE No. 0 280 155 968). According to the manufacturer data, this injector has an electrical resistance of 12 and a nominal static flow rate of 349 g/min at 380 kPa. At 300 kPa, the static flow rate is 310.1 g/min, corresponding to 443 mL/min, and the dynamic flow rate is 9.77 g per 1000 injection impulses for an injection time of 2.5 ms. These characteristics were considered suitable for the ethanol fumigation strategy evaluated in the present engine platform.
2.1.3. Dynamometer Bench and Data Acquisition
The engine was coupled to an SP TRONIC HD400 hydraulic dynamometer [36] through a cardan shaft. The HD400 is a water-brake dynamometer equipped with an inlet servo-valve for rapid and precise load control, electronic torque measurement, and rotational-speed sensing. According to the manufacturer, the dynamometer is suitable for engines up to 400 hp (294 kW), with maximum torque of 165 kgm and maximum speed of 4000 rpm. The main dynamometer specifications are summarized in Table 2. The tests were operated through the ECAT v1.0 (Engine Control and Acquisition Technology) software, which enables automated test routines, real-time data acquisition, safety-limit monitoring, and export of experimental data for subsequent processing.
Table 2.
Main specifications of the SP TRONIC HD400 hydraulic dynamometer.
2.1.4. Exhaust-Gas Measurement
The exhaust emissions were measured using two systems. CO2, CO, and total HC were measured using a Tecnomotor TM-131 gas analyzer [37] based on non-dispersive infrared (NDIR) spectroscopy. The measurement range and resolution were 0–10% vol and 0.01% vol for CO, 0–20% vol and 0.1% vol for CO2, 0–20,000 ppm vol and 1 ppm vol for HC as hexane equivalent, and 0–40,000 ppm vol and 1 ppm vol for HC as propane equivalent. NOx were measured using an ECOTORQ portable NOx analyzer [38], which performs direct sampling through a calibrated probe and reports NOx concentration in ppm.
2.1.5. Fuel-Consumption Measurement
Diesel and ethanol consumption were measured gravimetrically using two Marte AD-5002 precision balances [39], one for each fuel. Each balance has a maximum capacity of 5010 g, readability of 0.01 g, reproducibility of 0.01 g, tare range from 0 to 5010 g, and RS232 communication interface. The balances were connected to a computer, and a data-acquisition script recorded the fuel mass at 1 s intervals. The fuel consumption rate was then obtained from the mass variation over the selected steady-state time interval.
2.1.6. Summary of Equipment, Instruments, and Fuels
For clarity, the main equipment, measuring instruments, and fuels used in the experimental campaign are summarized in Table 3, together with their manufacturers and their function in the test bench.
Table 3.
Main equipment, measuring instruments, and fuels used in the experimental campaign.
2.1.7. Experimental Procedure and Test Matrix
Before each test sequence, the engine was warmed up at idle speed, approximately 900 rpm, for about 15 min. The gas analyzer and NOx meter were initialized and allowed to complete their internal warm-up and calibration routines. For each operating point, the engine was brought from idle to the target speed and torque using the dynamometer control system. After the operating condition had stabilized, a continuous time window was selected for data analysis.
The dual-fuel test matrix comprised two engine speeds (1200 and 1600 rpm); two brake torque levels (200 and 800 N·m); and three ethanol injection pulse widths (0, 10, and 20 ms). The 0 ms condition corresponds to the original diesel-only operation and was used as the baseline for each speed–torque condition. For each test point, engine speed and brake torque were maintained as constant as possible, while only the ethanol injection pulse width was changed. This procedure allowed the influence of ethanol addition to be evaluated under equivalent brake-power conditions.
The operating points were selected to reproduce, at both ends of the load range, the ways in which agricultural engines are typically used in the field. In tractors and harvesters, the engine usually runs at a speed that is kept approximately constant by the operator or governor to meet the power take-off or implement requirement, while the load varies from low to high depending on the implement and field conditions. Accordingly, two engine speeds were combined with a low and a high brake torque: 1600 rpm lies close to the peak-torque speed of the engine (1550 rpm, Table 1), whereas 1200 rpm represents a reduced-speed condition, and the torque levels of 200 and 800 N·m correspond to approximately 20% and 78% of the peak torque. This steady-state, discrete speed–load approach is consistent with the modal logic of off-road emission test cycles, such as those defined in ISO 8178-4 [40]. The purpose of the matrix was to quantify, at low and high load, the changes in emissions and fuel consumption relative to the original diesel-only operation so that the combined results can subsequently be used to identify an optimum operating point or a load-dependent ethanol calibration applicable to the real duty cycle of this engine.
The ethanol injection pulse widths were defined based on preliminary tests on the same engine. The upper limit of 20 ms corresponded to the maximum amount of ethanol that could be injected while maintaining engine operation; for longer pulse widths, the charge-cooling effect of ethanol evaporation led to engine shutdown. The intermediate value of 10 ms, corresponding to half of this maximum feasible injection, was adopted to characterize the evolution of performance and emissions between the diesel-only baseline and the maximum substitution level.
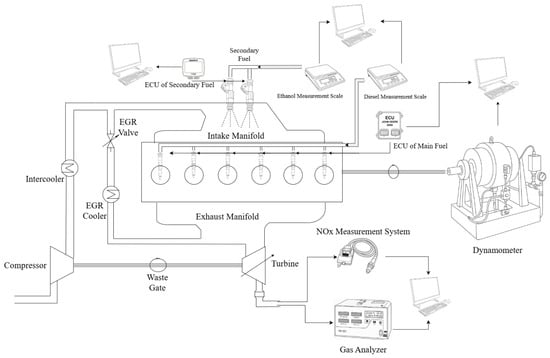
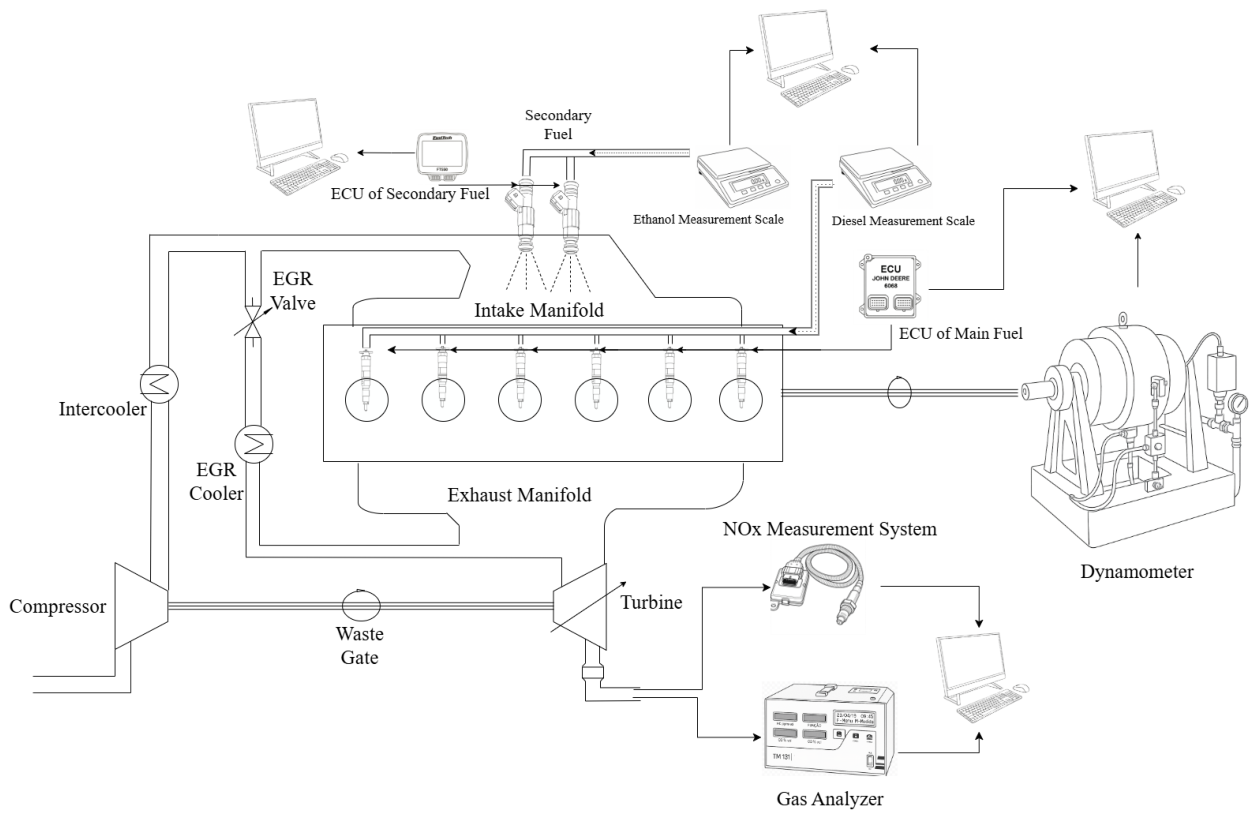
Figure 4 summarizes the experimental arrangement, including the diesel system, the independent ethanol circuit, the intake and exhaust paths, the dynamometer, the gas analyzer, the NOx measurement system, and the data-acquisition computers.
Figure 4.
Schematic of the experimental setup used for the dual-fuel tests.
2.2. Engine Performance Parameters
The performance analysis was based on the brake power measured during the dynamometer tests, the diesel and ethanol mass-flow rates obtained from the gravimetric system, and the lower heating values of both fuels. The formulations in this subsection follow the engine-performance definitions and mass- and energy-balance framework presented by Heywood [41], adapted here to account for the separate diesel and ethanol streams and to define the mass-based diesel substitution ratio and the ethanol energy fraction. The brake power, , can be obtained from the measured engine speed and brake torque as
where is the brake power in kW, N is the engine speed in rpm, and T is the brake torque in N·m.
The total fuel mass-flow rate in the dual-fuel operation is defined as
where is the diesel mass-flow rate and is the ethanol mass-flow rate. In the present analysis, both mass-flow rates are expressed in g/s.
2.2.1. Brake-Specific Fuel Consumption
The brake-specific fuel consumption (BSFC) was calculated using the total mass-flow rate of both fuels. This definition is suitable for dual-fuel operation because it accounts for the total fuel mass required to produce a given brake power:
In Equation (3), is expressed in g/kWh, and are in g/s, and is in kW. For the baseline diesel-only condition, .
2.2.2. Diesel Substitution Ratio
The diesel substitution ratio (DSR) quantifies the percentage reduction in diesel mass consumption relative to the diesel-only baseline at the same engine speed and brake torque. It is defined as
where is the diesel mass-flow rate in the baseline condition and is the diesel mass-flow rate during dual-fuel operation. The baseline condition has by definition. This parameter is mass-based and therefore indicates how much diesel mass was replaced by ethanol, but it does not account for the different heating values of the two fuels.
2.2.3. Energy Substitution Ratio
The energy substitution ratio (ESR) represents the fraction of the total chemical energy supplied by ethanol during dual-fuel operation. It is calculated as
where and are the lower heating values of Diesel S10 and hydrous ethanol, respectively, in kJ/kg. The division by 1000 converts the mass-flow rates from g/s to kg/s. Unlike DSR, ESR accounts for the lower energy density of ethanol and therefore provides an energy-based measure of fuel replacement.
2.2.4. Fuel Conversion Efficiency
The brake fuel conversion efficiency (FCE), , expresses the fraction of the total fuel chemical-energy rate converted into brake power. For dual-fuel operation, it was computed by considering the energy input from both diesel and ethanol:
Here, is in kW, the fuel mass-flow rates are originally measured in g/s, and the lower heating values are in kJ/kg. Therefore, the denominator represents the total chemical-energy input rate in kJ/s, which is numerically equivalent to kW. For the baseline condition, Equation (6) reduces to the conventional diesel-only brake fuel conversion efficiency because .
Together, BSFC, DSR, ESR, and FCE provide complementary information. BSFC indicates the total mass of fuel required per unit of brake energy, DSR quantifies the reduction in diesel mass consumption, ESR expresses the energetic contribution of ethanol, and FCE evaluates how effectively the combined chemical energy of diesel and ethanol is converted into useful brake work.
2.3. Experimental Uncertainty and Statistical Analysis
Each operating point was measured in repeated runs, and all derived quantities are reported as the mean ± one standard deviation (SD). For the main performance and emission metrics, the 95% confidence interval of the mean (CI95) and the coefficient of variation (CV) were also computed. The number of valid repetitions (n) ranged from three to four depending on engine speed. Specifically, each 1200 rpm operating point was measured with three valid repetitions (), whereas each 1600 rpm operating point was measured with four valid repetitions ().
The instrument-level (type-B) uncertainties of the primary measurements are listed in Table 4. The uncertainties of the derived quantities were obtained by standard propagation of uncertainty, following the method of Kline and McClintock [42] and the Guide to the Expression of Uncertainty in Measurement (GUM) [43]. For a quantity () with independent inputs,
Table 4.
Instrument resolution and estimated standard (type-B) uncertainty of the primary measured quantities.
Applying Equation (7) to Equations (1)–(6) gives the relative uncertainties of , BSFC, FCE, DSR, and ESR. Because torque and speed are measured with relative uncertainties below 1%, the dominant contribution to the performance metrics comes from the fuel mass-flow measurement, particularly at low load, where the diesel mass flow is small and the run-to-run scatter is larger. The resulting propagated standard deviations are reported together with the experimental SD in the result tables and shown as error bars in the figures.
For each dual-fuel condition, the statistical significance of the change relative to the corresponding diesel-only baseline was assessed with a two-sample Welch t-test (unequal variances) [44] on the raw repetitions, using a significance level of . The Welch test was preferred over the t-test because the baseline and dual-fuel groups do not have equal variances or equal sample sizes. The significance outcome is reported in the emission tables. This statistical layer is used to avoid over-interpreting differences that fall within the experimental scatter—in particular, at operating points where the baseline itself shows a high coefficient of variation.
3. Results and Discussion
This section presents and discusses the experimental results obtained with the proposed dual-fuel strategy based on independent ethanol port injection in a John Deere 6068 compression-ignition engine. The analysis was conducted at two engine speeds, 1200 and 1600 rpm, and two brake torque levels, 200 and 800 N·m, while the ethanol injection pulse width was varied among 0, 10, and 20 ms. The 0 ms condition corresponds to the original diesel-only operation and was adopted as the baseline for all comparative evaluations. For each operating condition, the engine speed and brake torque were kept constant, allowing the effects of ethanol addition to be evaluated under equivalent brake-power conditions. The results are discussed in terms of diesel consumption, ethanol consumption, brake-specific fuel consumption, fuel conversion efficiency, diesel substitution ratio, energy substitution ratio, and exhaust emissions. The emission analysis includes CO2, CO, HC, and NOx, enabling the environmental response of the dual-fuel strategy to be interpreted together with its fuel-use and performance behavior. This combined approach allows the practical viability of ethanol fumigation in agricultural compression-ignition engines to be assessed in terms of the relationship between fuel replacement, combustion efficiency, and emission trade-offs.
Before presenting the derived performance indicators, the primary experimental inputs used for the fuel-consumption and performance analysis are summarized in Table 5. The table reports the brake power, , measured for each operating condition, together with the average mass-flow rates of Diesel S10 and hydrous ethanol obtained from the gravimetric fuel-consumption system. The baseline cases correspond to diesel-only operation, with zero ethanol injection, whereas the 10 and 20 ms cases represent dual-fuel operation with independent ethanol port injection. These values constitute the direct input data for the calculation of BSFC, DSR, ESR, and FCE discussed in the following subsection.
Table 5.
Brake power and average fuel-consumption rates for the tested dual-fuel operating conditions.
As shown in Table 5, the brake power remained within a narrow range for each fixed speed–torque condition, confirming that the comparison between baseline and dual-fuel operation was performed under approximately equivalent brake-load conditions. At 1200 rpm and 200 N·m, varied from 24.849 to 25.821 kW, corresponding to a maximum deviation of 3.9% from the baseline, while at 1200 rpm and 800 N·m, it remained close to 100 kW, within 1.0% of the baseline. Similarly, at 1600 rpm, the low-load cases remained at approximately 34 kW (within 1.2%), whereas the high-load cases ranged from 132.277 to 135.511 kW (within 2.4%). Therefore, variations in the subsequent performance indicators are mainly associated with the change in fuel composition rather than with large changes in useful brake power.
The fuel-consumption data also show the expected reduction in Diesel S10 mass flow as the ethanol injection pulse width increased. This reduction was particularly pronounced under low-load conditions. At 1200 rpm and 200 N·m, diesel consumption decreased from 1.664 g/s in the baseline case to 0.634 g/s with 20 ms ethanol injection, a reduction of 61.9%. At 1600 rpm and 200 N·m, it decreased from 2.490 to 0.996 g/s, a reduction of 60.0%. Under high-load conditions, the reduction was more moderate in relative terms, with diesel consumption decreasing from 6.113 to 4.879 g/s at 1200 rpm and 800 N·m () and from 8.693 to 6.860 g/s at 1600 rpm and 800 N·m (). In parallel, hydrous ethanol consumption increased with the injection pulse width in all operating conditions, reflecting the intended replacement of part of the diesel fuel by the secondary renewable fuel.
3.1. Fuel Consumption and Engine Performance Under Dual-Fuel Operation
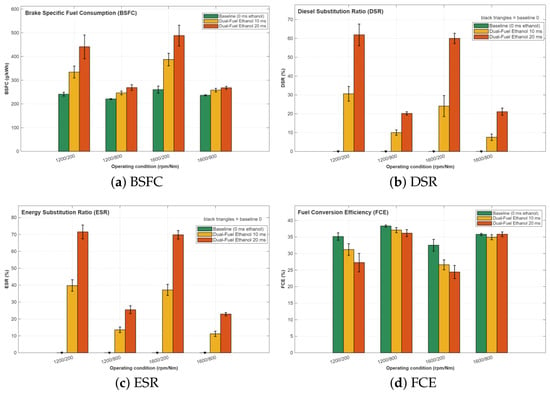
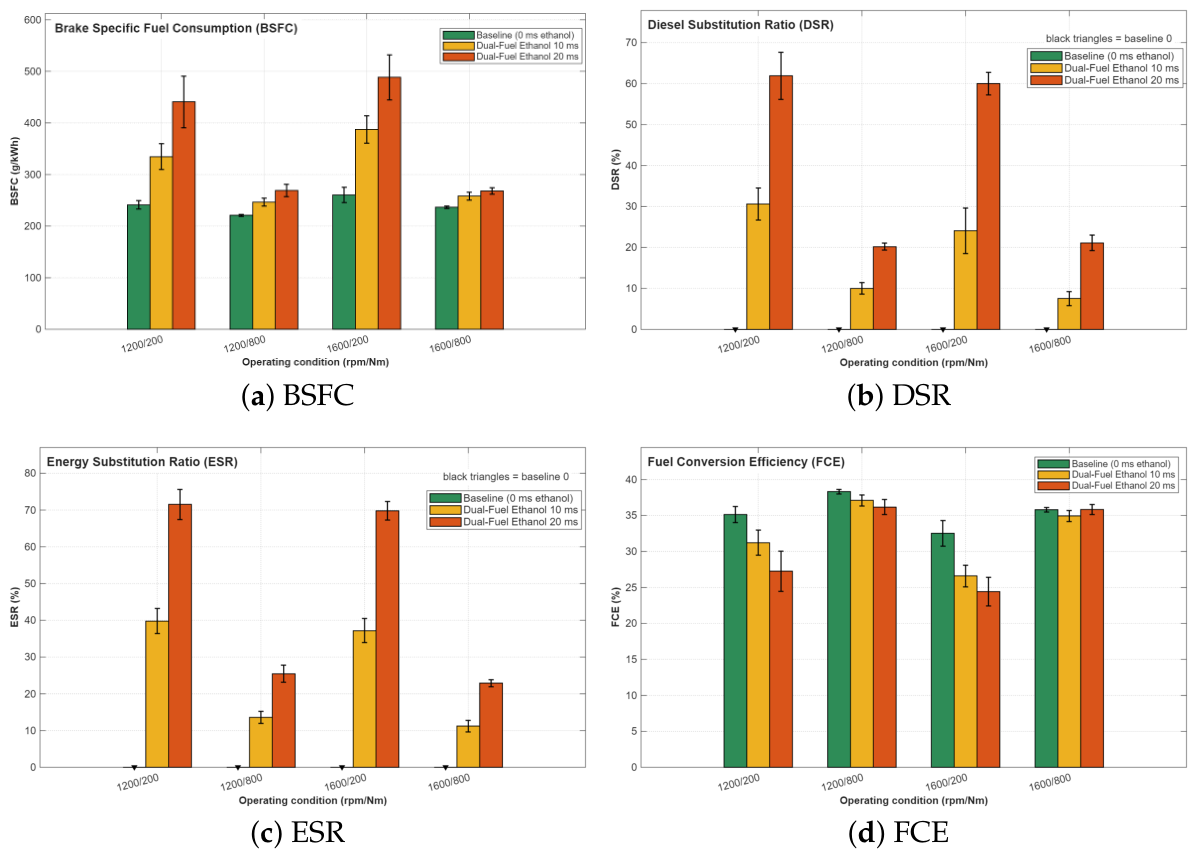
Table 6 consolidates the derived performance metrics (BSFC, FCE, DSR, and ESR) for all operating conditions, each reported as mean ± propagated standard deviation. The corresponding trends are shown in Figure 5, where the error bars represent the propagated SD.
Table 6.
Derived performance metrics (mean ± propagated SD) under diesel-only (0 ms) and hydrous-ethanol dual-fuel operation.
Figure 5.
Fuel-use and engine-performance indicators under diesel-only and hydrous-ethanol dual-fuel operation: (a) brake-specific fuel consumption (BSFC), (b) diesel substitution ratio (DSR), (c) energy substitution ratio (ESR), and (d) brake fuel conversion efficiency (FCE).
Figure 5a presents the brake-specific fuel consumption (BSFC) for the baseline diesel operation and for the dual-fuel cases with ethanol injection pulse widths of 10 and 20 ms. In all operating conditions, the addition of ethanol increased the mass-based BSFC, by between 9.2% and 87.6% relative to the corresponding baseline. Part of this increase is expected and does not, by itself, indicate a deterioration of engine operation: because ethanol has a lower LHV than Diesel S10, a larger fuel mass is required to deliver the same fuel energy and, therefore, the same brake power when part of the diesel is replaced by ethanol. To distinguish this inherent heating-value effect from a genuine efficiency penalty, the BSFC increase that would result from the lower LHV of the diesel–ethanol mixture alone, i.e., at constant FCE, was also estimated for each case; any increase beyond this value reflects a loss in fuel conversion efficiency.
At low load, the increase in BSFC was more pronounced. At 1200 rpm and 200 N·m, BSFC increased from 241.1 g/kWh in the baseline case to 334.6 g/kWh with 10 ms ethanol injection and 440.9 g/kWh with 20 ms, corresponding to increases of 38.8% and 82.9%, respectively. Similar behavior was observed at 1600 rpm and 200 N·m, where BSFC increased from 260.4 g/kWh to 387.5 g/kWh and 488.5 g/kWh, representing increases of 48.8% and 87.6%, respectively. With 20 ms injection, only about half of these increases (41.9% at 1200 rpm and 40.9% at 1600 rpm) can be attributed to the lower LHV of the fuel mixture; the remainder reflects a genuine efficiency loss, which constitutes a clear disadvantage of ethanol fumigation at low load. This loss is mainly attributed to the cooling effect of ethanol evaporation and the lower in-cylinder temperature, which reduce combustion completeness.
At high load, the BSFC increase was substantially smaller, ranging from 9.2% to 21.8%, i.e., approximately 3.4 to 6.6 times smaller than the corresponding low-load increases. At 1200 rpm and 800 N·m, BSFC increased from 221.0 g/kWh to 246.5 g/kWh and 269.2 g/kWh for 10 and 20 ms, corresponding to increases of 11.5% and 21.8%, respectively. At 1600 rpm and 800 N·m, the increase was even more moderate, from 236.6 g/kWh to 258.4 g/kWh and 268.1 g/kWh, corresponding to increases of 9.2% and 13.3%, respectively. Notably, the 13.3% increase observed at 1600 rpm and 800 N·m with 20 ms injection is entirely explained by the lower LHV of the fuel mixture (13.4%), which means that diesel was partially replaced by ethanol without a measurable efficiency penalty; this is a favorable result for the proposed strategy. This suggests that high-load operation partially compensates for the negative effects of ethanol cooling, since the higher combustion temperature and turbulence improve fuel oxidation.
Figure 5b shows the diesel substitution ratio (DSR), which quantifies the reduction in diesel mass flow relative to the baseline diesel-only condition. As expected, the baseline cases present zero diesel substitution, while increasing the ethanol injection pulse width from 10 to 20 ms increased the DSR by a factor of 2.0 to 2.8 in all operating conditions.
The highest diesel substitution levels occurred under low-load conditions. At 1200 rpm and 200 N·m, DSR increased from 30.6% with 10 ms ethanol injection to 61.9% with 20 ms. At 1600 rpm and 200 N·m, the corresponding values were 24.1% and 60.0%. These results indicate that, at low load, approximately 60% of the diesel mass can be replaced by ethanol, which is the most favorable result in terms of fossil-fuel displacement. However, this high substitution level must be interpreted together with the BSFC and FCE results, since the same conditions also showed the strongest deterioration in fuel conversion efficiency.
At high load, the DSR was approximately one-third of the corresponding low-load value. At 1200 rpm and 800 N·m, DSR reached 10.0% and 20.2% for 10 and 20 ms, respectively. At 1600 rpm and 800 N·m, the values were 7.6% and 21.1%. This lower substitution level is associated with the higher total energy demand at high torque, where a larger diesel contribution is still required to sustain combustion and maintain the imposed brake load. Nevertheless, because the baseline diesel consumption at high load is much larger, the absolute diesel mass flow displaced with 20 ms injection was greater at high load than at low load: 1.234 versus 1.030 g/s at 1200 rpm and 1.833 versus 1.494 g/s at 1600 rpm, i.e., approximately 20–23% more diesel saved per unit time. Therefore, the lower DSR at high load does not imply a smaller diesel saving in absolute terms, which is favorable because fuel consumption and, hence, the potential for diesel savings are greatest in this operating range.
Figure 5c presents the energy substitution ratio (ESR), which represents the fraction of the total chemical energy supplied by ethanol during dual-fuel operation. This parameter is essential because it evaluates fuel substitution on an energy basis rather than only on a mass-flow basis.
The ESR followed the same general trend as the DSR, increasing with ethanol injection pulse width and reaching higher values under low-load conditions. At 1200 rpm and 200 N·m, ethanol contributed 39.8% of the total fuel energy with 10 ms injection and 71.6% with 20 ms. At 1600 rpm and 200 N·m, the ESR values were similarly high, reaching 37.2% and 69.8%. These results demonstrate that ethanol became the dominant energy source at low load when the 20 ms pulse width was applied.
At high load, the energy contribution of ethanol was approximately one-third of that obtained at low load. At 1200 rpm and 800 N·m, ESR increased from 13.6% to 25.5% when the ethanol pulse width was increased from 10 to 20 ms. At 1600 rpm and 800 N·m, the corresponding values were 11.2% and 22.9%. Therefore, although ethanol injection effectively reduced diesel demand in all cases, its energy contribution was strongly dependent on engine load. The low-load cases favored high ethanol energy substitution, whereas high-load cases maintained a larger diesel energy contribution.
Figure 5d shows the fuel conversion efficiency (FCE), calculated by considering the chemical energy supplied by both diesel and ethanol. Unlike BSFC, which is a mass-based metric, FCE provides a more direct thermodynamic indication of how effectively the engine converted the total fuel energy into brake power.
At low load, ethanol injection reduced FCE considerably, by 3.9 to 8.1 percentage points (11.2% to 24.9% in relative terms), which represents the main performance disadvantage of the strategy. At 1200 rpm and 200 N·m, FCE decreased from 35.1% in the baseline case to 31.2% and 27.3% for 10 and 20 ms ethanol injection, corresponding to reductions of 3.9 and 7.9 percentage points, respectively. At 1600 rpm and 200 N·m, the penalty was even stronger, with FCE decreasing from 32.5% to 26.6% and 24.4%, corresponding to reductions of 5.9 and 8.1 percentage points, respectively. This confirms that, although ethanol allowed substantial diesel substitution at low load, a significant portion of the supplied chemical energy was not efficiently converted into brake work.
At high load, the FCE penalty was much smaller and did not exceed 2.2 percentage points (5.7% in relative terms). At 1200 rpm and 800 N·m, FCE decreased slightly from 38.3% to 37.1% and 36.2%, corresponding to reductions of 1.2 and 2.2 percentage points, respectively. At 1600 rpm and 800 N·m, FCE remained practically unchanged, varying from 35.8% in the baseline condition to 34.9% with 10 ms and 35.8% with 20 ms, i.e., changes of and percentage points, which are of the same order as or smaller than the propagated SD reported in Table 6. This result is particularly relevant because it suggests that, under high-load and medium-speed operation, ethanol fumigation can reduce diesel consumption while maintaining nearly the same fuel conversion efficiency. The higher in-cylinder temperature and stronger turbulence at this operating point likely improved ethanol–air mixing and oxidation.
3.2. Emission Characteristics Under Dual-Fuel Operation
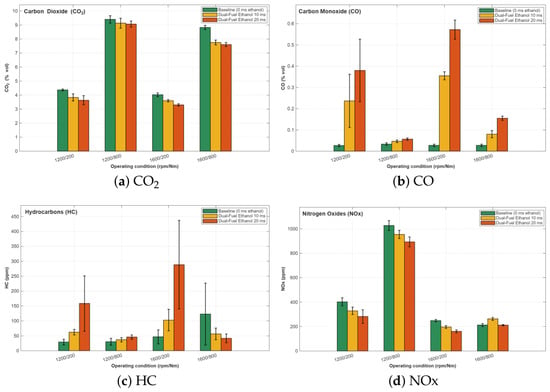
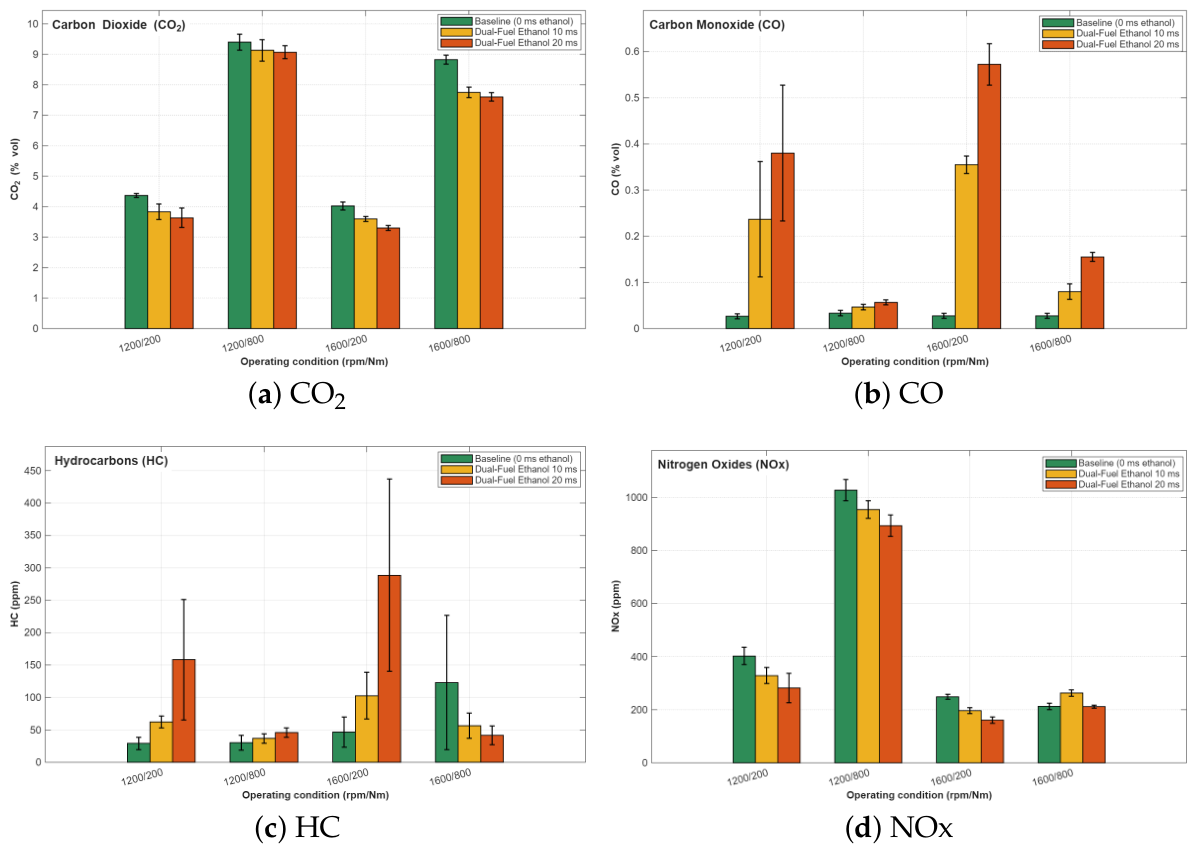
The exhaust-gas concentration results are consolidated in Table 7, reported as mean ± CI95 with the percentage change relative to the corresponding diesel-only baseline. A superscript asterisk marks changes that are statistically significant at according to a Welch t-test on the raw repetitions. The trends are illustrated in Figure 6 and Figure 7.
Table 7.
Exhaust-gas concentrations (mean ± CI95) and percentage changes relative to the diesel-only baseline. CO2 and CO are expressed in % vol and HC and NOx in ppm. * Statistically significant change versus baseline (Welch t-test, ).
Figure 6.
Regulated exhaust emissions under diesel-only and hydrous-ethanol dual-fuel operation: (a) carbon dioxide (CO2), (b) carbon monoxide (CO), (c) total hydrocarbons (HC), and (d) nitrogen oxides (NOx).
Figure 7.
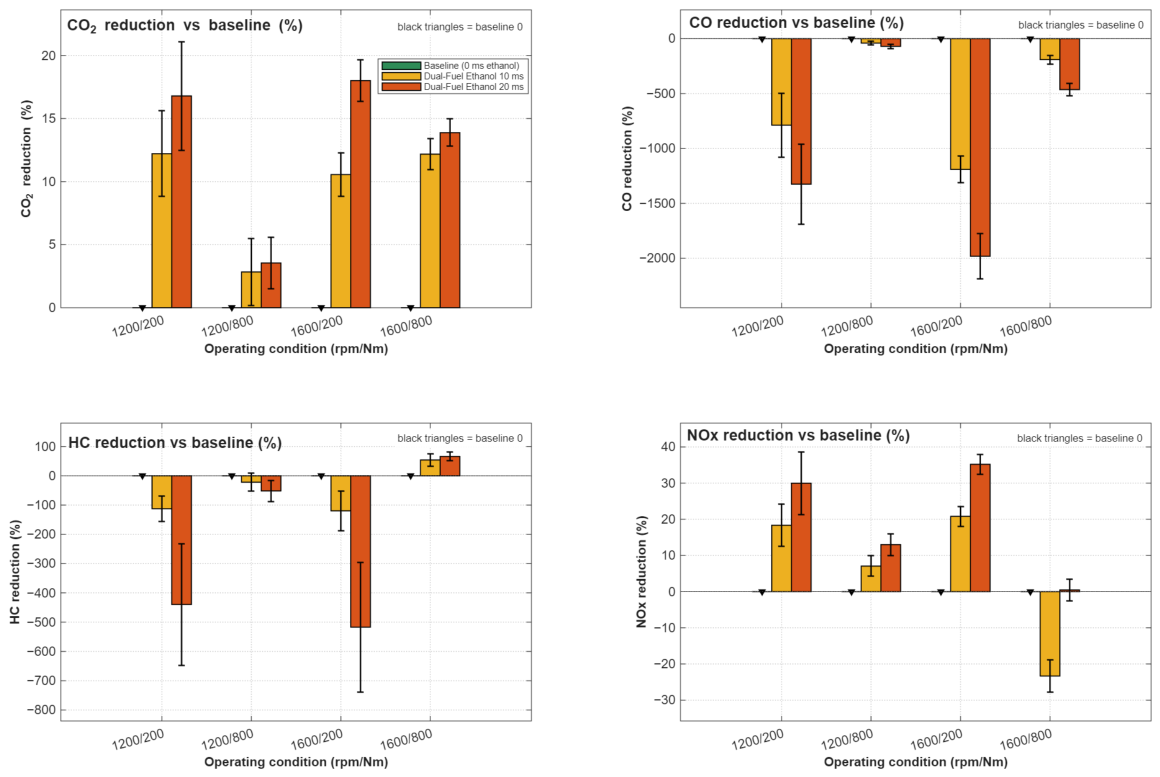
Relativeemission variation under dual-fuel operation compared with the corresponding diesel-only baseline. Positive values indicate reductions, and negative values indicate penalties.
Figure 6a presents the CO2 emissions for all operating conditions. The addition of ethanol reduced the CO2 concentration in all eight dual-fuel cases, by 2.8% to 18.0% relative to the corresponding baseline, which is a favorable outcome of the strategy. These reductions were statistically significant in all cases at 1600 rpm, whereas at 1200 rpm, they remained within the experimental scatter (Table 7).
At 1200 rpm and 200 N·m, CO2 decreased from 4.37% vol in the baseline condition to 3.83% vol and 3.63% vol with 10 and 20 ms ethanol injection, corresponding to reductions of 12.2% and 16.8%, respectively. At 1600 rpm and 200 N·m, the reduction was similar, from 4.03% vol to 3.60% vol and 3.30% vol, corresponding to reductions of 10.6% and 18.0%, respectively. These reductions are mainly associated with the lower carbon content of ethanol compared with diesel. However, at low load, part of this decrease does not represent a net carbon benefit: the simultaneous rise in CO (0.21–0.55% vol) corresponds to approximately 40–75% of the CO2 decrease, indicating that a fraction of the fuel carbon was emitted as CO instead of being fully oxidized to CO2.
At high load, the response depended more strongly on engine speed. At 1200 rpm and 800 N·m, CO2 decreased only slightly, from 9.40% vol to 9.13% vol and 9.07% vol, equivalent to reductions of 2.8% and 3.5%, respectively. In contrast, at 1600 rpm and 800 N·m, CO2 decreased from 8.82% vol to 7.75% vol and 7.60% vol, corresponding to reductions of 12.1% and 13.8%, respectively. In this case, the CO increase corresponded to no more than about 10% of the CO2 decrease, so the CO2 reduction mainly reflects the substitution of diesel by ethanol rather than incomplete oxidation. This indicates that the combination of higher speed and high load favored a more effective use of the ethanol fraction, leading to a more pronounced reduction in carbon-based emissions.
Figure 6b shows the CO emissions. In contrast to CO2, CO increased in all dual-fuel cases, revealing a clear penalty associated with incomplete combustion. This behavior is one of the main limitations of ethanol fumigation in compression-ignition engines.
The CO increase was particularly severe under low-load conditions. At 1200 rpm and 200 N·m, CO increased from 0.027% vol in the baseline case to 0.237% vol with 10 ms and 0.380% vol with 20 ms, representing increases of 787.5% and 1325%, respectively. At 1600 rpm and 200 N·m, the increase was even stronger, from 0.028% vol to 0.355% vol and 0.573% vol, corresponding to increases of 1190.9% and 1981.8%, respectively. At 1600 rpm, these increases were statistically significant, whereas at 1200 rpm, the large run-to-run scatter of the dual-fuel measurements placed them within the experimental uncertainty (Table 7).
At high load, CO emissions also increased, but the relative penalty (+40% to +464%) was considerably smaller than at low load (+788% to +1982%), and the absolute CO concentration did not exceed 0.155% vol. At 1200 rpm and 800 N·m, CO increased from 0.033% vol to 0.047% vol and 0.057% vol, corresponding to increases of 40% and 70%, respectively. At 1600 rpm and 800 N·m, CO increased from 0.028% vol to 0.080% vol and 0.155% vol, representing increases of 190.9% and 463.6%, respectively. The increase in CO is mainly attributed to the high latent heat of vaporization of ethanol, which cools the intake charge and reduces the oxidation rate of CO to CO2. This effect is intensified at low load, where the baseline combustion temperature is already lower.
Figure 6c presents the hydrocarbon (HC) emissions. The HC response was strongly dependent on load and speed, revealing a complex interaction between ethanol evaporation, combustion temperature, mixture preparation, and oxidation completeness.
At low load, HC emissions increased substantially with ethanol injection. At 1200 rpm and 200 N·m, HC increased from 29.3 ppm in the baseline case to 62.3 ppm and 158.3 ppm with 10 and 20 ms injection, representing increases of 112.5% and 439.8%, respectively. At 1600 rpm and 200 N·m, HC increased from 46.8 ppm to 102.8 ppm and 288.5 ppm, corresponding to increases of 119.8% and 517.1%, respectively. This confirms that low-load ethanol fumigation intensified incomplete combustion, most likely due to charge cooling and flame quenching near colder regions of the combustion chamber.
At 1200 rpm and 800 N·m, HC also increased but with a lower magnitude, from 30.3 ppm to 37.0 ppm and 46.0 ppm. This corresponds to an increases of 22.0% and 51.6%, respectively, neither of which was statistically significant. However, a different trend was observed at 1600 rpm and 800 N·m. In this condition, HC decreased from approximately 123 ppm in the baseline case to 56.5 ppm and 41.8 ppm with ethanol injection, corresponding to reductions of 54.1% and 66.1%, respectively. This suggests that, at high load and higher engine speed, the increase in in-cylinder temperature and turbulence was sufficient to overcome the cooling effect of ethanol and promote more complete oxidation of unburned hydrocarbons. Nevertheless, these reductions were not statistically significant because of the large scatter of the baseline HC measurement under this condition (123 ± 165 ppm); they should therefore be interpreted as a favorable tendency rather than a confirmed benefit.
Figure 6d shows the NOx emissions under baseline and dual-fuel operation. In seven of the eight dual-fuel cases, ethanol injection reduced NOx emissions, by up to 35.2%, mainly due to the charge-cooling effect associated with ethanol vaporization. Since thermal NOx formation is highly dependent on peak combustion temperature, the lower in-cylinder temperature caused by ethanol addition tends to inhibit NOx formation.
At low load, NOx reductions were consistent and statistically significant in all four cases. At 1200 rpm and 200 N·m, NOx decreased from 402.2 ppm to 328.3 ppm and 281.6 ppm with 10 and 20 ms ethanol injection, corresponding to reductions of 18.4% and 30.0%, respectively. At 1600 rpm and 200 N·m, NOx decreased from 248.4 ppm to 196.7 ppm and 160.9 ppm, corresponding to reductions of 20.8% and 35.2%, respectively. These results indicate that low-load operation is highly sensitive to ethanol-induced cooling, making NOx mitigation more effective, which is a clear environmental benefit of the strategy.
At 1200 rpm and 800 N·m, NOx decreased from 1026.9 ppm to 954.4 ppm and 893.4 ppm, corresponding to reductions of 7.1% and 13.0%, respectively, although only the latter was statistically significant. However, at 1600 rpm and 800 N·m, the behavior was different. NOx increased from 212.9 ppm to 262.6 ppm with 10 ms injection, corresponding to a statistically significant increase of 23.3%, which is an undesirable outcome, then returned to the baseline level with 20 ms injection (, not statistically significant). This indicates a competition between two opposite mechanisms: ethanol evaporation reduces temperature, but the combustion of a premixed ethanol–air charge at high load and high turbulence can create localized temperature peaks, favoring NOx formation.
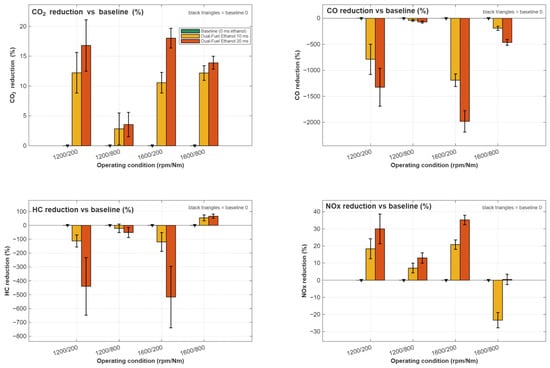
Figure 7 summarizes the relative emission variation with respect to the baseline diesel operation. Positive values indicate emission reduction, whereas negative values indicate an emission penalty. This overview clearly shows the main trade-off of the proposed dual-fuel strategy.
For CO2, all dual-fuel cases presented reductions. The strongest CO2 reductions were observed at low load with 20 ms ethanol injection, reaching 16.8% at 1200 rpm and 18.0% at 1600 rpm. A significant reduction was also observed at 1600 rpm and 800 N·m, where CO2 decreased by 13.8% with 20 ms ethanol injection. Therefore, ethanol fumigation consistently reduced CO2 emissions, mainly because ethanol has a lower carbon content than Diesel S10.
For NOx, the response was also generally favorable, especially at low load. NOx reductions reached 30.0% at 1200 rpm and 200 N·m and 35.2% at 1600 rpm and 200 N·m with 20 ms ethanol injection. However, at 1600 rpm and 800 N·m, the 10 ms case produced a NOx increase of 23.3%, indicating that the premixed combustion phase may locally increase temperature under high-load and medium-speed conditions.
In contrast, CO and HC showed strong penalties in several cases. CO increased in all dual-fuel conditions, with the largest penalties occurring at low load: +1325% at 1200 rpm and 200 N·m and +1981.8% at 1600 rpm and 200 N·m with 20 ms ethanol injection. HC also increased sharply at low load, reaching +439.8% and +517.1% under the same respective conditions. Nevertheless, the high-load case at 1600 rpm showed a tendency toward lower HC emissions, with a reduction of 66.1% with 20 ms ethanol injection, suggesting improved oxidation under higher temperature and turbulence, although this reduction remained within the scatter of the baseline measurement.
Overall, Figure 7 demonstrates that ethanol fumigation can effectively reduce CO2 and NOx emissions, but this benefit is accompanied by significant CO and HC penalties, especially at low load. Therefore, the feasibility of this strategy depends on calibration improvements capable of preserving the CO2/NOx advantages while reducing incomplete-combustion products.
3.3. Comparison with Previous Dual-Fuel Studies
The present results follow the general trend of recent dual-fuel reviews while also showing that the response of ethanol-assisted combustion depends strongly on engine scale, calibration, and load. No, Sahu et al., and Rios et al. [3,9,14] report that alcohol-assisted compression-ignition combustion can reduce carbon-based and soot-related species and NOx, while incomplete-combustion products may increase when mixture preparation and oxidation are not adequately controlled. The current data follow this pattern: exhaust CO2 concentration decreased in all dual-fuel cases, and NOx decreased under most conditions, but the same low-load points that favored high ethanol substitution also produced the strongest CO and HC penalties. Compared with the hydrous-ethanol PFI study of Rosa et al. [10], the present work confirms that ethanol fumigation can reach high substitution levels (DSR of 60–62% and ESR of 70–72% at low load) but reveals a more severe incomplete-combustion penalty in a larger agricultural engine under continuous injection. The comparison with the ethanol-PFI/EGR investigation of Gurbuz et al. [21] reinforces the role of charge cooling in the observed NOx reductions, and the sensitivity to ethanol delivery rate and phasing is consistent with Trung Tuan et al. [22]. Relative to the more advanced architectures of Costa et al., Ianniello et al., and Zhang et al. [23,24,25], the contribution of the present study is the specific, directly field-transferable combination summarized in Table 8: an independent retrofit PFI system, commercial hydrous ethanol, Brazilian Diesel S10/B14, and a commercial John Deere 6068 MAR-1/Tier 3 engine, evaluated through an integrated DSR/ESR/FCE/emission framework.
Table 8.
Positioning of the present work relative to representative ethanol/dual-fuel studies.
4. Conclusions
This study showed that an independent hydrous-ethanol port-fuel-injection system can be retrofitted to a John Deere PowerTech™ Plus 6068 agricultural engine and operated alongside the original high-pressure common-rail diesel system without modifying the factory ECU. Ethanol fumigation reduced the diesel mass flow in all tested conditions, confirming the technical feasibility of partially replacing Brazilian Diesel S10/B14 with commercial hydrous ethanol in a commercial-scale agricultural engine.
Engine load governed the value of this substitution. At low load, ethanol displaced approximately 60% of the diesel mass but reduced the fuel conversion efficiency by up to 8.1 percentage points. At high load, the relative substitution was smaller, but the absolute diesel saving per unit time was greater and, at 1600 rpm and 800 N·m with 20 ms injection, diesel was partially replaced without a measurable efficiency penalty. High substitution alone is therefore not a sufficient criterion for defining the operating strategy.
Ethanol fumigation consistently lowered the exhaust CO2 concentration and reduced NOx in seven of the eight dual-fuel cases, mainly through charge cooling. Conversely, CO and HC increased, most severely at low load, where charge cooling, very lean premixed mixtures, and the trapping of the ethanol–air charge in crevices and quench layers limit oxidation. For agricultural use, these results point to a load-dependent strategy, with larger ethanol quantities at medium-to-high load and reduced quantities at low load, where the efficiency and incomplete-combustion penalties are largest.
Future work will proceed along three complementary lines: (i) extending the tests to a denser map of speeds, loads, and ethanol quantities; to transient agricultural cycles; and to field operation so that the optimum operating point identified here can be generalized into a load-dependent ethanol calibration and expressed in practical indicators such as machine autonomy; (ii) introducing in-cylinder pressure analysis to relate the emissions to ignition delay, heat release, and pressure-rise rate and completing the emission inventory with smoke, particulate matter, unburned ethanol, and aldehydes; and (iii) optimizing the control and hardware of the retrofit system through sequential or split ethanol injection, closed-loop lambda control, intake thermal management, coordinated diesel injection timing where the calibration is accessible, and a diesel oxidation catalyst to mitigate CO and HC. Design-of-experiments and multi-objective optimization methods, combined with techno-economic and life-cycle assessments, will then support the definition of operating regions that maximize diesel displacement while minimizing emission penalties.
Author Contributions
Conceptualization, M.G.K.; Methodology, M.G.K.; Software, M.G.K.; Validation, M.G.K.; Formal analysis, M.G.K., G.C.R.A. and L.O.S.; Investigation, G.C.R.A.; Data curation, M.G.K. and G.C.R.A.; Writing—original draft, M.G.K.; Writing—review and editing, G.C.R.A., P.S.B.d.S., M.M. and L.O.S.; Visualization, M.G.K., M.M. and L.O.S.; Supervision, M.M. and L.O.S.; Project administration, P.S.B.d.S.; Funding acquisition, P.S.B.d.S. All authors have read and agreed to the published version of the manuscript.
Funding
This work was supported by the Coordenação de Aperfeiçoamento de Pessoal de Nível Superior (CAPES) and the Brazilian Green Mobility and Innovation Program (MOVER), Brazil.
Data Availability Statement
The data that support the findings of this study are not publicly available due to ethical restrictions but are available from the corresponding author upon reasonable request.
Acknowledgments
The authors acknowledge financial support from the Mover Program via FUNDEP, along with assistance from FUNDUNESP and CAPES during the project’s development. This work is dedicated to Ricardo Alan Verdú Ramos (In Memoriam) in acknowledgment of his significant support, encouragement, and the opportunities he provided throughout this research.
Conflicts of Interest
The authors declare no conflicts of interest.
Nomenclature and Abbreviations
| Symbol | Definition | Unit or basis |
| ANP | Brazilian National Agency of Petroleum, Natural Gas, and Biofuels | – |
| B14 | Diesel B containing 14% biodiesel by volume | % vol |
| BSFC | Brake-specific fuel consumption | g kWh−1 |
| CI | Compression ignition | – |
| CI95 | 95% confidence interval of the mean | same as metric |
| CO | Carbon monoxide concentration in the exhaust gas | % vol |
| CO2 | Carbon dioxide concentration in the exhaust gas | % vol |
| CV | Coefficient of variation | % |
| DSR | Diesel substitution ratio | % |
| ECU | Electronic control unit | – |
| EGR | Exhaust gas recirculation | % |
| ESR | Energy substitution ratio | % |
| FAME | Fatty acid methyl esters in biodiesel | % vol |
| FCE, | Brake fuel conversion efficiency | % |
| FT550 | FuelTech programmable electronic control unit used for ethanol injection | – |
| HC | Total hydrocarbon concentration in the exhaust gas | ppm vol |
| HPCR | High-pressure common-rail diesel injection system | – |
| ICCI | Intelligent charge compression ignition | – |
| IPM | Intelligent power management | – |
| Lower heating value of Diesel S10/B14 | kJ kg−1 | |
| Lower heating value of hydrous ethanol | kJ kg−1 | |
| MAR-1 | Brazilian emission standard for agricultural and road machinery | – |
| MOVER | Brazilian Green Mobility and Innovation Program | – |
| N | Engine rotational speed | rpm |
| NDIR | Non-dispersive infrared spectroscopy | – |
| NOx | Nitrogen oxides concentration in the exhaust gas | ppm or g kWh−1 |
| Brake power | kW | |
| PFI | Port fuel injection | – |
| PM | Particulate matter | – |
| PTO | Power take-off | – |
| PW | Ethanol injector pulse width | ms |
| SD | Standard Deviation | – |
| SDG | United Nations Sustainable Development Goal | – |
| T | Brake torque | N·m |
| Diesel S10/B14 mass-flow rate | g s−1 | |
| Diesel mass-flow rate in the baseline diesel-only condition | g s−1 | |
| Diesel mass-flow rate during dual-fuel operation | g s−1 | |
| Hydrous ethanol mass-flow rate | g s−1 | |
| Total fuel mass-flow rate | g s−1 |
References
- International Energy Agency. World Energy Outlook 2025; Technical Report; International Energy Agency: Paris, France, 2025. [Google Scholar]
- Boretti, A. Advantages and Disadvantages of Diesel Single and Dual-Fuel Engines. Front. Mech. Eng. 2019, 5, 64. [Google Scholar] [CrossRef] [Scilit]
- Sahu, T.K.; Shukla, P.C.; Belgiorno, G.; Maurya, R.K. Alcohols as alternative fuels in compression ignition engines for sustainable transportation: A review. Energy Sources Part A Recovery Util. Environ. Eff. 2022, 44, 8736–8759. [Google Scholar] [CrossRef] [Scilit]
- Agencia Nacional do Petroleo, Gas Natural e Biocombustiveis. Boletim Trimestral do Mercado de Combustiveis: Panorama das Importacoes Brasileiras de Oleo Diesel; Agencia Nacional do Petroleo, Gas Natural e Biocombustiveis: Rio de Janeiro, Brazil, 2024.
- Empresa de Pesquisa Energetica. Analysis of Biofuels’ Current Outlook: Year 2024; Technical Report; EPE: Lagos State, Nigeria, 2025.
- Agencia Nacional do Petroleo, Gas Natural e Biocombustiveis. Vendas de Derivados de Petroleo e Biocombustiveis; Agencia Nacional do Petroleo, Gas Natural e Biocombustiveis: Rio de Janeiro, Brazil, 2026.
- ANP. RenovaBio; Agencia Nacional do Petroleo, Gas Natural e Biocombustiveis: Rio de Janeiro, Brazil, 2025.
- Ministerio do Desenvolvimento, Industria, Comercio e Servicos. Programa Mobilidade Verde e Inovacao (MOVER); Ministerio do Desenvolvimento, Industria, Comercio e Servicos: Brasília, Brazil, 2024.
- No, S.Y. Application of bioethanol to advanced CI engines; dual fuel and RCCI combustion modes—A review. Int. J. Green Energy 2019, 16, 1105–1130. [Google Scholar] [CrossRef] [Scilit]
- Rosa, J.S.; Telli, G.D.; Altafini, C.R.; Wander, P.R.; Oliveira Rocha, L.A. Dual fuel ethanol port injection in a compression ignition diesel engine: Technical analysis, environmental behavior, and economic viability. J. Clean. Prod. 2021, 308, 127396. [Google Scholar] [CrossRef] [Scilit]
- Agarwal, A.K. Biofuels (alcohols and biodiesel) applications as fuels for internal combustion engines. Prog. Energy Combust. Sci. 2007, 33, 233–271. [Google Scholar] [CrossRef] [Scilit]
- Krishnan, M.G.; Rajkumar, S.; Thangaraja, J.; Devarajan, Y. Exploring the synergistic potential of higher alcohols and biodiesel in blended and dual fuel combustion modes in diesel engines: A comprehensive review. Sustain. Chem. Pharm. 2023, 35, 101180. [Google Scholar] [CrossRef] [Scilit]
- Abrar, I.; Arora, T.; Khandelwal, R. Bioalcohols as an alternative fuel for transportation: Cradle to grave analysis. Fuel Process. Technol. 2023, 242, 107646. [Google Scholar] [CrossRef] [Scilit]
- Rios, E.M.; de Moraes, D.R.; Vieira, G.M.R.; de Noronha Gonçalves, B.; Boloy, R.A.M. Dual-fuel compression-ignition engines fuelled with biofuels. A bibliometric review. Environ. Syst. Decis. 2022, 42, 8–25. [Google Scholar] [CrossRef] [Scilit]
- Tsang, K.S.; Zhang, Z.H.; Cheung, C.S.; Chan, T.L. Reducing Emissions of a Diesel Engine Using Fumigation Ethanol and a Diesel Oxidation Catalyst. Energy Fuels 2010, 24, 6156–6165. [Google Scholar] [CrossRef] [Scilit]
- Imran, A.; Varman, M.; Masjuki, H.H.; Kalam, M.A. Review on alcohol fumigation on diesel engine: A viable alternative dual fuel technology for satisfactory engine performance and reduction of environment concerning emission. Renew. Sustain. Energy Rev. 2013, 26, 739–751. [Google Scholar] [CrossRef] [Scilit]
- de Oliveira, A.; de Morais, A.M.; Valente, O.S.; Sodré, J.R. Combustion, performance and emissions of a diesel power generator with direct injection of B7 and port injection of ethanol. J. Braz. Soc. Mech. Sci. Eng. 2017, 39, 1087–1096. [Google Scholar] [CrossRef] [Scilit]
- Britto Júnior, R.F.; Martins, C.A. Emission analysis of a Diesel Engine Operating in Diesel–Ethanol Dual-Fuel mode. Fuel 2015, 148, 191–201. [Google Scholar] [CrossRef] [Scilit]
- Reitz, R.D.; Duraisamy, G. Review of high efficiency and clean reactivity controlled compression ignition (RCCI) combustion in internal combustion engines. Prog. Energy Combust. Sci. 2015, 46, 12–71. [Google Scholar] [CrossRef] [Scilit]
- Wissink, M.; Reitz, R.D. Direct Dual Fuel Stratification, a Path to Combine the Benefits of RCCI and PPC. Sae Int. J. Engines 2015, 8, 878–889. [Google Scholar] [CrossRef] [Scilit]
- Gürbüz, H.; Demirtürk, S.; Akçay, I.H.; Akçay, H. Effect of port injection of ethanol on engine performance, exhaust emissions and environmental factors in a dual-fuel diesel engine. Energy Environ. 2021, 32, 784–802. [Google Scholar] [CrossRef] [Scilit]
- Trung, K.N.; Tuan, H.H. Effects of ethanol port injection timing and delivery rate on combustion characteristic of a heavy-duty V-12 diesel engine. Therm. Sci. 2022, 26, 343–352. [Google Scholar] [CrossRef] [Scilit]
- da Costa, R.B.R.; Roque, L.F.A.; de Souza, T.A.Z.; Coronado, C.J.R.; Pinto, G.M.; Cintra, A.J.A.; Raats, O.O.; Oliveira, B.M.; Frez, G.V.; da Silva, M.H. Experimental assessment of renewable diesel fuels (HVO/Farnesane) and bioethanol on dual-fuel mode. Energy Convers. Manag. 2022, 258, 115554. [Google Scholar] [CrossRef] [Scilit]
- Ianniello, R.; Belgiorno, G.; Di Luca, G.; Beatrice, C.; Di Blasio, G. Ethanol in Dual-Fuel and Blend Fueling Modes for Advanced Combustion in Compression Ignition Engines; Energy, Environment, and Sustainability; Springer: Berlin/Heidelberg, Germany, 2021. [Google Scholar] [CrossRef] [Scilit]
- Zhang, Y.; Mi, S.; Zhao, W.; Li, Z.; He, Z.; Qian, Y.; Lu, X. Experimental study on the application of bioethanol in dual-fuel intelligent charge compression ignition (ICCI) engine. Fuel 2021, 303, 121181. [Google Scholar] [CrossRef] [Scilit]
- Górski, K.; Tziourtzioumis, D.; Smigins, R.; Longwic, R. Effects of Ethanol–Diesel Blends on Cylinder Pressure, Ignition Delay, and NOx Emissions in a Diesel Engine. Energies 2025, 18, 2392. [Google Scholar] [CrossRef] [Scilit]
- Rehman, S.; Rashid, M.K. Combustion and performance characteristics of a multi-cylinder DI diesel engine fuelled with diesel-ethanol and diesel-pentanol blends. Prog. Eng. Sci. 2026, 3, 100340. [Google Scholar] [CrossRef] [Scilit]
- Adekanbi, M.L.; Ahmad, Z.N.; Holloway, E.; Dou, D.; Evers, M.; Rosswurm, J.; Shaver, G.M. Experimental analysis of combustion stability and cycle-to-cycle variability in an off-road compression ignition engine fueled with biodiesel ethanol blends: Up to 50% ethanol. Fuel 2026, 430, 141185. [Google Scholar] [CrossRef] [Scilit]
- Zhang, W.; Cui, M.; Fu, J.; Qiu, S.; Li, X.; Nour, M.; Xu, M. Comprehensive experimental study on spray dynamics, combustion performance, and emission profiles of ethanol-gasoline and butanol-gasoline mixtures in a constant volume combustion chamber under cold start GDI conditions. Renew. Energy 2026, 264, 125561. [Google Scholar] [CrossRef] [Scilit]
- United Nations. Transforming Our World: The 2030 Agenda for Sustainable Development; United Nations: New York, NY, USA, 2015. [Google Scholar]
- Ministerio do Meio Ambiente e Mudanca do Clima. Emissoes Veiculares; Ministerio do Meio Ambiente e Mudanca do Clima: Brasília, Brazil, 2026.
- ANP. Óleo Diesel; Agencia Nacional do Petroleo, Gas Natural e Biocombustiveis: Rio de Janeiro, Brazil, 2024. (In Portuguese)
- Agencia Nacional do Petroleo, Gas Natural e Biocombustiveis. Fatores de Conversao, Densidades e Poderes Calorificos Inferiores: Valores Medios Para o ano de 2024; Agencia Nacional do Petroleo, Gas Natural e Biocombustiveis: Rio de Janeiro, Brazil, 2025.
- FuelTech. FT550 Programmable Electronic Fuel Injection; FuelTech: Porto Alegre, Brazil, 2022. (In Portuguese) [Google Scholar]
- Robert Bosch Ltda. Performance Bosch 2021|2022; Technical Report; Robert Bosch Ltda.: Campinas, Brazil, 2021. [Google Scholar]
- SP Tronic. Hydraulic Dynamometers HD Series and ECAT Automation System; SP Tronic: São Paulo, Brazil, 2022. (In Portuguese) [Google Scholar]
- Tecnomotor. Analisador de Gases TM131; Tecnomotor: São Carlos, Brazil, 2022. (In Portuguese) [Google Scholar]
- Hybrid e-Controls. ECOTORQ: NOx Emission Measurement Instrument; Hybrid e-Controls: São José dos Campos, Brazil, 2022. (In Portuguese)
- Marte Científica. Precision Balance AD5002; Marte Científica: São Paulo, Brazil, 2012. (In Portuguese) [Google Scholar]
- ISO 8178-4:2020; Reciprocating Internal Combustion Engines—Exhaust Emission Measurement—Part 4: Steady-State and Transient Test Cycles for Different Engine Applications. ISO: Geneva, Switzerland, 2020.
- Heywood, J.B. Internal Combustion Engine Fundamentals, 2nd ed.; McGraw-Hill Education: New York, NY, USA, 2018. [Google Scholar]
- Kline, S.J.; McClintock, F.A. Describing uncertainties in single-sample experiments. Mech. Eng. 1953, 75, 3–8. [Google Scholar]
- JCGM 100:2008; Evaluation of Measurement Data—Guide to the Expression of Uncertainty in Measurement. BIPM: Sèvres, France, 2008.
- Welch, B.L. The generalization of ‘Student’s’ problem when several different population variances are involved. Biometrika 1947, 34, 28–35. [Google Scholar] [CrossRef] [Scilit] [PubMed]

Disclaimer/Publisher’s Note: The statements, opinions and data contained in all publications are solely those of the individual author(s) and contributor(s) and not of MDPI and/or the editor(s). MDPI and/or the editor(s) disclaim responsibility for any injury to people or property resulting from any ideas, methods, instructions or products referred to in the content. |
© 2026 by the authors. Licensee MDPI, Basel, Switzerland. This article is an open access article distributed under the terms and conditions of the Creative Commons Attribution (CC BY) license.