


Abstract
This study aimed to characterise the polyphenolic profile and evaluate the extractability of Aiweixin Oral Liquid (AWX) residues, identify polyphenolic components via targeted metabolomics, optimise ultrasonic extraction, assess in-vitro antioxidant capacity, and explore extraction-synergy mechanisms by microstructural analysis to support high-value recycling of compound Chinese medicine residues. UPLC-Q Exactive MS was used to quantify 25 polyphenols. Single-factor tests combined with Box–Behnken response-surface methodology optimised ultrasonic-assisted deep-eutectic-solvent (DES) extraction of total polyphenols. Multiple in-vitro antioxidant assays and comparative morphological observation by light microscopy and SEM were carried out. Twenty-five polyphenols, mainly phenolic acids, were characterised in AWX residues, with gallic acid (361.57 μg/g) as the most abundant constituent. The optimal conditions were liquid-to-solid ratio of 62 mL/g, DES molar ratio 1:3, ultrasonic time 50 min, and power 445 W, yielding better extraction efficiency than ethanol or water. The extract exerted dose-dependent radical-scavenging effects against DPPH, ABTS, and PTIO alongside strong reducing power. Microscopy showed ultrasonic-DES treatment destroyed residues ducts, fibres, and cells, verifying ultrasonic cavitation-promoted constituent release. AWX residues are abundant in bioactive polyphenols. This eco-friendly, high-efficiency DES-ultrasonic approach yields antioxidant-rich extracts and provides a viable theoretical basis for the resource recovery and further development of waste materials from compound traditional Chinese medicines.
1. Introduction
The industrial production of traditional Chinese and ethnic medicines generates large quantities of medicinal waste residues. Traditional disposal methods, such as landfill and incineration, cause environmental pollution and waste large amounts of naturally active secondary metabolites. This is detrimental to the sustainable development of traditional Chinese medicine resources [1,2]. In recent years, research into the identification of active components and the high-value utilisation of waste residues from proprietary Chinese medicinal preparations has become a key area of focus in the comprehensive development of traditional Chinese medicine resources, offering both significant economic benefits and ecological value [3,4,5,6].
Aiweixin Oral Liquid (AWX) is formulated from several medicinal herbs, including Anchusa italica Retz. Flowers, Eugenia caryophyllata Thunb., Nardostachys jatamansi DC., and so on. It has cardiotonic and sedative properties and can regulate qi and relieve stagnation. Clinically, it is commonly used to treat cardiovascular and neurological disorders such as palpitations, insomnia, arrhythmia, chest pain, and coronary heart disease [7,8,9]. The waste herbal residues used in this study were sourced from the by-products of water extraction at Xinjiang Xinwei Pharmaceutical Co., Ltd. Due to limitations in existing industrial extraction processes, these residues still contain significant amounts of active constituents such as polyphenols and flavonoids, demonstrating good potential for further development. Current research has largely focused on the chemical composition and clinical efficacy of the finished product AWX. In contrast, systematic studies on the chemical composition of its residues, green extraction processes, and biological activity remain limited, resulting in significant waste of ethnic medicinal resources [10,11].
Targeted metabolomics technology based on ultra-high-performance liquid chromatography-Q Exactive mass spectrometry (UPLC-Q Exactive MS) enables the precise qualitative and quantitative analysis of multiple polyphenolic components, providing reliable technical support for the analysis of the material composition of medicinal waste [12,13,14,15]. Polyphenolic compounds are important bioactive constituents in natural plants, exhibiting various pharmacological activities such as antioxidant, anti-inflammatory, and anti-acne effects; they are among the key target substances for the resource-efficient development of medicinal waste residues [16,17,18,19,20]. Traditional organic solvent extraction suffers from drawbacks such as low extraction efficiency, solvent residues, and environmental pollution. Deep eutectic solvents (DES) have attracted increasing attention as alternative extraction media in the extraction of natural products because they can reduce the reliance on conventional volatile organic solvents and offer advantages such as good stability, strong solubility, and ease of preparation [21,22,23,24]. Combined with ultrasound-assisted physical intensification, this approach can reduce reliance on organic solvents by taking advantage of acoustic cavitation to disintegrate plant tissue matrices. Observations using powder microscopy and scanning electron microscopy have shown that, in combination with ultrasound-assisted technology, the cavitation effect can disrupt the structure of plant cell walls, thereby significantly enhancing the elution efficiency of bioactive compounds [25,26,27,28].
Building on these advances, AWX residues were selected as the subject of investigation and utilised targeted metabolomics to systematically analyse the characteristics of its polyphenolic components in this study. The green extraction process for total polyphenols was optimised using a eutectic solvent combined with ultrasound-assisted technology, whilst in vitro antioxidant models were employed to evaluate their biological activity. This was supplemented by microscopic and scanning electron microscopy characterisation to elucidate the mechanisms underlying the enhanced extraction efficiency. This work offers insights for circular-economy-oriented valorisation of TCM industrial waste biomass, thereby providing a theoretical basis and technical support for the resource recovery and high-value utilisation of waste medicinal residues from traditional medicine.
2. Materials and Methods
2.1. Laboratory Reagents
All solvents were of analytical or HPLC grade. Methanol, acetonitrile, and formic acid (HPLC grade) were obtained from Anpel Laboratory Technologies (Shanghai, China) Inc. Anhydrous ethanol, propylene glycol, urea, citric acid, sodium carbonate, and oxalic acid were purchased from Tianjin Damao Chemical Reagent Factory (Tianjin, China). Twenty-five polyphenolic standards, including gallic acid (CAS:149-91-7), 3,4-dihydroxybenzoic acid (CAS:99-50-3), catechin (CAS:154-23-4), vanillic acid (CAS:121-34-6), caffeic acid (CAS:331-39-5), syringic acid (CAS:530-57-4), epicatechin (CAS:490-46-0), vanillin (CAS:121-33-5), p-hydroxycinnamic acid (CAS:501-98-4), syringaldehyde (CAS:134-96-3), salicylic acid (CAS:69-72-7), trans-ferulic acid (CAS:537-98-4), sinapic acid (CAS:530-59-6), quercetin 3-β-d-glucoside (CAS:482-35-9), luteoloside (CAS:5373-11-5), benzoic acid (CAS:65-85-0), kaempferol-3-o-glucoside (CAS:480-10-4), luteolin (CAS:491-70-3), quercetin (CAS:117-39-5), hydrocinnamic acid (CAS:501-52-0), trans-cinnamic acid (CAS:140-10-3), apigenin (CAS:520-36-5), kaempferol (CAS:520-18-3), isorhamnetin (CAS:480-19-3), and isoliquiritigenin (CAS:961-29-5), were supplied by Sanshu Biotechnology Company (China). Choline chloride (Lot No. S30169), betaine (Lot No. S18046), lactic acid (Lot No. S11075), and urea were acquired from Shanghai Yuyuan Biotechnology Co., Ltd. (Shanghai, China). Folin-phenol reagent (Lot No. F9252) was obtained from Shenzhen Wobisen Biotechnology (Shenzhen, China). DPPH (AR grade, D0909) and ABTS (AR grade, N103784) were purchased from Beijing Solarbio Science & Technology Co., Ltd. (Beijing, China). Tolox (CAS: 53188-07-1) was obtained from MedChemExpress (Monmouth Junction, NJ, USA).
2.2. Preliminary Processing of Herbal Materials
AWX residues (Xinjiang Xinwei Pharmaceutical Co., Ltd. (China), batch number: 20240415) were coarsely ground and sieved through a 60-mesh sieve, then stored in a desiccator away from light.
2.3. Targeted Metabolomic Analysis of Polyphenolic Compounds
2.3.1. Chromatographic Conditions
Column: Waters HSS T3 (50 × 2.1 mm, 1.8 μm); mobile phase: Phase A was ultrapure water (containing 0.1% formic acid), and Phase B was acetonitrile (containing 0.1% formic acid); gradient elution was performed as shown in Table 1; column temperature was 40 °C; injection volume was 2 μL. Throughout the analysis, samples were stored in an autosampler at 4 °C.
Table 1.
Gradient elution program.
2.3.2. Mass Spectrometry Conditions
Data were acquired using a Q Exactive high-resolution mass spectrometry detection system from Thermo (USA), equipped with an electrospray ionisation (ESI) source, sheath gas 40 arb, auxiliary gas 10 arb, ion spray voltage −2800 V, temperature 350 °C, and ion transfer tube temperature 320 °C. The scan mode was Full scan-ddMS2, with negative ionisation. The first-stage mass scan range was 100–900.
2.3.3. Preparation of the Test Sample Solution
AWX residue powder (50 mg) was placed into a centrifuge tube. An 80% methanol–water solution (0.5 mL, containing 0.2% Vc) was added, and the mixture was vortexed and extracted by ultrasonication at room temperature for 30 min. The sample was then centrifuged at 12,000 rpm for 10 min, and the supernatant was collected. The extraction was repeated twice. The supernatants were combined and made up to a final volume of 1 mL, and the solution was diluted twofold before analysis.
2.3.4. Preparation of Standard Solutions
The following compounds were accurately weighed separately: gallic acid, 3,4-dihydroxybenzoic acid, catechin, vanillic acid, caffeic acid, syringic acid, epicatechin, vanillin, p-hydroxycinnamic acid, syringaldehyde, salicylic acid, trans-ferulic acid, sinapic acid, quercetin 3-β-d-glucoside, luteoloside, benzoic acid, kaempferol-3-o-glucoside, luteolin, quercetin, hydrocinnamic acid, trans-cinnamic acid, apigenin, kaempferol, isorhamnetin, and isoliquiritigenin. Each standard substance was dissolved in methanol to prepare a 10 mg/mL single-standard stock solution, which was then diluted with methanol to 1 μg/mL and stored for later use. Appropriate volumes of the single-standard stock solutions were mixed to prepare 1 μg/mL or 10 μg/mL mixed-standard solutions, which were also stored for later use. The above mixed standard solutions were diluted to different concentrations and analysed on the instrument. With concentration (ng/mL) as the x-axis and peak area as the y-axis, a standard curve was obtained by forcing the line to pass through the origin using TraceFinder 4.1 software.
2.3.5. Method Validation
The UPLC-MS method was validated using the 25 polyphenolic standards in terms of linearity, limit of detection (LOD), limit of quantification (LOQ), intra-day precision, inter-day precision, repeatability, and recovery. The LOD was the lowest concentration with S/N ≥ 3. The LOQ was the lowest concentration satisfying S/N ≥ 10 together with acceptable precision and recovery, determined using matrix-matched standard solutions. Intra-day precision was evaluated by analysing the standard solutions three times within a single day, and inter-day precision was assessed over three consecutive days. Repeatability was determined by three replicate injections of the same standard solution. Recovery was evaluated using spiked standard solutions at three concentration levels (low, medium, and high) and calculated as the ratio of the measured amount to the spiked amount. All precision results were expressed as relative standard deviation (RSD, %).
2.4. Extraction Process for Total Polyphenols from AWX Residues
2.4.1. Preparation of DES
DES consists of HBA (hydrogen bond acceptor) and HBD (hydrogen bond donor) reagents. In this study, choline chloride and betaine were selected as HBA reagents, whilst eight common reagents—L-lactic acid, citric acid, glucose, urea, ethylene glycol, 1,2-propanediol, maltose, and glycerol—were selected as HBD reagents. A total of 16 DES formulations were prepared, corresponding to categories such as carboxylic acids, polyols, amides, and sugars. The aforementioned reagents were added to beakers in specific molar ratios and at a moisture content of 30 per cent, then placed in a water bath maintained at 80 °C until the DES became clear and transparent. The solutions were then cooled using an ultrasonicator and set aside for later use. The screening of DES compositions is shown in Table 2. The experiment was repeated three times at each concentration. The results are expressed as the mean ± standard deviation (mean ± SD).
Table 2.
Composition of different solvent systems.
2.4.2. Plotting the Gallic Acid Standard Curve
Gallic acid standard (10 mg) was accurately weighed and dissolved in distilled water, and the solution was made up to 100 mL in a volumetric flask to obtain a standard solution with a mass concentration of 0.10 mg/mL. The solution was stored at 4 °C in the dark until required. Aliquots of 0.2, 0.3, 0.4, 0.5, 0.6, and 0.7 mL were transferred into 10 mL volumetric flasks, and 0.5 mL of Folin’s reagent was added and mixed thoroughly. After standing for 5 min, 1.5 mL of 10% Na2CO3 was added, and the solution was made up to the mark with distilled water and mixed thoroughly. The mixture was left to stand in the dark at room temperature for 1 h, and the absorbance was then measured at 764 nm. Taking the mass concentration of gallic acid as the independent variable (x) and the absorbance as the dependent variable (y), the standard calibration curve for gallic acid was obtained as y = 104.4x + 0.0652 (r2 = 0.9991), with a linear range of 0.002–0.007 mg/mL.
2.4.3. Ultrasound-Assisted DES Extraction of Total Polyphenols from AWX Residues
The polyphenol content of the AWX residues was determined using the Folin–Ciocalteu colorimetric method. One gram of prepared AWX residues powder was weighed into a conical flask and extracted under the following conditions: ultrasonication for 40 min, a liquid-to-solid ratio of 50 mL/g, DES moisture content of 30 per cent, and an ultrasonic power of 250 W. The mixture was centrifuged at 10,000 r/min for 10 min; the supernatant was collected, diluted 50-fold, and set aside for later use.
2.4.4. Determination of Sample Content
A total of 2.5 mL of the sample solution was added to a 10 mL volumetric flask. The absorbance was determined in accordance with the method described in “Section 2.4.2”, measuring the absorbance at a UV wavelength of 764 nm, and the total phenolic content (TPC) of AWX residues was calculated using a gallic acid calibration curve. All TPC values are expressed as milligrams of gallic acid equivalents per gram of sample (mg GAE/g DW (dry weight)).
2.4.5. One-Factor Experimental Design
Using the optimal DES solvent with a water content of 30 per cent as the extractant, this study investigated the effects of different liquid-to-solid ratios (30, 40, 50, 60, 70 mL/g), molar ratios of HBD to HBA (1, 1.5, 2, 3, 4, 5), ultrasonic power (100 W, 250 W, 300 W, 400 W, 500 W) and ultrasonication time (20, 30, 40, 50, 60 min) on the TPC of AWX residues. The experiment was repeated three times at each concentration. The results are expressed as the mean ± standard deviation (mean ± SD).
2.4.6. Response Surface Design of Experiments
Based on the results of the single-factor experiments, the liquid-to-solid ratio (A), molar ratio (B), ultrasonication time (C), and ultrasonic power (D) were selected as independent variables, with total polyphenol retention as the response variable. A four-factor, three-level experiment was designed in accordance with the Box–Behnken design principles. The coding levels and factors are shown in Table 3.
Table 3.
Coding levels and factors for the Box–Behnken response surface methodology experimental design.
2.4.7. Data Processing
Each sample test number was repeated three times, and the average value was calculated. Design-Expert 13 statistical software was used for experimental design and data analysis, and the response surface plots were exported using Design-Expert 13.
2.5. In Vitro Antioxidant Assays
AWX residues were extracted using the optimal response surface process conditions—a liquid-to-solid ratio of 62 (mL/g), a molar ratio of 3, an ultrasonication time of 50 min, and an ultrasonic power of 445 W. The extract was centrifuged, filtered, and diluted before being used for subsequent in vitro antioxidant assays. All antioxidant activity assays were repeated three times at each concentration. The results are expressed as the mean ± standard (mean ± SD) deviation.
2.5.1. Assay of DPPH Radical Scavenging Capacity
DPPH is a stable nitrogen-centred radical with an unpaired electron and appears deep purple in ethanol solution, exhibiting a maximum absorption peak at 517 nm. When a free radical scavenger is present, it donates a hydrogen atom or an electron to the DPPH radical, pairing with the unpaired electron and thereby reducing DPPH. As a result, the colour fades from deep purple to pale yellow or colourless, and the absorbance at 517 nm decreases accordingly. Consequently, the colour of the solution fades from deep purple to pale yellow or colourless, and the absorbance at 517 nm decreases accordingly. The extent of this decrease in absorbance is directly proportional to the scavenging capacity of the antioxidant; the more significant the decrease in absorbance, the stronger the free radical scavenging capacity of the sample. Scavenging capacity is expressed as the scavenging rate; a higher scavenging rate indicates a stronger scavenging capacity. Therefore, the scavenging rate of a substance against DPPH radicals can be assessed by measuring the absorbance of the solution at 517 nm, thereby evaluating the antioxidant activity of the sample used in the experiment; the higher the scavenging rate against DPPH radicals, the stronger the antioxidant activity.
Following the method described in SREEKALA et al. [29], with minor modifications, 100 μL of sample solutions of varying concentrations and 100 μL of 0.1 mM DPPH solution were added sequentially to a 96-well plate. After thorough mixing, the mixture was allowed to react for 30 min at 37 °C in the dark, and the absorbance was measured at a wavelength of 517 nm and recorded as A2. Concurrently, an equal volume of anhydrous ethanol was used in place of the DPPH solution as a control, and the absorbance value was recorded as A1; an equal volume of anhydrous ethanol was used in place of the sample solution as a blank, and the absorbance value was recorded as A0. The measurements were performed in triplicate. Following the same method as above, a series of working solutions of varying concentrations were prepared using a 1 mg/mL Trolox standard. The DPPH scavenging rates at each concentration were measured separately. A standard curve was plotted with the scavenging rate on the vertical axis and the Trolox concentration on the horizontal axis, and a linear regression equation was established. The scavenging rate of the sample was then substituted into the Trolox standard curve to calculate the Trolox-equivalent antioxidant capacity (μmol TE/g DW (dry weight)). The DPPH scavenging rate is calculated using the following Equation (1).
DPPH free radical scavenging rate = [1 − (A2 − A1)/A0] × 100%,
2.5.2. Determination of ABTS Radical Scavenging Capacity
In the ABTS method used in this experiment, ABTS is oxidised by the oxidising agent potassium persulphate to form a stable blue-green cationic radical, ABTS+, which exhibits a maximum absorption peak at a wavelength of 734 nm. A solution containing a free radical scavenger can reduce the ABTS+ radical to its colourless, neutral form by supplying hydrogen or transferring electrons; the blue-green colour of the solution gradually fades, and the absorbance at 734 nm consequently decreases. The extent of this decrease in absorbance is quantitatively related to the scavenging capacity of the antioxidant: the more significant the decrease in absorbance, the stronger the free radical scavenging capacity of the sample. Scavenging capacity is expressed as the scavenging rate; a higher scavenging rate indicates a stronger scavenging capacity. Therefore, the scavenging rate of a substance against the ABTS radical can be evaluated by measuring the absorbance of the reaction system at 734 nm, thereby assessing the antioxidant activity of the sample used in the experiment; the higher the scavenging rate against the ABTS radical, the stronger the antioxidant activity.
Following the method described in Ji et al. [30], with minor modifications, an equal-volume (1:1) mixture of 7 mmol/L aqueous ABTS solution and 1.4 mmol/L aqueous potassium persulphate solution was prepared and thoroughly mixed. After standing in the dark at 4 °C for 16 h, the mixture was diluted with anhydrous ethanol to an absorbance of 0.70 ± 0.02 at 734 nm immediately before use to obtain the ABTS working solution. A volume of 190 μL of ABTS working solution and 10 μL of sample solutions at different concentrations were added into a 96-well plate. After mixing, the mixture was incubated at 37 °C in the dark for 6 min, and the absorbance at 734 nm was measured and recorded as A2. The absorbance was determined and recorded as A1 when anhydrous ethanol was used instead of the ABTS working solution. The absorbance was determined and recorded as A0 when anhydrous ethanol was used to replace the sample solution. Three parallel replicates were performed. Trolox was used as the positive control and assayed using the identical procedure. The Trolox equivalent antioxidant capacity (μmol TE/g) was calculated accordingly. The ABTS radical scavenging rate was calculated using Equation (2).
ABTS free radical scavenging rate = [1 − (A2 − A1)/A0] × 100%,
2.5.3. Assay of PTIO Radical Scavenging Capacity
The method described was followed with minor modifications in Li et al. [31]. In a 96-well plate, 50 μL of sample solutions at different concentrations and 150 μL of 0.05 mM 2-phenyl-4,4,5,5-tetramethylimidazoline-1-oxyl-3-oxide (PTIO) solution (PBS phosphate-buffered saline, pH 7.4, 50 mM) were added sequentially. After thorough mixing, the mixture was incubated at 37 °C in the dark for 2 h, and the absorbance was measured at a wavelength of 557 nm, denoted as A2; PBS buffer was used in place of the PTIO reaction solution, denoted as A1; PBS buffer was used in place of the sample solution as a blank control, denoted as A0. Concurrently, Trolox was used as a positive control, following the same procedure, and the TEAC (μmol TE/g DW) was calculated. The PTIO scavenging rate was calculated using the formula in Equation (3), following the DPPH method:
PTIO free radical scavenging rate = [1 − (A2 − A1)/A0] × 100%,
2.5.4. Determination of the Ability of Salicylic Acid to Scavenge Hydroxyl Radicals
This experiment is based on the Fenton reaction for the generation of hydroxyl radicals, whereby hydrogen peroxide and Fe2+ are added to the reaction system to produce hydroxyl radicals through their reaction. Salicylic acid can scavenge the hydroxyl radicals generated in the system and react with them to form 2,3-dihydroxybenzoic acid, which exhibits characteristic absorption at a wavelength of 510 nm. If the test substance, which acts as a hydroxyl radical scavenger, is present in the reaction system, it competes with salicylic acid to consume the hydroxyl radicals, resulting in a corresponding reduction in the formation of the coloured product, 2,3-dihydroxybenzoic acid, and consequently a decrease in the absorbance of the system at 510 nm. Therefore, by comparing the absorbance at 510 nm between reaction systems containing and not containing the analyte, the analyte’s hydroxyl radical scavenging activity can be assessed, thereby evaluating the sample’s antioxidant activity. A higher hydroxyl radical scavenging rate indicates stronger antioxidant activity of the sample.
Following the method described in Chaniad et al. [32], with minor modifications, solutions of FeSO4 (6 mmol/L), H2O2 (6 mmol/L), and salicylic acid in ethanol (6 mmol/L) were prepared. In a 96-well plate, 50 μL of sample solution at different concentrations were dispensed, followed by the addition of 50 μL of 6 mmol/L FeSO4 solution and 50 μL of 6 mmol/L salicylic acid in ethanol. After mixing and allowing the mixture to stand for 10 min, 50 μL of 6 mmol/L H2O2 solution were added. The mixture was left to react at 37 °C for 30 min, after which the absorbance was measured at 510 nm. Experimental, control, and standard groups were established, with three parallel determinations carried out for each. The hydroxyl radical scavenging rate was calculated using the following Equation (4).
Hydroxyl scavenging rate = [(1 − (A2 − A1))/A0] × 100%,
In Equation (4):
A2—the absorbance of the experimental group: 50 μL FeSO4 solution + 50 μL H2O2 solution + 50 μL salicylic acid solution + 50 μL sample solution;
A1—the absorbance of the control group: 50 μL FeSO4 solution + 50 μL water + 50 μL salicylic acid solution + 50 μL sample solution;
A0—the standard group: the absorbance of 50 μL FeSO4 solution + 50 μL H2O2 solution + 50 μL salicylic acid solution + 50 μL water.
Following the method described above, a series of working solutions of varying concentrations were prepared using a 1 mg/mL Vc standard (selected for its greater stability in these reaction systems), a regression equation was plotted, and the equivalent antioxidant capacity value (μmol Vc/g DW) was calculated.
2.5.5. Experiment on the Scavenging of Superoxide Anion Radicals
This experiment is based on the fact that pyrogallol undergoes auto-oxidation under weakly alkaline conditions, producing superoxide anion radicals. A phosphate buffer (Tris-HCl, 50 mM, pH 8.2) was used as the reaction medium. In this system, pyrogallol undergoes auto-oxidation to form a coloured intermediate product, which exhibits characteristic absorption at 320 nm, with the absorbance increasing linearly with reaction time. By comparing the changes in absorbance before and after the addition of the sample, the sample’s ability to scavenge superoxide anion radicals can be evaluated.
Following the method described in Ye et al. [33], with minor modifications, 4.5 mL of 50 mmol/L Tris-HCl buffer (pH 8.2), and 1 mL of sample solution at various concentrations were added sequentially to a 10 mL centrifuge tube. After thorough mixing, the tube was preheated in a water bath at 25 °C for 20 min; 0.4 mL of a 25 mmol/L pyrogallol solution (prepared with 10 mmol/L HCl) was added; after shaking to mix, the mixture was allowed to react at 25 °C for 6 min. The reaction was then immediately terminated by adding 1 mL of 0.8 mol/L HCl solution, followed by thorough mixing; the absorbance was measured at a wavelength of 320 nm and recorded as A2. A blank control (A0) was prepared by substituting distilled water for the sample solution, and a background control (A1) was prepared by substituting distilled water for the pyrogallol solution. The determination of Vc (selected for its greater stability in these reaction systems), used as a positive control, should be carried out using the same method. The superoxide anion scavenging rate is calculated using the same formula as for the DPPH assay, as shown in Equation (5). As with the hydroxyl radical method described above, plot the Vc regression equation and calculate the Vc equivalent antioxidant capacity (μmol Vc/g DW).
Superoxide anion scavenging rate = [(1 − (A2 − A1))/A0] × 100%,
2.5.6. FRAP (Ferric Reducing Antioxidant Potential) Assay for Iron Ion Reducing Agents
The FRAP method employed in this assay is based on the colorimetric principle of redox reactions. Under acidic conditions, 2,4,6-Tris(2-pyridyl)-1,3,5-triazine (TPTZ) in the FRAP working solution forms a pale-yellow complex (Fe3+-TPTZ) with trivalent iron ions (Fe3+). A sample solution containing reducing substances donates electrons to Fe3+-TPTZ, reducing Fe3+ to Fe2+; the colour of the solution consequently changes from pale yellow to deep blue, and the absorbance at 593 nm increases accordingly. The depth of the blue colour is directly proportional to the reducing capacity of the sample; the higher the absorbance, the stronger the sample’s ability to reduce iron ions, and thus the higher its total antioxidant capacity. Reducing capacity is expressed as the FRAP value; a higher FRAP value indicates a stronger reducing capacity. Therefore, the reducing capacity of a substance towards Fe3+-TPTZ can be assessed by measuring the absorbance of the solution at 593 nm, thereby evaluating the total antioxidant activity of the samples used in the experiment.
Following the method described in Haji et al. [34], with minor modifications, the iron ion reduction/antioxidant capacity assay (FRAP) was employed to determine the total antioxidant capacity of the AWX residues extract. The FRAP working solution was prepared by thoroughly mixing an aqueous sodium acetate solution (0.3 mol/L, pH 3.6), a 10 mmol/L TPTZ solution (made up to volume with 40 mmol/L hydrochloric acid), and a 20 mmol/L FeCl3 solution in a volume ratio of 10:1:1. After preparation, the working solution was preheated in a 37 °C water bath, protected from light. To a 96-well plate, 10 μL of sample solution at different concentrations, 300 μL of the FRAP working solution, and 30 μL of distilled water were added in sequence and mixed thoroughly. The mixture was left to stand for 5 min at 37 °C, protected from light, and the absorbance (A1) was measured at 593 nm; the absorbance value was determined by replacing the sample solution with distilled water and recorded as A0. The net absorbance (△A) is calculated using the following Formula (6):
△A = A1 − A0,
Each concentration was analysed in triplicate. To comprehensively characterise the reducing capacity of the samples, two standard curves were established in this study: FeSO4·7H2O was used as the standard to replace the sample solution in the reaction with the FRAP working solution, and a standard curve was plotted with the concentration of the FeSO4 standard solution on the x-axis and absorbance on the y-axis. The net absorbance of the sample was then fitted to this standard curve to calculate the FRAP value (mmol/L); simultaneously, a standard calibration curve was plotted using Trolox as the standard, with the results expressed as Trolox equivalent concentration (μg/mL).
2.5.7. Total Antioxidant Capacity Assay Using the Phosphomolybdate Method
This assay determines the total antioxidant capacity of a sample based on the phosphomolybdate reduction reaction. Under acidic and heated conditions, ammonium molybdate forms a phosphomolybdate complex with phosphate; the antioxidant substances in the sample reduce the Mo(VI) in this complex to Mo(V), a green complex with characteristic absorption at a wavelength of 695 nm. Consequently, by measuring the absorbance of the reaction system at 695 nm and comparing it with a Trolox standard, the total antioxidant capacity of the sample can be quantitatively evaluated. The higher the absorbance of the sample at 695 nm, the stronger its total antioxidant capacity.
Following the method described in Arabela et al. [35], with minor modifications, 0.6 mol/L H2SO4, 28 mmol/L Na3PO4, and 4 mmol/L ammonium molybdate solutions were prepared. Aliquots (300 μL) of Trolox standard solutions at different concentrations and AWX residue extract solutions were collected, and 1 mL of 0.6 mol/L H2SO4 solution, 28 mmol/L Na3PO4 solution, and 4 mmol/L ammonium molybdate solution were added sequentially. After thorough mixing, the mixture was incubated in an oven at 95 °C for 90 min. The absorbance was measured at 695 nm and recorded as A1. The absorbance was measured using distilled water instead of the sample solution and recorded as A0. The net absorbance (△A) was calculated using Equation (7).
△A = A1 − A0,
Each concentration was analysed in triplicate. As with the FRAP method, a standard calibration curve was plotted using Trolox as the standard, and the results are expressed as Trolox equivalent concentration (µg/mL).
2.6. Microstructural Observation
2.6.1. Preparation of Herbal Residues Samples Subjected to Different Treatment Processes
Raw residues group: Raw herbal residues without any treatment were washed three times with water and then dried in an oven at 60 °C to constant weight. The dried residues were ground using a high-speed grinder and sieved through a 60-mesh Pharmacopoeia sieve to obtain the raw residues powder, which was stored in a sealed desiccator for later use.
Warm-soaking treatment group: A precise quantity of the raw residues powder was weighed and mixed thoroughly with a eutectic solvent at a liquid-to-solid ratio of 62 mL/g and a molar ratio of 3. The mixture was then placed in a water bath at 50 °C for warm soaking for 50 min. After the reaction, the mixture was removed, and the solid and liquid phases were separated by vacuum filtration; the resulting solid residues were collected. The residues were washed repeatedly with deionised water at least three times until the wash filtrate was clear and colourless. The washed residues were dried in a forced-air oven at 60 °C to constant weight, cooled, ground, and sieved through a 60-mesh sieve to obtain the warm-soaking residues powder, which was stored in a sealed desiccator for later use.
Ultrasonic treatment group: An amount of raw residues powder equal to that used in the warm-soaking group was weighed, and a eutectic solvent was added at the same ratio (liquid-to-solid ratio 62 mL/g, molar ratio 3). The mixture was subjected to ultrasonic treatment for 50 min at a power of 445 W. Immediately after ultrasonic treatment, vacuum filtration was performed to separate and collect the solid residues. The subsequent washing, drying, grinding, and sieving procedures were the same as those described for the warm-soaking treatment group.
2.6.2. Microscopic Observation of the Powder
A small amount of powder from each of the three batches was placed on a microscope slide. One to two drops of chloral hydrate were added, and the slide was slowly heated above the flame of an alcohol burner to allow for permeation; during heating, a chloral hydrate solution was added as required to prevent it from evaporating completely. One drop of dilute glycerol was added to the cooled mixture, and it was covered with a cover slip, taking care to avoid the formation of air bubbles during mounting. The microstructure of the powder was observed at different magnifications using a Motic PA53-FS6 upright LED fluorescence microscope (Motic China Group Co., Ltd., Xiamen, China).
2.6.3. Scanning Electron Microscopy Observation
The following steps were followed: Place a small quantity of samples from the three batches onto aluminium slides. Secure them to the aluminium sample stage using conductive double-sided adhesive tape and subject them to sputtering (metallisation). Observe the three-dimensional features of the samples at different magnifications using a HITACHI SU8600 scanning electron microscope (Japan) and capture images.
3. Results and Discussion
3.1. Results of Targeted Metabolomic Analysis of Polyphenolic Compounds
3.1.1. Method Validation Results
Quantitative analysis of the target compounds was performed under UPLC-MS conditions. The results indicate that all target compounds exhibited good linear relationships within their respective concentration ranges (R2 values all greater than 0.99); the results are shown in Table 4. The validation parameters of the 25 polyphenolic standards are summarized in Table 5. The LOD and LOQ values ranged from 0.5 to 100 ng/mL and 1 to 500 ng/mL, respectively. The intra-day and inter-day precision (RSD) values were below 5% for all compounds, and the repeatability (RSD) was also below 5%, indicating good precision of the method.
3.1.2. Determination of the Content in Samples
The total ion current chromatograms of the mixed standard and test samples, analysed by UPLC-Q Exactive MS, are shown in Figure 1. Each sample was analysed once. The contents of the 25 polyphenols in the AWX residues were determined, and the results are presented in Table 6, with gallic acid having the highest content, reaching 361.57 μg/g DW.
Figure 1.
Total ion current chromatograms of the mixed standard (A) and the sample (B).
Table 4.
Multivariate linear relationships.
Table 5.
Methodological analysis.
Table 6.
Determination of the content of multiple components in AWX residues.
3.1.3. Structural Confirmation of Typical Polyphenolic Compounds by UPLC-MS/MS
To ensure the reliability of the qualitative results, the 25 polyphenolic compounds were identified by comparing their retention times, accurate masses, and MS/MS fragmentation patterns with authentic standards and public databases (PubChem). The detailed MS/MS fragmentation pathways and spectra are provided in the Supplementary Material (Supplementary Figures S1–S4). Taking the representative flavonoids as examples, the [M-H]− ions of quercetin, luteolin, apigenin, and kaempferol were observed atm/z 301.03601, 285.04108, 269.04611, and 285.04114, respectively, with mass errors below 2.5 ppm.
Importantly, characteristic fragment ions were clearly observed, which are crucial for structural confirmation. For instance, quercetin exhibited characteristic Retro-Diels-Alder (RDA) fragment ions at m/z 151.00410 and m/z 178.99907, matching the PubChem reference spectrum (Supplementary Figure S1). Luteolin and apigenin showed their specific RDA fragments at m/z 133.02986/151.00403 and m/z 117.03493/151.00407, respectively, which perfectly matched their reference spectra (Supplementary Figures S2 and S3).
Regarding the identification of kaempferol (Supplementary Figure S4), the characteristic RDA fragment ions were clearly observed at m/z 151.00409 and m/z 133.02989, along with the fragment ion at m/z 175.04056 ([M-H-C6H4O2]−), which are highly consistent with the established cleavage pathway in Qiu [36].
It is worth noting that the retention time of kaempferol (RT = 7.61 min) in this specific chromatographic system was slightly longer than that of apigenin (RT = 7.52 min) (Table 4). This elution order differs from the conventional order observed on standard C18 columns. This phenomenon might be attributed to the specific mobile phase composition (0.1% formic acid in water/acetonitrile) and the specific gradient program used in our study, which could induce different interactions (such as intramolecular hydrogen bonding or chelation) with the stationary phase. Nevertheless, the highly specific MS/MS fragmentation patterns, combined with accurate mass and standard retention time comparison, unambiguously confirmed the identity of these compounds.
3.2. Screening of DESs
The formation of DESs is based on the formation of an extensive hydrogen-bond network between HBA and HBD: highly electronegative atoms in HBA molecules provide lone pairs of electrons, whilst HBD molecules provide hydrogen atoms that carry a partial positive charge due to electron cloud displacement; the two form a eutectic system via hydrogen bonding. Changes in the composition of DES simultaneously affect the system’s polarity, viscosity, and affinity for plant materials; these three factors collectively determine the extraction efficiency of the target compounds.
This study systematically investigated the effect of different DES ratios on the extraction yield of total polyphenols from AWX residues. Each experimental group comprised three replicates, with the results shown in Figure 2. The screening results indicate that the DESs-13, composed of betaine and ethylene glycol, exhibited the optimal extraction performance, with a TPC of 40.89 ± 0.0012 mg GAE/g DW; whereas the CK1 group, using pure water as the solvent, showed the poorest extraction performance, with a TPC of only 9.95 ± 0.0006 mg GAE/g DW. It is worth noting that the extraction efficiency of total polyphenols in the DES systems was, on the whole, significantly higher than that of conventional organic solvent systems: even the DES group with the lowest extraction rate (DESs-14, 33.91 ± 0.0006 mg GAE/g DW) far exceeded the optimal value of the conventional solvent group (50% ethanol, CK3, 14.36 ± 0.0015 mg GAE/g DW). Furthermore, the extraction yields for pure water (CK1, 9.95 ± 0.0006 mg GAE/g DW) and 75% ethanol (CK2, 11.42 ± 0.0038 mg GAE/g DW) were both less than 35% of the lowest value achieved by the DES systems, further confirming the significant advantages of DES in polyphenol extraction. In summary, DES exhibits excellent extraction efficiency and good universality for polyphenolic components in AWX residues. Based on the above screening results, this study selected the betaine-ethylene glycol system (DESs-13) as the extraction solvent for total polyphenols from AWX in subsequent experiments.
Figure 2.
Effect of different solvent types on the TPC from AWX residues. (Data are presented as mean ± SD (n = 3). Error bars represent standard deviation (SD)).
3.3. Results of Single-Factor Experiments
3.3.1. Effect of Liquid-to-Solid Ratio on the TPC from AWX Residues
Using a DES-13 molar ratio (HBD to HBA) of 2, an ultrasonication time of 40 min, and an ultrasonic power of 250 W as the baseline conditions, the effects of liquid-to-material ratios of 30, 40, 50, 60, and 70 mL/g on the TPC from AWX residues were investigated; the results are shown in Figure 3A. As the proportion of DES solvent increased, the TPC initially rose rapidly before levelling off: when the liquid-to-solid ratio increased from 30 to 60, the yield rose significantly from 25.99 ± 0.0208 mg GAE/g DW to approximately 44.92 ± 0.0087 mg GAE/g DW; when it was further increased to 70 mL/g, the yield rose only slightly to 45.031 ± 0.0056 mg GAE/g DW. Initially, an increase in solvent volume significantly increases the solid–liquid contact area and maintains a high concentration gradient, thereby enhancing the mass transfer driving force; however, as the liquid-to-solid ratio approaches 70 mL/g, polyphenol elution gradually approaches saturation, and simply increasing the solvent volume is insufficient to further overcome the elution bottleneck. Although the yield was highest at 70 mL/g, the difference compared with 60 mL/g was negligible; taking into account both solvent consumption and process economics, a liquid-to-solid ratio of 60 (mL/g) was ultimately selected.
Figure 3.
Effect of single factors on the TPC from AWX residues ((A): DES-13 molar ratio; (B): liquid-to-solid ratio; (C): ultrasonic extraction time; (D): ultrasonic power). Data are presented as mean ± SD (n = 3). Error bars represent standard deviation (SD).
3.3.2. Effect of DES Molar Ratio on the TPC from AWX Residues
Using a liquid-to-solid ratio of 50 mL/g for DES-13, an ultrasonication time of 40 min, and an ultrasonic power of 250 W as the baseline conditions, the effect of the DES-13 molar ratio (HBD to HBA) on the TPC from AWX residues was investigated; the results are shown in Figure 3B. As the proportion of HBD increased, the yield initially rose and then fell, reaching a maximum (39.51 ± 0.0015 mg GAE/g DW) at a molar ratio of 3. When the molar ratio was lower than 3, the number of intermolecular hydrogen bonds formed between HBA and HBD gradually increased, significantly enhancing the solubility of polyphenols in the eutectic solvent system; when the molar ratio exceeds 3, the proportion of ethylene glycol (as HBD) becomes too high, and hydrogen bonds form between excess ethylene glycol molecules, leading to a relative reduction in the number of effective hydroxyl groups and external hydrogen-bonding sites available to interact with the polyphenols, thereby reducing the TPC from the AWX residues. Therefore, a molar ratio (HBD to HBA) of 3 for DES-13 was selected as the optimal condition.
3.3.3. Effect of Ultrasonication Time on the TPC from AWX Residues
Under conditions of a molar ratio (HBD to HBA) of 2, a liquid-to-solid ratio of 50 mL/g, and an ultrasonic power of 250 W, the effect of ultrasonication time on the TPC from AWX residues was investigated; the results are shown in Figure 3C. As the ultrasonication time increased, the TPC first rose and then fell; within the range of 20–50 min, the TPC rose significantly with increasing time, from 34.27 ± 0.0066 mg GAE/g DW to 38.84 ± 0.0042 mg GAE/g DW; after 50 min, the yield levelled off, and at 60 min (38.90 ± 0.0032 mg GAE/g DW), there was no significant difference compared with 50 min. Appropriately extending the extraction time can enhance the mechanical disruption of plant cell walls caused by ultrasonic cavitation, thereby promoting the sustained release and diffusion of intracellular polyphenols; however, when the extraction time is too long, the soluble polyphenols have largely been extracted, and the local thermal effects generated by sustained cavitation may lead to the degradation of some active polyphenols, resulting in a slight decrease in yield. Taking into account both extraction efficiency and energy consumption, 50 min was determined to be the optimal ultrasonic extraction time.
3.3.4. Effect of Ultrasonic Power on the TPC from AWX Residues
Under conditions of a DES-13 molar ratio (HBD to HBA) of 2, a liquid-to-material ratio of 50 mL/g, and an ultrasonication time of 40 min, the effect of ultrasonic power on the TPC from AWX residues was investigated; the results are shown in Figure 3D. As the ultrasonic power increased from 100 W to 400 W, the TPC rose steadily from 28.40 ± 0.0097 mg GAE/g DW to 39.06 ± 0.0020 mg GAE/g DW; when the power was further increased to 500 W, the yield decreased significantly to 34.85 ± 0.0053 mg GAE/g DW. An appropriate ultrasonic power can effectively enhance the cavitation effect, promoting cell wall disruption and the release of intracellular polyphenols; however, excessively high power intensifies free radical oxidation and thermal effects, leading to the degradation of active polyphenols. At 400 W, the cavitation effect is sufficient to achieve effective cell wall disruption without inducing significant thermal degradation, thereby balancing extraction efficiency and the stability of the target compounds. Therefore, 400 W was selected as the optimal ultrasonic power condition.
3.4. Response Surface Methodology
3.4.1. Box–Behnken Response Surface Methodology Experiment
Design-Expert.13.0 software was used to perform multiple regression analysis on the experimental data, establishing a quadratic polynomial regression model relating the TPC to the four factors. The resulting regression equation is as follows:
Y = −285.49175 + 4.38707 × A + 23.97117 × B + 3.31175 × C + 0.36523 × D − 0.01775 × A × B
−0.00352 × A × C − 0.00081 × A × D − 0.0175 × B × C − 0.00815 × B × D
−0.00035 × C × D − 0.03169 × A2 − 3.03783 × B2 − 0.02794 × C2 − 0.00032 × D2
−0.00352 × A × C − 0.00081 × A × D − 0.0175 × B × C − 0.00815 × B × D
−0.00035 × C × D − 0.03169 × A2 − 3.03783 × B2 − 0.02794 × C2 − 0.00032 × D2
The results of the Box–Bohnken response surface experimental design are shown in Table 7. As can be seen from the results in Table 8, the model’s p-value is <0.0001, indicating extremely significance; the p-value for the misfit term is 0.1107, which is greater than 0.05, indicating that the misfit term is not significant. From the results in Table 8, judging by the magnitude of the p-values, the four factors—liquid-to-solid ratio (A), DES molar ratio (B), extraction time (C), and ultrasonic power (D)—influence the response value in the order D > C > B > A. Furthermore, the first-order term D is extremely significant, and the second-order terms A2, B2, C2, and D2 are all extremely significant. However, all two-way interaction terms (AB, AC, AD, BC, BD, and CD) had p-values greater than 0.05 (ranging from 0.0771 to 0.6883), indicating that these interactions were not statistically significant. The model’s R2 = 0.9572 and Adjusted R2 = 0.9144, indicating that this regression equation effectively describes the true relationship between the factors and the response value, and can be used to determine the optimal extraction process conditions.
Table 7.
Box–Behnken response surface experimental design results.
Table 8.
Analysis of variance (ANOVA) results.
Figure 4 shows a 3D response surface plot generated by fitting a quadratic regression model using Design-Expert 13 software. In response surface analysis, the shape of the contour lines provides an intuitive indication of the strength of the interaction between two factors: The more elliptical and steep the contour lines are, the more pronounced the interaction. The contour lines for all six pairs of factor interactions (AB, AC, AD, BC, BD, and CD) exhibited a non-tilted elliptical shape without any oblique orientation. In response surface methodology, the absence of tilted contours visually confirms the lack of synergistic interactions between these factors, which is fully consistent with the ANOVA results (Table 7). Furthermore, the observed elliptical curvature of the contours is attributed to the highly significant quadratic effects (A2, B2, C2, and D2) of the individual factors. The steepness of the response surfaces visually demonstrates the dominant influence of ultrasonic power (D) and extraction time (C) on TPC.
Figure 4.
3D response surface plot showing the influence of different factors on the evaluation indicators. ((A) Combined effects of mole ratio and liquid-to-solid ratio; (B) Combined effects of ultrasound duration and liquid-to-solid ratio; (C) Combined effects of ultrasonic power and liquid-to-solid ratio; (D) Combined effects of ultrasound duration and mole ratio; (E) Combined effects of ultrasonic power and mole ratio; (F) Combined effects of ultrasonic power and ultrasound duration).
3.4.2. Model Validation
Using the regression model generated by Design-Expert.13.0, the optimal extraction parameters for total polyphenols from AWX residues were predicted as follows: a liquid-to-solid ratio of 61.592 (mL/g), a molar ratio (HBD to HBA) of 3.191, an ultrasonication time of 50.069 min, and an ultrasonic power of 446.607 W. Under these conditions, the yield of total polyphenols from AWX residues could theoretically reach 47.241 mg GAE/g DW. Taking into account practical feasibility, the extraction conditions for AWX residues were adjusted from the theoretical values derived from the regression equation to the following: a solid-to-liquid ratio of 62 (mL/g), a molar ratio of 3, an ultrasonication time of 50 min, and an ultrasonic power of 445 W. Validation experiments were conducted under the above optimised conditions, with a total of three experiments carried out. The average value from the validation experiments was 47.15 ± 0.0729 mg GAE/g DW, and the relative deviation between the theoretical and experimental values was 1.15 per cent. This indicates that the use of the response surface optimisation method to optimise the extraction conditions for total polyphenols from AWX residues is feasible, and that the resulting extraction conditions for total polyphenols have practical application value.
3.5. Results of In Vitro Antioxidant Activity Assays
3.5.1. Scavenging Activity of the Extracts Against DPPH Radicals
Figure 5A illustrates the DPPH radical scavenging capacity of the total polyphenol extract from AWX residues. Within the concentration range of 11.875–760 μg/mL, the DPPH radical scavenging capacity exhibited a dose–response relationship, increasing with concentration. A quantitative standard curve for the DPPH system was constructed using Trolox as the standard, with the regression equation y = 3.5123x + 3.331 (R2 = 0.9995); a good linear relationship was observed within the concentration range of 6.25–25 μg/mL. According to the Trolox standard curve, the TEAC of AWX residues were 73.62 μmol TE/g DW.
Figure 5.
Results of antioxidant activity assays for total polyphenols in AWX residues ((A)—DPPH; (B)—ABTS; (C)—PTIO; (D)—hydroxyl radicals; (E)—superoxide anion; (F)—FRAP; (G)—total antioxidant activity by the phosphomolybdate method).
3.5.2. Scavenging Effect of the Extract on ABTS Radicals
The results of the antioxidant study on ABTS radicals using the total polyphenol extract from AWX residues are shown in Figure 5B. Within the range of 11.875–760 μg/mL, the total polyphenols from AWX residues exhibited antioxidant capacity that increased with concentration, reaching a maximum scavenging rate at 380 μg/mL, after which a slight decrease was observed as the concentration continued to rise. A quantitative standard curve for the ABTS system was constructed using Trolox as the standard, with the regression equation y = 0.7148x + 21.317 (R2 = 0.999), showing good linearity within the concentration range of 9.375–100 μg/mL. Based on the standard curve, the Trolox-equivalent antioxidant capacity of AWX residues was 174.61 μmol TE/g DW.
3.5.3. Scavenging Effect of the Extract on PTIO
The results of the antioxidant study on PTIO radicals by the total polyphenol extract from AWX residues are shown in Figure 5C. The scavenging capacity increased with concentration, reaching a maximum at 570 μg/mL; beyond this concentration, the scavenging capacity decreased slightly. A quantitative standard curve for the PTIO system was constructed using Trolox as the standard, with the regression equation y = 0.8754x + 31.983 (R2 = 0.9908); a good linear relationship was observed within the concentration range of 9.375–100 μg/mL. Based on the standard curve, the Trolox-equivalent antioxidant capacity of AWX residues was 65.12 μmol TE/g DW. At high concentrations, the scavenging rate approached 1, indicating that AWX residues possess good PTIO radical scavenging capacity and have potential value for natural antioxidant applications.
3.5.4. Scavenging Activity of the Extract Against Hydroxyl Radicals
The total polyphenol extract from AWX residues exhibited scavenging activity against hydroxyl radicals, as shown in Figure 5D. Within the concentration range of 11.875–760 μg/mL, the scavenging of hydroxyl radicals increased with concentration, reaching a maximum scavenging rate (46.9%) at 190 μg/mL; beyond this point, a slight decrease was observed. A quantitative standard curve for the hydroxyl radical system was constructed using Vc as the standard, with the regression equation y = 0.1681x + 4.4905 (R2 = 0.9906), showing good linearity in the concentration range of 100–400 μg/mL. Based on the calibration curve, the vitamin C-equivalent antioxidant capacity of AWX residues was 33.82 μmol Vc/g DW.
3.5.5. Scavenging Effect of the Extract on Superoxide Anion
As shown in Figure 5E, the total polyphenols from AWX residues exhibited a scavenging effect on superoxide anion. Within the concentration range of 95–760 μg/mL, the scavenging rate increased gradually with concentration, reaching 59.7%. A quantitative standard curve for the superoxide anion system was constructed using Vc as the standard, with the regression equation y = 0.2571x + 30.283 (R2 = 0.9969); a good linear relationship was observed within the concentration range of 25–200 μg/mL. Based on the calibration curve, the vitamin C-equivalent antioxidant capacity of AWX residues was 49.35 μmol Vc/g DW, equivalent to 49.35 μmol Vc per gram of AWX residues.
3.5.6. FRAP Antioxidant Capacity Results
Figure 5F shows the total antioxidant capacity of the total polyphenols from AWX residues at different concentrations, as determined by the FRAP method. The total antioxidant capacity exhibited a dose–response relationship with concentration. When the concentration ranged from 35.625 to 71.25 μg/mL, the variation in total antioxidant capacity was minimal; when the concentration ranged from 71.25 to 190 μg/mL, the total antioxidant capacity increased. The FeSO4 calibration curve, within the range of 0.1–2.1 mmol/L, was fitted by the equation y = 0.6597x + 0.13, with R2 = 0.9992, indicating a good linear relationship. The Trolox calibration curve, within the range of 75–300 μg/mL, had the equation y = 0.0051x − 0.0303, with R2 = 0.9990, indicating a good linear relationship. Combining the two standard curves above, it was found that at a concentration of 190 μg/mL, the reducing capacity of the total polyphenols in the AWX residues is equivalent to 169.69 μg/mL of Trolox, which is also equivalent to 1.16 mmol/L of FeSO4.
3.5.7. Results of Total Antioxidant Capacity Determined by the Phosphomolybdate Method
Figure 5G illustrates the total antioxidant capacity of total polyphenols from AWX residues at different concentrations, as determined by the phosphomolybdate method. The total antioxidant capacity exhibited a dose–response relationship and increased with concentration. When the concentration ranged from 11.875 to 95 μg/mL, there was little variation; when the concentration ranged from 95 to 760 μg/mL, the total antioxidant capacity increased. The Trolox standard curve, within the range of 25–300 μg/mL, was fitted by the equation y = 0.0006x + 0.0114, with R2 = 0.996, indicating a good linear relationship. Based on the Trolox standard curve, it can be concluded that the antioxidant capacity of a 380 μg/mL solution of total polyphenols from AWX residues is equivalent to that of 164.72 μg/mL Trolox.
3.6. Results of Microscopic Identification
3.6.1. Results of Microscopic Examination of Powders
The microscopic structure of the AWX residues powder is shown in Figure 6. Figure 6a–c shows the powder microstructure of the original medicinal residues; in Figure 6a, relatively intact spiral vessels can be seen; Figure 6b shows pollen grains that are elliptical in shape, with a diameter of approximately 10–15 μm, appearing to have a finely engraved texture on their surface and a yellowish-brown colour; Figure 6c shows stone cells, which are roughly square in shape, with a diameter of approximately 25–30 μm. Figure 6d–f shows the microstructure of the medicinal residues powder after being washed with water and dried following a 50 min warm immersion in a eutectic solvent. Figure 6d shows pollen grains, which are triangular in shape and approximately 10–15 μm in diameter and possess three pairs of furrows; Figure 6e shows tightly arranged thin-walled cells that appear purple-blue after staining; Figure 6f clearly shows fragmented glandular trichomes, approximately 250 μm in length, with gland stalks composed of three cells. Figure 6g–i shows the microstructure of the medicinal residues powder after being washed with water and dried following 50 min of ultrasonic treatment in a eutectic solvent. Figure 6g shows vessels that are severely fragmented; Figure 6h shows calcium oxalate cluster crystals with slightly blunted edges, approximately 25 μm in diameter; Figure 6i clearly shows tetragonal crystals with a diameter of approximately 10 μm. When compared with the relatively intact vessels in Figure 6a, the fragmented state of the vessels after sonication (Figure 6g) indicates that the ultrasonic cavitation effect can effectively disrupt the plant tissue framework, thereby enhancing the extraction efficiency of active constituents.
Figure 6.
The powdered microstructure of AWX residues.((a) Spiral vessels; (b) Pollen grains; (c) Stone cells; (d) Pollen grains; (e) Thin-walled cells; (f) Glandular trichomes; (g) Vessels; (h) Calcium oxalate cluster crystals; (i) Tetragonal crystals).
3.6.2. Scanning Electron Microscopy (SEM) Micrographs
The SEM characteristics of AWX residues are shown in Figure 7. Figure 7a–d shows the microstructure of the raw residues powder; Figure 7e–h shows the residues powder after warm soaking in DES for 50 min, followed by water washing and drying; and Figure 7i–l shows the residues powder after ultrasonic treatment in DES for 50 min, followed by water washing and drying. At 50× magnification (Figure 7a), a large number of small, irregularly shaped particles ranging in size from 20 to 300 μm were observed. Pollen grains in the raw residues powder (Figure 7b) and in the warm-soaking group (Figure 7e) had a diameter of approximately 70 μm, were spherical in shape, and possessed spiny projections with sharp tips on their outer walls. Spiral vessels were observed in the raw residues powder (Figure 7c), the warm-soaking group (Figure 7f), and the ultrasonic group (Figure 7k,l) at magnifications of 2500×, 1000×, 250×, and 1200×, respectively. In Figure 7c, the vessels appeared as long tubes with distinct spiral-shaped thickening on the vessel walls. In Figure 7f, the spiral texture of the vessel wall was continuous and dense. In Figure 7k,l, the vessels were exposed and exhibited reticulate or ridged protrusions with a small pitch. In contrast, after ultrasonic treatment with DES (Figure 7k,l), the thickened layer of the spiral vessels was completely exposed and distorted; the cavitation effect generated by ultrasound acted directly on the plant cell walls, causing the vessels to fracture. Fibres were examined in the raw residues powder (Figure 7d), the warm-soaking group (Figure 7g,h), and the ultrasonic group (Figure 7i,j) at magnifications of 1000×, 600×, 500×, 200×, and 300×, respectively. In Figure 7d, the fibres were elongated and spindle-shaped, with a distinct longitudinal texture and fine longitudinal cracks on the surface. In Figure 7g,h, the longitudinal grooves on the surface were deeper, with slight wrinkling in some areas. In Figure 7i,j, the fibres were severely fractured, appearing as short rod-like segments or fragments with a rough surface. In contrast, after ultrasonic treatment with DES (Figure 7i,j), the fibre structure suffered severe mechanical damage; the fibres fractured into short rod-like segments or minute fragments, and their original elongated spindle-shaped contours disappeared entirely. This phenomenon provides clear evidence that the physical forces of ultrasound can effectively disrupt the rigid structure of plant fibres.
Figure 7.
Scanning electron microscopy (SEM) of AWX residues ((a) Raw medicinal residue particles; (b) Pollen grains in raw residues; (c) Spiral vessels in raw residues; (d) Fibres in raw residues; (e) Pollen grains after warm soaking; (f) Spiral vessels after warm soaking; (g) Fibres after warm soaking; (h) Fibres after warm soaking; (i) Fibres after ultrasonic treatment; (j) Fibres after ultrasonic treatment; (k) Spiral vessels after ultrasonic treatment; (l) Spiral vessels after ultrasonic treatment.).
4. Conclusions
Previous UPLC-MS qualitative analysis conducted by our research group has confirmed that AWX residues contain a wide variety of compounds, amongst which flavonoids and polyphenolic compounds are the secondary metabolites present in higher concentrations [37]; these constitute the key material basis for the medicinal development potential of these residues. Based on this, the present study further utilised targeted metabolomics via UPLC-MS to quantitatively analyse the characteristics of the polyphenolic components in the AWX residues. Screening for low-eutectic green solvents, single-factor experiments, and response surface process optimisation were conducted for total polyphenols. Furthermore, the mechanisms of extraction synergy and the basis of bioactive substances were elucidated through in vitro antioxidant models and microstructural characterisation, thereby providing a scientific basis for the green, circular and high-value utilisation of waste medicinal residues from traditional medicines.
Through targeted qualitative and quantitative analysis, this study identified 25 polyphenolic constituents in AWX residues, including phenolic acids, flavonoids, and their glycosides. Among these, gallic acid, Kaempferol-3-O-glucoside,3,4-Dihydroxybenzoic acid, and vanillic acid exhibited relatively high concentrations. In the experiments, all target compounds exhibited good linearity in their standard calibration curves (R2 > 0.99), and the quantitative results were accurate and reliable, fully reflecting the polyphenol content profile of the AWX residues. The eutectic solvent screening showed that the betaine–ethylene glycol system (DESs-13) had significantly higher extraction efficiency for polyphenols from AWX residues than traditional solvents such as pure water, 50% ethanol, and 75% ethanol, with a maximum TPC of 40.89 ± 0.0012 mg GAE/g DW. These results highlight the unique advantages of green solvents for natural polyphenol extraction. Owing to its hydrogen-bond network structure, DES can effectively disrupt the interactions between plant cell walls and polyphenolic components. It also offers advantages such as high solubility, good stability, and ease of preparation and can reduce the reliance on conventional volatile organic solvents. Based on the optimisation achieved through a combination of single-factor experiments and the Box–Behnken response surface method, the established regression model was found to be highly significant, with the residual term not significant (p > 0.05), indicating a good fit. Ultimately, based on practical considerations, the optimal process was determined to be a liquid-to-solid ratio of 62 mL/g, a molar ratio of 3, an ultrasonication time of 50 min, and an ultrasonic power of 445 W. Under these conditions, the polyphenol yield reached 47.15 ± 0.0729 mg GAE/g DW, with the experimental values showing a high degree of agreement with the theoretical values. The results of in vitro antioxidant assays indicate that the polyphenol extract from the AWX residues exhibits good scavenging capacity against DPPH, ABTS, and PTIO, whilst also demonstrating excellent iron ion reduction capacity and total antioxidant activity; however, its scavenging capacity against hydroxyl radicals and superoxide anions is relatively weak. The extract exhibited outstanding DPPH and ABTS radical scavenging activity, as well as excellent Trolox-equivalent antioxidant capacity, providing a basis for further investigation of its in vitro antioxidant potential. However, in vivo efficacy, bioavailability, safety, and therapeutic activity remain to be established in future studies. Results from microscopic and microstructural characterisation further elucidated the mechanism of action of ultrasound-assisted DES extraction. The SEM results revealed that ultrasonic treatment combined with DES caused fragmentation of vascular bundles, breakage of fibres, and disruption of cell structures. These structural changes are consistent with the markedly higher polyphenol extraction efficiency of DES-13 compared with conventional solvents (pure water and 50% ethanol), supporting the proposed synergistic mechanism of ultrasonic physical enhancement and DES extraction. The results therefore suggest that ultrasonic cavitation and its associated thermal effects, in combination with the hydrogen-bond network of DES, may disrupt plant cell walls and fibres, thereby increasing the contact area between the solvent and the intracellular polyphenols and promoting their release. These findings further support the conclusion that, compared with conventional solvents, DES can significantly improve the extraction efficiency of polyphenols.
The optimised betaine-ethylene glycol DES-ultrasound extraction reduces the use of conventional volatile organic solvents. Compared with water- and ethanol-based extraction, it also provides higher polyphenol yields. Ultrasound-driven cavitation physically breaks plant tissues to enhance mass transfer without complicated chemical derivatisation. Landfill-bound herbal residues are converted into bioactive extracts to realise source-level waste prevention. However, the optimal liquid-to-solid ratio of 62 mL/g causes high solvent usage, and ultrasonication contributes notable energy expenditure. Despite superior polyphenol yields over water- and ethanol-based extraction, resource-energy costs cannot be ignored. Future industrialisation requires lower liquid-to-solid ratios, DES-recycling techniques, and reduced energy input. This approach may contribute to the valorisation of industrial herbal by-products within a circular-economy framework, but a full life-cycle and environmental assessment is required to confirm its overall sustainability.
In summary, this study analysed the polyphenolic constituents of AWX residues, optimised a green extraction process, and evaluated the in vitro antioxidant activity of the extract. These findings provide experimental evidence and a potential approach for the resource recovery and high-value utilisation of medicinal residues from traditional Chinese medicine formulations. However, further studies are needed to evaluate the in vivo efficacy, safety, and applicability of this approach.
Supplementary Materials
The following supporting information can be downloaded at https://www.mdpi.com/article/10.3390/pr14203332/s1: Figure S1: Mass spectrometry and chromatography spectra of quercetin (A—PubChem mass spectrum; B—Experimental mass spectrum; C—Chromatogram of the standard: D—Chromatogram of the sample), Figure S2: Mass spectrometry and chromatography spectra of luteolin (A—PubChem mass spectrum; B—Experimental mass spectrum; C—Chromatogram of the standard: D—Chromatogram of the sample), Figure S3: Mass spectrometry and chromatography spectra of apigenin (A—PubChem mass spectrum; B—Experimental mass spectrum; C—Chromatogram of the standard: D—Chromatogram of the sample), Figure S4: Mass spectrometry and chromatography spectra of kaempferol (A—Experimental mass spectrum; B—Chromatogram of the standard; C—Chromatogram of the sample).
Author Contributions
X.L.: conceptual design; methodology; validation; investigation; data organization; drafting. S.L.: validation; data organization. A.A.: investigation; resources; supervision; funding acquisition. H.Z.: resources; reviewing and editing; supervision; project management; funding acquisition. S.T.: conceptual design; methodology; validation; supervision; funding acquisition. All authors have read and agreed to the published version of the manuscript.
Funding
This project was funded by the 14th Five-Year Plan Key Discipline of Xinjiang Uygur Autonomous Region-Traditional Medicine at Xinjiang Medical University (1005) and Xinjiang Hetian Specialty Chinese Medicine Research Key Laboratory Project (202406-1).
Data Availability Statement
The original contributions presented in this study are included in the article/Supplementary Material. Further inquiries can be directed to the corresponding author.
Acknowledgments
The authors express gratitude to Xinjiang Medical University for providing the experimental platform and research environment. Special thanks are extended to Shuge Tian for his invaluable guidance in research design and manuscript preparation.
Conflicts of Interest
Author Haiyan Zhang was employed by the Xinjiang Xinwei Pharmaceutical Co., Ltd. The remaining authors declare that the research was conducted in the absence of any commercial or financial relationships that could be construed as a potential conflict of interest.
References
- Ding, H.; Huang, Y.; Zhao, R.; Wang, Y.; Huang, Y.; Long, S.; Feng, H.; Gao, G.; Meng, L. Phosphorus-solubilizing Acinetobacter strains from Chinese medicine residues enhance tomato growth and rhizosphere microbial diversity. Biocatal. Agric. Biotechnol. 2026, 76, 104160. [Google Scholar] [CrossRef] [Scilit]
- Tian, X.; An, Z.; Yang, Z.; Xi, L.; Yu, L.; Gu, Y.; Yang, X.; Qin, H.; Zhang, M.; Wu, J. Probiotic-fermented herbal residues in obesity management: A review. Front. Public Health 2026, 14, 1797885. [Google Scholar] [CrossRef] [Scilit] [PubMed]
- Chen, P.; Aikemu, A.; Zhang, H.; Tian, S. Elucidating the therapeutic potential of Crocus sativus L. residues against myocardial infarction via UPLC-MS, network pharmacology, and molecular dynamics simulations. Discov. Appl. Sci. 2025, 8, 37. [Google Scholar] [CrossRef] [Scilit]
- Hu, X.; Fang, M.; Huang, H.; Chen, N.; Hao, J. Natural deep eutectic solvent for efficient extraction of polyphenols from dendrobium residue: Optimization, characterization, and enhanced antioxidant activity. Prep. Biochem. Biotechnol. 2026, 56, 1–17. [Google Scholar] [CrossRef] [Scilit] [PubMed]
- Liu, S.; Wang, J.; Chen, X.; Pan, X.; Zhang, J.; Xu, S.; Bai, W. Inhibitory effect of lignin extracted from traditional Chinese medicine residues on colon cancer cells: An in vitro study. ChemistrySelect 2026, 11, e06562. [Google Scholar] [CrossRef] [Scilit]
- Zhao, Z.; Ma, J.; Zeng, Y.; Wang, W.; Zhou, B.; Tang, J.; Ren, Z.; Wang, Y.; Hu, Y. Structural elucidation of bioactive lignin-carbohydrate complexes from herb residue of Artemisia argyi: A case study of high-value valorization of herb wastes. Chem. Eng. J. 2025, 521, 166458, Erratum in Chem. Eng. J. 2026, 542, 178187. https://doi.org/10.1016/j.Cej.2026.178187. [Google Scholar] [CrossRef] [Scilit]
- Aikhermu, E.; Abdumijiti, A.; Yunus, A.; Simáyi, A. Clinical Observation of 100 Cases of Coronary Heart Disease Treated with the Traditional Uyghur Medicine ‘Aiwei Xin’ Oral Solution. Chin. J. Ethnomed. 2018, 24, 3–5. [Google Scholar] [CrossRef]
- Zhao, B. Clinical efficacy of Wei Medicine Aivixin Oral Solution in the treatment of angina pectoris due to coronary heart disease. Chin. J. Ethnomed. 2021, 27, 16–17. [Google Scholar] [CrossRef]
- Xin, H.; Bao, Y.; Gao, X.; Li, H.; Li, W.; Anwar, D.; Nasir, N.; Anwair, G.; Sun, Z. Aiweixin oral solution regulates mitochondrial fusion and fission to alleviate myocardial ischemia/reperfusion injury in rats. Chin. J. Pharmacol. 2025, 41, 2177–2185. [Google Scholar] [CrossRef]
- Baihumuti, M.; Abula, N.; Aihmaiti, H.; Ma, Q.; Maitusun, N. A study on the chemical composition identification of Aivixin oral solution using UHPLC-Q-Orbitrap-MS and the mechanism underlying its protective effect against myocardial ischemia-reperfusion injury. J. Hunan Univ. Chin. Med. 2025, 45, 1210–1220. [Google Scholar] [CrossRef]
- Tursun, P.; Abduwak, M.; Tian, S.; Dilimati, M.; Tursi, W.; Zhang, H.; Aikmu, A. Qualitative and quantitative analysis of chemical composition of Aivixin oral solution. Chin. J. Hosp. Pharm. 2025, 45, 2464–2470. [Google Scholar] [CrossRef]
- Xu, H.; Pan, L.-B.; Yu, H.; Han, P.; Fu, J.; Zhang, Z.-W.; Hu, J.-C.; Yang, X.-Y.; Keranmu, A.; Zhang, H.-J.; et al. Gut microbiota-derived metabolites in inflammatory diseases based on targeted metabolomics. Front. Pharmacol. 2022, 13, 919181. [Google Scholar] [CrossRef] [Scilit] [PubMed]
- Chen, J.; Li, T.; Qin, X.; Du, G.; Zhou, Y. Integration of non-targeted metabolomics and targeted quantitative analysis to elucidate the synergistic antidepressant effect of Bupleurum chinense DC-Paeonia lactiflora Pall herb pair by regulating purine metabolism. Front. Pharmacol. 2022, 13, 900459. [Google Scholar] [CrossRef] [Scilit] [PubMed]
- Dai, M.; Li, S.; Shi, Q.; Xiang, X.; Jin, Y.; Wei, S.; Zhang, L.; Yang, M.; Song, C.; Huang, R.; et al. Changes in Triterpenes in Alismatis rhizoma after Processing Based on Targeted Metabolomics Using UHPLC-QTOF-MS/MS. Molecules 2021, 27, 185. [Google Scholar] [CrossRef] [Scilit] [PubMed]
- Li, W.; Li, S.; Cao, Z.; Sun, Y.; Qiu, W.; Jia, M.; Su, M. Exploration of the amino acid metabolic signature in anthracycline-induced cardiotoxicity using an optimized targeted metabolomics approach based on UPLC-MS/MS. Naunyn-Schmiedeberg’s Arch. Pharmacol. 2022, 395, 1209–1224. [Google Scholar] [CrossRef] [Scilit] [PubMed]
- Amorim, C.R.B.; Lopez, J.A.; Franceschi, E.; Borges, G.R.; Dariva, C.; Santos, K.S. Sequential separation process of antioxidant polyphenols from umbu-cajá (Spondias bahiensis P. Carvalho, Van den Berg & M. Machado) leaves by ultrasound-assisted pressurized liquid extraction. Braz. J. Chem. Eng. 2026, 43, 1–8. [Google Scholar] [CrossRef] [Scilit]
- Kossar, A.; Pamu, S.; Rajput, D.; Beck, N.R. Moringa oleifera in the gut–skin axis: Linking polyphenol signaling, microbiome diversity, and dermatological benefits. S. Afr. J. Bot. 2026, 197, 337–350. [Google Scholar] [CrossRef] [Scilit]
- Li, W.; Xu, N.; Hu, Y.; Liu, Z.; Li, W.; Li, D. Protective effects of flavonoid and polyphenol from lotus leaf on lung damage induced by inhalation of N2O4 in mice. E3S Web Conf. 2021, 233, 02013. [Google Scholar] [CrossRef] [Scilit]
- Mohebbi, A.; Askari, F.S.; Madihi, M.; Monavari, S.H.; Salim, F.B.; Tabarraei, A.; Kiani, S.J. Antiviral effects of polyphenols against herpes simplex virus type 1: A comprehensive review. Phytochem. Rev. 2026, 25, 1–40. [Google Scholar] [CrossRef] [Scilit]
- Singh, B.; Singh, L.; Belwal, T.; Bhatt, I.D.; Kandpal, N.D. Green and sustainable extraction of therapeutic glycosides and polyphenols from Paeonia emodi Royle: Implications for process safety. Process Saf. Environ. Prot. 2026, 217, 109336. [Google Scholar] [CrossRef] [Scilit]
- Chen, Q.; Zhuang, L.; Li, P.; Lei, J.; Hu, Y.; Song, D.; Liu, J. Ultrasound-assisted natural deep eutectic solvents for the extraction of flavonoids from Zanthoxylum bungeanum Maxim leaves: COSMO-RS screening, process optimization, and α-glucosidase inhibition mechanism. Food Chem. 2026, 525, 150661. [Google Scholar] [CrossRef] [Scilit] [PubMed]
- Chiriac, A.; Dragoi, E.N.; Estevinho, B.N.; Blaga, A.C. Sustainable extraction, modelling, and microencapsulation of Sempervivum tectorum polyphenols using natural deep eutectic solvents. Sustain. Chem. Pharm. 2026, 53, 102512. [Google Scholar] [CrossRef] [Scilit]
- Tessaro, L.; Astolfo, M.E.d.A.; Matheus, J.R.V.; Alencar, S.M.d.; Fai, A.E.C.; Maniglia, B.C. Green extraction and stabilization of bioactive compounds from annatto (Bixa orellana L.) seeds using hydrophobic natural deep eutectic solvents. Sep. Purif. Technol. 2026, 411, 139525. [Google Scholar] [CrossRef] [Scilit]
- Varfaj, I.; Chiocci, C.; Sardella, R.; Lanari, D.; Piovan, A.; Costa, V.D.; Giovagnoli, S.; Marcotullio, M.C. Unlocking Matricaria chamomilla bioactives: Process optimization via betaine-NADES extraction, metabolic profiling, and antityrosinase activity. Ind. Crops Prod. 2026, 250, 123969. [Google Scholar] [CrossRef] [Scilit]
- Zahra, S.A.; Iqbal, J.; Abbasi, B.A.; Yaseen, T.; Hameed, A.; Shahbaz, A.; Kanwal, S.; Mahmood, T.; Ahmad, P. Scanning electron microscopy of Sophora alopecuroides L. seeds and their cytotoxic, antimicrobial, antioxidant, and enzyme inhibition potentials. Microsc. Res. Tech. 2021, 84, 1809–1820. [Google Scholar] [CrossRef] [Scilit] [PubMed]
- Urooj, U.; Mazhar, F.; Azhar, I. Microscopic characterization of Achillea santolina L. flower through light microscopy and scanning electron microscopy. Microsc. Res. Tech. 2024, 88, 879–894. [Google Scholar] [CrossRef] [Scilit] [PubMed]
- Liu, Z.; Li, X.; Zhao, Y.; Jin, Y.; Zhou, J.; Huang, L.; Zha, L.; Yuan, Y. Microscopic characterization of five Artemisia crude herbs using light microscopy, scanning electron microscopy, and microscopic quantitative analysis. Microsc. Res. Tech. 2022, 85, 2428–2437. [Google Scholar] [CrossRef] [Scilit] [PubMed]
- Sun, Z.; Wang, L.; Chen, P.; Tian, S.; Chen, Y. Microscopic observation and physicochemical analysis reveal the microstructure and chemical composition of Abelmoschus manihot flower and its potential value in anti-caries applications. Microsc. Res. Tech. 2024, 88, 1181–1206. [Google Scholar] [CrossRef] [Scilit] [PubMed]
- Sreekala, V.; Vijaykishan, B.; Rajasekar, S.S.; Rajesh, R. Phytochemical Analysis And In Vitro Dpph Assay of Ethanolic Extract of Mucuna Pruriens Seed. Int. J. Curr. Pharm. Res. 2020, 12, 93–96. [Google Scholar] [CrossRef] [Scilit]
- Jo, Y.-J.; Cho, H.-S.; Chun, J.-Y. Antioxidant activity of β-cyclodextrin inclusion complexes containing trans-cinnamaldehyde by DPPH, ABTS and FRAP. Food Sci. Biotechnol. 2021, 30, 807–814. [Google Scholar] [CrossRef] [Scilit] [PubMed]
- Li, G.; Cheng, Y.; Zhang, T.; Li, Y.; Han, L.; Liang, G. Characterization of oxygenated heterocyclic compounds and in vitro antioxidant activity of pomelo essential oil. Drug Des. Dev. Ther. 2021, 15, 937–947. [Google Scholar] [CrossRef] [Scilit] [PubMed]
- Chaniad, P.; Tewtrakul, S.; Sudsai, T.; Langyanai, S.; Kaewdana, K. Anti-inflammatory, wound healing and antioxidant potential of compounds from Dioscorea bulbifera L. bulbils. PLoS ONE 2020, 15, e0243632. [Google Scholar] [CrossRef] [Scilit] [PubMed]
- Ye, L.; Huang, Y.; Zhang, L.; Li, X.; Zhang, B.; Yang, X.; Luo, J.; Liu, H.; Zhang, X.; Song, C.; et al. Structural characterization and antioxidant activity evaluation of a polysaccharide from Pink Auricularia cornea. Int. J. Biol. Macromol. 2025, 284, 138149. [Google Scholar] [CrossRef] [Scilit] [PubMed]
- Muhammad, H.; Qasim, M.; Ikram, A.; Versiani, M.A.; Tahiri, I.A.; Yasmeen, K.; Abbasi, M.W.; Azeem, M.; Ali, S.T.; Gul, B. Antioxidant and antimicrobial activities of Ixora coccinea root and quantification of phenolic compounds using HPLC. S. Afr. J. Bot. 2020, 135, 71–79. [Google Scholar] [CrossRef] [Scilit]
- Untea, A.; Lupu, A.; Saracila, M.; Panaite, T. Comparison of ABTS, DPPH, phosphomolybdenum assays for estimating antioxidant activity and phenolic compounds in five different plant extracts. Bull. Univ. Agric. Sci. Vet. Med. Cluj-Napoca Anim. Sci. Biotechnol. 2018, 75, 110–114. [Google Scholar] [CrossRef] [Scilit] [PubMed]
- Qiu, L.Y.R.; Wei, K.T.; Zhu, J.P.; Jiang, J.; Xu, Y.C.; Lao, K.Y. Integrating UPLC-Q-TOF-MS and network pharmacology to analyze the components and mechanism of action of Compound Duzhong Zhuangyao Capsules on osteoporosis. Medicine 2025, 104, e45453. [Google Scholar] [CrossRef] [Scilit] [PubMed]
- Lou, X.; Aikemu, A.; Zhang, H.; Tian, S. Chemical composition analysis of Aiweixin oral liquid residue based on UPLC-Orbitrap-MS and HS-SPME-GC-MS. Acta Chromatogr. 2026, 38, 659–676. [Google Scholar] [CrossRef] [Scilit]
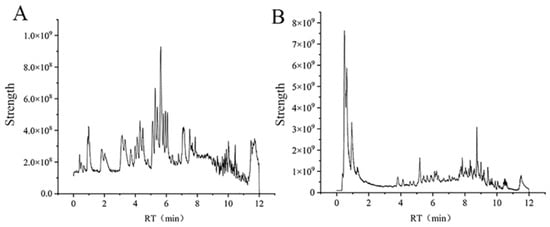
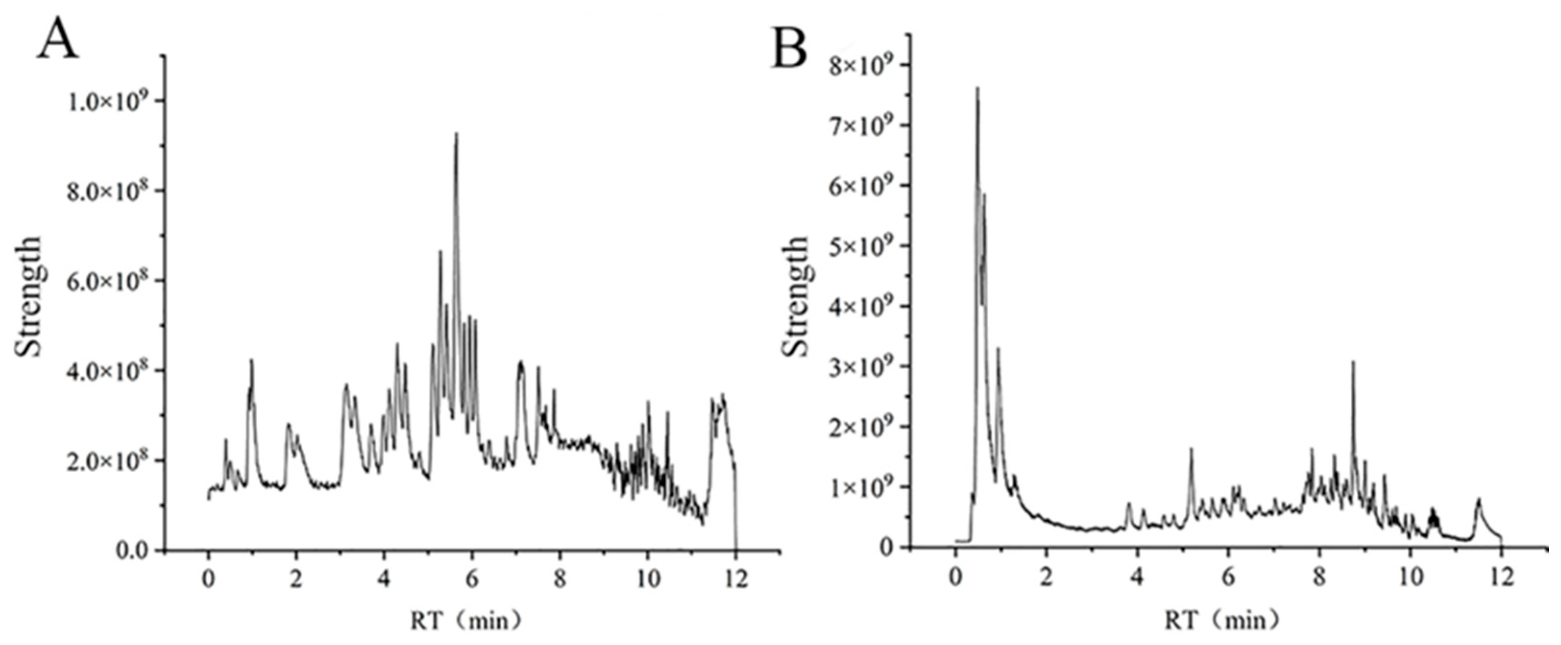
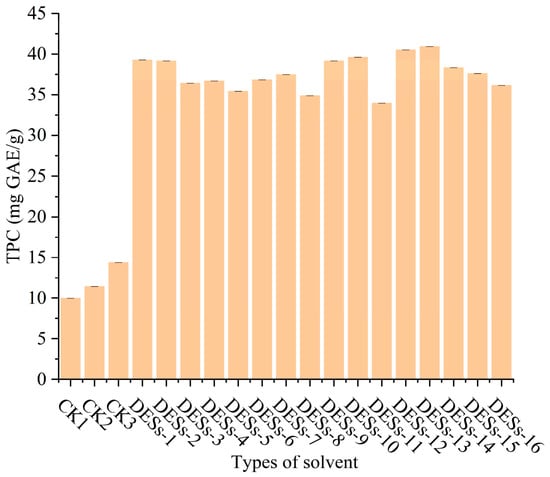
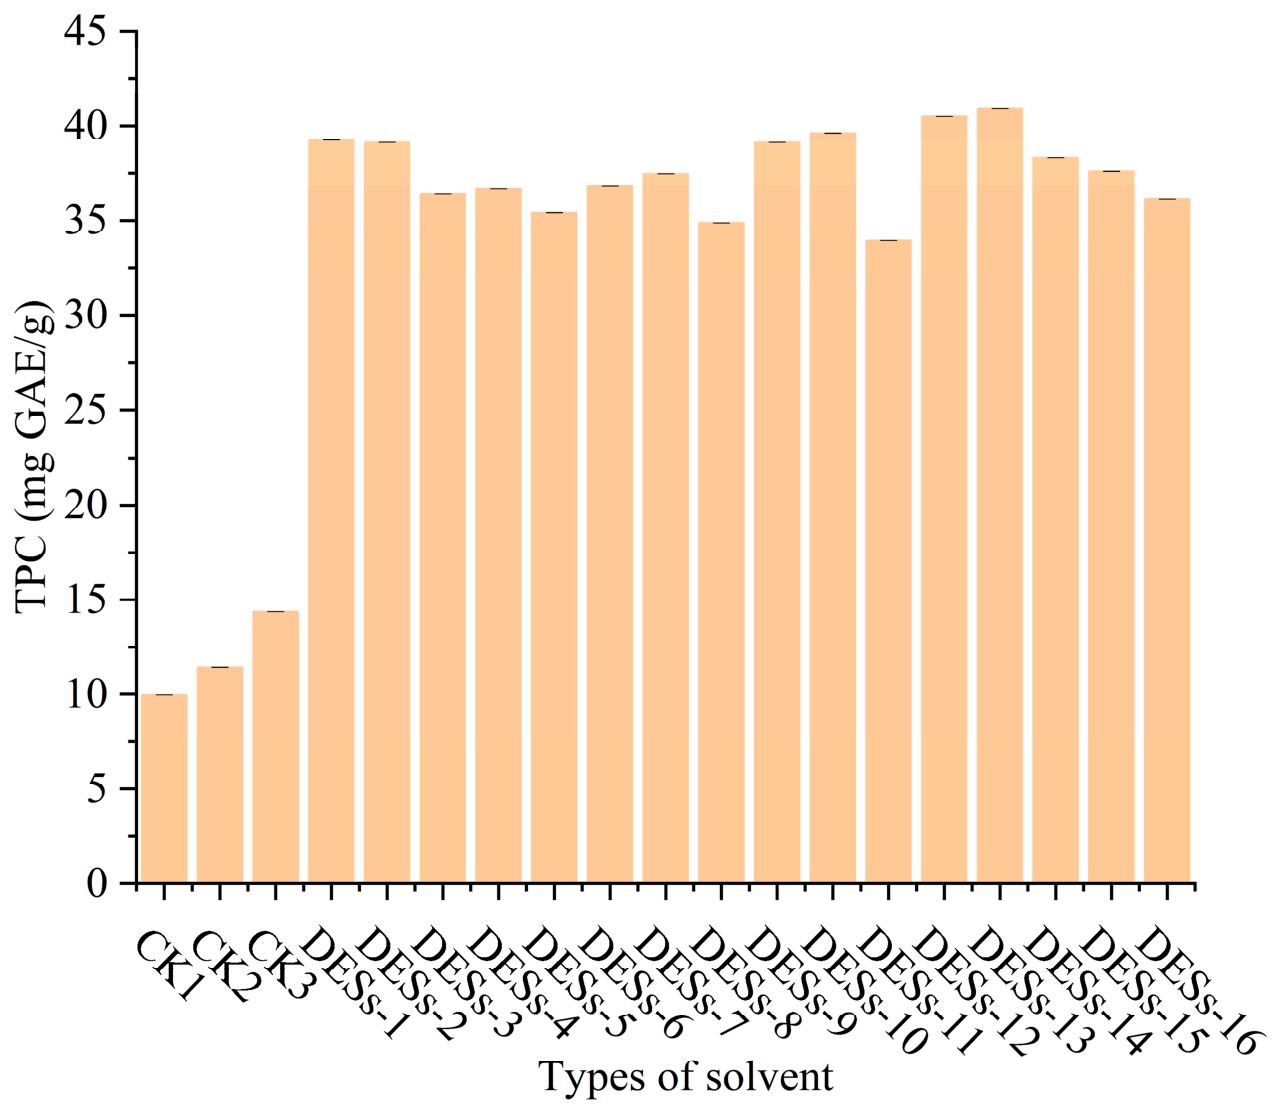
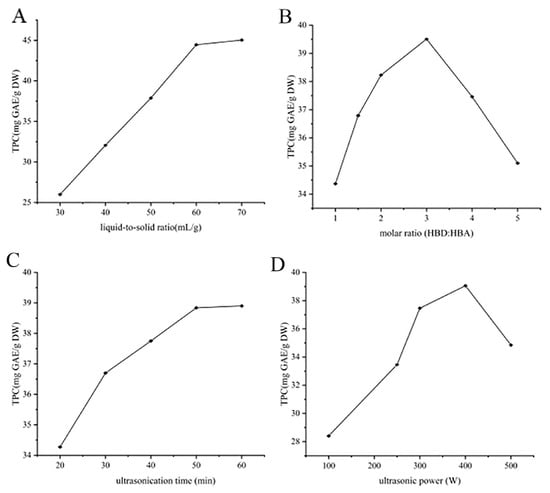
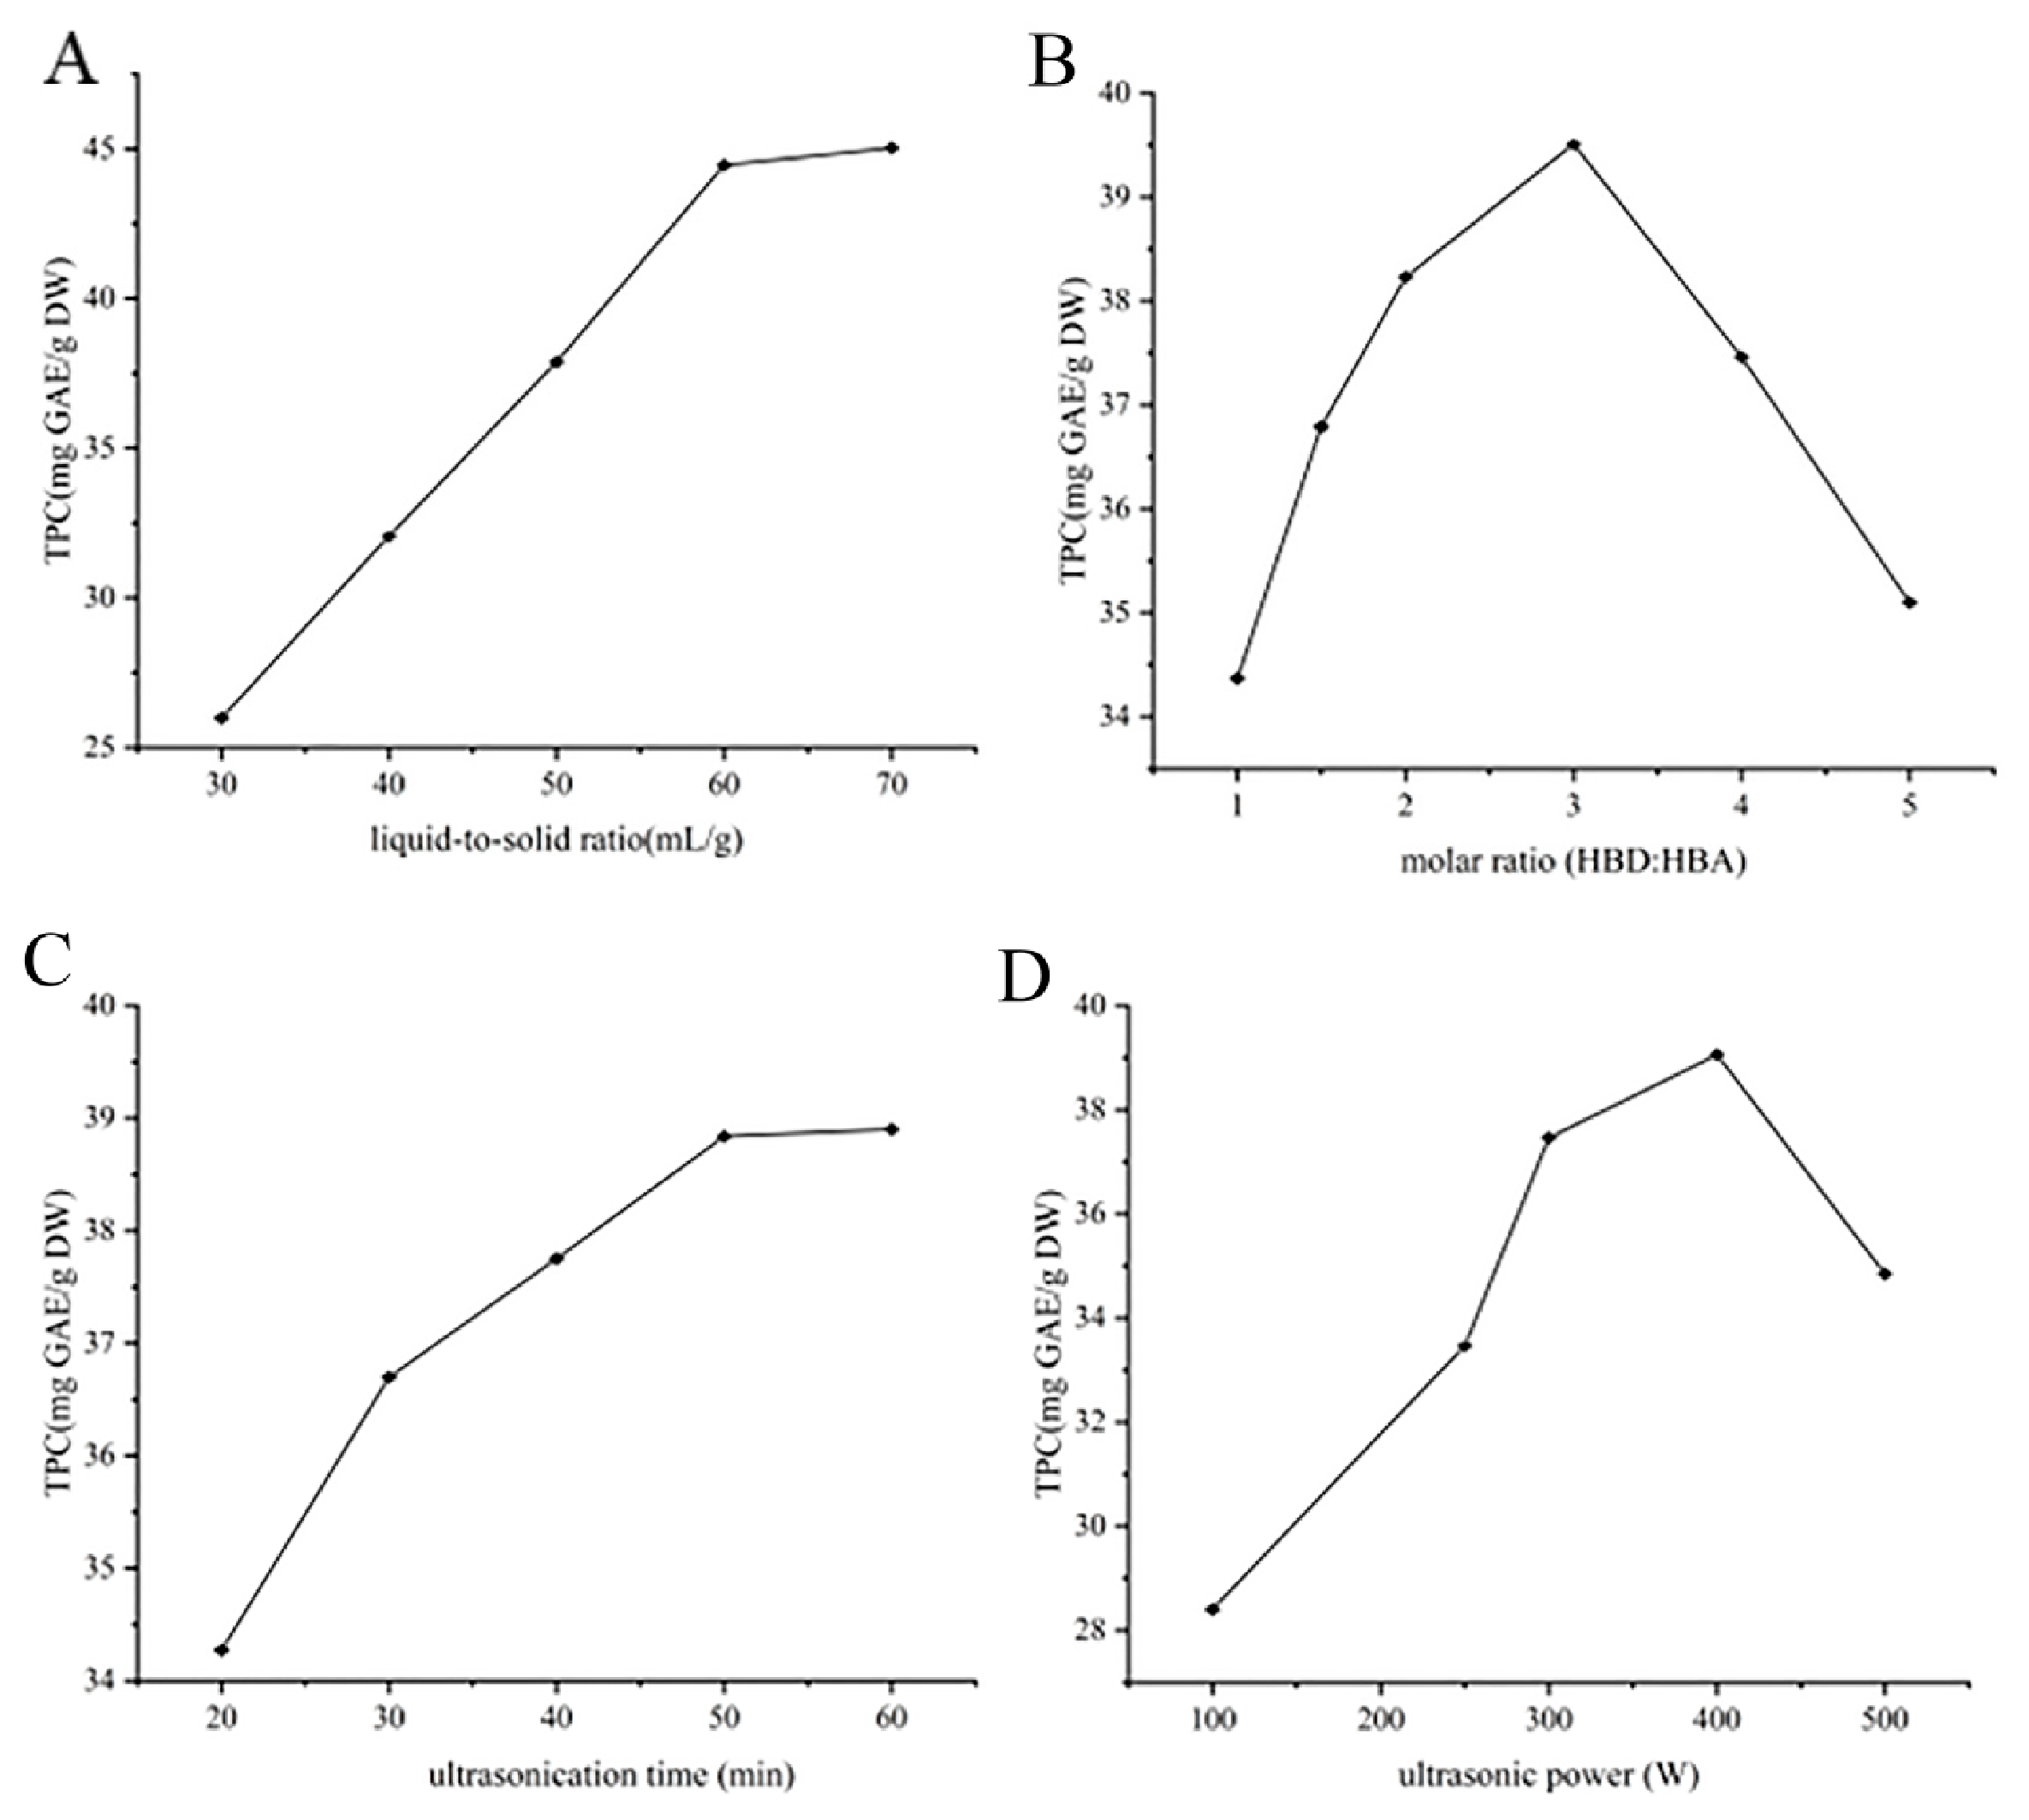
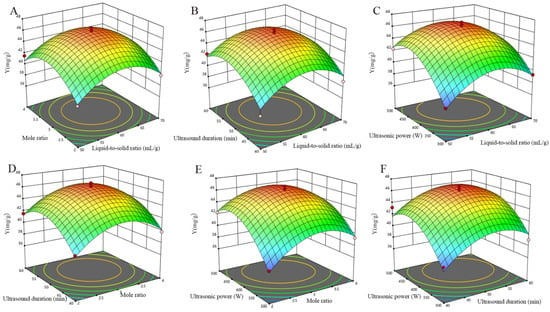
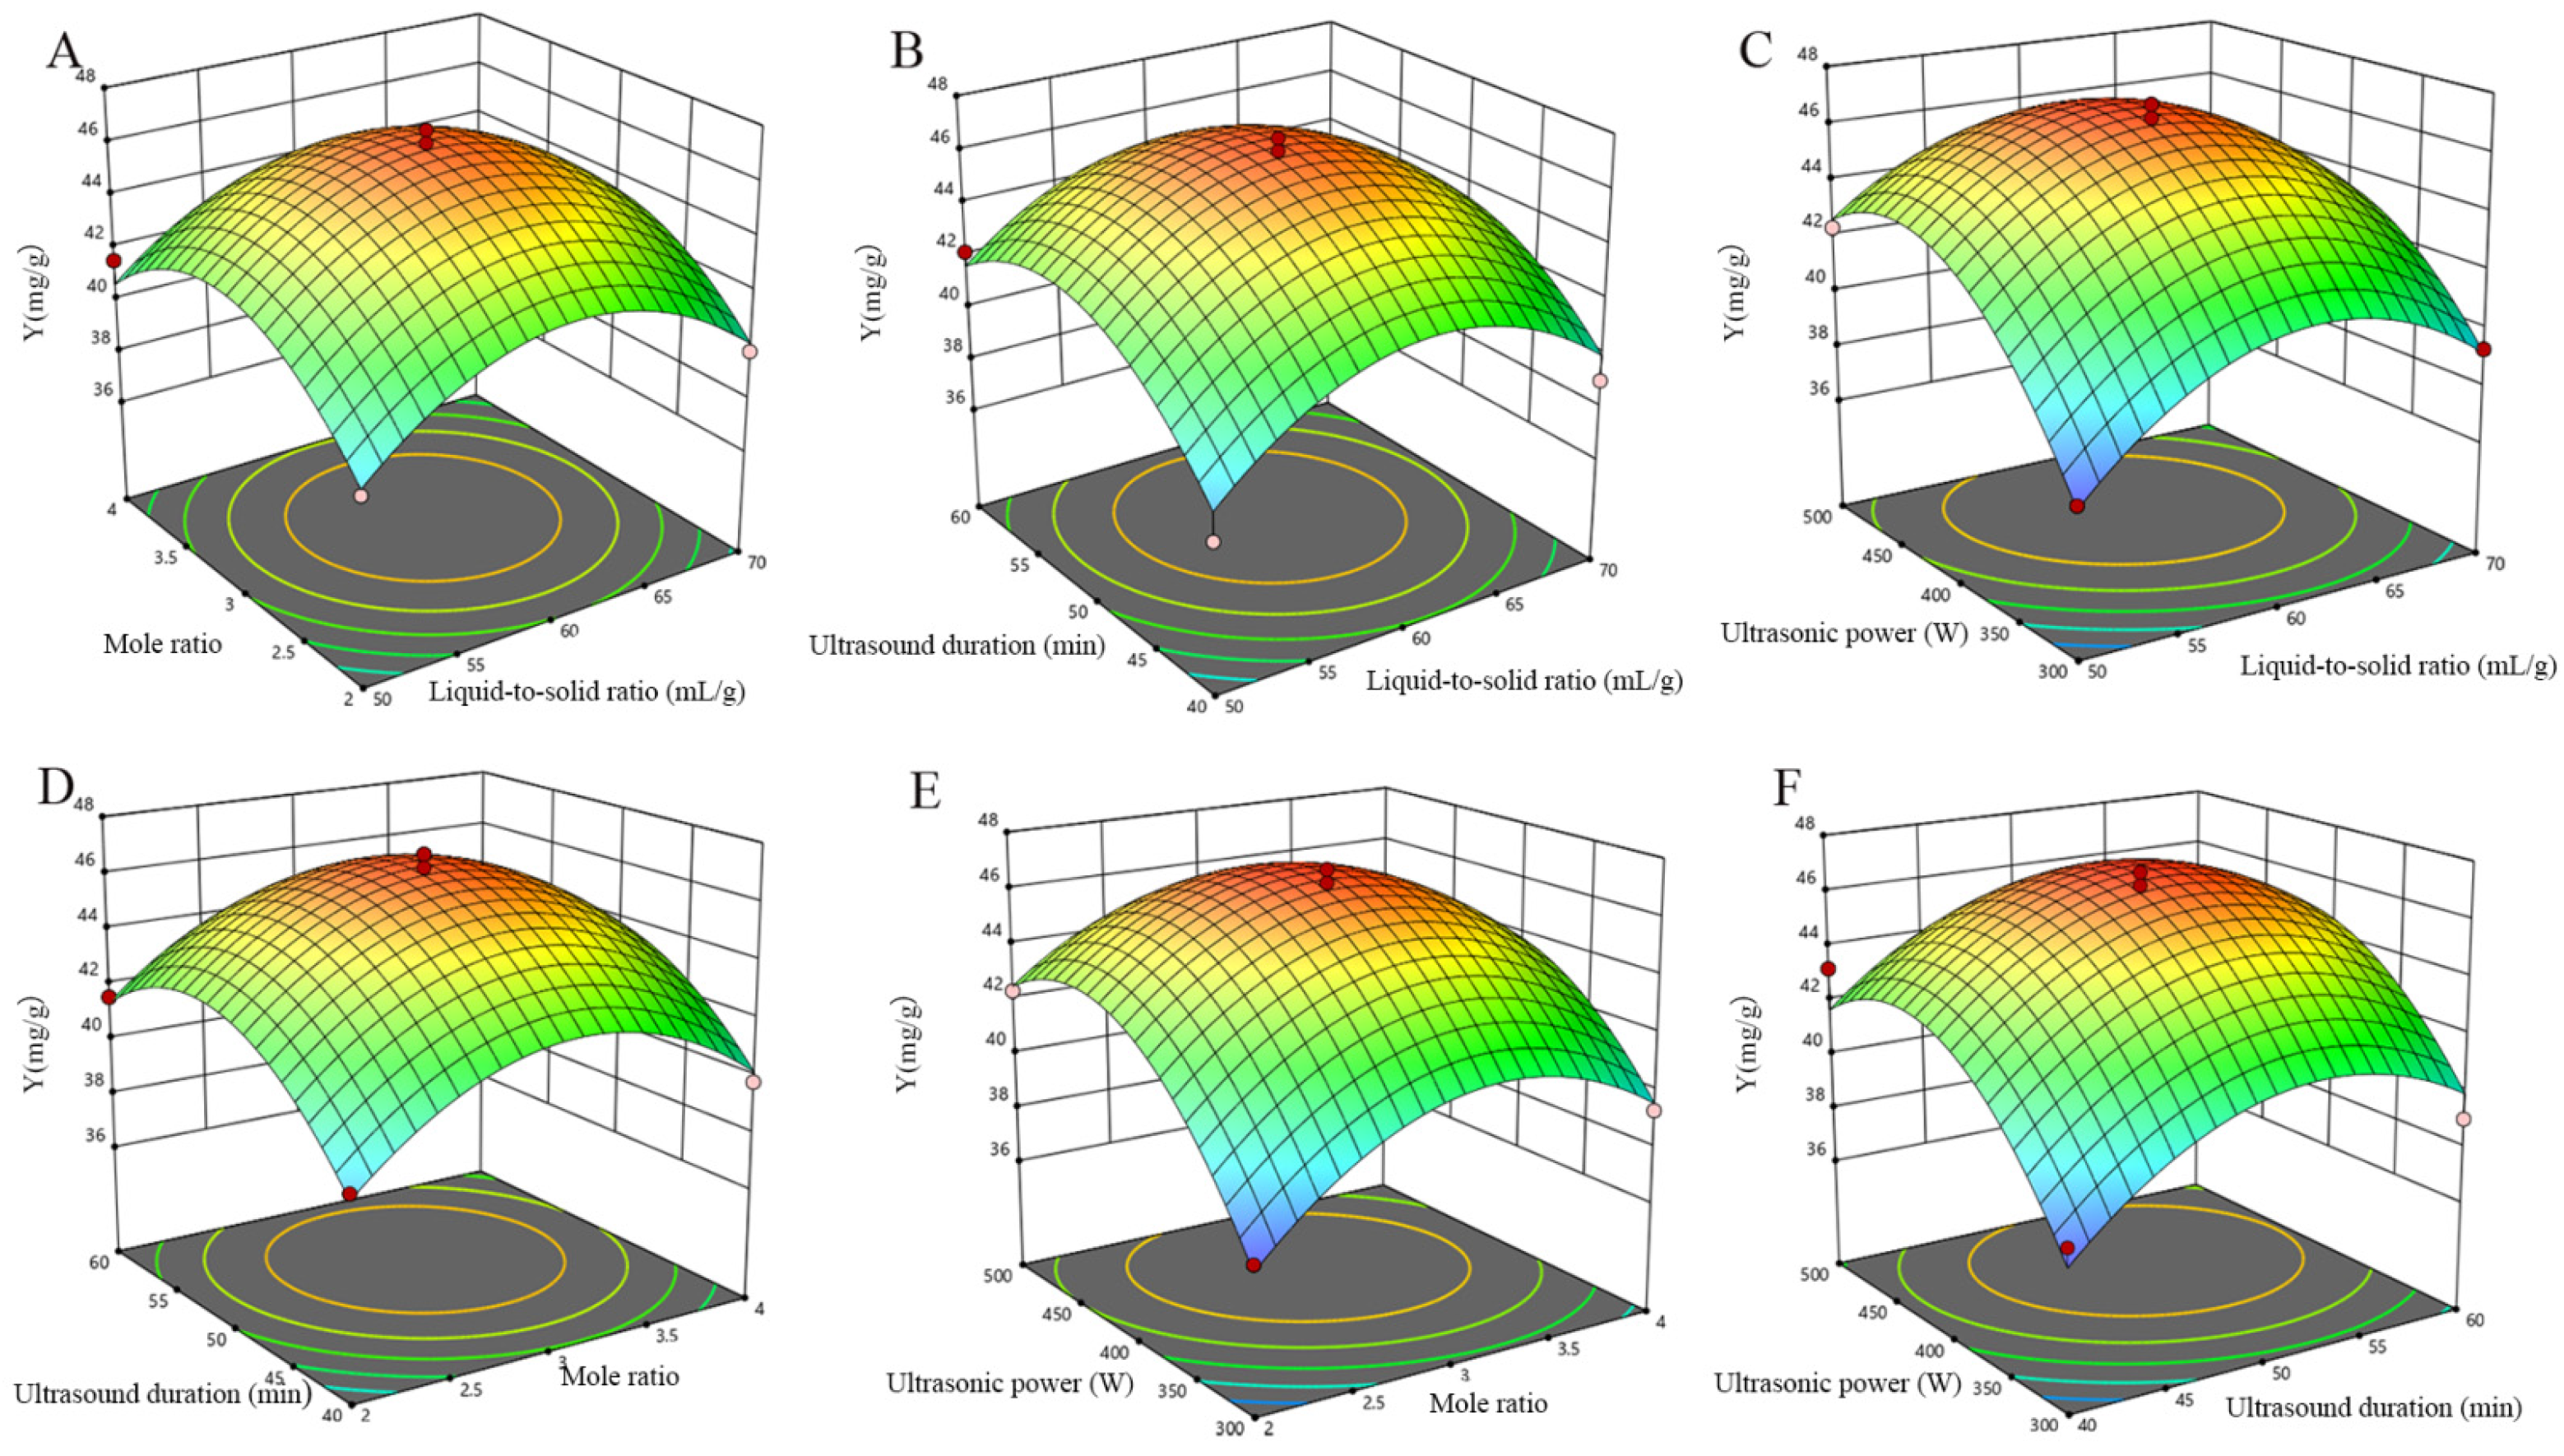
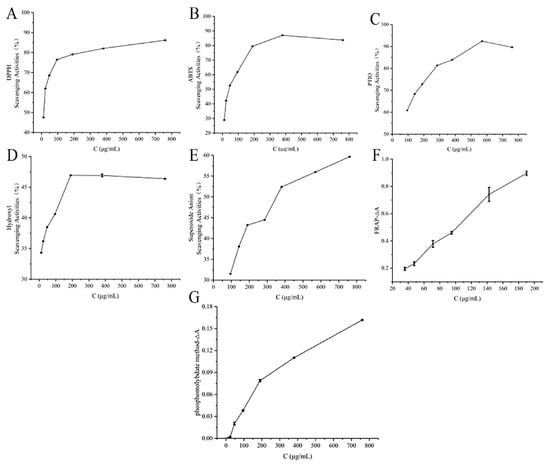
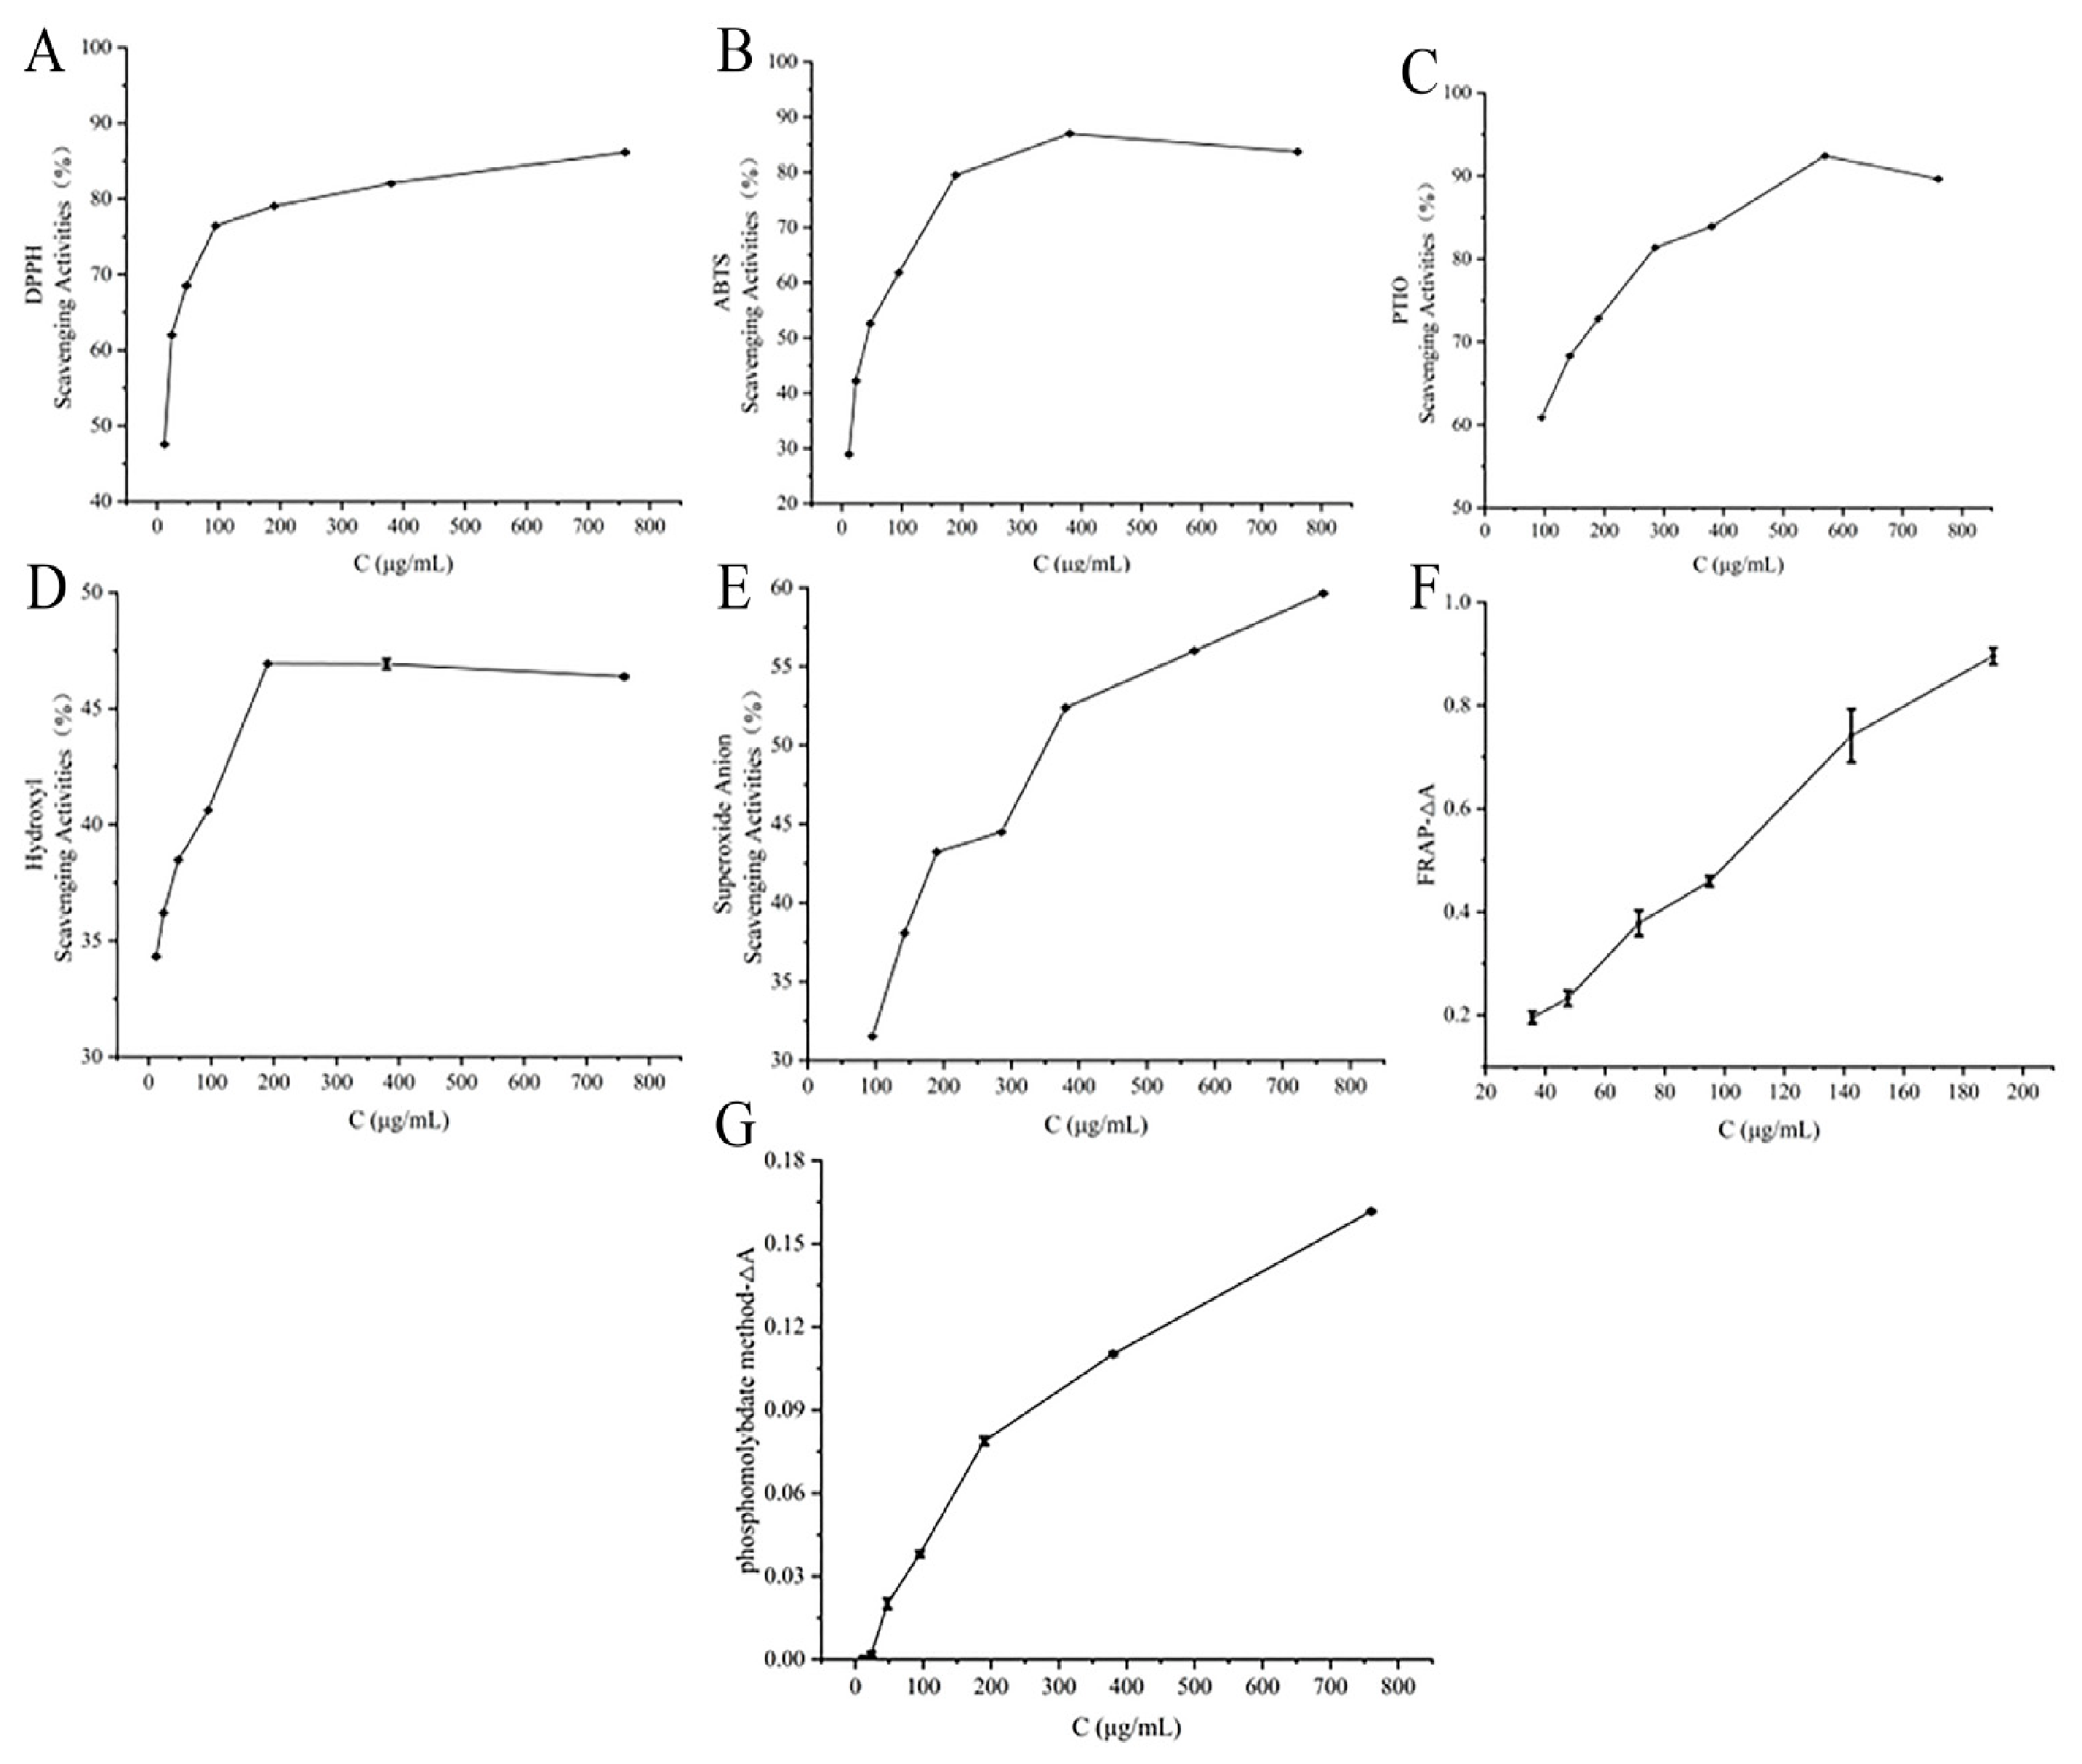
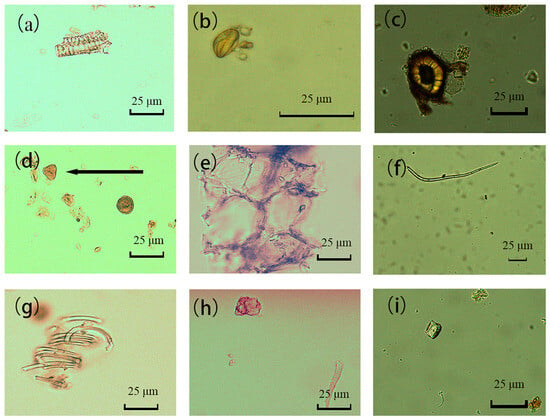
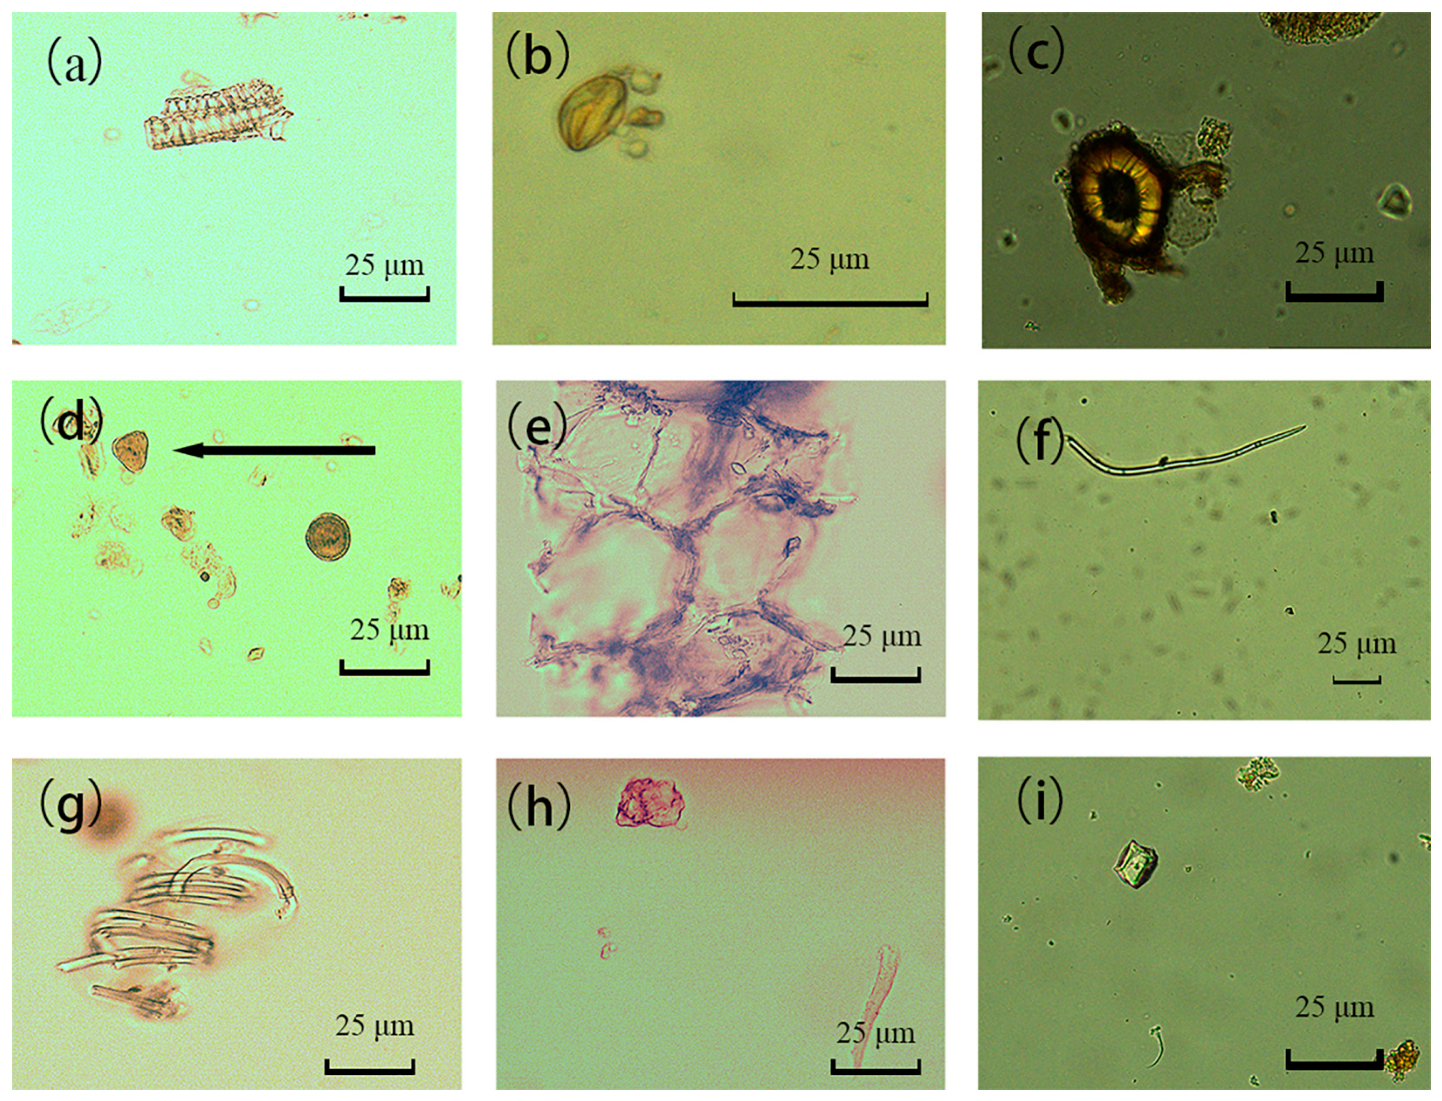
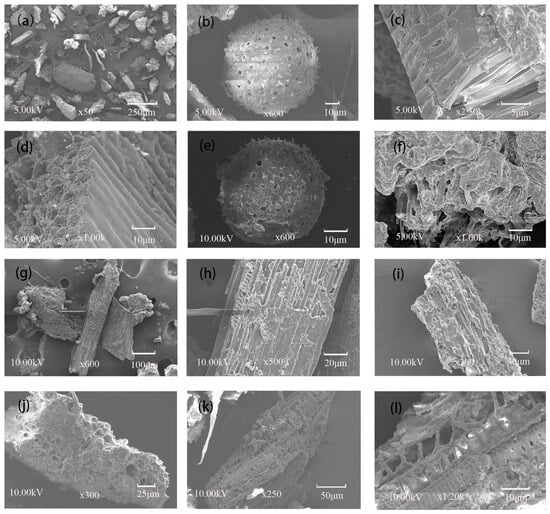
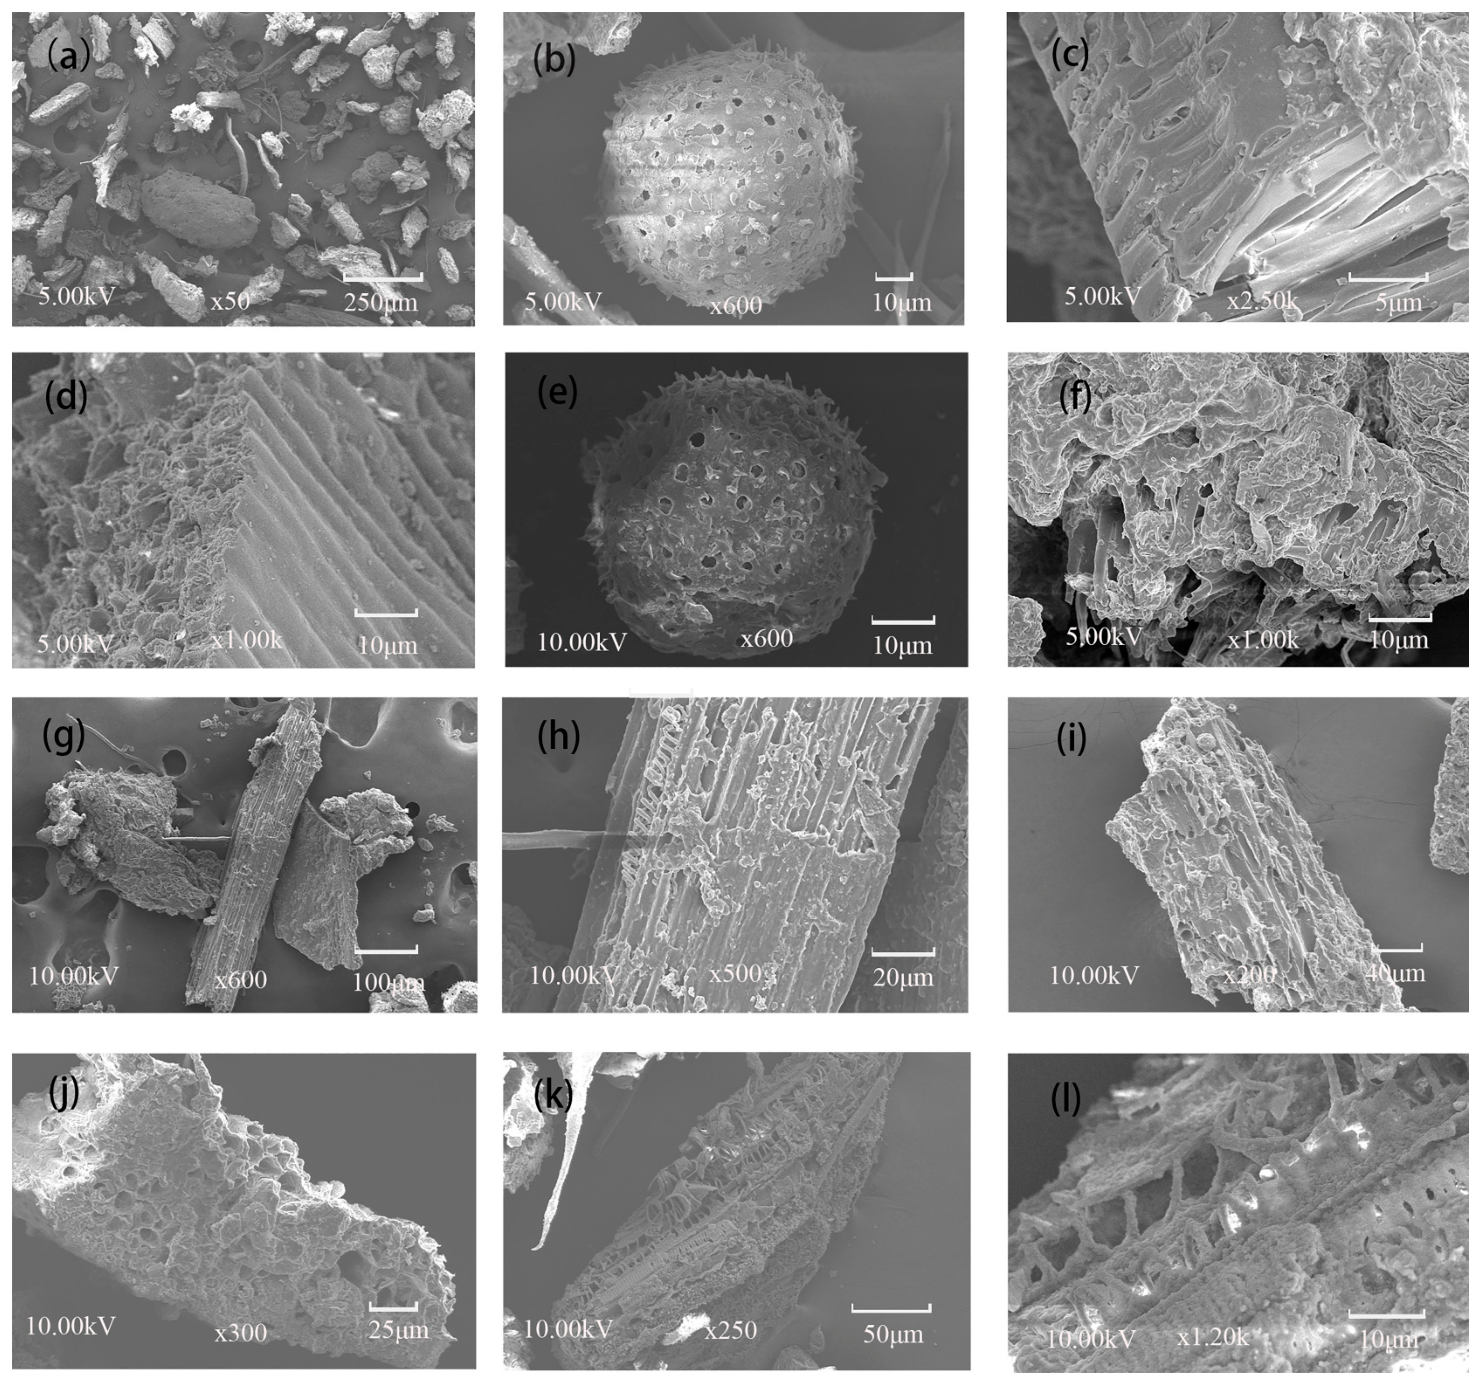

Disclaimer/Publisher’s Note: The statements, opinions and data contained in all publications are solely those of the individual author(s) and contributor(s) and not of MDPI and/or the editor(s). MDPI and/or the editor(s) disclaim responsibility for any injury to people or property resulting from any ideas, methods, instructions or products referred to in the content. |
© 2026 by the authors. Licensee MDPI, Basel, Switzerland. This article is an open access article distributed under the terms and conditions of the Creative Commons Attribution (CC BY) license.