


Abstract
Bearing fault diagnosis under varying operating conditions faces speed and data-source shifts that can make models unreliable outside their development regime. Record-level diagnosis therefore requires both fault classification and an automatic accept-or-defer decision. This study proposes Support-Bounded Confidence-First Selective Evidence Diagnosis (CSED), which separates evidence applicability from selective acceptance. CSED combines a frequency-domain logistic regression anchor with an acceleration-only WaveCNN expert. A prespecified support gate and calibration criterion admit waveform evidence; otherwise, the frequency anchor is retained. Records are ranked by a fixed confidence-risk score and accepted at prespecified coverage levels without a learned router or evaluation-label tuning. On the primary HUST (Huazhong University of Science and Technology) held-speed profile, five predeclared seed pairs yielded 270 pooled descriptive model-record predictions from 54 held record identifiers. Full-coverage Macro-F1/error was 0.8701/0.1333; at the prespecified 80% target, accepted Macro-F1/error was 0.9406/0.0602 and deferred error was 0.4259. Removing the support boundary increased observed accepted error, but the paired record-identifier-cluster bootstrap interval included zero, so this result is directional rather than statistically established. Additional variable-speed, cross-source, and frequency-anchor tests assess behavior beyond the primary profile. The results support the selective-diagnosis policy only under the evaluated record-wise protocol, not cross-source waveform transfer or bearing-wise generalization.
1. Introduction
Online condition monitoring is an important component of reliability-oriented maintenance in industrial processes involving rotating machinery. Rolling bearings are among the components most frequently monitored because localized defects can produce characteristic changes in vibration signals and, if not identified appropriately, may affect equipment availability and maintenance decisions. Consequently, extensive research has been devoted to data-driven bearing fault diagnosis. This topic forms part of the broader literature on data-driven process monitoring and fault diagnosis in industrial systems [1]. Most existing approaches formulate diagnosis as a closed-set classification problem, in which every input record or signal segment is assigned to one of a predefined set of health states. Although this formulation is effective for algorithm development and benchmark comparison, it represents only part of the decision problem encountered in practical condition monitoring. A diagnostic system must determine not only the most probable fault class but also whether the available evidence is sufficiently reliable to support an automatic decision.
The reliability of such decisions also depends strongly on how bearing-diagnosis models are evaluated. Many public datasets contain a limited number of complete vibration records from which numerous overlapping or closely related signal windows can be generated. If windows originating from the same or related records are distributed across training and evaluation partitions, information leakage can lead to overly optimistic estimates of diagnostic performance [2]. Record-wise evaluation, in which complete-record identifiers define the partitioning and reporting units, provides a more conservative assessment of model performance and is more closely aligned with record-level diagnostic use [3]. However, this protocol exposes another practical limitation: the number of statistically distinct records available for model development, calibration, and evaluation is often modest. Under such conditions, individual errors can noticeably affect class-balanced performance measures and uncertainty estimates. Moreover, variations in rotational speed, sensing configuration, channel availability, and data source can change the statistical characteristics of vibration signals without changing the underlying fault category. A model that performs well within its development regime may therefore become unreliable near the boundary of its empirically supported operating conditions or under source mismatch.
Considerable effort has been devoted to improving fault-diagnosis robustness under such distributional changes. Domain generalization has become an important research direction for rotating-machinery diagnosis [4]. Recent work in Processes has also examined domain-generalized bearing diagnosis under an unseen load condition [5]. The integration of prior knowledge has been identified as a means of improving model interpretability and generalizability [6], while the lab-to-field generalization gap has been examined for bearing vibration diagnosis [7] and domain-adversarial learning has been investigated for unlabeled bearing-fault transfer [8]. At the representation and transfer levels, recent studies have explored lightweight multiscale attention architectures [9], state-space models such as Mamba and their multisensor extensions [10,11], calibrated transformers under sharp speed variation [12], multi-source domain adaptation [13], and universal domain adaptation [14]. These developments have substantially expanded the ability of diagnostic models to learn transferable representations. Nevertheless, their operational objective is generally to improve the fault label assigned to an input. Improved transferability does not, by itself, determine whether the evidence available for a particular record is sufficiently supported for automatic diagnosis. More recent studies have further advanced this direction, including curriculum-learning-based domain generalization under category shift [15], meta-recognition-based universal domain generalization [16], continuously indexed domain generalization under continuously varying working conditions [17], incremental learning for bearing diagnosis under noisy conditions [18], domain generalization networks for imbalanced machinery fault diagnosis [19], and sparse LPV-ARMA modeling of non-stationary vibration under variable-speed conditions [20]; a recent survey systematically reviews these developments [21].
A complementary line of research focuses on diagnostic reliability through confidence calibration and uncertainty modeling. Calibration under distribution shift has been explicitly investigated for deep fault-diagnosis models [22], and calibrated confidence estimation has been incorporated into collaborative human–computer diagnosis [23]. Bayesian generalization under limited data [24], prototype calibration for few-shot continual diagnosis [25], and uncertainty-aware representations for rotating machinery [26] further illustrate the growing emphasis on prediction reliability. These studies are consistent with the broader finding that modern neural networks can produce poorly calibrated probabilities even when their classification accuracy is high [27]. Calibration can improve the interpretation of predictive confidence, but confidence and evidence support are not equivalent. A prediction may be highly confident even when the expert producing it is applied under operating conditions that are weakly represented by the development and calibration data. Confidence calibration alone therefore does not answer whether a particular source of diagnostic evidence should be used in the first place.
Selective prediction provides a natural framework for addressing the subsequent decision of whether a prediction should be accepted automatically. Selective classification formalizes the trade-off between predictive risk and coverage by allowing uncertain cases to be rejected or deferred [28]. SelectiveNet integrates a reject option into neural classification [29], while related studies have developed partial reject options, constrained reject-option formulations, and reject-refine strategies [30,31,32]. This principle is attractive for reliability-oriented condition monitoring because records associated with greater predictive risk can be directed to additional inspection or human review rather than being forced into automatic classification. However, conventional selective prediction primarily determines whether the final prediction should be accepted. Under operating-condition and source shifts, an earlier question must also be addressed: whether a particular diagnostic expert is applicable to the current operating profile. Treating these two questions as a single confidence decision can allow an unsupported expert to produce a high-confidence prediction that is subsequently accepted. The distinction becomes particularly relevant when only a limited number of complete records are available, because training an additional flexible sample-level router may introduce further estimation and overfitting risk.
This distinction motivates the present study. This study proposes Support-Bounded Confidence-First Selective Evidence Diagnosis (CSED) for record-level bearing fault assessment under speed and source shifts. The framework explicitly separates evidence applicability from selective acceptance. First, CSED organizes complementary evidence from a low-capacity frequency-domain multinomial logistic-regression anchor and an acceleration-only WaveCNN expert. Waveform evidence is allowed to contribute only when prespecified support and calibration conditions are satisfied; otherwise, the frequency-domain anchor is retained as a conservative fallback. Second, after the applicable evidence has been organized, the resulting class probabilities are ranked using a fixed confidence-based risk score defined as one minus the maximum class probability. Lower-risk records are accepted for automatic diagnosis at prespecified coverage levels, whereas higher-risk records are deferred for review. No learned sample-level router is introduced, and evaluation labels are not used to optimize the acceptance threshold or coverage level. The HUST Bearing dataset (Huazhong University of Science and Technology) is used as the primary source, the common-3 profile of the SQ Speed Variation Vibration Signal dataset (SQV) as a bounded cross-source safety profile, and the University of Ottawa time-varying-speed bearing dataset (VSBD) as a separate external stress test.
The study addresses the following three questions. RQ1: Under the HUST Bearing record-wise condition-holdout protocol, does the fixed CSED policy concentrate prediction errors in the deferred subset while retaining a lower-risk subset for automatic diagnosis? RQ2: Under the evaluated protocol, does restricting waveform participation show lower observed accepted error than unconditional waveform fusion? RQ3: What do the variable-speed, cross-source, calibration, and matched-backbone analyses reveal about the operating range, mechanism, and limitations of the proposed framework? These questions are intended to evaluate CSED as a bounded diagnostic decision framework rather than to establish universal superiority over full-coverage classifiers or unrestricted domain-adaptation methods.
The main contributions of this study are summarized as follows:
- (1)
- This study formulates record-level bearing fault assessment as a two-decision problem that separates the applicability of waveform evidence from the eligibility of the resulting prediction for automatic diagnosis. This formulation makes accept/defer decisions explicit under declared speed and source shifts.
- (2)
- This study proposes a support-bounded evidence-organization rule that admits waveform evidence only when prespecified support and calibration conditions are satisfied; otherwise, the frequency-domain anchor alone is retained as a conservative fallback. This rule provides an explicit evidence branch without a learned sample-level router.
- (3)
- This study establishes a fixed confidence-first accept/defer policy that ranks organized predictions by one minus the maximum class probability at prespecified coverage levels. Lower-risk records are accepted for automatic diagnosis, whereas higher-risk records are deferred for review, without threshold or coverage tuning using evaluation labels.
- (4)
- This study designs a record-wise validation protocol that retains complete-record identifiers as the evaluation units. It combines primary held-speed evaluation, the bounded HUST variable-speed and SQV cross-source safety profiles, a separate VSBD frequency-anchor stress test, record-identifier-cluster bootstrap analysis, support-boundary and risk-ranking analyses, calibration analysis, and matched waveform-backbone comparisons. This protocol separates the effects of evidence support from selective acceptance while keeping the scope of the resulting claims explicit.
The remainder of this paper is organized as follows. Section 2 presents the CSED methodology, including support-bounded evidence organization and confidence-based selective acceptance. Section 3 describes the datasets and record-wise experimental protocol. Section 4 reports the main results and ablation analyses. Section 5 discusses the underlying mechanism, implications for condition-monitoring decisions, and limitations of the study. Section 6 concludes the paper.
2. Methodology
CSED implements record-level selective diagnosis through two sequential decision layers with fixed inference-time rules. The evidence-applicability layer resolves, once for each declared combination of seed pair, fold, and profile, whether waveform evidence may enter the organized class-probability vector. The automation-eligibility layer then ranks each frozen model-record prediction instance for automatic diagnosis or deferral for review. The waveform expert is trained, whereas the evidence gate and confidence-ranking rule are fixed after the declared training and calibration procedures. The first layer is a fixed protocol gate, not a sample-level support estimator or learned router; the second is a fixed confidence-first ranking rule, not a threshold selected from evaluation labels.
This separation is central to CSED. A high-confidence output is not released automatically when its probability vector contains waveform evidence outside the declared support conditions. Conversely, an output from an allowed evidence branch is not automatically released when its confidence remains low. CSED therefore separates evidence organization, class prediction, and operational action; Figure 1 summarizes this workflow.
Figure 1.
Overview of the Support-Bounded Confidence-First Selective Evidence Diagnosis (CSED) pipeline. The support gate is resolved once for each declared combination of seed pair, fold, and profile; the organized evidence vector is fixed before risk ranking; optional pair- and fold-local calibrated-risk (CalRisk) re-ranking is limited to the matched HUST Bearing held-speed profile and does not change class predictions; and accept/defer uses the prespecified coverage grid (the figure shows the primary 80% target). Solid, dashed, and dotted arrows denote the main workflow, the optional ranking extension, and the frequency fallback, respectively. Frame colors distinguish functional roles: blue for the primary evidence path and acceptance, orange for the fallback branch and the coverage cut, gray for inputs, intermediate quantities, and deferral, and purple for the optional CalRisk extension.
2.1. Record-Wise Formulation and Selective Evaluation
Let xi denote a complete vibration record, yi ∈ its reference class, and ui its complete-record identifier. The identifier ui, rather than a signal window, is the atomic split unit. All windows, crops, frequency features, probabilities, and audit rows derived from one identifier remain in the same declared partition within a fold. For each HUST fixed-speed condition-holdout fold, the available records are separated into disjoint training, calibration, and evaluation partitions.
For ease of reference, Appendix A (Table A1 and Table A2) consolidates the notation used in Equations (1)–(12); the local definitions in Section 2.1, Section 2.2, Section 2.3 and Section 2.4 govern the use of each symbol in its corresponding equation.
A model-record prediction instance is one frozen output of one declared seed pair for one complete-record unique identifier (UID). Repeated instances for the same UID are retained for model-randomness diagnostics and are not counted as independent records.
= train ∪ calib ∪ eval, a ∩ b = ∅ (a ≠ b).
Equation (1) defines the record partitions used in each HUST fixed-speed condition-holdout fold, where denotes the set of complete-record identifiers available within one fold. Here, train, calib, and eval are disjoint sets of complete-record identifiers used for fitting, calibration, and held evaluation, respectively; a and b index different partitions; and ∅ denotes the empty set. All preprocessing and fitted parameters follow the same partition boundary. HUST variable-speed and SQV common-3 are evaluation-only safety profiles and are not repartitioned in the main protocol.
The primary HUST held-speed protocol has 72 training UIDs, 9 calibration UIDs, and 9 held UIDs per fold. Across six held-speed folds this yields 54 unique held UIDs. A UID is evaluated only in its own held-speed fold but may be used for training in another fold; the estimand is therefore internal condition-holdout cross-validation, not a globally untouched 54-record final test.
The frequency anchor F0 and the waveform expert W0 (both defined in Section 2.2) are fitted using train. In the primary CSED policy, calibration records are used to select the W0 checkpoint and resolve the fixed evidence branch. In the optional CalRisk extension, each seed pair and held-speed fold uses only its own nine calibration UIDs to select a temperature from the fixed grid. The corresponding held UIDs are excluded from that temperature selection. Evaluation labels are used only after evidence probabilities, predicted classes, branches, temperatures, and risk rankings have been frozen.
For each evaluation prediction instance, the closed-set class output is
In Equation (2), denotes the predicted class for evaluation prediction instance i, and pE,k(xi) denotes the organized probability assigned to class k in the closed-set label set . Ties are resolved by the deterministic ordering specified below.
At target coverage c, the accepted set Ac contains the lowest-risk prediction instances in a frozen, profile-specific pool, and the deferred set Dc contains the remainder. For a pool of N instances, the policy sets Nacc(c) = max{1, min{N,⌊cN⌋}} and Ndef(c) = N − Nacc(c). The policy uses the prespecified coverage grid c ∈ {1.00,0.95,0.90,0.80,0.70}; it does not tune a threshold or search coverage values. At the pair-level HUST held-speed analysis, N = 54, so the 80% target accepts ⌊0.80 × 54⌋ = 43 identifiers, or 79.63% actual coverage.
After prediction instances and their ranks have been frozen, Equations (3) and (4) define Riskacc(c) and Riskdef(c) as the error rates over the accepted and deferred sets at coverage c, respectively. These accepted and deferred error definitions follow the standard risk-coverage formulation of selective classification [28].
Equation (5) defines Δerr(c) as the descriptive difference between the full-coverage reference error and the accepted-set error:
Δerr(c) = Riskfull − Riskacc(c).
Here, Riskfull = Riskacc(1.00) denotes the full-coverage reference error. Full coverage (coverage c = 1.00) denotes the setting in which every record’s E0-based prediction is accepted and no record is deferred; the full-coverage output therefore coincides with the closed-set E0 prediction for all evaluated records.
In Equations (3)–(5), Riskacc(c) and Riskdef(c) are the accepted and deferred error rates at coverage c, respectively, and Δerr(c) is the descriptive difference from the full-coverage reference error. I[·] is the error indicator, and Nacc(c) and Ndef(c) are the accepted and deferred counts. Riskdef(c) is reported only when the deferred set is nonempty. Accepted-set Macro-F1 is reported together with accepted and deferred error because Macro-F1 alone does not establish whether the deferred review queue is enriched for difficult cases.
For the primary record-wise estimand, each seed pair is evaluated separately on a pool of 54 unique held record identifiers. The accepted and deferred sets are formed within that 54-UID pool. At the 80% target coverage, the fixed integer rule accepts ⌊0.80 × 54⌋ = 43 identifiers, corresponding to an actual coverage of 43/54 = 79.63%. The aggregate across the five predeclared seed pairs contains 54 × 5 = 270 model-record prediction instances and is reported only as a descriptive model-randomness summary, not as 270 independent test observations. UID-cluster bootstrap resampling retains all five pair-specific predictions associated with each sampled UID. The predeclared pairs are pair05 = (2186, 2196), pair06 = (2206, 2216), pair07 = (2226, 2236), pair08 = (2246, 2256), and pair09 = (2266, 2276); no pair is selected after inspecting evaluation performance. The corresponding seed-pair and protocol audit details are provided in Appendix B (Table A3, Table A4, Table A5 and Table A6).
More generally, for a declared evaluation profile p, Ninst(p) denotes the pooled count of model-record prediction instances: Ninst(p) = NUID(p) × Ncfg(p) × Nseed. Here, NUID(p) is the number of unique complete-record identifiers, Ncfg(p) is the number of eligible model configurations within each fold contributing one prediction per identifier, and Nseed is the number of predeclared seed pairs. Thus, the corresponding counts are 54 × 1 × 5 = 270 for HUST held-speed, 9 × 6 × 5 = 270 for HUST variable-speed, and 51 × 6 × 5 = 1530 for SQV common-3. These are repeated model-record measurements, not independent records.
2.2. Support-Bounded Evidence Organization
F0 is a deliberately low-capacity frequency-domain anchor based on multinomial logistic regression. It supplies the record-level probability vector pF(x) used by the evidence rule below.
For the HUST source, each complete record contains 262,144 samples at 25.6 kHz (10.24 s). Within each fixed-speed record, eight evenly spaced blocks of 16 cycles are processed. For each block, the raw acceleration and its Hilbert-envelope signal are mean-centered separately and multiplied by a Hann window. A 4096-point real fast Fourier transform (FFT) (6.25 Hz native bin spacing) is applied to each view; spectral power is transformed as log(1 + |FFT|2), and each view is interpolated to 128 bins over 0–8 kHz. Median aggregation across blocks followed by valid-channel averaging yields a 256-dimensional record vector (128 raw-frequency plus 128 envelope-frequency bins). StandardScaler and the classifier are fitted within the training partition only. The fixed classifier is a multinomial logistic regression with L2 regularization (C = 1.0), balanced class weights, and an intercept. It uses the lbfgs solver with max_iter = 5000, tol = 1 × 10⁻⁶, and random_state = 2026; these settings were fixed a priori, and no frequency-feature or classifier hyperparameter search was performed.
The spectral preprocessing described here belongs to F0. W0 receives raw acceleration-only waveform crops rather than these spectral features. During W0 training, each crop has 16,384 samples and starts at a random valid offset; during inference, eight deterministic, evenly spaced crop starts are used, and crop logits are averaged to obtain one record-level output per seed. No sliding-window prediction is treated as an independent evaluation sample.
W0 is a compact acceleration-only AxisSafeWaveCNN expert. It supplies the waveform probability vector pW(x) when the fixed support gate admits waveform evidence.
The W0 implementation uses a 3-to-16 Conv1D stem (kernel 15, stride 4, BatchNorm, and ReLU), followed by residual stages with 16, 32, and 64 channels (kernels 9, 9, and 7); the first block of stages 2 and 3 has stride 4. Each residual block uses BatchNorm. The head applies temporal mean pooling, a 64-unit projection with ReLU, dropout 0.15, and LayerNorm before the five-class linear layer, for 150,837 trainable parameters. The training contract fixes AdamW (learning rate 1 × 10⁻³; weight decay 1 × 10⁻⁴), label-smoothed cross-entropy (0.05), batch size 16, 144 class-balanced crops per epoch, additive noise with a standard deviation of 0.01, gain in [0.90, 1.10], gradient clipping at 5, maximum 80 epochs, and patience 18; no learning-rate scheduler is used. Checkpoints are selected by calibration Macro-F1 only. At inference, logits from eight deterministic 16,384-sample crops are averaged per seed, converted to probabilities, and then averaged across the two members of each predeclared seed pair. Mixed-precision autocast is enabled for the recorded CUDA runs. The recorded runs used PyTorch 1.13.1+cu117 on an NVIDIA Tesla V100-PCIE-32GB GPU. The extended comparator entries, complete W0 implementation contract, and policy-value provenance are provided in Appendix C (Table A7, Table A8 and Table A9).
Let s, f, and p denote a declared seed pair, held-speed fold, and evaluation profile, respectively. Let MF(s,f,p) and MW(s,f,p) be the calibration Macro-F1 values of F0 and the paired W0 ensemble on the same calibration records. The binary gate Gsfp equals one only when the profile is eligible for waveform participation under the frozen protocol, the calibration partition contains at least 9 complete records and all 5 declared classes, and MW(s,f,p) − MF(s,f,p) ≥ 0.02; otherwise, Gsfp = 0. The gate is resolved once for the combination of seed pair, fold, and profile and is applied unchanged to every prediction instance in that group. It is not a per-record decision.
The minimum calibration size and class-count requirements prevent a branch decision from being resolved from an underspecified calibration partition. Because Gsfp is fixed for the complete combination of seed pair, fold, and profile, every record in that group follows the same evidence branch.
The organized record-level evidence probability vector pE(x), referred to below as E0, is the final record-level class-probability vector on which prediction and confidence-risk ranking are based after the support gate has decided whether waveform evidence may be blended with the frequency anchor. It is defined as
The blend weights and the calibration margin are frozen policy values. Hard profile locks override the calibration comparison: the HUST held-speed 80 Hz evaluation profile and SQV common-3 use the F0 branch, so Gsfp = 0 for those profiles. The asymmetric treatment of the two edge-speed conditions is intentional and is defined by the available calibration support rather than by the numerical speed boundary alone. Although both 20 and 80 Hz lie at the edges of the fixed-speed range, the 20 Hz evaluation fold is paired with an immediately adjacent 25 Hz calibration condition, providing local same-source evidence with which to assess whether W0 contributes beyond F0. In contrast, the 80 Hz evaluation fold is paired with 70 Hz under the fixed calibration mapping and lies at the upper endpoint of the available fixed-speed operating range, with no observations beyond 80 Hz available to establish outward waveform support. The 80 Hz condition is therefore treated as a conservative one-sided waveform-support boundary, and F0 is retained there irrespective of the calibration performance comparison. This rule is a protocol-level applicability constraint rather than a claim that 80 Hz is intrinsically more difficult than 20 Hz. Evaluation labels do not determine the gate or the evidence branch. Any result-open margin or blend scans are retained only as descriptive supplementary sensitivity analyses and are not used to reselect the primary policy. For the SQV common-3 profile, no SQV record or SQV label is used for F0 or W0 fitting, checkpoint selection, branch selection, temperature selection, or selection of coverage levels; SQV labels are accessed only after predictions are frozen to report evaluation metrics. The HUST-trained F0 probabilities are restricted to the shared Health/Inner/Outer class space and renormalized over those three retained classes. Thus, SQV common-3 is a frequency-fallback cross-source safety profile rather than a waveform-transfer evaluation.
2.3. Confidence-First Accept/Defer Policy
Equation (7) defines rconf(x), the primary confidence-risk score, as the complement of the largest organized class probability:
Lower values indicate higher model confidence. This quantity is used as a confidence-based risk-ordering proxy, not as a calibrated probability of error. Ranking is performed within the declared evaluation profile: pair-level curves use a separate 54-UID pool for each seed pair, whereas the pooled audit ranks the five pair-specific instances together. At each prespecified coverage, the lowest-risk instances form Ac and the remainder form Dc. Ties are resolved deterministically by risk, profile, seed pair, fold, record identifier, and within-profile instance order. No sample-level router, trainable reject head, threshold search, or coverage search is used.
The class output remains the closed-set prediction in Equation (2); the accept/defer action determines whether that frozen prediction is released for automatic diagnosis or routed to review. The ranking rule is label-blind with respect to evaluation records: evaluation labels are read only after predictions, branches, and ranks are frozen to compute the reported metrics.
2.4. Optional Ranking Extensions and Diagnostic Scores
CSED-CalRisk is a separate calibration-only ranking extension, not the primary CSED policy and not a new classifier. It retains the same F0 and W0 models, evidence branch, E0 probabilities, predicted classes, and fixed coverage grid. For each declared seed pair and held-speed fold, one temperature T is selected from the prespecified grid {0.50, 0.75, 1.00, 1.25, 1.50, 2.00, 3.00} by minimizing negative log-likelihood using only the nine calibration UIDs assigned to that pair and fold. Those UIDs are disjoint from the corresponding held UIDs. For the matched HUST Bearing held-speed test profile only, Equation (8) defines qE,k(x;T) as the temperature-transformed organized probability for class k, and Equation (9) defines rCalRisk(x) as the resulting optional calibration-only ranking score: The temperature transformation in Equation (8) follows the standard temperature-scaling formulation of Guo et al. [27].
The vector in Equation (8) is used only to rank frozen prediction instances. It does not overwrite pE(x), alter the evidence branch, or change . HUST variable-speed and SQV common-3 retain the raw confidence score because a calibration transform fitted on HUST fixed-speed calibration records is not assumed to transfer to those safety profiles.
For diagnostic mechanism analysis, Equations (10) and (11) define Rconf(x) and RJSD(x) as the rank-normalized confidence and disagreement components, respectively, and Equation (12) defines rhybrid(x) as their fixed diagnostic combination:
Rconf(x) = rankp(rconf(x)),
rhybrid(x) = 0.60Rconf(x) + 0.40RJSD(x).
Here, JS is the Jensen–Shannon divergence and rankp(⋅) denotes tie-aware rank normalization within the declared evaluation profile. The hybrid score is retained solely as a diagnostic ablation. It does not alter pE, predicted classes, evidence applicability, or the prespecified primary confidence-first policy. Equations (6) and (10)–(12) are defined specifically for the CSED framework in this study.
3. Datasets and Experimental Protocol
3.1. Dataset Roles, Label Mapping and Fold Construction
CSED was evaluated with a record-wise protocol that separates error concentration, evidence applicability, and behavior under the specified profile changes. Complete-record identifiers are retained throughout partitioning, model fitting, calibration, inference, and auditing.
The HUST Bearing dataset is used as the primary development and condition-holdout source and is cited according to the source repository’s requested benchmark reference [33]. The source release contains 99 complete records: 90 fixed-speed records and nine records from the 0–40–0 Hz variable-speed condition. The fixed-speed records contain nine records at each of the ten declared speeds: 20, 25, 30, 35, 40, 60, 65, 70, 75, and 80 Hz. The five-class HUST Bearing label space is Ball, Compound, Health, Inner, and Outer. The HUST data were acquired on a Spectra Quest Mechanical Fault Simulator consisting of a speed-control unit, a drive motor, a shaft, acceleration sensors, the test bearing, and a data-acquisition board [33]; the SQV data were acquired on a Spectra Quest fault-simulation bench with an NSK6203 bearing [34,35]; and the VSBD data were acquired on the motor-driven bearing test rig described in [36]. The considered fault types are localized mechanical bearing defects (Ball, Compound, Inner, and Outer faults, plus the Health state for HUST; Health, Inner, and Outer for SQV and VSBD); electrically induced bearing faults are not represented in these datasets. Representative time-domain waveforms and FFT amplitude spectra of the 40 Hz records are shown in Figure 2.
Figure 2.
Representative HUST Bearing records at the 40 Hz operating speed (25.6 kHz sampling, Acc_x channel). (a) Time-domain acceleration waveforms (0.10 s windows). (b) FFT amplitude spectra computed from the complete 10.24 s records after mean-centering and Hann windowing; the dominant spectral peaks are annotated. Rows correspond to the Health, Inner-race fault, Outer-race fault, and Ball fault classes. The fault records show class-dependent transient or burst-like structures and stronger, more localized high-frequency spectral components than the healthy record.
The primary HUST protocol uses six fixed-speed condition-holdout folds with held speeds of 20, 30, 40, 60, 70, and 80 Hz. The calibration speed is fixed for each held-speed fold as follows: 20 → 25 Hz, 30 → 35 Hz, 40 → 60 Hz, 60 → 65 Hz, 70 → 75 Hz, and 80 → 70 Hz. In every fold, nine records at the held speed form the evaluation partition, nine records at the corresponding calibration speed form the calibration partition, and the remaining 72 fixed-speed records form the training partition.
Thus, the per-fold structure is 72 training, nine calibration, and nine evaluation complete-record UIDs. Across the six folds, 54 distinct fold-specific held UIDs are evaluated. A UID is evaluated only in its own held-speed fold, but it may occur in the training or calibration partition of another fold. The design is therefore internal condition-holdout cross-validation, not a globally untouched 54-record final test set. The numbers 72, 9, and 9 describe each fold; they must not be interpreted as a single global split of 36 training-plus-calibration records plus 54 independent test records.
The SQV dataset [34,35] is used only as a common-label cross-source safety profile. It is an openly released variable-speed bearing dataset maintained in the public repository [35]; its acquisition protocol and experimental description are also reported by Chi et al. [34]. The repository describes a Spectra Quest fault-simulation bench at Xi’an Jiaotong University, with 25.6 kHz vibration recordings from an NSK6203 bearing under a continuous speed cycle from 0 to 3000 rpm and back to 0. The retained common-3 subset contains 51 complete records from the 52 SQV records represented in the frozen HUST–SQV package. One short inner-race record, containing 37,888 samples, is excluded under the predeclared paired-validity and signal-quality contract used to construct the paired feature-and-evidence package. It is not imputed or replaced, and the exclusion is not based on evaluation performance.
The HUST-to-SQV mapping retains only the shared Health–NC, Inner–IF, and Outer–OF semantic families. HUST Ball and Compound are excluded because no semantically matched SQV classes are declared for them. Severity levels are not treated as equivalent across the two datasets. For the SQV common-3 evaluation, the HUST-trained frequency-anchor probabilities are restricted to the three retained class IDs and renormalized within that common label space. The mapping is fixed before evaluation and is not used to select the fusion weights, support margin, risk score, coverage, or waveform backbone.
No SQV record is used to fit the HUST F0 or W0 models, to calibrate the primary branch, or to select a primary policy. The main SQV evidence vector is fixed to the HUST-trained F0 frequency fallback. Waveform-side outputs retained for explicitly labeled diagnostic comparisons, where applicable, do not contribute to the primary SQV evidence vector. Reference [34] provides the peer-reviewed acquisition description and article DOI (10.3390/machines10100948), whereas [35] is the public repository through which the open SQV files were obtained. The DOI in [34] identifies the article rather than a standalone dataset deposit. The repository has no separate dataset DOI or explicit repository-level data license statement; this paper therefore cites the repository for access and does not repackage or redistribute the raw SQV files.
The University of Ottawa time-varying-speed bearing dataset (VSBD) [36] is used as a separate third-source frequency-anchor stress test. It contains 36 complete-record identifiers, each stored in a MAT file, with the common label space healthy, inner-race, and outer-race. The evaluation uses four profile-holdout folds and three replicate-holdout folds, with each complete MAT file kept within one partition. Channel_1 is used as the vibration signal. Channel_2 is withheld because its pulse-per-revolution interpretation has not been verified; no VSBD order-domain claim is made. VSBD is evaluated with its own grouped frequency-domain logistic-regression protocol and is not merged into HUST–SQV CSED training or into the primary CSED headline estimate. Other public datasets with different physical mechanisms or incompatible label semantics are likewise not merged into the present bearing label space. The acquisition configurations of the three data sources are shown in Appendix D (Figure A1). Table 1 summarizes the dataset roles, label mappings, fitting boundaries, and evaluation units.
Table 1.
Dataset roles, label mapping, fitting boundaries, and evaluation units.
The complete-record UID is the unit of partitioning and the basis of record-clustered uncertainty analysis. A model-record prediction instance is one prediction for one UID produced by one seed-pair and fold configuration. Consequently, the 270 HUST held-speed instances represent 54 fold-specific UIDs measured across five primary seed pairs; they do not represent 270 independent records, bearings, or machines. The corresponding 270 HUST variable-speed instances and 1530 SQV instances are also repeated model-record measurements rather than independent observations. In Table 1, evaluation labels are used only after policy freeze to compute post-freeze metrics.
3.2. Information Flow, Leakage Controls and Execution Scope
For each HUST fold, the information flow is fixed. Complete records are first partitioned; all model fitting uses training records only; checkpoint selection and support decisions use calibration records only. The resulting evidence, confidence ranking, and coverage are then frozen, and the accepted and deferred predictions are evaluated under this frozen protocol.
The split is performed before any learned model or fitted preprocessing parameter is estimated. Deterministic signal transforms do not use labels or fitted parameters. All learned preprocessing, including feature scaling, is fitted using training UIDs only. F0 parameters are fitted on the training partition. W0 parameters are also fitted on the training partition, while W0 checkpoint selection and the support comparison use the calibration partition. No derived window, feature row, transformed view, probability, or audit row from one complete UID is allowed to cross a partition boundary.
For the HUST–SQV frequency representation, the verified sampling frequency is 25.6 kHz. Each complete record is represented by eight evenly distributed blocks. Within each block, the raw acceleration signal is mean-centered; its Hilbert-envelope signal is computed and mean-centered separately. Both views are multiplied by a Hann window and transformed with a 4096-point real FFT; spectral power is transformed as log(1 + |FFT|2). The raw and envelope spectra are interpolated to 128 bins over 0–8 kHz, producing 256 features after concatenation. The eight block representations are aggregated by a block-wise median, followed by averaging over valid acceleration channels. The resulting record vector is scaled with a StandardScaler fitted on training records only.
The frequency anchor F0 is a fixed multinomial logistic regression with L2 regularization (C = 1.0) and balanced class weights; all solver settings were fixed a priori, and no classifier hyperparameter, feature-selection parameter, threshold, or coverage value is searched.
For HUST, W0 receives only the three Acc_x, Acc_y, and Acc_z acceleration channels. The Time and Speed_redundant columns are excluded from the waveform input. W0 is an AxisSafeWaveCNN. Record-level inference uses eight deterministic crops of 16,384 samples, and the two W0 models in each primary seed pair are combined by averaging their probability vectors. The training contract uses AdamW with learning rate 1 × 10⁻³, weight decay 1 × 10⁻⁴, batch size 16, a maximum of 80 epochs, patience 18, and 144 class-balanced record crops per epoch. Label smoothing is 0.05, additive-noise standard deviation is 0.01, gain augmentation is sampled from [0.90, 1.10], and gradient clipping is fixed at 5. Checkpoint selection uses calibration Macro-F1 only. W0 is trained in every declared HUST fold regardless of whether the subsequent support gate permits its probabilities to contribute to E0; the gate controls evidence participation, not whether the waveform model is trained.
Evaluation labels do not alter model fitting, preprocessing parameters, checkpoint selection, evidence-branch definitions, risk-score definitions, seed choices, thresholds, or coverage levels. After all model outputs and policy settings have been frozen, evaluation labels are used to compute the reported classification and selective metrics and to evaluate declared reporting or promotion criteria. No candidate is retuned or selectively omitted on the basis of a post-freeze metric.
The primary HUST analysis uses five prespecified seed pairs. Pair-specific results are retained rather than selecting the best-performing pair. The primary training package contains six fold-local F0 fits, 60 W0 fits, and 30 fold-pair E0 outputs. Model fitting was performed within the declared single-device training boundary, and the independent result audit was performed on CPU. No sample-level router, trainable router, parameter search, threshold search, or coverage search is used.
The optional CSED-CalRisk analysis is a ranking extension rather than a new classifier. For each seed pair and held-speed fold, it selects a temperature from the fixed grid {0.50, 0.75, 1.00, 1.25, 1.50, 2.00, 3.00} using only that pair and fold’s nine calibration-UID predictions. The selected temperature is applied only to that pair and fold’s matched HUST Bearing held-speed risk ranking. HUST Bearing variable-speed and SQV retain the raw confidence risk. CalRisk does not change the stored E0 probability vector, the predicted class, the support branch, or the coverage grid.
3.3. Protocol Instantiation of the Support Rule
The support rule instantiates the first CSED decision layer. For each declared combination of seed pair, fold, and profile, waveform evidence is admissible only when all of the following conditions hold:
- (1)
- the group is eligible under the declared HUST waveform-support protocol;
- (2)
- the calibration partition contains at least nine complete records and all five HUST classes are represented;
- (3)
- the calibration Macro-F1 advantage of the W0 seed-pair ensemble over F0 satisfies MW(s,f,p) − MF(s,f,p) ≥ 0.02;
- (4)
- no hard F0 lock applies.
When these conditions are satisfied, the E0 evidence vector uses the fixed arithmetic mixture 0.25pF + 0.75pW; otherwise, E0 uses pF alone. The HUST 80 Hz held-speed profile is hard-locked to F0. SQV common-3 is also hard-locked to the HUST-trained F0 fallback in the main protocol.
For HUST, this asymmetric edge treatment follows the fold-specific calibration geometry specified before evaluation. The 20 Hz held-speed fold is paired with the adjacent 25 Hz calibration condition, giving a 5 Hz same-source calibration step; W0 can therefore participate at 20 Hz only if it passes the same calibration-support criterion applied to the other eligible folds. By contrast, the 80 Hz fold is paired with 70 Hz under the fixed mapping, a 10 Hz separation, and 80 Hz is the maximum fixed-speed condition available in the dataset. Because no higher-speed condition is available to provide outward support, the protocol does not use calibration performance alone to authorize waveform extrapolation at 80 Hz. The 80 Hz profile is consequently assigned to the conservative F0 fallback before selective confidence ranking. Importantly, this asymmetric rule concerns the evidential support available for W0 and does not impose any class decision or acceptance decision on individual records.
The branch decision is resolved once for each declared combination of seed pair, fold, and profile and then applied unchanged to every record in that group. It is a fixed group-level protocol rule, not a per-record learned selector, density estimator, or continuous speed-distance estimator. The mixture weights 0.25 and 0.75 and the calibration margin 0.02 were empirical policy choices carried forward from the preceding read-only development screen. The blend retains a frequency anchor while assigning the dominant contribution to an admitted waveform expert, whereas the positive margin requires a calibration Macro-F1 advantage before waveform evidence is admitted. Both values were frozen before the fresh pair05–pair09 confirmation. Table A9 documents their provenance and result-open descriptive sensitivity analyses, which were not used for parameter selection.
A separate SQV WaveCNN expert confirmation was completed outside the primary protocol. That independent experiment was closed as frequency-fallback only and was not promoted into the main CSED route. Its outcome does not change the main SQV fallback rule, the HUST-trained F0 evidence vector, or any primary coverage or risk definition.
3.4. Comparators and Controlled Backbone Evaluation
The comparator design separates mechanism-oriented comparisons from literature positioning. Numerical comparisons are used for locally implemented variants that follow the same record-wise split, evidence, risk, and coverage contracts. Table 2 summarizes the implemented baselines, ablations, and same-protocol comparators.
Table 2.
Implemented baselines, ablations, and same-protocol comparators.
F0-only, W0-only, E0 full coverage, CSED-full, and CSED-no-boundary are evaluated under the declared local protocol. The no-boundary variant is a mechanism ablation and is not treated as a deployment policy. Risk-score comparisons include raw confidence, confidence combined with F0–W0 Jensen–Shannon disagreement, and pure disagreement ranking. These scores are diagnostic alternatives; they do not introduce a trained router.
CSED-CalRisk is reported separately as an optional calibration-only ranking extension. It changes only the ranking score and does not change E0 probabilities, predicted classes, support branches, or the coverage grid. Its temperature is selected independently for each seed pair and held-speed fold using only that pair and fold’s calibration UIDs. Consequently, an improvement in a CalRisk ranking result is not interpreted as an improvement in the underlying classifier or as a replacement for the primary CSED policy.
The controlled waveform-backbone comparison evaluates the declared AxisSafeWaveCNN, AxisSafeLightSSMNet, AxisSafeTCNLiteNet, AxisSafeInceptionLiteNet, and AxisSafePatchTransformerLiteNet. The comparison uses the same six held-speed folds, the same deterministic input plan in each fold, five shared fair-comparison seed pairs, the same three acceleration channels (Acc_x, Acc_y, and Acc_z), the same training budget of 80 epochs with patience 18, batch size 16, 16,384-sample crops, 144 training crops per epoch, and eight deterministic evaluation crops. F0, the support rule, the 0.25/0.75 mixture, the 0.02 calibration margin, the confidence-risk definition, and the coverage grid are also shared.
The fair-backbone seed pairs are a separate controlled-comparison contract and are not pooled with the five primary CSED seed pairs. Every declared backbone is reported regardless of the direction of its result. This comparison measures performance under a common input and computational budget; it does not establish the separately tuned optimum of each backbone and is not a new formal external test. Historical comparator runs with different seeds, different input plans, or different training budgets are retained only as exploratory context and do not support a strict backbone ranking. The five fair-comparison seed pairs were fair_pair01 = (2706, 2716), fair_pair02 = (2726, 2736), fair_pair03 = (2746, 2756), fair_pair04 = (2766, 2776), and fair_pair05 = (2786, 2796); these pairs are separate from the primary CSED pairs.
3.5. Metrics and Record-Clustered Statistical Analysis
The primary selective analysis uses the fixed target coverages 100%, 95%, 90%, 80%, and 70%. Within each declared profile, the accepted count follows the frozen integer rule defined in Section 2.1.
Instances are ordered by increasing confidence risk, with the declared deterministic metadata tie-break. The lowest-risk instances are accepted and the remaining instances receive the operational output deferral for review. No risk-score threshold is fitted, and no coverage value is optimized after looking at evaluation labels.
At the primary HUST held-speed level, each seed pair contains 54 complete held UIDs. Therefore, the 80% target accepts ⌊0.80 × 54⌋ = 43 UIDs, corresponding to an actual pair-level coverage of 43/54 = 79.63%. The pooled descriptive analysis contains 54 × 5 = 270 model-record prediction instances and accepts ⌊0.80 × 270⌋ = 216 instances. The pooled 216-instance selection is not interchangeable with the five separate pair-level selections of 5 × 43 = 215 pair-specific accepted UID instances; the same physical UIDs can recur across pairs.
The reported quantities include full-coverage Macro-F1 and error, accepted-set Macro-F1 and accepted error, deferred error, and the corresponding absolute error counts and denominators. Accepted-set Macro-F1 is never interpreted without the accepted error, deferred error, and accepted/deferred counts. Deferred error is not defined at c = 1.00 because Ndef(1.00) = 0; it is reported only when the deferred set is nonempty. The area under the receiver operating characteristic curve for distinguishing incorrect from correct predictions (wrong-prediction AUC) and the area under the risk-coverage curve (AURC) are reported only as secondary ranking diagnostics where defined. All reported Macro-F1 and error values are computed over model-record prediction instances (for example, the 270 pooled instances of the primary HUST held-speed profile); record-level statistical support is quantified separately by the UID-cluster bootstrap, which resamples complete UIDs and retains all pair-specific predictions of each sampled UID, so that repeated predictions of one record are never treated as independent observations.
For every ratio, the denominator is identified explicitly as either complete UIDs or model-record prediction instances. The pooled HUST held-speed value is a descriptive summary over 270 repeated instances from 54 UID clusters. The five pair-specific results each use 54 complete UIDs and describe seed-to-seed algorithmic variation on the same records. The HUST variable-speed and SQV summaries are likewise descriptive repeated-instance analyses, with 270 and 1530 model-record prediction instances, respectively. None of these pooled counts is interpreted as an equivalent number of independent bearings, machines, or observations from a common physical population.
The primary uncertainty analysis uses 10,000 nonparametric percentile bootstrap resamples clustered by complete-record UID. Each resample draws complete UIDs with replacement and retains all five seed-pair measurements associated with each drawn UID. Within every resample, the frozen risk scores are reranked and the prespecified integer coverage rule is reapplied before accepted and deferred metrics are recomputed. The resulting intervals quantify record-clustered uncertainty for the evaluated records and protocol; they are not p-values, external-generalization intervals, bearing-wise confidence guarantees, or machine-wise inference.
The observed range across the five primary seed pairs is reported separately from the UID-cluster bootstrap interval. A simple binomial or Wilson interval based on pooled model-record instances is not used as primary inferential evidence because it would treat repeated predictions of the same UID as independent observations. If a small-cell binomial interval is retained for a descriptive display, its numerator, denominator, and descriptive status must be stated explicitly.
4. Results
4.1. Primary Selective Results on HUST and the Declared Safety Profiles
For RQ1, the HUST held-speed profile is the primary record-wise selective-diagnosis analysis. The primary record-wise estimates are computed separately for five predeclared seed pairs, each evaluated on 54 complete-record UIDs. At the 80% target, each pair accepts ⌊0.80 × 54⌋ = 43 UIDs, giving actual coverage of 43/54 = 79.63%. The pooled summary contains 270 model-record prediction instances and accepts 216 instances; these are descriptive repeated measurements from 54 UID clusters, not 270 independent records. At full coverage, the pooled E0 achieved Macro-F1 0.8701 with error rate 0.1333 (36/270). At the pooled 80% target, CSED accepted 216 model-record prediction instances and achieved accepted-set Macro-F1 0.9406 with accepted error 0.0602 (13/216). The deferred set of 54 model-record prediction instances had error rate 0.4259 (23/54), showing that the review queue was enriched for difficult cases. Table 3 reports the pooled profile-level results at the 80% target coverage.
Table 3.
Profile-level selective results at the pooled 80% target (descriptive model-record summaries; UID-cluster bootstrap is the primary uncertainty analysis).
For the pooled HUST held-speed descriptive analysis, the observed full-to-accepted error contrast, defined as Riskfull − Riskacc(c), was 0.0731 (0.1333 − 0.0602). A 10,000-resample UID-cluster percentile bootstrap gave a 95% interval of [0.0269, 0.1204]. This contrast describes error concentration under the evaluated record-wise protocol; it is not a causal treatment effect, a bearing-population guarantee, or evidence from 270 independent records.
The HUST-held-speed auxiliary metrics are shown only in Table 3 entry; the corresponding wrong-prediction AUC and AURC values for HUST variable-speed and SQV common-3 are reported in the risk-ranking comparison in Section 4.3. The SQV row is especially important for interpretation. In the main protocol, SQV is not served by a waveform expert, so CSED uses the HUST-trained F0 fallback. A separate SQV waveform-expert confirmation was completed and closed as frequency-fallback only (Section 4.4); it was not promoted into the main route. The result therefore supports a bounded statement: a frequency-anchored output can still provide useful confidence ordering for a declared common-label cross-source profile. It does not establish HUST-to-SQV waveform transfer. For the primary HUST result, 10,000 UID-cluster percentile bootstrap resamples gave full E0 error 0.1333 [0.0667, 0.2074] and accepted Macro-F1 0.9406 [0.8699, 0.9856]. The corresponding accepted error was 0.0602 [0.0139, 0.1250], and deferred error was 0.4259 [0.2037, 0.6667]. The Wilson intervals reported below are descriptive small-cell displays only, not the primary inferential intervals.
For completeness, the HUST variable-speed F0-only comparator reaches full Macro-F1 0.8933 and accepted error 0.0231 (5/216). It is slightly stronger than CSED-full on full Macro-F1, but it still leaves a higher accepted-error floor than CSED-full on the same profile.
The same-profile accepted-error cells in Table 3 correspond to 13/216, 2/216, and 115/1224 accepted instances; their descriptive Wilson 95% intervals are 0.0355–0.1002, 0.0025–0.0331, and 0.0789–0.1116, respectively. These intervals are retained only as descriptive small-cell summaries; the primary uncertainty analysis is the UID-cluster bootstrap described above. Figure 3 presents the risk-coverage curves for the three declared profiles.
Figure 3.
Risk-coverage curves for the declared profiles. The curves use fixed coverage points and show how accepted error changes as automatic coverage is reduced. The dashed horizontal line denotes the full-coverage error at 100% acceptance, shown as the reference benchmark; the vertical dotted line marks the primary 80% coverage target.
4.2. Boundary and Comparator Analysis
For RQ2, the boundary ablation compares CSED-full with an unconstrained no-boundary diagnostic variant that blends F0 and W0 unconditionally. The comparison tests whether the protocol-level support rule changes accepted risk under the evaluated conditions. Table 4 reports the boundary-ablation results, and Figure 4 compares the accepted error rates.
Table 4.
Support-boundary ablation at 80% coverage.
Figure 4.
Support-boundary accepted-error ablation. The no-boundary variant removes the protocol-level restriction on waveform participation and tests whether unconditional waveform fusion increases accepted risk at conditions for which W0 participation is not authorized by the support rule.
Removing the boundary showed higher observed accepted error by 0.0324 on HUST held-speed (95% UID-cluster bootstrap interval [−0.0278, 0.0926]) and by 0.1560 on SQV common-3. A temperature-consistent boundary control showed the same direction, with a +0.0231 HUST held-speed difference (95% interval [−0.0370, 0.0833]), +0.1560 SQV difference, and +0.2500 at the HUST 80 Hz upper-speed edge. The primary HUST paired UID-cluster intervals include zero; the SQV comparison is retained as a descriptive cross-source contrast rather than as a population-level estimate. Because the primary HUST paired intervals include zero, the HUST difference is reported strictly as a directional observation without a supportive-evidence claim; the SQV difference is likewise retained only as a descriptive cross-source contrast. The role of the support boundary is therefore justified by the protocol design (an evidence-applicability constraint) rather than by the statistical magnitude of these observed error differences.
The Wilson intervals shown in Section 4.1 are descriptive small-cell displays; the UID-cluster percentile bootstrap intervals are the primary uncertainty statements for the paired comparison.
The fixed evidence-source comparison separates support-bounded evidence organization from single-source controls and the optional pair- and fold-local calibrated ranking. All rows in Table 5 use the same pooled five-pair audit contract; they are descriptive model-record summaries rather than independent-bearing comparisons. CSED-full has the lowest observed accepted error among the primary non-CalRisk variants on HUST held-speed.
Table 5.
Fixed evidence-source variants at the pooled 80% target coverage.
SQV common-3 is routed to the HUST-trained F0 fallback in the main protocol; the separate SQV WaveCNN confirmation also closed as frequency-fallback only. Therefore, the SQV F0-only, CSED-full, and CSED-CalRisk rows coincide, and the W0-only row is retained only as a diagnostic unsupported-waveform control. The large W0-only error on SQV reflects the expected behavior of an unadapted waveform model applied out of distribution; it is reported as motivation for gating waveform participation on declared same-source support, not as evidence about waveform methods in general or about intrinsic cross-source waveform transfer.
The historical W0-replacement suite used heterogeneous seeds, input plans, and training budgets and is not used for strict ranking. A separate fair comparison fixed the six held-speed folds, the common three acceleration channels (Acc_x, Acc_y, and Acc_z), deterministic crop plan, 80-epoch budget with patience 18, batch size 16, F0 anchor, support rule, confidence risk, and coverage rule for all five waveform backbones. Table 6 reports the controlled backbone comparison, and Figure 5 shows the point estimates and paired uncertainty intervals.
Table 6.
Fair matched-input and matched-budget waveform-backbone comparison on HUST held-speed at the 80% target coverage.
Figure 5.
Fair matched-input and matched-budget waveform-backbone comparison on HUST held-speed. Point estimates are pooled descriptive values from 270 model-record instances; intervals are paired UID-cluster percentile bootstrap intervals for each replacement-minus-WaveCNN difference. Blue denotes the reference WaveCNN; orange denotes the replacement backbones.
Table 6 reports the resulting five-pair controlled comparison. WaveCNN has accepted error 0.0694 (15/216), LightSSM 0.0694 (15/216), TCN-lite 0.0926 (20/216), Inception-lite 0.1111 (24/216), and PatchTransformer-lite 0.0787 (17/216). Every replacement-minus-WaveCNN paired UID-cluster 95% interval includes zero. The defensible conclusion is that no tested replacement demonstrated a reliable reduction in accepted error under this common contract; this does not establish universal or separately tuned architecture superiority.
4.3. Risk Ranking, Calibration, and Seed Stability
The risk-score ablation in Table 7 explains why confidence risk is used as the main cross-profile ranking rule. Hybrid confidence-plus-disagreement improves the HUST held-speed result slightly, but it has a higher observed accepted error on SQV common-3 under the same descriptive comparison. Pure F0–W0 disagreement is also less reliable on SQV. Therefore, disagreement is useful diagnostically but is not promoted as the primary ranking rule.
Table 7.
Risk-score ablation at the pooled 80% target coverage.
CSED-CalRisk is different from the hybrid score. It does not add a new evidence source or a disagreement term. For each seed pair and held-speed fold, the temperature is selected from the fixed grid using only the nine calibration UIDs assigned to that pair and fold; these UIDs are disjoint from the corresponding held UIDs. Under this protocol, the optional extension achieves accepted Macro-F1/error of 0.9499/0.0556 in the main evaluation and 0.9695/0.0324 in the secondary seed-root check. It is reported as a descriptive calibration-only ranking extension, not as a replacement for the primary CSED policy. Table 8 summarizes the corresponding main-evaluation and secondary seed-root results.
Table 8.
Pair- and fold-local calibration-only risk extension.
HUST Bearing variable-speed and SQV common-3 retain the raw confidence risk because the pair- and fold-local calibration rule is declared only for the matched HUST Bearing held-speed profile. This scope restriction prevents an unvalidated calibration transform from being carried into the safety profiles. CalRisk is therefore reported only as a support-guarded ranking extension on HUST Bearing held-speed.
All five predeclared seed pairs passed the selective checks. Table 9 shows expected variation in full-coverage and accepted-set performance, but every pair retained the direction of accepted-error reduction and deferred-error enrichment.
Table 9.
Seed-pair stability on HUST held-speed at the pair-level 80% target.
This stability result is stronger than a single-seed demonstration. It does not mean that all WaveCNN randomness has been removed; rather, it shows consistency of the observed direction under the declared seed contract, not elimination of training randomness or a guarantee that the same ordering will hold for new physical bearings or machines.
At the seed-pair level, each pair accepts 43 held identifiers. The accepted-error count ranges from 1 to 5 instances, which corresponds to accepted-error rates from 0.0233 (pair07) to 0.1163 (pair06). These per-pair results show that the observed accepted-error reduction was directionally consistent across the declared seed pairs, while its magnitude varied.
4.4. External Stress Test and Withheld Enhancement Candidates
For RQ3, VSBD is evaluated as an external bearing-source boundary. A fixed Channel_1 frequency logistic-regression model was fitted separately for four profile-holdout and three replicate-holdout folds, always keeping complete MAT files together. All seven folds achieved test Macro-F1 and balanced accuracy of 1.0000. Table 10 summarizes these stress-test results.
Table 10.
VSBD external frequency-anchor stress test.
Because no test error is observed, the read-only confidence-first recomputation has zero accepted error at every declared coverage. Deferred error is zero whenever the deferred set is nonempty and is undefined whenever no record is deferred, including at 100% coverage; wrong-prediction AUC is undefined and AURC is zero. This is a useful saturation boundary but not evidence that CSED adds measurable selective gain on VSBD. It shows that the third source is highly separable under the fixed frequency protocol and should therefore be reported separately rather than averaged into the HUST–SQV selective headline.
On Channel_1, the inner-race signals have raw-signal standard deviations of approximately 0.04–0.05, compared with approximately 0.007–0.01 for healthy and outer-race signals. This raw-amplitude contrast provides a strong distinction for the inner-race class and is consistent with perfect three-class test results under the fixed frequency representation in the declared folds. The four profile-holdout folds each contain nine complete cases, balanced as three healthy, three inner-race, and three outer-race cases; the three replicate-holdout folds each contain 12 cases, balanced as four cases per class. Two shortcuts are also excluded: grouping by complete MAT file avoids window-level leakage, and the Channel_2 rotational-speed pulse is withheld, so no tacho or order shortcut is used. Regarding fold construction, each of the four profile-holdout folds holds out one complete speed-trajectory profile (nine records, three per class) as the test partition, and each of the three replicate-holdout folds holds out one complete acquisition replicate (twelve records, four per class) as the test partition; within each fold, one further group forms the validation partition and the remaining records form the training partition, with every complete MAT file kept within one partition. Validation groups are selected before any evaluation metric is read, and every test partition contains all three classes (healthy, inner-race, and outer-race).
Several audited candidates were not promoted to the primary workflow, including the training-stability diagnostic, the 20-seed-pair record-consensus variant, and the dedicated SQV WaveCNN confirmation. They either failed their prespecified promotion criterion or did not improve the conservative route. Their results are retained as negative or boundary evidence rather than merged into the primary positive result.
4.5. Sensitivity Analysis of the Frozen Policy Values
The two frozen policy constants, the 0.25/0.75 F0/W0 mixture weights and the 0.02 calibration Macro-F1 margin, were selected in the preceding read-only development screen (the pair00–pair04 stability-confirmation runs; Appendix B) and were frozen before the fresh pair05–pair09 confirmation reported as the primary results. Because the folds are speed-determined, the development screen and the confirmation runs evaluate the same 54 fold-specific held UIDs with different training seeds, so the screen serves as a temporal, seed-separated control rather than an independent record-level validation. Within every run, the calibration and held partitions remained disjoint; all 60 calibration/held UID intersections were verified empty (Appendix B). The grids documented in Table A9 are result-open descriptive recomputations of the frozen evaluation under perturbed policy values; they were executed read-only and were not used to select or revise the primary policy.
Table 11 summarizes the descriptive scan on the primary HUST held-speed profile at the 80% coverage target. Across the margin grid {0.00, 0.01, 0.02, 0.05, 0.10}, the accepted error remains within 0.0556–0.0648, always below the corresponding full-coverage error (0.1259–0.1370), and the deferred error remains within 0.4074–0.4259. Across the blend-weight grid {0.00, 0.25, 0.50, 0.75, 1.00}, the accepted error remains within 0.0509–0.1852, again always below the corresponding full-coverage error (0.1185–0.2593), and the deferred error remains within 0.3889–0.5741, i.e., the deferred set stays enriched for errors at every grid point. The qualitative conclusions of this study, error concentration in the deferred subset and a lower-risk accepted subset, are therefore robust to reasonable perturbations of both frozen values. The blend weight 0.50 yields a slightly lower descriptive accepted error (0.0509) than the frozen 0.75 (0.0602); reselecting it after reading evaluation results would violate the frozen-policy contract, so the value is reported as a descriptive observation only and the primary policy is retained unchanged.
Table 11.
Descriptive sensitivity of the frozen policy values on the primary HUST held-speed profile at the 80% coverage target (result-open read-only scans; not used for policy selection).
5. Discussion
5.1. What the Selective Result Means
The main result supports a two-tier diagnostic service. At 80% coverage on HUST held-speed, CSED automatically diagnoses the lower-risk subset with an error rate of 0.0602 and sends the higher-risk subset, whose error rate is 0.4259, to review. The deferred records are not discarded. They are records for which the current evidence does not justify automatic action. The deferred-set error is the error of the frozen model predictions before human intervention; it is not an estimate of the final error after expert review. A deployed system should store, for each deferred record, the raw signal, probability vector, profile metadata, defer reason, and review outcome for later monitoring. In such a monitoring deployment, a rising deferral rate or a rising record-level risk trend for a given machine can serve as an early-warning indicator before a fault fully develops.
This reading differs from a conventional accuracy claim. CSED does not say that the full classifier has become universally stronger. It gives an operating policy for trading automatic coverage for lower automatic risk. The confidence risk is used as a ranking proxy for selective ordering, not as a calibrated probability that an individual diagnosis is wrong or as a formal safety guarantee. Deferred-error enrichment is therefore central. If the deferred subset were not riskier than the accepted subset, selective diagnosis would not be operationally meaningful. The width of the UID-cluster bootstrap intervals reflects the modest number of statistically distinct records (54 UIDs) and is an intrinsic property of the record-wise protocol rather than a defect of the estimator; the point estimates should therefore be read together with their intervals. For practical deployment, the accepted-set error is plausibly anywhere within the reported interval under the evaluated protocol, and the deferred-review queue should be sized accordingly as a required component of the operating policy rather than an optional one.
5.2. Why Boundaries and Backbone Changes Matter
The support boundary has a functional role in the organization of evidence. The support-bounded policy showed lower observed accepted error than unconditional fusion on the primary HUST held-speed profile and a larger descriptive difference on SQV common-3, but the paired HUST UID-cluster intervals include zero. The defensible interpretation is bounded mechanism evidence in this dataset, not a proof of an invariant population-level reduction. The boundary is resolved once for each declared combination of seed pair, fold, and profile and was not selected from evaluation errors. The asymmetric treatment of 20 and 80 Hz should be interpreted in terms of available calibration support rather than speed per se: the 20 Hz fold is adjacent to the 25 Hz calibration condition, whereas the 80 Hz upper endpoint lacks comparable outward support and is conservatively assigned to the frequency anchor. Here, “mechanism” refers specifically to the separation of two effects: (i) whether waveform evidence is applicable to the declared profile, which is resolved by the support gate before any confidence ranking, and (ii) whether the resulting prediction is reliable enough for automatic release, which is resolved by the confidence-first ranking. The no-boundary ablation isolates effect (i) by changing only the evidence branch while holding the ranking rule and the coverage fixed. This differs from a regularization effect, which would act on model parameters during fitting; the support boundary acts on evidence routing after fitting and does not change any model weights.
This explains why CSED does not train a sample-level router. The calibration sets are small. Disagreement near a boundary can be misleading. A flexible selector could memorize fold-specific posterior patterns and look attractive while remaining unstable. CSED instead chooses an explicit support rule and a low-degree confidence ranking.
Relative to established selective-classification methods such as SelectiveNet [29] and related reject-option formulations [28,30,31,32], CSED differs in two fundamental aspects. First, conventional selective prediction models only the acceptance decision, whether a final prediction should be released, and assumes that the evidence source itself is applicable; CSED adds an upstream evidence-applicability decision (the support gate) that these methods do not model. Second, methods such as SelectiveNet learn a selection or reject head jointly with the classifier on training data to optimize a coverage target. Under the present record-wise protocol, with only 72 training complete records per fold and an explicit prohibition on label-driven threshold tuning, fitting such an additional selection function would introduce the estimation and overfitting risk that the framework is designed to avoid; CSED therefore uses a fixed, predeclared confidence-first ranking rule with no learned selection parameters. A direct numerical comparison under identical conditions is not reported because a faithful implementation of these baselines would require retraining their selection components on the small calibration partitions, which conflicts with the declared leakage controls; the conceptual comparison above delineates the differences that are independent of any particular numerical instantiation.
The fair matched-input and matched-budget comparison addresses whether a simple waveform-backbone replacement can reproduce a lower accepted risk. With common splits, inputs, budgets, seed pairs, evidence policy, and coverage, none of the four replacements showed a reliable accepted-error reduction relative to WaveCNN; all paired UID-cluster intervals included zero. This supports retaining W0 under the frozen contract, but it does not show that WaveCNN is universally or statistically superior to all state-space, convolutional, multiscale, or Transformer alternatives. Each alternative could have a different separately tuned optimum under another protocol.
5.3. Scope, Limitations, and Reproducibility
The dataset design is intentionally asymmetric. HUST is the main source and primary profile. HUST variable-speed and SQV common-3 are safety profiles. VSBD is an external saturation and stress-test source. These roles keep incompatible label semantics out of one aggregate score and prevent unrelated datasets from being treated as ordinary bearing records in the same label space.
The SQV result should be interpreted within its declared role. The main protocol uses the frequency fallback on SQV common-3, and the dedicated SQV WaveCNN expert confirmation also closed as frequency-fallback only. It therefore supports useful risk ordering on a declared common-label profile, but does not constitute evidence of source adaptation. The VSBD result is a separate boundary case: its perfect frequency-anchor performance is useful as a saturation check, but it cannot show selective gain when no errors are observed to defer.
This study has several limitations. The evaluation is record-wise, not physical-entity-wise. The available metadata do not establish a verified bearing-level identifier. The independent record count is small. A few records can still change a fold result. CSED is a selective-risk policy, not an open-set detector. Deferral for review does not prove that a novel fault type has been recognized. The study also does not measure human-review cost or workflow design. Complete WaveCNN determinism is not claimed either. Residual model-side variance remains. The support rule is resolved once for each declared combination of seed pair, fold, and profile and remains intentionally coarse; it does not estimate a continuous sample-level distance from the training distribution and may therefore defer too many or too few records within a profile whose internal heterogeneity is large. Finally, the reported coverage values are fixed operating points. Because the accepted count is determined by an integer rule, realized coverage can differ slightly from the nominal target, especially in small profiles. In deployment, the coverage grid should therefore be translated into an operating policy together with review capacity and maintenance cost. The coverage values are not tuned on evaluation labels.
The pooled evaluation unit is a model-record prediction instance, not a physical entity; repeated entries for one UID are not independent observations. The manuscript therefore makes no claim of bearing-wise generalization, complete open-set recognition, or identical-input computational superiority.
6. Conclusions
The primary conceptual contribution of this study is the separation of evidence applicability from selective acceptance: a declared support boundary first determines which diagnostic evidence may enter the prediction, and a fixed confidence-first policy then determines whether the resulting prediction is released for automatic diagnosis. This two-decision formulation, together with a record-wise evaluation protocol that keeps the scope of the resulting claims explicit, distinguishes the present framework from conventional closed-set classifiers and from selective-prediction methods that model only the acceptance decision.
This study introduced Support-Bounded Confidence-First Selective Evidence Diagnosis (CSED), a record-level framework for bearing-fault assessment under specified speed and source shifts. CSED first determines, for each declared combination of seed pair, fold, and profile, whether waveform evidence is sufficiently supported to augment a frequency-domain logistic-regression anchor. It then applies a fixed confidence-first ranking to separate predictions released for automatic diagnosis from those referred for review. This design makes the evidence branch and the accept/defer decision explicit and auditable without introducing a flexible sample-level router.
On the primary HUST held-speed analysis, the full-coverage E0 output achieved a Macro-F1 of 0.8701 with an error rate of 0.1333. At the prespecified 80% target coverage, the accepted subset achieved a Macro-F1 of 0.9406 with an error rate of 0.0602, whereas the deferred subset had an error rate of 0.4259. These pooled values summarize repeated model-record predictions clustered by complete-record identifier rather than 270 independent records. The HUST variable-speed and SQV common-3 analyses provide supplementary evidence about the behavior of the confidence-first policy under declared safety-profile conditions, while the VSBD experiment serves as a separate frequency-anchor saturation check. The support-boundary ablation and the fair matched-input and matched-budget backbone comparison favor retaining the conservative evidence organization and WaveCNN under the present protocol. They do not, however, establish universal architectural superiority or a population-level guarantee.
CSED should therefore be viewed as an auditable operating policy for risk-aware selective diagnosis under the evaluated protocol; broader claims about universal full-coverage accuracy, open-set recognition, or bearing-wise generalization require additional evidence. Future work should evaluate the support rule with independently partitioned bearing entities and additional sources, extend the setting to explicitly labeled novel fault conditions, extend the framework to electrically induced bearing faults using current or shaft-voltage measurements, and quantify review workload and decision outcomes in online monitoring.
Author Contributions
Conceptualization, B.Z., D.S. and F.Z.; methodology, B.Z. and F.Z.; software, B.Z.; validation, B.Z. and D.S.; formal analysis, B.Z. and Z.H.; investigation, B.Z. and C.L.; resources, B.Z., D.S. and C.L.; data curation, B.Z. and C.L.; writing—original draft preparation, B.Z. and F.Z.; writing—review and editing, B.Z., D.S., T.Z. and F.Z.; visualization, B.Z. and Z.H.; supervision, D.S. and F.Z.; project administration, D.S., T.Z. and F.Z.; funding acquisition, D.S. and F.Z. All authors have read and agreed to the published version of the manuscript.
Funding
This work was supported by the Key R&D Plan of Shandong Province (Major Science and Technology Innovation Project No. 2023CXGC010701), the 2024 Jinan City–University Integration Development Strategic Engineering Project (No. JNSX2024066), the Shandong Province Major Scientific and Technological Innovation Project (No. 2019TSLH0315), and the Shandong Province Natural Science Foundation (Nos. ZR2023MF089 and ZR2023QF130).
Data Availability Statement
The HUST and VSBD sources are available from their cited providers. SQV was accessed through the cited public catalog [35], and its acquisition protocol is reported in [34]. Because a formal dataset DOI and redistribution license were not verified, this paper does not repackage or redistribute the raw SQV files; processed split manifests and compact summaries are shared only to the extent permitted by the original data providers.
Conflicts of Interest
Author Cuntao Lou was employed by the company Shandong Guoshun Construction Group Co., Ltd. The remaining authors declare that the research was conducted in the absence of any commercial or financial relationships that could be construed as a potential conflict of interest.
Appendix A. Consolidated Notation Used in the Methodology
This appendix consolidates the notation used in Equations (1)–(12) and the associated methodology. The local definitions in Section 2.1, Section 2.2, Section 2.3 and Section 2.4 govern each symbol in its equation-specific context; the entries below provide a cross-reference rather than additional model assumptions.
Table A1.
Notation for records, partitions, and selective evaluation.
Table A2.
Notation for evidence organization, ranking, and diagnostic scores.
Appendix B. Seed-Pair and Protocol Audit Details
Five predeclared seed pairs were used; all passed the execution checks specified in the protocol, and per-pair values are listed in this appendix. The pair05–pair09 identifiers continue the internal experiment sequence: pair00–pair04 were used in the preceding stability confirmation, whereas pair05–pair09 were newly predeclared for the selective confirmation reported here. They do not denote additional datasets or independent test populations. For the optional CalRisk extension, each seed pair and held-speed fold uses its own nine calibration UIDs for temperature selection; all 60 calibration/held UID intersections across the development and secondary roots were empty.
Table A3.
Fresh seed pairs used in the main evaluation.
Table A4.
Executed HUST held-speed support branch map by primary seed pair.
Blend denotes the evidence mixture 0.25pF + 0.75pW; F0 denotes the frequency-anchor fallback. The map is resolved once for each declared combination of profile, fold, and seed pair and is applied unchanged to every record in that group; it is not a per-record learned router. The asymmetric behavior at the two speed edges follows the support protocol described in Section 2.2 and Section 3.3. The 20 Hz fold retains access to the calibration gate because it is paired with the adjacent 25 Hz calibration condition, whereas 80 Hz is treated as a conservative upper support boundary because its assigned calibration condition is 70 Hz and no operating condition above 80 Hz is available to establish outward waveform support. The hard lock therefore represents an evidence-applicability constraint rather than a conclusion that the 80 Hz records are intrinsically more difficult. HUST 80 Hz and SQV common-3 are hard-locked to F0.
Table A5.
Information-flow audit by evaluation profile.
The fitting, calibration, and policy boundaries shown here are fixed before evaluation. Evaluation labels are used only after freeze to compute the reported metrics and declared audits.
Table A6.
HUST–SQV common-3 label mapping.
The mapping is fixed before evaluation. Only retained classes are scored; SQV labels are not used for HUST fitting, calibration, branch selection, policy selection, or hyperparameter selection.
Appendix C. Extended Implementation and Comparator Details
The following support- and comparator-side entries are retained for transparency but are not part of the compact main-text comparator table.
Table A7.
Extended comparator entries moved out of the main comparator table.
Table A8.
AxisSafeWaveCNN architecture and training contract.
This table records the frozen W0 implementation contract used for the primary HUST protocol. It does not imply that a separately tuned optimum was sought for this or any comparator backbone.
Table A9.
Frozen policy values and read-only sensitivity provenance.
The mixture weights 0.25 and 0.75 and the calibration margin 0.02 were empirical policy choices made during the preceding read-only development screen. The blend retains the frequency anchor while assigning the dominant contribution to an admitted waveform expert, whereas the positive margin requires a calibration Macro-F1 advantage before waveform evidence is admitted. Both values were frozen before the fresh pair05–pair09 confirmation; the grids in Table A9 are result-open descriptive sensitivity analyses and were not used for parameter selection.
Appendix D. Test-Rig Configurations
This appendix presents the acquisition configurations of the three bearing-data sources. Figure A1 shows the HUST [33], SQV [34,35], and VSBD [36] test rigs. The HUST and VSBD panels are reproduced with the source attribution and license statement displayed in the figure; the SQV panel is reproduced from the publicly accessible SQV dataset release [35].
Figure A1.
Test-rig configurations for the HUST, SQV, and VSBD bearing-data sources. Panel (a) is reproduced from HUST [33] under the indicated CC BY 4.0 terms; panel (b) is reproduced from the SQV dataset release [35]; and panel (c) is reproduced from VSBD [36] under the indicated CC BY 4.0 terms.
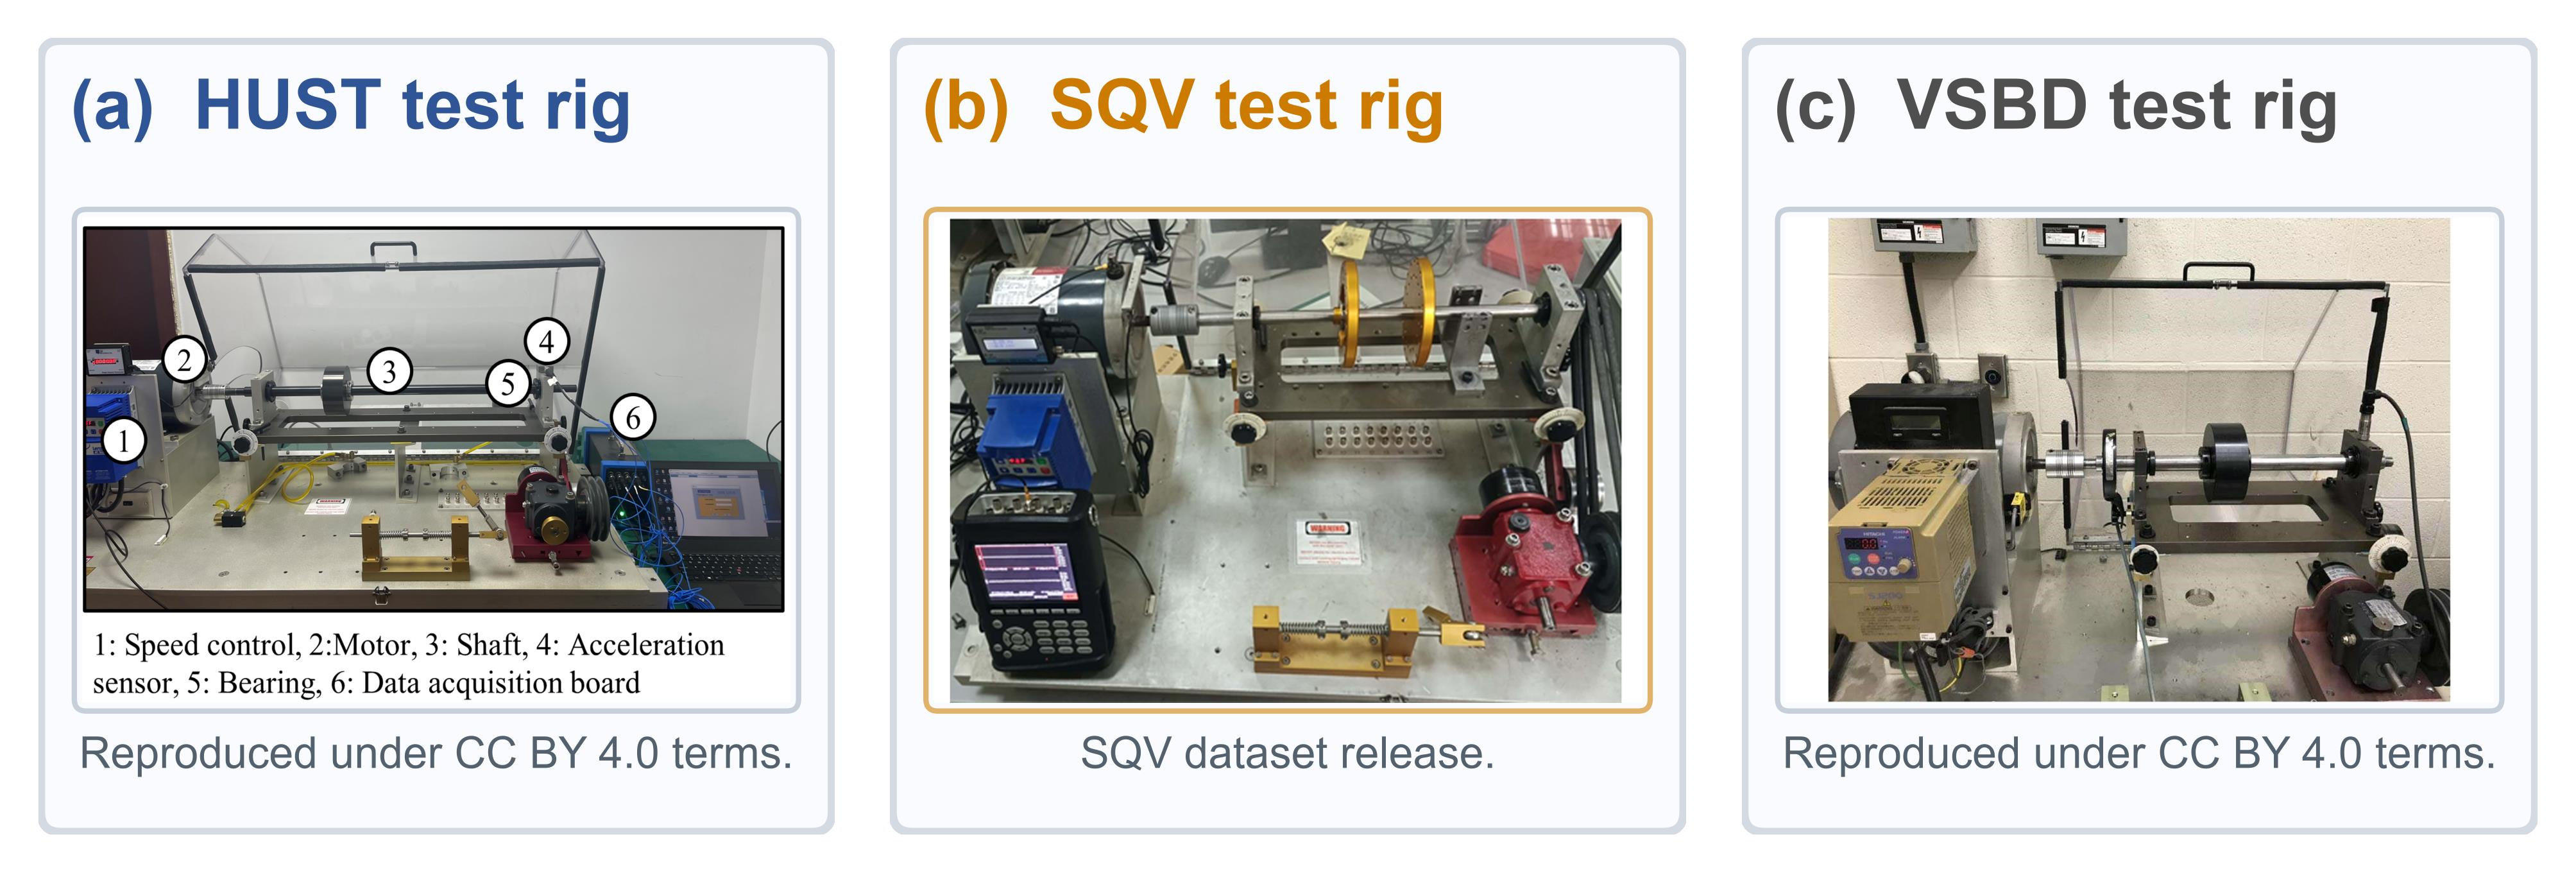
References
- Melo, A.; Câmara, M.M.; Pinto, J.C. Data-Driven Process Monitoring and Fault Diagnosis: A Comprehensive Survey. Processes 2024, 12, 251. [Google Scholar] [CrossRef] [Scilit]
- Wheat, L.; Mohrenschildt, M.V.; Habibi, S.; Al-Ani, D. Impact of Data Leakage in Vibration Signals Used for Bearing Fault Diagnosis. IEEE Access 2024, 12, 169879–169895. [Google Scholar] [CrossRef] [Scilit]
- Vieira, J.P.; Bauler, V.A.; Rosa, R.K.; Silva, D. Towards a More Realistic Evaluation of Machine Learning Models for Bearing Fault Diagnosis. Mech. Syst. Signal Process. 2026, 258, 114640. [Google Scholar] [CrossRef] [Scilit]
- Xiao, Y.; Shao, H.; Yan, S.; Wang, J.; Peng, Y.; Liu, B. Domain Generalization for Rotating Machinery Fault Diagnosis: A Survey. Adv. Eng. Inform. 2025, 64, 103063. [Google Scholar] [CrossRef] [Scilit]
- Shen, B.; Zhang, M.; Yao, L.; Song, Z. Novel Triplet Loss-Based Domain Generalization Network for Bearing Fault Diagnosis with Unseen Load Condition. Processes 2024, 12, 882. [Google Scholar] [CrossRef] [Scilit]
- Li, J.; Zheng, C.; Wu, Z.; Chen, H.; Wang, X.-B.; Yang, Z.-X. Review of Fault Diagnosis for Rotating Machinery: Prior Knowledge Integration in Data-Driven Methods Benefits Model Interpretability and Generalizability. Mech. Syst. Signal Process. 2026, 242, 113623. [Google Scholar] [CrossRef] [Scilit]
- Iunusova, E.; Archenti, A. Lab-to-Field Generalization Gap: Assessment of Transfer Learning for Bearing Fault Detection. Appl. Sci. 2025, 15, 6804. [Google Scholar] [CrossRef] [Scilit]
- Zhang, Z.; Xue, C.; Li, X.; Wang, Y.; Wang, L. A Collaborative Domain Adversarial Network for Unlabeled Bearing Fault Diagnosis. Appl. Sci. 2024, 14, 9116. [Google Scholar] [CrossRef] [Scilit]
- Yan, S.; Shao, H.; Wang, J.; Zheng, X.; Liu, B. LiConvFormer: A Lightweight Fault Diagnosis Framework Using Separable Multiscale Convolution and Broadcast Self-Attention. Expert Syst. Appl. 2024, 237, 121338. [Google Scholar] [CrossRef] [Scilit]
- Yi, H.; Li, D.; Lu, Z.; Jin, Y.; Duan, H.; Hou, L.; Duraihem, F.Z.; Awwad, E.M.; Saeed, N.A. VibrMamba: A Lightweight Mamba Based Fault Diagnosis of Rotating Machinery Using Vibration Signal. Measurement 2025, 249, 116881. [Google Scholar] [CrossRef] [Scilit]
- Zhang, H.; Li, Y.; Zhang, X.; Feng, H. Multi-Scale Group Mamba Network with Structural Attention for Rotating Machinery Fault Diagnosis Using Multisensor Data. Adv. Eng. Inform. 2025, 67, 103521. [Google Scholar] [CrossRef] [Scilit]
- Liu, S.; Chen, J.; He, S.; Shi, Z.; Zhou, Z. Few-Shot Learning under Domain Shift: Attentional Contrastive Calibrated Transformer of Time Series for Fault Diagnosis under Sharp Speed Variation. Mech. Syst. Signal Process. 2023, 189, 110071. [Google Scholar] [CrossRef] [Scilit]
- Zhou, Q.; Ma, W.; Zhang, Y.; Guo, J. A Multi-Source Domain Adaptation Approach with Learning Domain-Specific Representations for Bearing Fault Diagnosis under Limited Samples. Appl. Soft Comput. 2025, 184, 113727. [Google Scholar] [CrossRef] [Scilit]
- Song, Y.; Yang, H.; Cong, X.; Wang, D.; Gao, H.; Li, Y.; Zhang, Y. Universal Domain Adaptation with Adaptive Dual-Confidence Bounds for Rotating Machinery Fault Diagnosis. Mech. Syst. Signal Process. 2026, 252, 114294. [Google Scholar] [CrossRef] [Scilit]
- Wang, Y.; Gao, J.; Wang, W.; Yang, X.; Du, J. Curriculum Learning-Based Domain Generalization for Cross-Domain Fault Diagnosis with Category Shift. Mech. Syst. Signal Process. 2024, 212, 111295. [Google Scholar] [CrossRef] [Scilit]
- Xu, M.; Zhang, Y.; Lu, B.; Liu, Z.; Sun, Q. A Novel Domain-Private-Suppress Meta-Recognition Network Based Universal Domain Generalization for Machinery Fault Diagnosis. Knowl.-Based Syst. 2025, 309, 112775. [Google Scholar] [CrossRef] [Scilit]
- Wang, C.; Ma, L.; Wang, J.; Bao, R.; Yu, H.; Wang, S. Continuously Indexed Domain Generalization for Fault Diagnosis under Continuously Varying Working Conditions. IEEE Trans. Instrum. Meas. 2025, 74, 1–11. [Google Scholar] [CrossRef] [Scilit]
- Zhu, J.; Wang, Y.; Huang, C.-G.; Shen, C.; Chen, B. A New Incremental Learning for Bearing Fault Diagnosis under Noisy Conditions Using Classification and Feature-Level Information. IEEE Trans. Instrum. Meas. 2024, 73, 1–14. [Google Scholar] [CrossRef] [Scilit]
- Guo, Y.; Ju, G.; Zhang, J. A Domain Generalization Network for Imbalanced Machinery Fault Diagnosis. Sci. Rep. 2024, 14, 25447. [Google Scholar] [CrossRef] [Scilit] [PubMed]
- Chen, Y.; Li, Z.; Jiang, Y.; Gong, D.; Zhou, K. Sparse LPV-ARMA Model for Non-Stationary Vibration Representation and Its Application on Gearbox Tooth Crack Detection under Variable Speed Conditions. Mech. Syst. Signal Process. 2025, 224, 112161. [Google Scholar] [CrossRef] [Scilit]
- Chen, Y.; Zhang, D.; Yan, R.; Xie, M. Applications of Domain Generalization to Machine Fault Diagnosis: A Survey. IEEE/CAA J. Autom. Sin. 2025, 12, 1963–1984. [Google Scholar] [CrossRef] [Scilit]
- Xiao, Y.; Shao, H.; Liu, B. Evaluating Calibration of Deep Fault Diagnostic Models under Distribution Shift. Comput. Ind. 2025, 171, 104334. [Google Scholar] [CrossRef] [Scilit]
- Shao, H.; Xiao, Y.; Leng, J.; Zhao, X.; Liu, B. Collaborative Human-Computer Fault Diagnosis via Calibrated Confidence Estimation. Adv. Eng. Inform. 2025, 65, 103349. [Google Scholar] [CrossRef] [Scilit]
- Feng, M.; Shao, H.; Shao, M.; Xiao, Y.; Wang, J.; Liu, B. Utilizing Bayesian Generalization Network for Reliable Fault Diagnosis of Machinery with Limited Data. Knowl.-Based Syst. 2024, 305, 112628. [Google Scholar] [CrossRef] [Scilit]
- Yan, S.; Shao, H.; Wang, X.; Zhang, H.; Xiao, Y.; Liu, B. Compact-Sparse Prototype Calibration Network for Few-Shot Continual Fault Diagnosis of Rotating Machinery. Eng. Appl. Artif. Intell. 2025, 155, 111099. [Google Scholar] [CrossRef] [Scilit]
- Gu, J.; Yuan, X.; Li, X.; Wang, Y.; Xing, J. Symmetric Radial Vectors for Uncertainty-Aware Rotary Machinery Fault Diagnosis. Reliab. Eng. Syst. Saf. 2026, 266, 111639. [Google Scholar] [CrossRef] [Scilit]
- Guo, C.; Pleiss, G.; Sun, Y.; Weinberger, K.Q. On Calibration of Modern Neural Networks. In Proceedings of the 34th International Conference on Machine Learning, Sydney, Australia, 6–11 August 2017; PMLR: Sydney, Australia, 2017; Volume 70, pp. 1321–1330. Available online: https://proceedings.mlr.press/v70/guo17a.html (accessed on 12 October 2026).
- Geifman, Y.; El-Yaniv, R. Selective Classification for Deep Neural Networks. In Advances in Neural Information Processing Systems; Curran Associates, Inc.: Red Hook, NY, USA, 2017; Volume 30, pp. 4878–4887. Available online: https://papers.nips.cc/paper_files/paper/2017/hash/4a8423d5e91fda00bb7e46540e2b0cf1-Abstract.html (accessed on 12 October 2026).
- Geifman, Y.; El-Yaniv, R. SelectiveNet: A Deep Neural Network with an Integrated Reject Option. In Proceedings of the 36th International Conference on Machine Learning, Long Beach, CA, USA, 9–15 June 2019; PMLR: Long Beach, CA, USA, 2019; Volume 97, pp. 2151–2159. Available online: https://proceedings.mlr.press/v97/geifman19a.html (accessed on 12 October 2026).
- Karlsson, M.; Hössjer, O. Classification under Partial Reject Options. J. Classif. 2024, 41, 2–37. [Google Scholar] [CrossRef] [Scilit]
- Motlagh, N.K.; Davis, J.; Anderson, T.; Gwinnup, J. Naturally Constrained Reject Option Classification. Mach. Vis. Appl. 2025, 36, 9. [Google Scholar] [CrossRef] [Scilit]
- Zhang, C.; Wang, W.; Qiao, X. On Reject and Refine Options in Multicategory Classification. J. Am. Stat. Assoc. 2018, 113, 730–745. [Google Scholar] [CrossRef] [Scilit]
- Zhao, C.; Zio, E.; Shen, W. Domain Generalization for Cross-Domain Fault Diagnosis: An Application-Oriented Perspective and a Benchmark Study. Reliab. Eng. Syst. Saf. 2024, 245, 109964. [Google Scholar] [CrossRef] [Scilit]
- Chi, F.; Yang, X.; Shao, S.; Zhang, Q. Bearing Fault Diagnosis for Time-Varying System Using Vibration-Speed Fusion Network Based on Self-Attention and Sparse Feature Extraction. Machines 2022, 10, 948. [Google Scholar] [CrossRef] [Scilit]
- Liu, S. SQ Speed Variation Vibration Signal Dataset; GitHub Repository. Available online: https://github.com/shenliuuu/SQ-dataset-with-variable-speed-for-fault-diagnosis (accessed on 14 September 2026).
- Huang, H.; Baddour, N. Bearing Vibration Data Collected under Time-Varying Rotational Speed Conditions. Data Brief. 2018, 21, 1745–1749. [Google Scholar] [CrossRef] [Scilit] [PubMed]
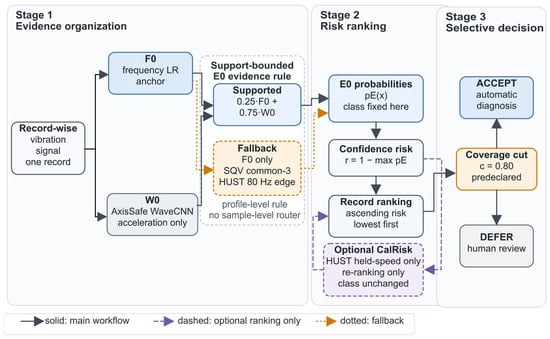
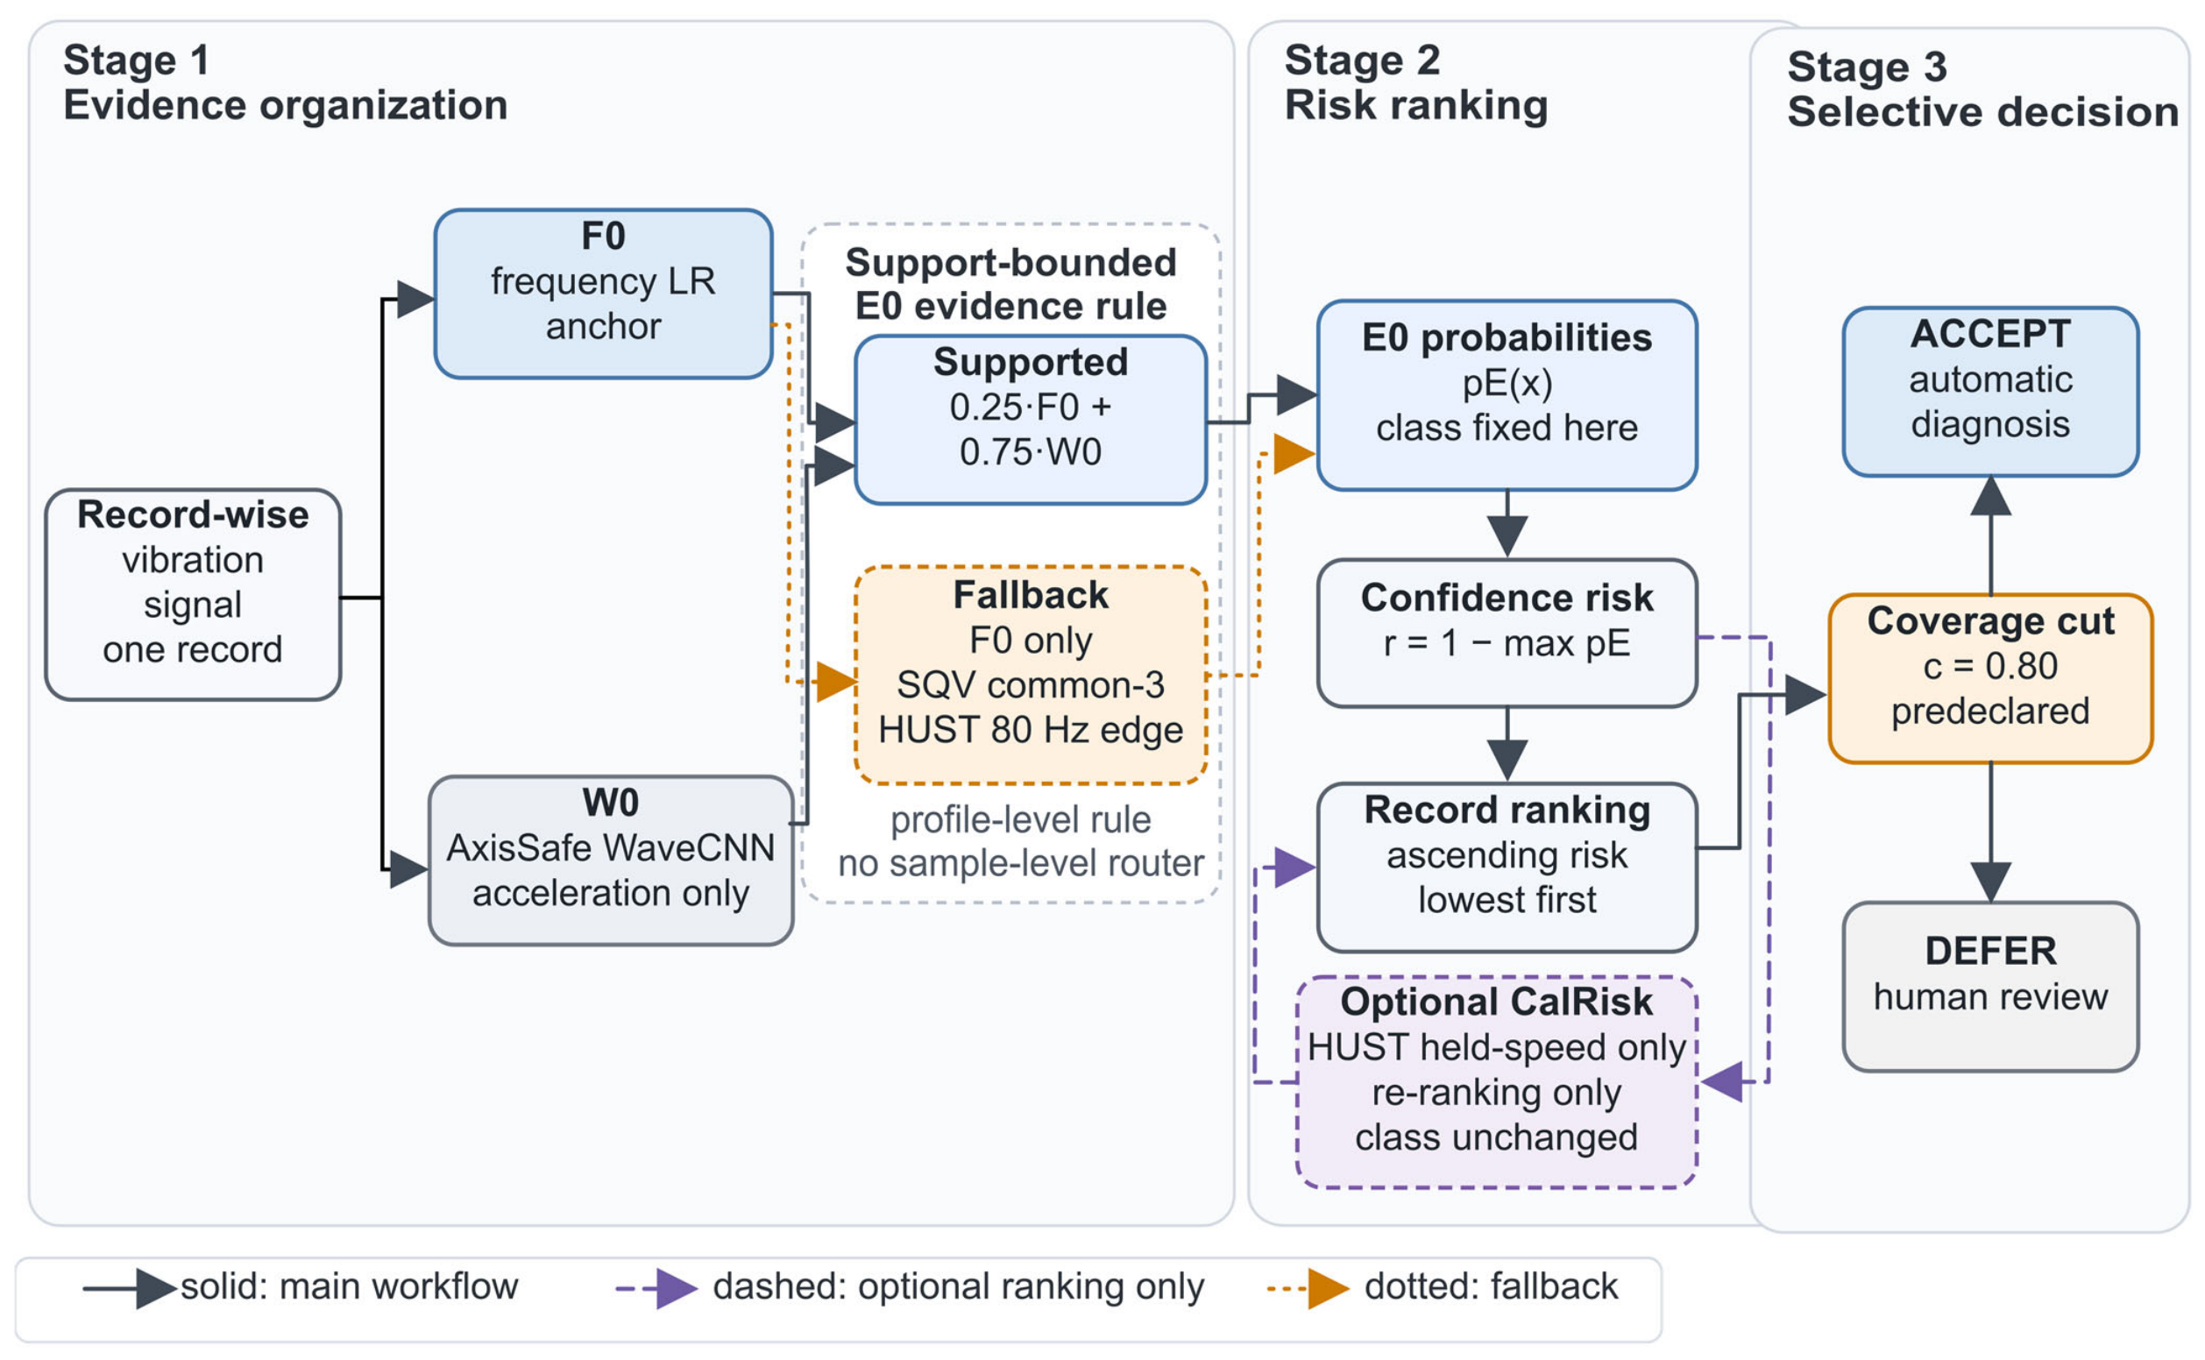
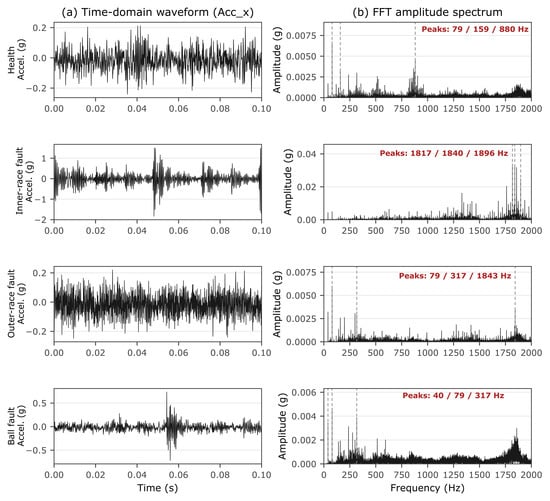
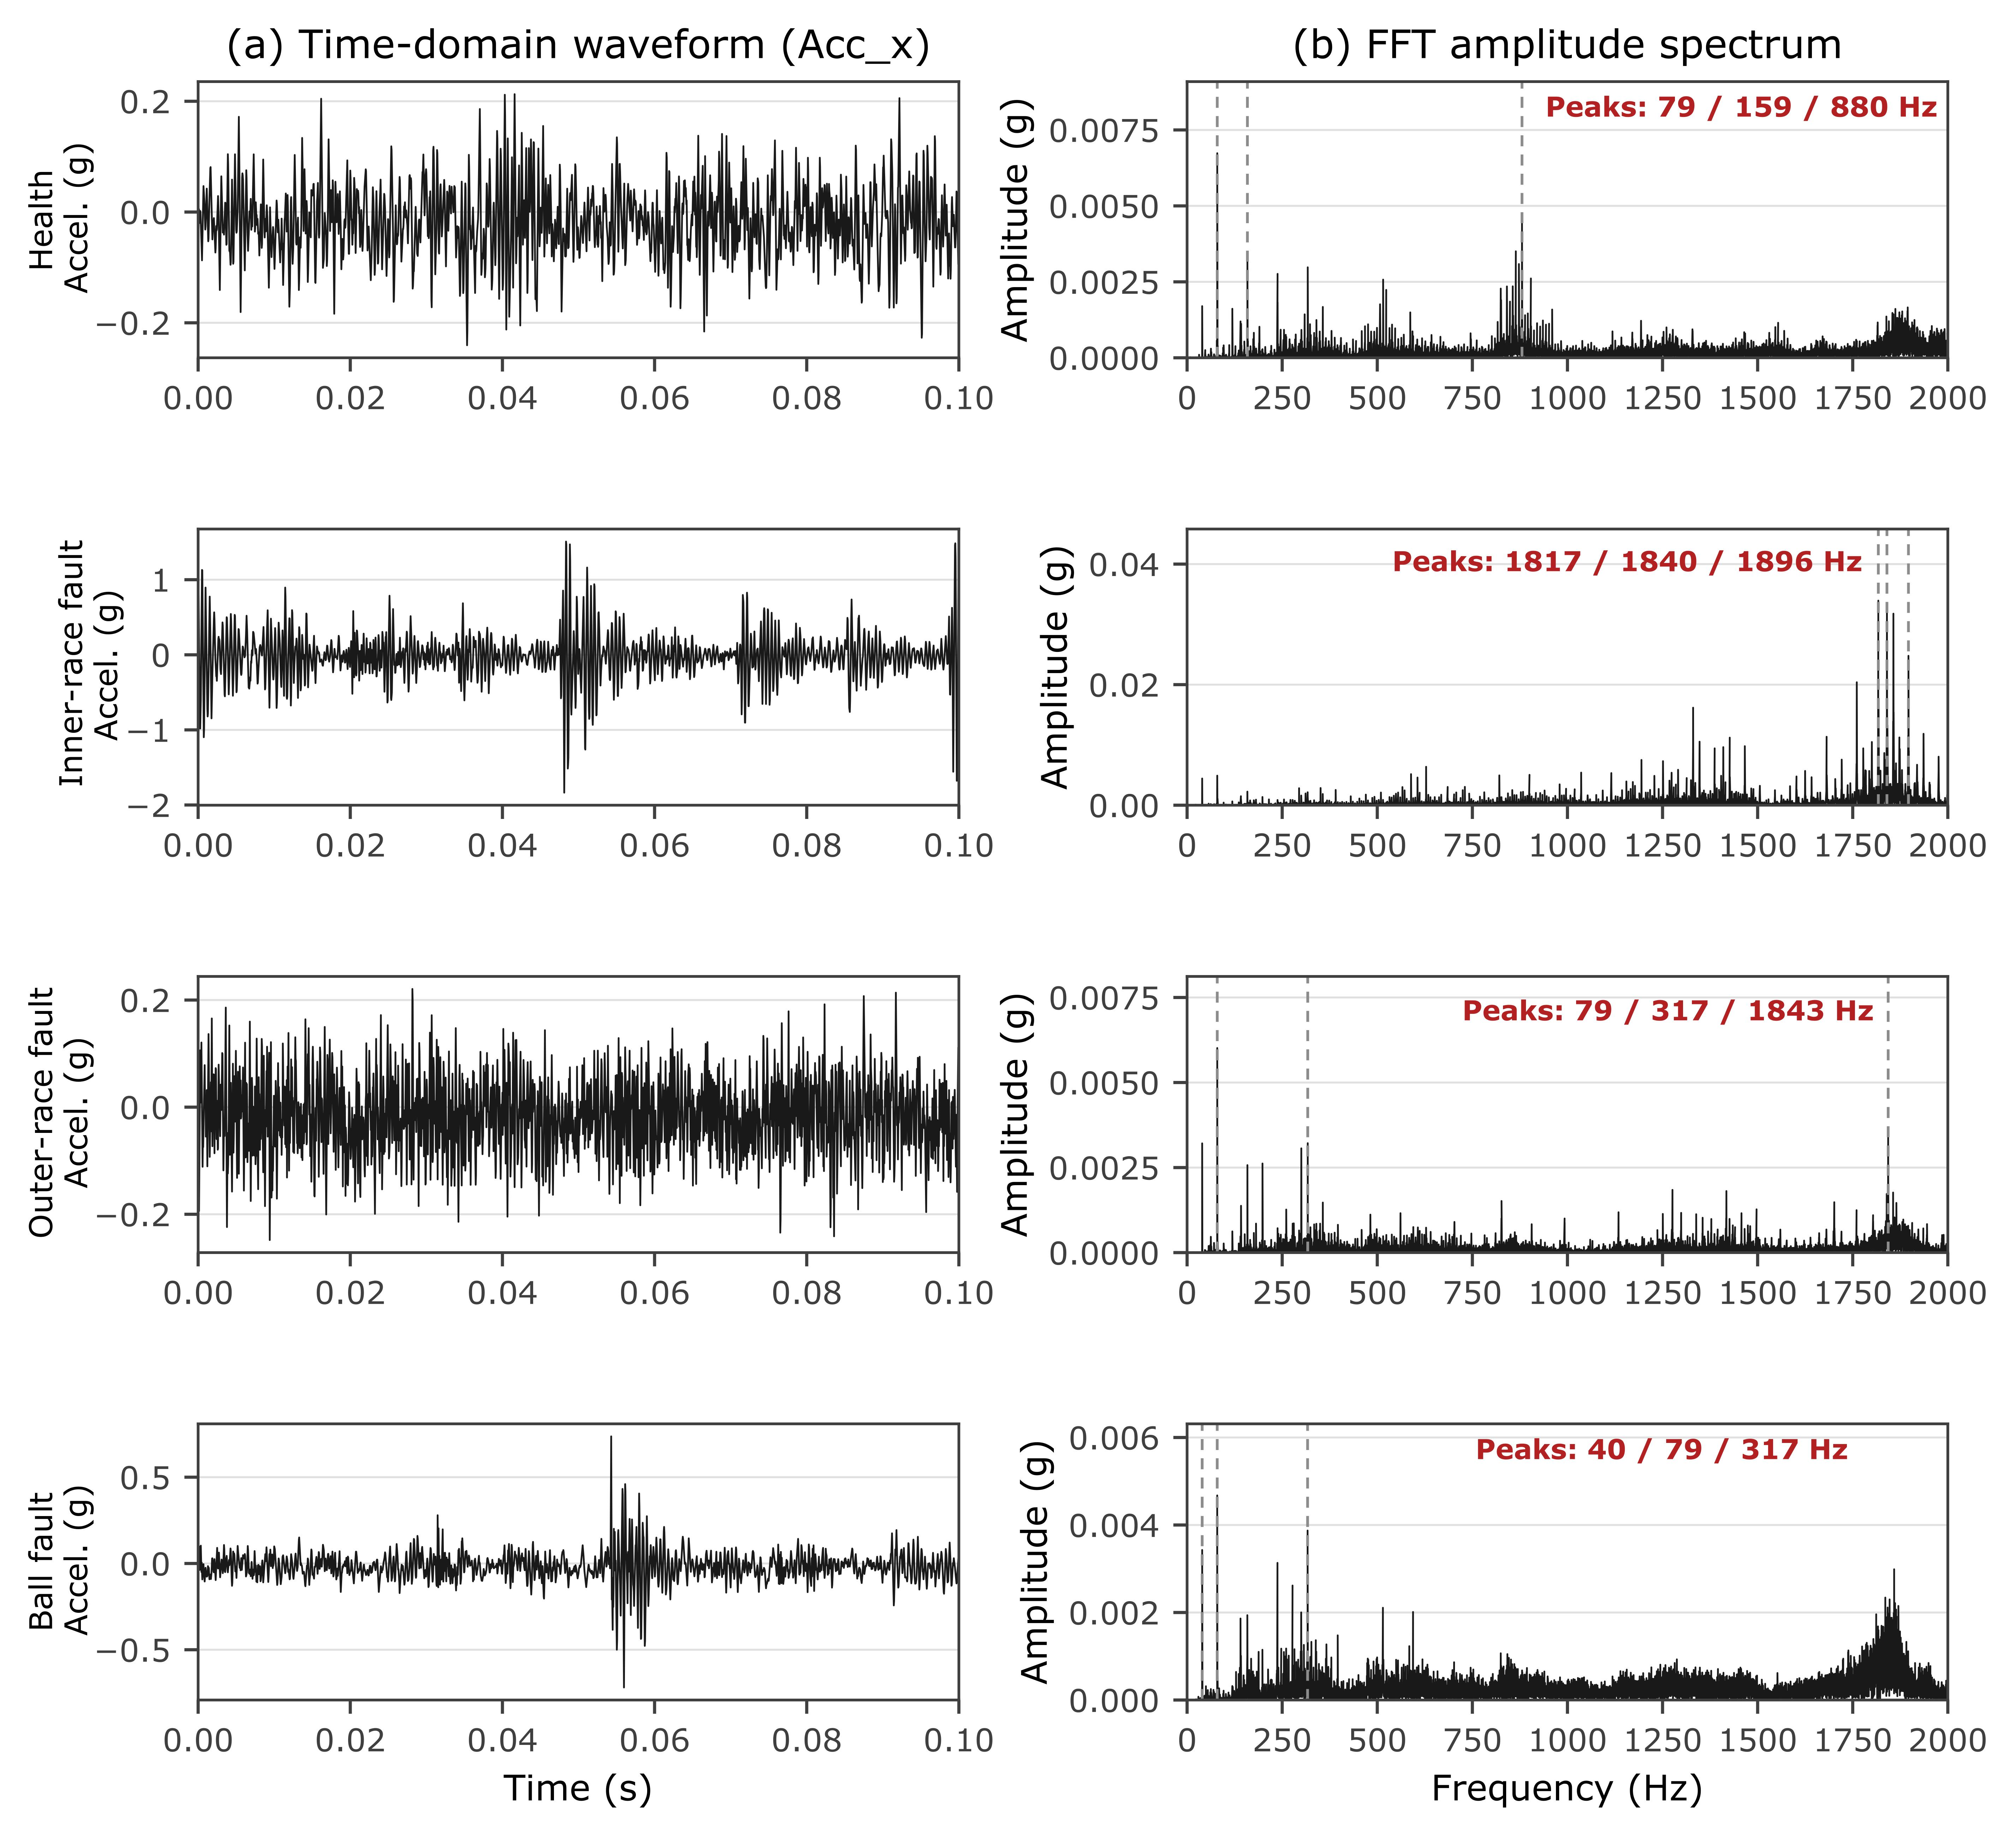
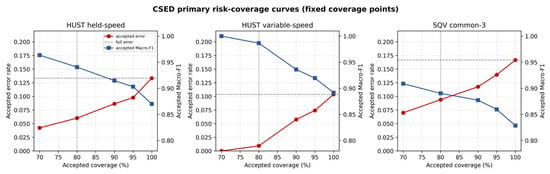
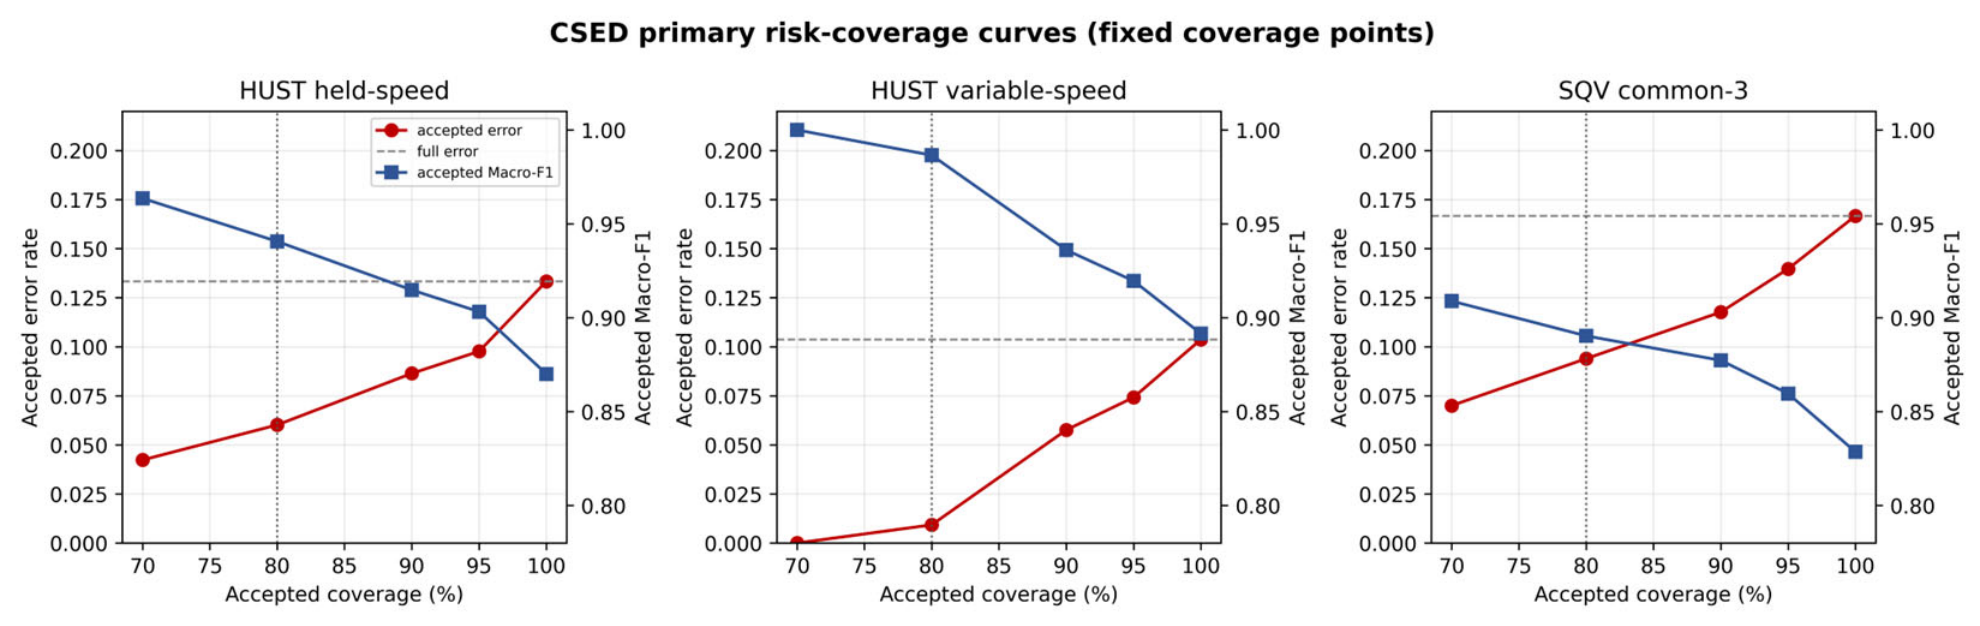
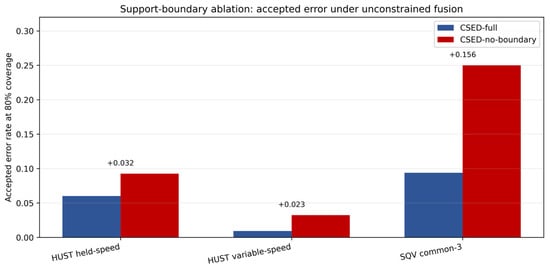
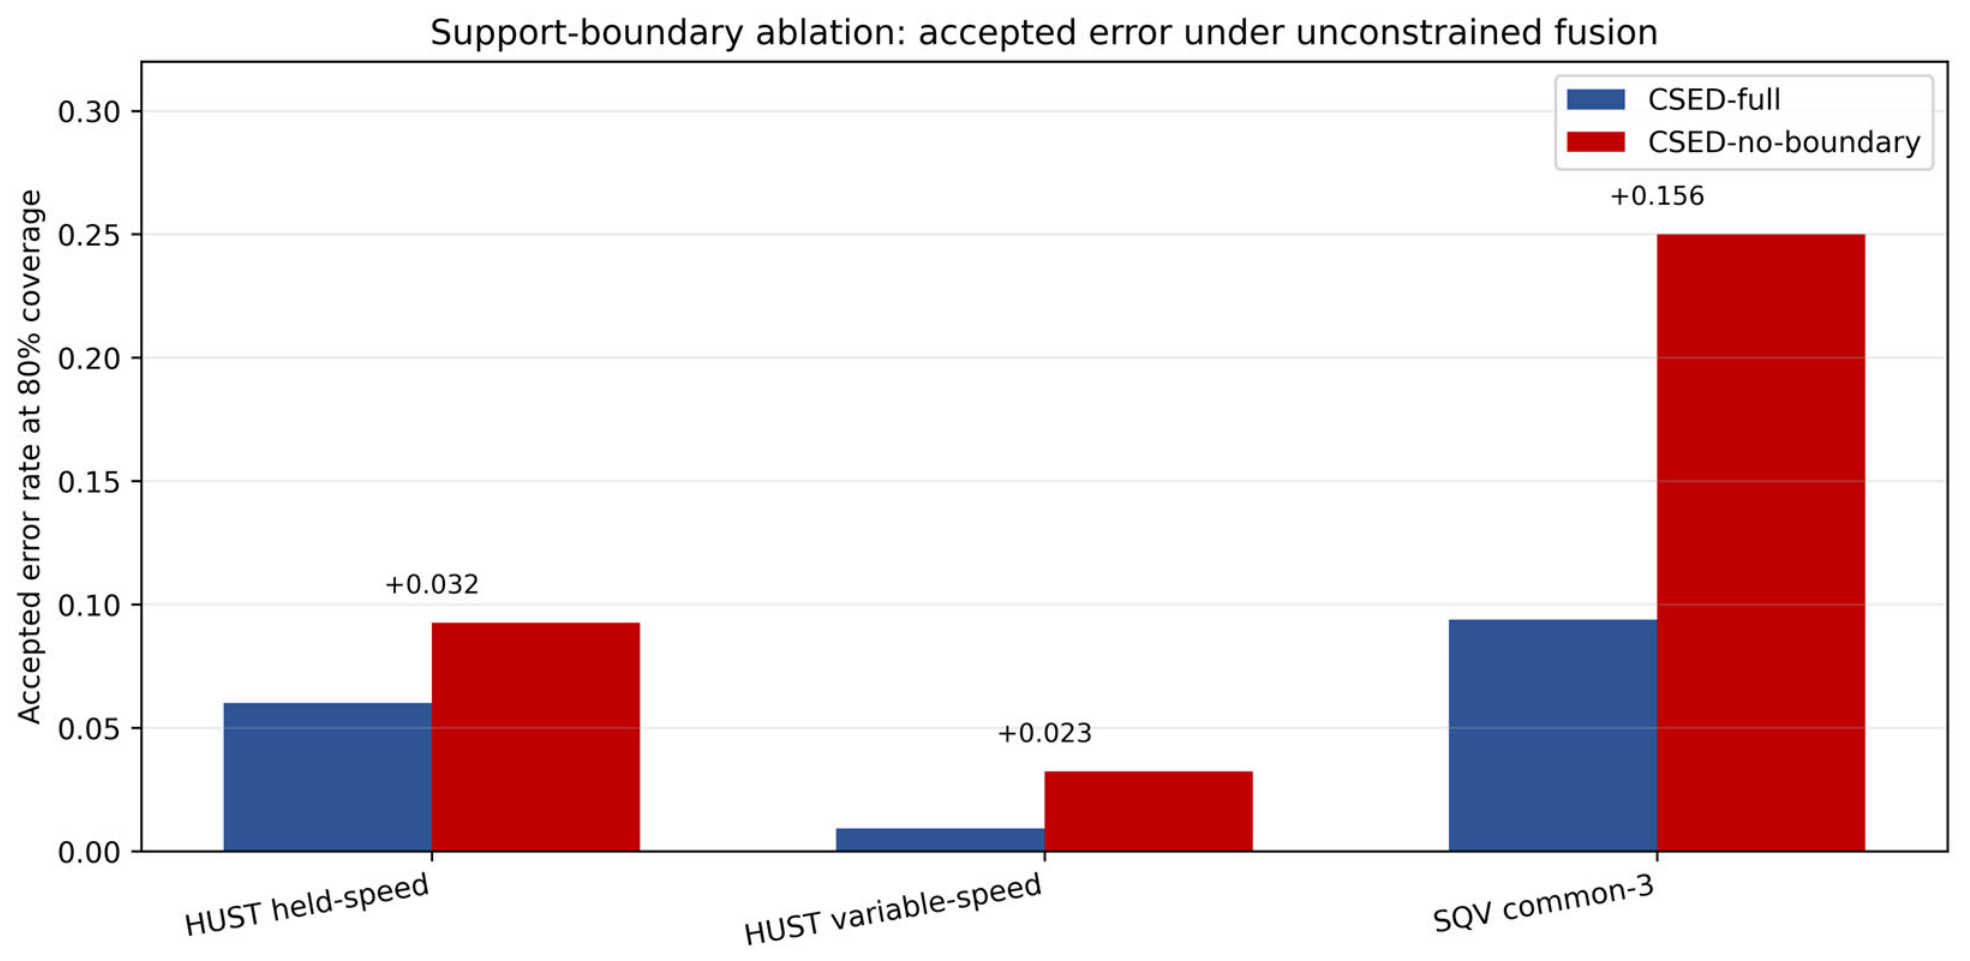
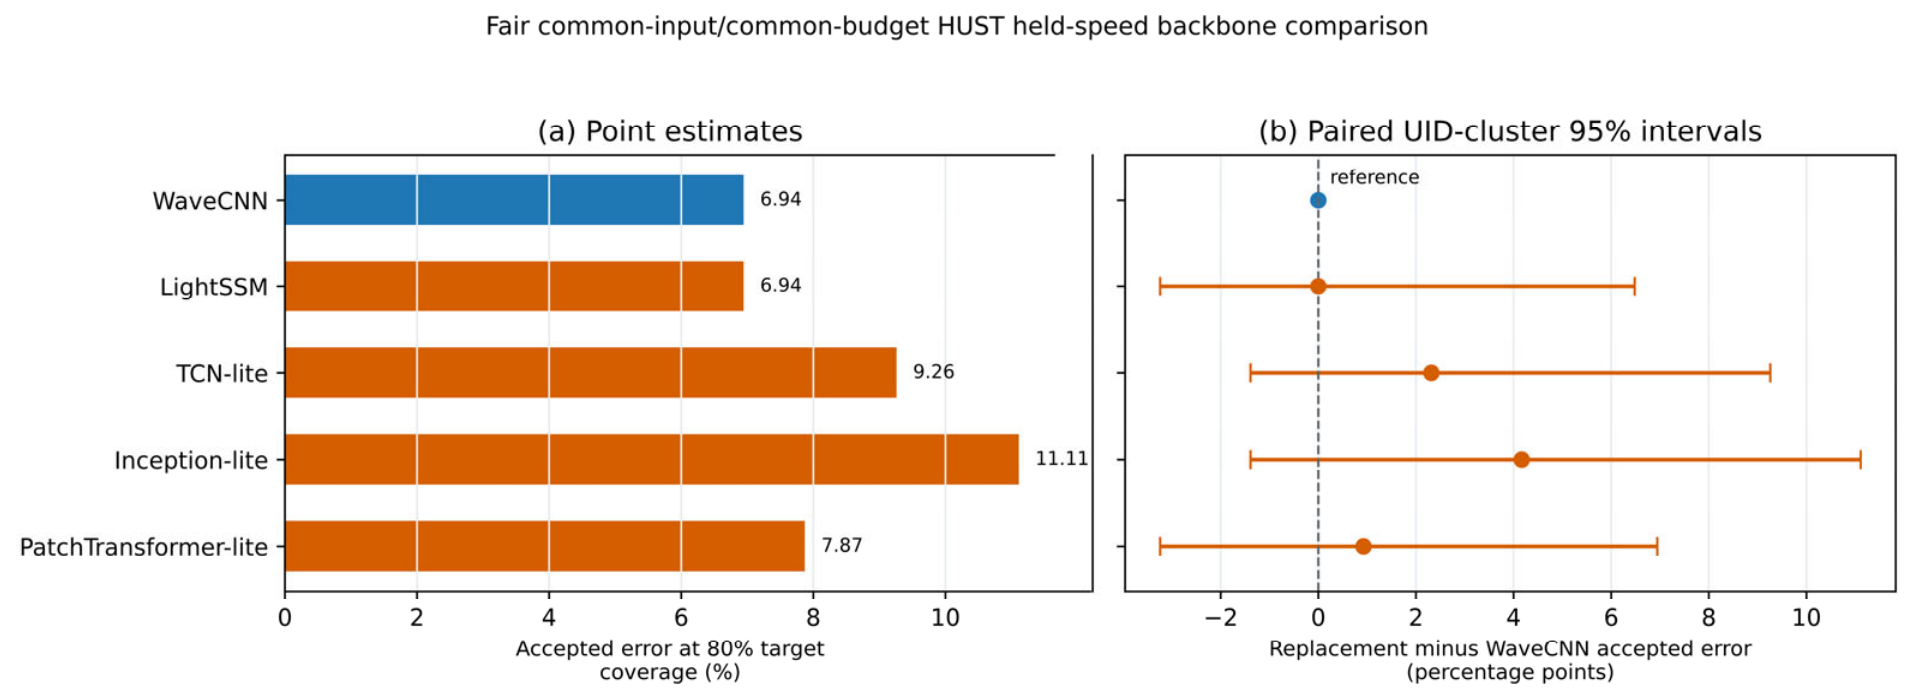

Disclaimer/Publisher’s Note: The statements, opinions and data contained in all publications are solely those of the individual author(s) and contributor(s) and not of MDPI and/or the editor(s). MDPI and/or the editor(s) disclaim responsibility for any injury to people or property resulting from any ideas, methods, instructions or products referred to in the content. |
© 2026 by the authors. Licensee MDPI, Basel, Switzerland. This article is an open access article distributed under the terms and conditions of the Creative Commons Attribution (CC BY) license.