


Abstract
Hydraulic transport through pipeline bends can redistribute particles and alter the pressure response in deep-sea mining lifting systems. This study examines coarse-particle transport through a vertical-to-horizontal elbow using a two-way coupled CFD–DEM framework. The framework is benchmarked at the component level against published horizontal-pipe, vertical-pipe, local particle-transport, and elbow pressure-drop data. We examine how feed concentration, particle diameter, particle gradation, and particle density affect local particle concentration, particle velocity, slip velocity, and pressure response. Under the investigated conditions, time-averaged local particle concentration generally exceeds feed concentration, indicating solids holdup within the monitored regions. A concentration minimum occurs within 2–3 pipe diameters downstream of the elbow, where bend-induced particle acceleration temporarily reduces local solids holdup. Feed concentration and particle density produce the largest changes in the apparent hydraulic gradient. Particle diameter and gradation have weaker effects at the tested mixture velocity of 3 m/s. Broader gradations reduce the downstream increase in local concentration and the attenuation of particle velocity. These results describe simulated transport trends across the vertical–bend–horizontal transition under the operating conditions studied.
1. Introduction
The deep ocean contains strategically important energy and mineral resources whose development poses demanding engineering challenges [1,2]. Seabed mineral resources such as polymetallic nodules, cobalt-rich crusts, and seafloor massive sulfides contain valuable metals and have attracted increasing attention as potential strategic resources [3,4,5,6]. The present study concerns the latter class of solid mineral resources. After ore particles are collected or crushed on the seabed, they must be conveyed reliably through a long lifting pipeline to the sea surface; the hydraulic transport process is therefore a central engineering issue in deep-sea mining.
Among the available ore-transport methods, hydraulic pipeline transport is widely regarded as a promising approach for deep-sea mining [4,5,6,7,8]. Seawater or slurry acts as the carrier phase, and the upward flow provides the hydrodynamic force required to transport mineral particles. Compared with straight pipelines, bends introduce additional complexity because the carrier flow must be redirected along the curved geometry [9,10,11,12,13,14,15,16,17,18,19,20,21]. When coarse particles enter a bend, particle inertia tends to maintain the incoming trajectory while the carrier fluid follows the pipe curvature. This kinematic mismatch intensifies particle-wall collisions, inter-particle interactions, local concentration redistribution, and flow-regime transition. Consequently, bends can become regions of greater hydraulic losses, local solids holdup, and changes in transport stability. Understanding particle transport through bends is therefore important for assessing hydraulic response and particle-flow transitions in lifting systems.
Previous experimental studies have provided useful insights into pressure drop, particle motion, and flow-regime evolution in pneumatic and hydraulic conveying bends [9,11,12,13,14,15,16,17,18,19,20,21]. These studies show that bend pressure drop is linked to momentum change, wall friction, particle-wall collision, conveying concentration, bend curvature, and pipe orientation, while non-uniform velocity profiles, secondary flow, particle redistribution, and flow separation are commonly observed. Nevertheless, many available studies focus on pneumatic conveying, dilute particle-laden flows, or macroscopic pressure drop measurements. For coarse-particle solid-liquid transport, especially under conditions relevant to deep-sea mining, experimental access to local particle concentration, particle velocity, slip velocity, and transient accumulation remains limited because the flow is opaque and highly unsteady.
Numerical simulation provides an effective complementary approach for analyzing particle-fluid mixture flows [22,23,24,25]. Two-fluid models treat the fluid and solid phases as interpenetrating continua and are computationally efficient, but their predictions depend on solid-phase closure relations and they do not directly resolve individual particle trajectories or contacts. CFD-DPM tracks particles in a Lagrangian framework but is generally more suitable for dilute conditions when inter-particle collision and local solids-volume effects are simplified. These limitations reduce the applicability of continuum or dilute-flow approaches to coarse-particle hydraulic transport, where particle inertia, collision, settling, and local accumulation can play important roles.
The coupled computational fluid dynamics-discrete element method (CFD–DEM) provides a suitable framework for coarse-particle hydraulic transport because the carrier fluid is solved by CFD while individual particles are tracked by DEM, allowing two-way momentum exchange, particle-particle collisions, particle-wall interactions, and local concentration evolution to be considered simultaneously [8,10,21,22,23,24,25,26,27,28]. However, coarse-particle transport through a vertical-to-horizontal bend remains insufficiently understood, particularly with respect to how particle-related parameters reorganize local concentration, particle velocity, slip velocity, flow pattern, pressure distribution, and apparent hydraulic response during the transition from vertical lifting to horizontal conveying.
The present study applies a two-way coupled CFD–DEM framework to investigate coarse-particle hydraulic transport through a vertical-to-horizontal bend at a representative mixture velocity for deep-sea mining lifting. The numerical framework is first assessed against published straight-pipe benchmarks and an elbow-specific hydraulic-conveying experiment. The subsequent analysis is organized around the transition from vertical lifting to bend-induced redirection and then to horizontal conveying, with emphasis on local concentration, particle velocity, slip velocity and hydrostatic-corrected hydraulic response. The objective is to establish a component-benchmarked application framework and clarify how particle properties reorganize transport behavior across the vertical-bend-horizontal transition under a controlled operating condition.
The remainder of this paper is organized as follows. Section 2 describes the governing equations, particle–fluid interaction models, contact model, and CFD–DEM coupling strategy. Section 3 presents the computational configuration, boundary conditions, numerical parameters, mesh-independence analysis, and component-level validation. Section 4 discusses the effects of feed concentration, particle diameter, particle gradation, and particle density on in-situ transport characteristics and hydrostatic-corrected apparent hydraulic gradient. Section 5 summarizes the main conclusions.
2. Mathematical Formulations
2.1. Governing Equations
The liquid phase is treated as an incompressible continuum and described by the volume-averaged Navier–Stokes equations [26,27]:
In the governing equations, represents liquid density, is liquid pressure gradient, signifies liquid velocity, refers to the acceleration of gravity, and is defined as the void fraction. The source term represents the momentum exchange from particles to fluid, thereby accounting for the two-way coupling feedback of the discrete particle phase on the continuous carrier phase.
The Navier–Stokes equations are discretized using the finite volume method (FVM). The convective term is discretized using a second-order upwind scheme, while transient computations are conducted with an implicit unsteady formulation incorporating second-order temporal discretization. The velocity components and the pressure field are resolved iteratively at each time step using the Semi-Implicit Method for Pressure Linked Equations (SIMPLE) algorithm, which couples the pressure-correction equation with the momentum equations.
Particle motion under hydrodynamic forces is simulated using a six-degree-of-freedom (6DOF) solver within a Lagrangian framework. In the DEM model, the translational and rotational motion of particle i follows Newton’s second law [26,28]:
where and are the particle mass and moment of inertia; and are the normal and tangential particle-particle contact forces, is the hydrodynamic force exerted by the surrounding fluid, is the body force (e.g., gravity). The torque terms include the additional rolling-resistance torque and the hydrodynamic torque .
2.2. Particle–Fluid Interaction Model
Particle–fluid interaction can be represented by Equation (5):
where , , , and are the drag force, the lift force, the pressure gradient force and the virtual mass force, respectively. In the present model, these components are retained because the particles are sufficiently large for inertia, gravity, local acceleration, and shear-induced effects to influence particle motion.
The drag force plays a critical role in interfacial interactions between particles and fluid. In this study, the Di Felice [29] correlation is employed because its voidage-dependent formulation continuously adjusts the drag response with local solids concentration. The Di Felice formulation has also been widely used within unresolved Eulerian–Lagrangian/CFD–DEM frameworks for particulate flows [26,27]. The model expresses the drag force as the product of the drag experienced by an isolated particle under equivalent volumetric flow conditions and a function of the void fraction.
where is the fluid velocity around the particle, is the particle diameter, is the void fraction around a particle, is the drag coefficient, is the particle Reynolds number. characterizes drag enhancement due to neighboring particles.
The lift force can be decoupled into the Magnus force and the Saffman force . The Magnus force arises primarily from the pressure difference across a rotating particle moving through a fluid medium. This force can be calculated using the expression provided by Sommerfeld [30].
where is the coefficient of Magnus lift force; is the particle-to-fluid angular velocity, ; is the rotational Reynolds number.
The Saffman force originates from the pressure asymmetry induced by fluid shear and is given by Equation (11) [30]. Given significant velocity gradients near pipe walls, this force is retained in simulations:
where is the shear lift coefficient; is the shear Reynolds number; is an empirical function of and can be calculated as follows:
The virtual mass force accounts for the additional inertial resistance experienced by the particles undergoing acceleration, and can be calculated by Equation (14) [31]:
For spherical particles in incompressible fluid, the virtual-mass coefficient is taken as = 0.5. is the particle volume.
The pressure gradient force refers to the additional force generated by particles in a fluid with a pressure gradient, which is opposite to the direction of the fluid pressure gradient. The expression is as follows:
The applicability of the particle–fluid force closures should be interpreted at the engineering-model level. The Di Felice drag model explicitly accounts for local voidage and provides a physically relevant voidage correction for the relatively concentrated particle transport considered here, while the pressure-gradient force is a standard continuum contribution and the virtual-mass term with = 0.5 provides a conventional approximation for spherical particles. The Saffman and Magnus lift terms, however, should not be regarded as exact particle-scale force laws under the present coarse-particle, turbulent and locally concentrated conditions. They are retained as empirical/engineering closures for shear- and rotation-induced transverse effects, as commonly done in CFD–DEM simulations of concentrated particle transport. Accordingly, the present model is not used to quantitatively decompose the individual microscopic force contributions. Its applicability is assessed primarily from the agreement of macroscopic statistical quantities, including mean particle velocity, local concentration, and hydraulic response, with available experiments.
2.3. Contact Model in DEM
The Hertz–Mindlin contact model was used for contacts between spherical particles. This granular model uses the following formula for the frictional force between two spheres with radius and when their central distance is less than the contact distance . There is no force between the particles when . The normal and tangential contact forces are given by:
The normal contact force depends on the normal overlap , normal relative velocity , normal stiffness , and normal damping coefficient . The tangential contact force depends on the tangential overlap , tangential relative velocity , tangential stiffness , tangential damping coefficient , and static friction coefficient . The detailed descriptions of the Hertz–Mindlin contact model can be found in Johnson [32], Di Renzo et al. [33], and Tsuji et al. [34]. This contact model enables particle-particle and particle-wall collisions to be included in the prediction of accumulation, moving-bed formation, and energy dissipation.
2.4. Coupling Scheme of CFD–DEM
A two-way coupling scheme is implemented in the numerical simulations. DEM resolves particle motion at the individual particle scale, while CFD computes fluid flow at the computational mesh scale. At each time step: (1) DEM provides particle position and velocity data to CFD, which calculates local void fractions and fluid-particle interaction forces in each mesh cell; (2) CFD solves the flow field and returns hydrodynamic forces to DEM; (3) DEM updates particle motion using these coupling forces for the next time step [35,36]. By Newton’s third law, forces exerted on particles are equal and opposite to those acting on the fluid phase.
3. Numerical Method
3.1. Computational Overview
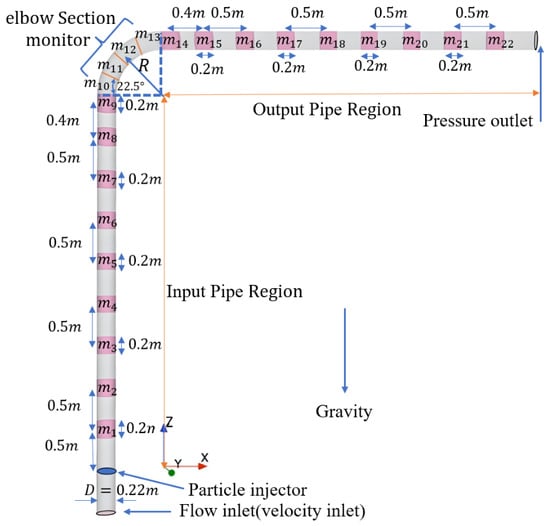
In the present study, the baseline vertical-bend-horizontal pipeline consists of a 90-degree bend with a curvature radius of 0.66 m, connecting 5.5 m upstream and 5.0 m downstream straight sections, as shown in Figure 1. The inner diameter is 0.22 m. The 5.0 m downstream section corresponds to approximately 22.7 D and provides the spatial extent over which the post-bend redistribution and subsequent downstream development are examined in this study. The post-bend concentration trough occurs within approximately 2–3 D of the bend outlet, after which concentration recovery and downstream particle-transport development are tracked over the remaining monitoring locations. The objective is therefore to resolve the vertical–bend–horizontal transition and its downstream evolution rather than to extend the computational domain until an asymptotically fully developed far-downstream state is reached.
Figure 1.
Computational geometry and monitoring sections.
The boundary conditions of the numerical model are illustrated in Figure 1. A velocity inlet condition is applied at the bottom of the computational domain to drive the carrier fluid. To ensure successful model initialization, the particle inlet is positioned 0.5 m above the fluid inlet. The fluid inlet velocity, , is prescribed, while the feed concentration, , is controlled by adjusting the particle injection rate at the particle inlet. A pressure outlet condition is imposed at the downstream end of the domain to allow the mixture to exit freely. The pipe wall is modeled as a no-slip boundary with an equivalent hydraulic roughness 0.2 mm in the CFD wall treatment, consistent with the initial design for field trials. Figure 1 also shows the monitoring regions used to characterize the spatial distribution of in-situ flow properties.
The initial mixture velocity is defined as the superficial seawater–particle mixture velocity at the pipe inlet and is calculated as follows:
where and represent the inlet volumetric flow rates of the mixture, particles, and fluid, respectively, and A denotes the cross-sectional area of the passage in the pipe. The feed concentration is calculated as follows:
To quantify in-situ flow characteristics, 22 monitoring sections are distributed along the pipeline, as shown in Figure 1. Each monitoring region in the straight pipe sections has a streamwise length of 0.2 m, while the elbow section is angularly divided into four monitoring segments. The monitored quantities include local particle concentration , particle velocity , slip velocity and pressure. Unless otherwise stated, these quantities refer to time-averaged values. Gravity is included in the simulation.
At each monitoring region, the local particle concentration is defined on a monitoring-volume basis as the particle volume contained in that region divided by the monitoring-region volume; it differs from the feed concentration. Particle velocity is the mean particle velocity at each monitoring region. Slip velocity is the mean velocity lag of particles relative to the carrier fluid within each monitoring region.
The simulations are performed using an unresolved CFD–DEM framework, where hydrodynamic particle–fluid interactions are computed based on cell-averaged fluid fields. For the selected mesh ( = 29.3), the nominal cell size is approximately 7.5 mm. Thus, ranges from approximately 0.67 to 3.33 for = 5–25 mm and is approximately 2.0 for the 15-mm benchmark case. For the mesh adopted herein, particle diameters are comparable to the CFD cell size. To regularize coupling when particles are comparable to the CFD cell size, a source-term smoothing scheme available in the CFD solver is employed [37]. Neighboring cells were combined into a composite cell; fluid velocity and pressure were averaged over its subcells, and the particle–fluid force was redistributed using the same weights. The smoothing settings were held fixed across all cases. The smoothing treatment was used as a consistent numerical regularization of two-way momentum exchange rather than as an independently calibrated physical parameter.
The carrier fluid is seawater with a density of 1025 kg/m3 and a dynamic viscosity of 0.0015 Pa·s. Turbulence in the liquid phase is modeled using the realizable k–ε model. The model is retained as an engineering RANS closure because realizable k–ε has shown reasonable predictions of mean velocity and pressure drop behavior in turbulent 90° bend flows, while maintaining the numerical robustness required for the present transient two-way CFD–DEM calculations [38,39]. Because eddy-viscosity RANS models do not resolve all curvature-induced turbulent structures, the present analysis does not interpret fine-scale turbulence statistics; conclusions are based primarily on mean flow redistribution, particle kinematics, local accumulation, and hydraulic response. During the simulations, the convective Courant number remains below 1.0 in most computational cells. The crushed ore particles are simplified as spheres. The benchmark particle diameter is 15 mm, and the benchmark particle density is 2000 kg/m3. To systematically evaluate parameter effects, the feed concentration varies from 4% to 12%, the particle diameter varies from 5 to 25 mm, the particle density varies from 1500 to 2500 kg/m3, and the standard deviation of the particle gradation varies from 0 to 0.006 m. The initial mixture velocity is fixed at 3 m/s unless otherwise stated. Detailed particle properties, fluid–particle interaction models, and the corresponding DEM parameters are provided in Table 1.
Table 1.
Liquid and solid-phase parameters used in the present study.
The DEM contact properties were based on related deep-sea hydraulic-transport CFD–DEM studies [40,41] and were fixed across all cases. They were not calibrated against the specific ore–pipe material pair. The results therefore describe comparative trends for the selected contact-property set and should not be interpreted as material-specific quantitative predictions.
In the two-way CFD–DEM coupling, the particle integration step is constrained by characteristic contact time scales, including the Rayleigh time scale [32,33,34], and is much smaller than the CFD time step.
For the benchmark case with = 15 mm, ≈ 1.19 × 10⁻⁴ s according to the particle properties used in the simulations. In the present study, the DEM time step is determined by = , where the coefficient for Rayleigh time = 0.2 is adopted.
3.2. Convergence Study
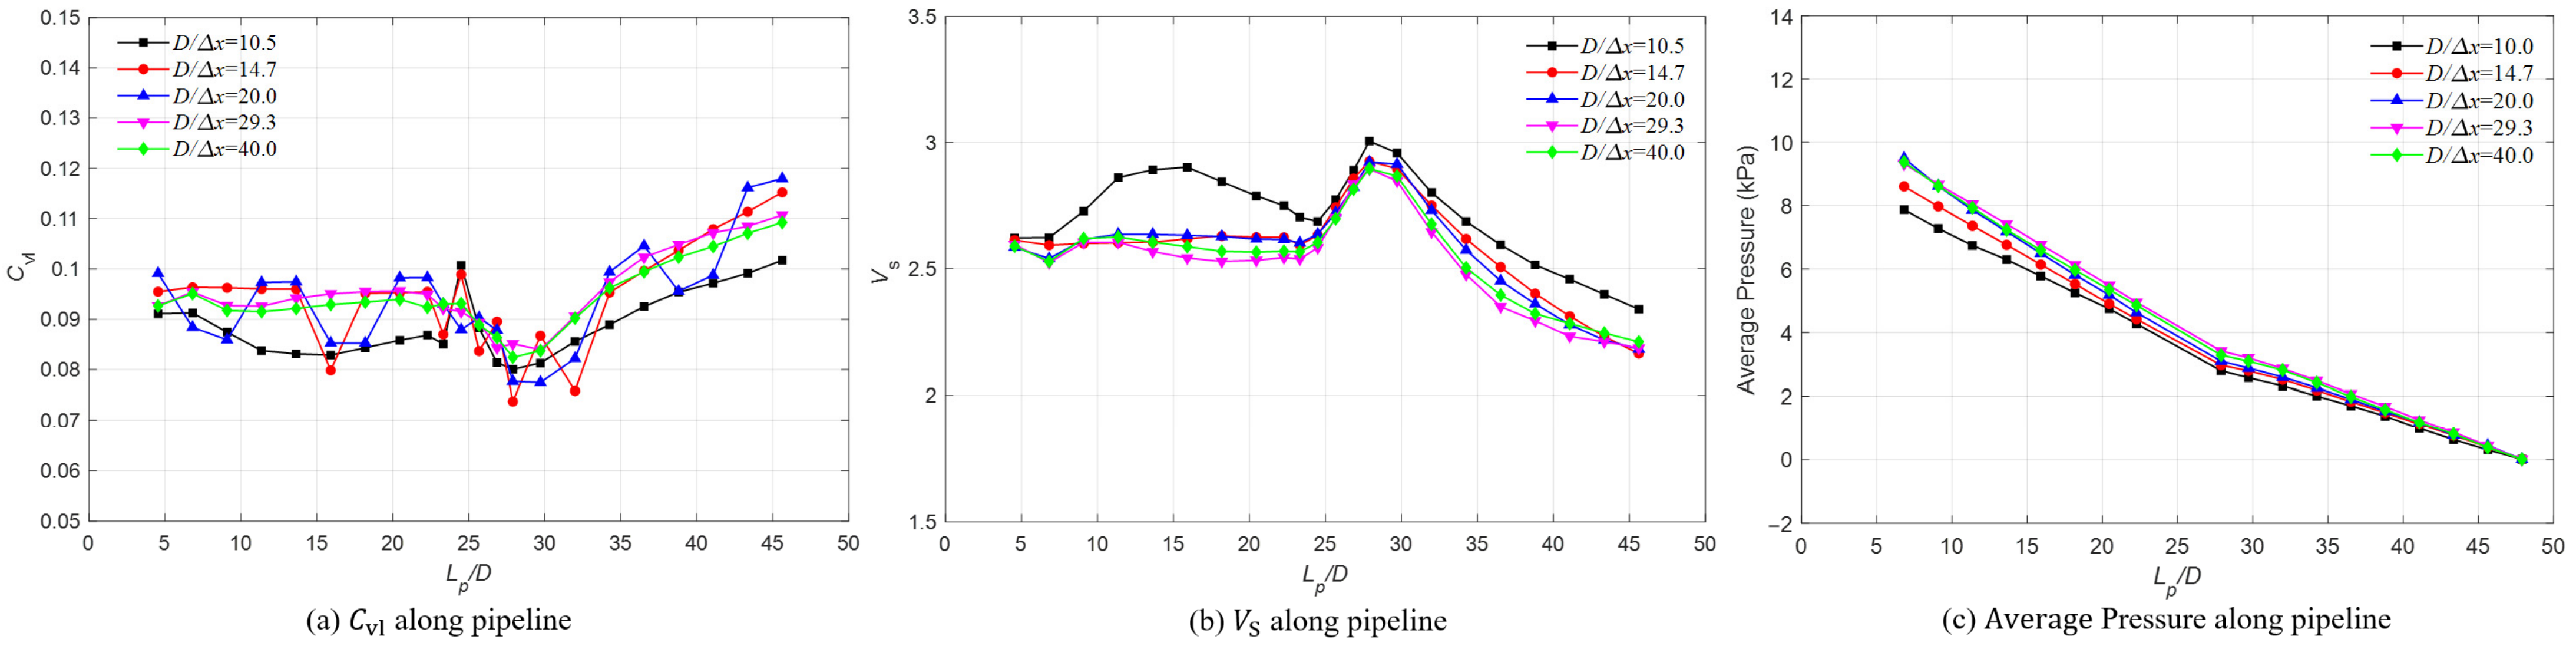
A mesh-independence study was conducted for the benchmark condition (mixture velocity 3 m/s, feed concentration 8%, particle diameter 15 mm, and particle density 2000 kg/m3) using five resolutions, = 10.5, 14.7, 20, 29.3, and 40, shown in Figure 2. The finest mesh ( = 40) was used as the reference. Quantitative convergence was evaluated for the complete monitored , , and pressure-distribution profiles using a global relative error, shown in Table 2. For the selected = 29.3 mesh, the respective errors are 1.85%, 1.13%, and 2.13%. Over the final monitored downstream interval from 3.5 to 4.0 m, changes by 2.07% and by 1.16%. The selected mesh was therefore retained as a reasonable balance between accuracy and computational cost for the quantities and domain examined.
Figure 2.
Mesh-independence study.
Table 2.
Global relative errors using = 40 as the reference.
Global relative L2 error:
where is the vector obtained with the mesh being evaluated, is the corresponding vector obtained with = 40, and N is the number of available monitoring quantities for the variable considered. This metric measures the overall difference in the full spatial response.
3.3. Component-Level Validation Study
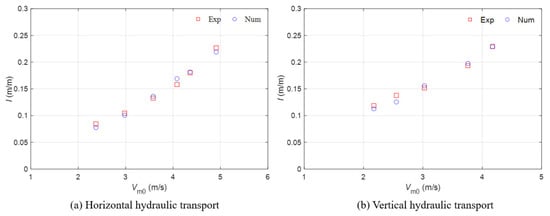
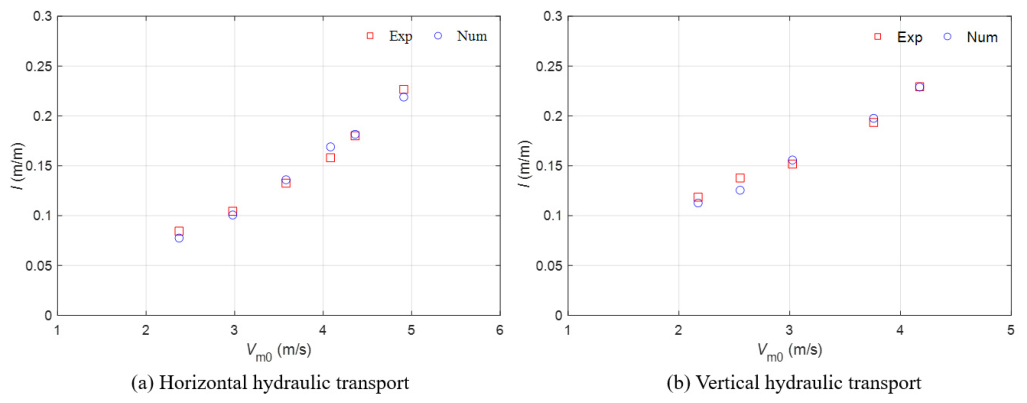
To assess the numerical framework at the component level, the hydraulic response is first compared with the horizontal-pipe measurements [42] and the vertical-pipe measurements [43] in Figure 3. The predicted hydraulic gradients agree with the published data, with a maximum deviation of approximately 8%. These cases benchmark the global hydraulic response under two canonical pipe orientations.
Figure 3.
Component-level benchmark comparison of hydraulic gradient. The numerical results are compared to the experimental data from (a) Ravelet et al. [42] ( = 5 mm, = 0.1 m, = 5% and = 2500 kg/m3); (b) Xia et al. [43] ( = 15 mm, = 0.1 m, = 5% and = 2000 kg/m3). Experimental data were digitized from Refs. [42,43] and independently replotted by the authors; numerical results were obtained in the present study.
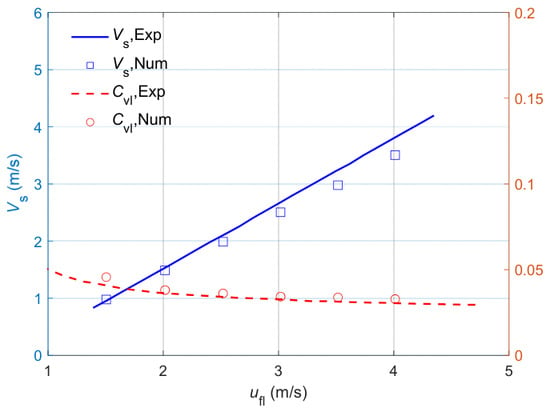
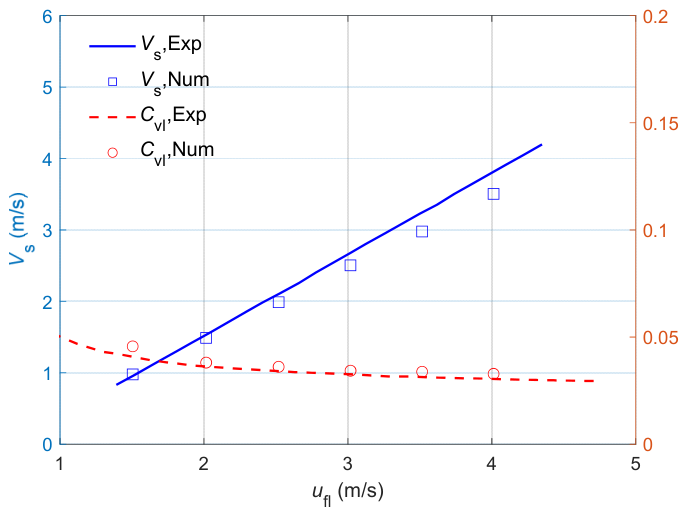
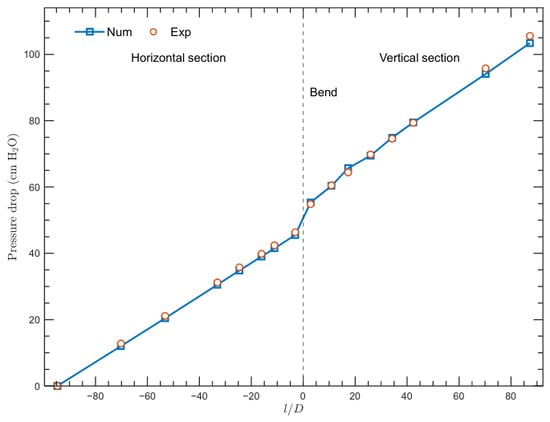
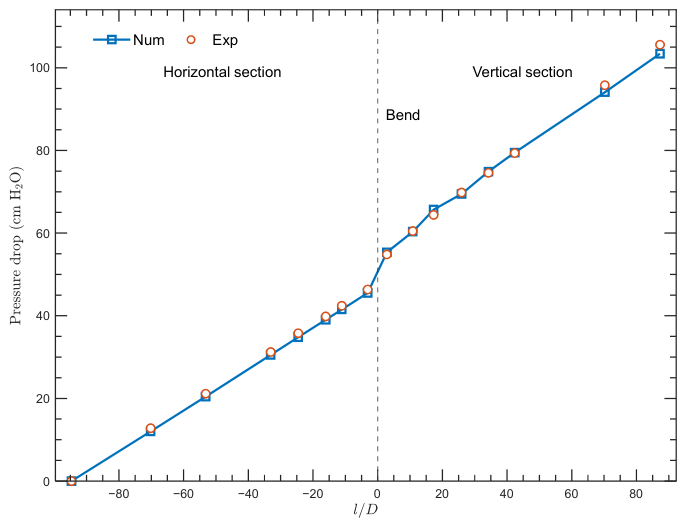
A third component-level case evaluates local particle characteristics in vertical transport. The predicted particle velocity and local concentration reproduce the trends measured by Engelmann [44] (Figure 4). A further bend-specific case compares pressure drop with the experiments of Toda et al. [45]. Figure 5 shows close agreement with the measured pressure-drop development across the straight sections and bend. These benchmark geometries differ from the complete vertical–bend–horizontal system studied in Section 4.1, Section 4.2, Section 4.3, Section 4.4 and Section 4.5. No matched experimental measurements are available for the complete configuration at the operating conditions considered. The comparisons therefore provide component-level benchmarks, not full-system validation. Accordingly, the system-level results should be interpreted as comparative numerical trends under the tested conditions, not as validated quantitative predictions for the full configuration.
Figure 4.
Component-level benchmark comparison of local particle characteristics. The numerical results are compared to the experimental data from Engelmann [44] ( = 13 mm, = 0.2 m, = 2.83% and = 2300 kg/m3). Experimental data were digitized from Ref. [44] and independently replotted by the authors; numerical results were obtained in the present study.
Figure 5.
Component-level benchmark of pressure drop. The numerical results are compared with the experimental data of Toda et al. [45] ( = 0.99 mm, = 30.2 mm, = 1.195%, = 2.18 m/s, and = 2500 kg/m3). Experimental data were digitized from Ref. [45] and independently replotted by the authors; numerical results were obtained in the present study.
3.4. Numerical-Model Limitations and Uncertainty
The results should be interpreted in light of several limitations. The ore particles were represented as spheres, which cannot fully capture the angularity, interlocking, and orientation-dependent contacts of real particles. This simplification may affect particle packing, bed formation, and transport. The realizable k–ε RANS model captures mean flow but does not resolve all bend- and particle-induced turbulent structures.
The particle-force and contact models and their parameters were selected based on established formulations and reported values. However, they have not been independently validated for the specific ore–pipe system and operating conditions considered here. The results should therefore be interpreted in the context of the selected mechanical models and parameter set.
All simulations were conducted at a flow velocity of 3 m/s, so the results do not establish trends or predictive performance at other velocities. Validation covered individual components, but experimental data were unavailable for the complete vertical-to-horizontal pipeline configuration. The integrated system has therefore not been validated, and conclusions for that configuration should be limited to comparative numerical trends under the conditions studied.
4. Results and Discussion
In hydraulic transport of mineral particles, feed concentration, particle diameter, density, and particle gradation can alter particle redistribution and hydraulic response. The present simulations therefore compare these parameters while keeping the mixture velocity fixed at 3 m/s. The discussion covers the in situ flow characteristics, pressure responses, and flow patterns derived from the CFD–DEM model.
4.1. Temporal and Spatial Distribution of , , and Pressure
The following analysis examines temporal and spatial changes in the particle–fluid mixture across the vertical–bend–horizontal pipeline. The benchmark parameters employed for this analysis are listed in Table 1.
4.1.1. Temporal Distribution of , , and Pressure
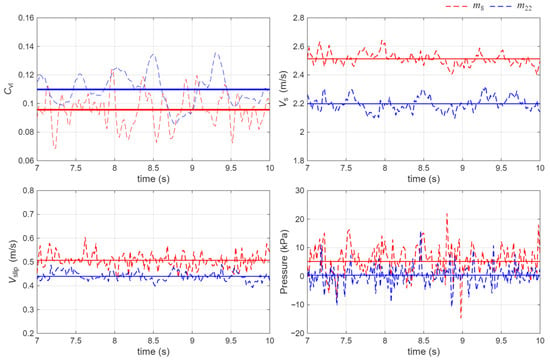
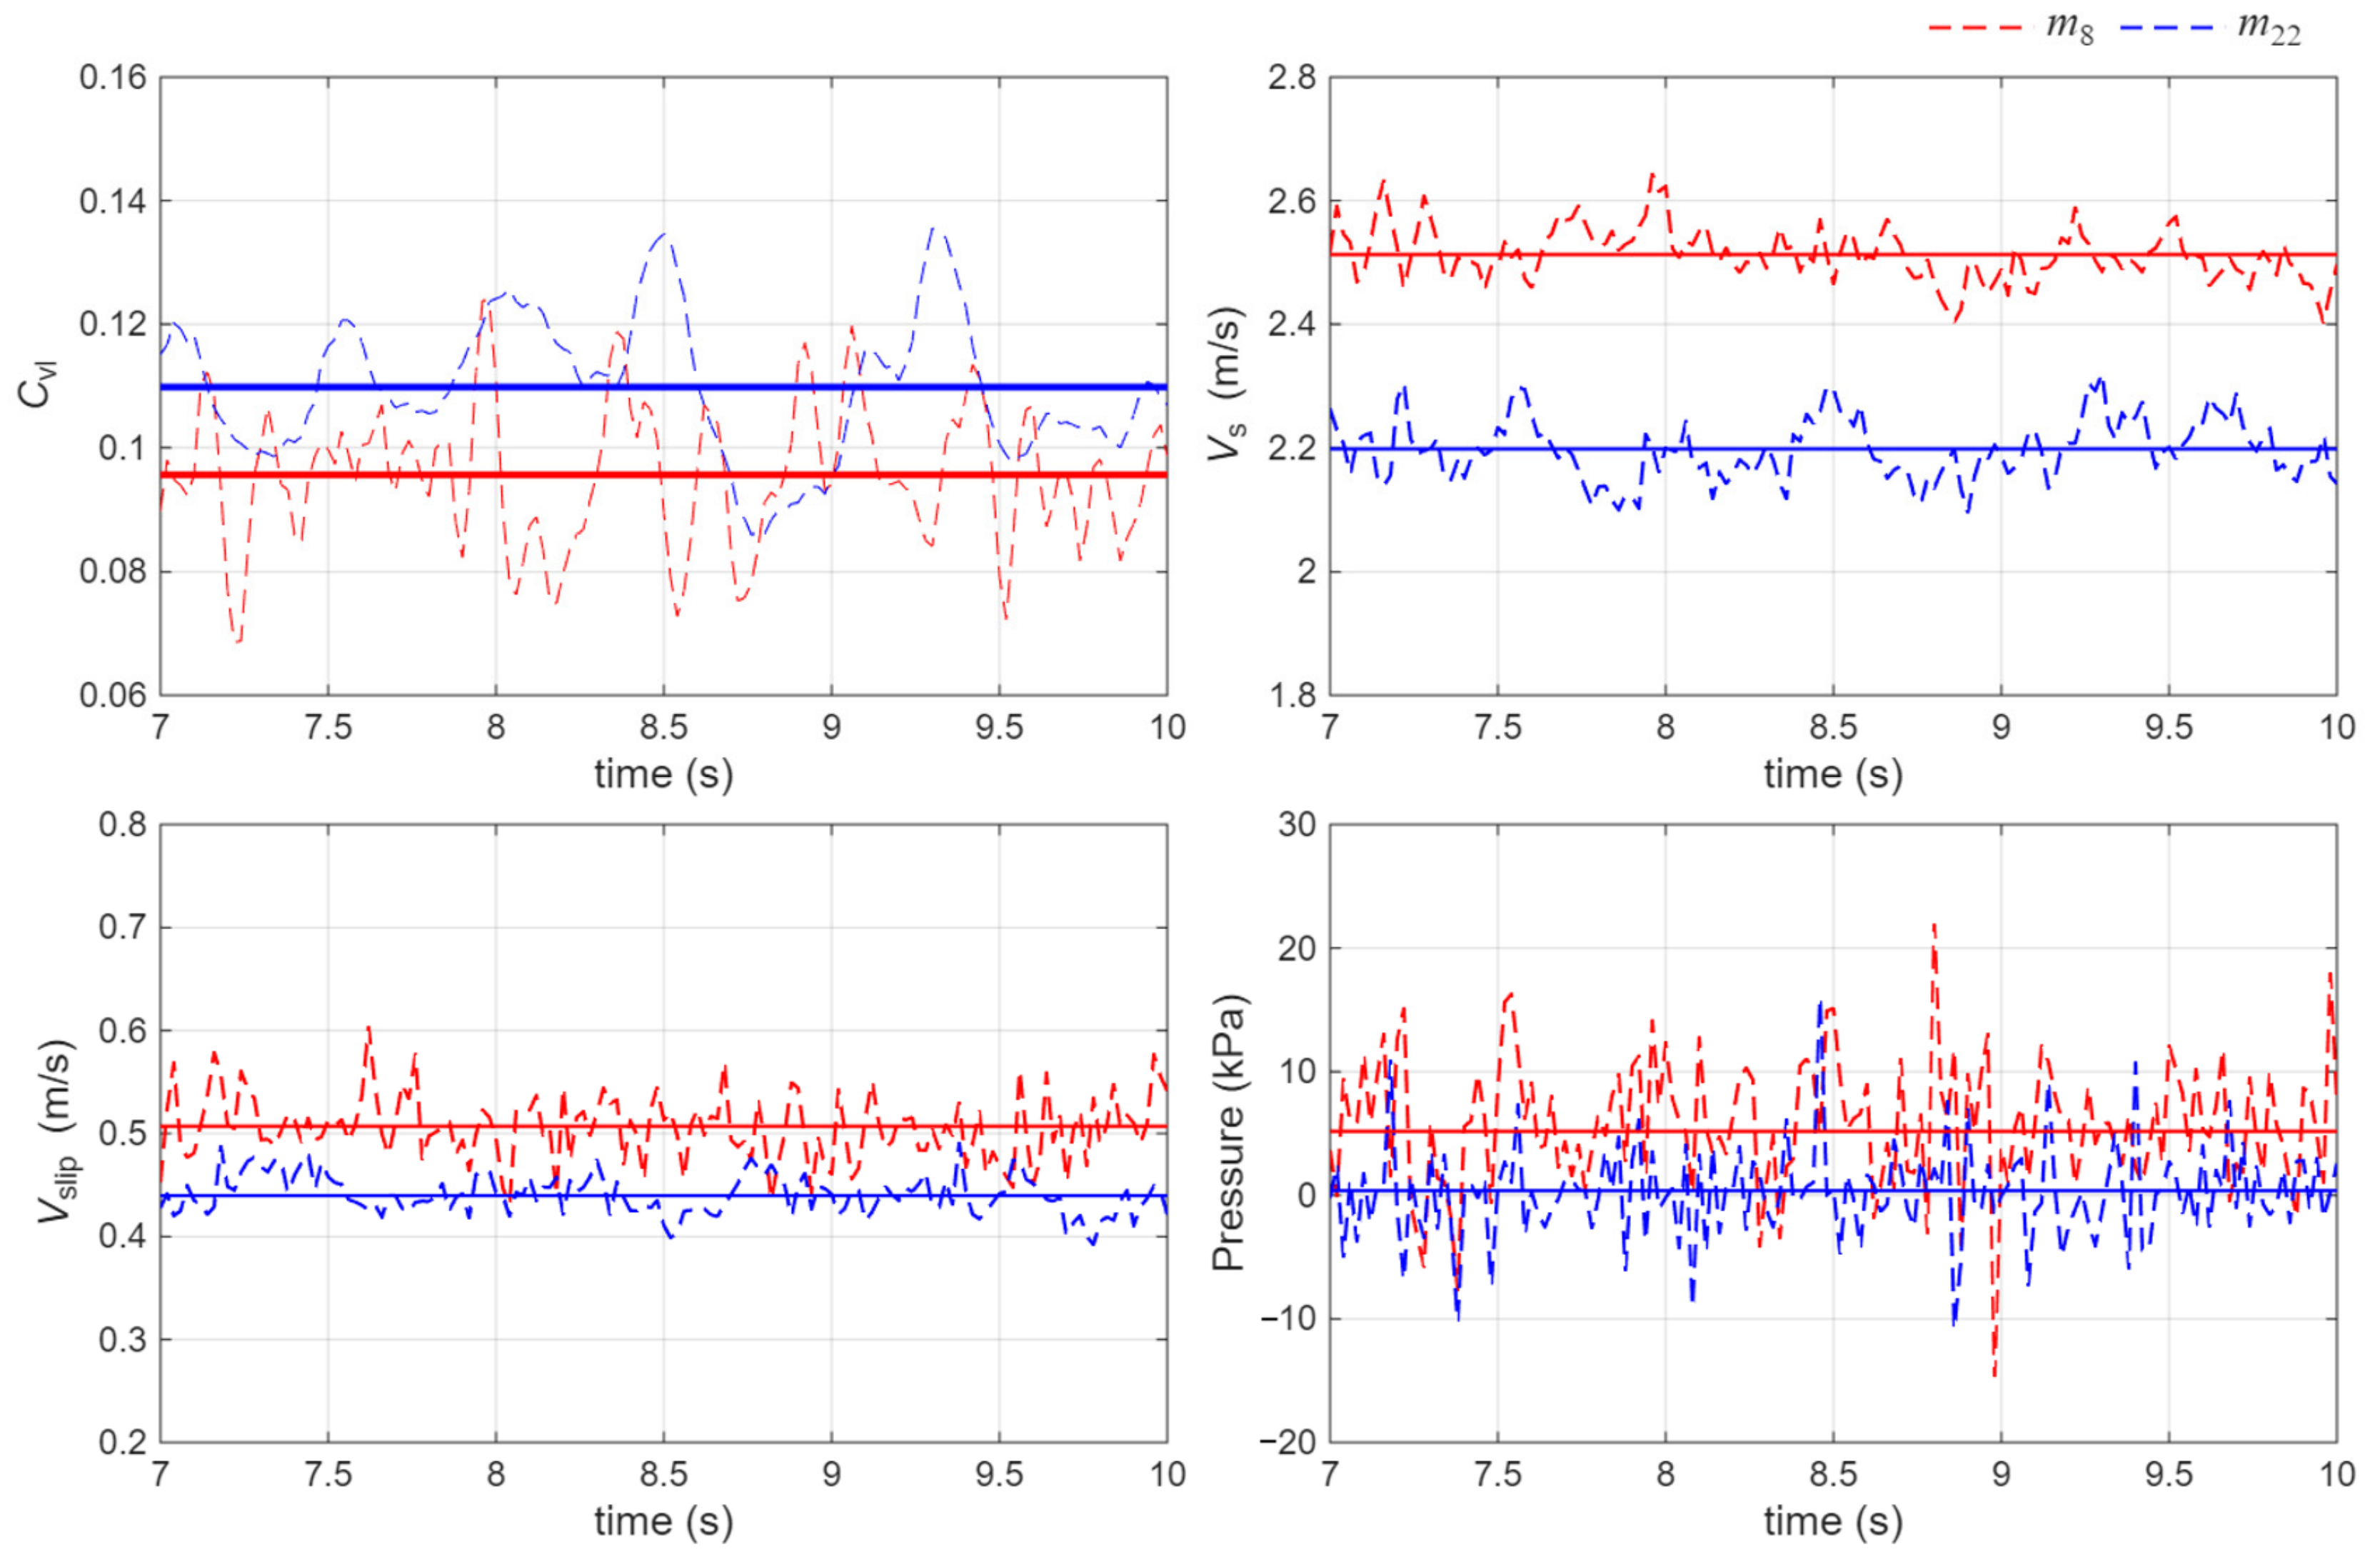
Figure 6 shows the instantaneous signals at monitoring regions m8 and m22. After about 7 s, the signals fluctuate around approximately stable mean levels. We compared the original 7–10 s means with the 9–12 s and 7–12 s means at both locations (Table 3). For , , and , the largest relative deviation from the 7–10 s mean was 1.93%. The largest absolute pressure difference was 14.3 Pa at m22, between the 7–10 s and 7–12 s means. These comparisons show limited sensitivity of the reported means to the tested windows at m8 and m22; they do not establish stationarity throughout the full domain. The 7–10 s interval was retained for the parametric analysis.
Figure 6.
Time traces of local concentration , particle velocity , slip velocity and pressure at the monitor region m8 (/ = 20.45) and m22 (/ = 45.62). The red dashed line denotes m8, the blue dashed line denotes m22, and the solid horizontal lines indicate the corresponding 7–10 s mean values.
Table 3.
Comparison of monitored means across sampling intervals.
At a feed concentration of 8%, the maximum instantaneous local particle concentration, , is 0.117 at m8 and 0.132 at m22, corresponding to approximately 1.46 and 1.65 times the feed concentration, respectively. These are instantaneous peaks, not time-averaged concentrations. Monitoring region m8 is close to the upstream side of the bend; its peak is mainly associated with transient particle clustering superimposed on gravity- and bend-driven spatial redistribution. Monitoring region m22 is far downstream of the bend; its peak is mainly associated with particle settling and moving-bed formation in the horizontal section.
4.1.2. Spatial Distribution of , and
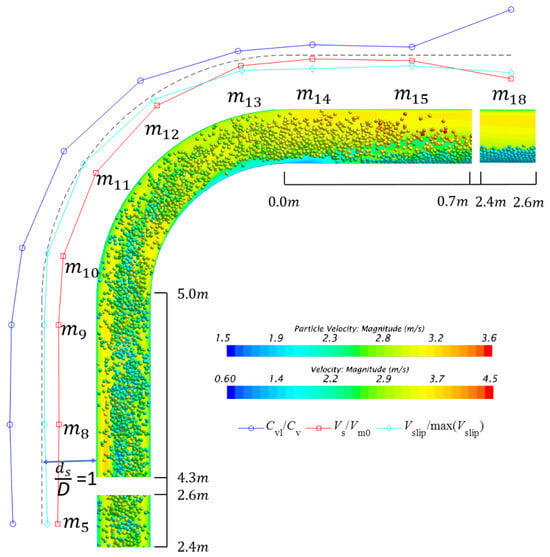
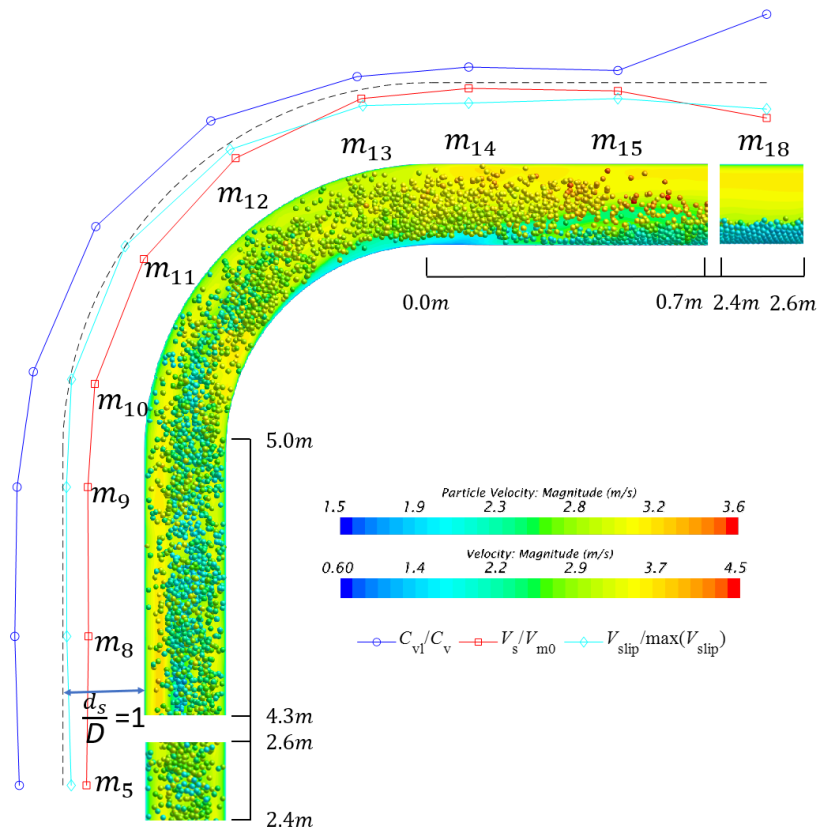
Figure 7 illustrates the particle patterns and spatial distribution of normalized , , along representative monitoring regions. In Figure 7, represents the distance from the outer pipe wall, with the grey dashed line indicating = 1 as a geometric reference. In the vertical inlet pipe, particles are suspended across the entire pipe cross-section but are more concentrated in the core central region than near the wall. This dense-core suspension pattern is associated with higher particle velocity in the core and a local concentration greater than the feed concentration. As the mixture enters the bend, strong centrifugal effects, secondary flow, and particle inertia drive particle redistribution toward the outer wall of the bend. The local concentration decreases slightly from m8 to m13, while particle velocity increases because the pipe curvature promotes enhanced fluid-particle momentum exchange and subsequent particle acceleration. Consequently, the slip velocity first increases slightly near the bend entrance due to the abrupt geometric transition and then decreases sharply in the rear part of the bend.
Figure 7.
Snapshots showing particle patterns and spatial distribution of , , .
After exiting the bend, the flow regime gradually transitions from a dense-core suspension to a moving bed. The bend outlet region shows a temporary reduction in local particle concentration, with a minimum near m15, where the particle velocity reaches a maximum. This behavior indicates that the bend-induced acceleration temporarily suppresses local particle accumulation. Farther downstream, gravity drives particles toward the bottom of the horizontal pipe, and a moving bed develops. As the sediment bed grows, the particle velocity decreases and local concentration increases again. Therefore, the bend does more than introduce a local hydrodynamic disturbance: it redistributes particles and shapes the downstream transition from suspension-dominated transport to bed-load-dominated transport.
4.2. Effect of Feed Concentration
Feed concentration affects particle distribution and motion in the pipeline. In this section, five feed concentrations are examined: 4%, 6%, 8%, 10%, and 12%. The initial mixture velocity and the particle diameter are fixed at 3 m/s and 15 mm, respectively.
4.2.1. Effect of Feed Concentration on Particle Characteristics
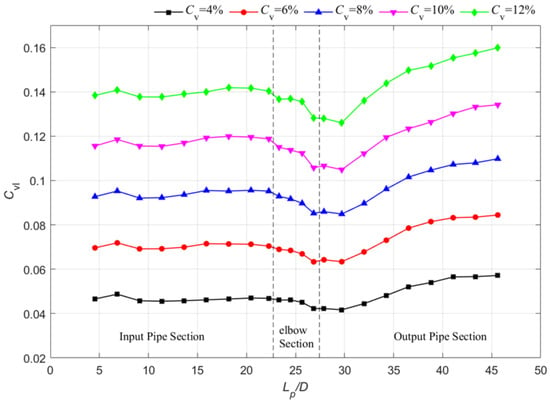
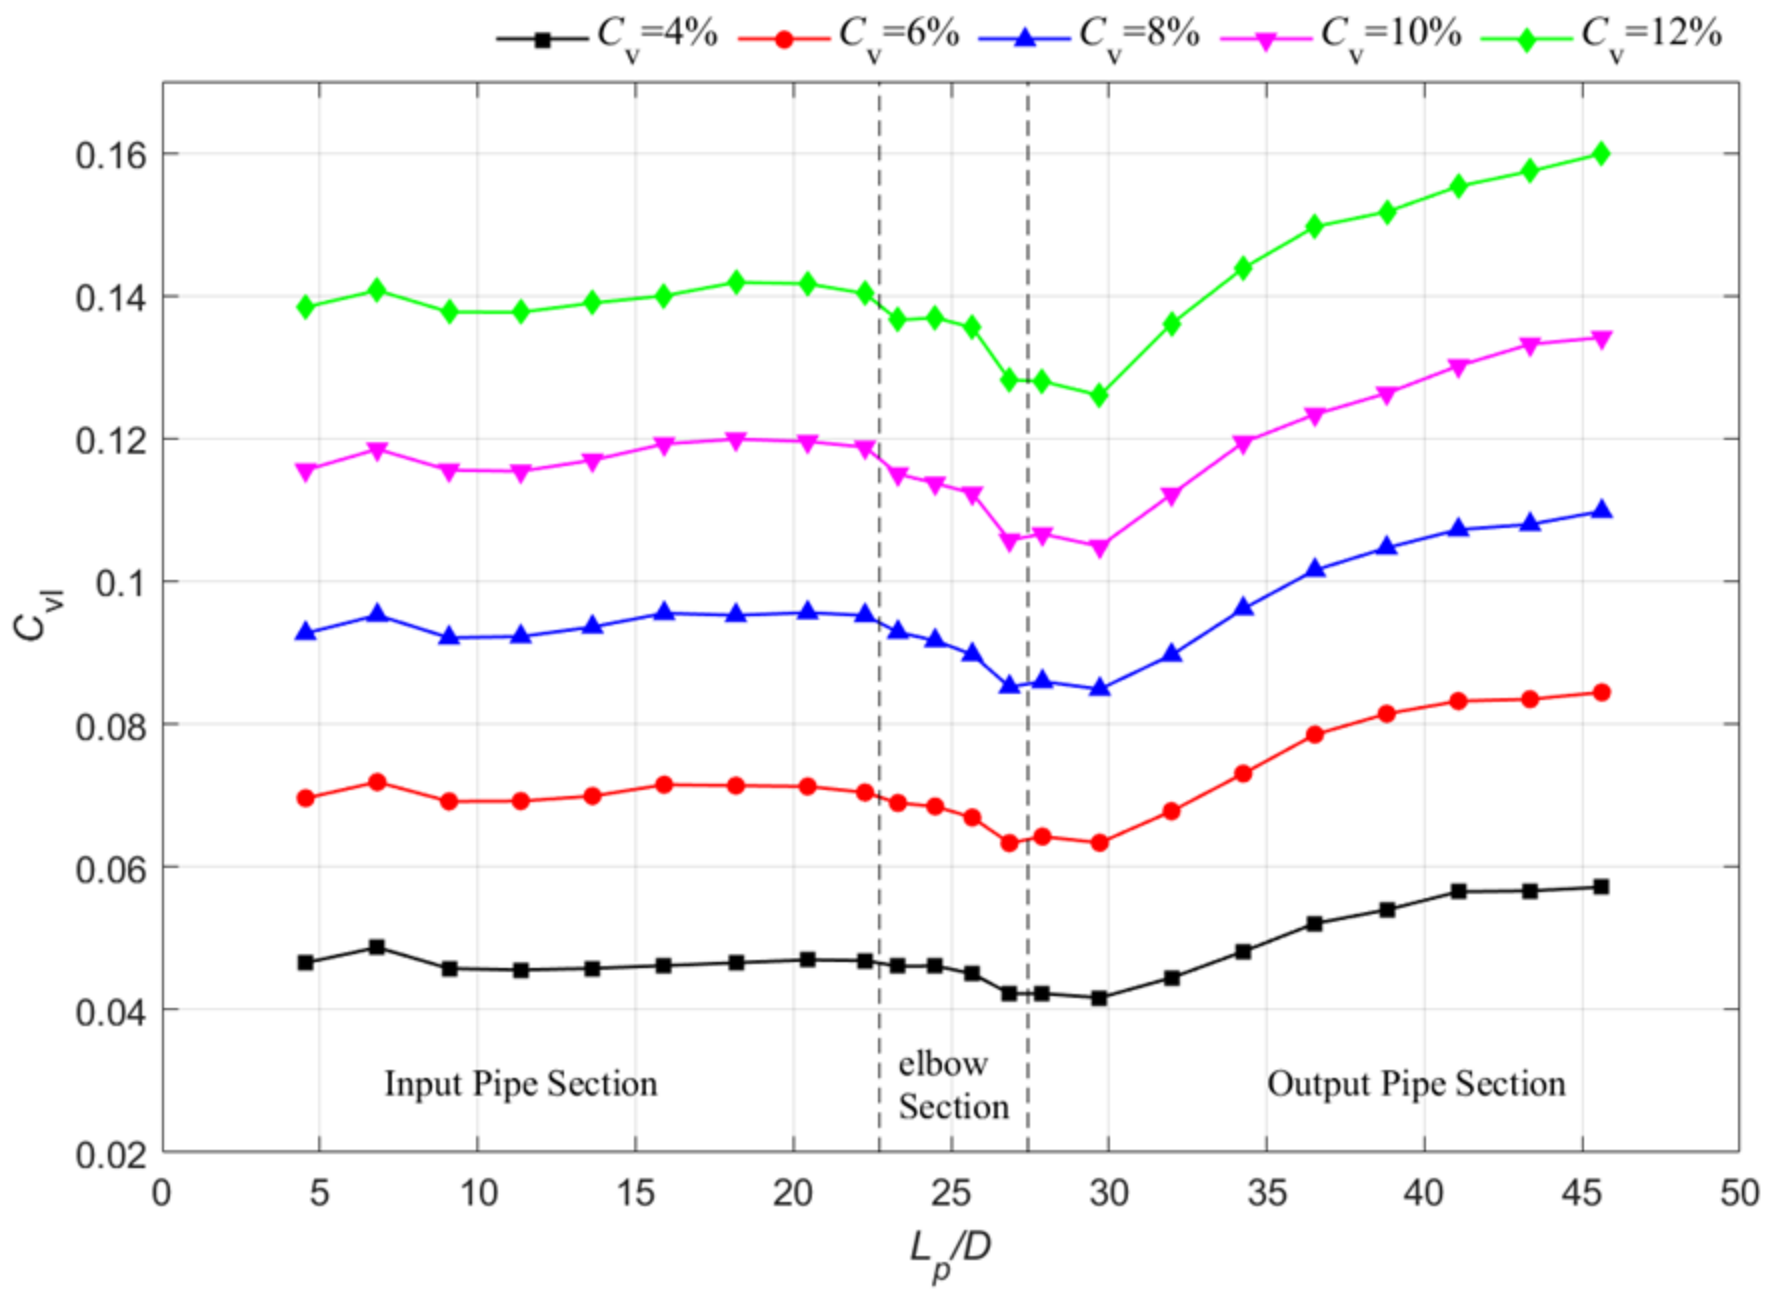
Figure 8 shows axial profiles of along the pipeline at different . Across all evaluated cases, remains nearly constant within the inlet pipe section, decreases through the bend and the early outlet section, reaches a minimum near monitor region m15, and subsequently increases gradually in the downstream horizontal pipe. This pattern is consistent with gravity-induced slip in the vertical section, bend-induced acceleration and redistribution, and settling-induced moving-bed formation in the horizontal section. Under all conditions, remains higher than the , indicating that local solids holdup exceeds the inlet value under the tested conditions.
Figure 8.
Axial variations of along the pipeline at different .
The relative concentration, defined as , exhibits distinct behaviors in the inlet and outlet sections. At m8, first increases from 17.46% to 19.58% and subsequently decreases to 18.06% as increases. This weak variation suggests that the vertical inlet section maintains a similar concentration-amplification mechanism over the investigated concentration range. Conversely, at m22, decreases from 42.89% to 33.23% as increases. Consequently, the downstream horizontal section is more sensitive to the interplay among the development of the bed height, particle settling dynamics, and the subsequent local fluid acceleration above the particle bed. Although the absolute local concentration increases with feed concentration, the relative amplification becomes weaker at higher loading.
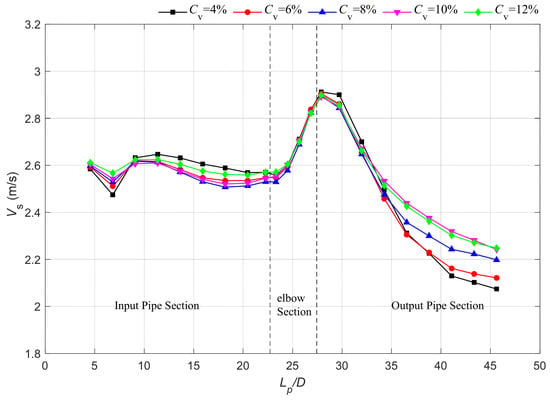
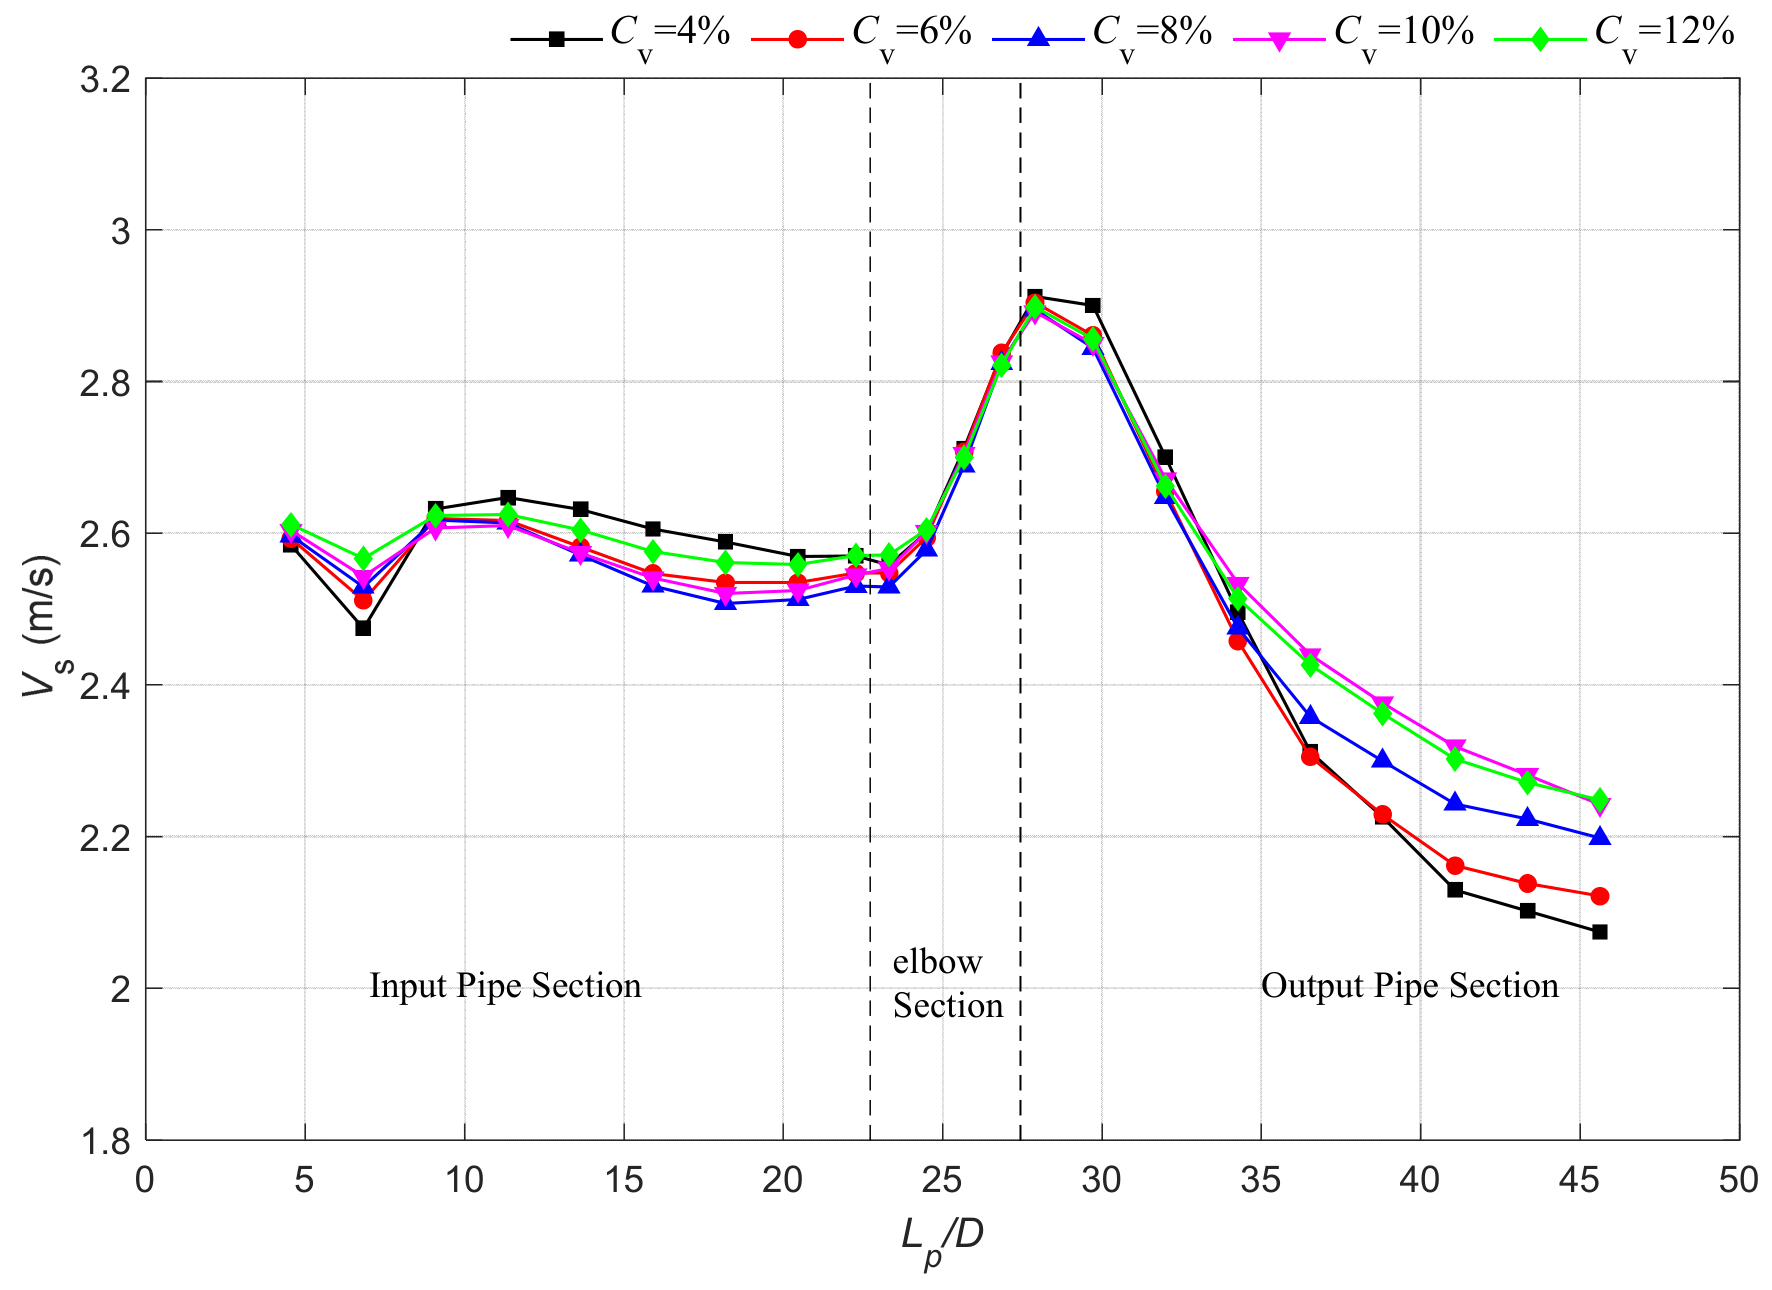
Figure 9 shows similar axial particle-velocity profiles across the tested feed concentrations. is relatively stable in the vertical inlet, increases through the bend, peaks shortly downstream, and then decreases as the moving bed develops. Across the 4–12% range, the mean particle-velocity response is weak. Two competing effects contribute to this response. At fixed mixture velocity, increasing solids loading changes the carrier-fluid fraction, while the locally reduced fluid-passage area can increase interstitial fluid velocity around concentrated particle regions. These effects partially offset one another.
Figure 9.
Axial variations of along the pipeline at different .
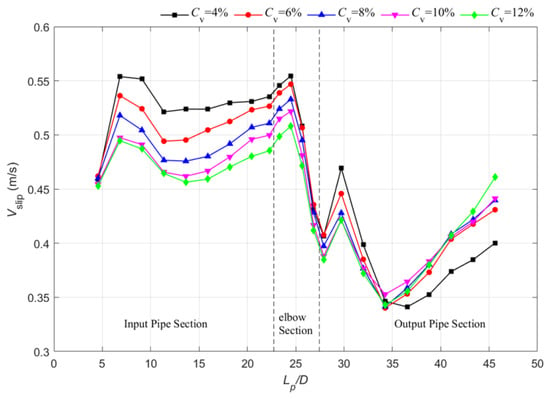
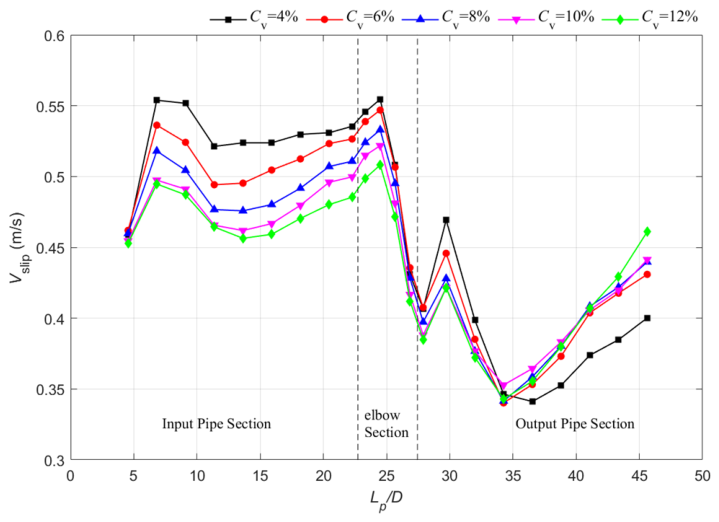
Figure 10 indicates that is more sensitive to pipeline position than and . In the vertical inlet pipe, increases toward the bend entrance because the particles must maintain a velocity lag relative to the upward carrier fluid to balance gravity. After entering the bend, reaches a local peak, and subsequently decreases rapidly as particle velocity increases. A secondary variation appears in the early outlet section, followed by a gradual downstream increase. This complex pattern results from the transition among three distinct hydrodynamic regimes. In the inlet pipe, the particle and fluid velocities are relatively aligned. In the bend, the secondary flow and curvature-induced acceleration generate strong directional mismatch between the fluid and particle velocities. In the outlet pipe, particle settling produces a non-uniform velocity distribution between the moving bed and the suspension layer above it.
Figure 10.
Axial variations of along the pipeline at different .
4.2.2. Effect of Feed Concentration on Pressure Drop
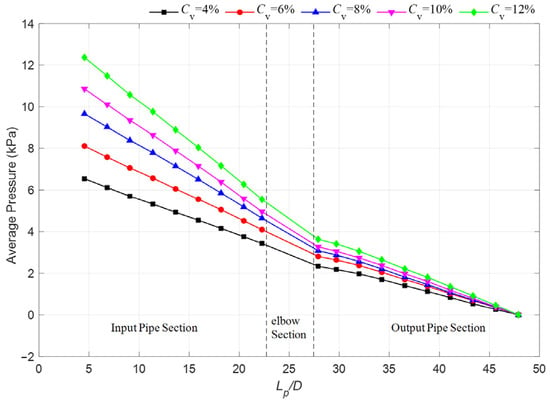
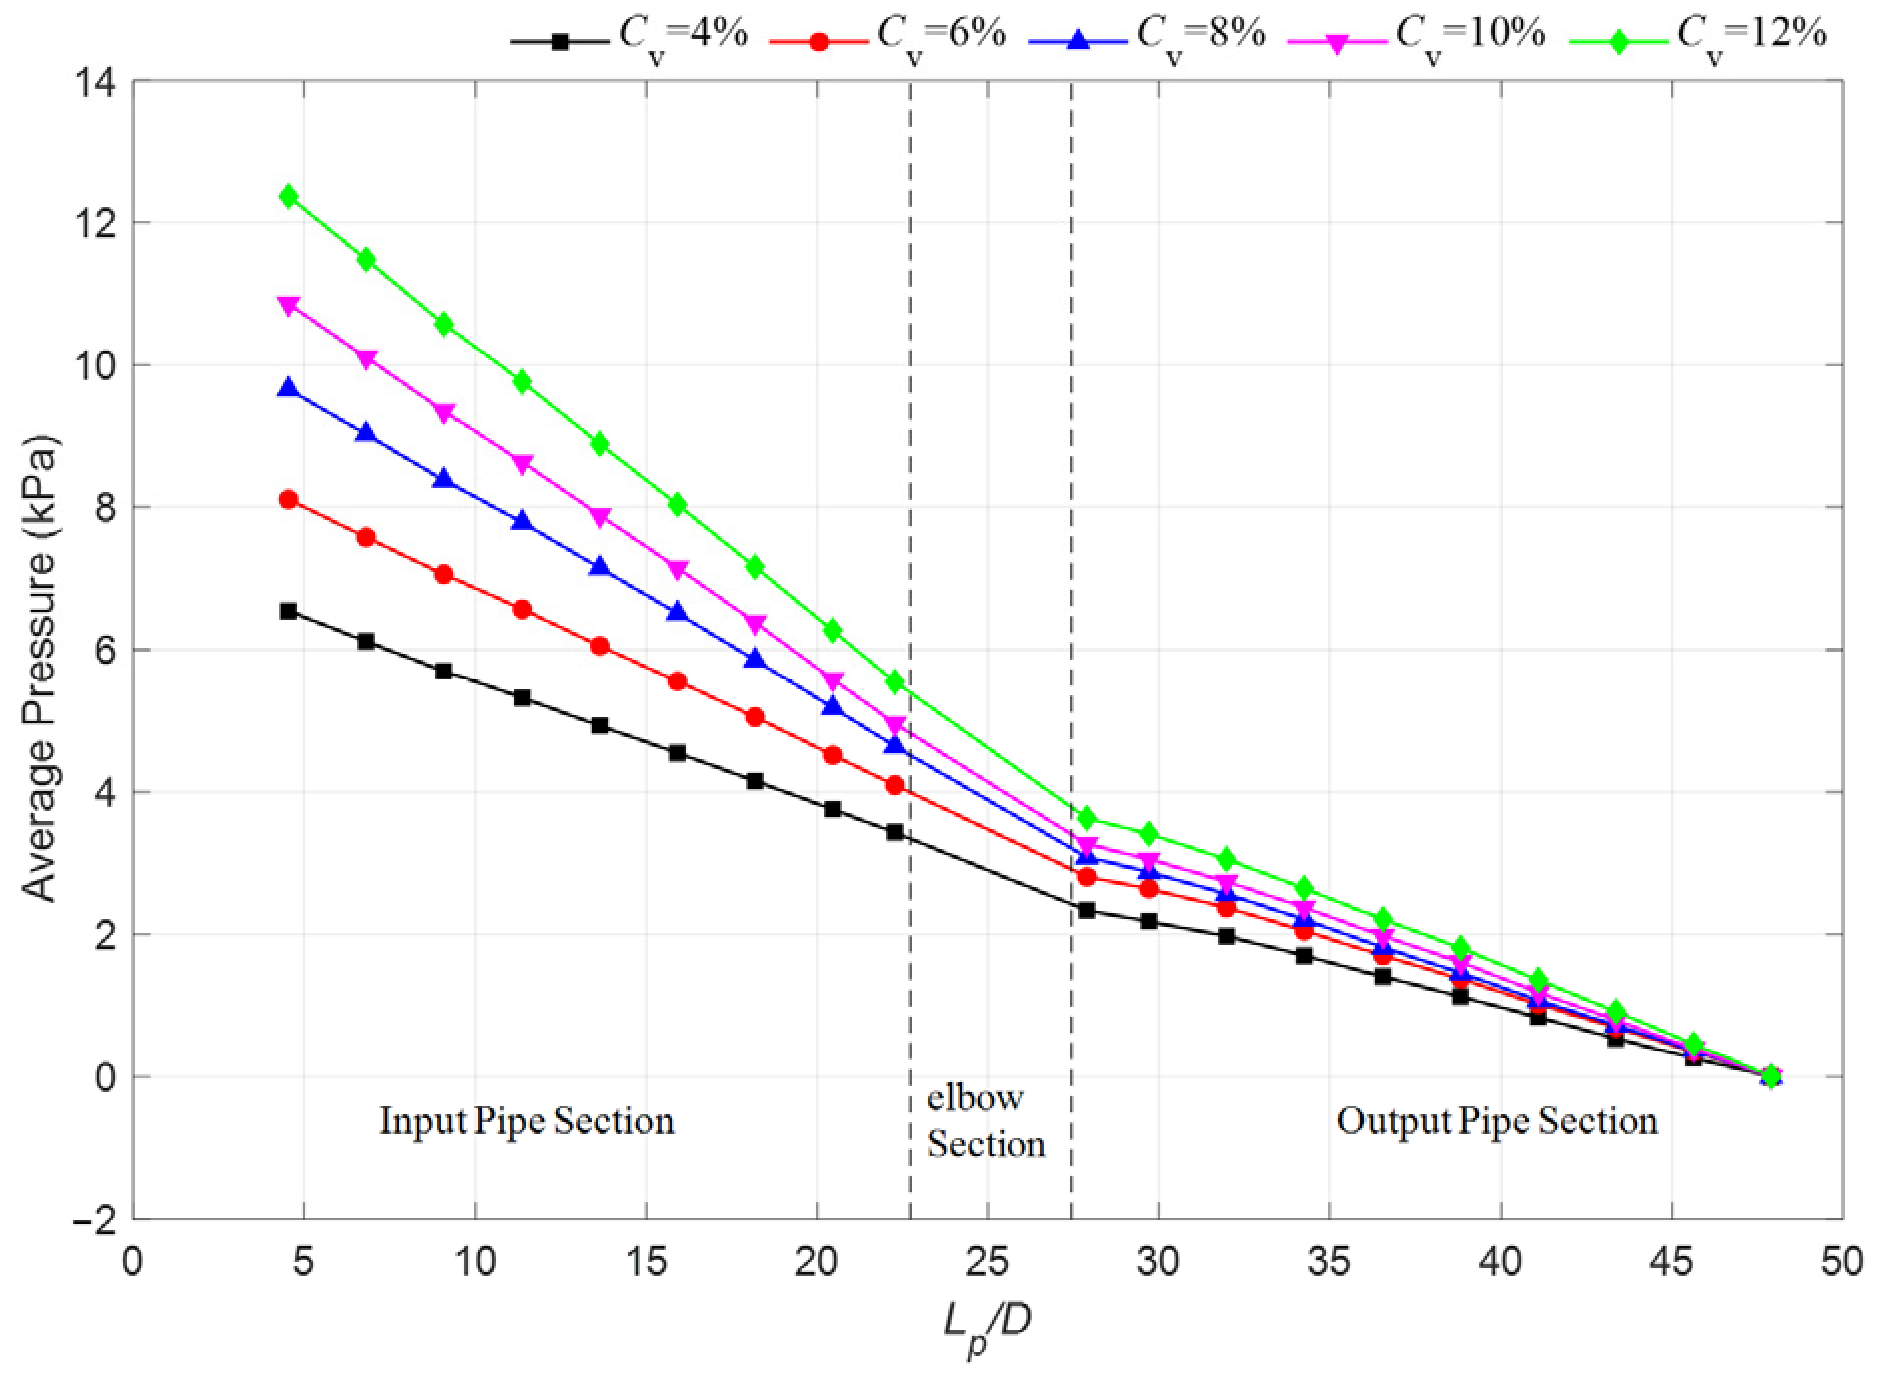
Figure 11 presents the hydrostatic-corrected mean pressure distribution. The pressure used in the present analysis excludes the hydrostatic contribution of the carrier liquid. However, the gravitational effect of the particles is not removed. Particle weight remains reflected in the coupled pressure response through particle slip, local solids holdup, interphase momentum exchange, and particle–particle and particle–wall contacts. Therefore, the pressure attenuation, particularly in the vertical section, should not be interpreted as a pure wall-friction loss.
Figure 11.
Axial variations of pressure distributions along the pipeline at different .
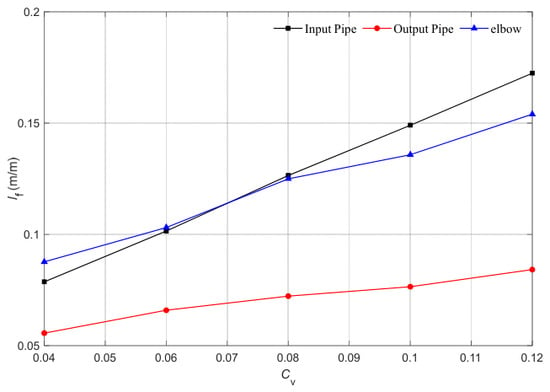
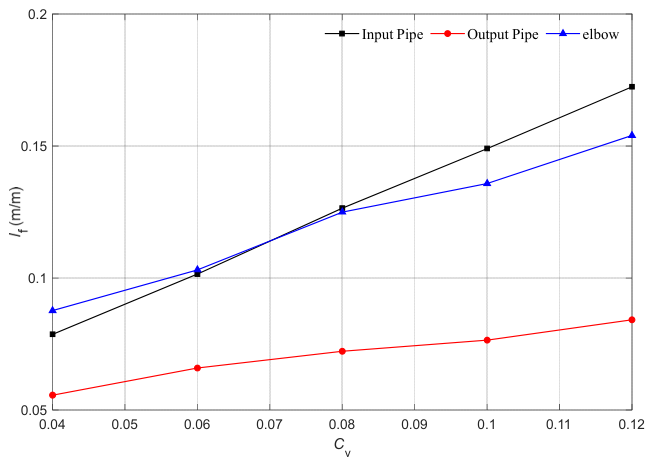
To compare the pressure response of the inlet, elbow, and outlet sections, the hydrostatic-corrected apparent hydraulic gradient is defined as:
where is the pressure difference over the section length L; for the bend, L is the centerline arc length. Because the particle-weight contribution remains embedded in the coupled pressure response, represents the apparent hydraulic gradient of the solid–liquid system.
Figure 12 shows that increases monotonically with feed concentration in the inlet pipe, bend, and outlet pipe. The inlet and bend sections exhibit larger values than the outlet section. At lower feed concentrations, the bend value is slightly higher than that of the inlet section, whereas at higher feed concentrations the inlet section becomes slightly dominant. Because the hydrostatic term has been removed, this transition is consistent with a change in the relative contributions of bend-induced particle–wall interactions and solids-loading-induced interphase momentum exchange. In the vertical section, gravity-driven particle slip increases this interphase exchange indirectly as solids loading increases.
Figure 12.
Influences of on in the inlet pipe, elbow region and outlet pipe.
4.2.3. Effect of Feed Concentration on Flow Patterns
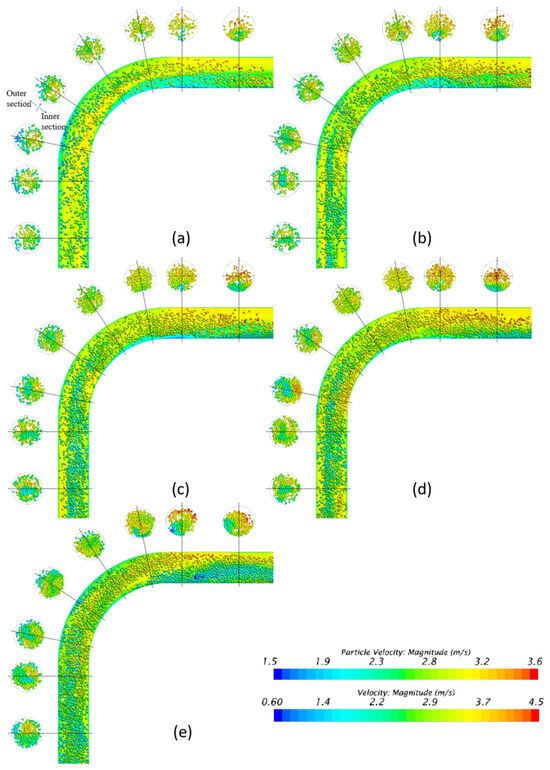
Figure 13 shows the influence of on instantaneous flow patterns, including flow velocity and particle velocity, in the bend and adjacent sections and at eight representative cross-sections (m8–m15). The higher-feed-concentration case shows a thicker moving bed and a larger low-velocity particle region near the bottom of the horizontal outlet.
Figure 13.
Flow patterns for different . (a) ; (b) ; (c) ; (d) ; (e) .
4.3. Effect of Particle Diameter
Mineral particles generated from crushing processes typically exhibit a wide size range. To isolate the effect of particle diameter, five mono-sized cases are considered: 5, 10, 15, 20, and 25 mm.
4.3.1. Effect of Particle Diameter on Particle Characteristics
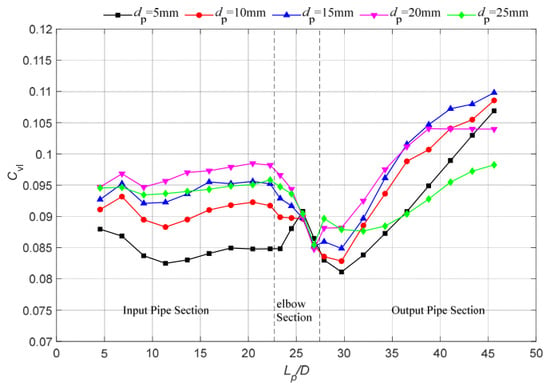
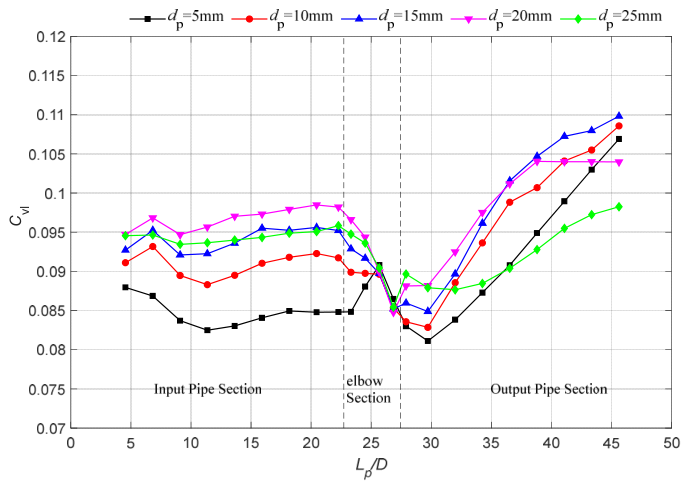
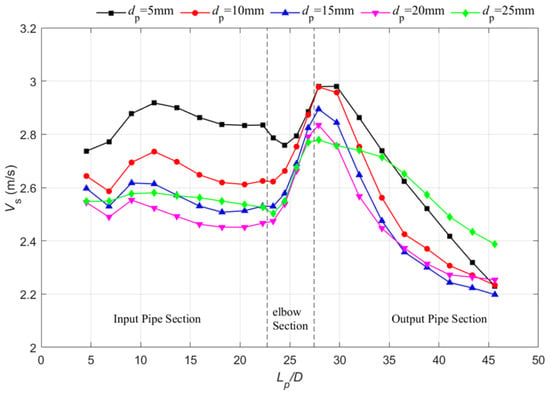
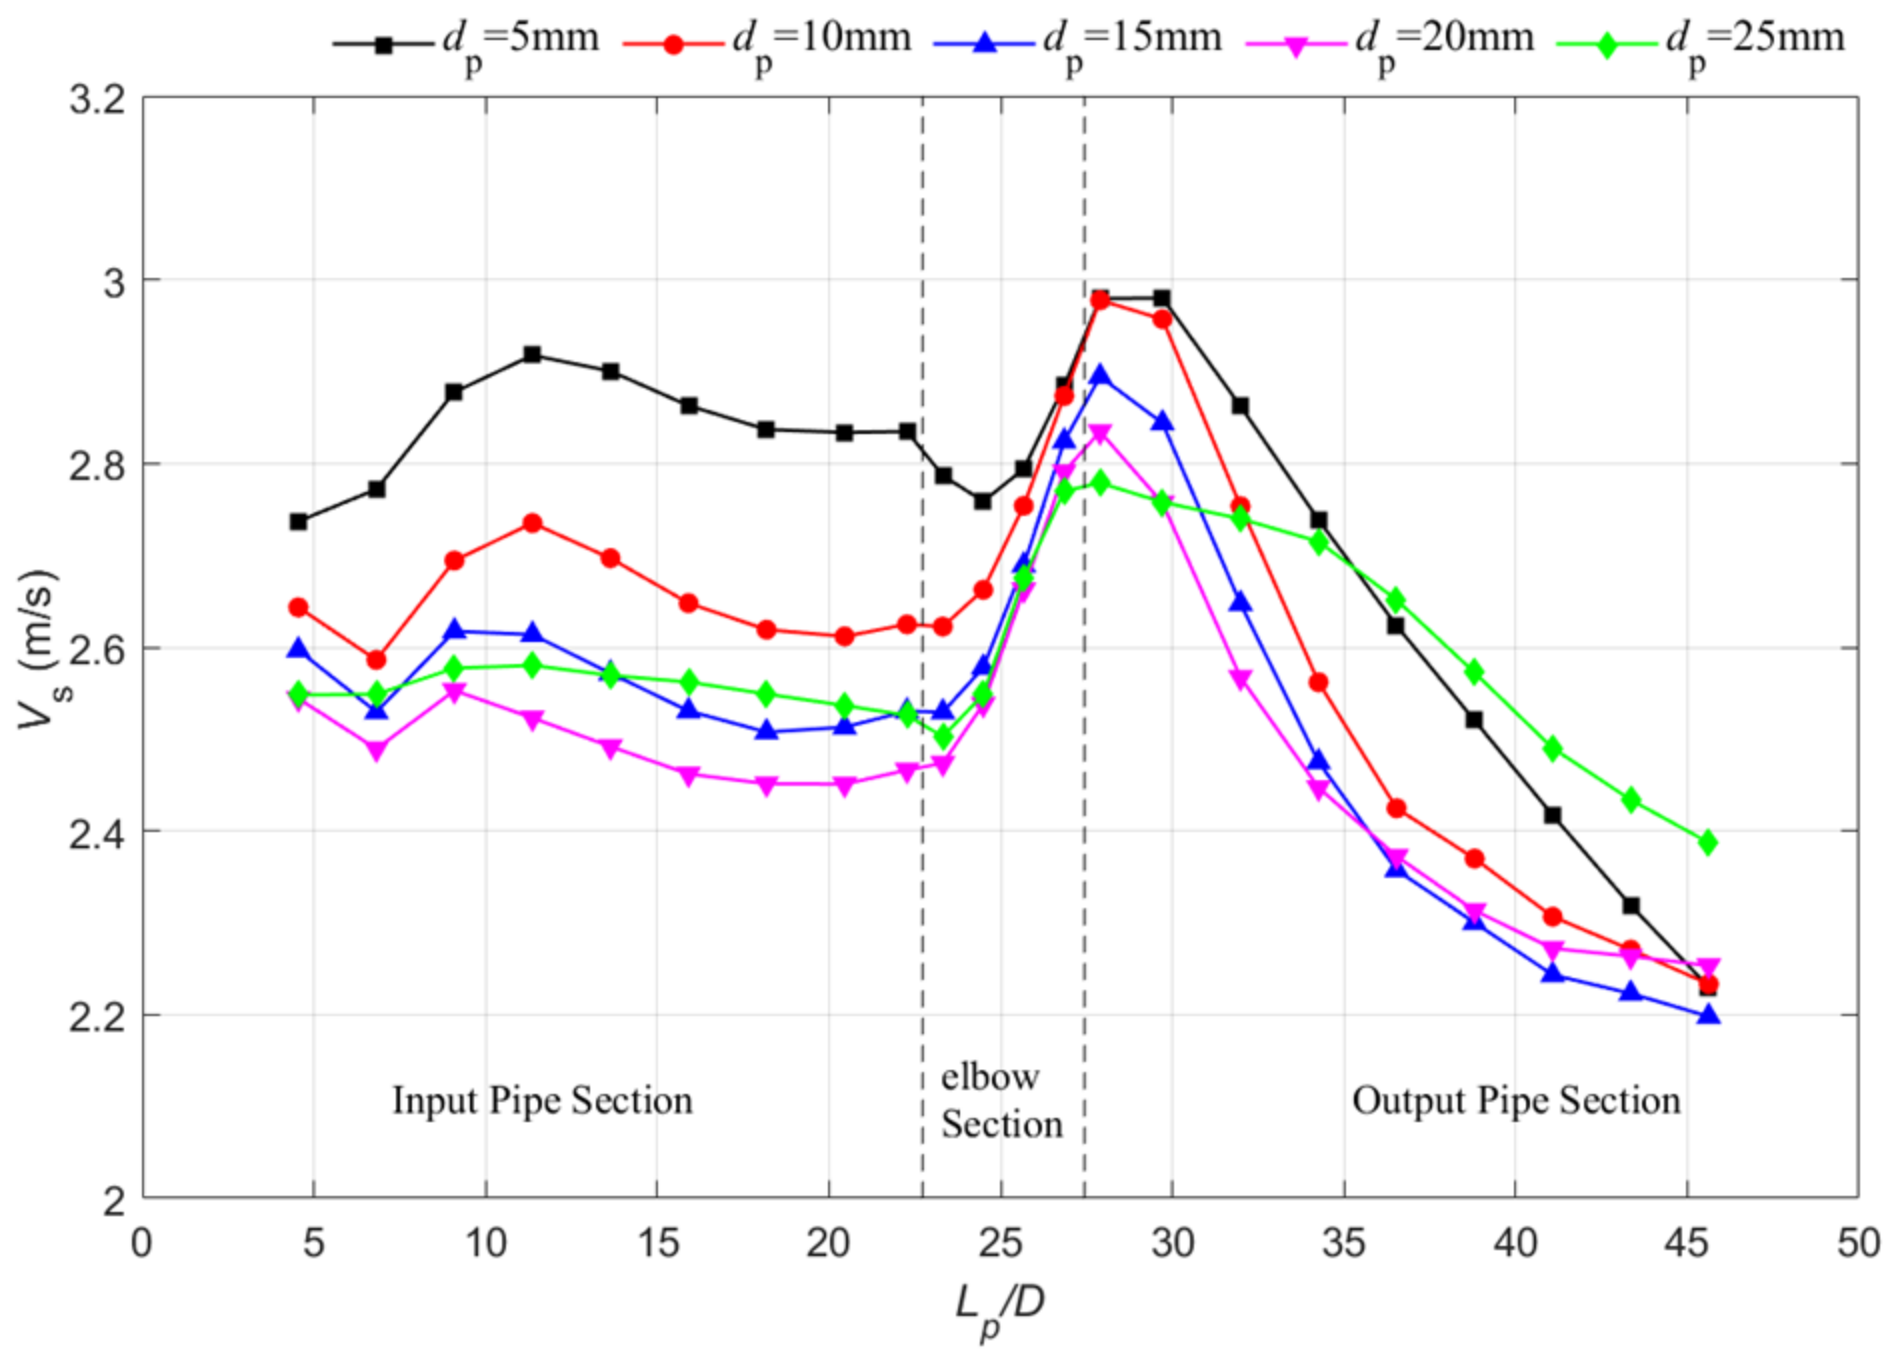
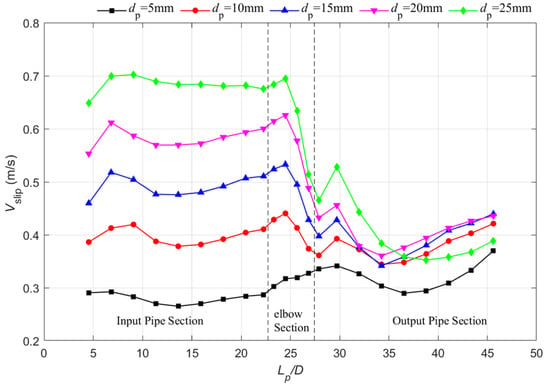
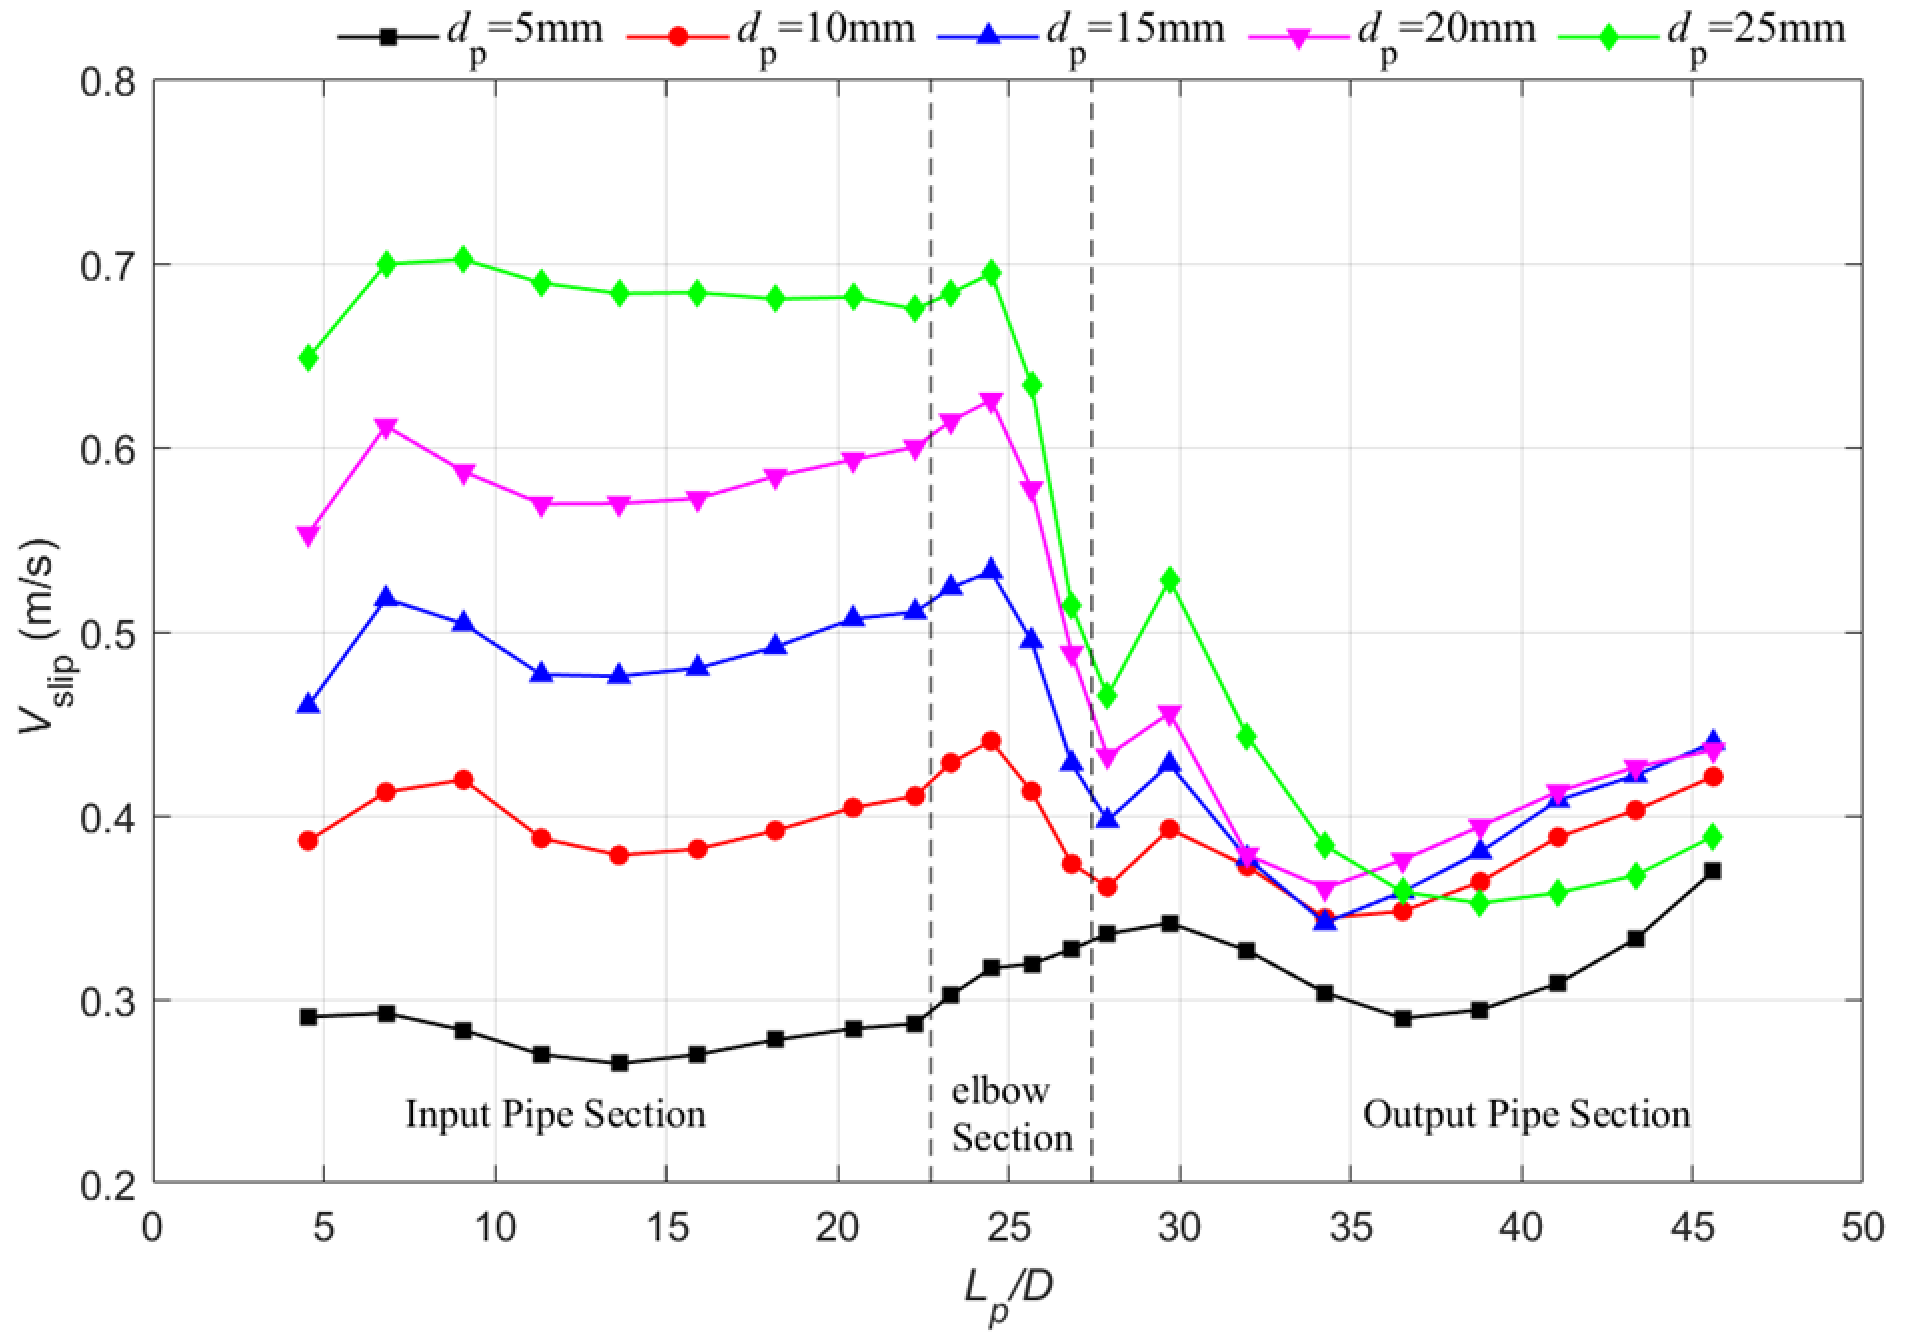
Figure 14, Figure 15 and Figure 16 show the effects of on , and . In the vertical inlet section, larger particles generally exhibit a higher and a lower , thereby leading to more pronounced local accumulation. This trend is consistent with the theoretical relationship for the terminal slip velocity of a single spherical particle:
Figure 14.
Axial variations of along the pipeline at different .
Figure 15.
Axial variations of along the pipeline at different .
Figure 16.
Axial variations of along the pipeline at different .
This relationship indicates that, under identical operational conditions, larger particles require a larger to maintain upward transport against gravity. However, the effect of the diameter is not strictly monotonic throughout the entire pipeline. Notably, the kinematic behavior of the 25 mm particles deviates from the trend observed for the 15 and 20 mm particles. This deviation is likely attributable to the finite pipe-to-particle size ratio (wall effect) and the corresponding reduction in the total number of particles at a constant volume concentration. Consequently, this observation suggests that single-particle settling theory alone does not fully explain coarse-particle transport in this system.
Within the bend section, the kinematic differences among the five evaluated particle sizes diminish. Specifically, converge near the exit region of the bend. This convergence may reflect the combined effects of particle–wall collisions, bend-induced acceleration, and secondary flows, which reduce the inherent differences in the particle settling velocities. As the particles exit the bend, reaches a local maximum whereas drops to a minimum. Further downstream in the horizontal section, gravity drives the formation of a moving bed, causing to decrease subsequently.
Interestingly, the 5 mm particle case exhibits a transport behavior that is analogous to a pseudo-homogeneous suspension. Smaller particles are more readily entrained by the fluid turbulence and are significantly less constrained by individual particle inertia. Consequently, they distribute more uniformly across the cross-section. Nevertheless, in the horizontal outlet pipe, small particles inherently yield a larger total specific surface area at an identical volume concentration. This characteristic significantly enhances the frictional interactions with the pipe wall and the moving bed.
This competing mechanism explains why the downstream concentration and velocity responses exhibit complex non-linear behaviors rather than a simple monotonic dependence on the particle size.
4.3.2. Effect of Particle Diameter on Pressure Drop
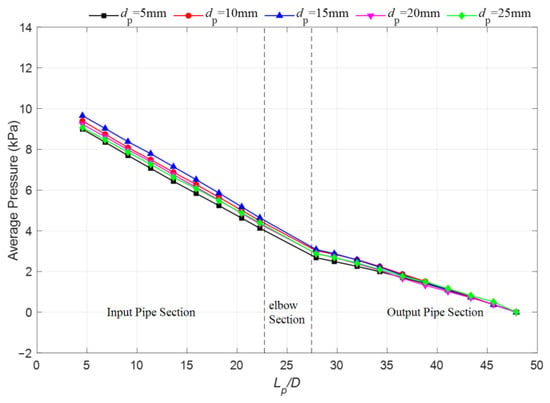
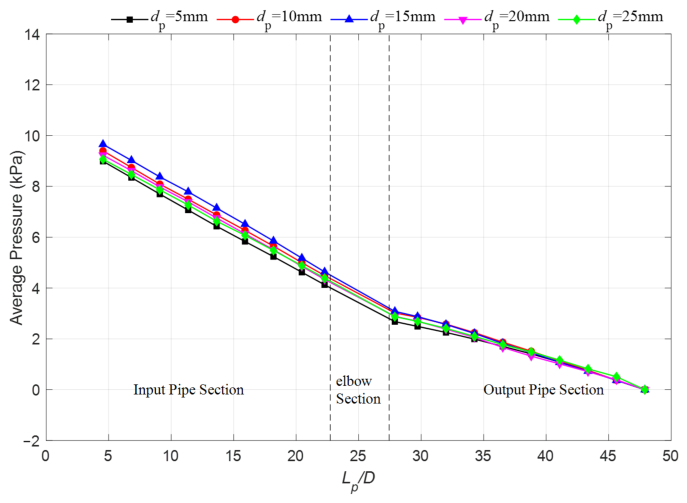
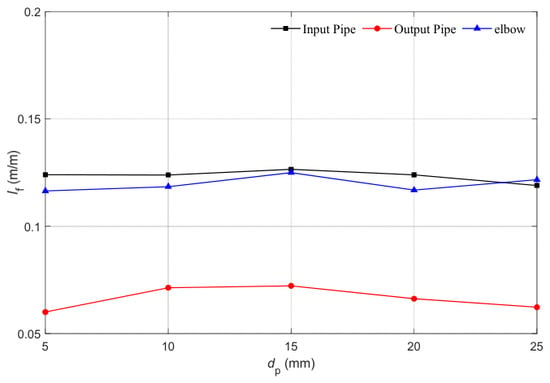
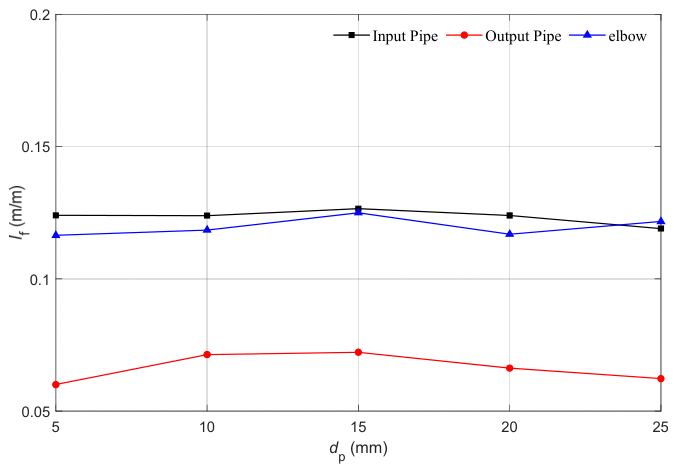
Figure 17 and Figure 18 show that particle diameter has a comparatively weak effect on pressure distribution and apparent hydraulic gradient under the present mixture velocity of 3 m/s [46]. Under this tested flow condition, increasing diameter reduces the number of particles and associated contact opportunities at a fixed solids volume, while it simultaneously increases particle inertia, settling tendency, and wall interaction. The competing effects partly offset one another in the overall hydraulic response, even though local flow patterns and accumulation remain diameter-dependent.
Figure 17.
Axial variations of pressure distributions along the pipeline at different .
Figure 18.
Influence of on in the inlet pipe, elbow region, and outlet pipe.
4.3.3. Effect of Particle Diameter on Flow Patterns
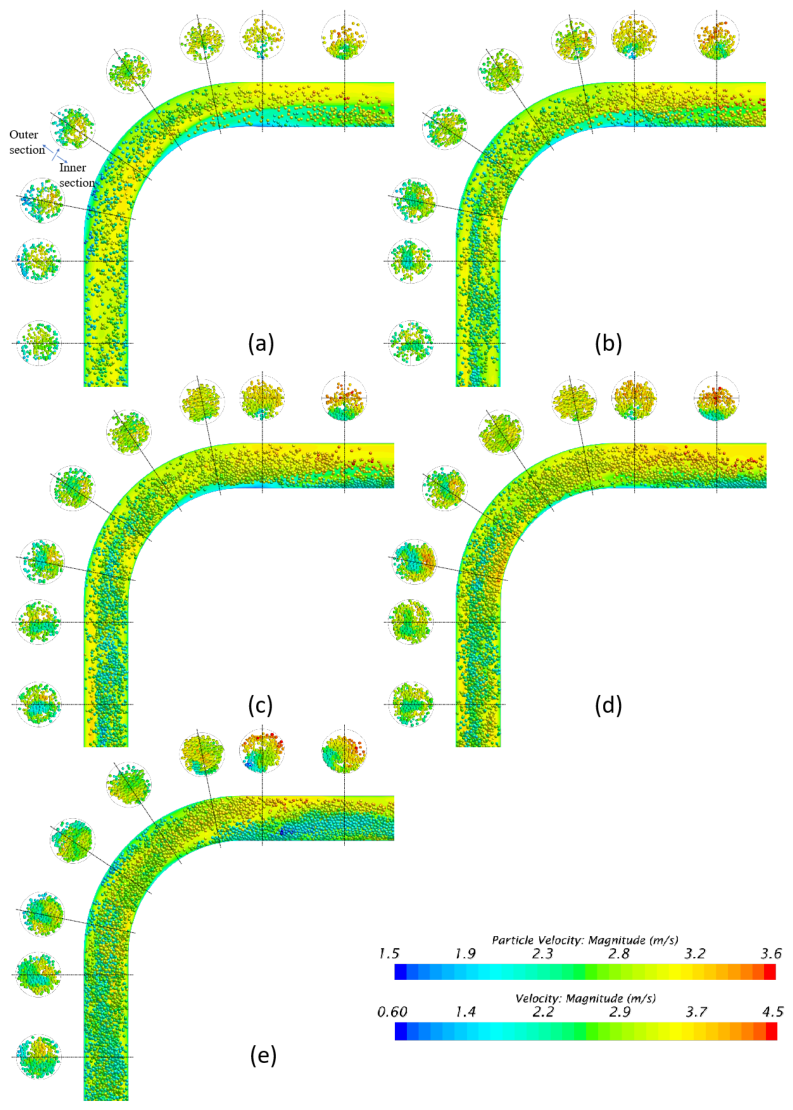
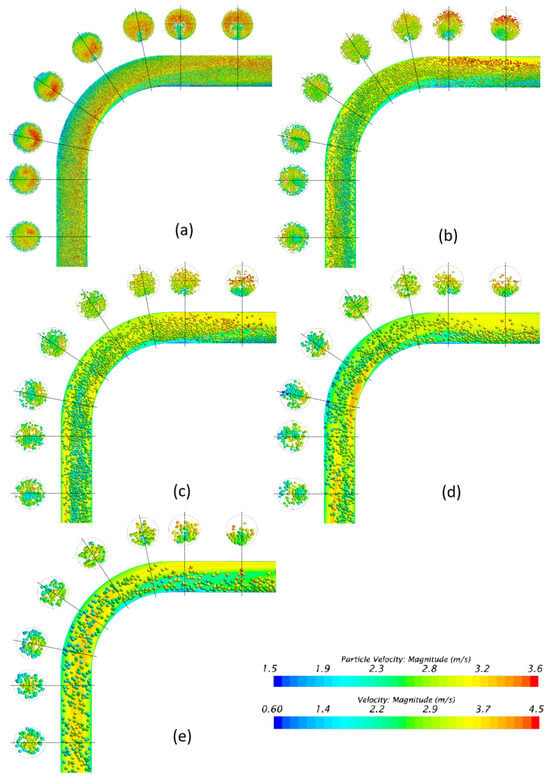
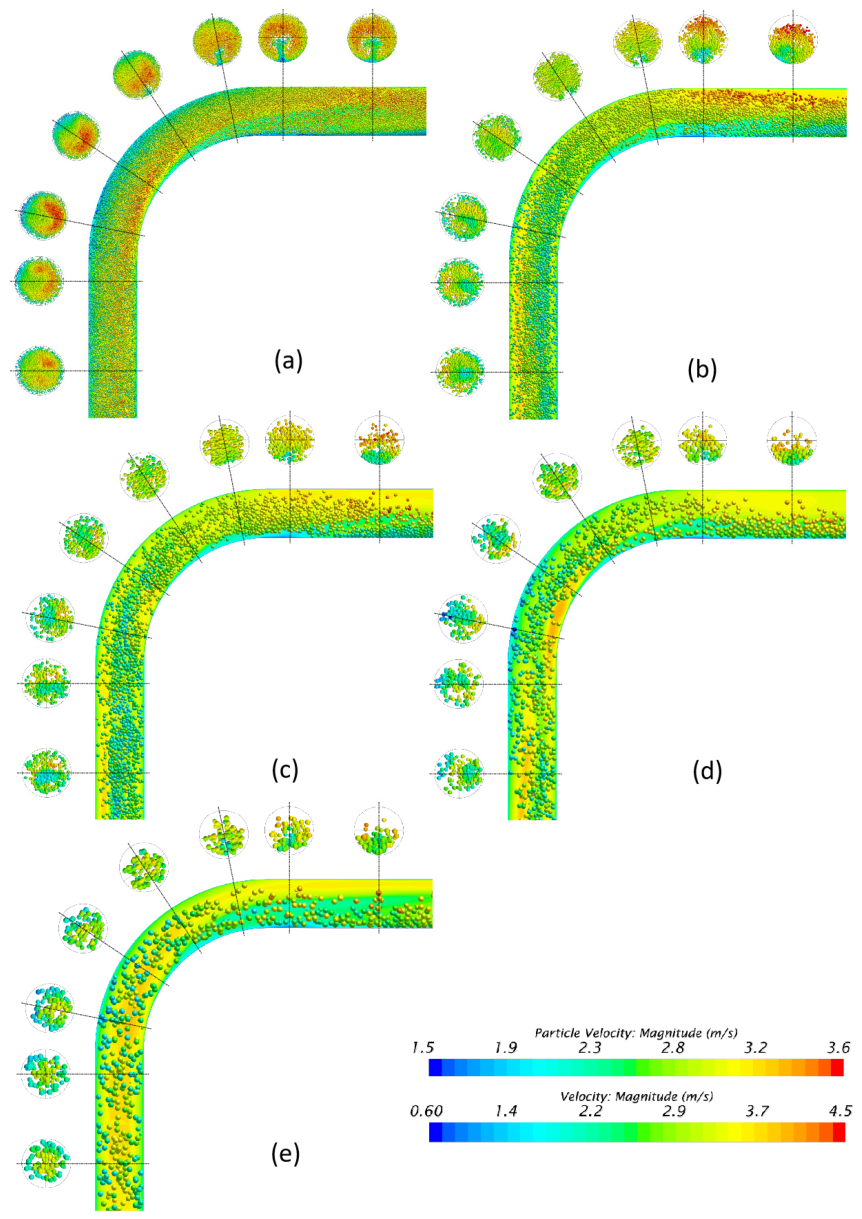
Figure 19 further illustrates the diameter-dependent flow patterns. Smaller particles are more uniformly distributed and undergo a more intense spatial redistribution between the inner and outer curvatures of the bend. In contrast, larger particles exhibit pronounced inertial effects and demonstrate a higher tendency to form local clusters or bed-load structures immediately downstream of the bend. Overall, the analysis indicates that particle diameter affects the internal spatial organization of the solid phase much more profoundly than it impacts the global pressure drop.
Figure 19.
Snapshots showing flow patterns with different . (a) ; (b) ; (c) ; (d) ; (e) .
4.4. Effect of Solid Particle Gradation
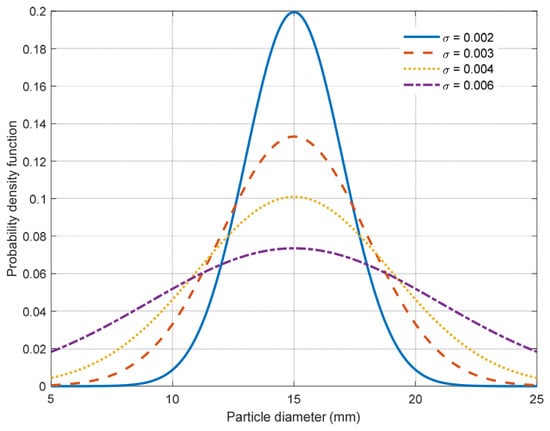
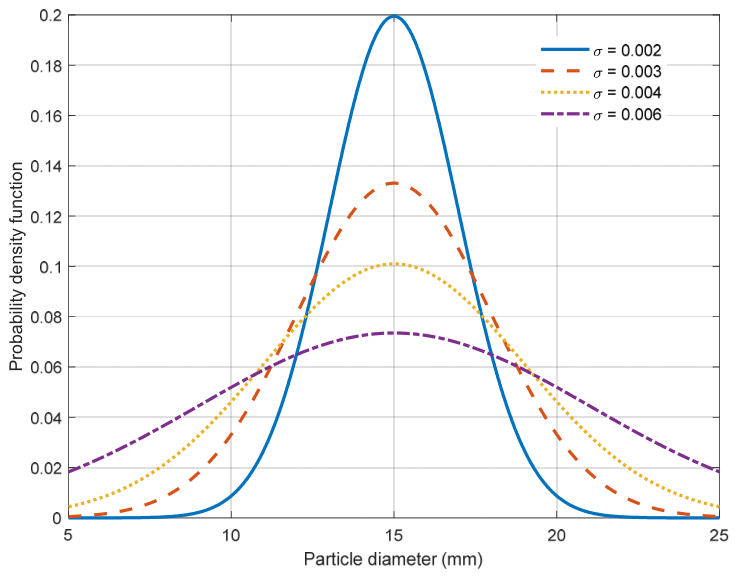
The crushed ore is represented by mono-sized and graded particle cases. In this section, the prescribed volume-based particle gradation is generated from a Gaussian distribution centered at = 0.015 m. To avoid nonphysical tails and to keep all gradation cases within the particle-size range investigated in the mono-sized study, the Gaussian distribution is truncated to 5 mm ≤ ≤ 25 mm. Samples outside this interval are rejected, and the retained distribution is renormalized so that the prescribed total inlet solids volume fraction is unchanged. The underlying Gaussian cumulative distribution function before truncation is given by Equation (24), which applies only when σ > 0; σ = 0 denotes the mono-sized reference case.
where = 0.015 m is the central particle size. Five cases are evaluated with = 0, 0.002, 0.003, 0.004, and 0.006 m. The resulting truncated particle-size distributions are shown in Figure 20.
Figure 20.
Truncated particle-size distributions used in the simulations.
4.4.1. Effect of Particle Gradation on Particle Characteristics
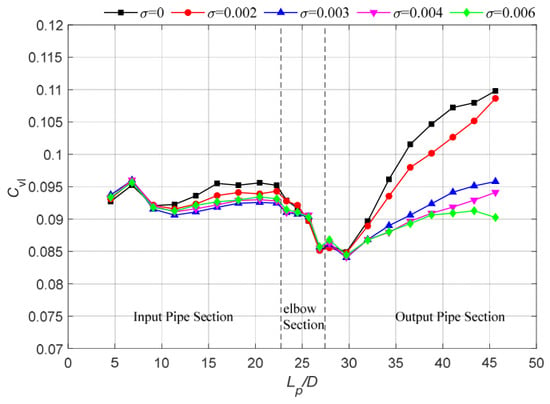
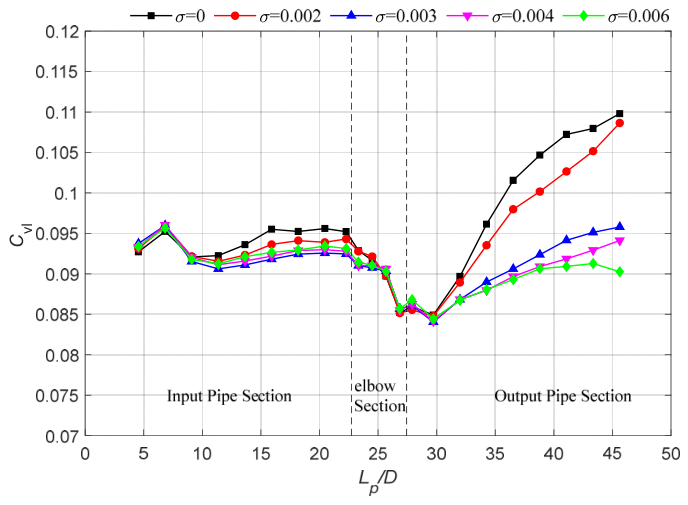
Figure 21 shows that particle-size distribution has only a limited effect on the time-averaged local particle concentration in the vertical inlet and bend, but substantially alters the downstream distribution. When σ increases from 0 to 0.006 m, the mean monitored decreases by only 1.31% in the inlet and 0.29% in the bend, whereas the outlet mean decreases by 10.08%. At 0.5 m downstream of the bend, remains within 0.084–0.085 for all gradation cases, indicating that the immediate post-bend concentration minimum is nearly insensitive to gradation. Farther downstream, however, the increase in from 0.5 to 4.0 m decreases from 29.34% for the mono-sized case to only 6.88% for σ = 0.006 m. Thus, a broader particle-size distribution is associated with a smaller downstream increase in local solids holdup.
Figure 21.
Axial variations of along the pipeline at different .
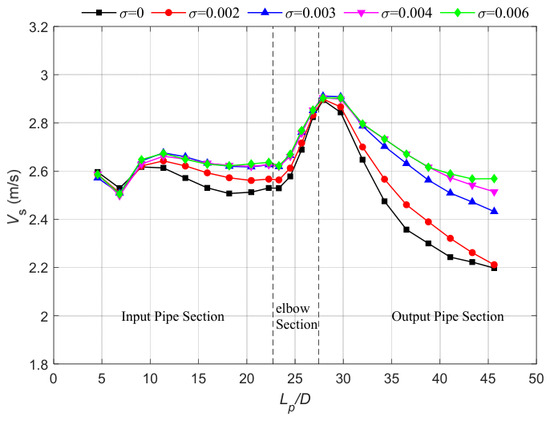
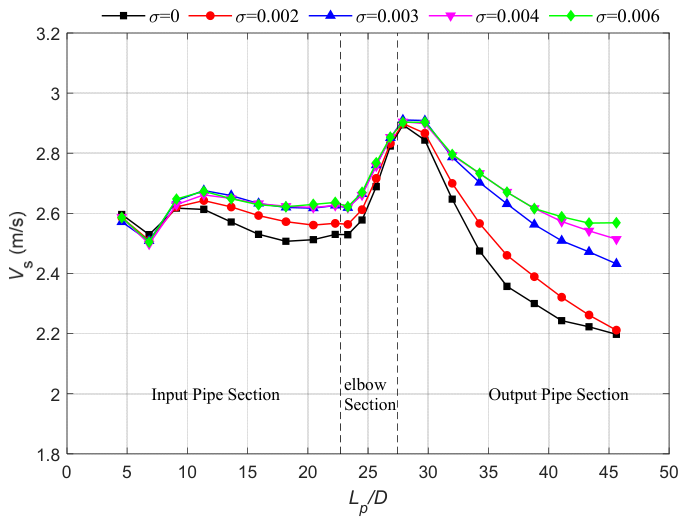
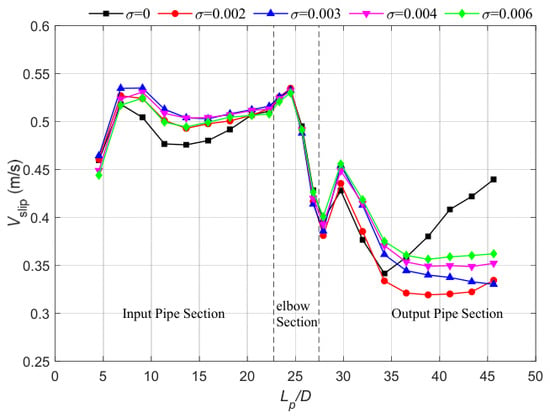
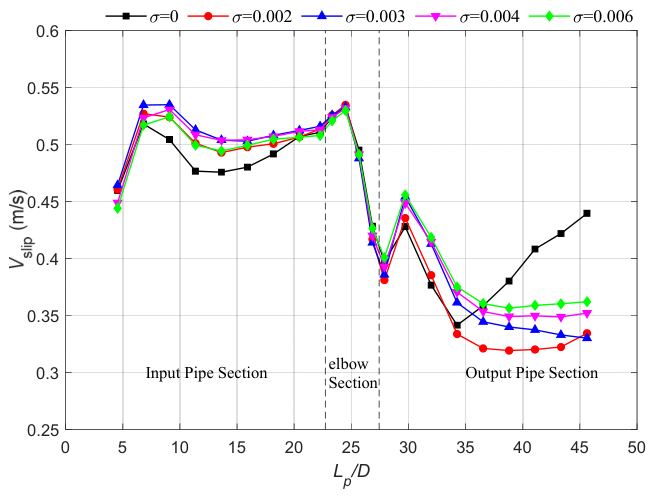
Figure 22 shows a smaller downstream decrease in for broader gradations. Between 0.5 and 4.0 m downstream, decreases by 22.71% for σ = 0 and by 11.52% for σ = 0.006 m. These simulated changes indicate lower downstream concentration recovery and weaker particle-velocity attenuation for the broader case. Figure 23 shows the corresponding spatial variation in slip velocity for the same gradation cases.
Figure 22.
Axial variations of along the pipeline at different .
Figure 23.
Axial variations of along the pipeline at different .
Interstitial filling and polydisperse packing are thus proposed as potential microscopic contributors, yet not directly verified by current results. Direct measurements of porosity and particle-scale packing would help test these proposed mechanisms.
4.4.2. Effect of Particle Gradation on Pressure Drop
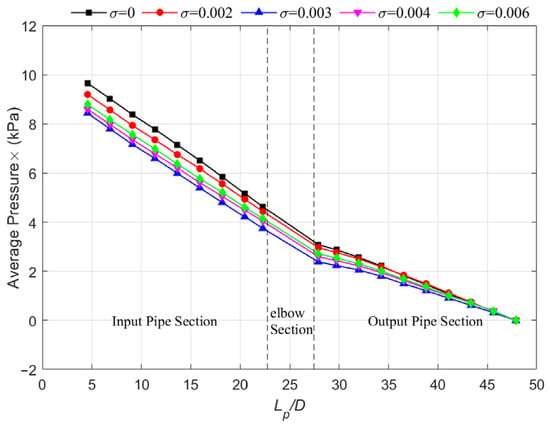
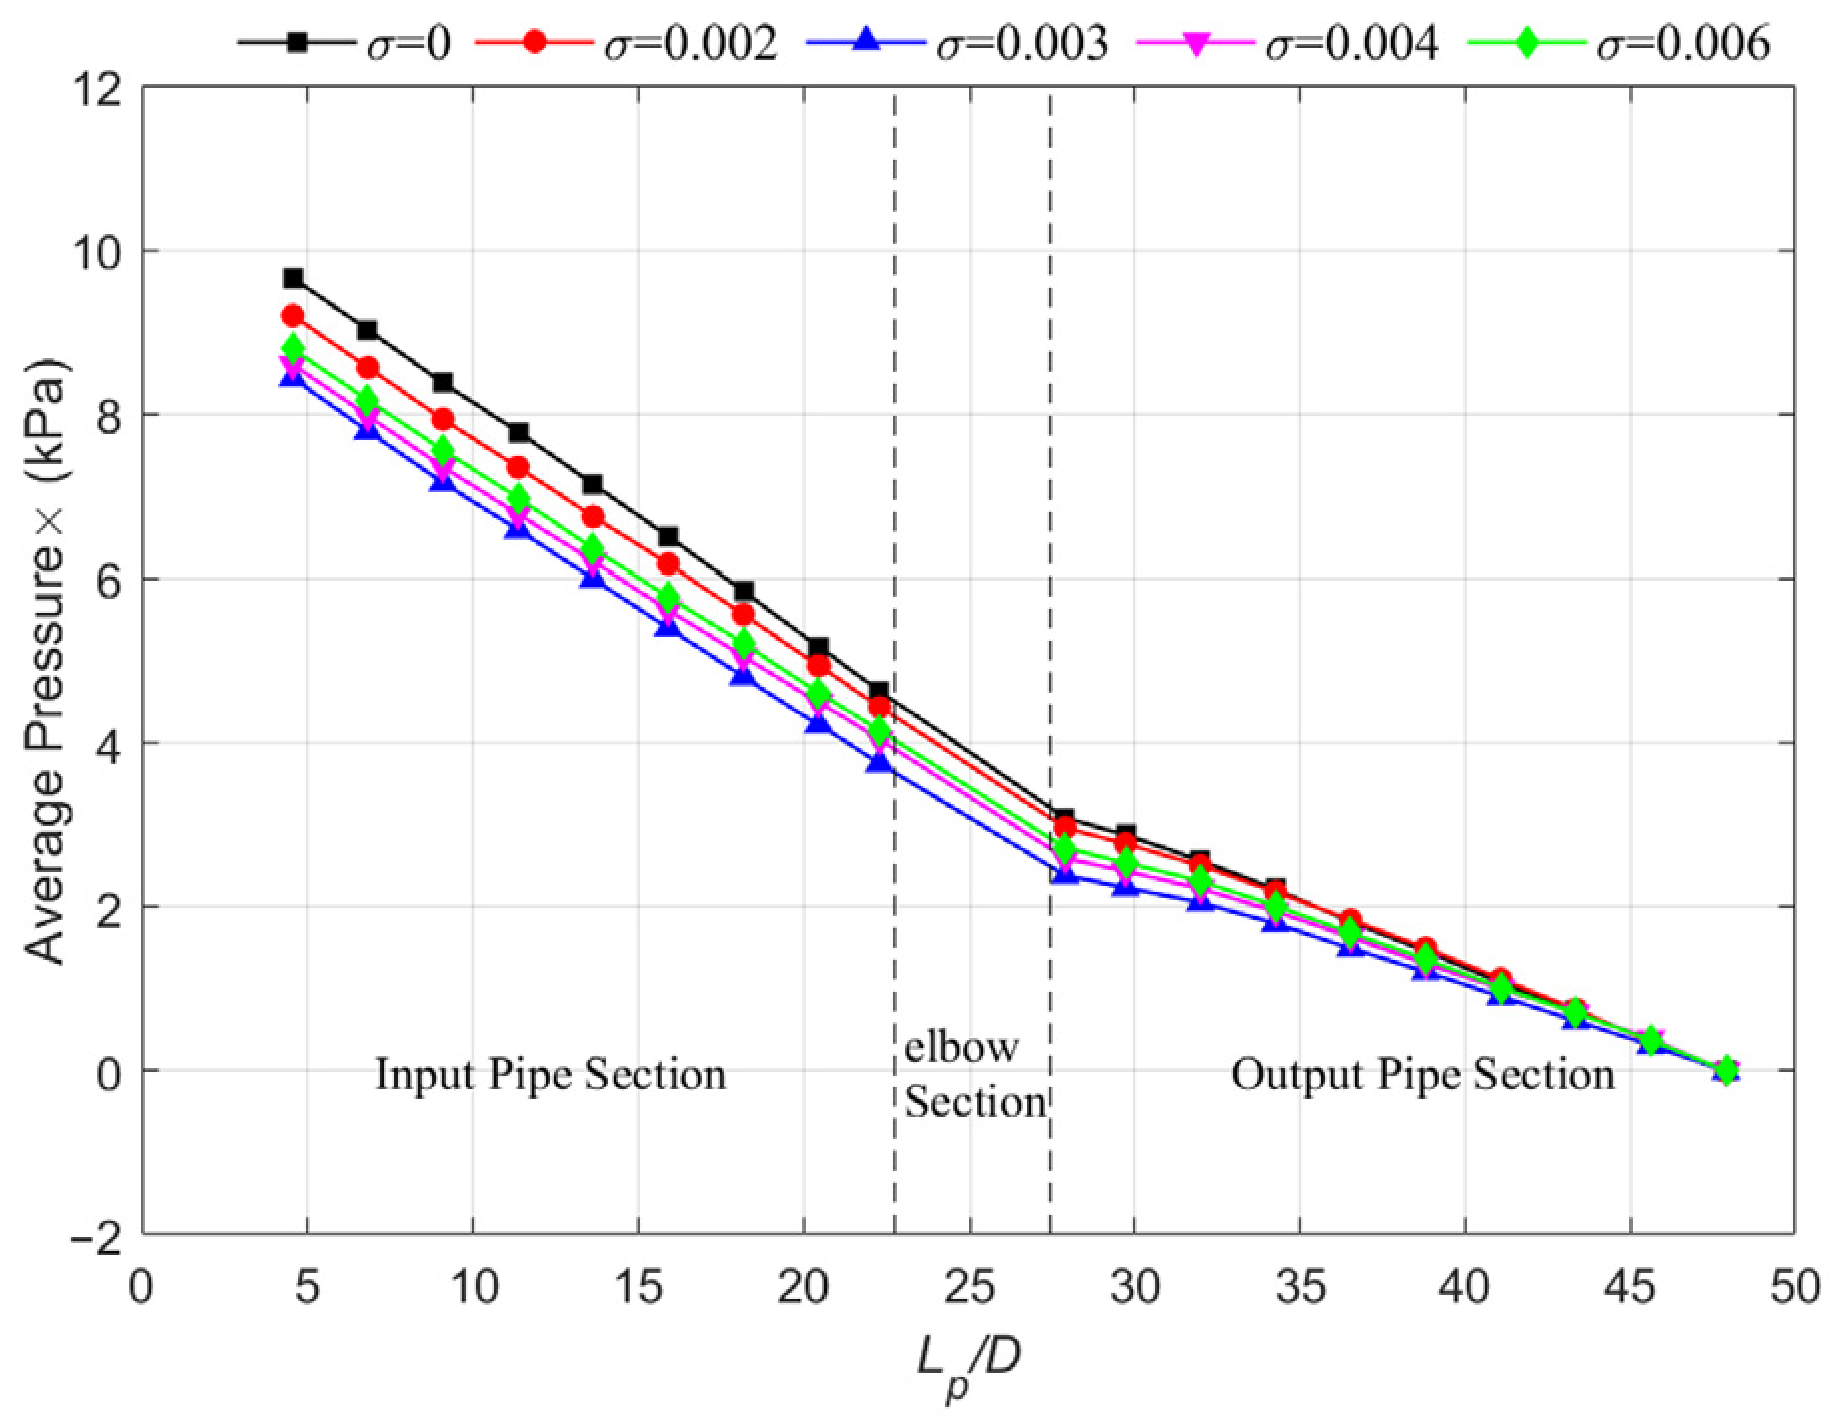
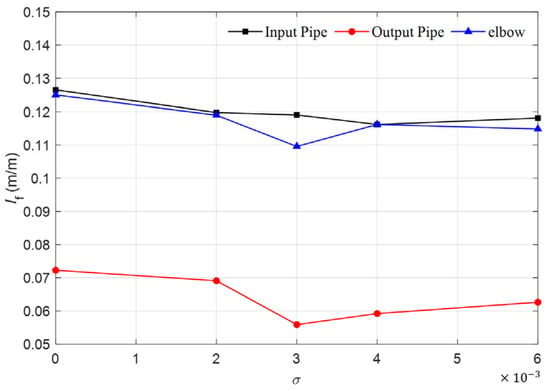
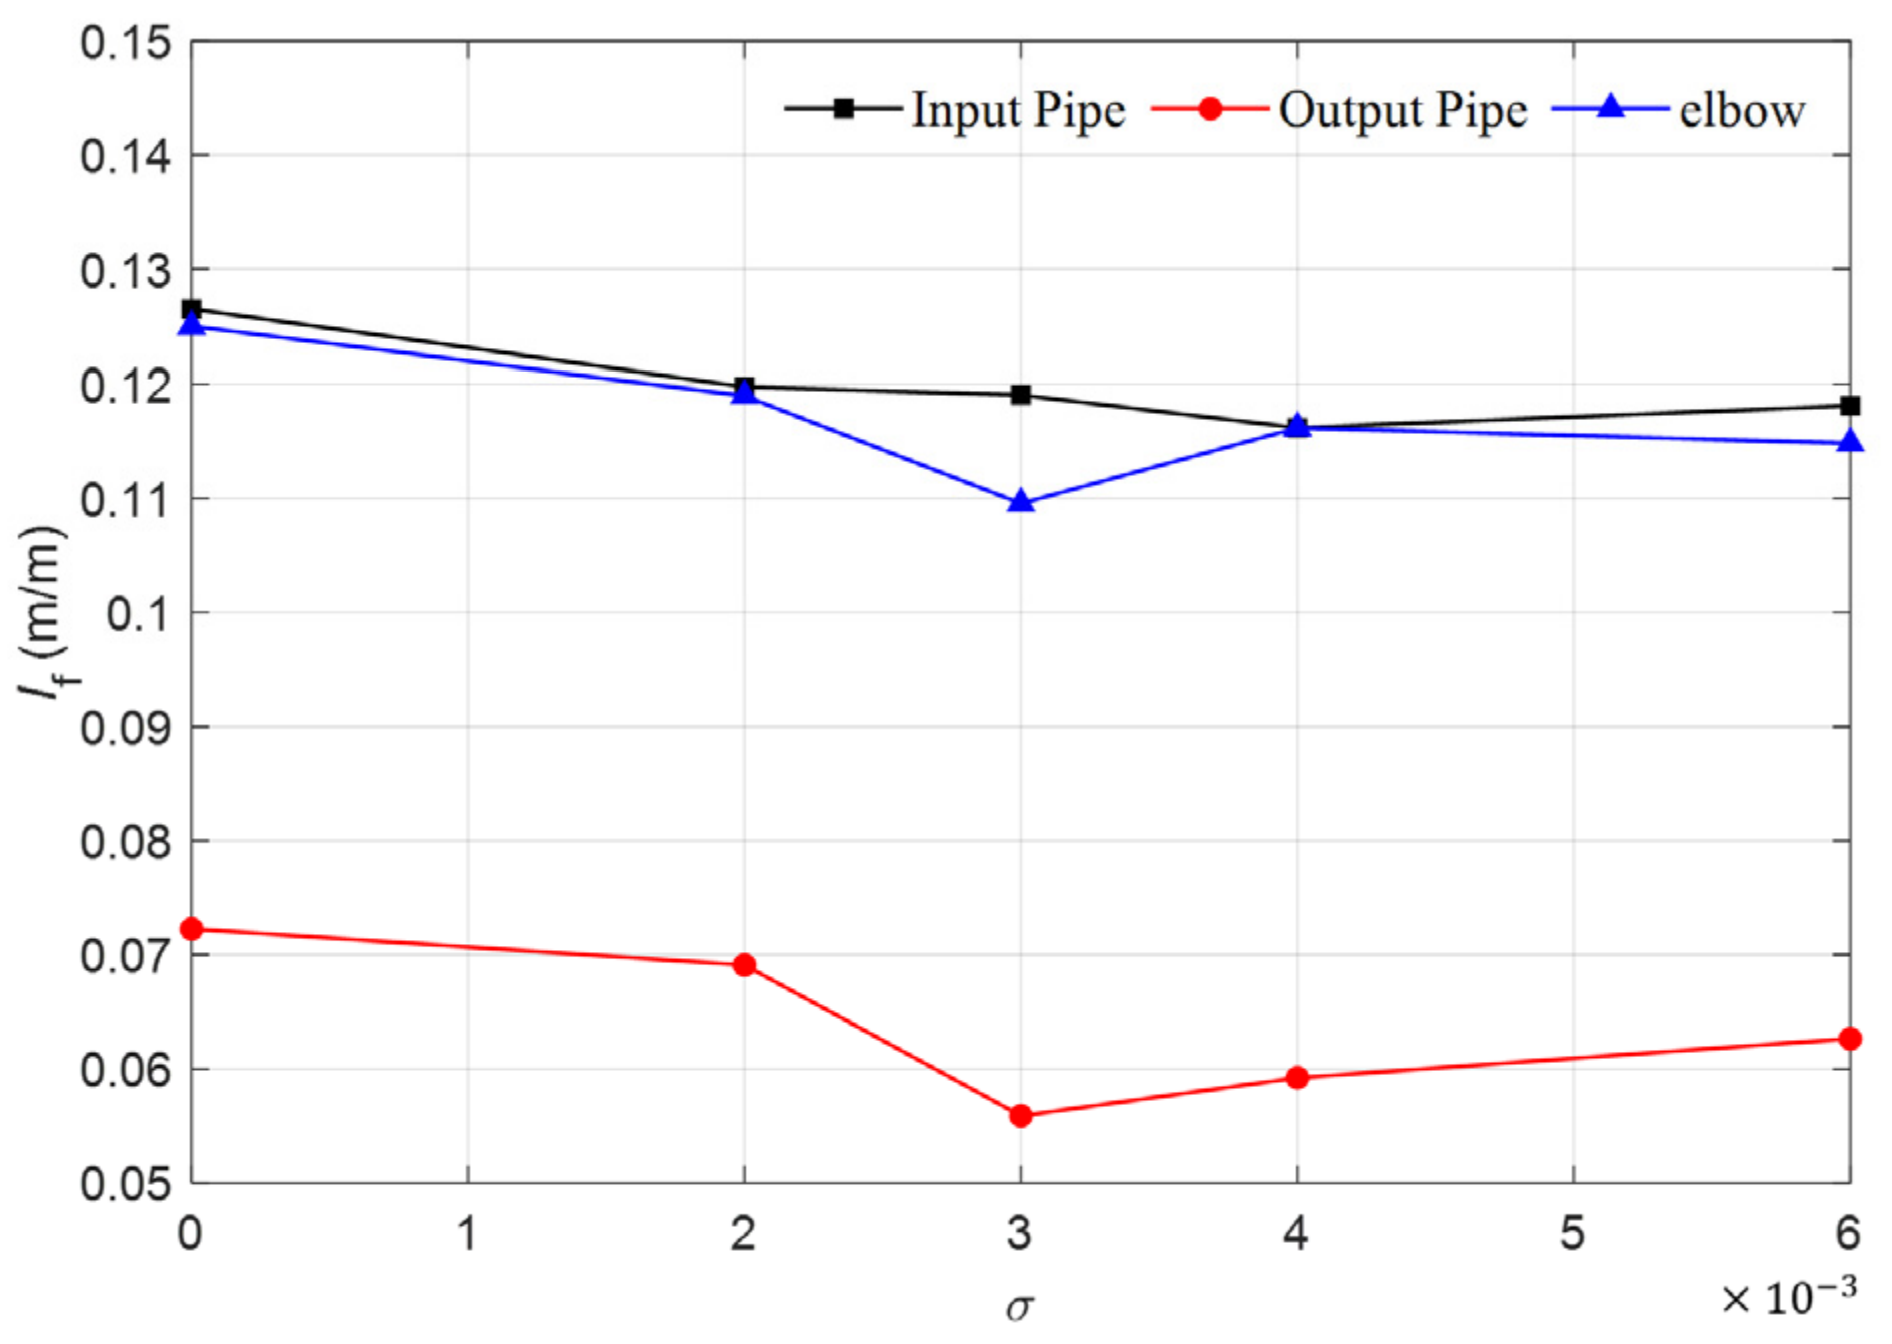
Figure 24 and Figure 25 show that the pressure response to particle gradation is moderate and non-monotonic. The apparent hydraulic gradient decreases initially and then increases, becoming relatively stable for ≥ 0.004. The present results indicate that this hydraulic response occurs together with changes in downstream solids redistribution and particle mobility.
Figure 24.
Axial pressure distributions along the pipeline at different .
Figure 25.
Influence of on in the inlet pipe, elbow region, and outlet pipe.
4.4.3. Effect of Particle Gradation on Flow Patterns
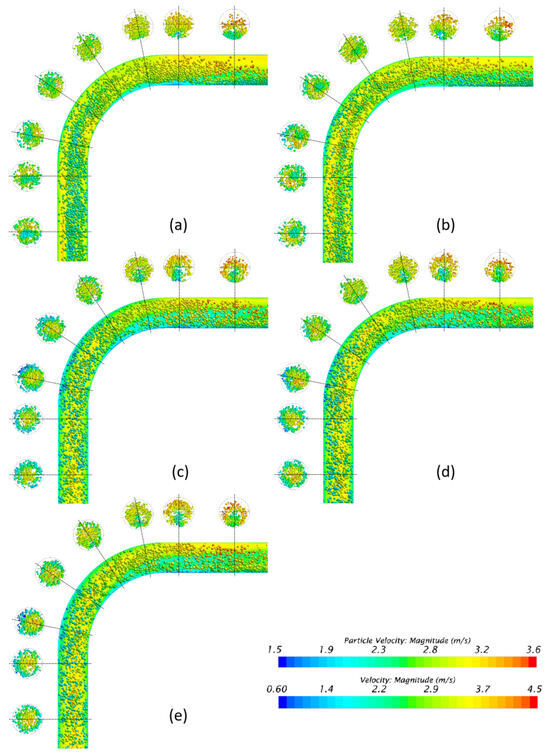
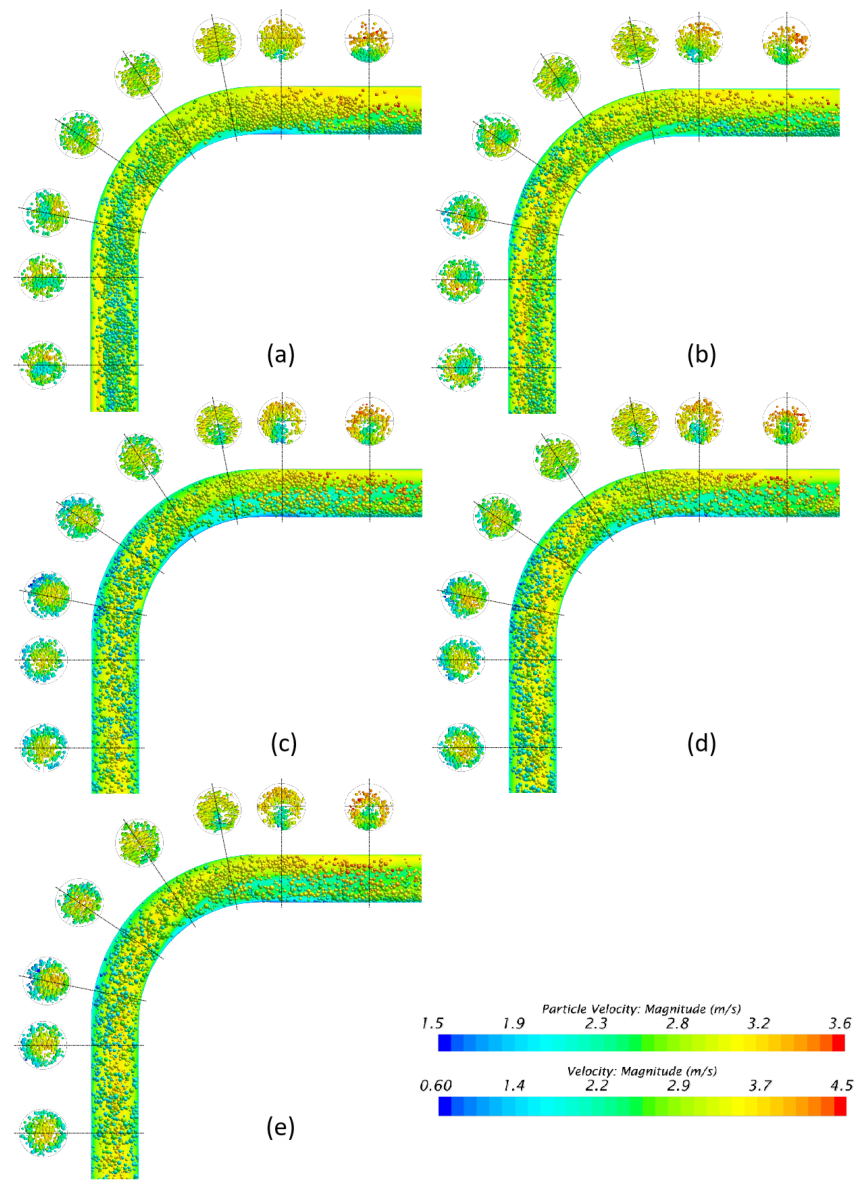
Figure 26 shows that gradation changes the spatial distribution of high- and low-velocity particles around the bend. In the computed instantaneous fields, larger particles appear more often in lower-velocity regions, while smaller particles appear more often in higher-velocity regions. These instantaneous fields are consistent with the simulated downstream changes in solids holdup and particle mobility.
Figure 26.
Flow patterns for different . (a) ; (b) ; (c) ; (d) ; (e) .
4.5. Effect of Particle Density
In practical mining, the conveyed material may contain minerals with different densities. To isolate the effect of density contrast, five particle densities are considered: 1500, 1750, 2000, 2250, and 2500 kg/m3.
4.5.1. Effect of Particle Density on Particle Characteristics
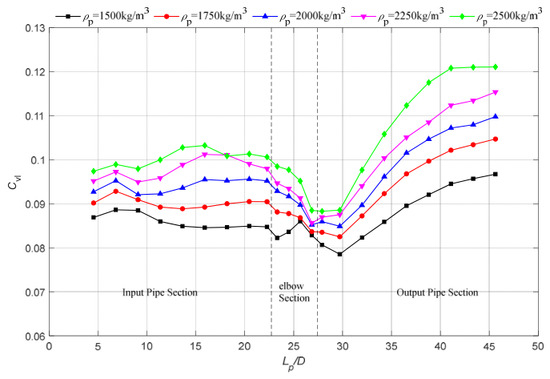
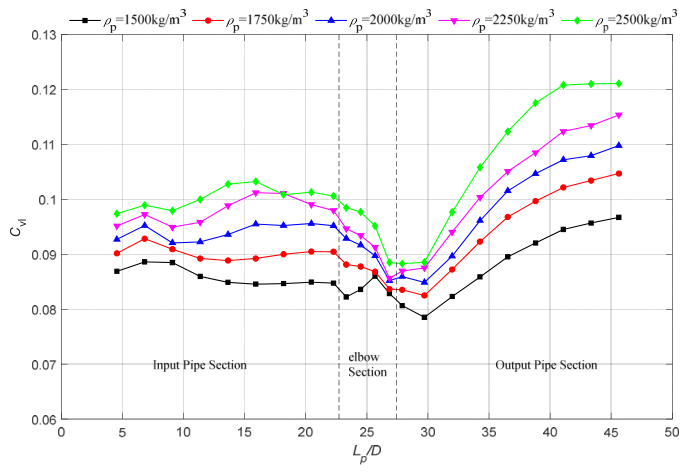
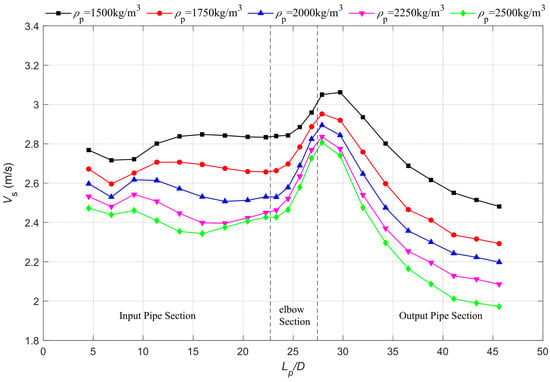
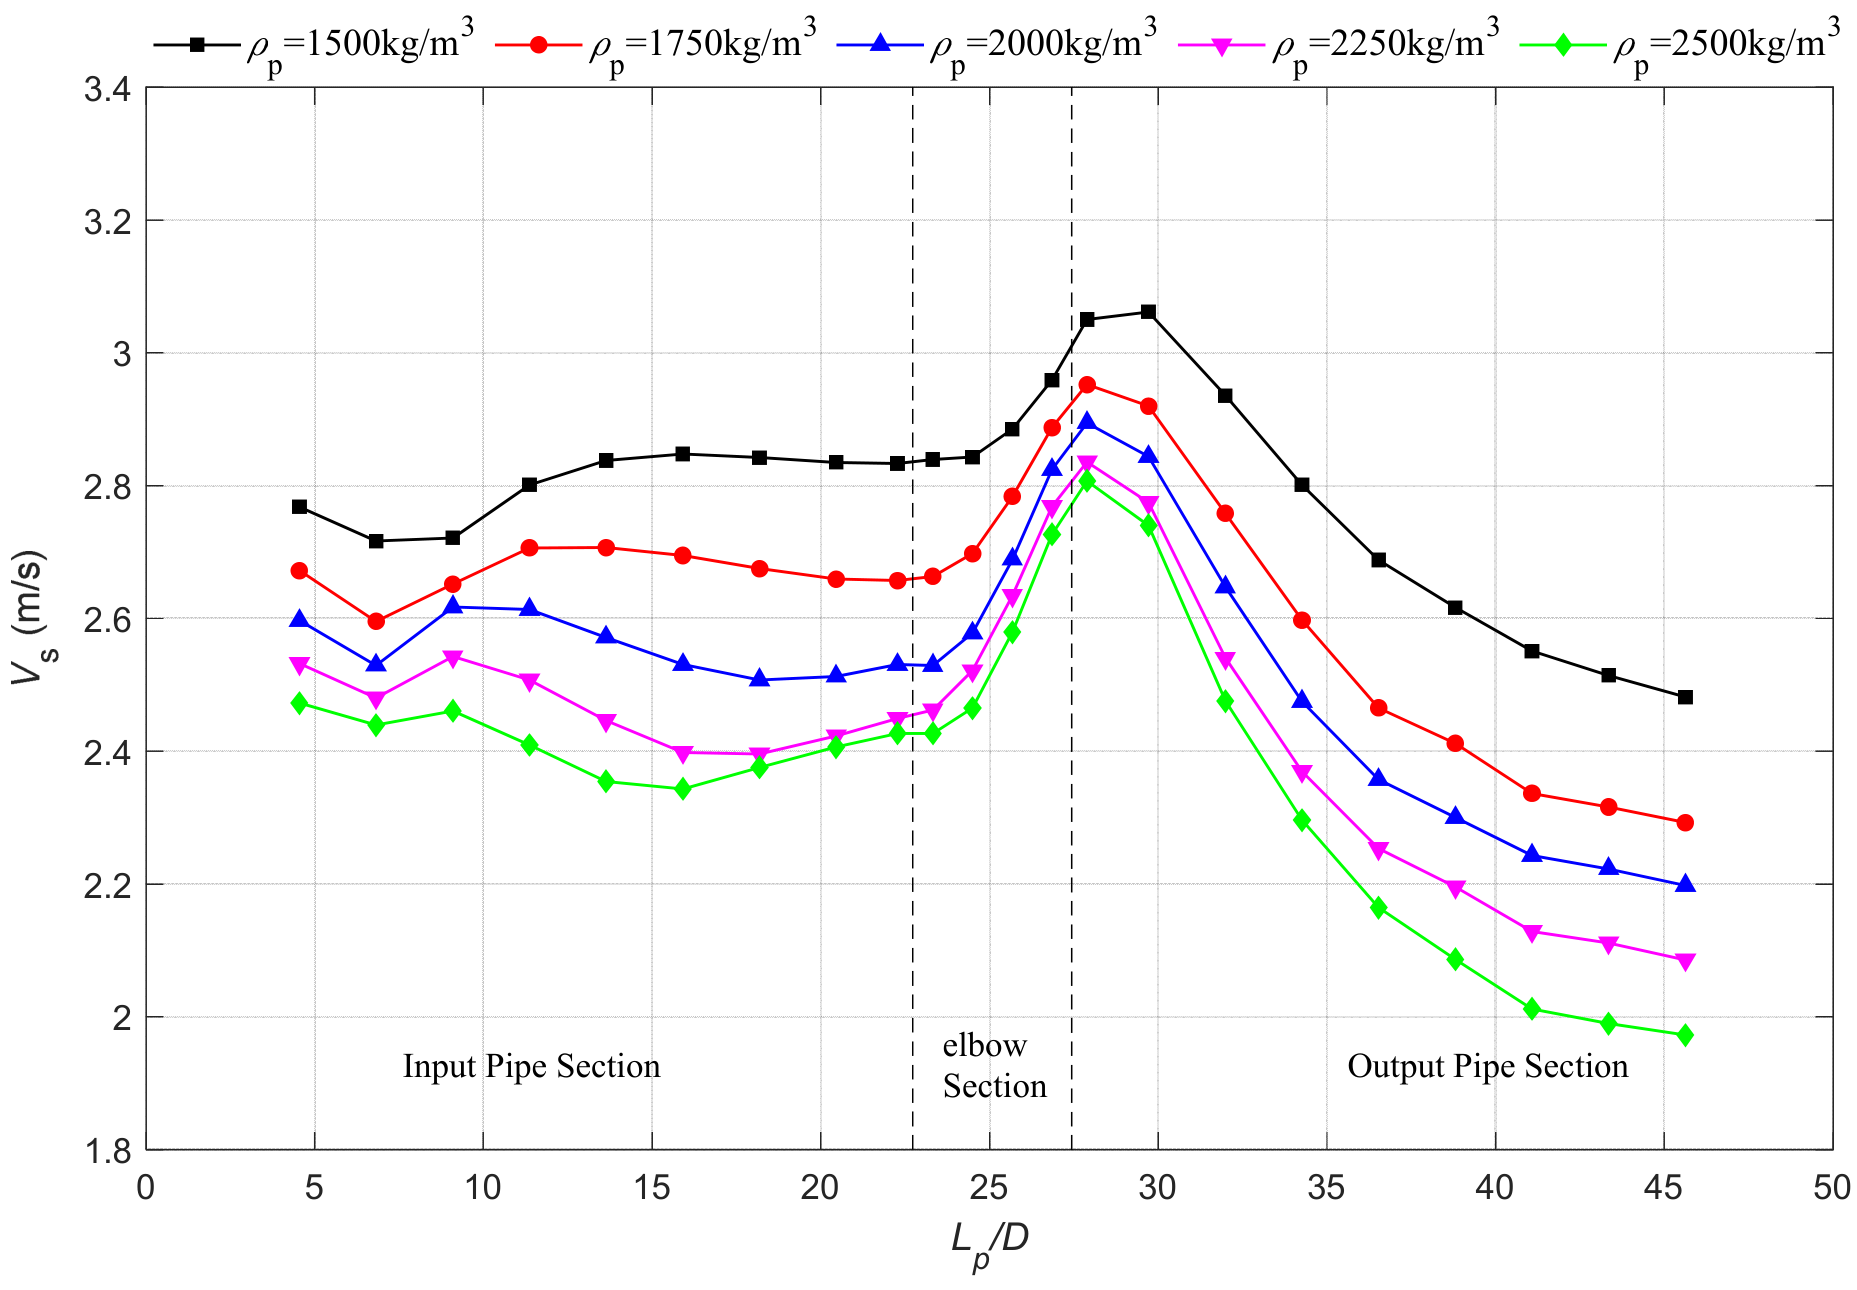
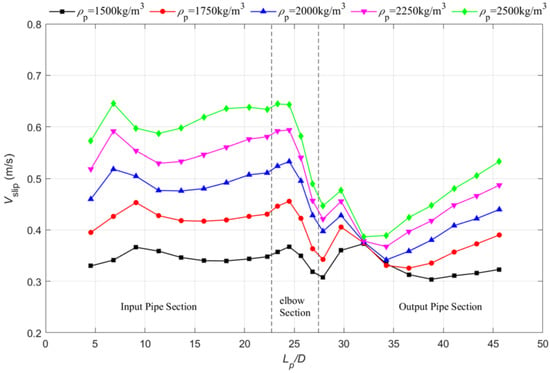
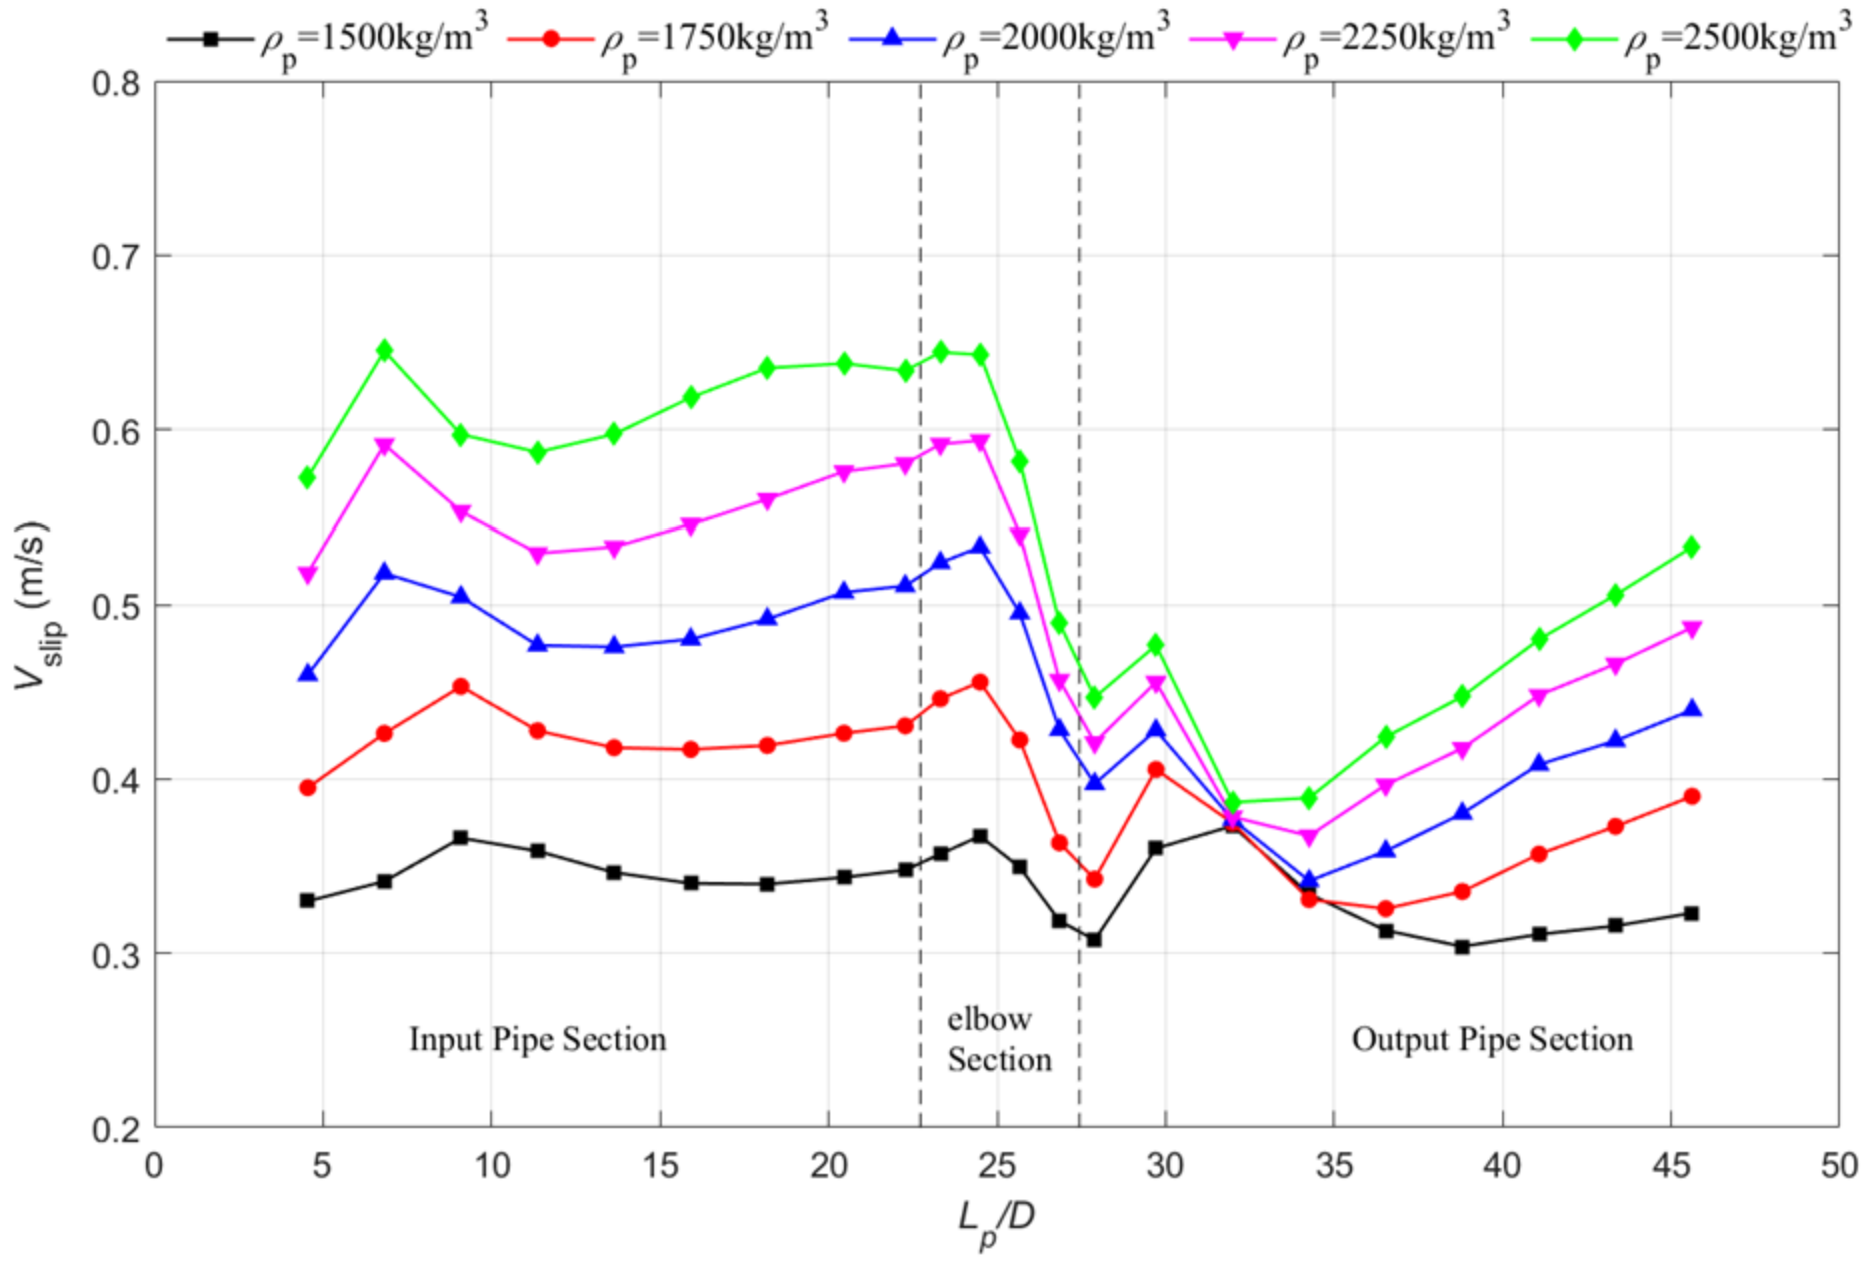
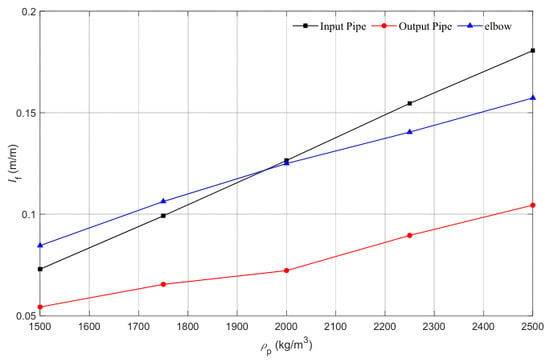
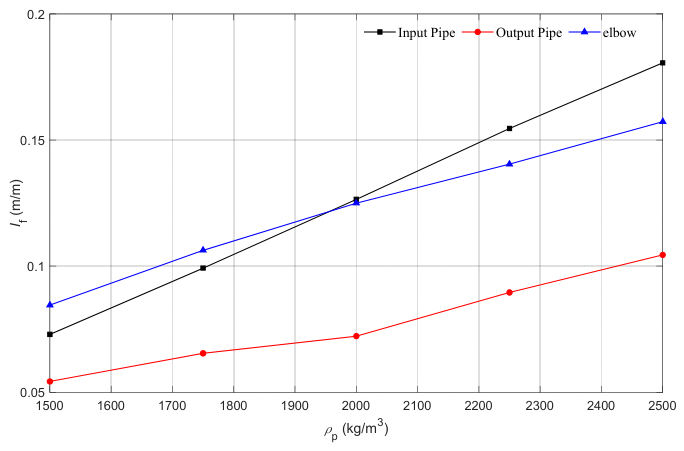
Figure 27 shows that local particle concentration increases as particle density increases throughout the pipeline. Figure 28 and Figure 29 further indicate that increasing density decreases particle velocity while increasing slip velocity in both the vertical inlet and horizontal outlet sections. This trend is physically consistent with the increase in the effective gravitational force acting on the particles. Under comparable drag conditions, particles with higher density exhibit weaker acceleration and therefore require a larger fluid-particle velocity difference to maintain suspension and transport. As a result, high-density particles are more susceptible to settling and local accumulation.
Figure 27.
Axial variations of along the pipeline at different .
Figure 28.
Axial variations of along the pipeline at different .
Figure 29.
Axial variations of along the pipeline at different .
In the bend, the differences in particle velocity, slip velocity, and local concentration become less pronounced than those in the straight sections. This observation suggests that secondary-flow-induced acceleration, trajectory deflection, and particle-wall collisions in the bend partially weaken the direct influence of particle density. After the bend, however, the influence of density becomes evident again. High-density particles settle faster and form a moving bed earlier, which leads to a higher local concentration and a lower downstream particle velocity.
4.5.2. Effect of Particle Density on Pressure Drop
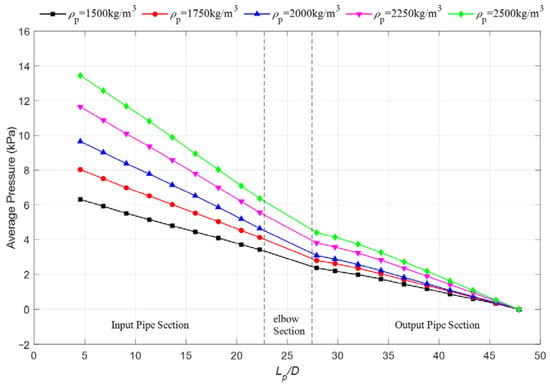
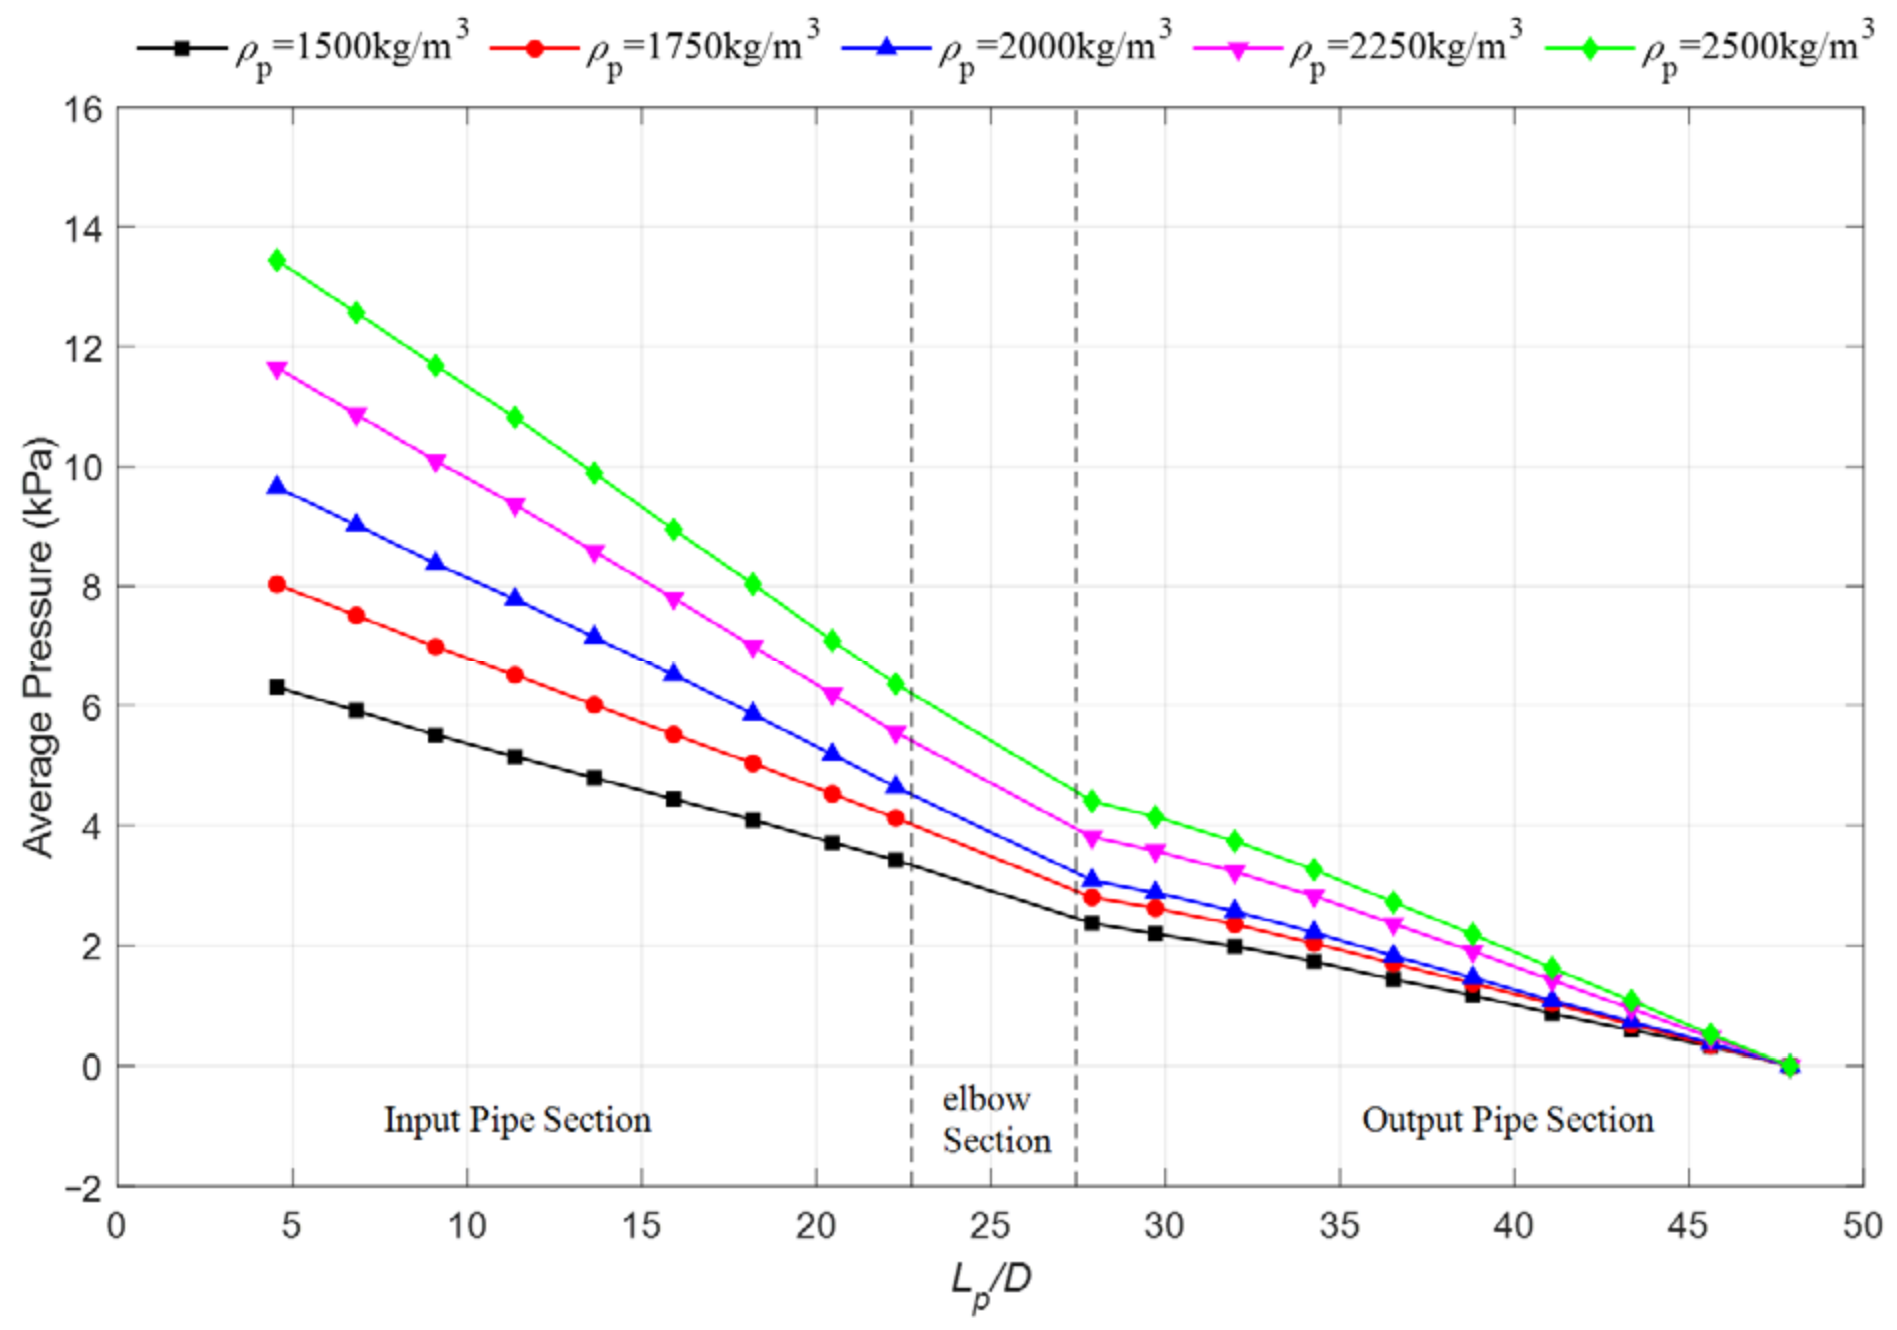
Figure 30 shows that the hydrostatic-corrected pressure drop increases with particle density. The increase in the vertical inlet section is attributed primarily to the larger gravity-induced particle slip and the resulting increase in fluid–particle momentum exchange. In the horizontal outlet section, denser particles settle more strongly and form a more concentrated moving bed, which increases wall/contact dissipation and interphase momentum transfer. Figure 31 therefore shows an increasing hydrostatic-corrected apparent hydraulic gradient with in all three sections, with the strongest response in the inlet and bend regions under the investigated condition.
Figure 30.
Axial pressure distributions along the pipeline at different .
Figure 31.
Influence of on in the inlet pipe, elbow region, and outlet pipe.
4.5.3. Effect of Particle Density on Flow Patterns
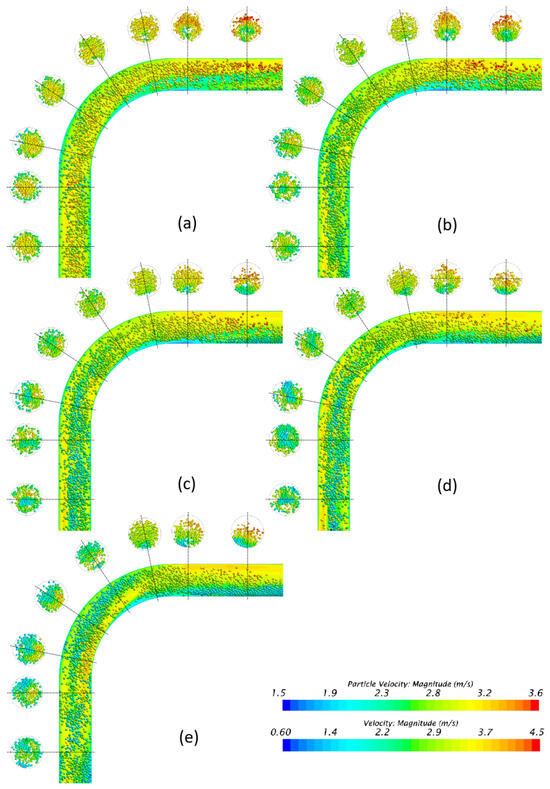
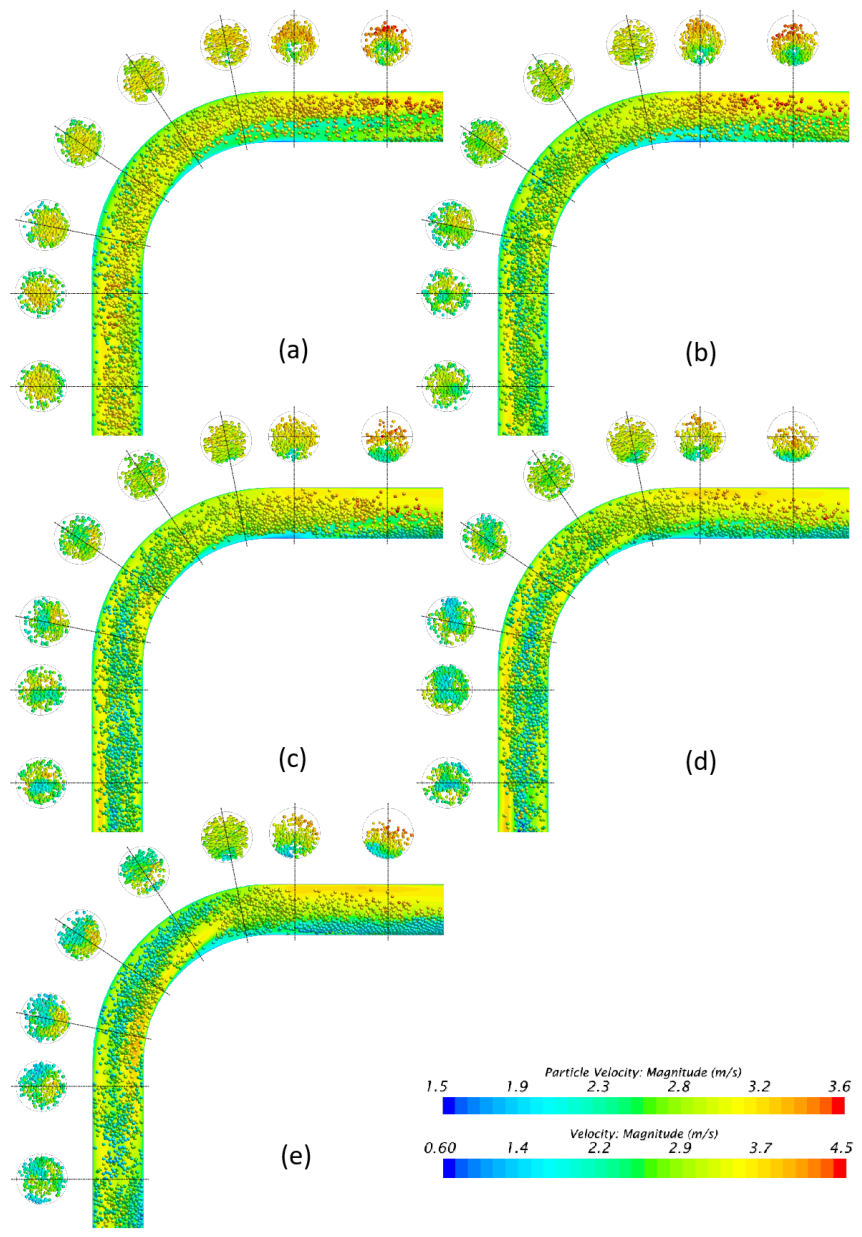
Figure 32 shows that the overall particle velocity decreases as particle density increases. Low-density particles are more readily entrained by the carrier flow and account for a larger proportion of high-velocity particles, whereas high-density particles generate larger low-velocity regions and promote earlier moving-bed formation after the bend. Thus, increasing density strengthens local accumulation and deposition tendencies in the downstream section.
Figure 32.
Flow patterns for different . (a) ; (b) ; (c) ; (d) ; (e) .
5. Conclusions
A two-way coupled CFD–DEM framework was used to investigate coarse-particle hydraulic transport through a vertical-to-horizontal bend under representative deep-sea mining conditions. The framework was benchmarked against published horizontal-pipe, vertical-pipe, local particle-transport, and elbow pressure-drop experiments. It was then applied to examine the effects of feed concentration, particle diameter, particle-size distribution, and particle density on local particle concentration, particle velocity, slip velocity, flow pattern, pressure distribution, and apparent hydraulic gradient. No matched experimental data are available for the integrated vertical–elbow–horizontal configuration; thus, these results are comparative numerical trends rather than fully validated quantitative predictions for the complete system.
Under the investigated conditions, the time-averaged local particle concentration generally exceeds the imposed feed concentration, indicating sustained solids accumulation within the pipeline. A distinct concentration trough occurs within approximately 2–3 D downstream of the bend as the particles accelerate after passing through the elbow. Farther downstream, particle settling promotes moving-bed development, accompanied by a decrease in particle velocity and a renewed increase in local concentration.
Increasing feed concentration increases time-averaged local particle concentration and pressure drop throughout the pipeline. Relative concentration amplification changes little in the vertical inlet but decreases in the horizontal outlet as feed concentration increases. The apparent hydraulic gradient increases approximately linearly with feed concentration and is larger in the inlet and bend than in the outlet for the tested cases.
Particle diameter primarily affects the local transport pattern and particle accumulation, while its influence on the apparent hydraulic gradient is comparatively weak. Smaller particles exhibit a more uniform suspension-like distribution, whereas larger particles show more pronounced local accumulation and moving-bed development.
Broader particle gradations are associated with a smaller downstream increase in local particle concentration and weaken the attenuation of particle velocity. The apparent hydraulic gradient first decreases and then increases with gradation and changes little for σ ≥ 0.004 m.
Increasing particle density decreases particle velocity and increases slip velocity, local particle concentration, and apparent hydraulic gradient. These changes are more pronounced in the vertical inlet. In the horizontal outlet, denser particles show stronger settling, earlier moving-bed development, greater local solids holdup, and a larger hydrostatic-corrected pressure drop.
Author Contributions
Methodology, H.X. and H.C.; Software, Y.C.; Formal analysis, H.C.; Investigation, H.X. and H.C.; Writing—original draft, H.X.; Writing—review & editing, H.C. and Y.C.; Visualization, H.X.; Supervision, Y.C.; Project administration, Y.C.; Funding acquisition, H.X. All authors have read and agreed to the published version of the manuscript.
Funding
This research was supported by the Innovational Fund for Scientific and Technological Personnel of Hainan Province (Funder: Department of Science and Technology of Hainan Province; Grant No. KJRC2023D37).
Data Availability Statement
The data presented in this study are available on request from the corresponding author.
Conflicts of Interest
The authors declare that they have no known competing financial interests or personal relationships that could have appeared to influence the work reported in this paper.
References
- Li, Q.; Li, Q.; Wu, J.; He, K.; Xia, Y.; Liu, J.; Wang, F.; Cheng, Y. Wellhead Stability During Development Process of Hydrate Reservoir in the Northern South China Sea: Sensitivity Analysis. Processes 2025, 13, 1630. [Google Scholar] [CrossRef] [Scilit]
- Kang, Y.; Liu, S. The Development History and Latest Progress of Deep-Sea Polymetallic Nodule Mining Technology. Minerals 2021, 11, 1132. [Google Scholar] [CrossRef] [Scilit]
- Toro, N.; Robles, P.; Jeldres, R.I. Seabed mineral resources, an alternative for the future of renewable energy: A critical review. Ore Geol. Rev. 2020, 126, 103699. [Google Scholar] [CrossRef] [Scilit]
- Chen, R.; Deng, S.; Zhao, L.; Zhao, R.; Xu, W. Energy recovery from wastewater in deep-sea mining: Feasibility study on an energy supply solution with cold wastewater. Appl. Energy 2022, 305, 117719. [Google Scholar] [CrossRef] [Scilit]
- Wang, R.; Zhu, Z.; Su, X.; Mianowicz, K.; Jia, H.; Wu, K. Slurry pumps in deep-sea mining: A review of numerical and experimental studies. Ocean Eng. 2022, 251, 111150. [Google Scholar] [CrossRef] [Scilit]
- Cho, S.-G.; Park, S.; Oh, J.; Min, C.; Kim, H.; Hong, S.; Jang, J.; Lee, T.H. Design optimization of deep-seabed pilot miner system with coupled relations between constraints. J. Terramechanics 2019, 83, 25–34. [Google Scholar] [CrossRef] [Scilit]
- Singh, J.P.; Kumar, S.; Mohapatra, S. An experimental study on head loss characteristics of pipe bends for flow of coal–water slurry at high solid concentration. Proc. Inst. Mech. Eng. Part E J. Process Mech. Eng. 2019, 233, 1151–1161. [Google Scholar] [CrossRef] [Scilit]
- Chu, K.W.; Yu, A.B. Numerical Simulation of the Gas–Solid Flow in Three-Dimensional Pneumatic Conveying Bends. Ind. Eng. Chem. Res. 2008, 47, 7058–7071. [Google Scholar] [CrossRef] [Scilit]
- Li, Y.; Liu, S.; Hu, X. Research on reflux in deep-sea mining pump based on DEM-CFD. Mar. Georesources Geotechnol. 2019, 38, 744–752. [Google Scholar] [CrossRef] [Scilit]
- Parenteau, T. Flow Assurance for Deepwater Mining. In International Conference on Ocean, Offshore and Arctic Engineering, Shanghai, China, 6–11 June 2010; American Society of Mechanical Engineers Digital Collection: Little Falls, NJ, USA, 2010; pp. 11–21. [Google Scholar]
- Zhou, M.; Kuang, S.; Xiao, F.; Luo, K.; Yu, A. CFD-DEM analysis of hydraulic conveying bends: Interaction between pipe orientation and flow regime. Powder Technol. 2021, 392, 619–631. [Google Scholar] [CrossRef] [Scilit]
- Sharma, A.; Poddar, R.; Saluja, G.; Mallick, S.S. Modeling pressure drop in curvature and reacceleration zones in bends during pneumatic conveying of fine powders. Part. Sci. Technol. 2023, 42, 377–392. [Google Scholar] [CrossRef] [Scilit]
- Tripathi, N.M.; Portnikov, D.; Levy, A.; Kalman, H. Bend pressure drop in horizontal and vertical dilute phase pneumatic conveying systems. Chem. Eng. Sci. 2019, 209, 115228. [Google Scholar] [CrossRef] [Scilit]
- Inthavong, K. A unifying correlation for laminar particle deposition in 90-degree pipe bends. Powder Technol. 2019, 345, 99–110. [Google Scholar] [CrossRef] [Scilit]
- Sheng, L.T.; Xiao, Y.L.; Hsiau, S.S.; Chen, C.P.; Lin, P.S.; Jen, K.K. A study of pneumatic conveying with high-density AM-using metal powder in a pipe bend. Int. J. Mech. Sci. 2020, 181, 105763. [Google Scholar] [CrossRef] [Scilit]
- Lu, Y.; Tong, Z.; Glass, D.H.; Easson, W.J.; Ye, M. Experimental and numerical study of particle velocity distribution in the vertical pipe after a 90° elbow. Powder Technol. 2017, 314, 500–509. [Google Scholar] [CrossRef] [Scilit]
- Kaushal, D.R.; Kumar, A.; Tomita, Y.; Kuchii, S.; Tsukamoto, H. Flow of mono-dispersed particles through horizontal bend. Int. J. Multiph. Flow 2013, 52, 71–91. [Google Scholar] [CrossRef] [Scilit]
- Messa, G.V.; Malavasi, S. Numerical prediction of particle distribution of solid-liquid slurries in straight pipes and bends. Eng. Appl. Comput. Fluid Mech. 2014, 8, 356–372. [Google Scholar] [CrossRef] [Scilit]
- Wang, J.; Wang, S.; Zhang, T.; Battaglia, F. Numerical and analytical investigation of ice slurry isothermal flow through horizontal bends. Int. J. Refrig. 2018, 92, 37–54. [Google Scholar] [CrossRef] [Scilit]
- Hu, Q.; Zou, L.; Lv, T.; Guan, Y.; Sun, T. Experimental and numerical investigation on the transport characteristics of particle-fluid mixture in Y-shaped elbow. J. Mar. Sci. Eng. 2020, 8, 675. [Google Scholar] [CrossRef] [Scilit]
- Patankar, N.A.; Joseph, D.D. Modeling and numerical simulation of particulate flows by the Eulerian-Lagrangian approach. Int. J. Multiph. Flow 2001, 27, 1659–1684. [Google Scholar] [CrossRef] [Scilit]
- Tarodiya, R.; Khullar, S.; Gandhi, B.K. CFD modeling of multi-sized particulate slurry flow through pipe bend. J. Appl. Fluid Mech. 2020, 13, 1311–1321. [Google Scholar] [CrossRef] [Scilit]
- Peretz, F.M.; Levy, A. Bends pressure drop in hydraulic conveying. Adv. Powder Technol. 2019, 30, 1484–1493. [Google Scholar] [CrossRef] [Scilit]
- Chen, L.; Liu, K.; Yao, Y.; Yao, J.; Su, Z.; Luo, G. Flow analysis in right-angled pipes with different geometric shapes and parameters for sludge discharge in slime shield machines measured using a CFD-DEM method. Int. J. Comput. Methods Eng. Sci. Mech. 2020, 21, 231–242. [Google Scholar] [CrossRef] [Scilit]
- Chu, K.W.; Yu, A.B. Numerical simulation of complex particle–fluid flows. Powder Technol. 2008, 179, 104–114. [Google Scholar] [CrossRef] [Scilit]
- Zhou, Z.; Kuang, S.; Chu, K.; Yu, A. Discrete particle simulation of particle–fluid flow: Model formulations and their applicability. J. Fluid Mech. 2010, 661, 482–510. [Google Scholar] [CrossRef] [Scilit]
- Blais, B.; Lassaigne, M.; Goniva, C.; Fradette, L.; Bertrand, F. Development of an unresolved CFD–DEM model for the flow of viscous suspensions and its application to solid–liquid mixing. J. Comput. Phys. 2016, 318, 201–221. [Google Scholar] [CrossRef] [Scilit]
- Ren, B.; Zhong, W.; Jin, B.; Yuan, Z.; Lu, Y. Computational fluid dynamics (CFD)–discrete element method (DEM) simulation of gas–solid turbulent flow in a cylindrical spouted bed with a conical base. Energy Fuels 2011, 25, 4095–4105. [Google Scholar] [CrossRef] [Scilit]
- Di Felice, R. The voidage function for fluid-particle interaction systems. Int. J. Multiph. Flow 1994, 20, 153–159. [Google Scholar] [CrossRef] [Scilit]
- Sommerfeld, M. Theoretical and Experimental Modelling of Particulate Flows; Technical Report Lecture Series 2000–06; von Karman Institute for Fluid Dynamics: Sint-Genesius-Rode, Belgium, 2000; pp. 20–23. [Google Scholar]
- Auton, T.R.; Hunt, J.C.R.; Prud Homme, M. The force exerted on a body in inviscid unsteady non-uniform rotational flow. J. Fluid Mech. 1988, 197, 241–257. [Google Scholar] [CrossRef] [Scilit]
- Johnson, K.L. Contact Mechanics; Cambridge University Press: Cambridge, UK, 1985. [Google Scholar]
- Di Renzo, A.; Di Maio, F.P. Comparison of contact-force models for the simulation of collisions in DEM-based granular flow codes. Chem. Eng. Sci. 2004, 59, 525–541. [Google Scholar] [CrossRef] [Scilit]
- Tsuji, Y.; Kawaguchi, T.; Tanaka, T. Discrete particle simulation of two-dimensional fluidized bed. Powder Technol. 1993, 77, 79–87. [Google Scholar] [CrossRef] [Scilit]
- Li, Y.; Xu, Y.; Thornton, C. A comparison of discrete element simulations and experiments for ‘sandpiles’ composed of spherical particles. Powder Technol. 2005, 160, 219–228. [Google Scholar] [CrossRef] [Scilit]
- Yang, S.; Luo, K.; Fan, J.; Cen, K. Particle-scale investigation of the solid dispersion and residence properties in a 3-D spout-fluid bed. AIChE J. 2014, 60, 2788–2804. [Google Scholar] [CrossRef] [Scilit]
- Zhou, L.; Li, T.; Ma, H.; Liu, Z.; Dong, Y.; Zhao, Y. Development and verification of an unresolved CFD–DEM method applicable to different-sized grids. Powder Technol. 2024, 432, 119127. [Google Scholar] [CrossRef] [Scilit]
- Crawford, N.; Spence, S.; Simpson, A.; Cunningham, G. A numerical investigation of the flow structures and losses for turbulent flow in 90° elbow bends. Proc. Inst. Mech. Eng. Part E J. Process Mech. Eng. 2009, 223, 27–44. [Google Scholar] [CrossRef] [Scilit]
- Apalowo, R.K. Numerical study of different models for turbulent flow in 90° pipe bend. U.Porto J. Eng. 2022, 8, 121–134. [Google Scholar] [CrossRef] [Scilit]
- Liu, L.; Zhang, X.; Tian, X.; Li, X. Numerical investigation on dynamic performance of vertical hydraulic transport in deepsea mining. Appl. Ocean Res. 2023, 130, 103443. [Google Scholar] [CrossRef] [Scilit]
- Liu, L.; Gai, K.; Yang, J.; Guo, X. Numerical Investigation on the Dynamics of Mixture Transport in Flexible Risers during Deep-Sea Mining. J. Mar. Sci. Eng. 2022, 10, 1842. [Google Scholar] [CrossRef] [Scilit]
- Ravelet, F.; Bakir, F.; Khelladi, S.; Rey, R. Experimental study of hydraulic transport of large particles in horizontal pipes. Exp. Therm. Fluid Sci. 2013, 45, 187–197. [Google Scholar] [CrossRef] [Scilit]
- Xia, J.; Ni, J.R.; Mendoza, C. Hydraulic lifting of manganese nodules through a riser. J. Offshore Mech. Arct. Eng. 2004, 126, 72–77. [Google Scholar] [CrossRef] [Scilit]
- Engelmann, H.E. Vertical hydraulic lifting of large-size particles—A contribution to marine mining. In Proceedings of the Offshore Technology Conference; OTC: Houston, TX, USA, 1978. [Google Scholar]
- Toda, M.; Komori, N.; Saito, S.; Maeda, S. Hydraulic conveying of solids through pipe bends. J. Chem. Eng. Jpn. 1972, 5, 4–13. [Google Scholar] [CrossRef] [Scilit]
- Matousek, V. Pressure drops and flow patterns in sand-mixture pipes. Exp. Therm. Fluid Sci. 2002, 26, 693–702. [Google Scholar] [CrossRef] [Scilit]

Disclaimer/Publisher’s Note: The statements, opinions and data contained in all publications are solely those of the individual author(s) and contributor(s) and not of MDPI and/or the editor(s). MDPI and/or the editor(s) disclaim responsibility for any injury to people or property resulting from any ideas, methods, instructions or products referred to in the content. |
© 2026 by the authors. Licensee MDPI, Basel, Switzerland. This article is an open access article distributed under the terms and conditions of the Creative Commons Attribution (CC BY) license.