


Abstract
Substituting chemical fertilizer (CF) with biogas slurry (BS) is a promising strategy for sustainable agriculture, yet determining appropriate substitution ratios and their impacts remains challenging across different soil-crop systems. This study investigated five BS-to-CF ratios under an equal ammonium NH4+-N loading of approximately 60–63 kg/ha (R1: 100% BS; R2: 75% BS + 25% CF; R3: 50% BS + 50% CF; R4: 25% BS + 75% CF; R5: 0% BS + 100% CF) through field experiments to evaluate their impacts on soil properties, shallow groundwater quality, and soil microbial communities during winter wheat cultivation in the Huaihe–Yangtze River divide zone. Results demonstrated that the R4 treatment optimized the soil microenvironment under the conditions tested and achieved the highest winter wheat yield (5792.28 kg/ha), surpassing the pure CF treatment (R5) while increasing soil total nitrogen accumulation by 23.68%. Groundwater monitoring indicated that full chemical fertilization (R5) induced nitrate (NO3−-N) leaching risks, reaching NO3−-N concentrations up to 4.10 mg/L at a 1.5 m depth. Conversely, BS substitution treatments (R1–R4) were associated with lower nitrate concentrations in shallow groundwater than the CF treatment, without evidence of increased toxic heavy metal contamination or persistent dissolved organic matter pollution. High-throughput 16S rRNA sequencing revealed that partial BS substitution enriched essential functional microbial taxa, including Pseudomonadota, Actinomycetota, and Chloroflexota, that are potentially involved in organic matter degradation and nutrient cycling. Overall, partial substitution of CF with BS, particularly the R4 treatment, improved crop productivity, optimized soil microbial communities, and reduced groundwater pollution risk, providing scientific support for developing green, low-carbon farming systems.
1. Introduction
Biogas slurry (BS), the primary byproduct of anaerobic digestion, has been continuously generated due to the intensification and large-scale production of livestock and poultry farming [1,2]. Human activities currently add approximately 150 Tg of reactive nitrogen to the Earth’s land surface annually, with livestock accounting for about one-third of human-induced nitrogen emissions. Excessive nitrogen inputs and losses can degrade soil and water quality, highlighting the importance of sustainable nitrogen and manure management [3,4], and their inappropriate management has caused serious pollution of soil and water bodies. As the liquid end-product of anaerobic digestion of manure, BS is rich in nitrogen, phosphorus, potassium, and organic matter (OM), giving it strong potential as a substitute for chemical fertilizer (CF) [5]. The scientific application of BS to farmland not only reduces reliance on synthetic fertilizers, but also improves soil quality and promotes nutrient cycling [6].
Given the nutrient value of livestock manure, anaerobic digestion and subsequent agricultural utilization of BS offer a potential pathway for nutrient recovery and partial substitution of synthetic fertilizers. However, in the traditional agricultural system dominated by CF, crops have long relied on intensive fertilizer use, with excessive nitrogen application being particularly common [7]. This practice not only raises production costs and reduces nitrogen use efficiency, but also causes serious soil and environmental problems, such as nitrate groundwater contamination and soil compaction [8]. Continuous and excessive CF use also reduces microbial diversity and degrades soil quality, threatening the long-term sustainability of agricultural systems [9]. Therefore, reducing CF dependence and advancing green agricultural transformation have become critical challenges for sustainable agriculture.
The field application of BS is an effective strategy to reduce CF dependence while ensuring the safe recycling of livestock waste [10,11,12]. Emerging evidence further underscores the multifaceted benefits of BS in advancing sustainable agriculture. Sa et al. demonstrated that partial substitution with BS (particularly 35%) improved soil fertility, root activity, and tomato yield in greenhouse systems [10]. Similarly, Sorecha et al. reported that 50% BS substitution enhanced soil quality, increased wheat yield and nitrogen use efficiency, and simultaneously reduced N2O emissions by regulating nitrogen-cycling microbial communities [12]. Extending these insights, Chen et al. showed that co-application of BS with hydrothermal carbonization aqueous products effectively mitigated ammonia (NH3) volatilization, increased soil dissolved organic matter (DOM) and humification, and improved fertility, thereby providing a viable alternative to CF [11]. Collectively, these studies highlight BS as a versatile organic amendment that can sustain crop productivity, enhance soil health, and mitigate environmental adverse impacts.
However, inappropriate application of BS may lead to soil, surface water and groundwater contamination [13,14,15]. Tang et al. reported that long-term BS fertilization increases the accumulation and bioavailability of Cu, Zn, and Cd in soils and crops, indicating potential heavy metal risks despite concentrations remaining within short-term safety thresholds [13]. Similarly, Zeng et al. demonstrated that BS fertilization may result in the leaching of small-molecule organics and nitrates into groundwater [14]. Nitrogen in BS is prone to leaching and denitrification, thereby contributing to nitrate contamination and greenhouse gas emissions (N2O and CH4). Using HYDRUS modeling, Wang et al. revealed nitrogen migration dynamics under BS drip irrigation, showing that optimized application strategies can reduce nitrate leaching by ~50% and simultaneously enhance root nitrogen uptake relative to CF [15]. In addition, the effect of BS land application on soil, groundwater and microbes also depends on the plant species, soil properties and groundwater level. Therefore, while promoting farmland utilization of BS, researchers must systematically assess its ecological and environmental impacts.
Soil hydraulic and sorption behaviour determines whether the nitrogen, phosphorus, potassium and organic matter applied with BS are retained in the root zone or are displaced towards shallow groundwater [16,17,18]. Two mechanisms act in opposite directions. On the one hand, the organic matter added with BS promotes aggregate formation and improves pore-size distribution, which increases the water-holding capacity and the share of infiltrated water that is stored and subsequently transpired rather than drained below the root zone; in addition, NH4+ is a cation that is retained by cation exchange on clay minerals and organic surfaces, and organic N must first be mineralized before it can be leached. On the other hand, BS is a dilute liquid with a high water content, so each application delivers a substantial water load together with mineral N, and the NO3− produced by nitrification is only weakly sorbed by soil solids and moves essentially with the percolating water. Dissolved organic matter can also act as a carrier for metals and nutrients. Whether BS substitution reduces or enhances leaching therefore depends on the balance between the gain in water and nutrient retention and the additional hydraulic and nitrogen loading. This balance is examined in the present study at a shallow-groundwater field site.
This work reported here adds the integration, within a single field trial, of depth-resolved shallow groundwater monitoring, three-dimensional excitation–emission matrix (3D-EEM) fluorescence characterization of dissolved organic matter, and 16S rRNA-based microbial community analysis, which makes it possible to link agronomic performance to subsurface and microbial responses. This study focuses on winter wheat fields in the Huaihe–Yangtze River divide zone of Anhui Province, using field experiments to examine how different proportions of BS and fertilizers affect soil properties and groundwater quality. Specifically, it investigates: (1) how BS influences soil nitrogen cycling, nutrient accumulation, and heavy metal movement; (2) how BS impacts groundwater quality through the migration of nutrients, heavy metals, and organic pollutants across soil layers; and (3) how BS regulates soil microbes and nitrogen-related functional genes. The results aim to support the safe use of BS in wheat production and provide guidance for developing green, low-carbon farming systems.
2. Materials and Methods
2.1. Study Area
The experimental site is located in Lu’an City, Anhui Province, China (31°54′ N, 116°41′ E), with an average elevation of 35 m above sea level. This area is a representative region of the Huaihe–Yangtze River divide zone, which is characterized by a transitional ecotone between the northern subtropical and warm temperate zones. The site experiences a northern subtropical humid monsoon climate, primarily influenced by the warm and moist southeast monsoon during summer (June to August), resulting in high temperatures and concentrated rainfall. The mean annual precipitation is approximately 1200 mm, with about 55% occurring from May to August. Winters are typically cold and dry, and the mean annual temperature is 15.1 °C.
The groundwater table at the experimental site was relatively shallow, generally occurring at a depth of less than 4 m. The dominant soil was a yellow-brown soil with a clay texture (Table S1). The basic physical and chemical properties of the 0–100 cm soil profile are presented in Table S1. The meteorological conditions during the wheat growth period, including rainfall, air temperature, and relative humidity, are shown in Figure S1.
2.2. Experimental Design
The BS used in this experiment was obtained from an anaerobic lagoon at a dairy cattle farm in Lu’an City, Anhui Province, China, the same farm that supplies slurry to the surrounding farmland. The slurry had been anaerobically digested for more than 100 days before collection and was applied to the plots within 30 days of collection. Detailed physicochemical characteristics of the BS, including its dry matter content and electrical conductivity, are provided in Table S2.
This study used winter wheat as the experimental crop, with different ratios of BS and CF (NH4+-N (15%) + P2O5 (15%) + K2O (15%) ≥ 45%) as the experimental factors. Five different BS-to-CF ratios were used: R1: 100% BS + 0% CF; R2: 75% BS + 25% CF; R3: 50% BS + 50% CF; R4: 25% BS + 75% CF; R5: 0% BS + 100% CF. Note: BS refers to the amount of BS applied (m3/ha), while CF refers to the CF (kg/ha). Besides, Polyvinyl Chloride (PVC)-sealed monitoring wells were installed at each designated sampling point, evenly distributed around the perimeter of the experimental field. Each sampling point was equipped with wells at depths of 0.5 m, 1.0 m, 1.5 m, and 2.0 m to enable comprehensive monitoring of vertical variations in groundwater quality and to assess the potential impact of BS application on the groundwater.
Soil sampling was conducted from 30 October 2024 to 30 May 2025, covering the entire winter wheat growing season. Fertilizers were applied and soil samples were collected at key wheat growth stages, including basal fertilization (BF; 2 November 2024) at sowing, seedling fertilization (SF; 14 December 2024), green-up fertilization (GF; 11 March 2025), jointing-booting fertilization (JF; 12 April 2025), foliar fertilization (FF; 3 May 2025), and final harvest (28 May 2025). Soil samples were collected at six corresponding phenological stages: sowing, seedling, overwintering, green-up, jointing and flowering, grain filling, and maturity, with an additional sampling round conducted after harvest. Prior to sowing, the soil was plowed to a depth of 20–30 cm. A micro-ridge planting method typical of the local region was adopted, with 2–3 m-wide protective rows separating the plots. R1-R5 treatments were each replicated three times, resulting in 15 plots. Each plot measured 200 m2. All treatments were designed to receive similar NH4+-N inputs. Accordingly, the BS application rate was adjusted according to its NH4+-N concentration (1049.18 mg/L; Table S2) and the N content of the compound CF (15%), resulting in approximately 60 kg NH4+-N/ha across treatments (Table S3). The specific application rates are provided in Table S3. Agronomic management practices, encompassing pest, disease, and weed control, were implemented in accordance with the protocols commonly adopted by local farmers. The crop relied entirely on natural rainfall during the growing season, with no supplementary irrigation applied. Daily precipitation data during the growing season were obtained from a meteorological station and are summarized in Figure S1.
2.3. Sample Collection
Shallow groundwater samples were collected from the 0–2.0 m depth wells prior to fertilization to establish baseline conditions. These pre-fertilization values serve as the reference (baseline) for all subsequent difference calculations and are reported in Table S7. Sampling was repeated every two weeks after fertilization. Differences between pre- and post-fertilization samples were used to evaluate the influence of BS application on groundwater quality, accounting for vertical transport rates. Prior to groundwater sampling, well purging was conducted to ensure sample integrity. One groundwater sample was collected from each replicate plot at each depth on each sampling date, i.e., three samples per treatment per depth per sampling date (n = 3). A water pump (ESTBIRDS DFN9900S, China) was used to collect groundwater. Water samples were put in amber glass bottles to prevent photodegradation and were immediately stored at 4 °C in a refrigerator until transported to the laboratory for analysis. To address spatial heterogeneity within the soil profile, soil samples from the 0–0.3 m tillage layer were collected using the five-point composite sampling method across multiple field sites, both before and after crop planting. The subsamples collected from each field site were thoroughly homogenized to obtain a composite sample. Thereafter, one portion of each composite sample was air-dried in a shaded, well-ventilated environment for physicochemical analysis, while another portion was stored at −80 °C for microbial community sequencing. Three independent composite samples were collected for each treatment and sampling stage for microbial community sequencing.
2.4. Analytical Methods
To systematically assess the effects of BS application on soil and groundwater quality, a suite of key indicators was selected, including total organic carbon (TOC), ammonium nitrogen (NH4+-N), nitrate nitrogen (NO3−-N), nitrite nitrogen (NO2−-N), total nitrogen (TN), total phosphorus (TP), and total potassium (TK). Additionally, samples were analyzed for heavy metals and chemical oxygen demand (COD, for water samples only) to evaluate potential environmental impacts associated with BS fertilization.
OM content was determined using a TOC analyzer (HT 1300, Analytik Jena, Germany) based on high-temperature catalytic combustion (680 °C). The measured TOC values were converted to OM using the empirical formula given in Equation (S1).
COD, NH4+-N, NO3−-N, NO2−-N, TN, and TP were determined using a UV-Visible spectrophotometer in accordance with Standard APHA [19]. Soil pH was determined potentiometrically in a 1:2.5 soil-to-water suspension using a calibrated glass electrode pH meter (LEICI PHS-2F, Shanghai, China). Heavy metal concentrations in samples were quantified by inductively coupled plasma optical emission spectrometry (ICP-OES) using an iCAP PRO instrument (Thermo Scientific, Waltham, MA, USA) according to Standard Methods for the Examination of Water and Wastewater, Method 3120 B (Metals by ICP-OES).
The three-dimensional excitation–emission matrix (3D-EEM) spectra were acquired using a fluorescence spectrophotometer (Hitachi F-4600 FL, Tokyo, Japan) under the following conditions: excitation slit width of 5 nm, scanning speed of 2400 nm/min, excitation (Ex) wavelength range of 200–450 nm, and emission (Em) wavelength range of 280–550 nm. To resolve and characterize the fluorescent components of DOM in the groundwater, the 3D-EEM data were analyzed in combination with parallel factor analysis (PARAFAC).
The soil microbial community structure was analyzed using high-throughput 16S rRNA gene amplicon sequencing. Three independent biological replicates were collected for each treatment and sampling stage and independently processed and sequenced (n = 3). Sequencing data were processed using the Sangon Biotech Cloud Platform. Sequences with ≥97% similarity were clustered into operational taxonomic units (OTUs) for microbial community composition and diversity analysis. Functional profiles were predicted using PICRUSt2, with predicted gene families mapped to KEGG Orthology (KO) categories and metabolic pathways. The microbial sample of the R2 treatment was unfortunately lost during sample processing, and therefore reliable sequencing data for R2 could not be obtained. Consequently, R2 was excluded from the microbial community analyses, while it was retained in the agronomic, soil, and groundwater analyses because valid samples were available for these measurements.
2.5. Statistical Analysis
All experiments were conducted with at least three independent samples (n ≥ 3). Data are presented as means ± standard deviations. Statistical analyses were performed using Student’s t-test or one-way analysis of variance (ANOVA), followed by the least significant difference (LSD) test for multiple comparisons. Statistical significance was considered at p < 0.05. Relevant mathematical calculations were performed according to the methods described in Supplementary Material S1.1. Different lowercase letters in the figures denote significantly different groups according to the LSD test (p < 0.05); treatments sharing the same letter are not significantly different.
3. Results and Discussion
3.1. Effects on Wheat Production
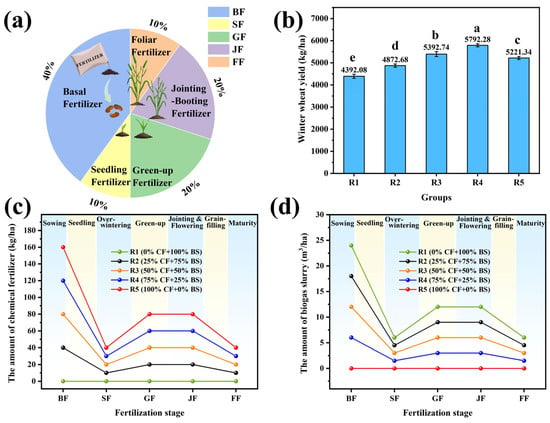
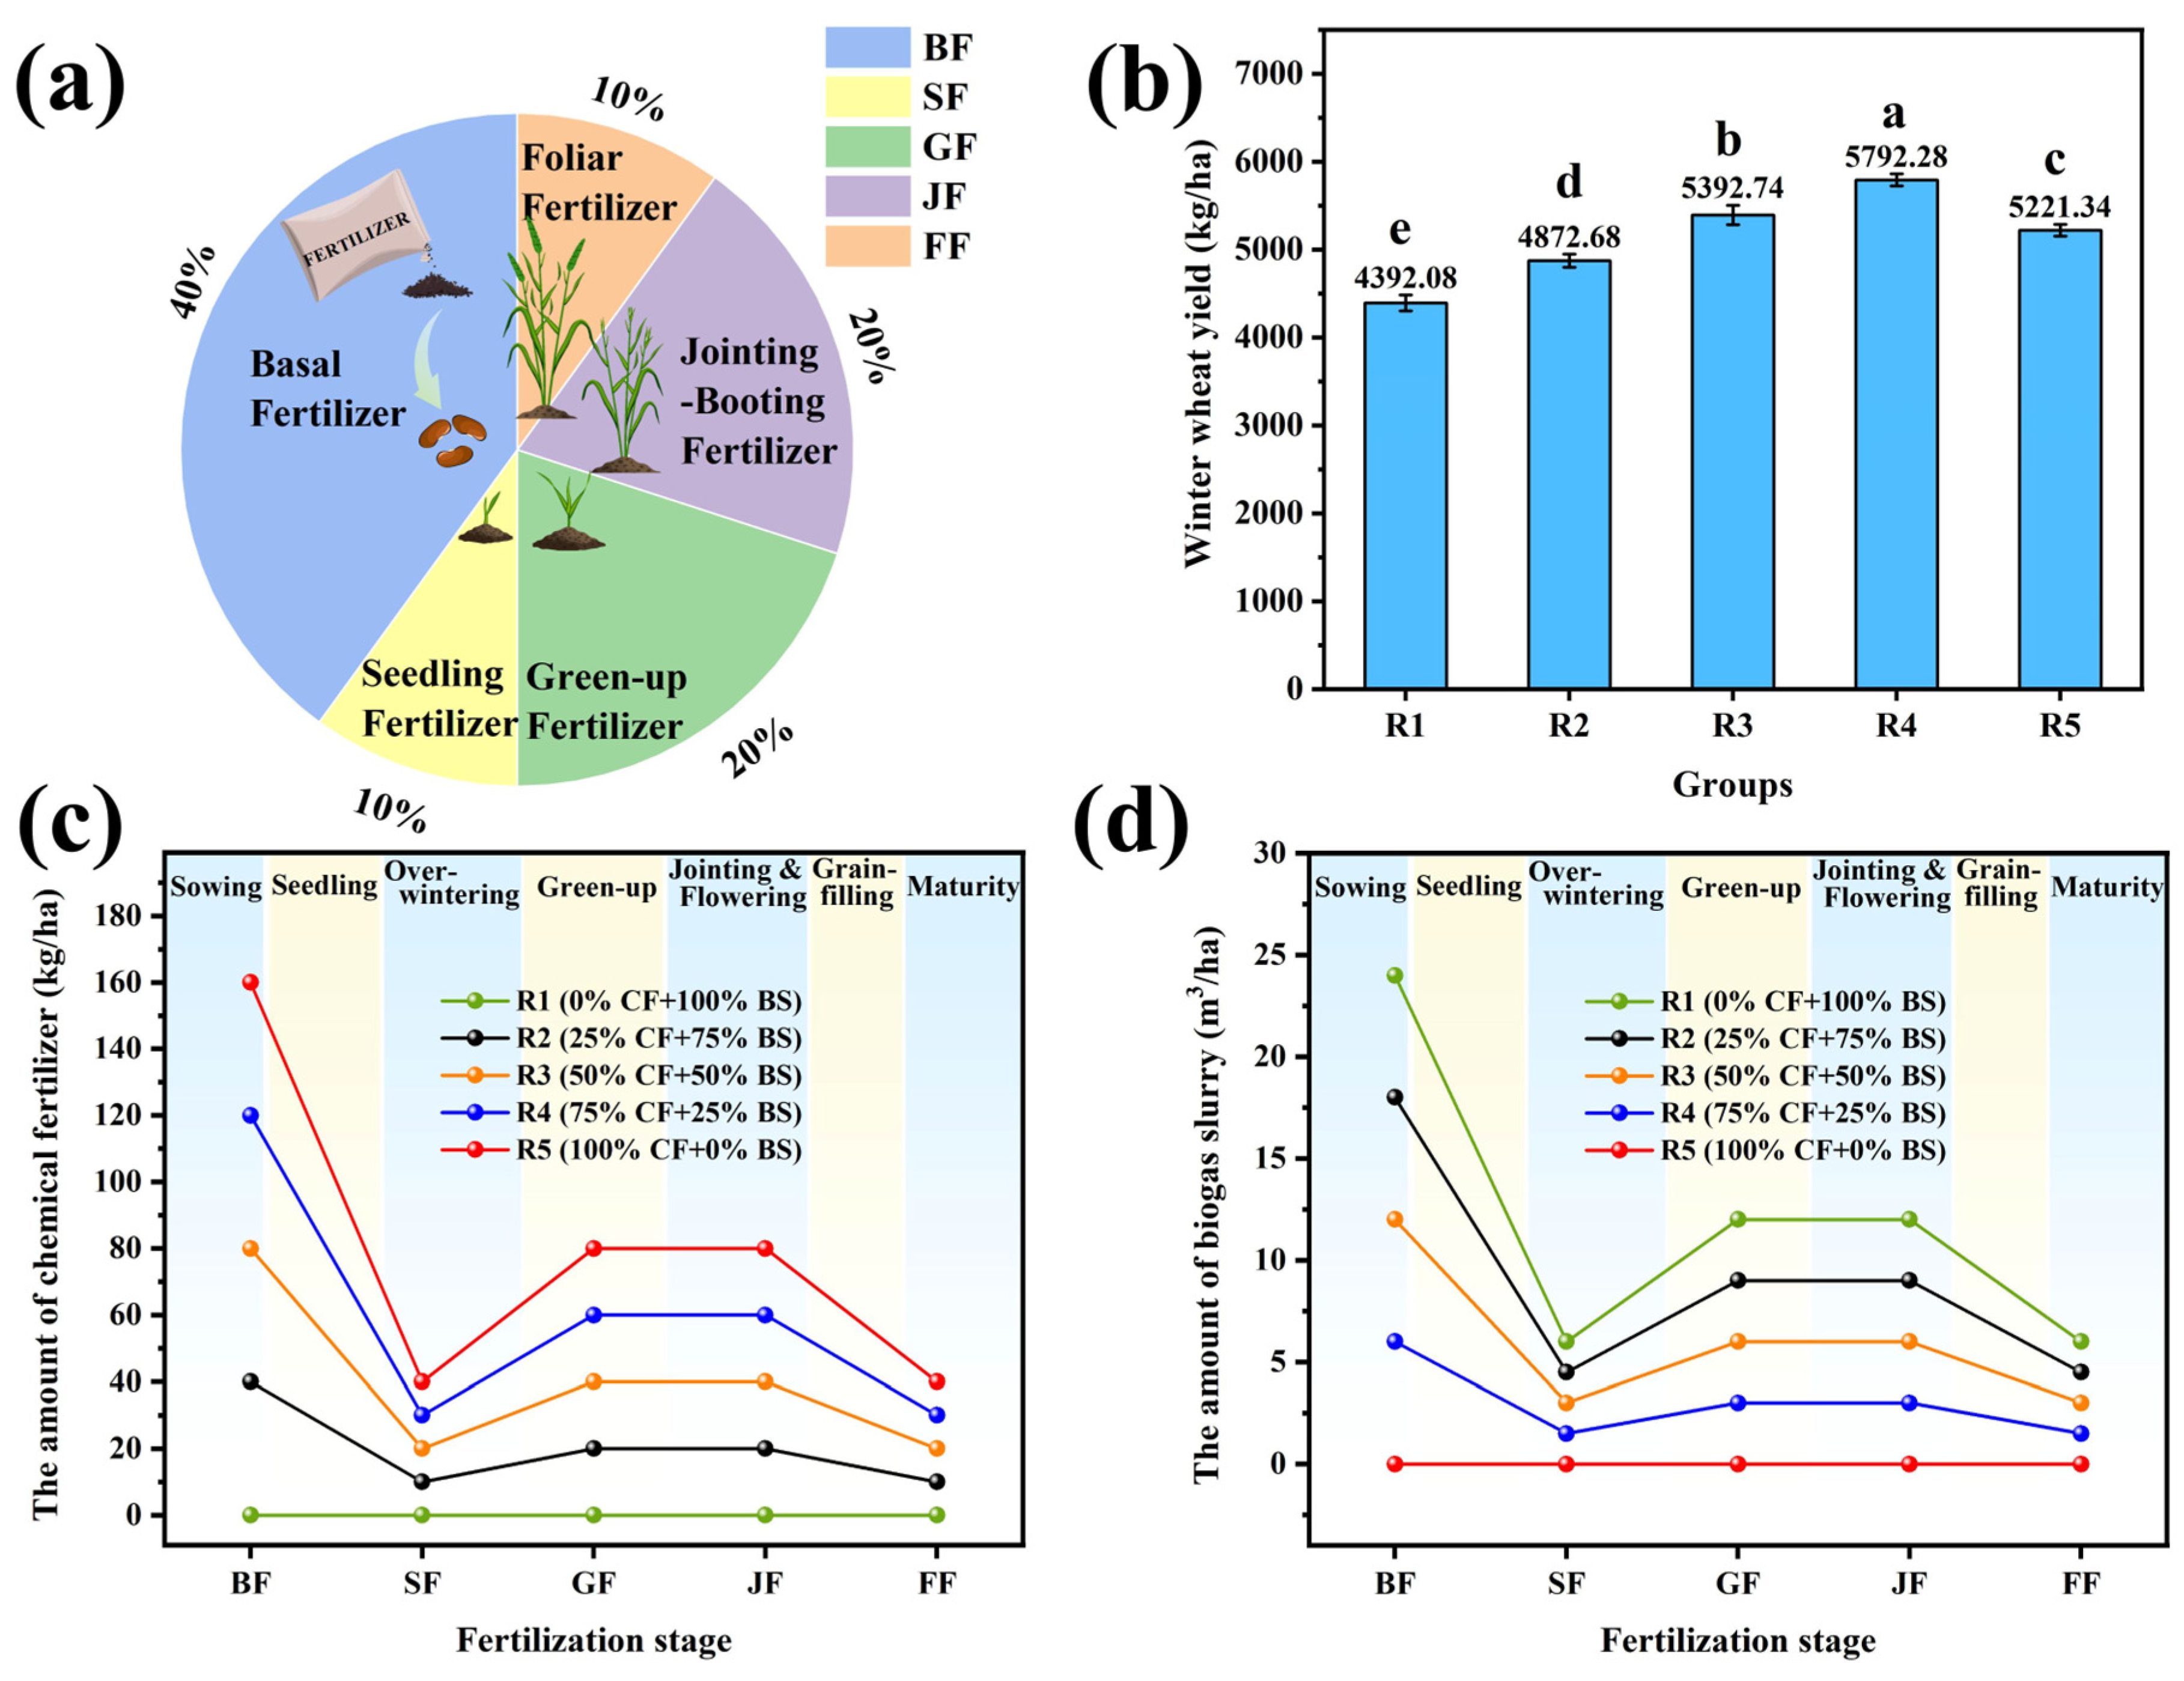
Winter wheat yield is a key indicator for evaluating the feasibility of substituting CF with BS [20]. Fertilizer application varied across wheat growth stages, as illustrated in Figure 1a. In total, 50% of the fertilizer was applied before the over-wintering stage, consisting of 40% basal fertilizer and 10% seedling fertilizer, to ensure seed emergence and support over-wintering and subsequent green-up. Following overwintering, three additional fertilizer applications were conducted: green-up fertilizer (20%), jointing–booting fertilizer (20%), and foliar fertilizer (10%), to promote post-winter tillering and spike development. The specific application rates of CF and BS under treatments R1–R5 are presented in Figure 1c,d.
Figure 1.
Fertilization regimes for R1–R5 winter wheat: (a) Percentage distribution of fertilization by growth stage; (b) Winter wheat yield performance; (c) Chemical fertilizer usage per stage; (d) Biogas slurry application rates per stage. In panel (b), different lowercase letters above the bars indicate significant differences among treatments according to one-way ANOVA followed by the LSD test (p < 0.05); values above the bars are treatment means (n = 3).
Different CF-to-BS substitution ratios influenced winter wheat yield (Figure 1b). R4 (25% BS +75% CF) achieved the highest yield (5792.28 kg/ha), representing a 10.93% increase compared with R5 (0% BS +100% CF). In contrast, wheat yield exhibited a declining trend with increasing BS substitution. The treatment with full BS application (R1, 0% CF + 100% BS) exhibited a 15.88% lower yield than R5, indicating that BS cannot fully replace CF for winter wheat production under the conditions tested. These results highlight the need to further elucidate the effects of BS and CF on soil nutrient composition, identify nutrient deficiencies associated with BS application, and optimize nutrient supplementation strategies to increase the proportion of BS while maintaining crop productivity. One-way ANOVA indicated a significant treatment effect on grain yield (F(4, 10) = 121.02, p < 0.001), and the LSD groupings shown in Figure 1b ranked the treatments R4 > R3 > R5 > R2 > R1.
3.2. Effects on Soil Properties
3.2.1. Soil Nitrogen Fractions Dynamics
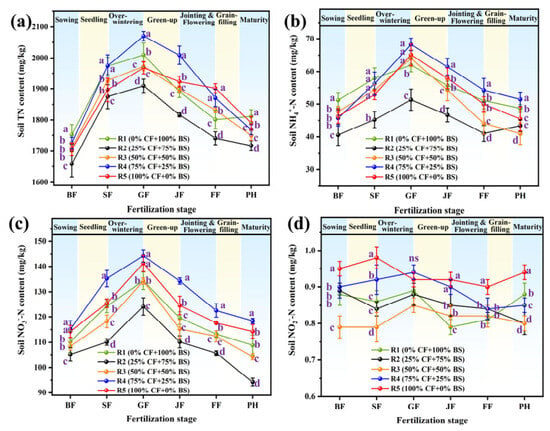
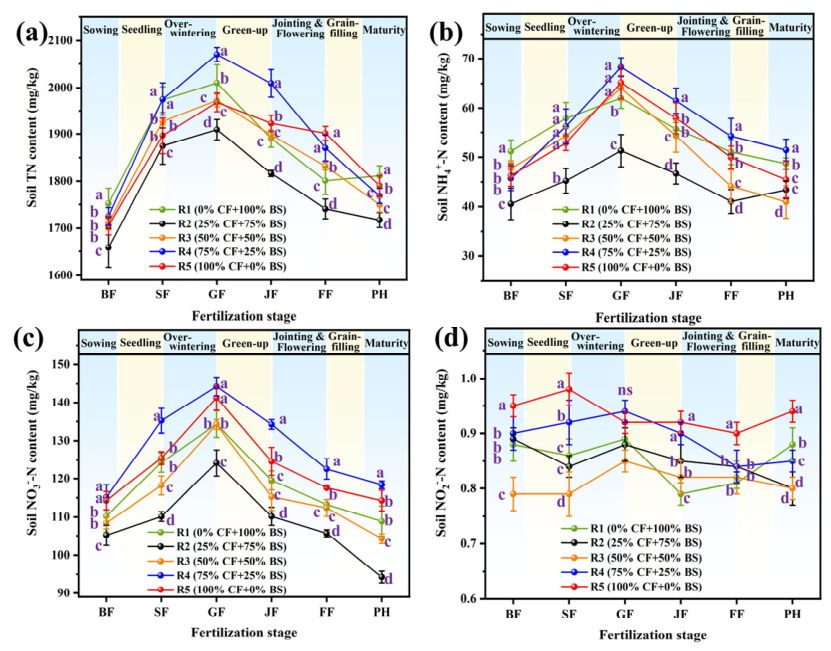
To examine the effects of different BS and CF ratios on soil nitrogen dynamics, changes in nitrogen forms at various fertilization stages were analyzed (Figure 2). After BS is applied, it undergoes fixation, nitrification, and denitrification through interactions with plants, soil and microbes [11,12]. As shown in Figure 2a, soil TN initially increases and then decreases. This suggests that fertilization during the seedling stage (from sowing to overwintering) leads to nitrogen accumulation. However, wheat seedlings at this stage have limited nitrogen uptake, resulting in residual nitrogen from both BS and CF. Treatment R4 showed the highest TN accumulation (344.48 ± 23.92 mg/kg), 23.68% higher than R5. This indicates that incorporating 25% BS may reduce soil nitrogen losses. After the green-up fertilizer (GF) was applied post-overwintering, wheat growth accelerated, accompanied by a decline in soil TN levels. Post-harvest calculations showed that the apparent nitrogen utilization rates in R4 and R2 reached 84.92% and 79.61%, respectively, compared with 57.01%, 62.58%, and 61.12% in R1, R3, and R5, respectively. This difference was significant (p < 0.05, LSD test; Figure 2a). Since ANUR is based on the soil nitrogen balance (Equation (S6)), it reflects the net change in soil nitrogen relative to total nitrogen input and does not directly represent plant nitrogen utilization. Therefore, the higher ANUR values in R4 and R2 indicate greater net soil nitrogen depletion rather than greater nitrogen utilization.
Figure 2.
Dynamics of soil nitrogen forms across fertilization stages: (a) TN, (b) NH4+-N, (c) NO3−-N, (d) NO2−-N. Abbreviations: BF, Basal Fertilizer; SF, Seedling Fertilizer; GF, Green-up Fertilizer; JF, Jointing-Booting Fertilizer; FF, Foliar Fertilizer; PH, Post-Harvest. Different lowercase letters at each fertilization stage indicate significant differences among treatments (one-way ANOVA, LSD test, p < 0.05); “ns” denotes no significant treatment effect at that stage.
The organic nitrogen in BS can be degraded by anaerobic microorganisms and mineralized into ammonium nitrogen (NH4+-N), which can rapidly supply nitrogen, which is readily available for plant uptake or can be oxidized to NO3−-N through nitrification [20]. As shown in Figure 2b, soil NH4+-N content exhibited a trend of early accumulation and later depletion under different BS and CF ratios. Among them, R2 and R1 had the lowest accumulation and consumption of ammonium, indicating that a high BS proportion impaired wheat uptake and utilization of ammonium nitrogen. Based on the changes in soil NO3-N content in Figure 2c, it can be seen that the NO3-N content in R2 after harvest (94.25 ± 1.56 mg/kg) is lower than that in the sowing stage (105.15 ± 3.28 mg/kg), and R1 and R3 also show NO3-N loss. The higher proportion of BS causes the loss of nitrate nitrogen in the soil, as NO3-N is easily soluble in water and infiltrates into groundwater with water during rainfall and irrigation [14]. Its loss not only reduces nitrogen utilization efficiency, but may also lead to groundwater pollution and eutrophication of water bodies. Therefore, it is necessary to track the situation of groundwater pollution.
Nitrite nitrogen (NO2−-N) typically does not accumulate in soil, as shown in Figure 2d, where its concentration generally remains below 1.0 mg/kg. Under normal aerobic conditions, NO2--N is rapidly oxidized to NO3--N via nitrification [21]. The concentration of NO2--N in the R5 treatment (100% CF) was higher than in treatments R1–R4, suggesting that the application of BS slightly influences soil NO2−-N dynamics. BS application may increase the soil organic carbon content, thereby enhancing microbial activity and oxygen consumption. Under reduced oxygen conditions, NO2−-N can serve as an intermediate in the denitrification pathway and be further reduced to N2O or N2, thus limiting its accumulation in the soil [22]. Although BS fertilization did not lead to excessive NO2−-N buildup in the soil, its presence—especially during rainfall or irrigation—may still pose a leaching risk. Therefore, it is necessary to monitor NO2−-N levels in groundwater to mitigate potential environmental impacts associated with BS application.
3.2.2. Variations in Soil OM, C/N Ratio, TP, and TK
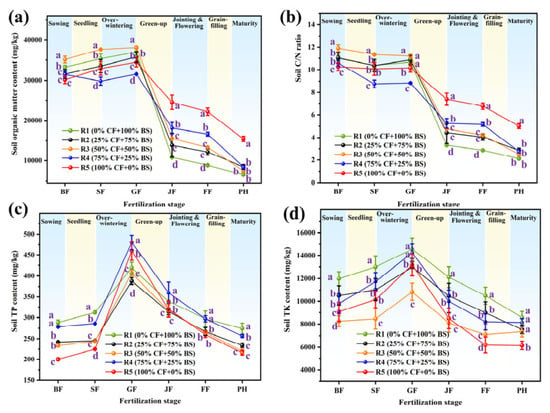
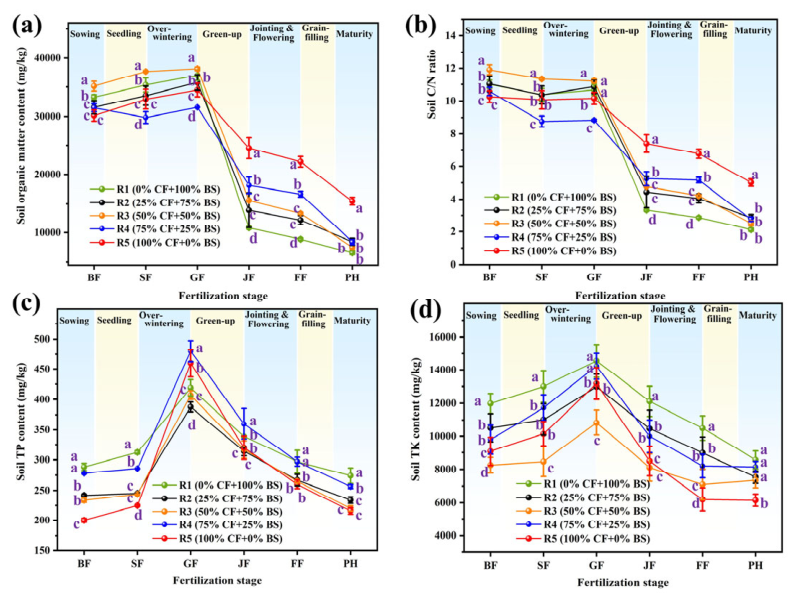
OM, total phosphorus (TP), and total potassium (TK) in BS, as well as the soil C/N ratio, play critical roles in wheat root development, energy metabolism, and grain quality [23,24,25,26]. Soil OM provides an organic carbon source, improves the soil microenvironment, and stimulates microbial activity [23]. As shown in Figure 3a, OM content in the soil increases briefly during the seedling and over-wintering stage, followed by gradual depletion from the green-up to the grain-filling stage. Notably, the post-harvest OM concentration in R5 (15,489.52 ± 657.36 mg/kg) was 49.98 ± 5.75% higher than that in R1–R4 (p < 0.05), indicating that OM in BS is consumed during crop growth. Since OM cannot be directly absorbed by plants, it may first undergo microbial mineralization to release inorganic nutrients available for uptake. Thus, BS can serve as a complementary amendment to CF, enhancing soil microbial activity.
Figure 3.
Dynamics of soil index across fertilization stages: (a) Organic matter, (b) C/N ratio, (c) TP, (d) TK. Abbreviations: BF, Basal Fertilizer; SF, Seedling Fertilizer; GF, Green-up Fertilizer; JF, Jointing-Booting Fertilizer; FF, Foliar Fertilizer; PH, Post-Harvest. Different lowercase letters at each fertilization stage indicate significant differences among treatments (one-way ANOVA, LSD test, p < 0.05).
To further assess the impact of returning BS to the field on soil carbon–nitrogen dynamics, changes in the soil C/N ratio were calculated (Figure 3b). Prior to the overwintering stage of wheat, the C/N ratio remained within the range of 8–12, which is generally regarded as indicative of a balanced soil carbon–nitrogen cycle [24]. This suggests that BS combined with CF application promotes carbon accumulation in the soil, stabilizes OM, and maintains a balanced nutrient release. After wheat entered the green-up stage, the C/N ratio declined to below 10. Across treatments, treatment R5 exhibited higher C/N ratios than treatments R1–R4, particularly from the jointing–flowering stage onward (p < 0.05), indicating that the organic carbon input from BS was the primary driver of C/N ratio variation. The decomposition of soil OM by microorganisms facilitated the release of nitrogen (NH4+, NO3−), phosphorus (PO43−), sulfur (SO42−), and other nutrient elements [25]. Based on the observed nitrogen concentration trends, it can be inferred that a portion of soil nitrogen was mineralized into ammonium and nitrate forms during this period, which were subsequently absorbed by the wheat plants.
Phosphorus in soil plays a critical role in enhancing wheat root development and grain quality [26]. To evaluate this relationship, the TP concentration in soil was monitored (Figure 3c). The cumulative TP levels in R4 and R5 reached 223.53 mg/kg and 244.10 mg/kg, respectively, higher than those in R1 (144.99 mg/kg), R2 (153.87 mg/kg), and R3 (186.81 mg/kg) (LSD groupings at each stage are shown in Figure 3c,d). This demonstrates that CF serves as the primary source of soil phosphorus, whereas BS-derived phosphorus is insufficient to meet plant requirements. Similarly, the TK consumption in R4 and R5 was 4425.15 mg/kg and 4103.14 mg/kg, respectively (Figure 3d). BS application at an appropriate ratio improved potassium uptake efficiency, though BS-derived potassium alone was also insufficient for plant requirements.
In summary, supplementing CF with a defined proportion of BS (e.g., 25%) increases soil OM content while promoting the retention of phosphorus and potassium, thereby reducing nutrient loss. The comparative effectiveness of different BS ratios on nutrient retention generally followed the order: R4 > R3 > R1 > R2. Based on these findings, the combination of R4 (75% CF and 25% BS) provided the most favorable nutrient retention and crop productivity among the substitution ratios tested under the conditions of this study.
3.2.3. Variations in Soil Heavy Metals
The metal ion composition of BS can substantially alter soil physicochemical properties, influence nutrient cycling, and modulate trace element bioavailability [18]. As shown in Figure S3, ICP analysis was employed to quantify Cr, Pb, As, Zn, and Cu concentrations in soils with pH values ranging from 6.0 to 7.0 (Figure S3f). These metals tend to accumulate in wheat roots and tissues, posing a considerable risk of entering the food chain [27]. As illustrated in Figure S3a, the concentration of Cr showed no significant increase across treatments R1–R5 during the entire wheat growth cycle. In R1, Cr concentrations decreased to 50 mg/kg during the grain-filling and maturity stages, well below the risk screening value for non-paddy agricultural land (150 mg/kg for 5.5 < pH ≤ 6.5 and 200 mg/kg for 6.5 < pH ≤ 7.5; Table S4). The soil pH at the site is 6.47 (Table S1).
Similarly, the concentrations of Pb, As, and Zn (Figure S3b–d) remained within the ranges specified by national standards (Table S4). Among these, Zn—an essential micronutrient for plants—accumulated throughout crop growth in the order R2 (22.17 mg/kg) > R4 (19.57 mg/kg) > R1 (16.21 mg/kg) > R5 (13.85 mg/kg) > R3 (9.08 mg/kg). The combined Zn inputs from CF and BS enhanced the soil Zn pool, potentially influencing its availability for plant uptake. Notably, in Figure S3e, Cu concentrations in R1 increased markedly following the application of green-up fertilizer (GF), reaching 47.99 mg/kg—close to the risk screening value of 50 mg/kg for non-paddy agricultural land with 5.5 < pH ≤ 6.5 (Table S4). Although Cu is also an essential element, excessive accumulation can be phytotoxic [28]. Therefore, the potential Cu pollution risk should be monitored when applying 100% BS.
3.3. Effects on Shallow Groundwater Quality
3.3.1. Variation of Nitrogen and Potassium Concentrations in Shallow Groundwater
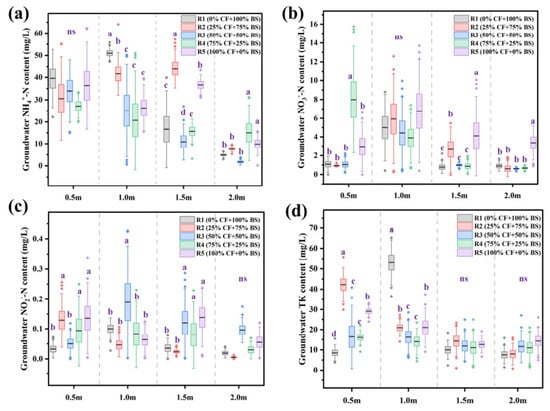
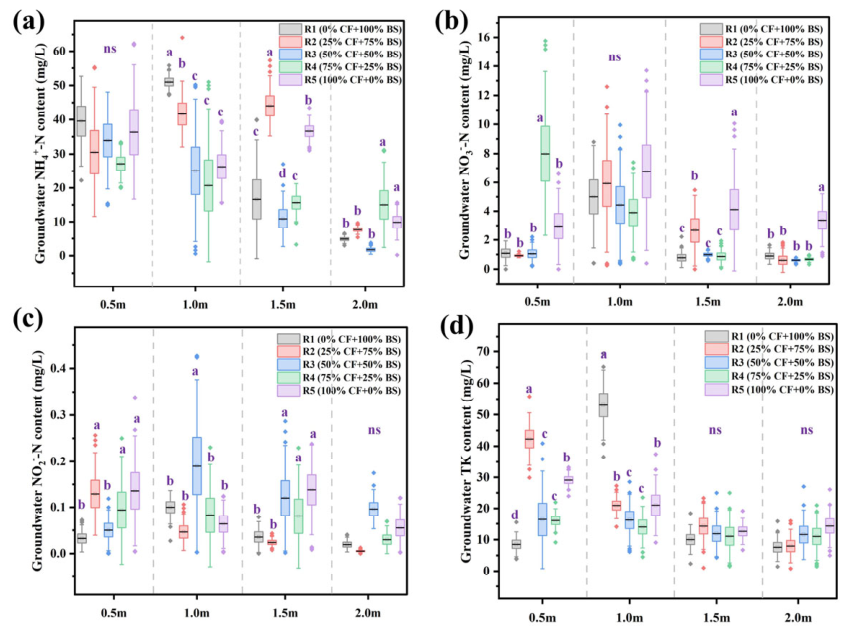
The nitrogen in BS might leach into groundwater during irrigation or rainfall events, particularly in areas with a shallow water table [14]. Accordingly, Figure 4 presents changes in nutrient concentrations in shallow groundwater (0.5–2.0 m).
Figure 4.
Variations in groundwater nutrient concentrations across different depths: (a) NH4+-N, (b) NO3−-N, (c) NO2−-N, and (d) TK. Different lowercase letters at each depth indicate significant differences among treatments (one-way ANOVA, LSD test, p < 0.05); “ns” denotes no significant treatment effect at that depth.
As shown in Figure 4a, NH4+-N concentrations varied with depth. At 0.5–1.0 m, the mean NH4+-N concentration exceeds 20 mg/L, whereas at 2.0 m the mean concentrations in R1–R3 are only 4.85, 7.63, and 1.74 mg/L, respectively. In contrast, R4 and R5 exhibit higher values of 15.00 and 9.83 mg/L, respectively (p < 0.05). Although NH4+-N is positively charged and readily adsorbed by soil OM and clay minerals—reducing its mobility—the combination of shallow groundwater, heavy BS and CF application, and percolation can still lead to its infiltration into shallow aquifers.
NH4+-N is also susceptible to nitrification by soil bacteria, producing NO3−-N, which is only weakly retained in soils and thus readily leaches downward [29]. As shown in Figure 4b, NO3−-N in groundwater is concentrated mainly at 1.0 m depth, with average concentrations of 5.20 ± 1.15 mg/L. Notably, in R5, NO3−-N at 1.5 m (4.10 mg/L) and 2.0 m (3.37 mg/L) was higher than in R1–R4, indicating that full chemical fertilization promoted NO3−-N accumulation in the shallow subsurface (p < 0.05). These concentrations should nevertheless be placed in context: every NO3−-N value measured in this study was well below the Class III limit of 20 mg/L (as N) of GB/T 14848-2017 and the WHO drinking-water guideline of 50 mg/L as NO3− (equivalent to about 11.3 mg/L as N) (Table S6). The differences among treatments are therefore best regarded as an early warning of relative leaching risk rather than as an exceedance of drinking-water quality standards. Even so, they highlight the need to regulate both the application rate and the spatial distribution of fertilizers in order to limit nitrate leaching into shallow groundwater.
NO2−-N is an intermediate product formed during the nitrification of NH4+-N or the denitrification of NO3−-N, as illustrated in Figure 4c. Across the 0.5–2.0 m depth range, NO2−-N concentrations remain below 0.5 mg/L, indicating no significant accumulation. At 2.0 m depth, the mean NO2−-N concentrations in R1–R5 are all below 0.1 mg/L, suggesting that nitrite did not leach into groundwater.
Potassium, a primary nutrient component for plant growth [30], can leach into groundwater via percolation during precipitation or irrigation, particularly affecting shallow aquifers. As shown in Figure 4d, the TK concentrations in 0.5 m groundwater reached 42.28 mg/L in R2 and 29.15 mg/L in R5, but declined to below 20 mg/L at depths of 1.0–2.0 m. In R1, TK at 1.0 m reached 53.08 mg/L, which may represent an isolated abnormal observation associated with local groundwater heterogeneity and/or lateral groundwater movement.
3.3.2. Variation in Heavy Metals in Shallow Groundwater
Figure S4 shows the effects of BS substitution on groundwater concentrations of As, Cr, Cu, and Zn. As and Cr are recognized heavy metal contaminants that pose risks to human health [27,30]. Compared with the CF treatment (R5: 0% BS + 100% CF), BS application did not appreciably alter As and Cr concentrations (Figure S4a,b); as noted in Section 3.2.3, As was not detected in the BS, so the small differences in groundwater As among treatments cannot be ascribed to BS-derived As. Although BS substitution slightly increased Cu and Zn concentrations at depths of 0.5 m and 1.0 m, no substantial differences were observed among the five treatments (R1–R5) at depths of 1.5 m and 2.0 m. All As, Cr, Cu and Zn concentrations measured in this study remained below the Class III limits of GB/T 14848-2017 (As ≤ 0.01, Cu ≤ 1.00 and Zn ≤ 1.00 mg/L) and the WHO drinking-water guideline value for chromium (0.05 mg/L; Cr was determined as total Cr, whereas the GB/T 14848-2017 limit is for hexavalent Cr, so this comparison is conservative) (Table S6). Consequently, BS application did not cause notable heavy metal accumulation in shallow groundwater (0.5–2.0 m). LSD groupings (Figure S4) showed significant differences among some treatments at individual sampling depths. However, the absolute differences were relatively small, and all measured concentrations remained well below the regulatory limits, suggesting limited practical environmental significance.
3.3.3. Variation in DOM in Shallow Groundwater
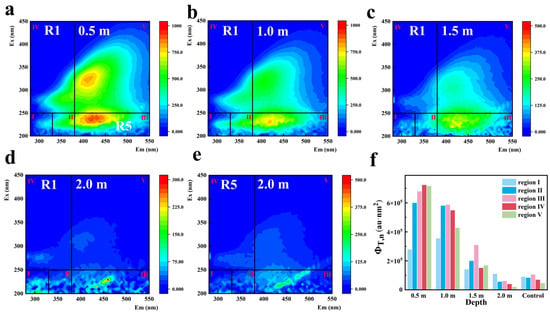
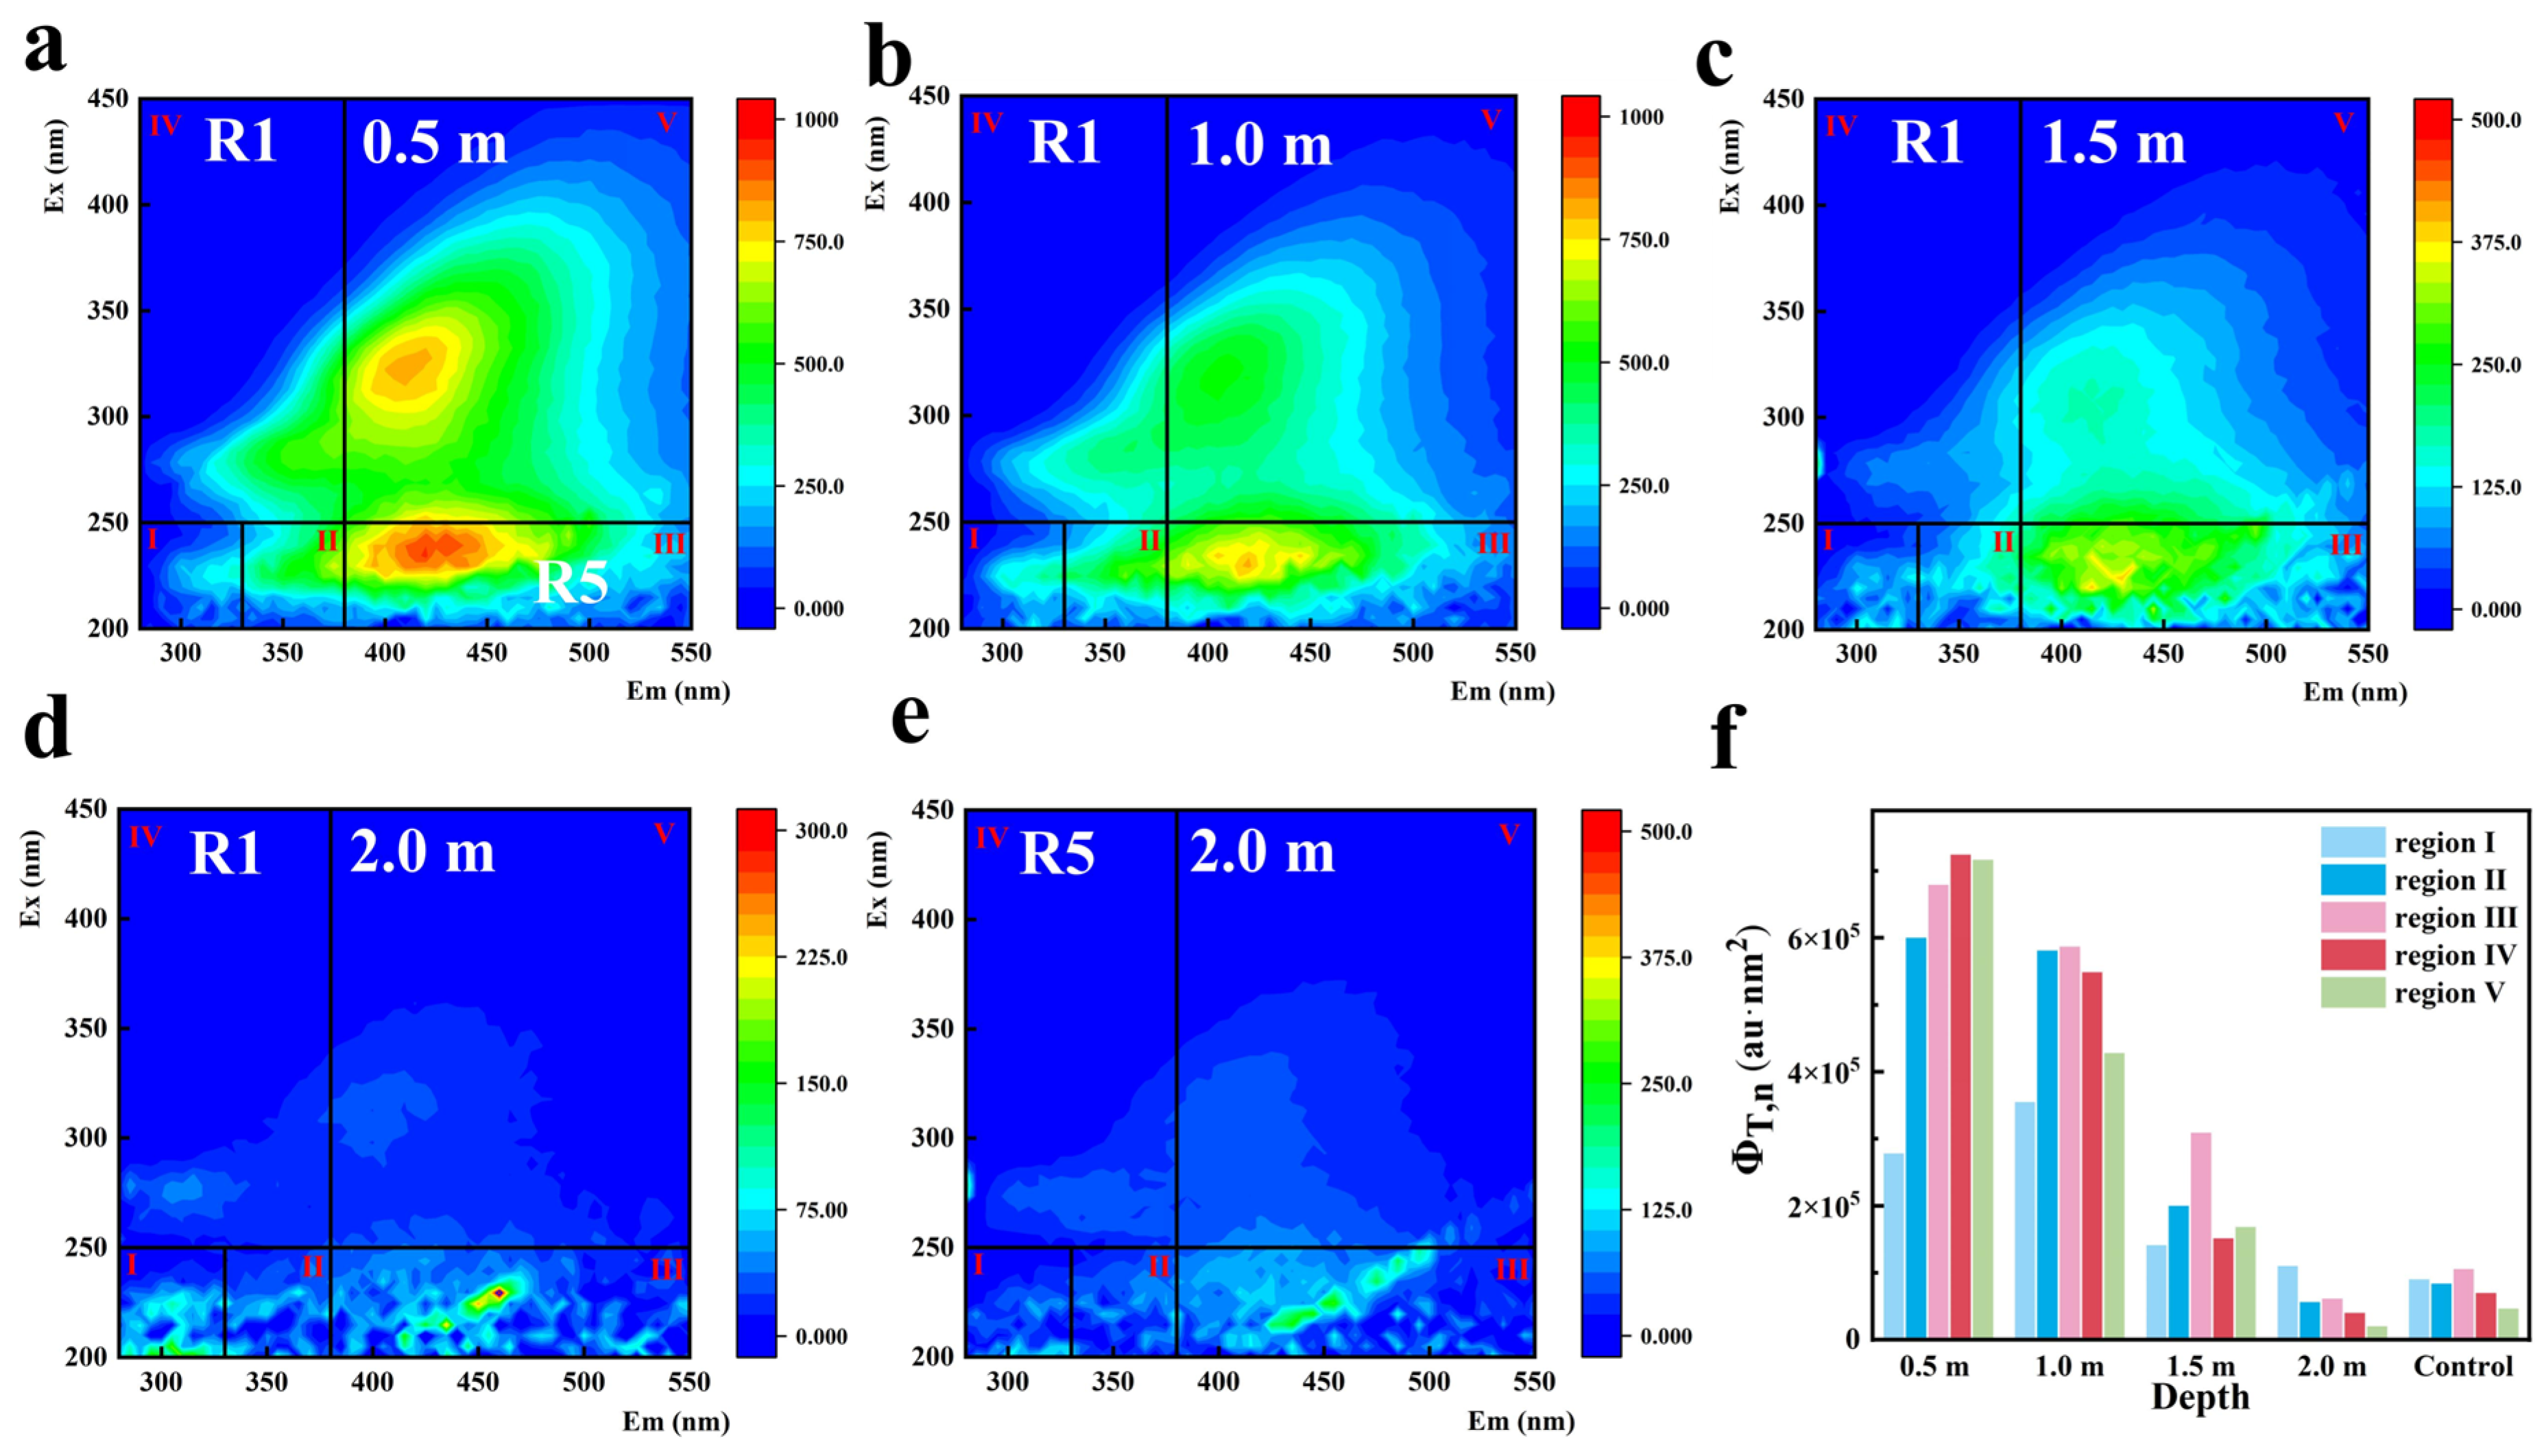
To characterize the potential effects of BS and CF application on groundwater DOM, three-dimensional excitation–emission matrix (3D-EEM) fluorescence spectroscopy was performed on groundwater samples collected from 0.5–2.0 m depths under R1 (100% BS + 0% CF), with the 2.0 m sample from R5 (0% BS + 100% CF) included as a reference (Figure 5). The two treatments were selected to represent the contrasting end-member fertilizer regimes and to provide an exploratory assessment of whether intensive BS or CF application was associated with changes in the fluorescence characteristics and composition of groundwater DOM. The spectra were partitioned into five fluorescence regions: aromatic protein-I (Region I), aromatic protein-II (Region II), fulvic acid-like (Region III), microbial by-products (Region IV), and humic acid-like (Region V) [31]. As shown in Figure 5a, at 0.5 m depth the fluorescence intensity was predominantly concentrated in Regions III and V, indicating that groundwater at shallow depth was strongly influenced by humic substances derived from the anaerobic fermentation of BS. However, from 0.5 m to 2.0 m depth (Figure 5a–d), the fluorescence intensities of fulvic acid- and humic acid-like substances decreased by 90.77% and 96.94%, respectively, suggesting that these refractory organic compounds from the slurry were progressively attenuated during vertical transport through the subsurface profile. At 2.0 m depth, the fluorescence intensities were comparable to those observed in the control treatment R5 (0% BS + 100% CF) (Figure 5e,f).
Figure 5.
3D-EEM diagram of different groundwater depths: (a) 0.5 m of R1, (b) 1.0 m of R1, (c) 1.5 m of R1, (d) 2.0 m of R1, (e) 2.0 m of R5, and (f) FRI overview.
To further elucidate the decline in fluorescence intensities in Regions III and V, groundwater indices (BIX, HIX, FI, and BDI) were calculated (Table S5). The FI values remained above 1.90, indicating that DOM was predominantly derived from microbial secretions [32], originating from anaerobic fermentation of BS and subsequently infiltrating into groundwater. In contrast, BIX values decreased with depth in R1, suggesting progressive degradation and transformation of OM, with the lowest biological activity observed at 2.0 m [33]. HIX values increased initially and then declined, reflecting a reduced degree of humification at 2.0 m. Similarly, the BDI index decreased to 0.32 at 2.0 m, indicating the depletion of fresh, labile BS-derived components and suggesting that BS application did not cause DOM contamination in deeper groundwater.
To further characterize DOM composition under BS influence, PARAFAC analysis was applied to groundwater fluorescence spectra (Figure S5). At 0.5 m depth, two fluorescent components were identified: C1 (Ex/Em 370/465, 250/465), corresponding to humic acid-like substances, and C2 (Ex/Em 230/410, 255/410), corresponding to tyrosine- and tryptophan-like proteins [34]. This indicates that BS infiltration introduces both refractory humic substances and labile protein-like organics into shallow groundwater. At 2.0 m depth, however, the dominant fluorescent component was C3 (Ex/Em 225/350, 280/350), representing residual tyrosine- and tryptophan-like proteins [35]. This suggests that most fluorescent compounds had been removed during transport, leaving behind only poorly degradable proteinaceous matter. Overall, PARAFAC results indicate that BS infiltration reduces the molecular weight of DOM and the stability of aromatic structures during vertical migration, without causing substantial contamination of deeper groundwater.
3.4. Effect on Soil Microbial Communities
To investigate the effects of BS application on soil microbial community structure, high-throughput sequencing was used to analyze soil samples collected at the pre-sowing (day 0), jointing (day 150), and maturity (day 240) stages of wheat growth. Microbial community analysis was performed for R1, R3, R4, and R5, because sequencing data for R2 could not be obtained (Section 2.4). As shown in Figure S6a, the number of detected species and OTUs varied among treatments and growth stages. The OTU number generally increased from the pre-sowing stage to the jointing stage and subsequently decreased toward maturity. To further assess community diversity, alpha diversity indices were calculated (Figure S6b). Overall, diversity increased initially and then declined, as reflected by changes in Chao1 and ACE values. These dynamics indicate that substantial shifts occurred in the microbial community during the jointing stage, when wheat roots were well developed and nutrient demand, particularly for nitrogen and phosphorus, increased [36]. In addition, the Shannon index was higher at the jointing stage compared to the pre-sowing and maturity stages, while the Shannon evenness index remained above 0.7, suggesting that the microbial community was both diverse and evenly distributed at this time [37,38]. Notably, R4 (75% CF + 25% BS) maintained relatively high diversity at both the jointing and maturity stages, indicating that this application ratio promotes microbial activity and may support root growth and wheat development.
To further examine changes in soil microbial species across different growth stages, Venn diagrams for the jointing and maturity stages are shown in Figure S6c,d. At the jointing stage, 473 species were shared across groups, whereas only 173 species remained at the maturity stage. Notably, R3 and R4 shared 501 species, which is consistent with an influence of BS application on soil microbial communities. Overall, BS fertilization appears to alter the structure of the soil microbial community, which may subsequently affect wheat growth and yield. Therefore, further analysis of dominant taxa and associated environmental factors is warranted.
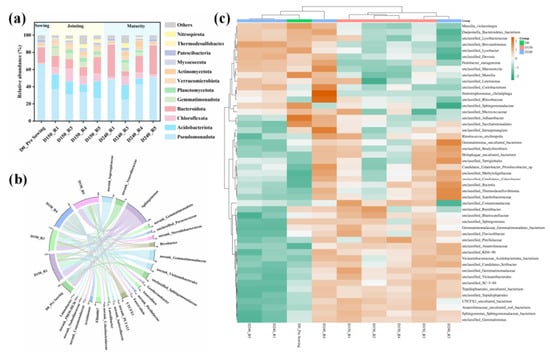
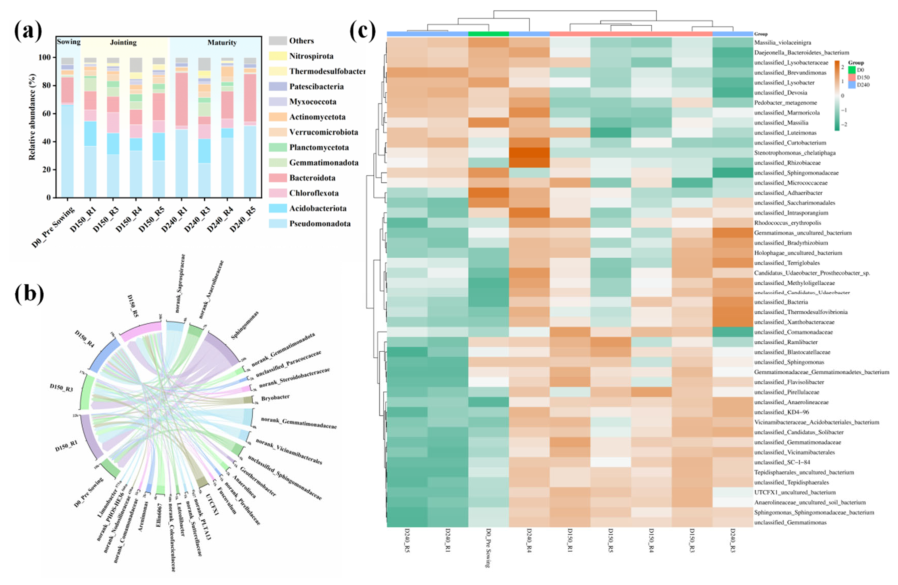
During the different growth stages of wheat, the overall soil microbial community structure underwent dynamic changes, largely driven by variations in the types and amounts of root exudates (e.g., sugars, amino acids, and organic acids) [39]. As shown in Figure 6a, from the Sowing stage to maturity, the dominant phyla are Pseudomonadota, Acidobacteriota, Chloroflexota, and Bacteroidota, together accounting for 76.03 ± 10.80% of the total community. Among these, Pseudomonadota play a particularly important role throughout all stages. Members of this group contribute to soil nutrient cycling by solubilizing phosphorus bound in the soil, converting it into plant-available forms [40,41]. In addition, some taxa within Pseudomonadota possess nitrogen-fixing capabilities, thereby supplying an additional nitrogen source for wheat growth [42]. At the jointing stage (Day 150), the relative abundances of Acidobacteriota and Chloroflexota increase. Both groups are recognized as key decomposers of soil OM, with the ability to degrade complex substrates under anaerobic conditions [43]. Notably, by the maturity stage, the relative abundance of Acidobacteriota in treatments R1 and R5 declined to below 0.25%, suggesting a depletion of soil OM under these conditions. In contrast, in R3 and R4, the relative abundances of Acidobacteriota remain higher, at 17.60% and 7.09%, respectively. This pattern indicates that an appropriate combination of BS and CF amendments can enhance and sustain soil OM levels, thereby supporting the proliferation of associated microbial communities.
Figure 6.
Microbial community composition at different taxonomic levels: (a) phylum relative abundance; (b) genus abundance at jointing stage (Day 150); (c) species-level heatmap.
To further elucidate the shifts in microbial community structure during the jointing stage (Day 150), the genus-level composition is shown in Figure 6b. Sphingomonas, known for its ability to utilize and degrade soil pollutants as a sole carbon source, constitutes a relatively high proportion across all treatment groups. In addition, norank_Saprospiraceae and norank_Anaerolineaceae were widely distributed in R1, R3, and R4. These taxa are primarily involved in the degradation of complex OM, suggesting that BS fertilization increases soil OM content and promotes the proliferation of such functional microorganisms [44,45]. As shown in Figure 6c, which depicts community composition across wheat growth stages at the phylum level, a notable diversification of bacterial communities occurs at the jointing stage compared with D0_Pre-Sowing. Furthermore, many of the microbial taxa enriched in R3 and R4 during the jointing stage are maintained until maturity (Day 240). This persistence indicates that combined application of BS and CF improved soil microbial community structure, enhanced nutrient availability, and ultimately contributed to higher wheat yield.
3.5. Suggestions on Biogas Slurry Farmland Application
Previous studies have demonstrated that the application of BS to farmland can promote crop growth, reduce the reliance on CF, and enhance resource recycling [12,18,20,46]. However, the application of BS alone cannot fully satisfy the nutritional demands of crops and may disturb the soil nutrient balance and cause groundwater contamination.
The results showed that an appropriate combination of BS and CF increased wheat yield, with the overall trend R4 > R3 > R5 > R2 > R1. Considering the nutrients (e.g., nitrogen) supplied by the yellow-brown soil of the Huaihe–Yangtze River divide zone and the nutrient requirements of wheat (Equation (S2)), it is recommended that BS applications be supplemented with additional potassium and phosphate fertilizers. To avoid excessive irrigation that may cause surface runoff, waterlogging, and groundwater pollution, the dilution volume for a single or short-term application should be strictly limited. These recommendations apply to the soil, climatic and management conditions tested in this study, i.e., a single growing season at one site, and should be re-evaluated before being extended to other regions.
3.6. Study Limitations and Future Perspectives
This study provides field-based evidence of how different BS substitution ratios affect soil properties, crop performance, shallow groundwater quality, and soil microbial communities under winter wheat cultivation. Several aspects warrant further investigation. First, the experiment was conducted at a single site over one winter wheat season; therefore, the observed responses, particularly those related to nutrient leaching, should be interpreted within the climatic, soil, and hydrological conditions of the study period. Multi-year and multi-site experiments covering different precipitation regimes and soil types would help evaluate the consistency of these responses and the broader applicability of BS substitution. Second, longer-term monitoring of soil and shallow groundwater, together with information on groundwater flow and nutrient transformation, would provide further insight into the temporal dynamics and transport pathways of N and other dissolved constituents following BS application.
Future studies could further integrate plant nutrient uptake, soil N transformation, and microbial functional characteristics to better resolve the mechanisms underlying nutrient retention and loss. In addition, more comprehensive characterization of livestock-derived BS, including potential contaminants and antibiotic resistance-related risks, would help extend the assessment from short-term agronomic and environmental responses to its longer-term sustainability and environmental safety.
4. Conclusions
This study demonstrates that partial substitution of chemical fertilizer (CF) with biogas slurry (BS) can support winter wheat production while modifying soil nutrient dynamics and the subsurface environment. Under the conditions tested, the 25% BS substitution treatment (R4) achieved the highest wheat yield (5792.28 kg ha−1), representing a 10.93% increase over 100% CF, and increased soil total nitrogen accumulation by 23.68%. These findings indicate that moderate BS substitution can enhance crop productivity while promoting nitrogen retention in the soil. BS substitution also altered the form and distribution of nitrogen in the soil–groundwater system. Compared with 100% CF, BS substitution reduced nitrate migration into shallow groundwater, whereas higher BS substitution ratios were associated with elevated NH4+-N concentrations. Meanwhile, BS substitution modified soil microbial community composition, suggesting that its environmental effects extend beyond nutrient availability alone. Therefore, the benefits and risks of BS application should be evaluated according to both the substitution ratio and the form of nitrogen involved.
Overall, moderate BS substitution provides a potential approach for integrating nutrient recycling with crop production. Under the conditions tested, the 25% BS substitution treatment showed favorable agronomic performance, while the observed changes in groundwater nitrogen highlight the need for appropriate management of BS application rates. Further multi-season and multi-site studies are needed to determine the consistency and broader applicability of these responses.
Supplementary Materials
The following supporting information can be downloaded at https://www.mdpi.com/article/10.3390/pr14203293/s1.
Author Contributions
L.C.: Writing—original draft, Investigation. J.L.: Writing—original draft, Investigation. J.C.: Validation. R.T.: Formal Analysis. J.M.: Methodology. M.S.: Conceptualization. X.Z.: Software. Z.-H.H.: Writing—review & editing, Conceptualization, Resources. All authors have read and agreed to the published version of the manuscript.
Funding
This work was supported by the Key Project of Science and Technology in Anhui Province (1801041130), National Natural Science Foundation of China (52400050), and Shanghai Sailing Program (23YF1414500).
Data Availability Statement
The data supporting the findings of this study are available within the article and its Supplementary Materials. Additional data are available from the corresponding author upon reasonable request.
Conflicts of Interest
The authors state that they are not aware of any financial interests or personal relationships that could have influenced the work described in this paper.
Abbreviations
The following abbreviations are used in this manuscript:
| CF | chemical fertilizer |
| BS | biogas slurry |
| BF | basal Fertilizer |
| SF | seedling fertilization |
| GF | green-up fertilization |
| JF | jointing-booting fertilization |
| FF | foliar fertilization |
References
- Kong, F.; Gao, J.; Yang, Z.; Li, X.; Zhang, Y.; Chen, Y. Removing Macromolecular Organic Matter from Biogas Slurry Prior to Its Application Reduces Organic N Leaching and Soil N2O Emissions. Environ. Res. 2025, 285, 122427. [Google Scholar] [CrossRef] [Scilit] [PubMed]
- Lin, S.; Lyu, T.; Pan, M.; Hou, Y.; Guo, C.; Chen, Z.; Dong, R.; Liu, S. Exploration of Ammonia Stripping Coupled Adsorption-Membrane Filtration Process for Treating Kitchen Waste Biogas Slurry. Environ. Res. 2025, 274, 121318. [Google Scholar] [CrossRef] [Scilit] [PubMed]
- Zou, Z.; Li, Y.; Ren, X.; Zhao, Z.; Du, Z.; Wu, D. Potential Effect of Biogas Slurry Application to Mitigate of Peak N2O Emission without Compromising Crop Yield in North China Plain Cropping Systems. Appl. Soil Ecol. 2025, 210, 106083. [Google Scholar] [CrossRef] [Scilit]
- Zhang, X.; Fang, Q.; Zhang, T.; Ma, W.; Velthof, G.L.; Hou, Y.; Oenema, O.; Zhang, F. Benefits and Trade-Offs of Replacing Synthetic Fertilizers by Animal Manures in Crop Production in China: A Meta-Analysis. Glob. Change Biol. 2020, 26, 888–900. [Google Scholar] [CrossRef] [Scilit] [PubMed]
- Zhan, X.; Zhang, A.; Zhang, Q. Controlling Agricultural Non-Point Source Pollution: Thinking and Practice in the Era of Agricultural Green High-Quality Development. Nongye Gongcheng Xuebao/trans. Chin. Soc. Agric. Eng. 2020, 36, 1–7. [Google Scholar] [CrossRef]
- Wang, H.; Wang, H.; Liang, X.; Wang, J.; Qiu, X.; Wang, C.; Li, G. Infiltration Simulation and System Design of Biogas Slurry Drip Irrigation Using HYDRUS Model. Comput. Electron. Agric. 2024, 218, 108682. [Google Scholar] [CrossRef] [Scilit]
- Wang, X.; Yan, J.; Bierman, T.V.; Dong, X.; Wu, Y.; Wang, W.; Zhuang, M. Closing Economical and Sustainability Gaps for China’s Wheat, Maize, and Rice Production: A County Level Energy Analysis Approach. J. Environ. Manag. 2025, 380, 125041. [Google Scholar] [CrossRef] [Scilit] [PubMed]
- Wen, S.; Cui, N.; Wang, Y.; Gong, D.; Xing, L.; Wu, Z.; Zhang, Y.; Wang, Z. Determining Effect of Fertilization on Reactive Nitrogen Losses through Nitrate Leaching and Key Influencing Factors in Chinese Agricultural Systems. Agric. Water Manag. 2024, 303, 109055. [Google Scholar] [CrossRef] [Scilit]
- Zhou, T.; Zang, Y.; Li, Z.; Zhang, Y.; Zhu, K.; Zhang, W.; Zhang, H.; Liu, L.; Wang, Z.; Gu, J.; et al. Controlled-Release Nitrogen Fertilizer and Long-Term Straw Return Synergistically Improve Wheat Yield and Reduced the Nitrogen Losses by Regulating Soil Microbial Communities and Soil Organic Nitrogen Components. Field Crops Res. 2025, 334, 110148. [Google Scholar] [CrossRef] [Scilit]
- Sa, Q.; Zheng, J.; Zhang, K.; Wang, Y. Effects and Assessment of the Combined Application of Biogas Slurry and Chemical Fertilizers on Greenhouse Tomato Growth, Yield, and Soil Quality. Sci. Hortic. 2025, 344, 114113. [Google Scholar] [CrossRef] [Scilit]
- Chen, S.; Li, D.; He, H.; Zhang, Q.; Lu, H.; Xue, L.; Feng, Y.; Sun, H. Substituting Urea with Biogas Slurry and Hydrothermal Carbonization Aqueous Product Could Decrease NH3 Volatilization and Increase Soil DOM in Wheat Growth Cycle. Environ. Res. 2022, 214, 113997. [Google Scholar] [CrossRef] [Scilit] [PubMed]
- Sorecha, E.M.; Ruan, R.; Yuan, Y.; Wang, Y. Partial Substitution of Biogas Slurry for Chemical Fertilizer Increased Wheat Grain Yield While Alleviating N2O Emissions by Improving Soil Quality and Regulating N Cycling Genes. Environ. Technol. Innov. 2025, 39, 104286. [Google Scholar] [CrossRef] [Scilit]
- Tang, Y.; Wang, L.; Carswell, A.; Misselbrook, T.; Shen, J.; Han, J. Fate and Transfer of Heavy Metals Following Repeated Biogas Slurry Application in a Rice-Wheat Crop Rotation. J. Environ. Manag. 2020, 270, 110938. [Google Scholar] [CrossRef] [Scilit] [PubMed]
- Zeng, W.; Qiu, J.; Wang, D.; Wu, Z.; He, L. Ultrafiltration Concentrated Biogas Slurry Can Reduce the Organic Pollution of Groundwater in Fertigation. Sci. Total Environ. 2022, 810, 151294. [Google Scholar] [CrossRef] [Scilit] [PubMed]
- Wang, H.; Wang, H.; Liang, X.; Wang, J.; Qiu, X.; Wang, C. Replacing Chemical Fertilizers with Biogas Slurry Is an Environment Friendly Strategy to Reduce the Risk of Soil Nitrogen Leaching: Evidence from the HYDRUS Model Simulation. Agric. Ecosyst. Environ. 2024, 369, 109043. [Google Scholar] [CrossRef] [Scilit]
- Tang, J.; Yin, J.; Davy, A.J.; Pan, F.; Han, X.; Huang, S.; Wu, D. Biogas Slurry as an Alternative to Chemical Fertilizer: Changes in Soil Properties and Microbial Communities of Fluvo-Aquic Soil in the North China Plain. Sustainability 2022, 14, 15099. [Google Scholar] [CrossRef] [Scilit]
- Wang, H.; Qiu, X.; Liang, X.; Wang, H.; Wang, J. Biogas Slurry Change the Transport and Distribution of Soil Water under Drip Irrigation. Agric. Water Manag. 2024, 294, 108719. [Google Scholar] [CrossRef] [Scilit]
- Xu, Z.-M.; Wang, Z.; Gao, Q.; Wang, L.-L.; Chen, L.-L.; Li, Q.-G.; Jiang, J.-J.; Ye, H.-J.; Wang, D.-S.; Yang, P. Influence of Irrigation with Microalgae-Treated Biogas Slurry on Agronomic Trait, Nutritional Quality, Oxidation Resistance, and Nitrate and Heavy Metal Residues in Chinese Cabbage. J. Environ. Manag. 2019, 244, 453–461. [Google Scholar] [CrossRef] [Scilit] [PubMed]
- APHA Method 9221; Standard Methods for the Examination on of Water and Wastewater. American Public Health Association: Washington, DC, USA, 2012.
- Han, Z.; Zheng, T.; Yan, W.; Rensing, C.; Wu, H.; Wu, W.; Wu, H. Substitution of Chemical Fertilizer by Biogas Slurry Maintain Wheat Yields by Regulating Soil Properties and Microbiomes. Environ. Technol. Innov. 2025, 38, 104161. [Google Scholar] [CrossRef] [Scilit]
- Wu, X.; Yu, S.; Sui, W.; Zhang, X.; Li, J.; Wu, Q.; Zhang, X. Intermittent Oxygenation Is Essential for Modulating Nitrite Ammonifiers in an Agricultural Upland Soil to Minimize Nitrogen Loss. Appl. Soil Ecol. 2025, 214, 106386. [Google Scholar] [CrossRef] [Scilit]
- Wang, R.; Pan, Z.; Liu, Y.; Yao, Z.; Wang, J.; Zheng, X.; Zhang, C.; Ju, X.; Wei, H.; Butterbach-Bahl, K. Full Straw Incorporation into a Calcareous Soil Increased N2O Emission despite More N2O Being Reduced to N2 in the Winter Crop Season. Agric. Ecosyst. Environ. 2022, 335, 108007. [Google Scholar] [CrossRef] [Scilit]
- Mao, H.-R.; Hart, S.C.; Peak, D.; McKenna, A.M.; Zhu, M. Microbial Transformation and Mineral Adsorption Control Chemical Evolution of Soil Organic Matter during Semi-Arid Ecosystem Development. Geochim. Cosmochim. Acta 2025, 408, 283–295. [Google Scholar] [CrossRef] [Scilit]
- Cheng, L.; He, H.; Li, S.; Yu, M.; Wan, T.; Qin, J.; Li, C.; Li, J. Green Manure Species Synergize with Organic Fertilization to Enhance Soil Nutrient–Microbial Interactions and Wheat Productivity in Oasis Drip–Irrigated Systems. Field Crops Res. 2025, 333, 110095. [Google Scholar] [CrossRef] [Scilit]
- Hou, Y.; Jia, R.; Zhou, L.; Zhang, L.; Wei, S.; Li, B.; Zhu, J. Alterations in Microbial-Mediated Methane, Nitrogen, Sulfur, and Phosphorus Cycling within Paddy Soil Induced by Integrated Rice-Fish Farming. J. Environ. Manag. 2025, 388, 126056. [Google Scholar] [CrossRef] [Scilit] [PubMed]
- Wang, Q.; Duan, C.; Liang, H.; Ren, J.; Geng, Z.; Xu, C. Phosphorus Acquisition Strategies of Wheat Are Related to Biochar Types Added in Cadmium-Contaminated Soil: Evidence from Soil Zymography and Root Morphology. Sci. Total Environ. 2023, 856, 159033. [Google Scholar] [CrossRef] [Scilit] [PubMed]
- Kumar, U.; Singh, P.K.; Kumar, I.; Sharma, R.K. Heavy Metal Accumulation, Yield and Health Risk Assessment of Wheat Crop Grown in Contaminated Soil Amended with Bioash for Sustainable Agriculture. J. Food Compos. Anal. 2025, 139, 107140. [Google Scholar] [CrossRef] [Scilit]
- Lin, Y.; Allen, H.E.; Di Toro, D.M. Validation of Cu Toxicity to Barley Root Elongation in Soil with a Terrestrial Biotic Ligand Model Developed from Sand Culture. Ecotoxicol. Environ. Saf. 2018, 148, 336–345. [Google Scholar] [CrossRef] [Scilit] [PubMed]
- Wang, M.; Wu, S.; Si, D.; Wu, H.; Zhou, D. Effective Transformation of Ammonia Nitrogen in the Soil from Rare Earth Mining Areas by Amendments of Biomass Ash. Sci. Total Environ. 2025, 1000, 180433. [Google Scholar] [CrossRef] [Scilit] [PubMed]
- Xu, M.; Wang, L.; Lu, Y.; Bai, Y. Identifying the Critical Potassium Inputs for Optimum Yield, Potassium Use Efficiency and Soil Fertility through Potassium Balance in a Winter Wheat-Summer Maize Rotation System in North China. Soil Tillage Res. 2025, 254, 106743. [Google Scholar] [CrossRef] [Scilit]
- Liu, J.; Zhang, Y.; Zhan, Y.; Yang, L.; Chen, X.; Deng, G.; Hu, D.; Jiang, F. Catalytic Ozonation with Ferric Oxide Loaded Pumice: Enhancing Catalytic Ozonation and Microbial Community Dynamics in Anaerobic Leachate Treatment. J. Environ. Chem. Eng. 2025, 13, 117290. [Google Scholar] [CrossRef] [Scilit]
- Zhang, H.; Hou, J.; Nie, L.; Hao, Y.; Gao, H.; Yu, H. Developing New Spectral Indices for Identifying DOM Sources in Liaohe River in a Large-Scale River Basin by Fluorescence Spectroscopy and Random Forest Model. Process Saf. Environ. Prot. 2025, 201, 107553. [Google Scholar] [CrossRef] [Scilit]
- Hu, F.; Ye, J.; Wang, B.; Zhang, W.; Chen, P.; Yuan, Z.; Xu, Z. Transformation of Dissolved Organic Matter during Aquaculture Wastewater Treatment: Insights into the Biological Toxicity, Spectral Indices and Molecular Signatures. Water Res. 2025, 283, 123834. [Google Scholar] [CrossRef] [Scilit] [PubMed]
- Chen, M.; Jung, J.; Lee, Y.K.; Kim, T.-W.; Hur, J. Production of Tyrosine-like Fluorescence and Labile Chromophoric Dissolved Organic Matter (DOM) and Low Surface Accumulation of Low Molecular Weight-Dominated DOM in a Productive Antarctic Sea. Mar. Chem. 2019, 213, 40–48. [Google Scholar] [CrossRef] [Scilit]
- Chen, J.; Shen, H.; Zhang, X.; Li, W.; Zhang, J. Priming Effect of Different DOM Components on the Degradation of Organic Matter during the Decomposition Period of Phragmites Australis: Microbiological Mechanisms. J. Water Process Eng. 2025, 72, 107463. [Google Scholar] [CrossRef] [Scilit]
- Yu, T.; Jie, X.; Lei, Y.; Zhang, B.; Zang, H.; Zeng, Z.; Yang, Y. Rhizobacteria Shaped by Long-Term Fertilization and Wheat Nutritional Requirements Improve Grain Yield and Soil Multifunctionality. Field Crops Res. 2025, 333, 110117. [Google Scholar] [CrossRef] [Scilit]
- Lu, Y.; Yue, H.; Tan, R.; Ding, Z.; Chen, G.; Zhang, S.; Li, Z.; Proshad, R.; Cheng, X.; Zhao, Z. Remediation Effects of Humic Acid and Hydroxyapatite on Cadmium-Contaminated Alkaline Wheat Soil and Its Microbial Community Response: A Field Trial. J. Environ. Sci. 2026, 164, 57–68. [Google Scholar] [CrossRef] [Scilit] [PubMed]
- Liao, B.; Yao, Z.; Feng, J.; Liu, H. Wheat Rhizospheric Microbial Network’s Consistent Modular Pattern in Improved Lunar Soil Simulant Accompanied with Fungal Withdrawal. Acta Astronaut. 2025, 235, 475–484. [Google Scholar] [CrossRef] [Scilit]
- Yan, M.; Li, Q.; Tian, Z.; He, Q.; Xu, Y.; Liu, X.; Chen, Q.; Gu, Y.; Zou, L.; Zhao, K.; et al. Co-Application of Cadmium-Immobilizing Bacteria and Organic Fertilizers Alter the Wheat Root Soil Chemistry and Microbial Communities. Ecotoxicol. Environ. Saf. 2024, 287, 117288. [Google Scholar] [CrossRef] [Scilit] [PubMed]
- Cui, S.; Wang, Z.; Kong, L.; Zhang, M.; Xu, H.; Xiao, P.; Tao, Y. Dynamics of Microbial Communities and Functional Genes under the Interactions between Phosphorus Inactivation Agents and Phosphorus-Solubilizing Bacteria in Sediments. J. Water Process Eng. 2025, 77, 108395. [Google Scholar] [CrossRef] [Scilit]
- Ye, D.; Lin, Y.; Liu, T.; Zhang, X.; Tang, Y.; Wang, K.; Huang, H.; Yu, H.; Wang, Y.; He, X.; et al. Soil Microbial Community Harboring Key Genes Drives Rhizosphere Phosphorus Mobilization of Phosphorus-Accumulating Polygonum hydropiper. Appl. Soil Ecol. 2025, 213, 106314. [Google Scholar] [CrossRef] [Scilit]
- Ma, L.; Nawaz, M.N.; Xu, Y.; Chen, X.; Liu, D.; Lu, X.; Wang, H. Sphagnum Microhabitats Differentiate the Nitrogen-Fixing Microbial Communities in the Dajiuhu Peatland, Central China: Significance of Methane Oxidation for Nitrogen Fixation. Appl. Soil Ecol. 2025, 214, 106373. [Google Scholar] [CrossRef] [Scilit]
- Gonçalves, O.S.; Fernandes, A.S.; Tupy, S.M.; Ferreira, T.G.; Almeida, L.N.; Creevey, C.J.; Santana, M.F. Insights into Plant Interactions and the Biogeochemical Role of the Globally Widespread Acidobacteriota Phylum. Soil Biol. Biochem. 2024, 192, 109369. [Google Scholar] [CrossRef] [Scilit]
- Ni, Z.; Cao, M.; Wang, Y.; Zhong, W.; Zhang, M.; Duan, Y.; Wu, L. Phosphorus Fertilizer Input Level Regulates Soil Organic Carbon Physical Fraction Sequestration by Influencing the Microbial Community. Appl. Soil Ecol. 2025, 210, 106072. [Google Scholar] [CrossRef] [Scilit]
- Fang, K.; Rao, S.; He, Y.; Wang, J.; Xu, J.; Shi, J. Rice Straw-Derived Biochar Amendment Enabling a Synergy for Mercury Alkylation and Carbon Sequestration in Mercury-Contaminated Paddy Soil. Chem. Eng. J. 2024, 498, 155507. [Google Scholar] [CrossRef] [Scilit]
- Wang, H.; Liang, X.; Feng, X.; Qiu, X.; Wang, S.; Wang, J.; Chen, B. Biogas Slurry Topdressing as Replacement of Chemical Fertilizers Boosts Water and Nitrogen Use Efficiency and Yield in Semiarid Rainfed Field Crops. Agric. Water Manag. 2025, 318, 109725. [Google Scholar] [CrossRef] [Scilit]
Disclaimer/Publisher’s Note: The statements, opinions and data contained in all publications are solely those of the individual author(s) and contributor(s) and not of MDPI and/or the editor(s). MDPI and/or the editor(s) disclaim responsibility for any injury to people or property resulting from any ideas, methods, instructions or products referred to in the content. |
© 2026 by the authors. Licensee MDPI, Basel, Switzerland. This article is an open access article distributed under the terms and conditions of the Creative Commons Attribution (CC BY) license.