


Abstract
Unstable water injection is widely used in low-permeability shale oil reservoirs, but its performance under the combined effects of stress sensitivity and threshold pressure gradient remains uncertain. This study aims to determine how these two mechanisms jointly affect unstable water injection performance and to optimize the switching timing and half-cycle period. Core-scale stress sensitivity and flow experiments were conducted, and the results were incorporated into reservoir simulation using the ROCKTAB and Threshold Pressure keywords in Eclipse, enabling a coupled numerical modeling approach. The simulation results indicate that both stress sensitivity and threshold pressure gradient significantly affect ultimate recovery, with stress sensitivity exerting a considerably greater influence. Among the half-cycle scenarios evaluated, a 15-day half cycle yields the best development performance, and longer half cycles are associated with reduced stimulation effects. Extended shut-in periods cause greater formation pressure fluctuations, which may induce additional stress-sensitive damage and impair well productivity. These findings provide practical guidance for designing unstable water injection strategies in low-permeability shale reservoirs. Among the discrete cases simulated, the optimal timing for switching from continuous to unstable water injection is when the water cut reaches 25%, although this value is case-specific; conversion at water cut beyond this threshold leads to progressively diminished oil response.
1. Introduction
Qianjiang sag in Jianghan Basin is rich in shale oil resources, which is the main area of exploration and development in recent years [1,2]. The reservoir in this area is characterized by complex lithology, strong heterogeneity, and well-developed multi-scale fractures [3]. In the Tankou Oilfield, water injection rate significantly influences the distribution of water-driven oil [4]. However, the reservoir shows characteristics of low porosity and low permeability.
A large number of laboratory tests and development practices show that there are serious stress sensitivity and threshold pressure gradient phenomena in the development process of low-permeability reservoirs [5,6,7,8,9,10]; especially in the process of depressurization development, the pore throat, as a fluid percolation channel, will undergo certain compression deformation under the action of effective stress, resulting in the reduction in reservoir rock permeability [11,12]. Stress sensitivity is particularly prominent, especially in shale reservoirs [13]. Recent studies have further developed the stress-dependent permeability model by introducing fractal geometry theory [14] and quantitatively evaluating the stress sensitivity of shale reservoirs [15]. The cyclic stress-induced permeability variation has also been investigated for underground gas storage applications [16]. Permeability evolution during CO2 injection has been systematically analyzed [17], while hydraulic fracturing stress measurements in deep low-permeability reservoirs have been evaluated [18]. Coupled models considering both stress sensitivity and threshold pressure gradient have been established [19].
Water injection development is a commonly used means of developing low-permeability reservoirs, but continuous water injection development usually encounters the contradiction of ‘unable to inject, unable to recover’. Unstable water injection can well alleviate this problem. Therefore, unstable water injection is widely used in the development of low-permeability reservoirs [20,21,22,23]. There are many numerical simulation studies on unstable water injection [24,25,26,27,28,29], but the effects of stress sensitivity and starting pressure gradient on development are basically not considered at the same time. However, existing advanced coupled geomechanics and flow models have mainly addressed stress-dependent permeability and threshold pressure gradient separately or under continuous injection. The novelty of this work is to couple both mechanisms simultaneously in cyclic water injection simulations and to compare the results with models that neglect one or both mechanisms. In the numerical simulation of low-permeability reservoirs, the proper implementation of threshold pressure gradient is critical. The influence of movable water on the gas-phase threshold pressure gradient in tight gas reservoirs has been analyzed [30], providing a basis for accurate model setup.
In this study, based on the core stress sensitivity experiment and core percolation experiment, the characteristics of stress-dependent permeability and threshold pressure gradient of the target shale reservoir were systematically characterized. The experimental results were then incorporated into the reservoir numerical simulator by introducing the ROCKTAB and threshold pressure keywords in Eclipse, enabling a coupled simulation approach that accounts for both mechanisms simultaneously. Numerical models under different development schemes—including continuous water injection and unstable water injection with varying switching timing and half-cycle periods—were established and compared. The research findings provide practical insights into optimizing cyclic water injection strategies, mitigating stress-sensitive damage, and improving oil recovery in low-permeability shale reservoirs.
2. Method
2.1. Establishment of Geological Model
In order to isolate the influence of stress sensitivity and threshold pressure gradient on the productivity of unstable waterflooding, a deliberately simplified homogeneous single-porosity conceptual geological model is established based on the Jianghan Basin shale oil reservoir; this model does not represent the multi-scale fractures and strong heterogeneity described in the introduction, so the results are interpreted as mechanism-sensitive indicators rather than field-representative predictions. Choose Eclipse black-oil simulator to build the grid of 120 × 120 × 5, and the grid steps in the x, y and z directions are 10 m, 10 m and 2 m respectively. Other basic parameters of the model are shown in Table 1. The geological model is the inverted nine-point well pattern, including 4 well groups, and the injection production well spacing is 300 m; closed no-flow external boundaries are imposed, and boundary effects are minimized by comparing only interior wells away from the model edges.
Table 1.
Basic parameters of model.
2.2. Stress Sensitivity Processing
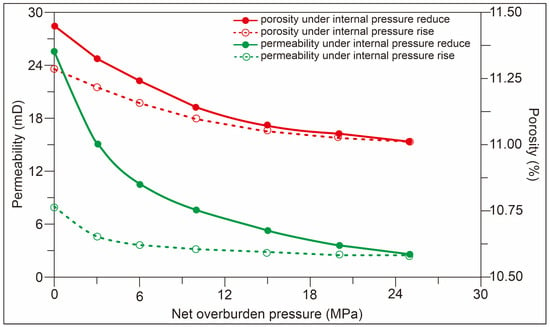
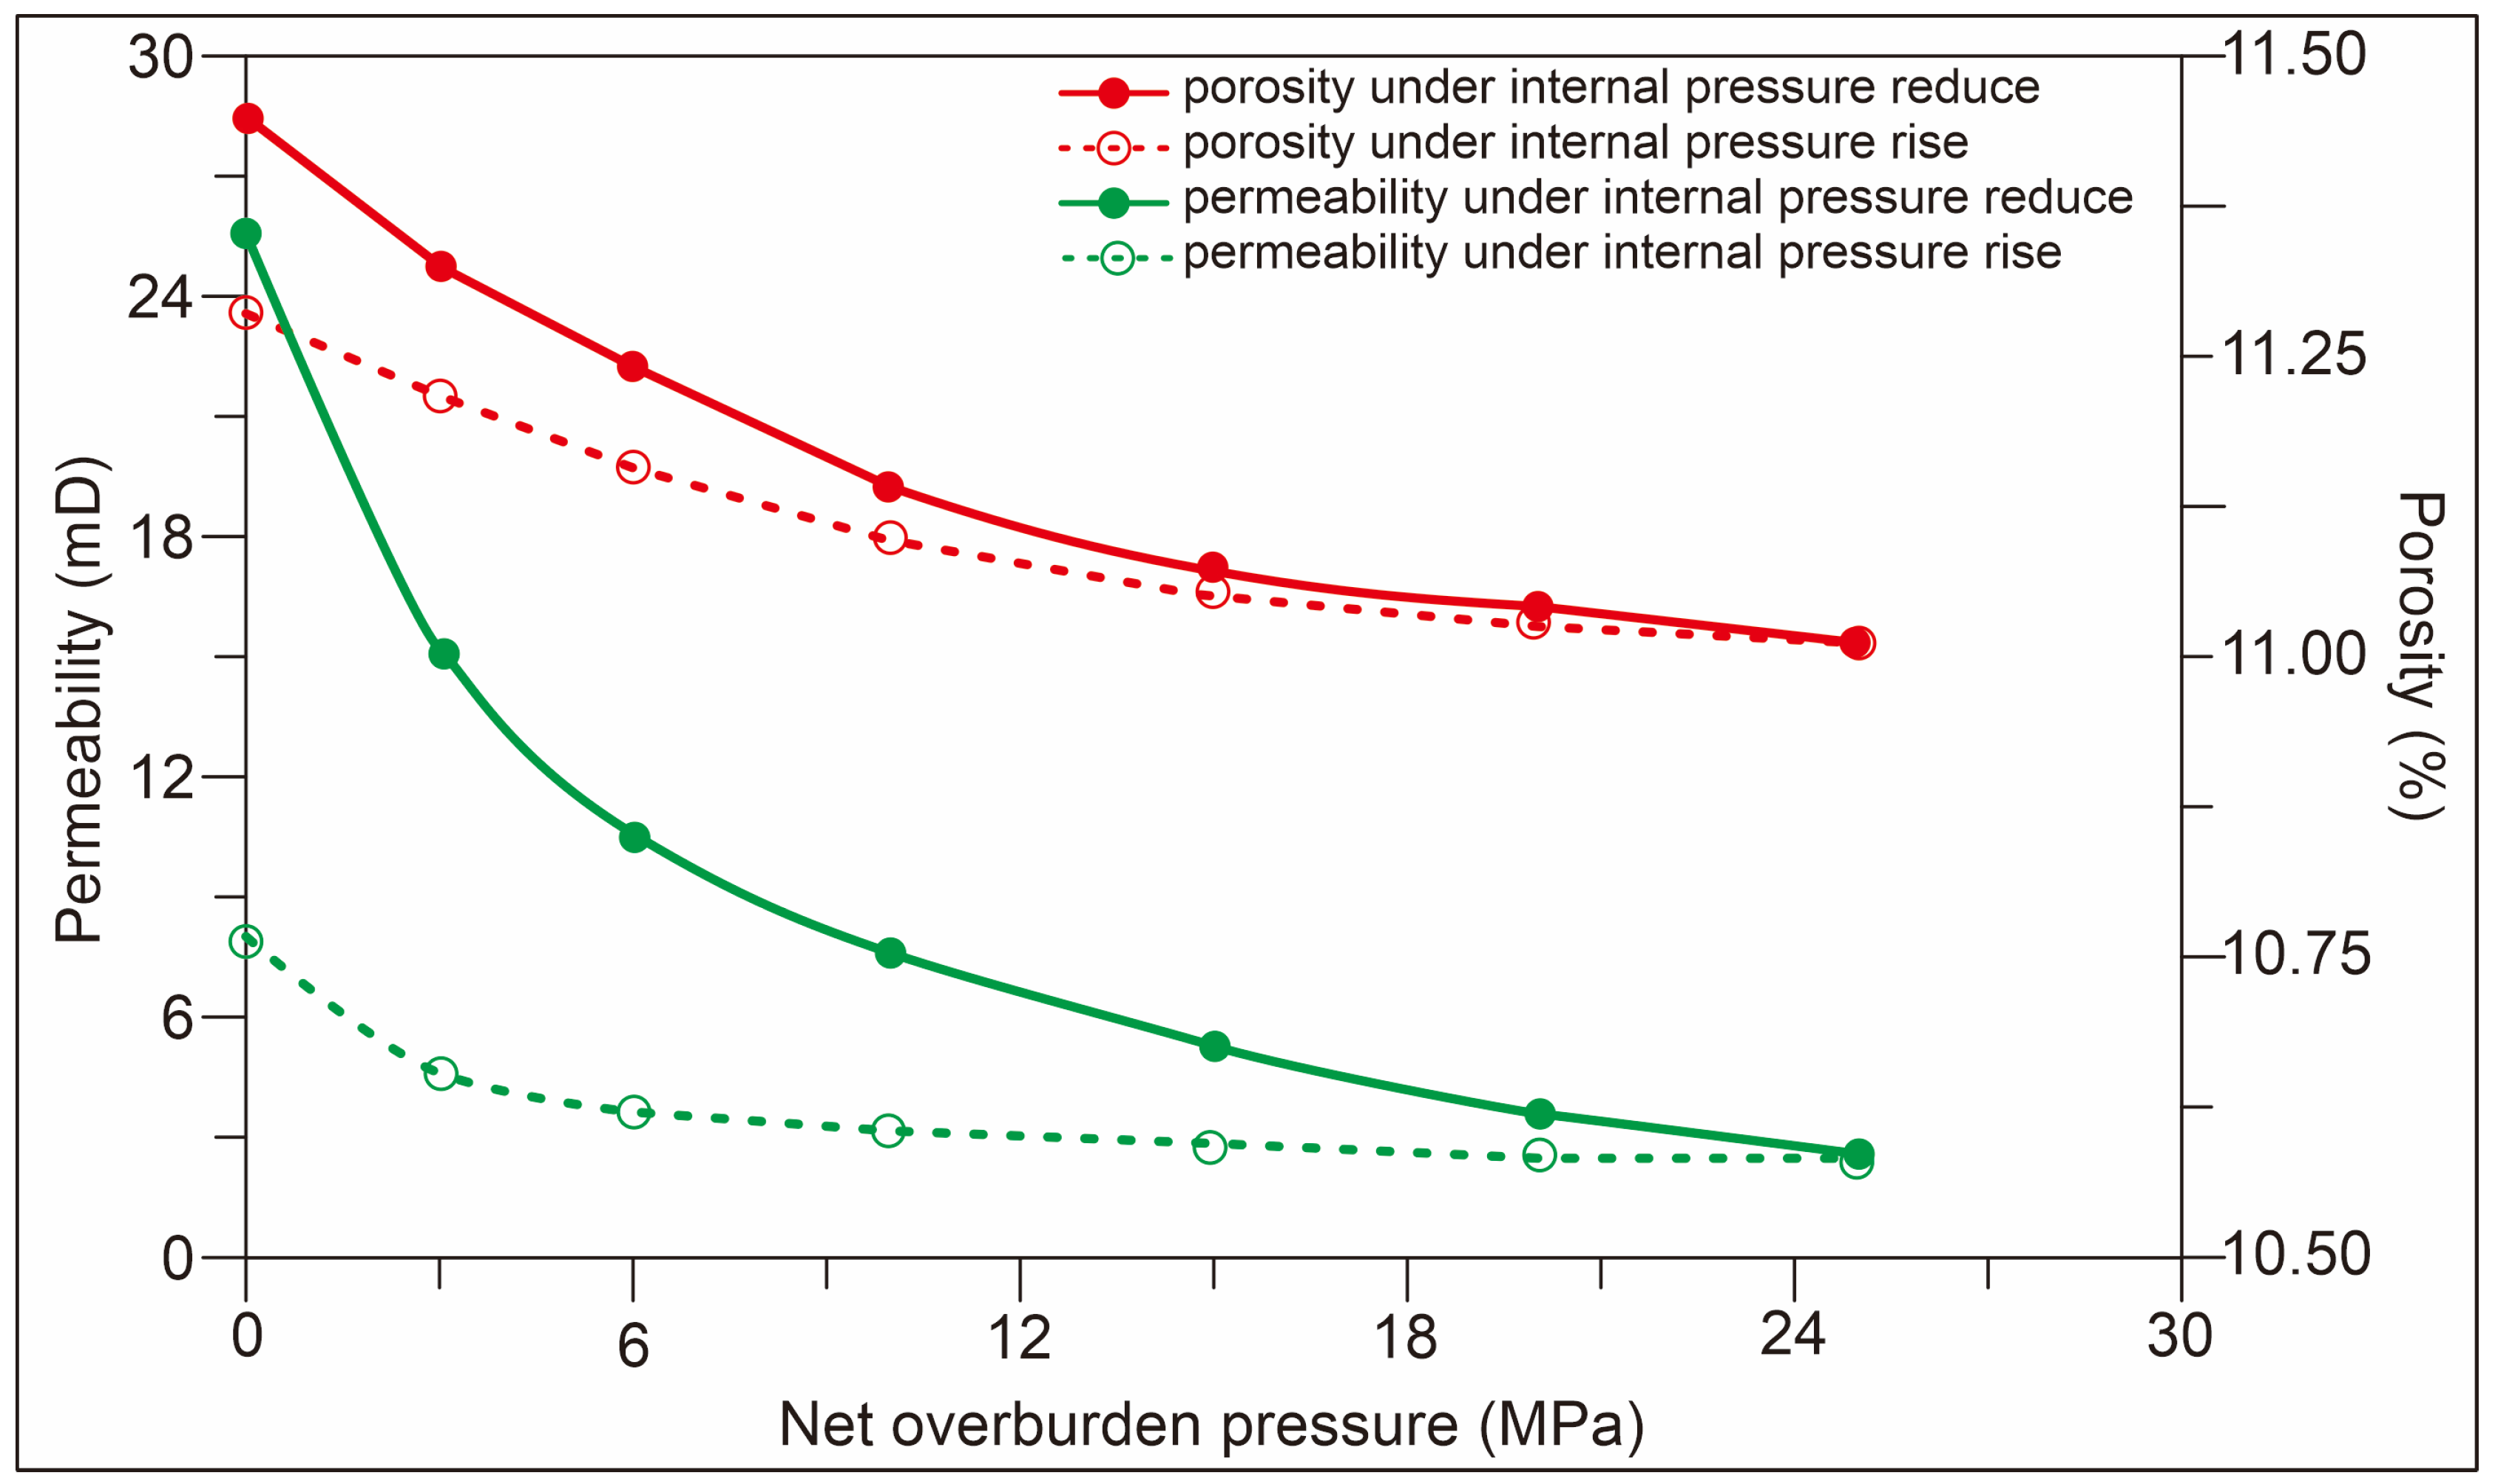
The real core of the salt shale oil reservoir in Jianghan Basin was used for the stress sensitivity test; compressed air was used as the test gas, and the measured gas permeabilities were corrected for gas slippage using the Klinkenberg correction to obtain equivalent liquid absolute permeabilities before determining stress sensitivity; however, the mean pore pressures, slippage factor b, and corrected versus uncorrected values are not reported, so it cannot be confirmed whether Figure 1, Table 2, and the ROCKTAB multipliers were recomputed from the corrected values. The test temperature was 25 °C. The original formation pressure is 25 MPa, and the core porosity and permeability are measured in the initial state (when the net confining pressure is 0 MPa). In order to more truly reflect the stress sensitivity phenomenon in the process of oil and gas field development, the stress sensitivity of the core was tested by changing internal pressure and holding the confining pressure unchanged. Throughout the experiment, the constant confining pressure was 25 MPa, and the internal pressure decreased from 25 MPa to 0 MPa and then recovered to 25 MPa. The experiment process was strictly in accordance with national technical standards [31,32]. Core parameters are shown in Table 3. Only core #1 remained intact after the porosity and permeability test; therefore, the representativeness of the measured curves for the reservoir-scale model could not be confirmed with additional cores.
Figure 1.
Influence of stress sensitivity on permeability and porosity.
Table 2.
Set of ROCKTAB keywords.
Table 3.
Physical properties of core samples.
2.3. Threshold Pressure Processing
In the process of shale oil reservoir development, the threshold pressure gradient cannot be ignored. The test steps are strictly in accordance with the relevant industry technical standard33. In order to more truly reflect the impact of threshold pressure gradient on oil productivity, the percolation experiment was carried out on core #1. Because stress sensitivity and threshold pressure measurements are based on a single core (core #1, 25.51 mD, the highest-permeability sample in Table 3), these measured values are applied to all five equilibrium regions (15–25 mD) without additional core-based justification; this extrapolation is listed in the Limitations. The main steps are as follows:
Step 1: Saturate the core with saline (mineralization 29,884 mg/L).
Step 2: Measure the relationship curve between the saline flow rate of the core and the injection production pressure difference in the core holder.
Step 3: After step 2, the simulated oil with viscosity of 14.10 mPa·s is used to drive water at the flow rate of 0.1 mL/min in the linear percolation zone until no water is produced. Because the reservoir model uses oil with a viscosity of 14.10 mPa·s, the measured threshold pressure gradient was applied directly to the reservoir model without viscosity scaling, and its effect on the 1.05% recovery reduction attributed to TPG is therefore not quantified.
Step 4: Start displacement from the flow rate of 0.01 mL/min, record the inlet and outlet pressure of the core holder, and gradually increase the flow rate after the pressure is stable until the Darcy percolation curve of oil is measured.
Step 5: After step 4, use CO2 to drive oil at a flow rate of 0.1 mL/min (in the linear percolation area) until no oil is produced.
Step 6: Start displacement from the flow rate of 0.01 mL/min, record the inlet and outlet pressure of the core holder, and gradually increase the flow rate after the pressure is stable until the Darcy percolation curve of CO2 is measured.
3. Results
3.1. Stress Sensitivity
The results of core stress sensitivity test are shown in Figure 1. It can be seen from the Figure that the decline in permeability is much greater than that of porosity in the process of internal pressure reduction. When the net effective overburden pressure returns to the original state, the final loss rate of permeability is 69.412%, and the final loss rate of porosity is 1.405%, indicating the permeability sensitivity of this core is strong. In addition, in the process of depressurization development, the sensitivity of permeability to stress is much greater than that of porosity. After correction for gas slippage, the maximum decrease in permeability is 91.06%, and the maximum decrease in porosity is only 3.69%; the residual uncertainty associated with the use of compressed air is not assessed, so the reported decline cannot be confirmed as being dominated by stress sensitivity rather than an apparent Klinkenberg effect.
Permeability retention coefficient and porosity retention coefficient are defined as follows:
where Δk and Δφ are permeability and porosity retention coefficient respectively; ko and φo are permeability and porosity under initial conditions respectively; ki and φi are permeability and porosity under different internal pressure conditions respectively.
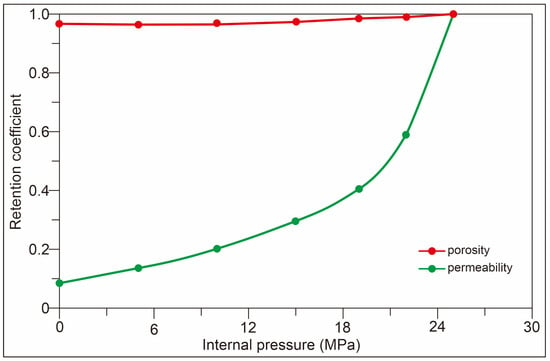
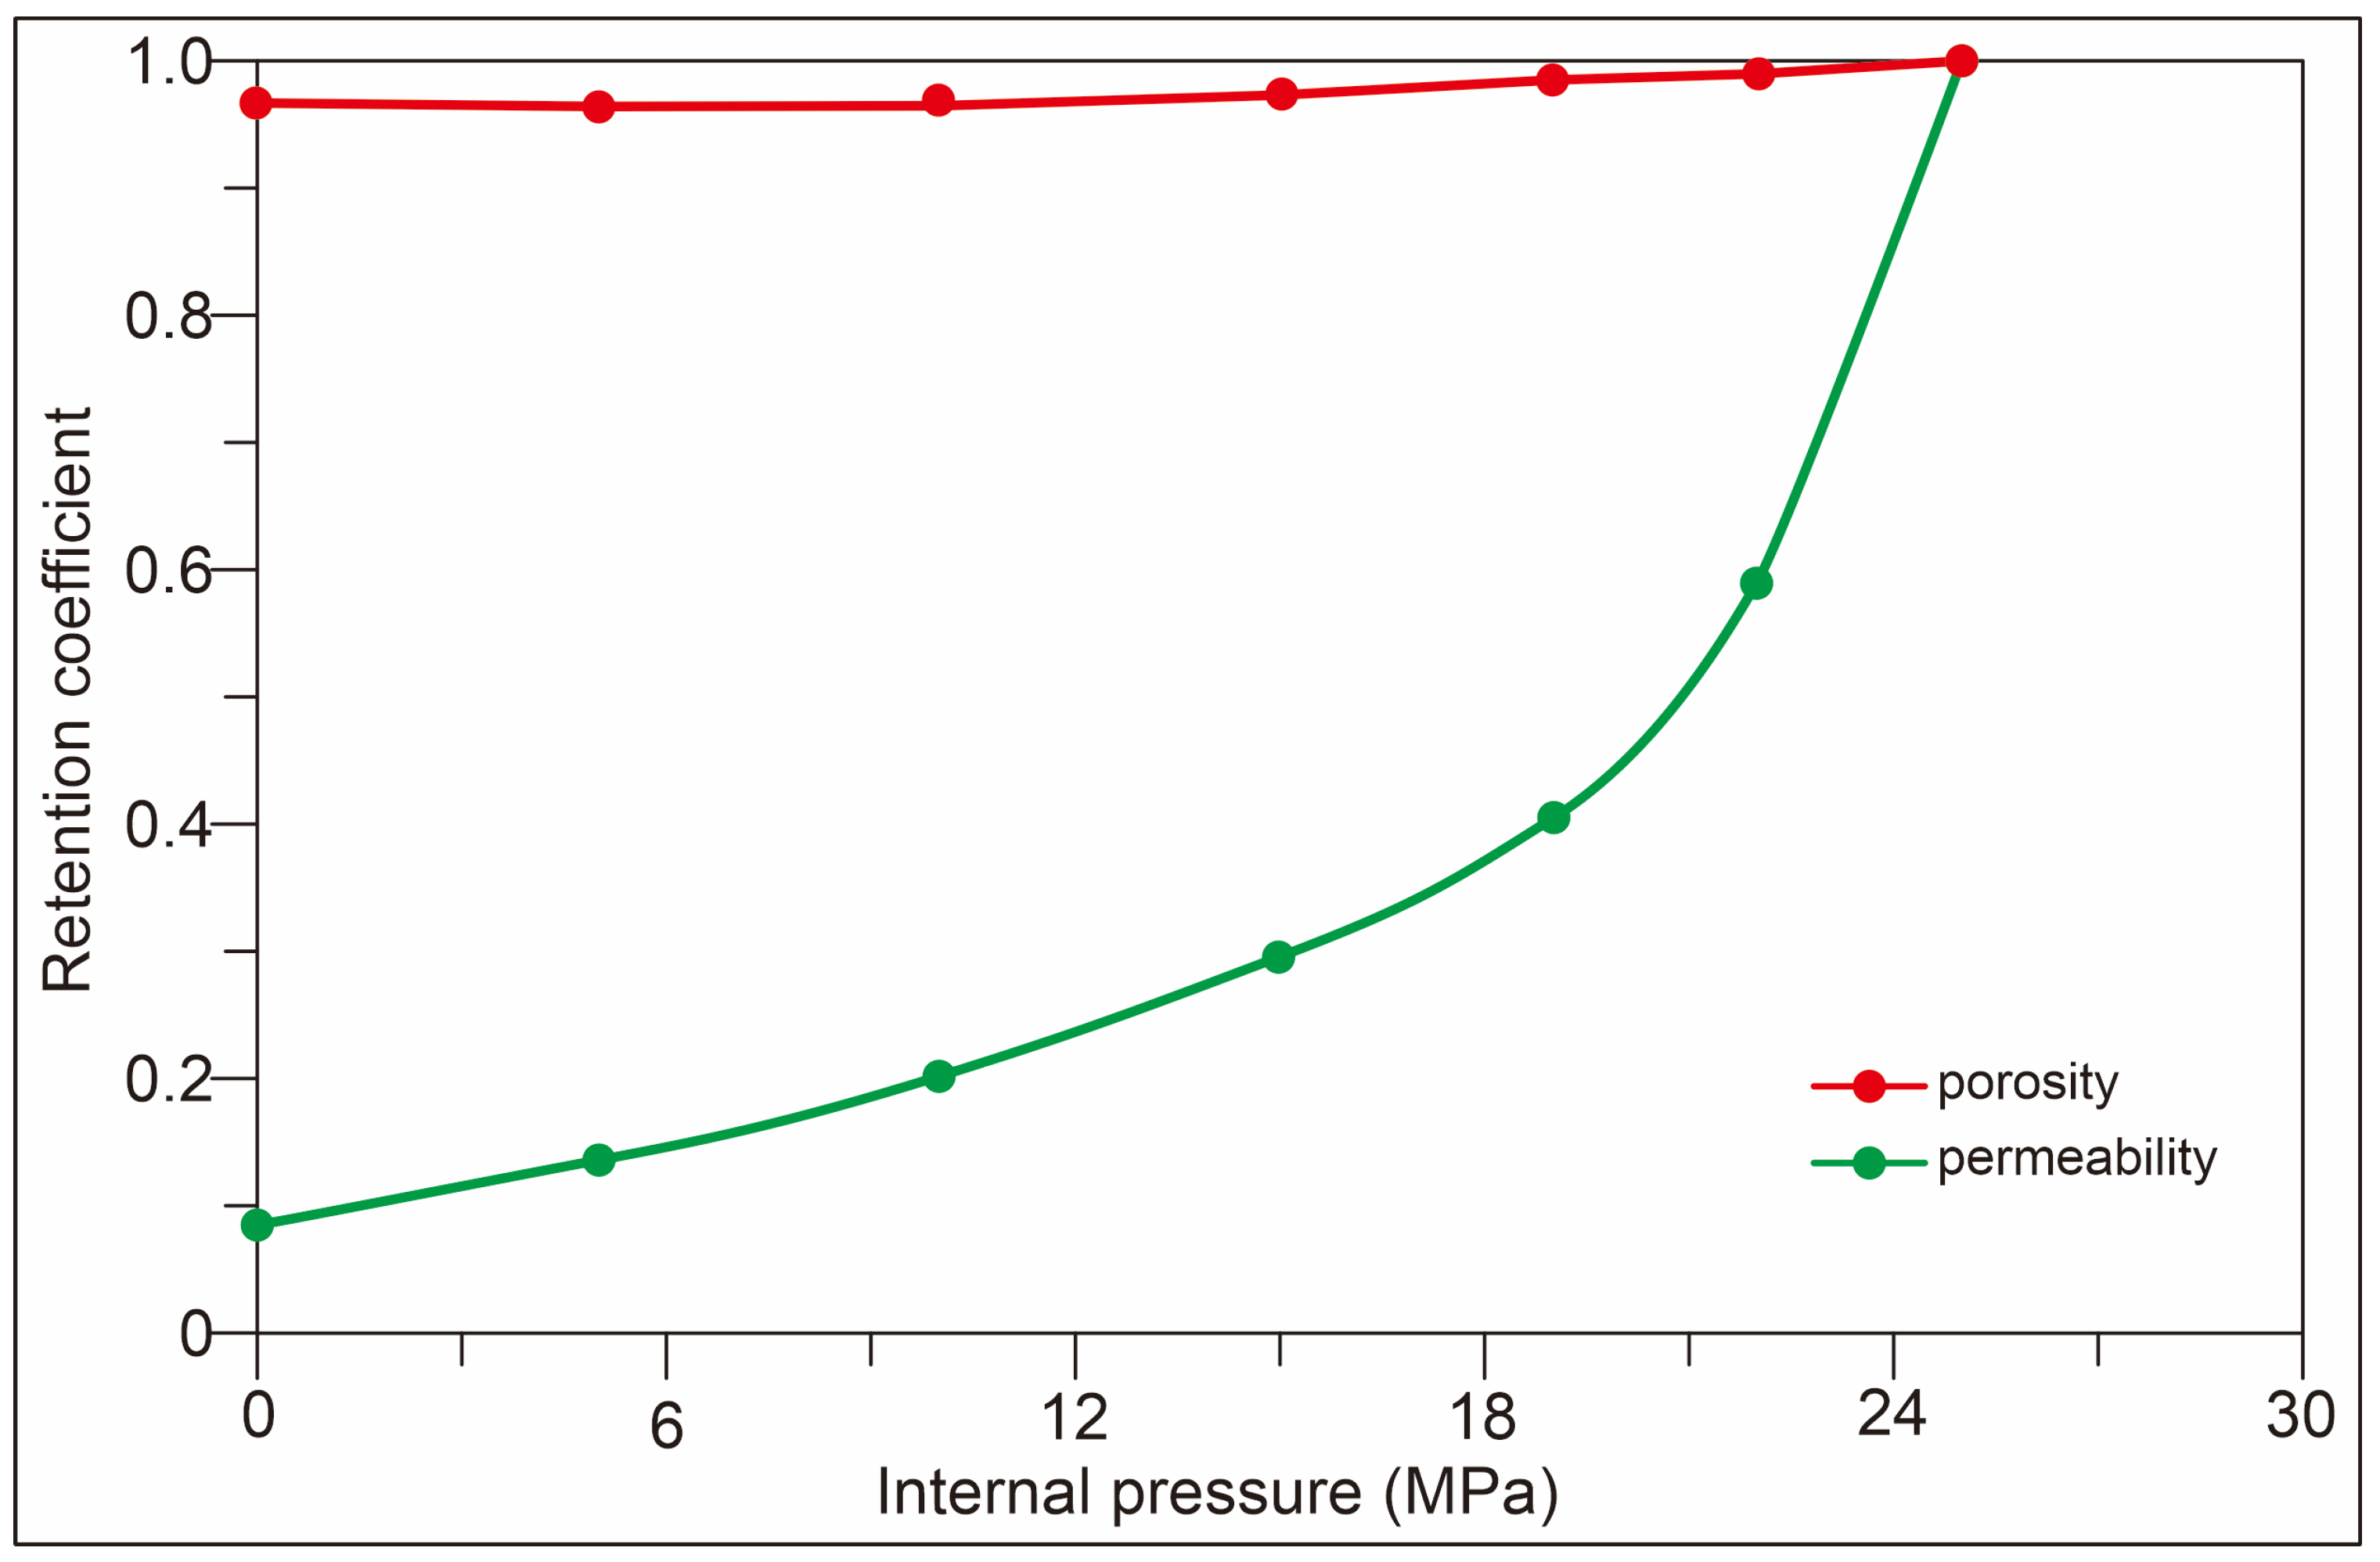
In order to simulate the effect of stress sensitivity on productivity during depressurization development, the ROCKTAB keyword is introduced into Eclipse reservoir numerical simulation software. In Table 2, the first column is the internal pressure value, the second column is the porosity conductivity multiplier corresponding to the first column of internal pressure data, and the third column is the permeability conductivity multiplier corresponding to the first column of internal pressure data. In the corner grid system, when the parameters such as the contact area of two adjacent grids remain unchanged, the conductivity multiplier can be regarded as the retention coefficient of porosity and permeability. The relationship between the retention coefficient of porosity and permeability and internal pressure calculated from the core #1 is shown in Figure 2. Using the stress sensitivity test results of core #1, the keyword ROCKTAB is set as shown in Table 2. ROCKTAB assigns porosity and permeability multipliers as functions of instantaneous internal pressure and therefore does not distinguish reversible from irreversible stress damage, so the experimentally observed hysteresis is represented only by using the depressurization branch and not the pressure-recovery branch (Figure 2). For example, when the internal pressure decreases from 25 MPa to 5 MPa, the porosity becomes 96.18% of the original porosity, and the permeability becomes 13.73% of the original permeability.
Figure 2.
Influence of internal stress on permeability and porosity.
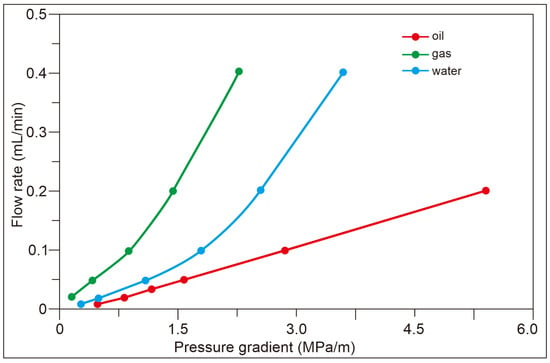
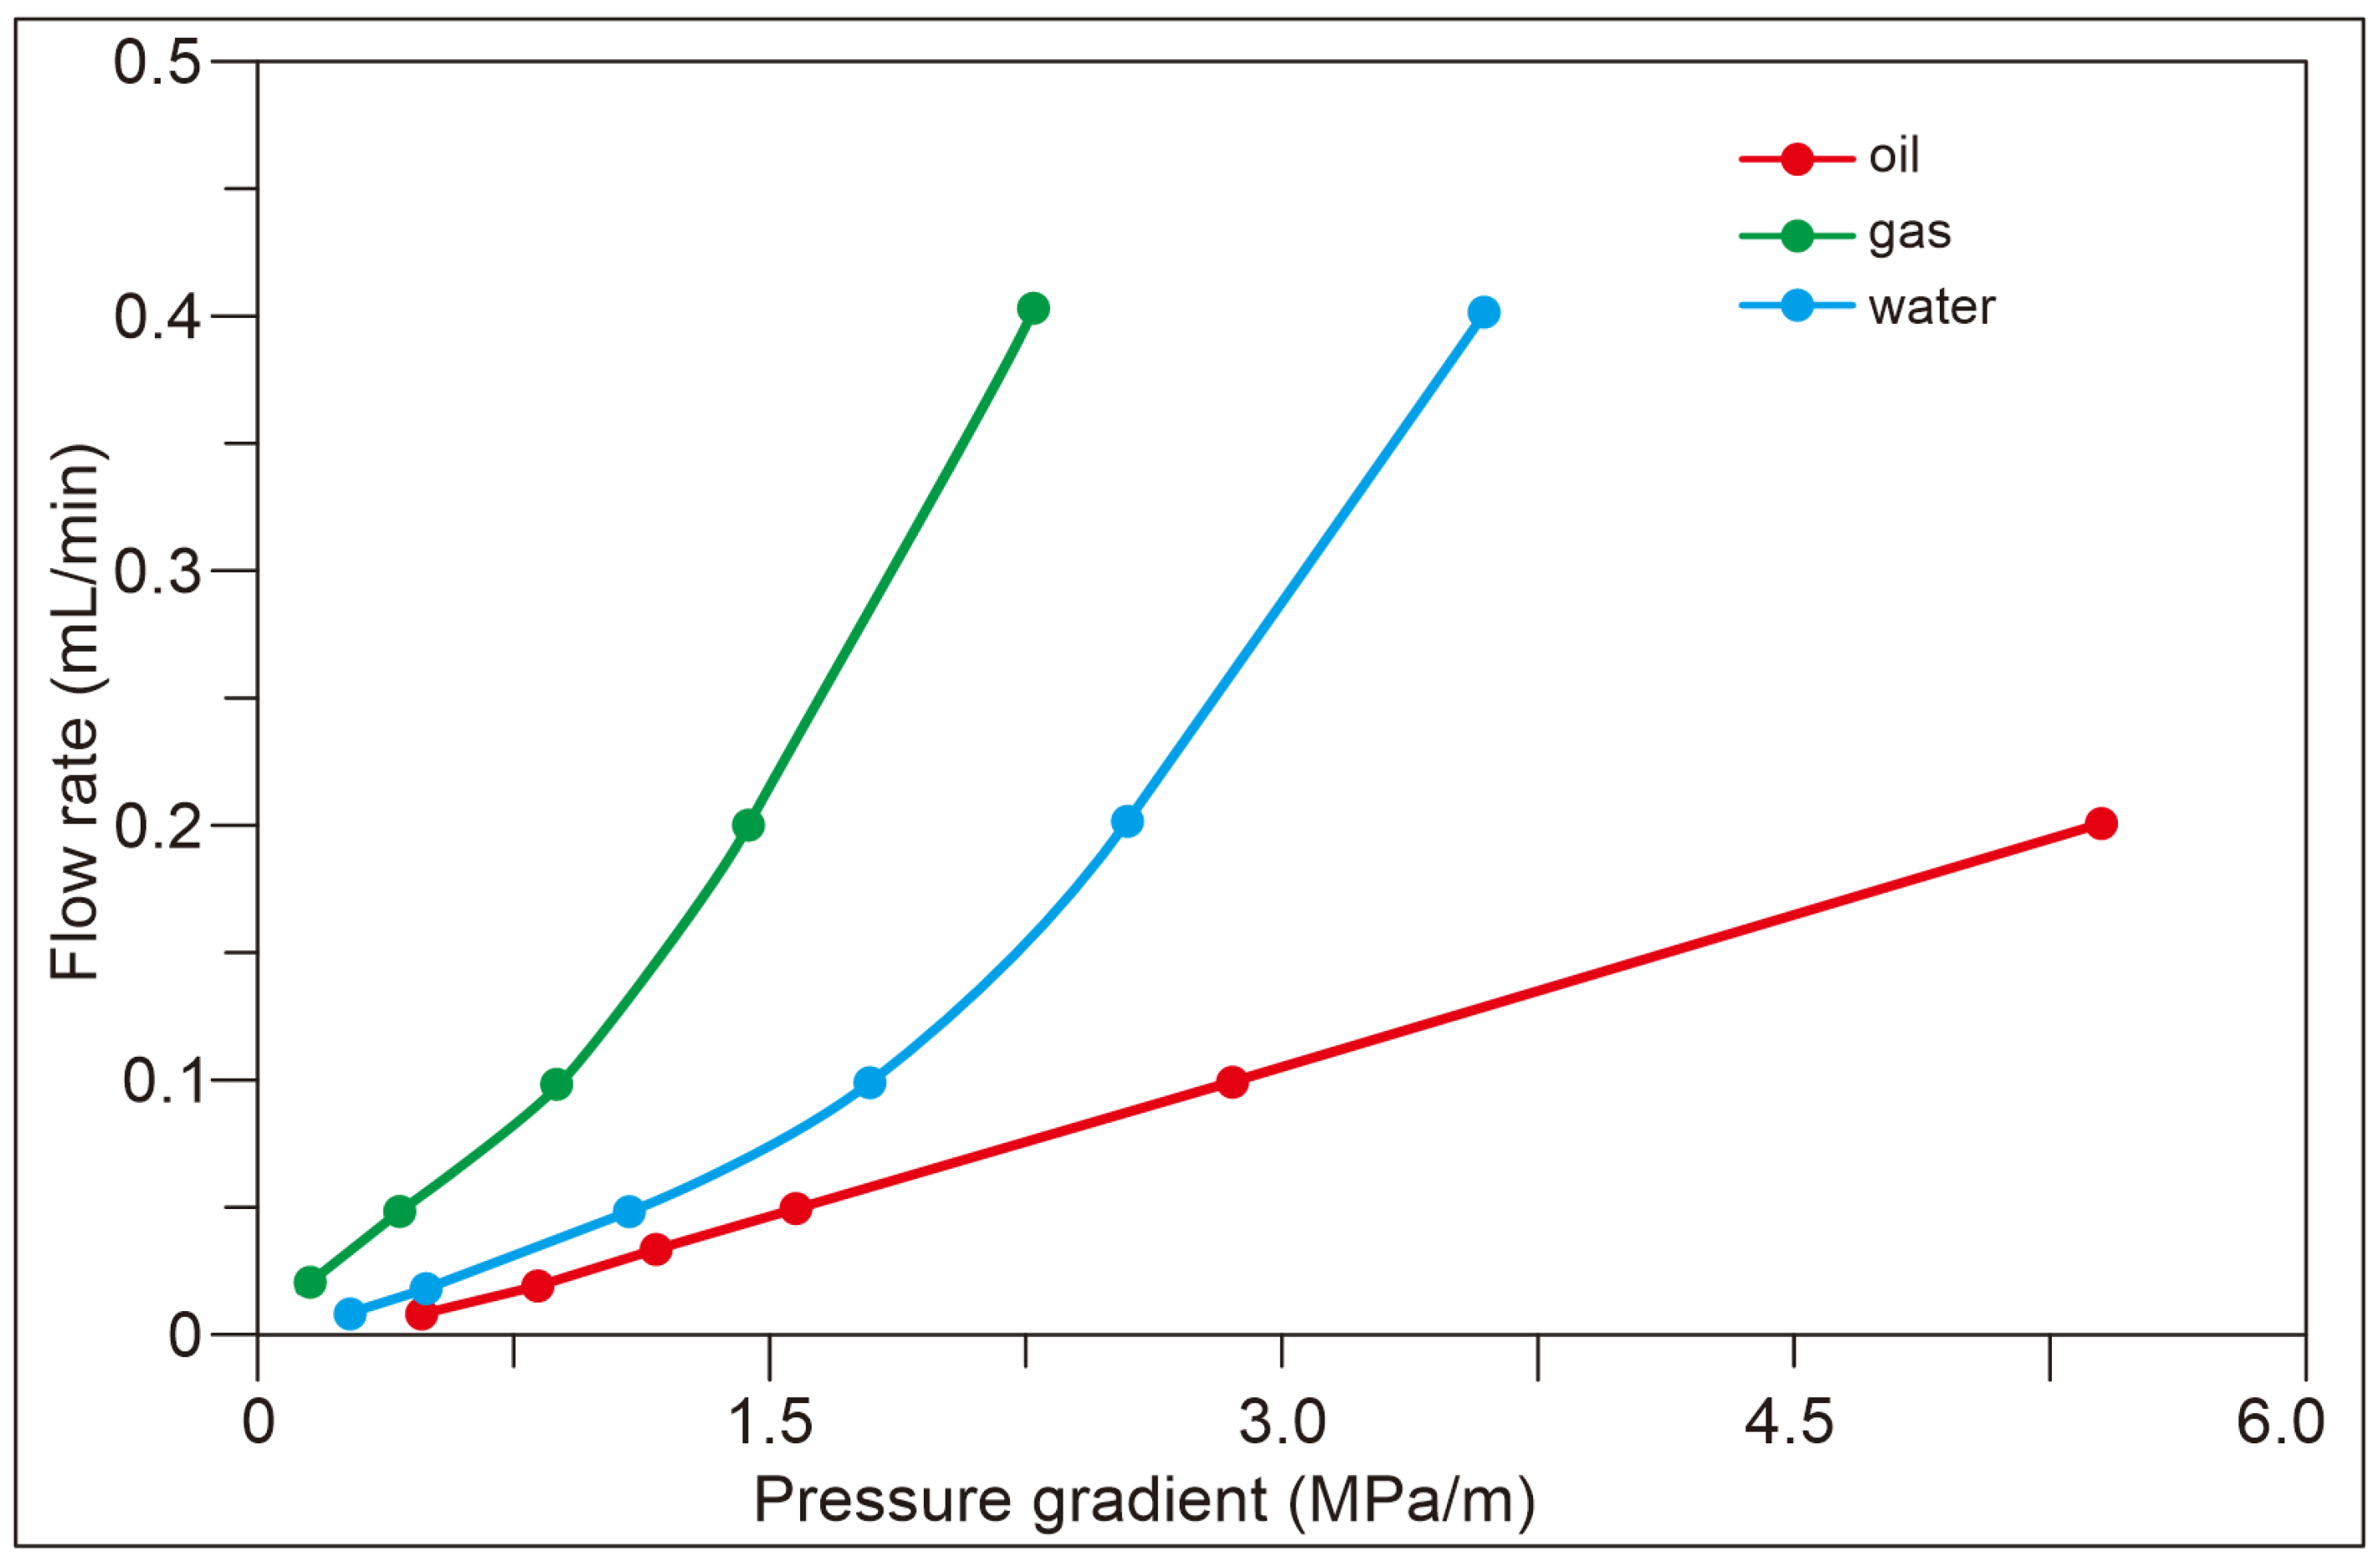
3.2. Threshold Pressure Determination
The core percolation curves measured under different displacement media conditions. From the pseudo stable flow section of the oil phase percolation curve, the pseudo threshold pressure gradient of the core is about 0.0096 MPa/m (9.6 × 10⁻⁵ MPa/cm); this value is obtained from the intercept of the pseudo-linear flow segment of the oil phase curve. In the process of numerical simulation, the threshold pressure is simulated by introducing the keyword Threshold Pressure. The meaning of this keyword is that the fluid flow between the two regions can be realized only when the pressure difference between the two regions reaches or exceeds the threshold pressure. There is no threshold pressure for the flow of fluid between grids with the same number of balance zones, whereas there is threshold pressure for the flow between any adjacent balance zones with different numbers of balance zones. For example, the threshold pressure gradient measured according to the core percolation experiment is about 0.0096 MPa/m (Figure 3). The threshold pressure of the grid where the equilibrium zone is located mainly depends on two points: the distance between the two equilibrium zones and the threshold pressure gradient. In Eclipse, the Threshold Pressure keyword imposes a minimum pressure difference for inter-cell flow between different equilibrium regions; therefore, the grid size and zoning pattern directly determine the numerical threshold value, and no sensitivity analysis is provided for the rounding from 0.0096 MPa/m to 0.576 MPa; since the distance between the two balance zones is 60 m and the threshold pressure difference between a single balance zone is 0.576 MPa, the threshold pressure between the two balance zones is set to be 0.576 MPa. The distance from the center well to the side well of the numerical model is 300 m. According to this calculation, the threshold pressure difference between injection and production wells is 2.88 MPa.
Figure 3.
Percolation curves of different fluids of core #1.
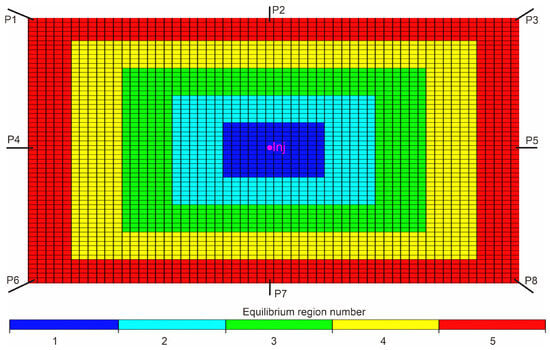
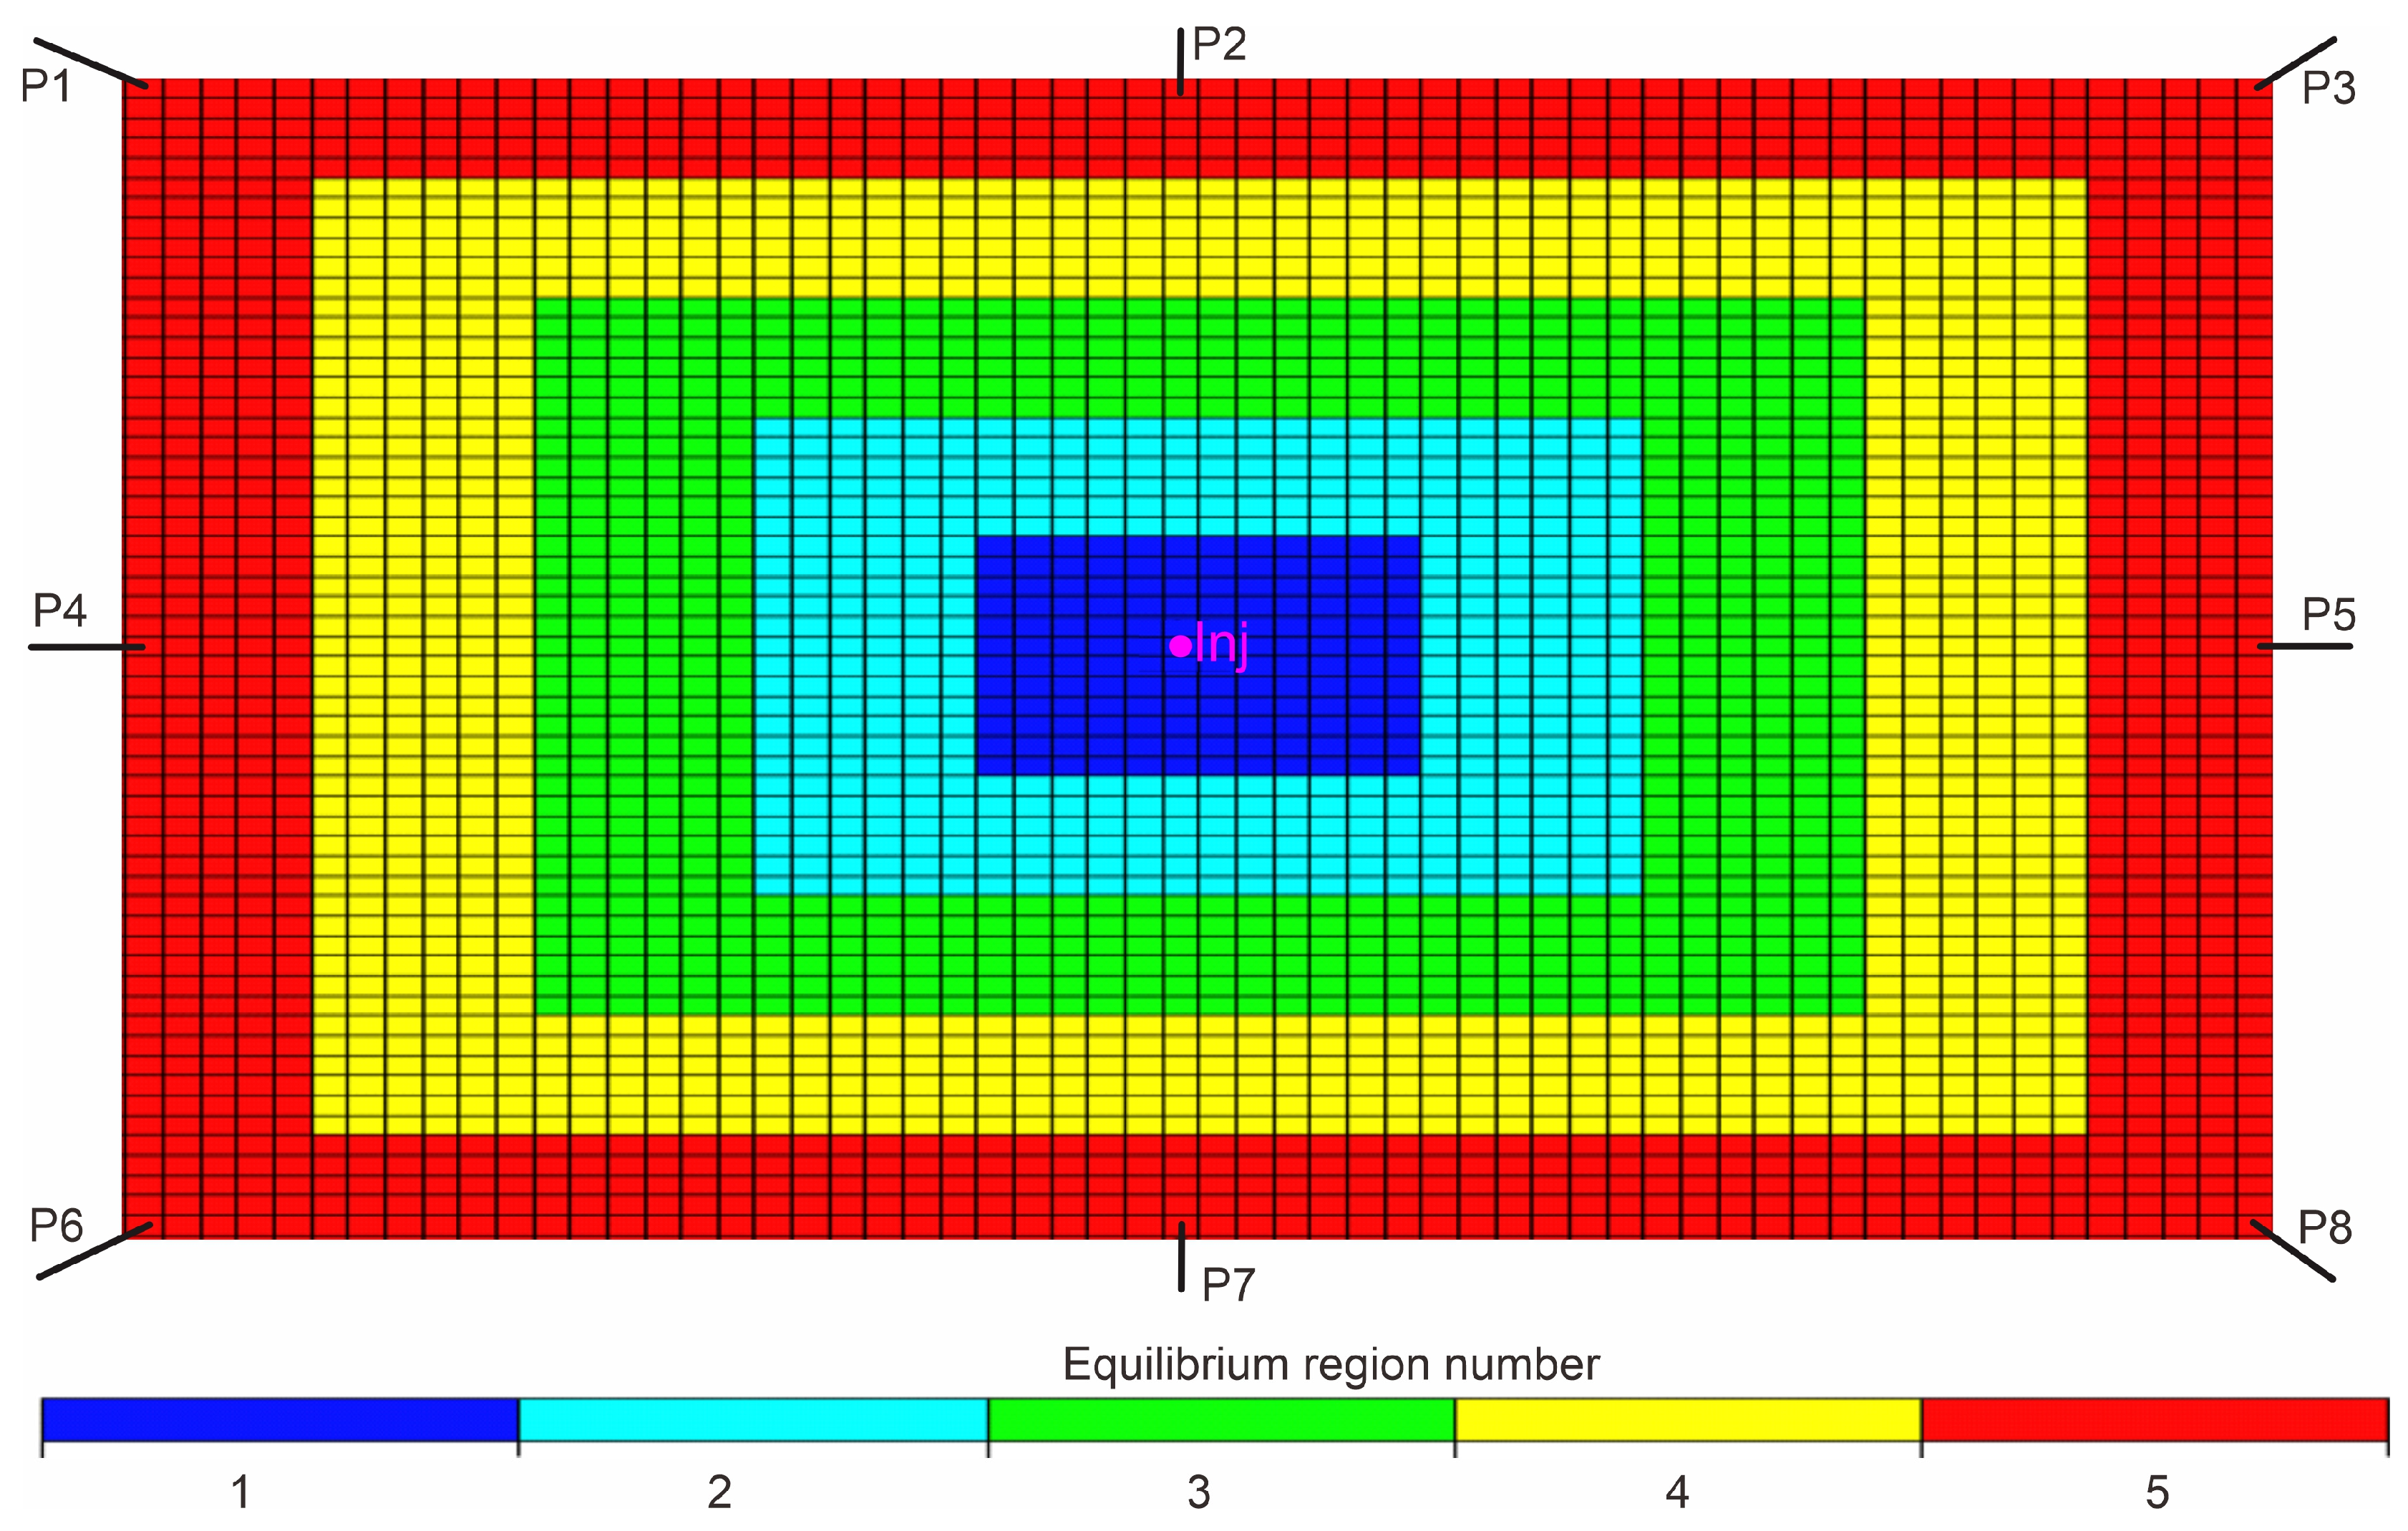
In the base model, only the threshold pressure of the flow in the plane is considered, and the threshold pressure in the longitudinal direction is ignored to reduce computational cost; however, because the vertical-to-horizontal permeability ratio is 0.1, vertical threshold pressure may still influence pressure redistribution during shut-in periods; no vertical-direction sensitivity analysis is provided for this simplification. Figure 4 shows the condition that the oil layer is homogeneous in the plane (in a certain region, numerical simulation usually adopts this treatment method). If it is the condition of plane heterogeneity, then each simulated grid block can only be zoned and numbered. The numerical simulation takes the injection well as the center to divide the numerical model of the injection production unit into five equilibrium zones (Figure 4, Table 4); the threshold pressure required for the fluid to flow from the equilibrium zone in the first column to the equilibrium zone in the second column is 0.576 MPa. The balanced zoning method can ensure that the threshold pressure difference in the injected fluid flowing to the surrounding production wells is equal, so as to realize the simulation of plane homogeneity.
Figure 4.
Dividing of partition equilibrium.
Table 4.
Setting of threshold pressure.
3.3. Effect of Stress Sensitivity and Threshold Pressure Gradient on Productivity
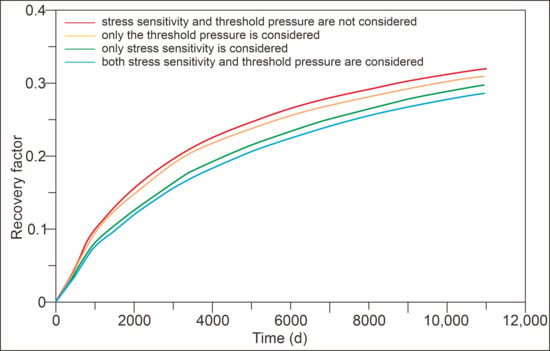
Based on the same geological model, different development methods are established, including continuous water injection model, continuous water injection model considering threshold pressure gradient, continuous water injection model considering stress sensitivity and continuous water injection model considering both stress sensitivity and threshold pressure gradient. Compared with the basic model, the continuous water injection model is established. In order to reduce the impact of stress sensitivity on productivity in the simulation process, the oil well is produced with a constant bottom flow pressure of 20 MPa, and the economic limit is set. When the water content of a single well exceeds 98%, the oil well will shut in automatically. The simulation results are shown in Figure 5. The water injection well is injected with a constant injection volume of 40 m3/d in the continuous case; in the unstable water injection cases, the injection rate during the injection half cycle is doubled to 80 m3/d so that the average injection rate over an entire cycle remains 40 m3/d, ensuring equivalent total injected volumes across all cases.
Figure 5.
Influence of stress sensitivity and threshold pressure gradient on production.
The existence of stress sensitivity and threshold pressure gradient has a significant impact on the final recovery, and the impact of stress sensitivity on productivity is significantly higher than that of threshold pressure gradient. When only considering stress sensitivity, the final recovery factor is reduced by 2.05%. When only the threshold pressure gradient is considered, the final recovery factor is reduced by 1.05%. Therefore, stress-sensitive damage should be avoided in the actual shale oil reservoir development. When threshold pressure and sensitivity exist at the same time, the final recovery factor is reduced by 3.35%, which is 0.25 percentage points greater than the simple sum of the individual reductions (2.05% + 1.05% = 3.10%); this non-linear interaction is likely caused by stress-dependent permeability reducing local pressure propagation and thereby increasing the effective threshold pressure gradient.
4. Discussion
4.1. Optimization of Unstable Water Injection Timing
This study adopts symmetrical unstable water injection, that is, the water injection time is equal to the stop time. According to the empirical formula of unstable water injection half cycle, the half cycle is about 24.4 days. For convenience of calculation, the half cycle is taken as 1 month. Under the condition that stress sensitivity and threshold pressure exist at the same time, in order to determine the optimal time to switch from continuous water injection to unstable water injection, seven simulation schemes are established respectively, as shown in Table 5.
Table 5.
Settings of unstable water injection cases.
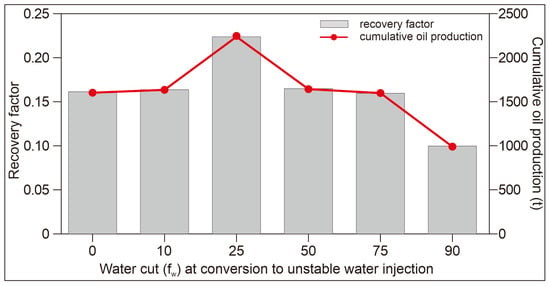
The simulation results of each scheme are shown in Figure 6. The effect of unstable water injection development is significantly better than that of continuous water injection development. There is an optimal time to convert to unstable water injection. When the water content exceeds 25%, the later the time to turn to unstable water injection, the worse the production increase effect. The simulation results show that, among the discrete water-cut switching cases tested and in the absence of field history matching or grid-refinement validation, the 25% water-cut case gives the highest recovery increase relative to continuous water injection and the largest cumulative oil production increment; this value is case-specific rather than a validated field optimum.
Figure 6.
Comparison of stimulation result for different water-cut timing converting to unstable water injection.
4.2. Optimization of Unstable Water Injection Half Cycle
In order to determine the optimal unstable water injection half cycle under the condition of simultaneous existence of stress sensitivity and threshold pressure gradient, seven simulation schemes are set up respectively, as shown in Table 6. Except for the continuous water injection scheme, the time for scheme 2–7 to convert to unstable water injection is when the water cut of the whole region reaches 25%.
Table 6.
Half-period injection time of different cases.
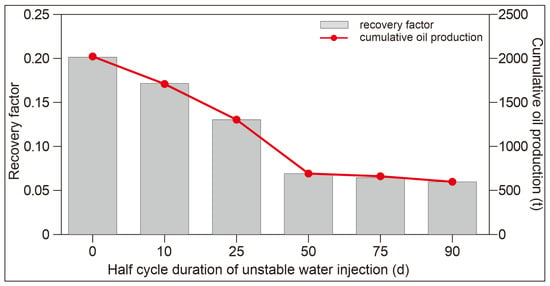
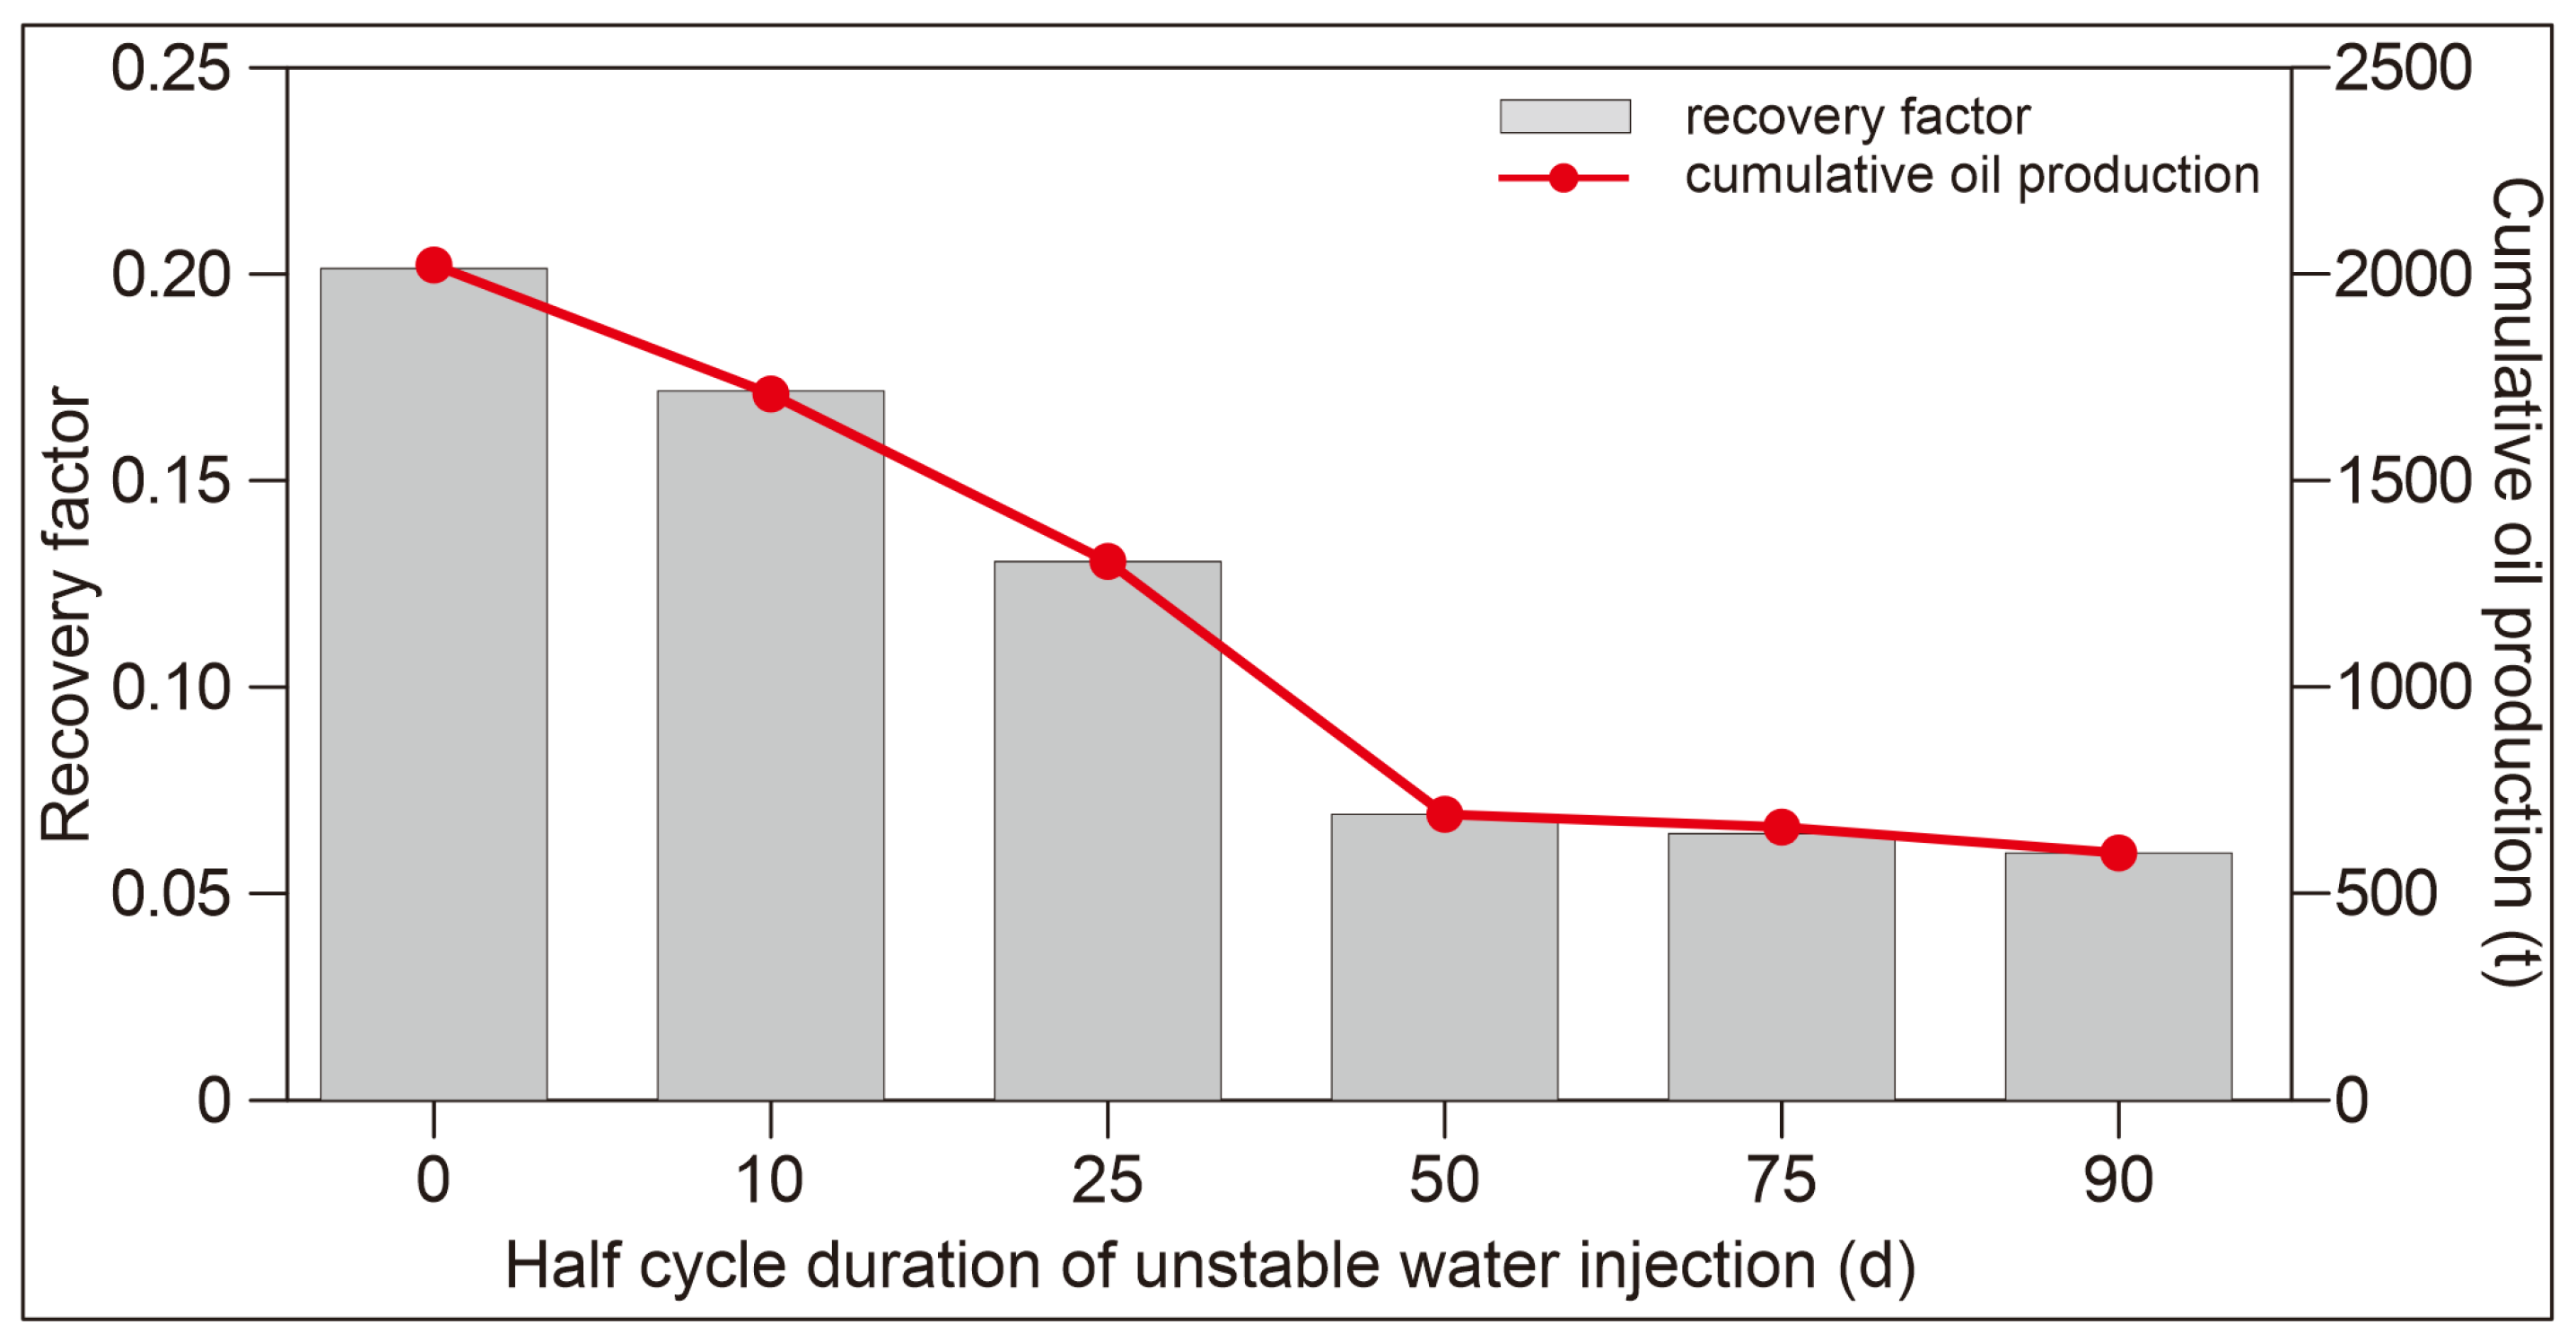
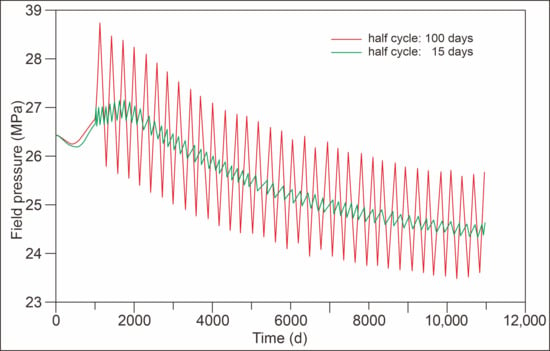
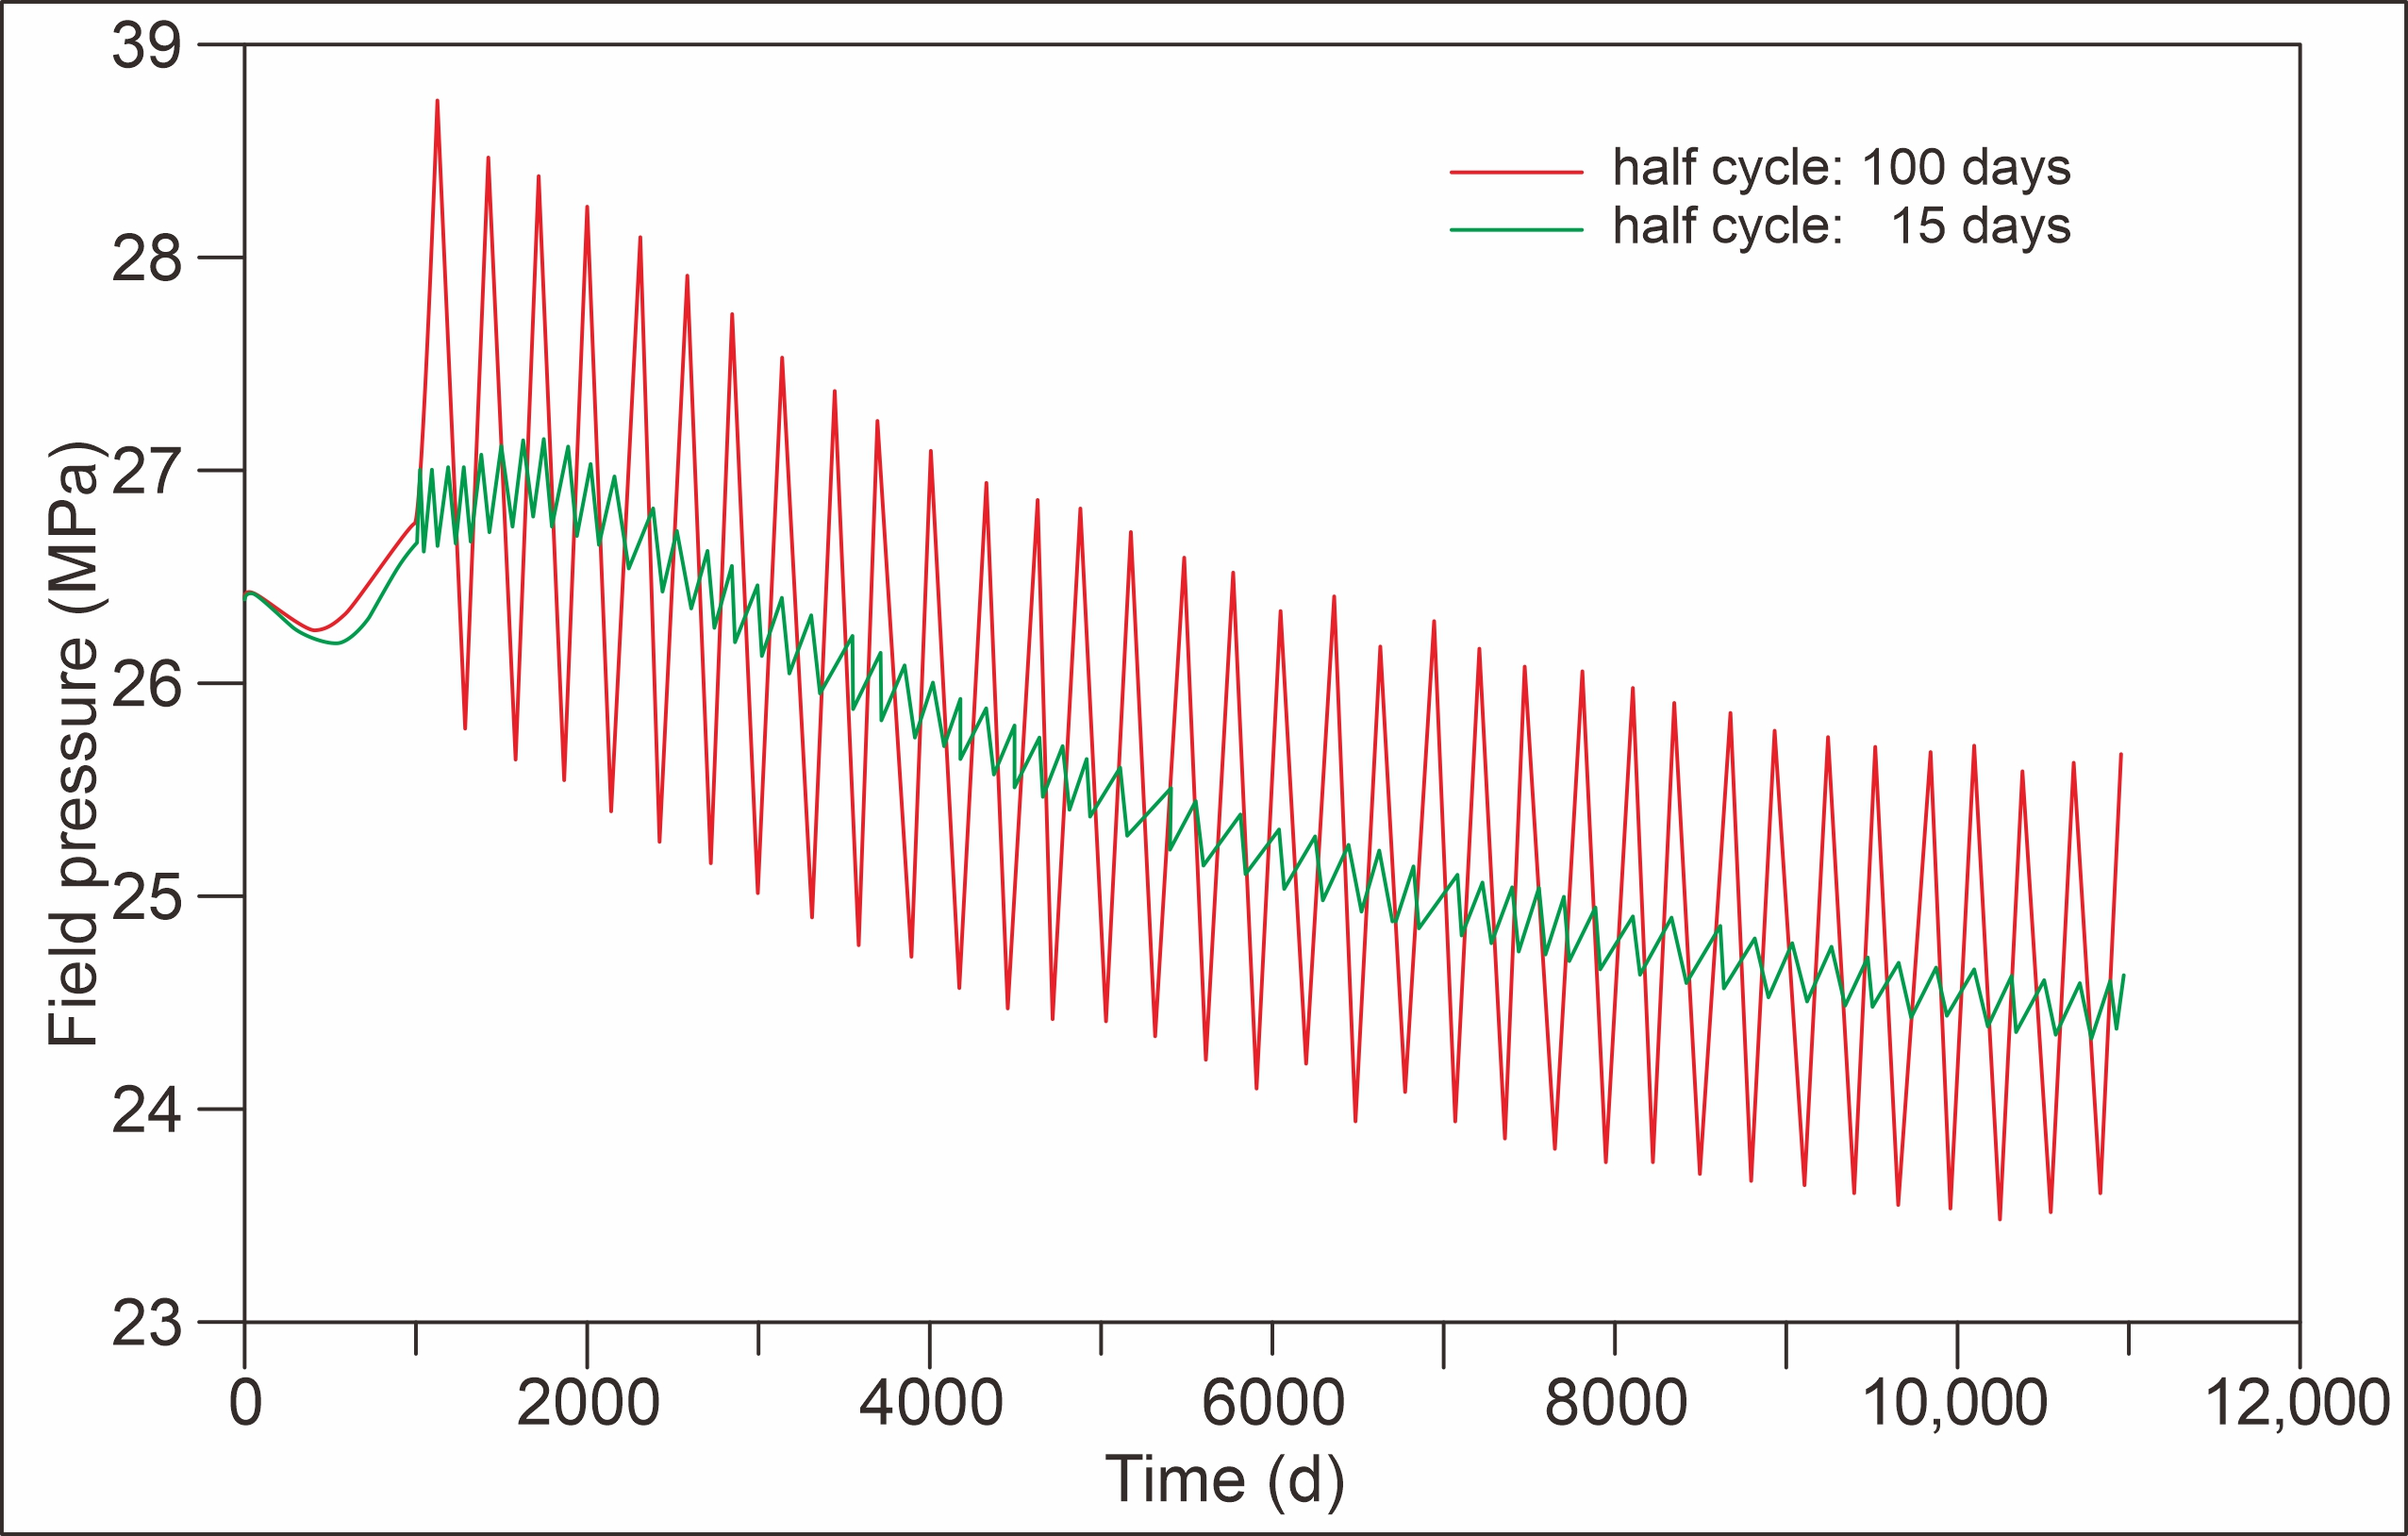
Compared with continuous water injection, the recovery efficiency of different half cycle schemes has increased, but the increase degree is different. The recovery efficiency increase degree and cumulative oil production increment in the development scheme with a half cycle of 15 days are the highest among the cases simulated Figure 7; because the model has not been validated against field data or tested by grid refinement, this result is model-dependent and should not be taken as a general optimum without further validation. Under the same other conditions, the interval time of long half cycle is long, and the oil well produces with constant bottom-hole flowing pressure, resulting in large fluctuations in formation pressure (Figure 8). The numerical model does not include capillary imbibition; therefore, the half-cycle optimum reflects only the pressure fluctuation/stress sensitivity trade-off. The experimental data shows that the stress sensitivity of this model is strong, so the long half cycle water injection method is expected to cause greater stress sensitivity damage than the short half cycle water injection method, resulting in the decline in stimulation effect.
Figure 7.
Comparison of stimulation results for different half-cycle duration injection cases.
Figure 8.
Comparison of pressure change for different cases.
4.3. Limitations
The following analyses were not performed in this study, and the corresponding findings should be interpreted accordingly: additional core testing to confirm the representativeness of core #1; quantitative verification of the Klinkenberg correction; viscosity scaling of the measured threshold pressure gradient; sensitivity analyses for threshold pressure rounding and vertical threshold pressure.
5. Conclusions
- (1)
- The results of core stress sensitivity experiment and core percolation experiment are applied to reservoir numerical simulation by introducing the keywords ROCKTAB and Threshold Pressure into Eclipse, and a numerical simulation research method of shale oil reservoir considering both stress sensitivity and threshold pressure gradient is realized.
- (2)
- The existence of stress sensitivity and threshold pressure gradient has a significant impact on the final recovery. When only considering stress sensitivity, the final recovery is reduced by 2.05%. When only the threshold pressure gradient is considered, the final recovery factor is reduced by 1.05%. When the threshold pressure and sensitivity both exist, the final recovery factor is reduced by 3.35%.
- (3)
- The effect of unstable water injection development is significantly better than that of continuous water injection development, and there is an optimal time to convert to unstable water injection. Among the discrete water-cut switching cases tested and in the absence of field history matching or grid-refinement validation, when the water cut of the whole area reaches 25%, the recovery rate of unstable water injection is the highest relative to continuous water injection; this value is case-specific. When the water cut exceeds 25%, the later the time to turn to unstable water injection, the worse the production increase effect.
- (4)
- Compared with continuous water injections, the recovery efficiency of different half cycle schemes has increased, but the degree of increase is different. Among the simulated cases, the development scheme with a half cycle of 15 days has the highest degree of recovery increase and cumulative oil production increment; because capillary imbibition is not included in the model, this result reflects only the pressure fluctuation/stress sensitivity trade-off. With the increase in half cycle, the increase degree of recovery decreases, and the short half cycle development mode is slightly better than the long cycle development mode. The long half cycle interval time is long, easily causing large formation pressure fluctuations, and will cause greater stress-sensitive damage to the reservoir with strong stress sensitivity, resulting in the decline in stimulation effect.
Author Contributions
Conceptualization, H.W. and C.C.; methodology, H.W.; software, C.C.; validation, L.Z. and H.X.; formal analysis, Z.X. and L.H.; investigation, M.Z. and B.W.; resources, X.W.; data curation, H.W. and C.C.; writing—original draft preparation, H.W.; writing—review and editing, C.C., L.Z., H.X., Z.X., L.H., M.Z., B.W. and X.W.; visualization, M.Z.; supervision, C.C.; project administration, C.C.; funding acquisition, C.C. All authors have read and agreed to the published version of the manuscript.
Funding
This research was funded by SINOPEC, grant number P24098.
Data Availability Statement
Experimental data are listed in the paper, no further new data.
Acknowledgments
During the preparation of this manuscript/study, the authors used DeepSeek-v4-pro for the purposes of language checking. The authors have reviewed and edited the output and take full responsibility for the content of this publication.
Conflicts of Interest
Author Hua Wu, Chenguang Cao, Liang Zhang, Hongli Xiong, Zuowen Xie, Lishi Huang, Manting Zhang and Boyu Wang were employed by the company The Institute of Exploration and Development, Sinopec (China). The remaining authors declare that the research was conducted in the absence of any commercial or financial relationships that could be construed as a potential conflict of interest. The authors declare that this study received funding from Sinopec (China). The funder was not involved in the study design, collection, analysis, interpretation of data, the writing of this article or the decision to submit it for publication.
Nomenclature
| TPG | threshold pressure gradient |
| ROCKTAB | Eclipse keyword for stress-dependent rock compaction tables |
| EOR | enhanced oil recovery |
| PVT | pressure–volume–temperature |
| GOR | gas–oil ratio |
| Swi | initial water saturation |
| Δk | permeability retention coefficient |
| Δφ | porosity retention coefficient |
| ko | permeability under initial condition |
| φo | porosity under initial condition |
| ki | permeability under different internal pressure conditions |
| φi | porosity under different internal pressure conditions |
| fw | water content ratio in liquid output (water cut) |
References
- Sun, Z.; Li, Z.; He, C.; Zhu, F.; Shen, B.; Lu, L. Characteristics of connected pores and evaluation of shale oil mobility in the Qianjiang Formation, Qianjiang Sag, Jianghan Basin, China. J. Earth Sci. 2025, 36, 1591–1604. [Google Scholar] [CrossRef] [Scilit]
- Liang, X.; Chen, F.; Li, W.; Wu, Z.; Ma, W. The controlling effect of salt rhythm in continental saline lake basins on tight oil accumulation: A case study of the lower Xinguozui Formation in the Qianjiang Sag. Resour. Data J. 2026, 5, 116–123. [Google Scholar]
- Cao, C.; Liu, X.; Wu, H.; Zhang, L.; Jia, Y.; Zhang, M.; Wang, X. Characteristics of fractured lacustrine carbonate reservoirs in the Zhongshi area, Jianghan Basin, China. Energies 2026, 19, 1402. [Google Scholar] [CrossRef] [Scilit]
- Yang, Y.; Yang, Y. Effect of water injection rate on the distribution of water-driven oil in the Tankou Oilfield. J. Geo-Energy Environ. 2026, 2, 163–177. [Google Scholar] [CrossRef] [Scilit]
- Fatt, I.; Davis, D.H. Reduction in permeability with overburden pressure. J. Pet. Technol. 1952, 4, 34–41. [Google Scholar] [CrossRef] [Scilit]
- Yu, Z.L.; Xiong, W.; Gao, S.S.; Liu, L. Stress sensitivity analysis of low-permeability reservoirs. Nat. Gas Technol. 2008, 2, 26–29, (In Chinese with English abstract). [Google Scholar]
- Jiao, C.Y.; He, S.L.; Xie, Q.; Gu, D.H.; Zhu, H.Y.; Sun, L.; Liu, H.X. An experimental study on stress-dependent sensitivity of ultra-low permeability sandstone reservoirs. Acta Pet. Sin. 2011, 32, 489–494, (In Chinese with English abstract). [Google Scholar]
- Dong, L.F.; Yue, X.A.; Xu, X.; Su, Q.; Song, W.X. Experimental study on the stress sensitivity in different permeability reservoirs. Geol. Sci. Technol. Inf. 2015, 34, 155–158, (In Chinese with English abstract). [Google Scholar]
- Ruan, M.; Wang, L.G. Low-permeability oilfield development and pressure-sensitive effect. Acta Pet. Sin. 2002, 23, 73–78. [Google Scholar]
- Raghavan, R.; Chin, L.Y. Productivity changes in reservoirs with stress-dependent permeability. SPE Reserv. Eval. Eng. 2004, 7, 308–315. [Google Scholar] [CrossRef] [Scilit]
- Wang, Q.L.; Tang, H.; Lü, D.L.; Peng, D.B.; Guo, F.Z. An experimental study on threshold pressure gradient in low permeability reservoir. Pet. Geol. Recovery Effic. 2011, 18, 97–100, (In Chinese with English abstract). [Google Scholar]
- Wei, X.; Qun, L.; Shusheng, G.; Zhiming, H.; Hui, X. Pseudo threshold pressure gradient to flow for low permeability reservoirs. Pet. Explor. Dev. 2009, 36, 232–236. [Google Scholar] [CrossRef] [Scilit]
- Liu, W.C.; Liu, Y.W.; Niu, C.C.; Han, G.F.; Wan, Y.Z. Numerical investigation of a coupled moving boundary model of radial flow in low-permeable stress-sensitive reservoir with threshold pressure gradient. Chin. Phys. B 2016, 25, 024701. [Google Scholar] [CrossRef] [Scilit][Green Version]
- Tan, X.H.; Zhou, X.J.; Xu, P.; Zhu, Y.; Zhuang, D.J. A fractal geometry-based model for stress-sensitive permeability in porous media with fluid-solid coupling. Powder Technol. 2025, 455, 120774. [Google Scholar] [CrossRef] [Scilit]
- Zhou, J.; Deng, G.; Tian, S.; Xian, X.; Yang, K.; Zhang, C.; Dong, Z. Experimental study on the permeability variation of sandstone at cyclic stress: Implication for underground gas storage. J. Energy Storage 2023, 60, 106677. [Google Scholar] [CrossRef] [Scilit]
- Du, S.H.; Shen, W.H.; Zhao, Y.P. Quantitative evaluation of stress sensitivity in shale reservoirs: Ideas and applications. Chin. J. Theor. Appl. Mech. 2022, 54, 2235–2247. [Google Scholar]
- Li, Z.; Yu, H.; Bai, Y.; Wang, Y.; Hu, H.; Gao, Y.; Yan, F. Analysis of reservoir permeability evolution and influencing factors during CO2-enhanced coalbed methane recovery. Energy 2024, 304, 132045. [Google Scholar] [CrossRef] [Scilit]
- Li, P.; Liu, Y.; Cai, M.; Miao, S.; Dai, L.; Gorjian, M. Accurate stress measurement using hydraulic fracturing in deep low-permeability reservoirs: Challenges and research directions. Adv. Geo-Energy Res. 2024, 14, 165–169. [Google Scholar] [CrossRef] [Scilit]
- Luo, X.; Wang, X.; Wu, Z.; He, T.; Qiu, X.; Yuan, F.; Tan, C. Study on stress sensitivity of ultra-low permeability sandstone reservoir considering starting pressure gradient. Front. Earth Sci. 2022, 10, 890084. [Google Scholar] [CrossRef] [Scilit]
- Wang, J.; Liu, H.; Zhang, J.; Meng, Q.; Liu, H.; Ge, L.; Liu, C. Experimental investigation on water flooding and continued EOR techniques in buried-hill metamorphic fractured reservoirs. J. Pet. Sci. Eng. 2018, 171, 529–541. [Google Scholar] [CrossRef] [Scilit]
- Di, S.; Ma, S.; Wei, Y.; Jing, H. Study on the mechanisms of microscopic remaining oil flow during cyclic water flooding. ACS Omega 2025, 10, 9062. [Google Scholar] [CrossRef] [Scilit] [PubMed]
- He, A.; Li, J.; Jiang, M.; Fang, Y.; Wang, Z.; Yang, H.; Jiang, H. Study of cyclic waterflooding for improving oil recovery in Lukeqin heavy oil reservoir. Geoenergy Sci. Eng. 2023, 223, 211467. [Google Scholar] [CrossRef] [Scilit]
- Ke, W.; Liu, Y.; Zhao, X.; Yu, G.; Wang, J. Study on the effect of threshold pressure gradient on remaining oil distribution in heavy oil reservoirs. ACS Omega 2022, 7, 3949. [Google Scholar] [CrossRef] [Scilit] [PubMed]
- Wang, J.; Li, Y.Z.; Wang, S.Y.; Wei, M.X.; Tang, X.J.; Fan, X.H.; Li, X. Optimal modeling of PV-grid collaborative water injection systems. In Proceedings of the International Field Exploration and Development Conference, Singapore, 2026; Springer: Singapore, 2026; pp. 902–908. [Google Scholar]
- Asare, K.; Ejike, C.; Okere, C.J. Numerical evaluation of multi-well cyclic gas injection technique for enhanced oil recovery in composite tight oil reservoirs. Arab. J. Sci. Eng. 2025, 50, 5037–5054. [Google Scholar] [CrossRef] [Scilit]
- Zhang, G.; Yang, S.; Mo, C.; Zhang, Z. Experimental research on capacity expansion simulation of multi-cycle injection-production in reconstruction of oil reservoir to underground gas storage. J. Energy Storage 2022, 54, 105222. [Google Scholar] [CrossRef] [Scilit]
- Li, Y.; Nguyen, Q.M.; Onur, M. Nonlinearly constrained life-cycle water flooding robust optimization using INSIM-2P. In Proceedings of the SPE Reservoir Simulation Conference, Galveston, TX, USA, 25–27 March 2025. SPE-223916-MS. [Google Scholar]
- Yuan, C.; Wei, Z.; Xu, J.; Tang, K. Numerical simulation and parametric optimization of harmonic pulse water flooding technology. Pet. Sci. Technol. 2026, 44, 1452–1474. [Google Scholar] [CrossRef] [Scilit]
- Chen, L.; Huang, Z.; Zhao, Q.; Miao, Y.; Jin, H.; Wang, Y.; Guo, L. Experimental investigation on enhanced oil recovery of heavy oil via cyclic supercritical water stimulation. Geoenergy Sci. Eng. 2025, 245, 213525. [Google Scholar] [CrossRef] [Scilit]
- Zhu, W.; Zou, G.; Liu, Y.; Liu, W.; Pan, B. The influence of movable water on the gas-phase threshold pressure gradient in tight gas reservoirs. Energies 2022, 15, 5309. [Google Scholar] [CrossRef] [Scilit]
- SY/T 5358-2010; Formation Damage Evaluation by Flow Test. Standardization Administration of China: Beijing, China, 2010.
- SY/T 6385-2016; The Porosity and Permeability Measurement of Core in Net Overburden Pressure. Standardization Administration of China: Beijing, China, 2016.
- SY/T 6703-2007; General Technical Conditions for Core Flow Test Instruments. Standardization Administration of China: Beijing, China, 2007.

Disclaimer/Publisher’s Note: The statements, opinions and data contained in all publications are solely those of the individual author(s) and contributor(s) and not of MDPI and/or the editor(s). MDPI and/or the editor(s) disclaim responsibility for any injury to people or property resulting from any ideas, methods, instructions or products referred to in the content. |
© 2026 by the authors. Licensee MDPI, Basel, Switzerland. This article is an open access article distributed under the terms and conditions of the Creative Commons Attribution (CC BY) license.