


Abstract
Concentrating solar power (CSP) can simultaneously provide high-temperature steam and renewable electricity for solid oxide electrolysis cells (SOECs), offering an efficient pathway for solar hydrogen production. This study proposes and compares two CSP-SOEC integrated hydrogen production configurations based on different steam extraction strategies: main steam extraction before turbine expansion (Scheme 1) and reheated steam extraction after the reheating process (Scheme 2). The effects of steam extraction rate and SOEC operating temperature on the thermodynamic performance of the integrated system are systematically investigated. At an SOEC operating temperature of 600 °C, Scheme 1 achieves a maximum hydrogen production rate of 296.33 g s−1 with an SOEC power consumption of 36.59 MW, while the CSP net output decreases to 1.15 MW. Under the same conditions, Scheme 2 reaches a hydrogen production rate of 240.67 g s−1 and an SOEC power consumption of 29.74 MW, with the CSP net output reduced to 9.37 MW. Increasing the SOEC operating temperature to 1000 °C improves the hydrogen production rates to 271.61 g s−1 and 225.31 g s−1 for Scheme 1 and Scheme 2, respectively. The maximum solar-to-hydrogen energy conversion efficiency reaches 19.5%. For a 50 MW CSP plant, the maximum peak-shaving revenues are 21,002 CNY day−1 for Scheme 1 and 21,350 CNY day−1 for Scheme 2, respectively. The corresponding minimum LCOHs are 40.91 CNY kgH2−1 and 42.36 CNY kgH2−1, respectively.
1. Introduction
For China, the announcement of the carbon peaking and carbon neutrality goals has fundamentally reshaped the country’s energy development strategy [1]. Among the available decarbonization pathways, zero-carbon fuels are widely regarded as one of the most effective and practical solutions for achieving these climate objectives. As a clean energy carrier with high gravimetric energy density and the capability for long-term storage, hydrogen has attracted considerable attention worldwide [2]. Therefore, developing clean and efficient hydrogen production technologies is essential for accelerating the large-scale utilization of hydrogen energy and supporting the low-carbon transformation of the global energy system [3].
China’s hydrogen production exceeded 36.5 million metric tons in 2024, representing a year-on-year increase of 3.5% [4]. Fossil-fuel-based hydrogen production remained the primary source, reaching 20.7 million metric tons, an increase of 6.7% compared with the previous year and accounting for nearly 56% of the total output [5]. Hydrogen produced from natural gas and industrial byproduct gases each contributed approximately 21% of the total production. By contrast, water electrolysis, recognized as the cleanest hydrogen production pathway, generated only about 320,000 metric tons, accounting for roughly 1% of the national hydrogen output in 2024. With the continuous optimization of peak-to-valley electricity pricing mechanisms and the rapid expansion of renewable energy resources such as solar and wind power, water electrolysis is expected to become the most promising hydrogen production technology in the future, owing to its outstanding environmental performance and high energy conversion potential [6,7,8].
Alkaline water electrolysis (ALK) is currently the most commercially mature and widely deployed hydrogen production technology because of its well-established operating principle and relatively simple system configuration. Nevertheless, its energy conversion efficiency remains relatively low, typically around 60% [9]. Under steady-state operating conditions, the specific electricity consumption of ALK ranges from 4.5 to 5.5 kWh/Nm3, making hydrogen production costs highly sensitive to electricity prices. At present, the production cost of hydrogen via ALK is approximately 25–45 CNY/kg, which is substantially higher than that of conventional gray hydrogen (about 10 CNY/kg) [10,11,12]. As renewable electricity becomes increasingly available and electricity pricing mechanisms continue to improve, the production cost of ALK is expected to decline and eventually become competitive with that of gray hydrogen. Proton exchange membrane (PEM) electrolysis employs a proton-conducting membrane as the solid electrolyte, where hydrogen is generated through the combined action of a direct-current power supply and electrocatalysts. Compared with ALK, PEM electrolysis operates at significantly higher current densities, typically exceeding 10,000 A/m2, while requiring only 3.7–4.5 kWh/Nm3 of electricity for hydrogen production. Consequently, its energy conversion efficiency can exceed 75%, making PEM a highly efficient hydrogen production technology [13]. Solid oxide electrolysis (SOEC) produces hydrogen by electrolyzing steam at elevated temperatures using solid oxide electrolytes. Common electrolyte materials include zirconia-based electrolytes, such as yttria-stabilized zirconia (YSZ), ceria-based electrolytes, such as gadolinium-doped ceria (GDC), and other doped oxide materials that provide excellent oxygen-ion conductivity and high-temperature stability, thereby enabling efficient electrolysis [14]. SOEC typically operates at temperatures above 600 °C, where part of the required electrolysis energy is supplied as thermal energy rather than electricity, substantially reducing electrical energy consumption while enabling energy conversion efficiencies approaching 100% [15]. The electricity consumption for SOEC hydrogen production can be as low as 3 kWh/Nm3 or even lower under favorable operating conditions. Despite these advantages, operation within the temperature range of 600–1000 °C places stringent requirements on electrode materials. Their long-term stability, durability, and resistance to degradation remain major challenges, limiting the large-scale commercialization and continuous operation of SOEC systems [16].
In summary, for each scheme of hydrogen production via electrolysis, electricity consumption or energy consumption is the critical factor limiting cost reduction and efficiency improvements. Consequently, hydrogen production powered by renewable energy has gradually become a current research frontier, especially for solar-based photovoltaic and concentrating solar power (CSP) stations. Solar energy is a highly promising renewable energy with great potential to advance sustainable development. Statistics indicate that the annual solar energy received by the Earth reaches approximately 3.9 × 1024 MJ, which is nearly 10,000 times the current global energy consumption and has been widely utilized in the thermal and power generation fields [17]. CSP uses thermal storage media for long-duration energy storage, has developed rapidly in recent years, and exhibits lower sensitivity to environmental variability and fluctuations. Typically employing molten salt for thermal storage, CSP consists of a solar power tower, molten salt tanks, a steam generator, turbine, and auxiliary heat exchange systems [18]. Solar-heated molten salt produces high-pressure steam in the steam generator, which drives the turbine-generator set. Similar to conventional thermal power plants, the operational principle of CSP is also based on the Rankine cycle [19]. The operational characteristics of CSP make it highly suitable for integration with hydrogen production through SOEC, as these plants can simultaneously supply high-temperature steam and electricity [20]. Recent studies have focused on integrating solar thermal power with SOEC hydrogen production. Yang [21] collected thermal energy through CSP and utilized it for high-temperature electrolytic hydrogen production. The effect of CSP with an integrated energy system on the total operational performance was evaluated from the aspects of the system economy, renewable energy utilization, and carbon emission. Zhou [22] proposed a model for capacity optimization configuration of a renewable energy hydrogen production system, which integrates wind power, photovoltaic power, and concentrating solar power with an alkaline electrolyzer. The capacity configuration of the renewable energy electrolysis of water hydrogen production system generator set under various scenarios was determined. Sanz-Bermejo [23] presented a technical approach for extracting steam from the low-pressure turbine section for hydrogen production through SOEC. The overall performance of the system on the hybrid plant is analyzed. The existing literature on CSP-SOEC integrated systems has mainly focused on multi-energy complementary configurations. It has also examined their impacts on system economics and CSP generation performance. In addition, pure water, rather than high-temperature steam, is typically used as the raw material for hydrogen production in SOEC. Limited attention has been given to hydrogen production behavior under different operating conditions of CSP-SOEC coupling systems. The comparative literature review on CSP-SOEC systems is listed in Table 1.
Table 1.
Comparative literature review on CSP-SOEC systems.
The reviewed studies mainly focus on the overall integration of CSP and SOEC, hydrogen production performance, energy efficiency, or economic assessment, while the influence of the steam extraction location within the CSP cycle on the thermodynamic coupling between the CSP system and SOEC has received limited attention. In particular, a systematic comparison between main-steam extraction and reheat-steam extraction under the same CSP-SOEC framework is lacking. To address this gap, this study investigates the hydrogen production performance of a CSP-SOEC integrated system under different schemes and operating conditions using numerical simulation. The key contributions of this work are as follows: (1) evaluating hydrogen production characteristics and operational flexibility of the CSP system under different CSP-SOEC coupling schemes; (2) analyzing solar-to-hydrogen energy conversion efficiency under varying operating conditions; (3) evaluating the economic performance of the integrated system under peak shaving.
In this paper, the thermodynamic models of both the CSP generation system and the SOEC hydrogen production system are established. Based on the steam parameter characteristics of the CSP cycle, two steam extraction strategies are proposed: main steam hydrogen production (Scheme 1) and reheated steam hydrogen production (Scheme 2). In both configurations, the SOEC system is powered exclusively by the electricity generated from the CSP unit. The effects of steam extraction flow rate and SOEC operating temperature on the integrated system are systematically investigated. Hydrogen production capacity, system energy consumption, and power variation are selected as the primary performance indicators to comprehensively evaluate the feasibility and operational characteristics of the proposed CSP-SOEC integration. Finally, different solar-driven hydrogen production pathways are comparatively analyzed to provide theoretical guidance for selecting suitable solar hydrogen production technologies.
2. Thermodynamic Modeling
2.1. Subsection
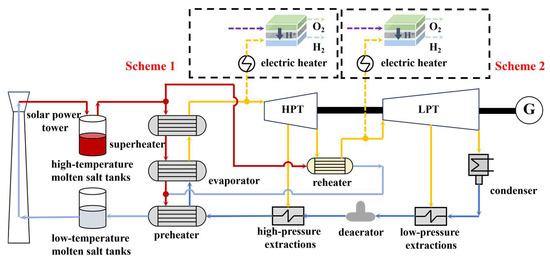
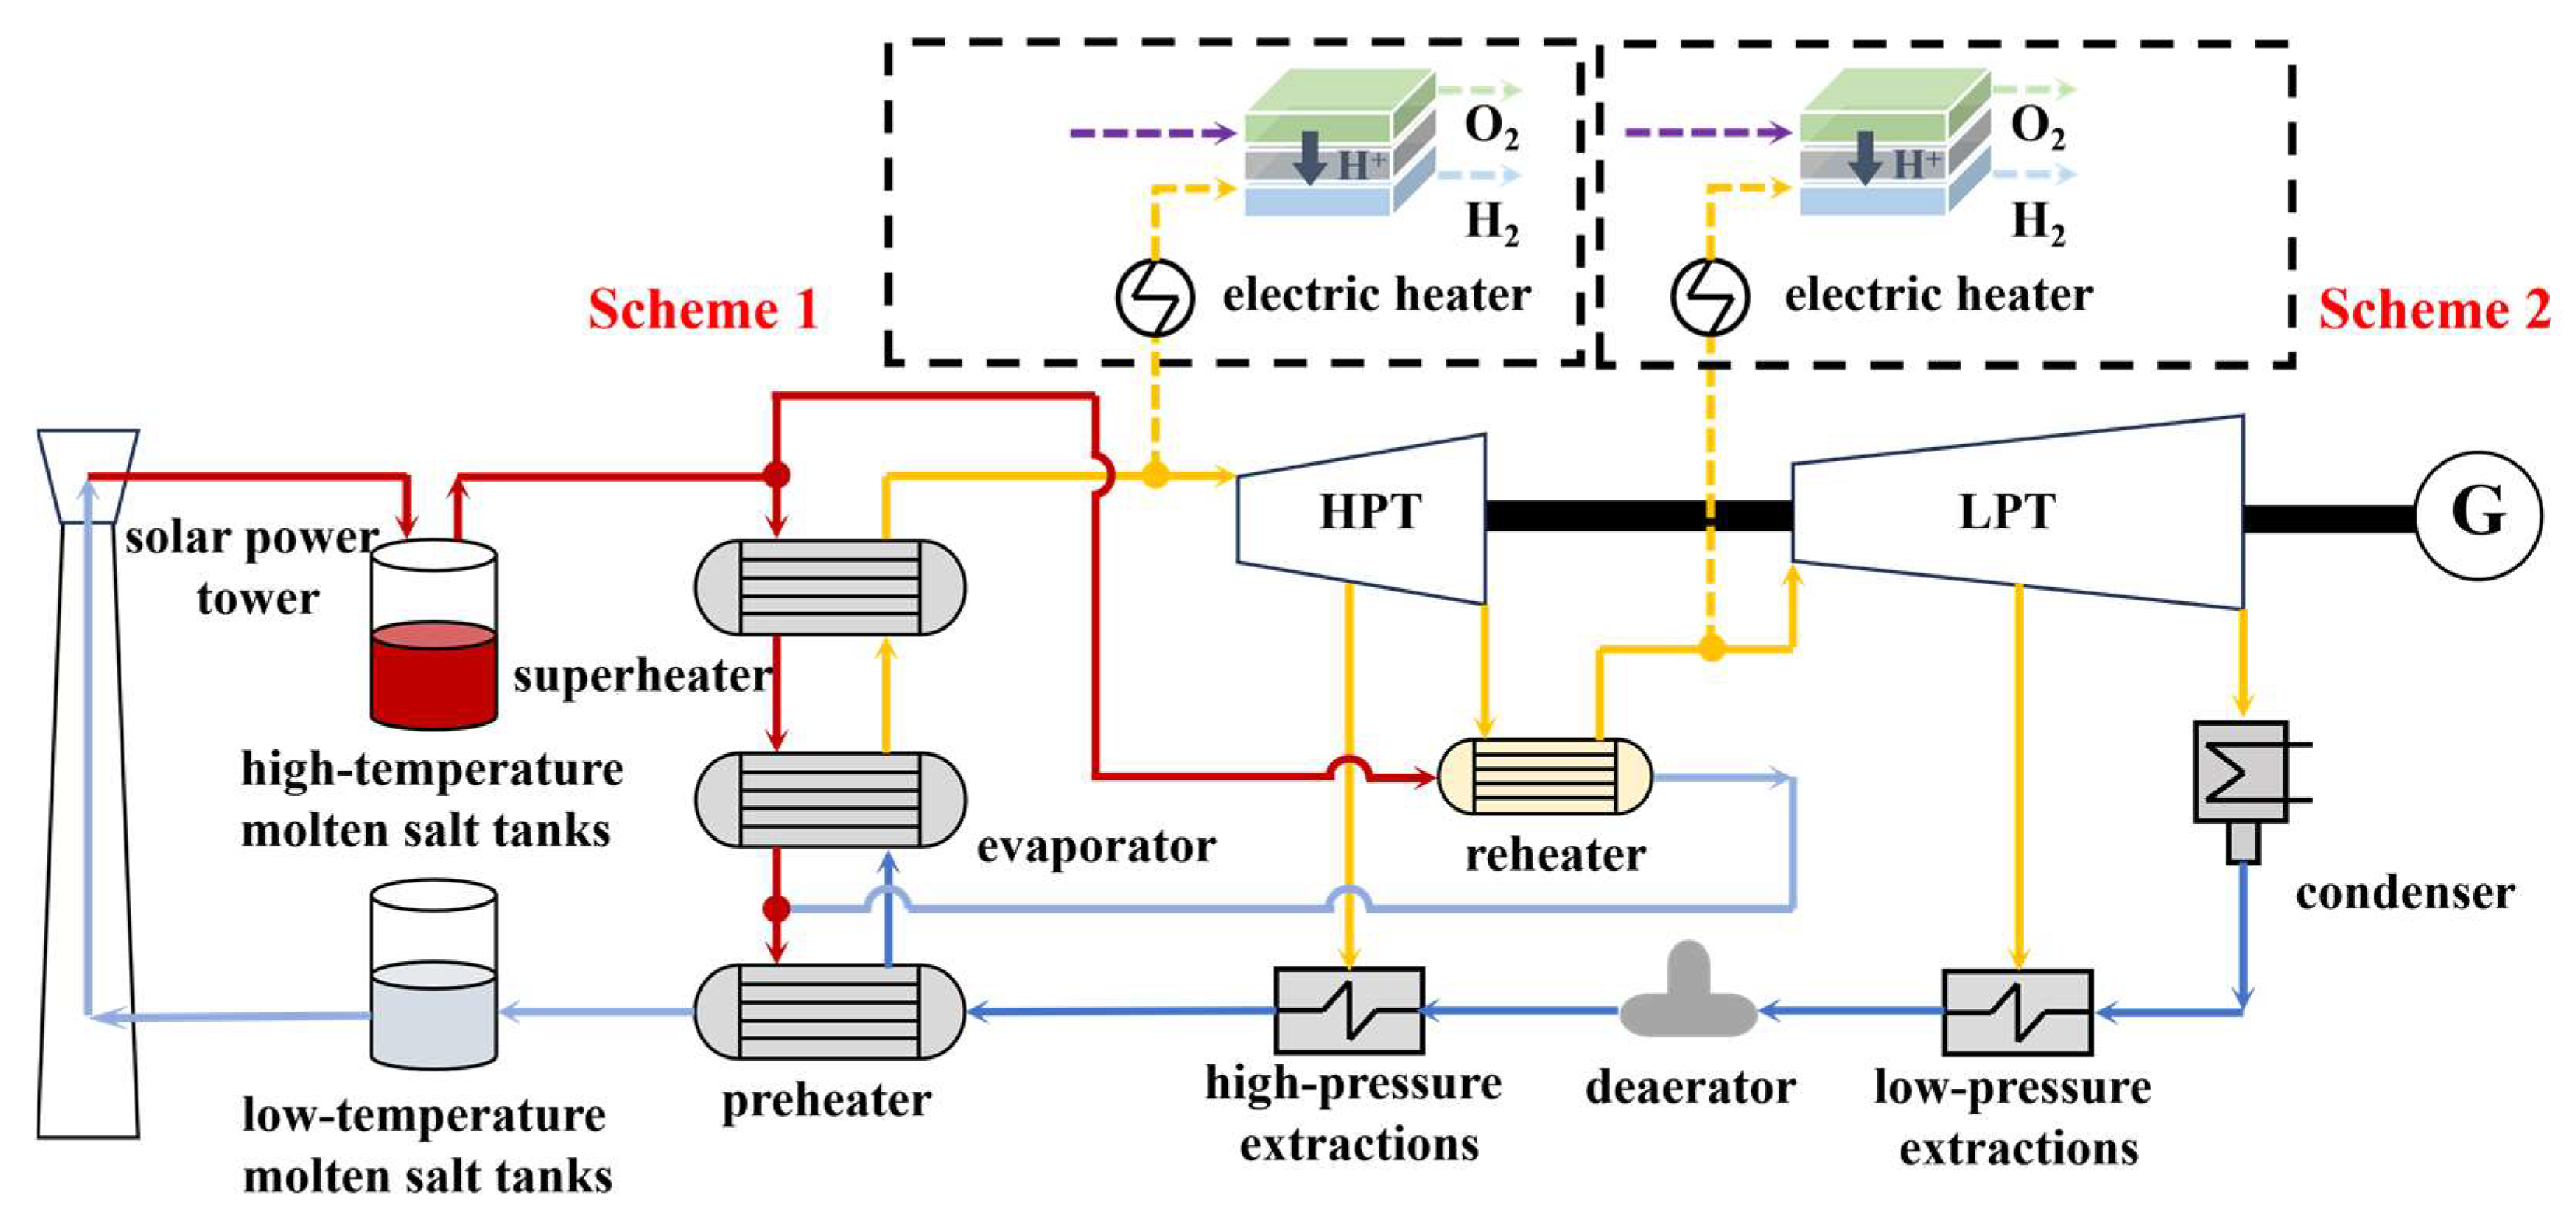
In this study, thermodynamic models of the CSP unit and SOEC are developed using EBSILON 15.0 and MATLAB 2025b, respectively. The CSP unit in this paper is configured based on the operational parameters of a 50 MW molten-salt tower referenced in [27], with turbine inlet temperature and pressure of 540 °C and 14 MPa, respectively. The regenerative system consists of two high-pressure extractions and five low-pressure extractions. Molten salt flows sequentially through the superheater, evaporator, and preheater for heat exchange, while part of the high-temperature molten salt is sent to the reheater to reheat the exhaust steam from the high-pressure cylinder before being sent back to the preheater. This paper proposes two hydrogen production schemes, using either the main steam or the reheat steam at the inlet of the low-pressure turbine as the steam source for hydrogen production. A schematic of the integrated system is shown in Figure 1.
Figure 1.
Schematic diagram of a high-temperature electrolysis hydrogen production system based on solar thermal power generation.
2.2. Model Development
To simplify the model, the following assumptions are proposed:
- (1)
- The integrated system of the CSP unit and SOEC hydrogen production operates under steady-state conditions;
- (2)
- Temperature gradients between internal cells of the SOEC are neglected;
- (3)
- The inlet and outlet fluids of the SOEC are at the same temperature;
- (4)
- Pressure drops and heat losses within the CSP unit are ignored;
- (5)
- The extracted steam from the CSP cycle is regarded as the steam feed available to the SOEC.
In the SOEC electrochemical model, the voltage and heat required for the operation of the electrolyzer are directly influenced by the current density J and operating temperature T [28].
The SOEC operating voltage (VSOEC) comprises ohmic overpotential (φohmic), Nernst potential (φNernst), concentration overpotential (φcon), and activation overpotential (φact), with the calculation formula given as follows:
The calculation formula for φohmic is given below [28]:
where de and J denote the thickness and current density of the electrolyzer unit, respectively.
φNernst can be calculated as follows [28]:
where R and F denote the gas constant and Faraday’s constant, respectively. p0 is the operating pressure of the SOEC; are the partial pressures of the inlet and outlet fluids of the SOEC electrolyzer, and φ0 represents the standard voltage.
The cathodic concentration overpotential φcon,c can be calculated as follows [28]:
where dc denotes the cathode thickness; Deff is the effective diffusivity; ϕ and γ are the porosity and tortuosity of the SOEC electrolyzer structure, respectively; T* denotes the dimensionless temperature; MH2 and MH2O are the molecular masses of hydrogen and water, respectively; ΩD represents the dimensionless diffusion collision integral; LH2O and LH2 denote the characteristic lengths of water and hydrogen, with corresponding values of 2.641 × 10⁻¹⁰ m and 2.827 × 10⁻¹⁰ m, respectively. UH2O/k and UH2/k represent the Lennard-Jones potentials of water and hydrogen, with corresponding values of 809.1 K and 59.7 KA, respectively.
The anode concentration overpotential φcon,a can be calculated as follows [28]:
where μ is the dynamic viscosity coefficient of oxygen, da denotes the anode thickness, and Bg represents the effective permeability.
Based on the Butler–Volmer equation, the activation overpotential φact is calculated via the following equation [28]:
where ki and Eact denote the pre-exponential factor and activation energy of SOEC, respectively.
The molar flow rates of water, hydrogen, and oxygen for SOEC are calculated respectively as follows [28]:
where Acell and Ncell are the effective area and number of electrolyzer units, respectively.
Therefore, the relationship between current density J and steam flow rate is as follows:
The operating voltage of the SOEC electrolyzer can be derived from the above equations [28].
The CSP model employed in this study was developed in the EBSILON Professional environment using a modular component-based approach. The component selection for the CSP model in EBSILON software is listed in Table 2.
Table 2.
Component Selection for the CSP Model in EBSILON Software.
To fully characterize the quality degradation of energy and the irreversibilities associated with different thermodynamic processes, an exergy analysis is further conducted to quantify the thermodynamic performance of the key components and identify the major sources of exergy losses within the system. The exergy efficiency is defined as the ratio of the useful exergy output of each component to the corresponding exergy input. The general definition is expressed as:
where hi is the specific enthalpy, and si is the specific entropy of different equipment. h0 and s0 represent their values under the reference standard environment, respectively.
In this study, the exergy efficiency of each component is defined as the ratio of the useful energy (exergy) output at the component outlet to the exergy input at the component inlet. The exergy efficiency for SOEC and extraction is as follows:
For SOEC, the fuel exergy for H2 can be expressed as follows:
For HPT and LPT, the exergy efficiency is defined as follows:
2.3. Model Validation
Due to the lack of available experimental or field data for an integrated CSP-SOEC system, the fully coupled system could not be directly validated. As a result, the CSP and SOEC submodels were independently validated against reference data. The thermodynamic model of the CSP unit developed in this study is validated using actual operational data from Ref. [27]. The SOEC model developed in this study is validated using experimental and simulation data reported in the reference [28,29]. The results show good agreement with the reference results, with the maximum relative errors of 1.57% for Table 3 and 2.88% for Table 4, respectively. For SOEC, the relatively larger deviation at high current densities can be attributed to the increasing mass-transfer limitations and concentration polarization, which introduce stronger nonlinearities that are not fully captured by the present model. These relatively small deviations demonstrate the reliability and accuracy of the developed CSP and SOEC models.
Table 3.
Solar thermal power generation unit model validation.
Table 4.
SOEC model validation.
3. Results Analysis
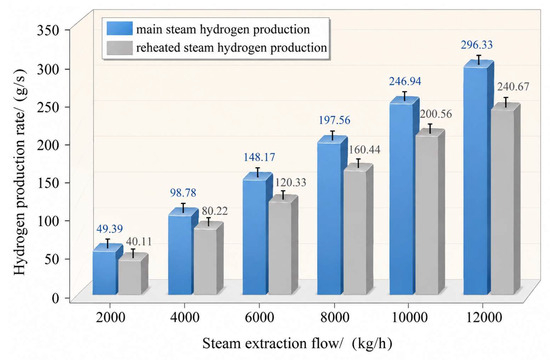
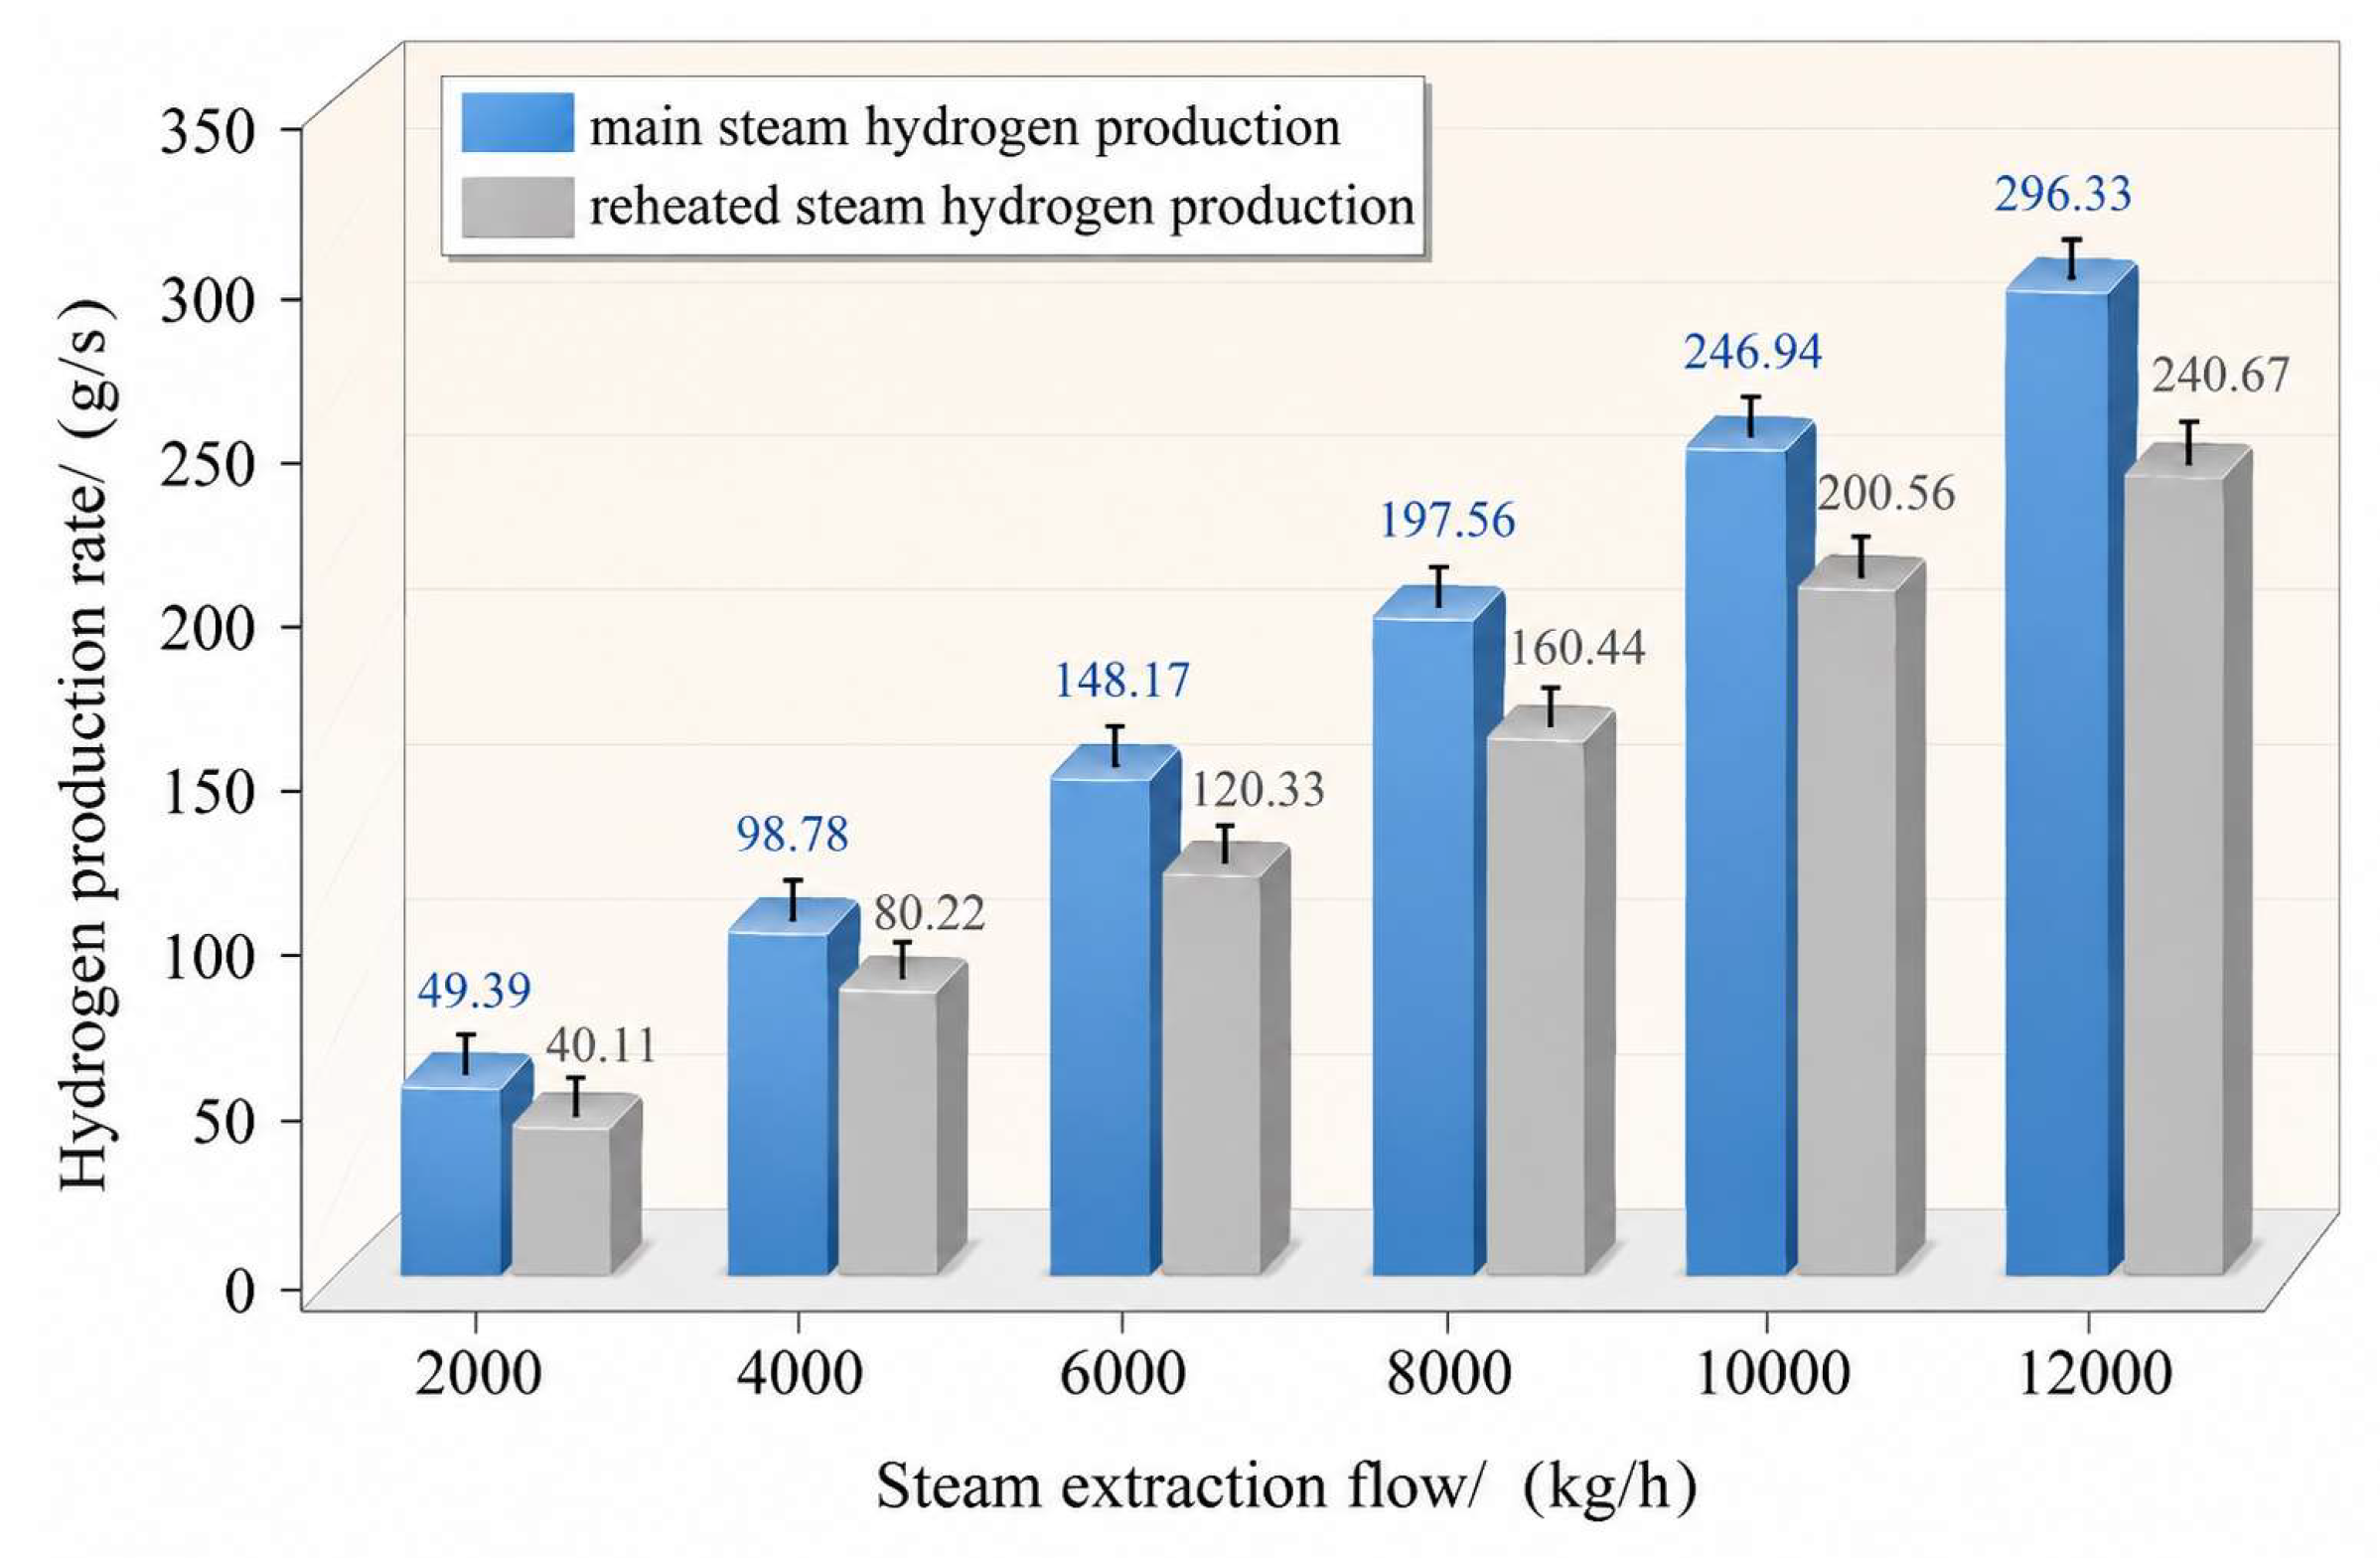
Figure 2 shows the variation trend of hydrogen production flow with the extracted steam flow for both main steam hydrogen production and reheat steam hydrogen production schemes. The operating temperature of the SOEC is maintained at 600 °C, and the thermoneutral voltage is selected to be 1.28 V to ensure the highest operating efficiency of the SOEC. As shown in Figure 2, when the main steam is used for hydrogen production, the hydrogen production flow rate at the SOEC outlet increases approximately linearly from 49.39 g/s to 296.33 g/s as the extracted steam flow rate rises from 2000 kg/h to 12,000 kg/h. Under the same operating conditions, when reheat steam is used for hydrogen production, the SOEC hydrogen output increases approximately linearly from 40.11 g/s to 240.67 g/s. Under the present thermodynamic model, the steam extraction rate directly determines the reactant supply to the SOEC. The electrolysis current density is maintained, and sufficient electrical power is available throughout the operating range. Therefore, hydrogen production is primarily limited by the inlet steam flow rate. As a result, the hydrogen production rate is expected to increase approximately linearly with the steam extraction rate. This trend is a direct consequence of the mass and energy conservation relationships incorporated into the proposed thermodynamic model. Although both schemes exhibit a similar proportional increase in hydrogen production, extracting steam from different locations in the CSP leads to different reductions in power output and changes in the energy conversion efficiency.
Figure 2.
Variation of hydrogen production from SOEC with steam extraction flow rate.
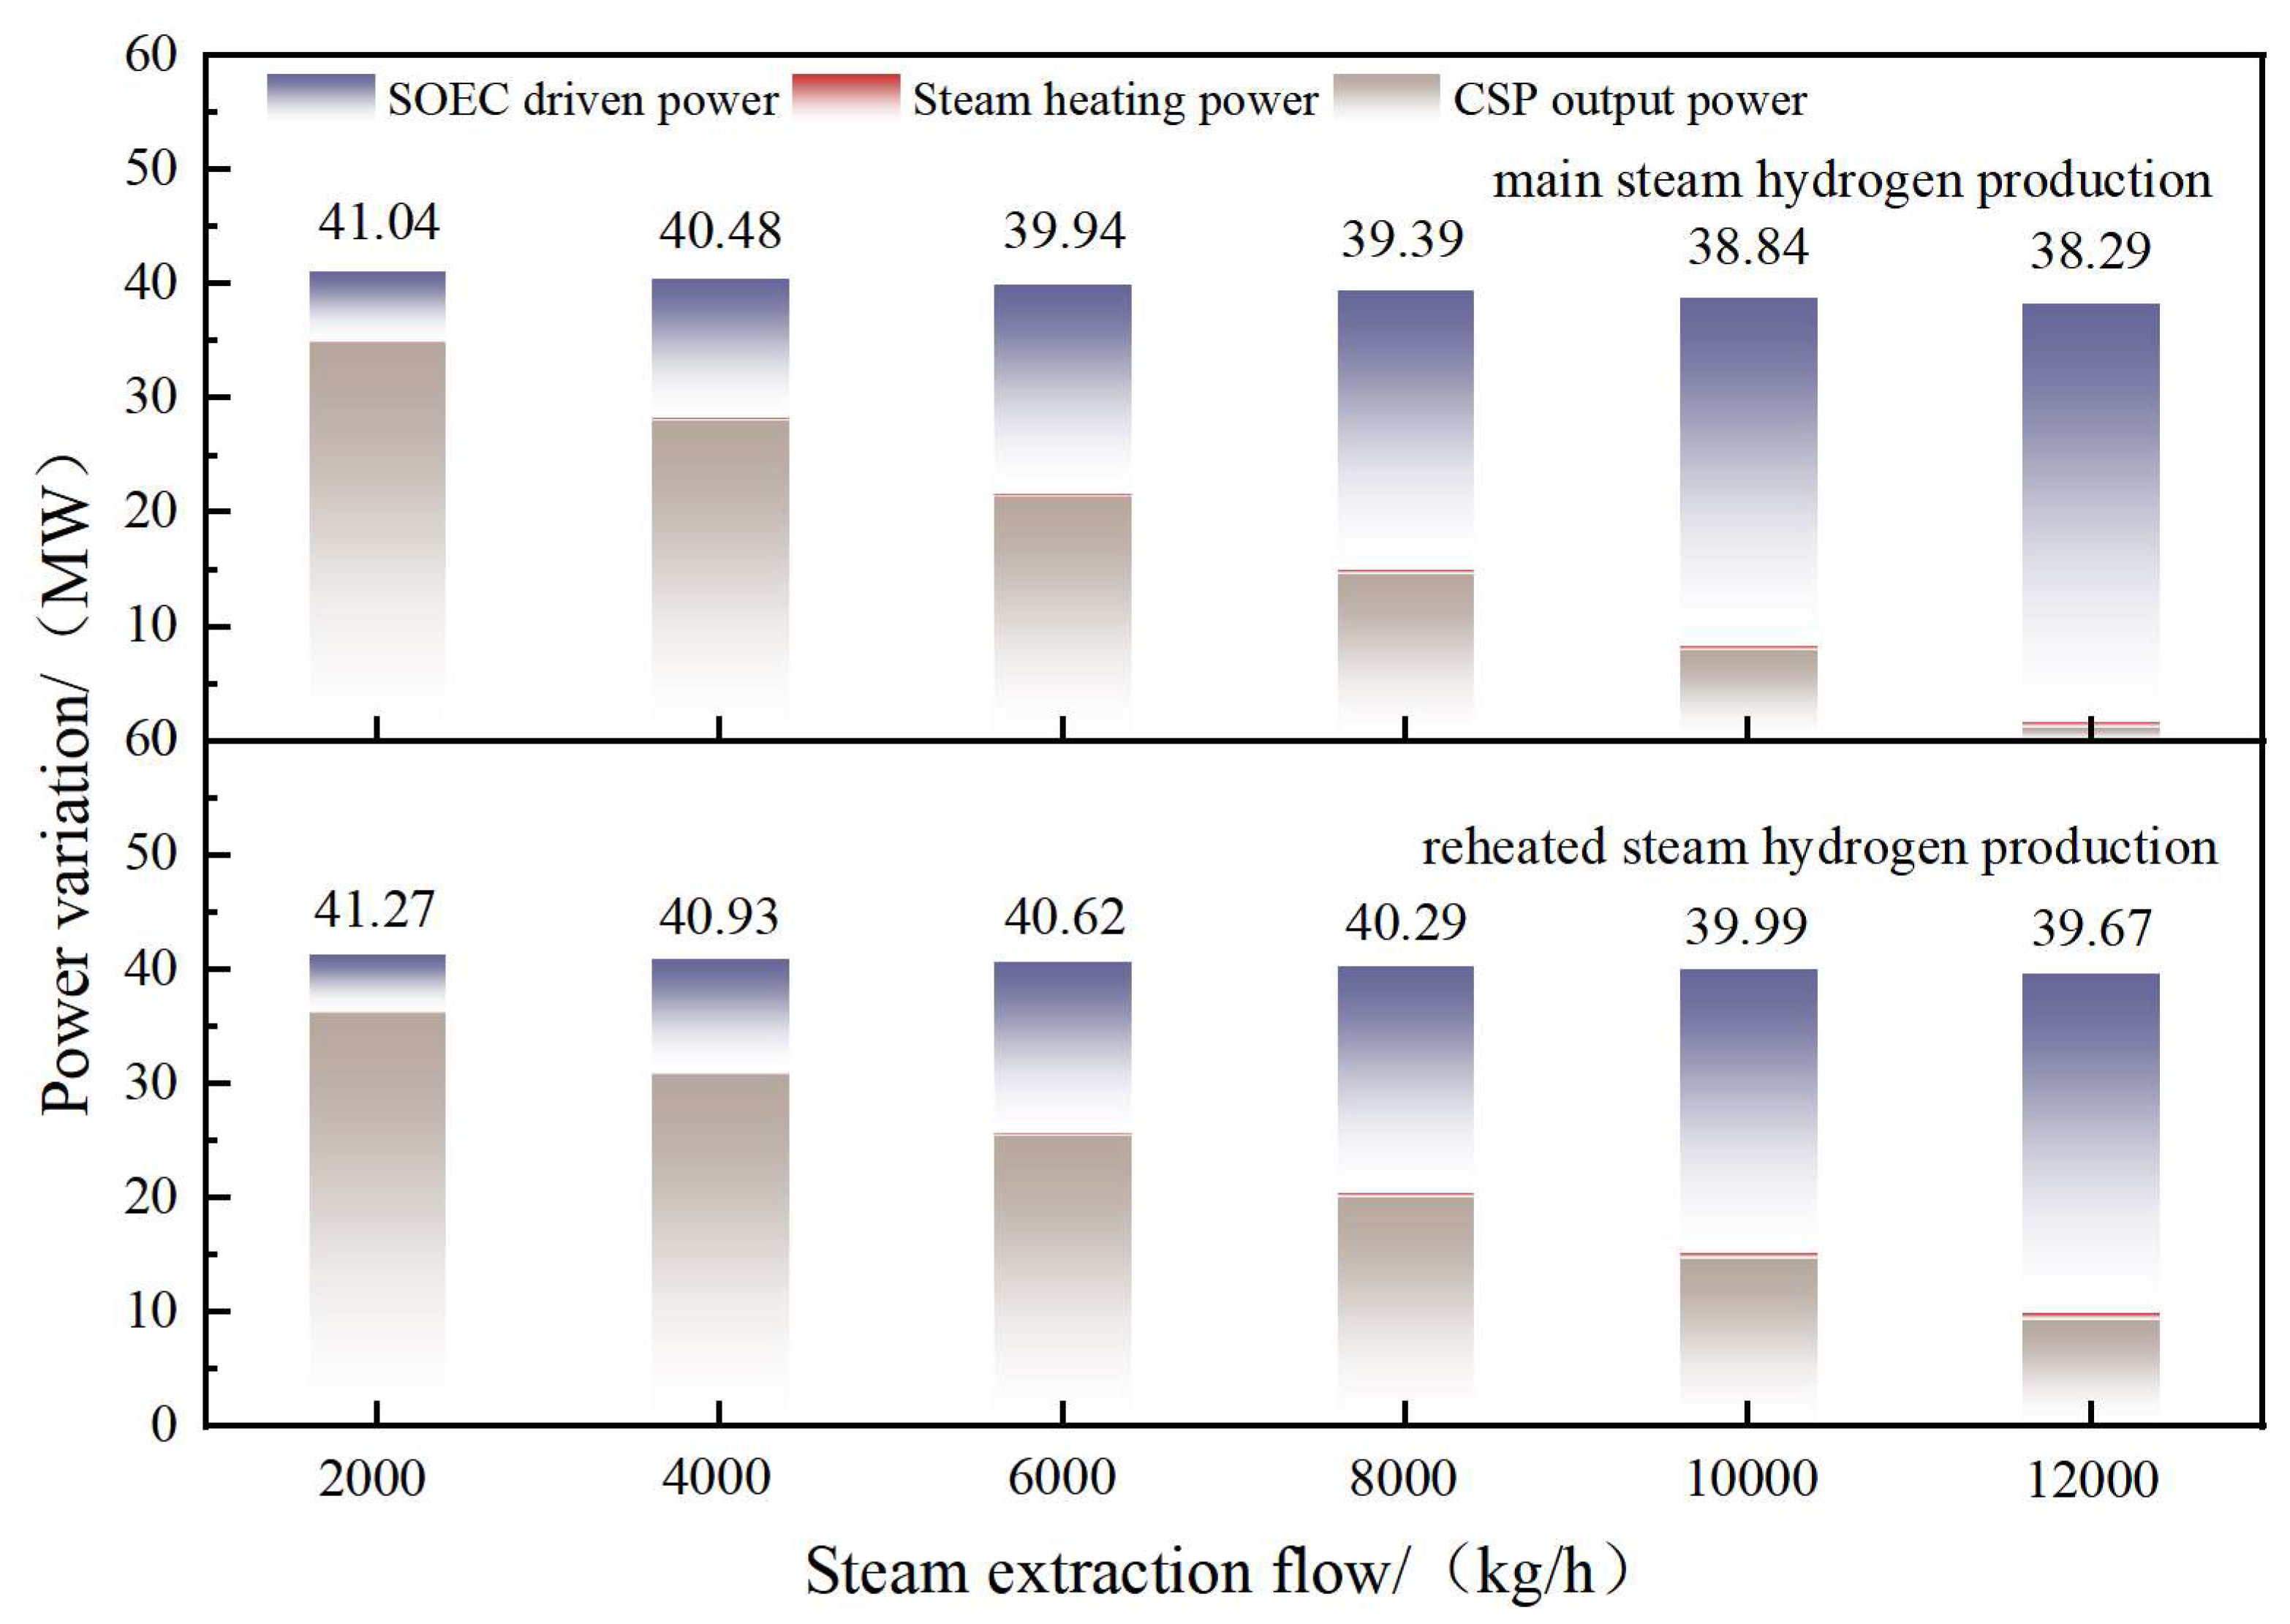
Figure 3 illustrates the variation trends of SOEC driving power, steam heating power, and CSP unit output power with extracted steam flow rate under different schemes. Since both SOEC operation and inlet steam heating are powered by the CSP itself, the output power shows an opposite trend to the aforementioned consumption powers. As shown in Figure 3, with the extracted steam flow rate increasing from 2000 kg/h to 12,000 kg/h, the output power of the CSP unit after steam extraction decreases from 41.04 MW to 38.29 MW due to the reduction in working steam flow. When the main steam is used for hydrogen production, the SOEC driving power increases from 6.10 MW to 36.59 MW, which is related to the amount of steam entering the SOEC. Meanwhile, due to the increase in SOEC inlet steam flow, the steam heating power grows approximately linearly from 0.10 MW to 0.55 MW. Under the combined consumption of heating power and SOEC driving power, the actual output power of the CSP unit after hydrogen production decreases from 34.84 MW to 1.15 MW. It should be noted that when the hydrogen production extraction flow rate exceeds 12,015 kg/h, the solar thermal plant’s own power generation can no longer supply the hydrogen production consumption powers such as steam heating and SOEC driving. External power supply is needed. Compared to main steam, the reheat steam used for hydrogen production utilizes part of the heat supplied by the molten salt bypass and operates at a lower pressure. Hydrogen production through reheat steam can maximize the work capacity of the steam at high temperature and high pressure, thereby maintaining the output power for CSP units. As shown in Figure 3, for hydrogen production using reheat steam, as the steam extraction flow rate increases from 2000 kg/h to 12,000 kg/h, the SOEC drive power increases from 4.96 MW to 29.74 MW, while the steam heating power increases from 0.1 MW to 0.53 MW. Compared to main steam, reheat steam exhibits reduced SOEC drive power during hydrogen production due to a decrease in hydrogen output. This is because at higher operating pressures, the SOEC exhibits higher electrolytic efficiency. As the extracted steam flow increases, the actual output power of the CSP unit decreases from 36.21 MW to 9.37 MW. When the extracted steam flow reaches 14,250 kg/h, the power generated by the CSP unit fails to support the steam heating and drive power requirements of the SOEC hydrogen production process.
Figure 3.
Variation in power in the integrated solar thermal power and SOEC system with steam extraction flow rate.
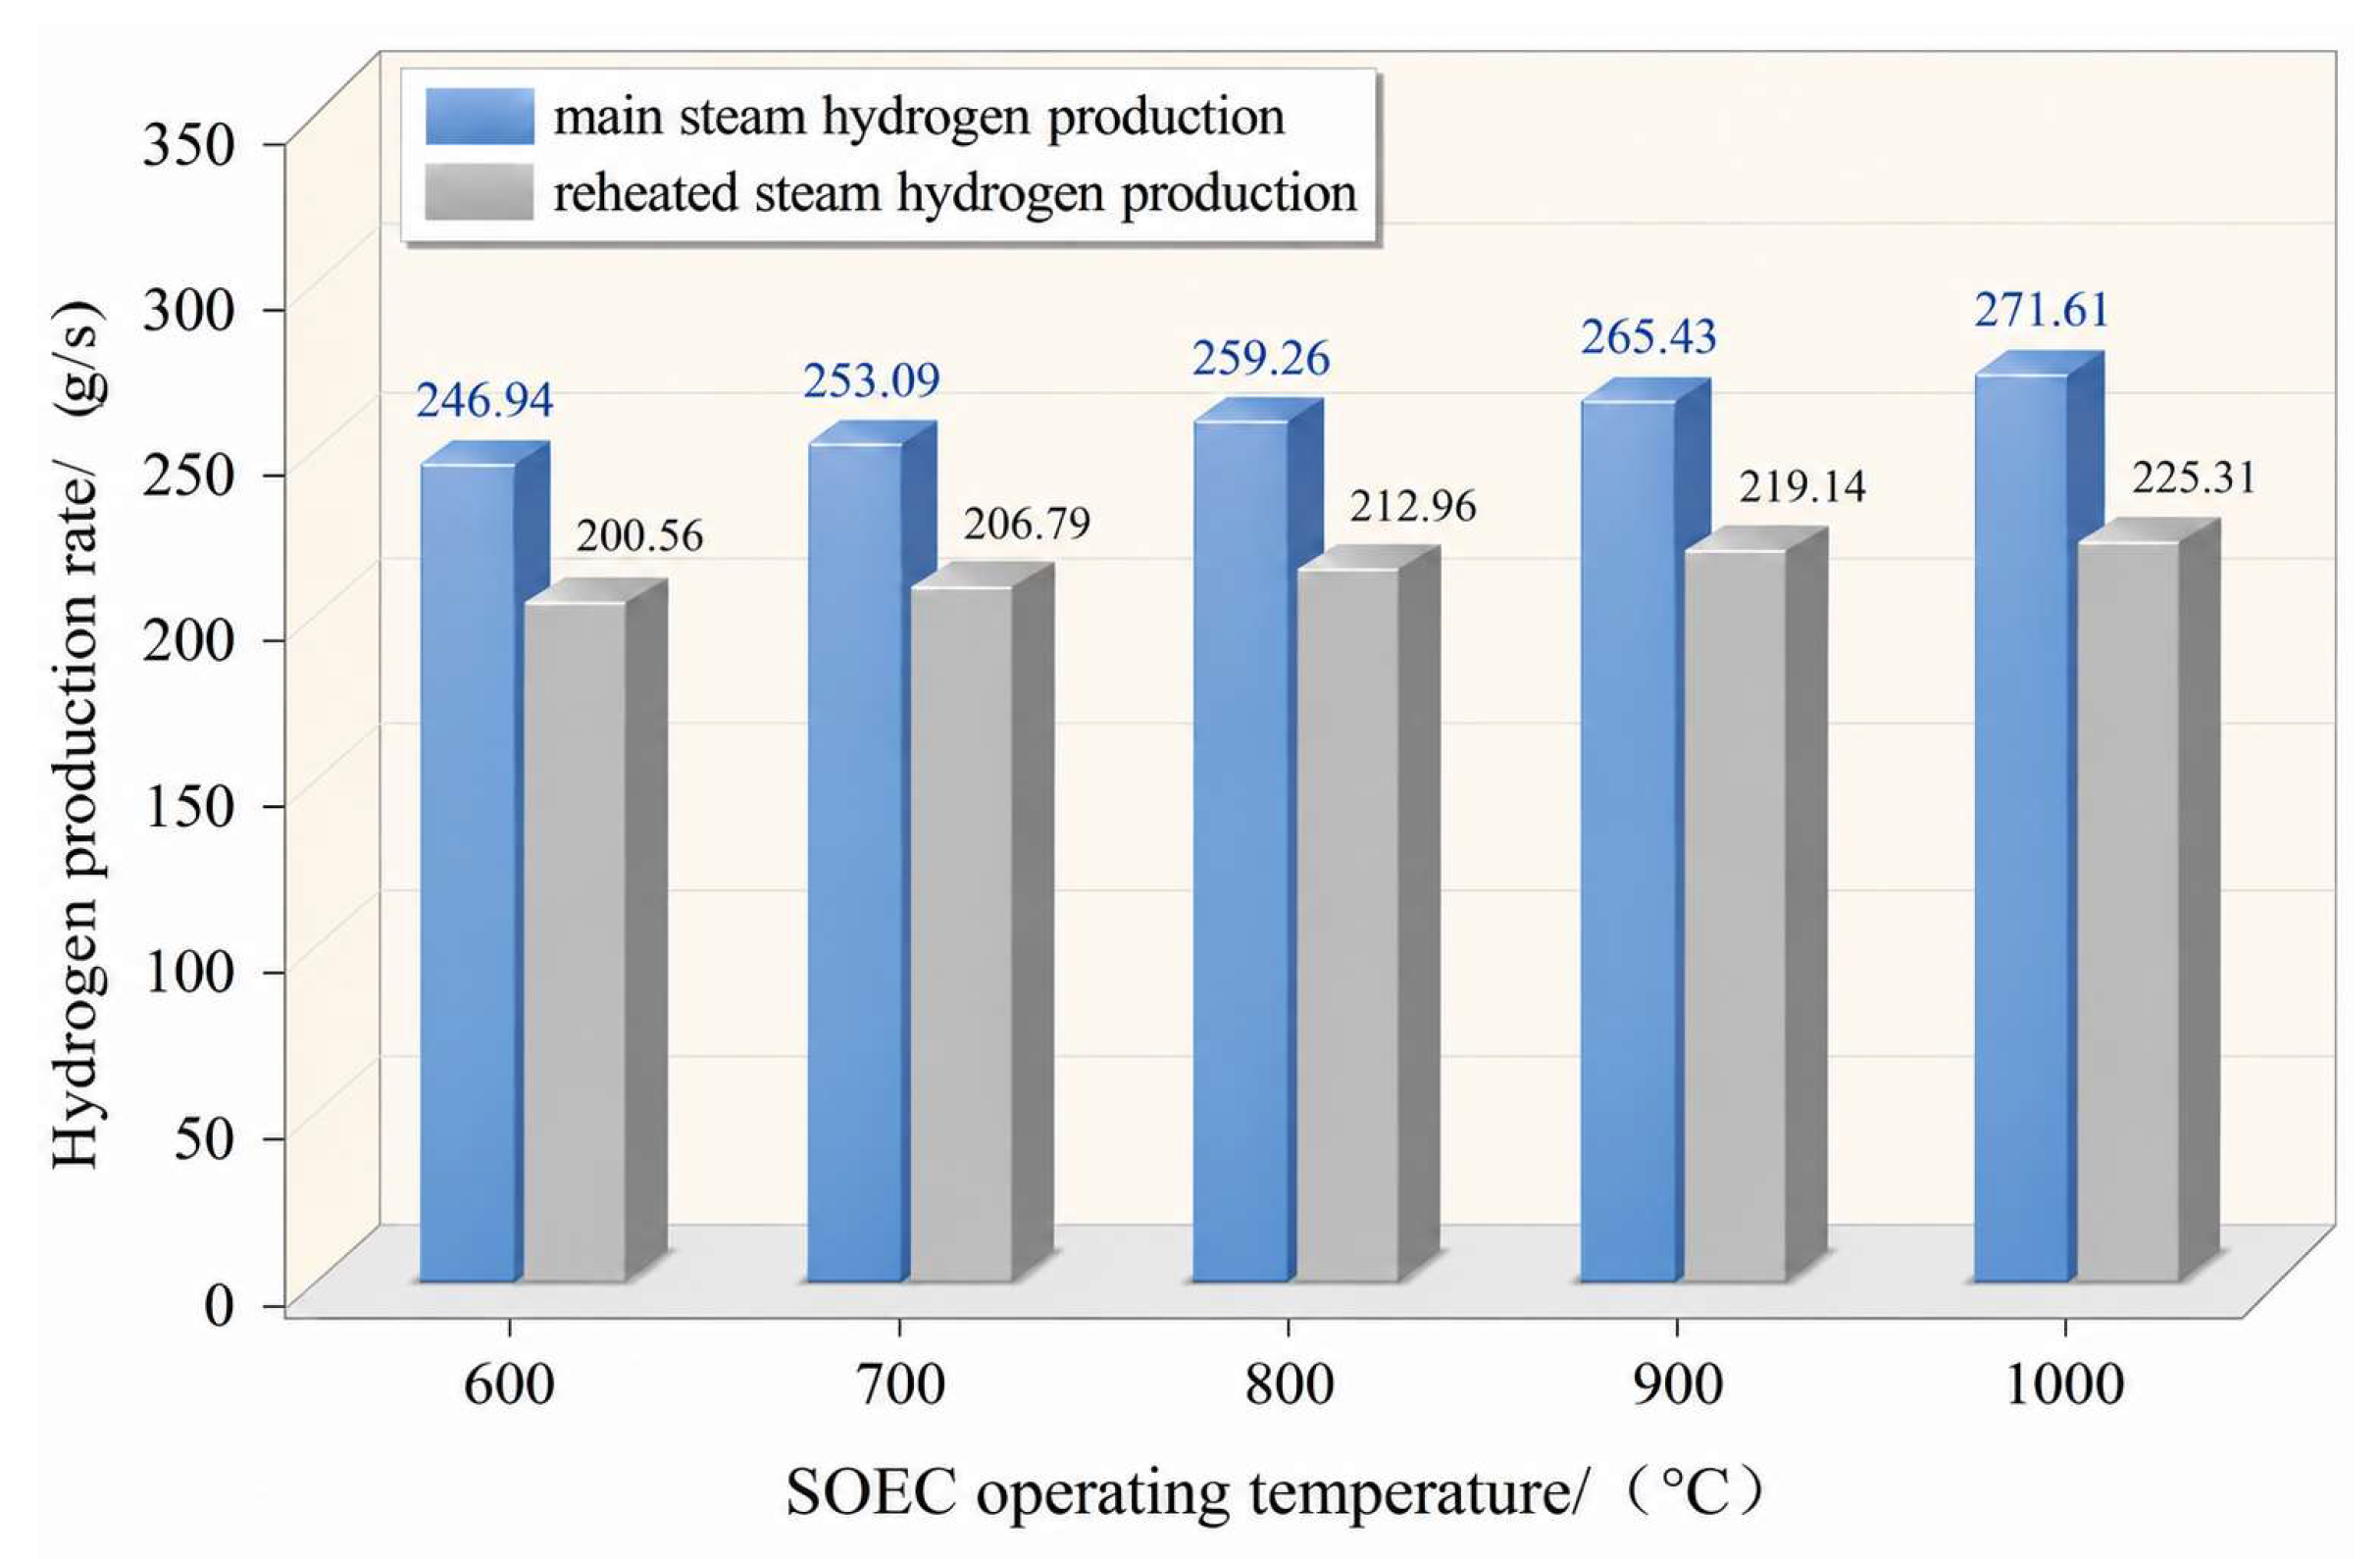
Figure 4 illustrates the variation trends of SOEC driving power, steam heating power, and CSP unit output power with SOEC operating temperature under two schemes. In this section, the SOEC driving voltage is selected as the thermoneutral voltage corresponding to its operating temperature, at which the heat released by the SOEC equals the heat absorbed. The current density during SOEC operation is chosen as the value corresponding to this thermoneutral voltage. According to reference [28], when SOEC operating temperatures are selected at 600 °C, 700 °C, 800 °C, 900 °C, and 1000 °C, the thermoneutral voltages are 1.29 V, 1.24 V, 1.22 V, 1.24 V, and 1.25 V, respectively. With a unified steam flow rate of 10,000 kg/h, the power generation of the solar thermal power plant decreases from an initial 50 MW to 38.84 MW and 39.97 MW under the main steam and reheat steam hydrogen production schemes, respectively. Higher power generation in the reheat steam hydrogen production scheme is attributed to the fact that the steam used for hydrogen production undergoes expansion work in the high-pressure turbine. As shown in Figure 4, as the SOEC operating temperature increases from 600 °C to 1000 °C, the hydrogen production under the main steam hydrogen production scheme increases from 246.94 g/s to 271.61 g/s. Under the reheat steam hydrogen production scheme, it increases from 200.56 g/s to 225.31 g/s. According to Equation (18), the hydrogen output at the SOEC outlet is related to the current density J, the effective area of an electrolysis cell Acell, the number of effective cell units Ncell, and the Faraday constant F. With other parameters unchanged, the SOEC outlet hydrogen output is influenced by the current density, thus showing an increasing trend.
Figure 4.
Variation of hydrogen production from SOEC with SOEC operating temperature.
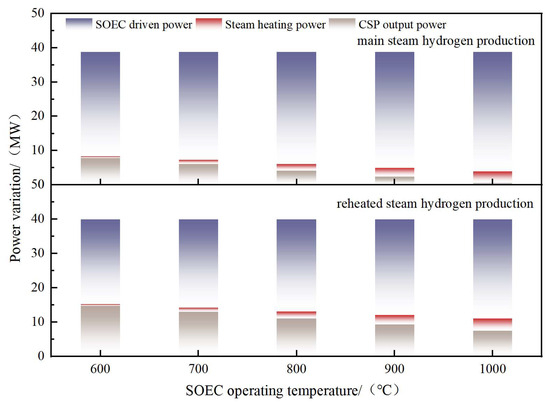
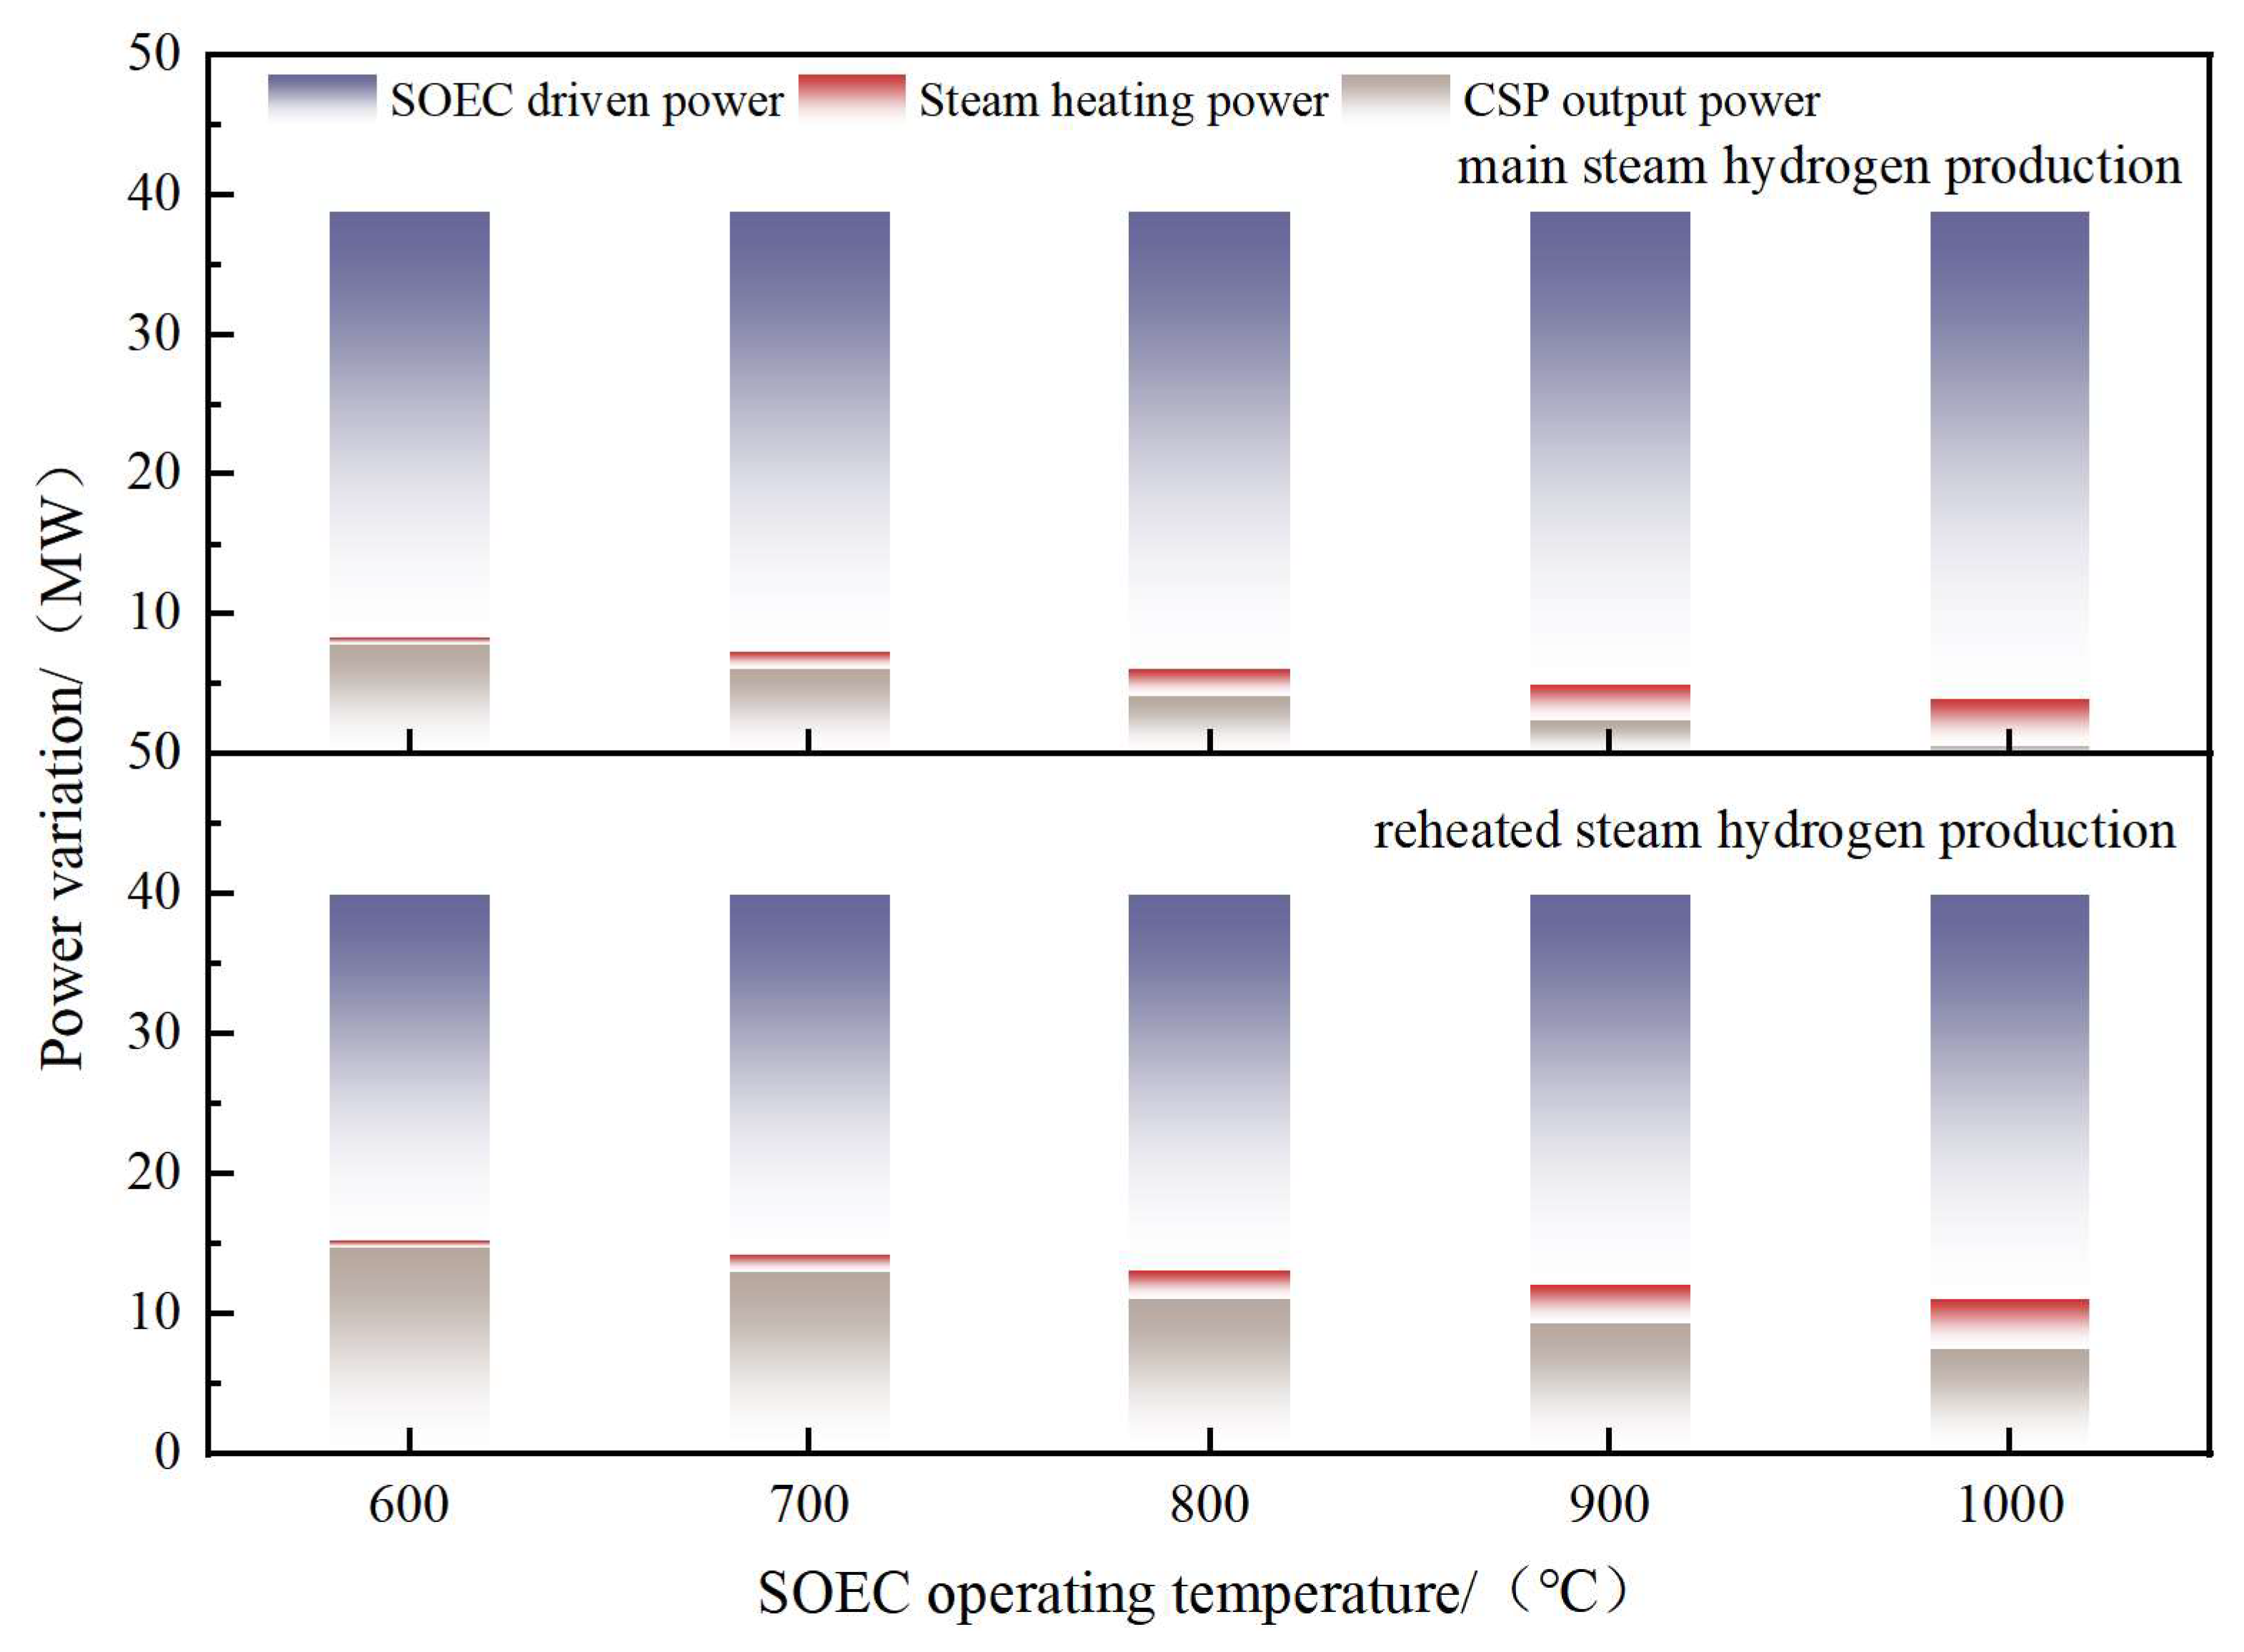
As shown in Figure 5, under the main steam hydrogen production scheme, as the SOEC operating temperature increases from 600 °C to 1000 °C, the steam heating power rises from 0.44 MW to 3.34 MW. Meanwhile, the SOEC driving power increases from 30.49 MW to 34.85 MW. Affected by these factors, the output power of the CSP unit drops from 7.89 MW to 0.65 MW, barely achieving self-sufficient hydrogen production. Under the reheat steam hydrogen production scheme, as the SOEC operating temperature increases from 600 °C to 1000 °C, the steam heating power rises from 0.46 MW to 3.54 MW, while the SOEC driving power increases from 24.78 MW to 28.91 MW. Consequently, the output power of the CSP unit decreases from 14.74 MW to 7.52 MW. It can be observed that the overall impact of the SOEC operating temperature on the output power of the CSP unit is relatively minor compared to that of the steam flow rate. According to reference [28], as the SOEC temperature increases, the electricity consumption per unit of hydrogen production shows a decreasing trend. This is because higher temperatures are beneficial to water electrolysis, reducing electrical energy losses. However, when the SOEC is integrated with other energy supply systems, such as the coupling of the SOEC with thermal power units as described in reference [30], since the CSP unit simultaneously provides both steam and electricity, the overall energy utilization efficiency of the integrated system does not vary monotonically with the SOEC operating temperature. Instead, it exhibits a peak efficiency point. This paper does not involve a comprehensive analysis of energy storage and release in the integrated system, so the overall round-trip efficiency is not considered. However, when hydrogen energy is used as a means for peak shaving or energy storage for the solar thermal power plant, the specific hydrogen production temperature needs to be further discussed.
Figure 5.
Variation in power in the integrated solar thermal power and SOEC system with SOEC operating temperature.
To improve the transparency and reproducibility of the analysis, Table 5 presents the energy balance of the integrated CSP-SOEC system and the SOEC subsystem under representative operating conditions. The SOEC operating temperature is set to 600 °C, while the steam extraction flow rate is fixed at 2000 kg/h. Table 5 summarizes the main energy inputs and outputs of both the integrated system and the SOEC subsystem.
Table 5.
Energy balance of the integrated CSP-SOEC system and the SOEC subsystem.
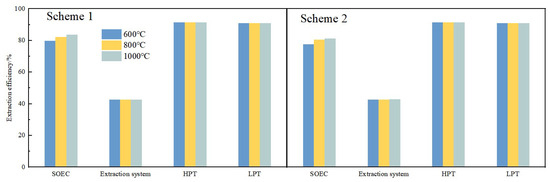
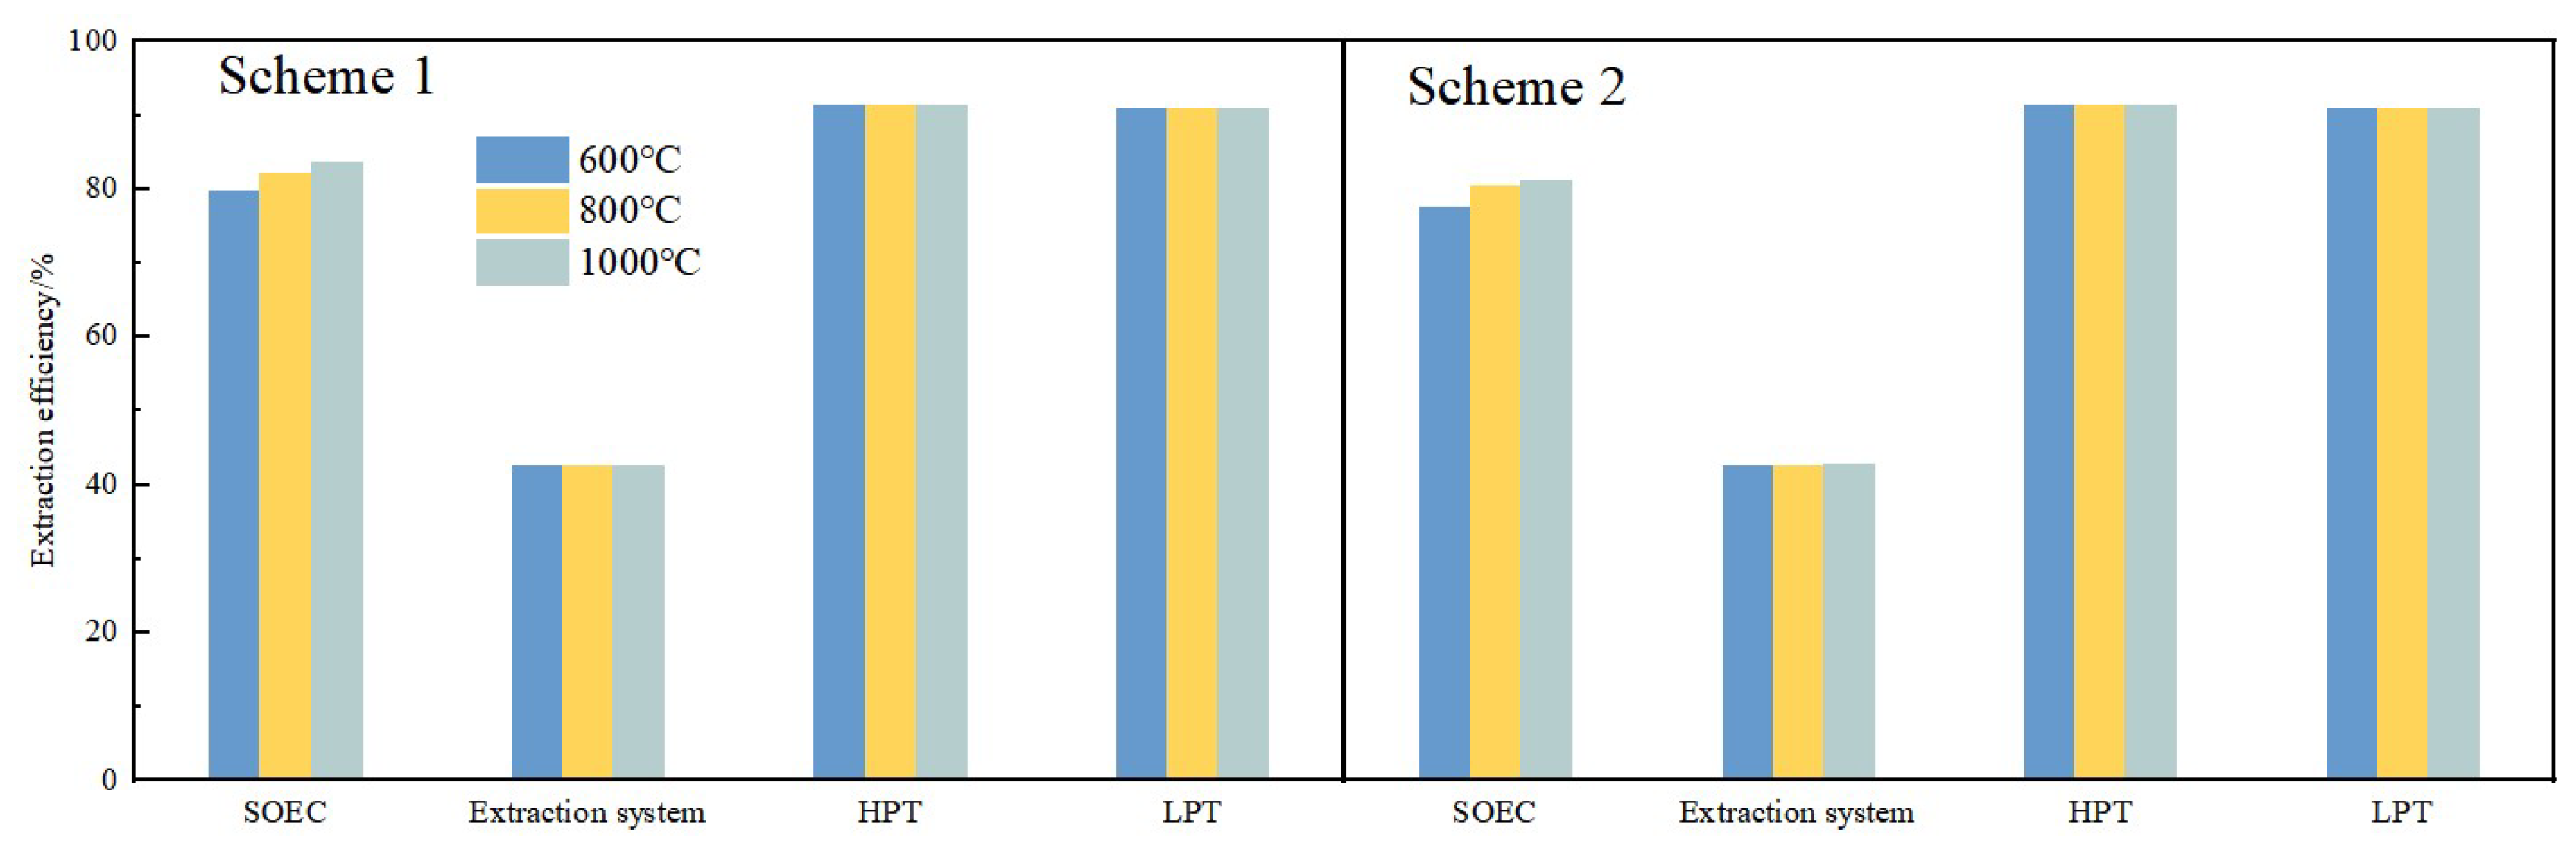
The exergy efficiencies of the key components at SOEC operating temperatures of 600 °C, 800 °C, and 1000 °C are compared. Figure 6 shows that, for the extraction system, HPT, and LPT, the exergy efficiencies under Scheme 1 and Scheme 2 exhibit only minor differences. This is because the two schemes mainly change the steam flow rates entering the HPT and LPT, without significantly affecting their inherent power-generation capability. In contrast, the exergy efficiency of the SOEC increases with increasing operating temperature. Under Scheme 1, the SOEC exergy efficiency increases from 79.8% to 82.5%, while that under Scheme 2 increases from 77.5% to 81.2%. This can be attributed to the decrease in the Gibbs free energy required for steam electrolysis at higher temperatures, which reduces the electrical energy requirement. In addition, the increase in operating temperature reduces the cell voltage and overpotentials, thereby lowering the electrical energy consumption and improving the corresponding exergy efficiency. The SOEC exergy efficiency under Scheme 1 is slightly higher than that under Scheme 2, which is mainly associated with the difference in hydrogen production between the two schemes.
Figure 6.
The exergy efficiencies of the key components.
4. Efficiency Comparison of Different Solar-Powered Hydrogen Production
Abundant solar energy can simultaneously provide high-temperature thermal energy and green electricity for electrolysis, thus improving hydrogen production efficiency. In this section, a comparison of energy conversion efficiencies (defined as the ratio of the chemical energy contained in the produced hydrogen to the input solar energy power) is presented for four solar-powered hydrogen production paths. To ensure a consistent basis for comparison, the thermodynamic boundary in this analysis is defined from solar energy input to the produced gaseous H2, with the lower heating value (LHV) of hydrogen used as the basis for the efficiency calculation. The auxiliary electricity consumption required by the hydrogen production systems is included in the analysis, including the electricity consumption of the SOEC and alkaline electrolyzer (ALK). In contrast, downstream hydrogen compression and hydrogen storage are not included in the system boundary.
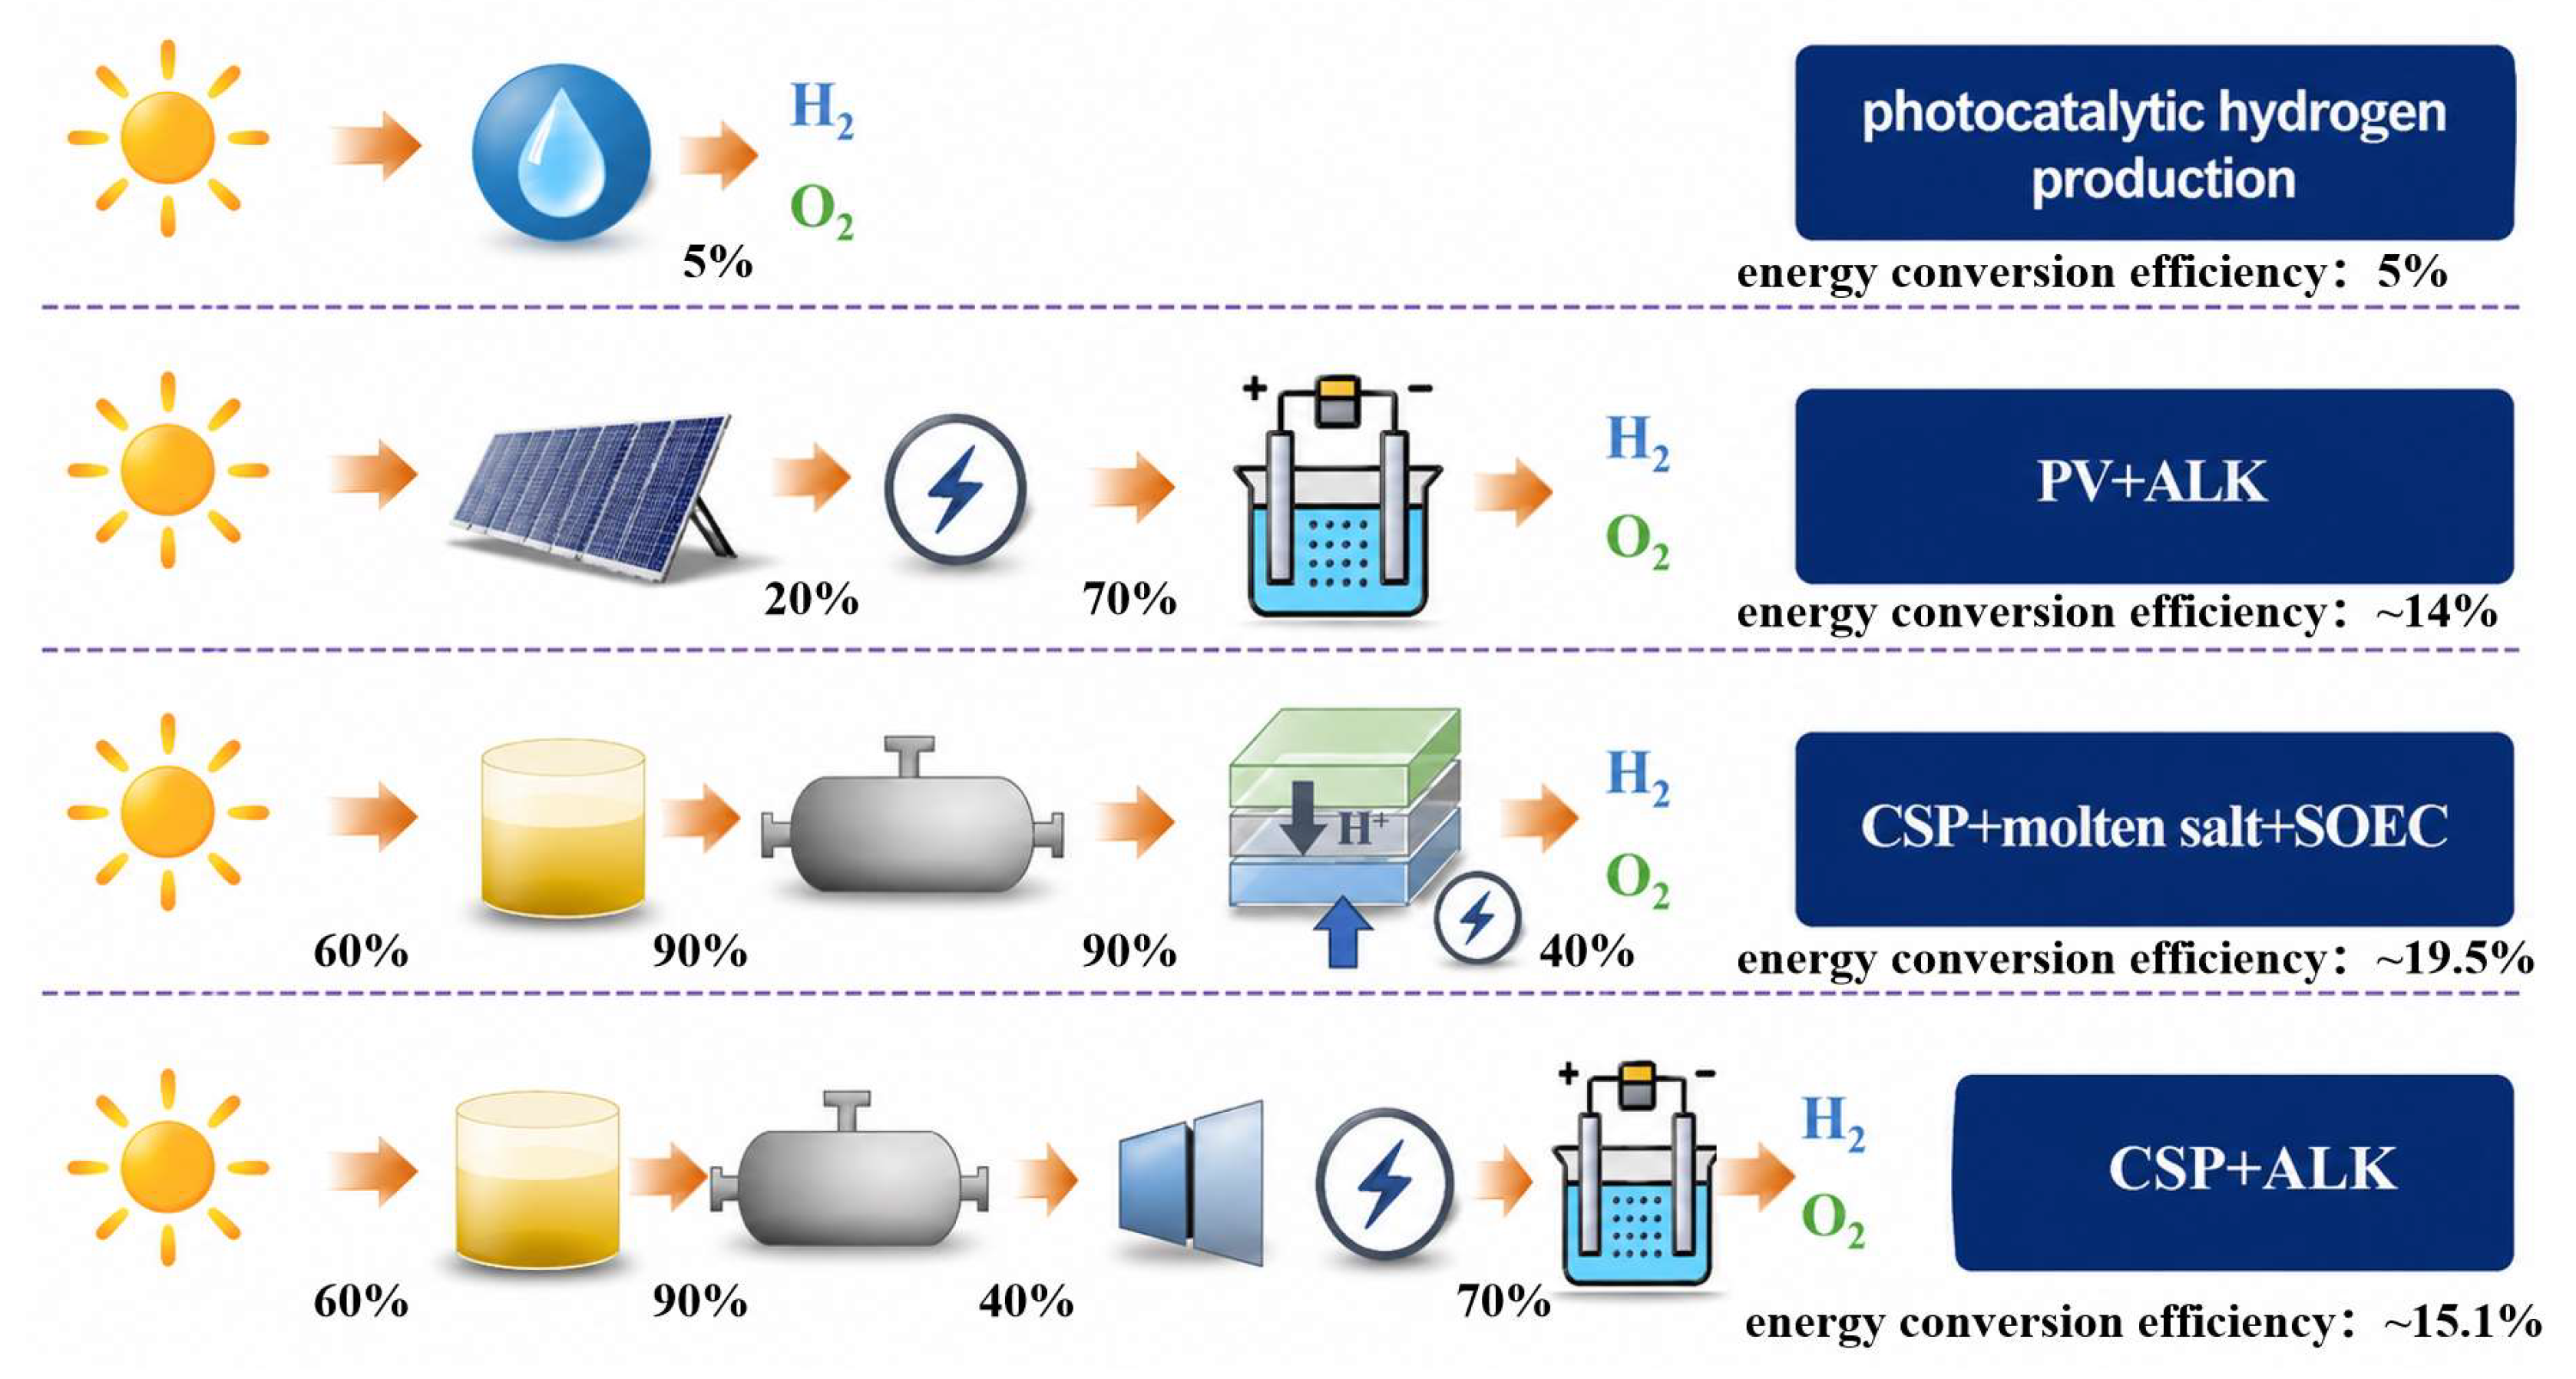
Figure 7 presents the efficiency comparison of different solar-driven water electrolysis hydrogen production pathways. Path 1 is photocatalytic hydrogen production, which uses photocatalysts such as titanium dioxide to directly decompose water molecules into hydrogen and oxygen under the action of sunlight. However, the energy conversion efficiency of photocatalytic hydrogen production is currently low, at only about 5% [31]. The durability of the catalysts also severely limits the development of this technology [32]. Path 2 combines photovoltaic power generation with alkaline water electrolysis (PV + ALK) to produce hydrogen and is currently the primary technology for green hydrogen production. Excess photovoltaic power can be stored in the form of hydrogen, which has a high energy density, thereby preventing energy waste. In addition, compared to gray hydrogen, the production of green hydrogen meets the requirements of the energy transition toward a low-carbon energy structure. In Path 2, the photovoltaic power generation efficiency is estimated at 20% [33], and the ALK technology for hydrogen production shows relative maturity, with an efficiency of 70% [34]. Therefore, the overall energy conversion efficiency for hydrogen production for Path 2 is established at 14%. Path 3 and Path 4 both utilize solar thermal resources coupled with high-temperature molten salt to produce hydrogen. In Path 3, molten salt at high temperatures heats water into high-temperature steam within the steam generator (CSP + molten salt + SOEC). Then the steam is introduced into the SOEC to produce hydrogen. Since a portion of the thermal energy from high-temperature steam is involved in the electrolysis reaction, SOEC exhibits higher electrolysis efficiency than ALK, reaching over 90%. With a heat conversion efficiency of 60% from solar energy to the molten salt medium and a heat transfer efficiency of 90%, Path 3 achieves an overall energy conversion efficiency of up to 19.5%. Path 4 utilizes a solar thermal power generation system to provide energy, coupled with ALK for hydrogen production (CSP + ALK). The power generation efficiency is limited by the Rankine cycle and is set at 40%. The overall energy conversion efficiency of the system is estimated to be 15.1%. The comparison of four solar-powered hydrogen production paths is presented as follows.
Figure 7.
Efficiency comparison of different solar-driven water electrolysis hydrogen production pathways.
A comparison of the energy conversion efficiencies of different hydrogen production schemes is presented in Table 6. It shows that direct photocatalytic hydrogen production has the lowest energy conversion efficiency, but it features the simplest system. Photovoltaic-based water electrolysis and CSP-based water electrolysis feature moderate energy conversion efficiencies and relatively mature technologies. Key components of the systems, such as photovoltaic panels, CSP units, and ALK hydrogen production units, have all achieved commercial-scale application. As a result, they are currently the dominant approach for producing hydrogen using solar energy. Path 3, which uses solar energy to generate high-temperature steam and then produces hydrogen via SOEC, offers the highest energy conversion efficiency. The comparison indicates that the CSP + SOEC pathway offers the highest solar-to-hydrogen energy conversion efficiency among the considered technologies, highlighting its potential for efficient solar hydrogen production. Based on this finding, the following sections establish a thermodynamic model of the CSP + SOEC integrated system to investigate the effects of key operating parameters on its hydrogen production performance and operational flexibility.
Table 6.
Comparison of four solar-powered hydrogen production pathways.
However, these efficiency values are representative literature-based assumptions, and the comparison is intended to illustrate the relative energy conversion characteristics of different solar hydrogen pathways, rather than to provide a rigorous system-level techno-economic assessment. The assumed efficiencies may vary depending on technology maturity, operating conditions, system configuration, and boundary definitions. Therefore, the reported overall efficiencies should be interpreted as indicative values rather than fixed performance limits.
5. Economic Analysis of Hydrogen Production Through CSP
In this section, considering the trade-off between electrochemical performance and long-term durability, 600 °C was selected as the representative operating temperature for the economic analysis. Although higher operating temperatures can reduce the electrical energy requirement of SOEC, they also impose more stringent requirements on cell materials and thermal-management components and may accelerate degradation. Moreover, operating at 600 °C reduces the thermal and material requirements for the coupling between the SOEC and CSP system, thereby providing a more practical basis for the economic evaluation.
5.1. LCOH Analysis
To further evaluate the economic performance of hydrogen production, the levelized cost of hydrogen (LCOH) is adopted as the primary economic indicator. In this study, the considered costs include the annualized SOEC capital cost, electricity consumption, stack replacement, and operation and maintenance costs, while the capital cost of the existing CSP system is excluded to avoid attributing the costs of the established solar thermal infrastructure to incremental hydrogen production. Hydrogen compression and storage are also excluded, consistent with the defined system boundary.
The calculation formula for LCOH is as follows:
where CCAPEX,annual, Celectricity, Cstack, and CO&M represent annualized SOEC capital cost, electricity consumption, stack replacement, and operation and maintenance costs, respectively [35].
where CRF is the capital recovery factor and can be calculated as follows [35]:
Other relevant parameters are listed in the table below.
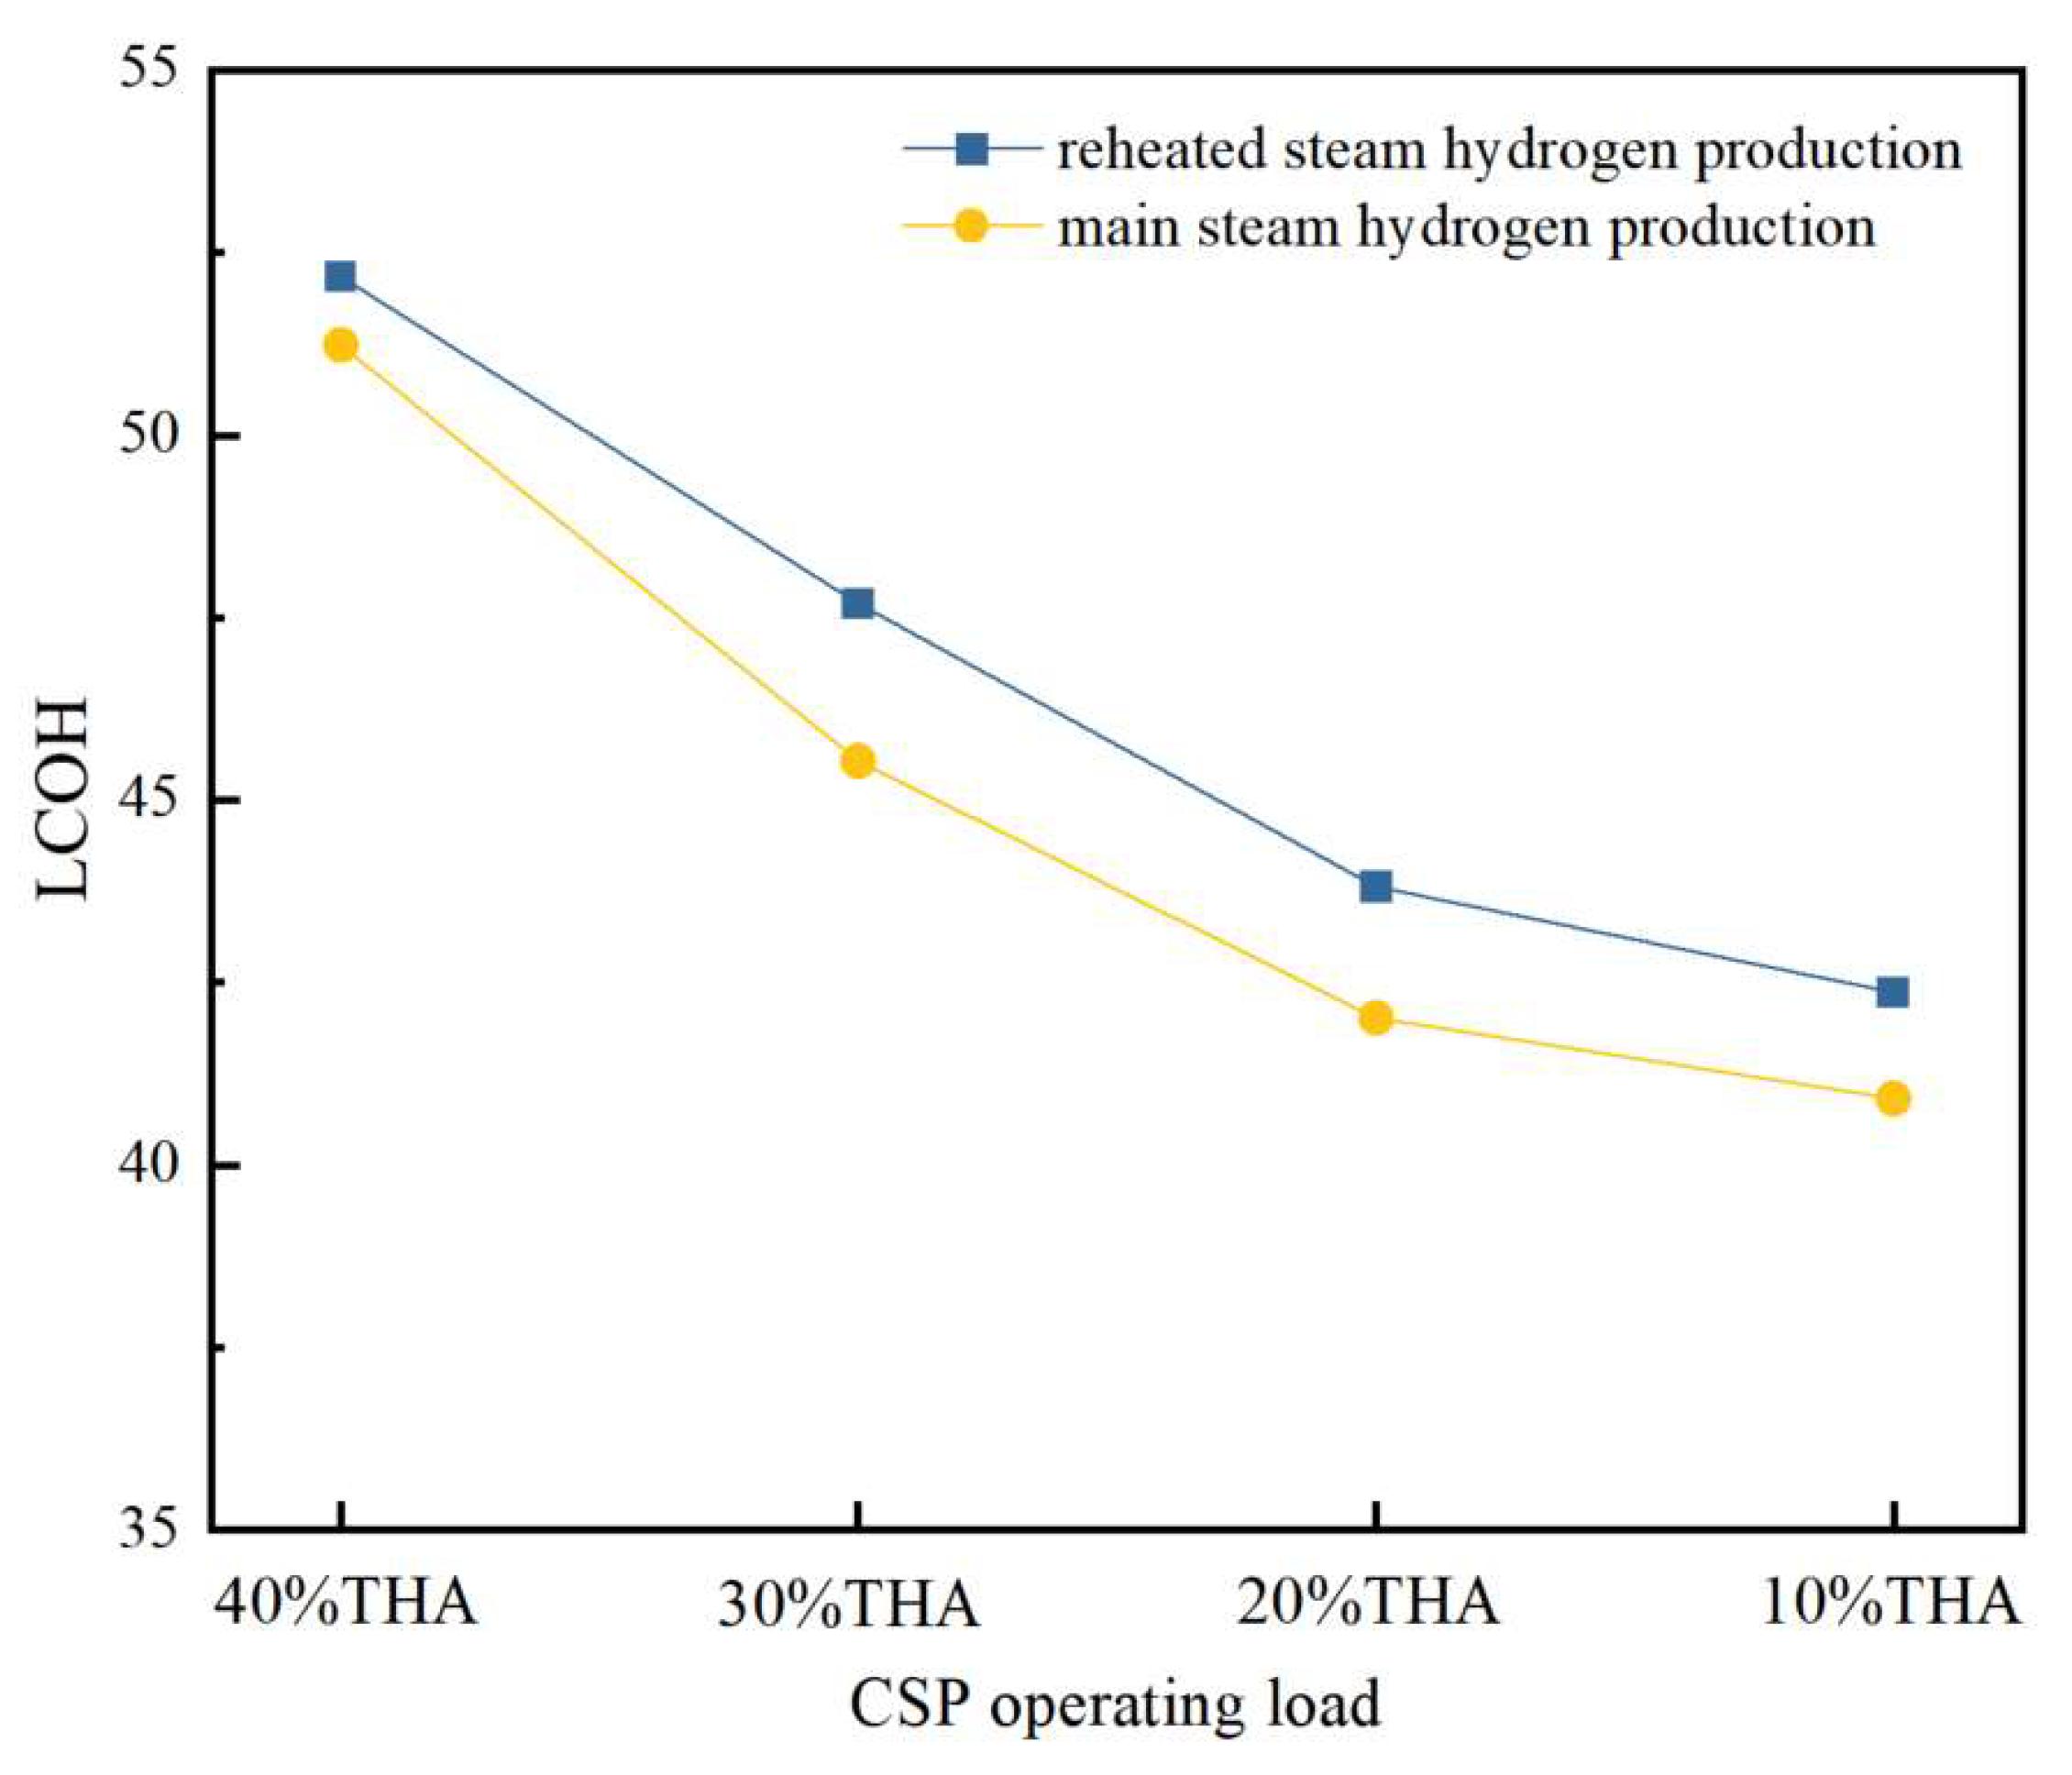
The parameters for LCOH analysis of CSP-SOEC system is showed in Table 7. Results in Figure 8 show that with the CSP operating load decreasing from 40%THA to 10%THA, the LCOH of CSP + SOEC with main steam for hydrogen production decreases from 51.24 CNY/kgH2 to 40.91 CNY/kgH2, while that with reheat steam for hydrogen production decreases from 52.17 CNY/kgH2 to 42.36 CNY/kgH2. For a given CSP-SOEC system scale, the LCOH generally decreases with increasing hydrogen production because the fixed costs are distributed over a larger amount of hydrogen. The reduction is nonlinear, with a relatively steep decrease at low hydrogen production and a gradually diminishing reduction at higher production levels. In general, SOEC capital cost, electricity price, and annual operating hours have a direct and significant influence on LCOH, while stack lifetime and replacement cost affect the annualized stack replacement expenditure. A higher SOEC capital cost or electricity price increases the LCOH, whereas a longer annual operating time generally reduces the LCOH by increasing annual hydrogen production and improving the utilization of the SOEC investment. Similarly, a longer stack lifetime or lower replacement cost reduces the contribution of stack replacement to the LCOH.
Table 7.
LCOH analysis of CSP-SOEC system.
Figure 8.
LCOH under different CSP operating loads.
5.2. Operating Benefits
CSP plants are typically built in regions with abundant solar radiation, making them capable of deep peak-shaving to increase the integration of solar power. CSP can achieve 24 h full-load operation when the molten salt storage tank has a large storage capacity. During periods of higher photovoltaic output, CSP can reduce its own output by coupling with SOEC to produce hydrogen, thus participating in the peak-shaving market. Compared to coal-fired power plants, CSP has no impact on system efficiency or operating costs (such as coal consumption rates) during load variations, thus offering significant advantages in the peak-shaving market. Therefore, for CSP systems coupled with SOEC to produce hydrogen, the benefits during peak-shaving operations include hydrogen profits, oxygen profits, and peak-shaving compensation.
The peak-shaving benefits of different schemes are evaluated at SOEC operating temperatures of 600 °C under 10% THA to 40% THA conditions. The prices of hydrogen and oxygen are 13 CNY/kg and 0.45 CNY/kg, respectively. Following the peak-shaving compensation policy of Gansu Province, China, the portion of operating load below 50% THA is calculated at 0.04 CNY/kWh. The corresponding parameters for benefit analysis are listed in Table 8.
Table 8.
The corresponding parameters for operating benefit analysis.
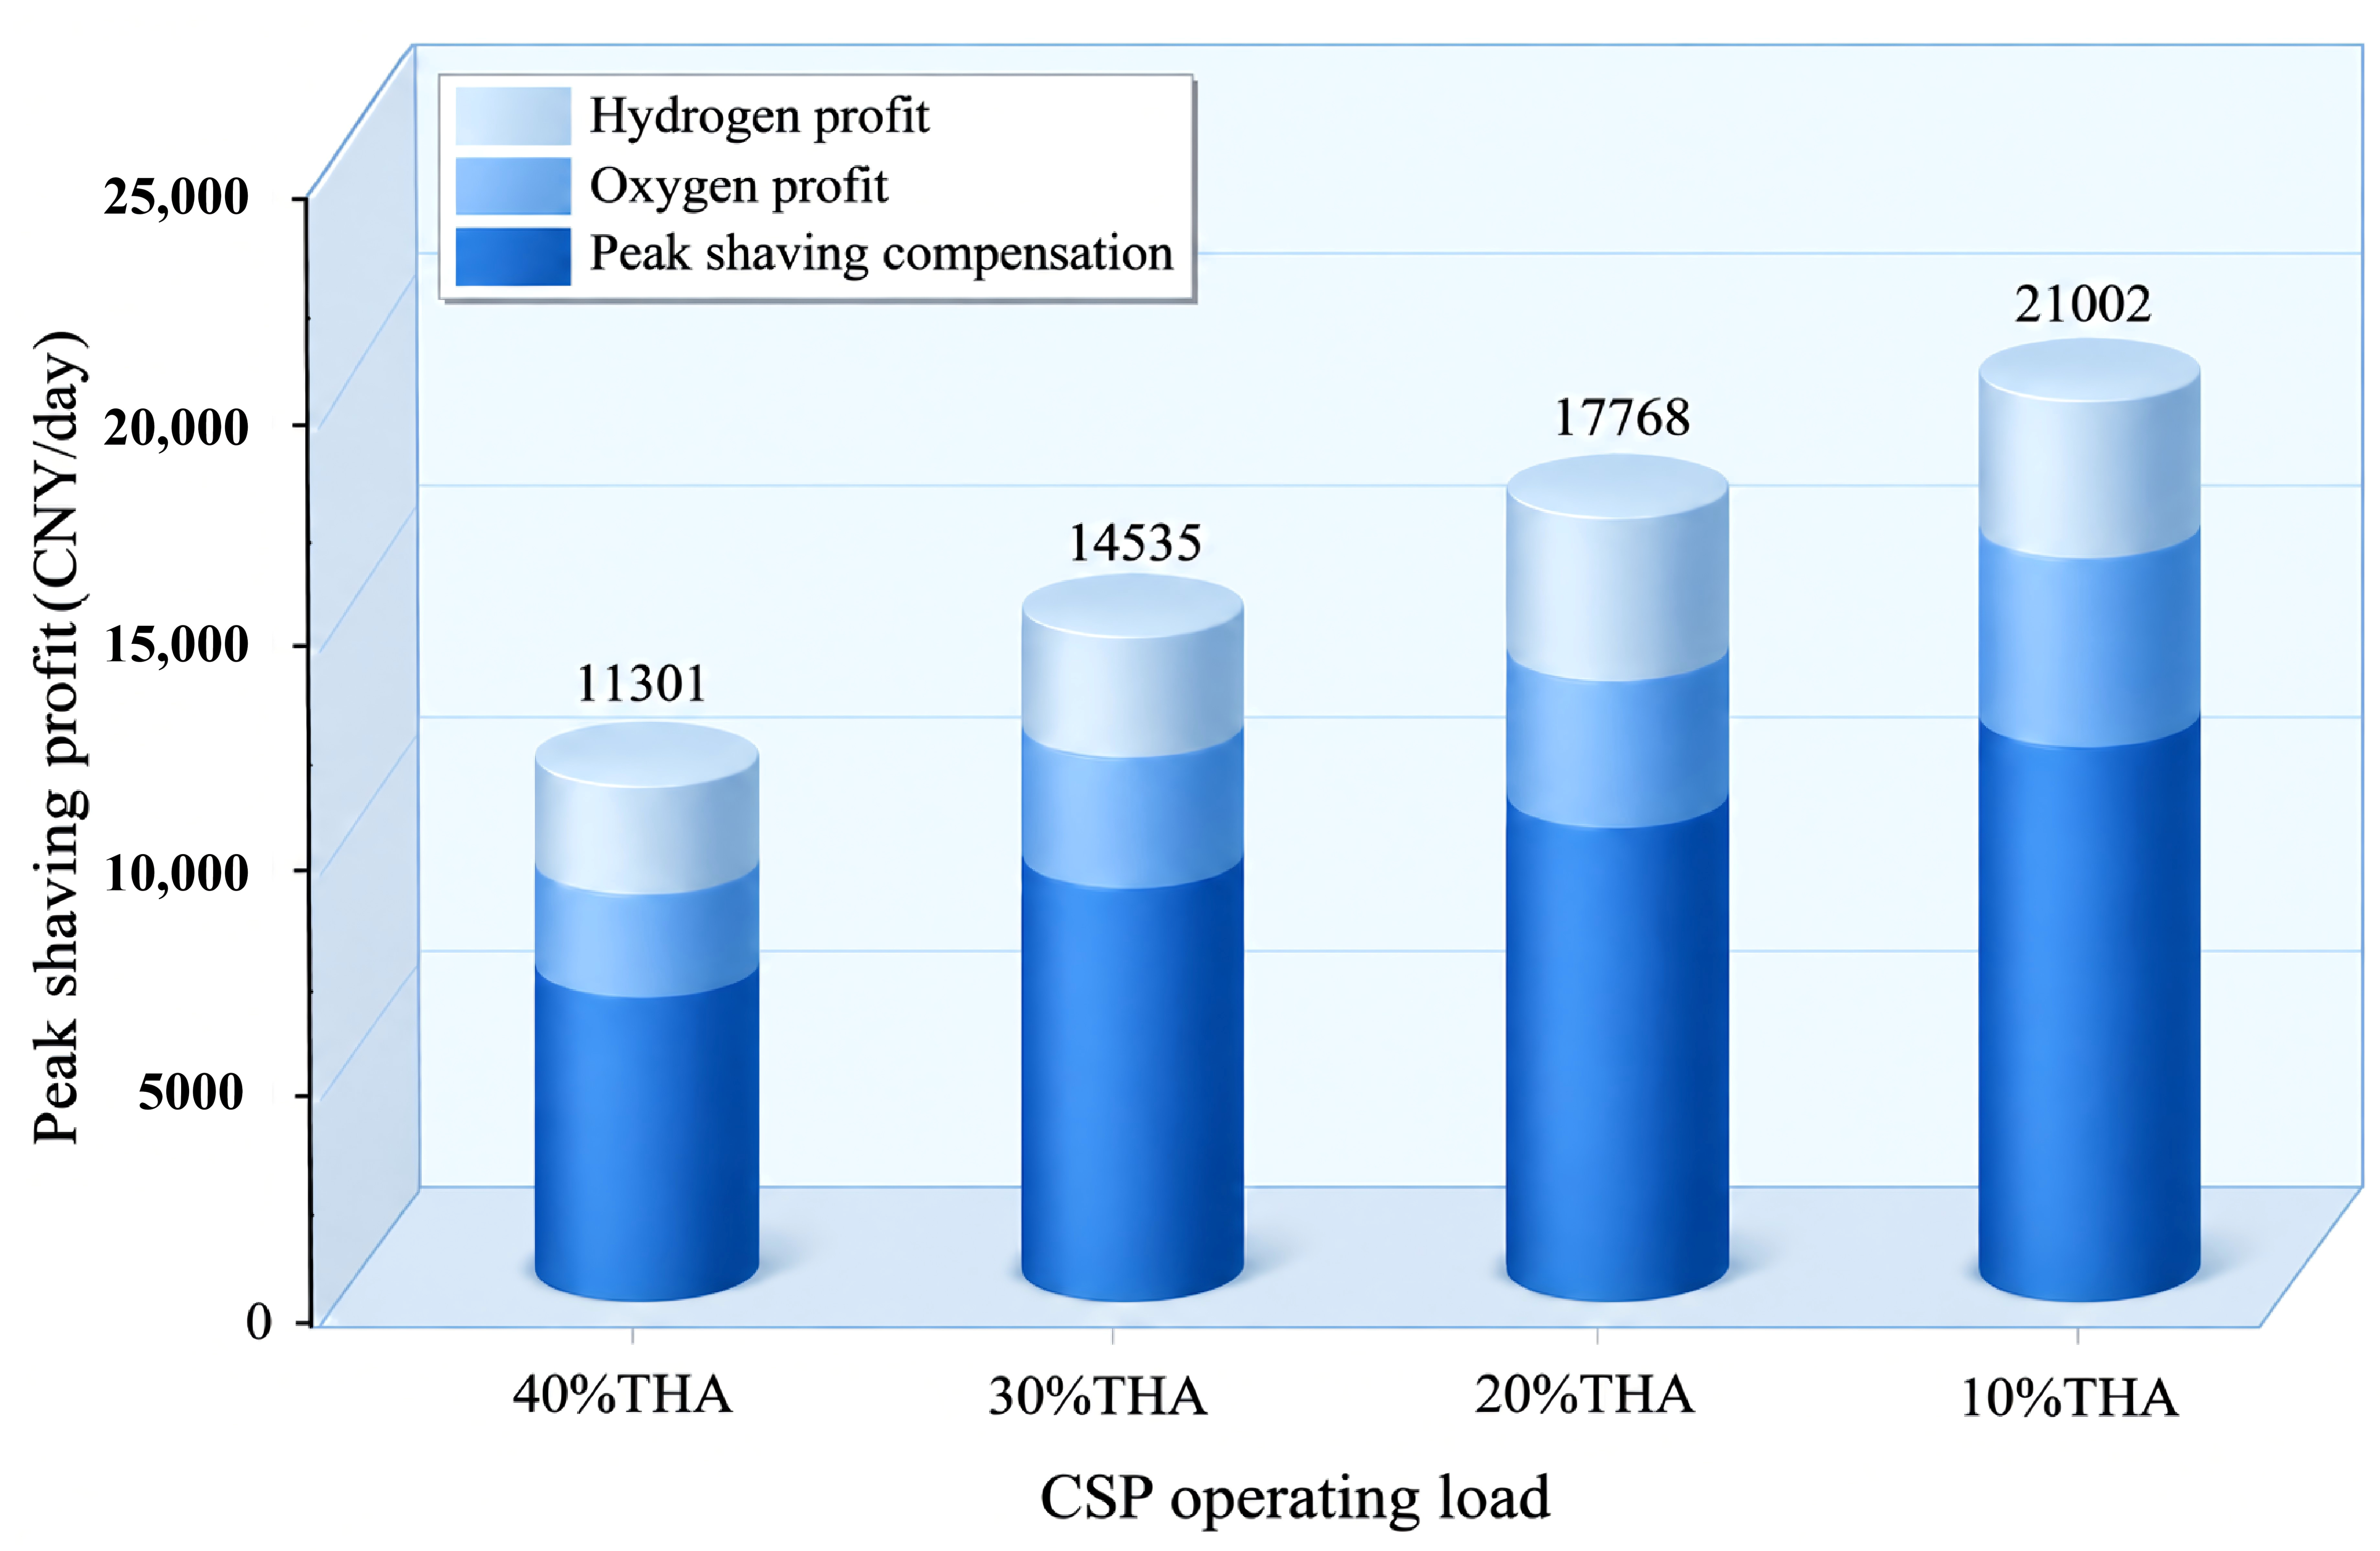
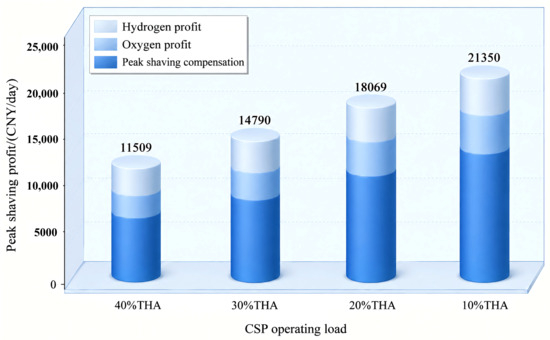
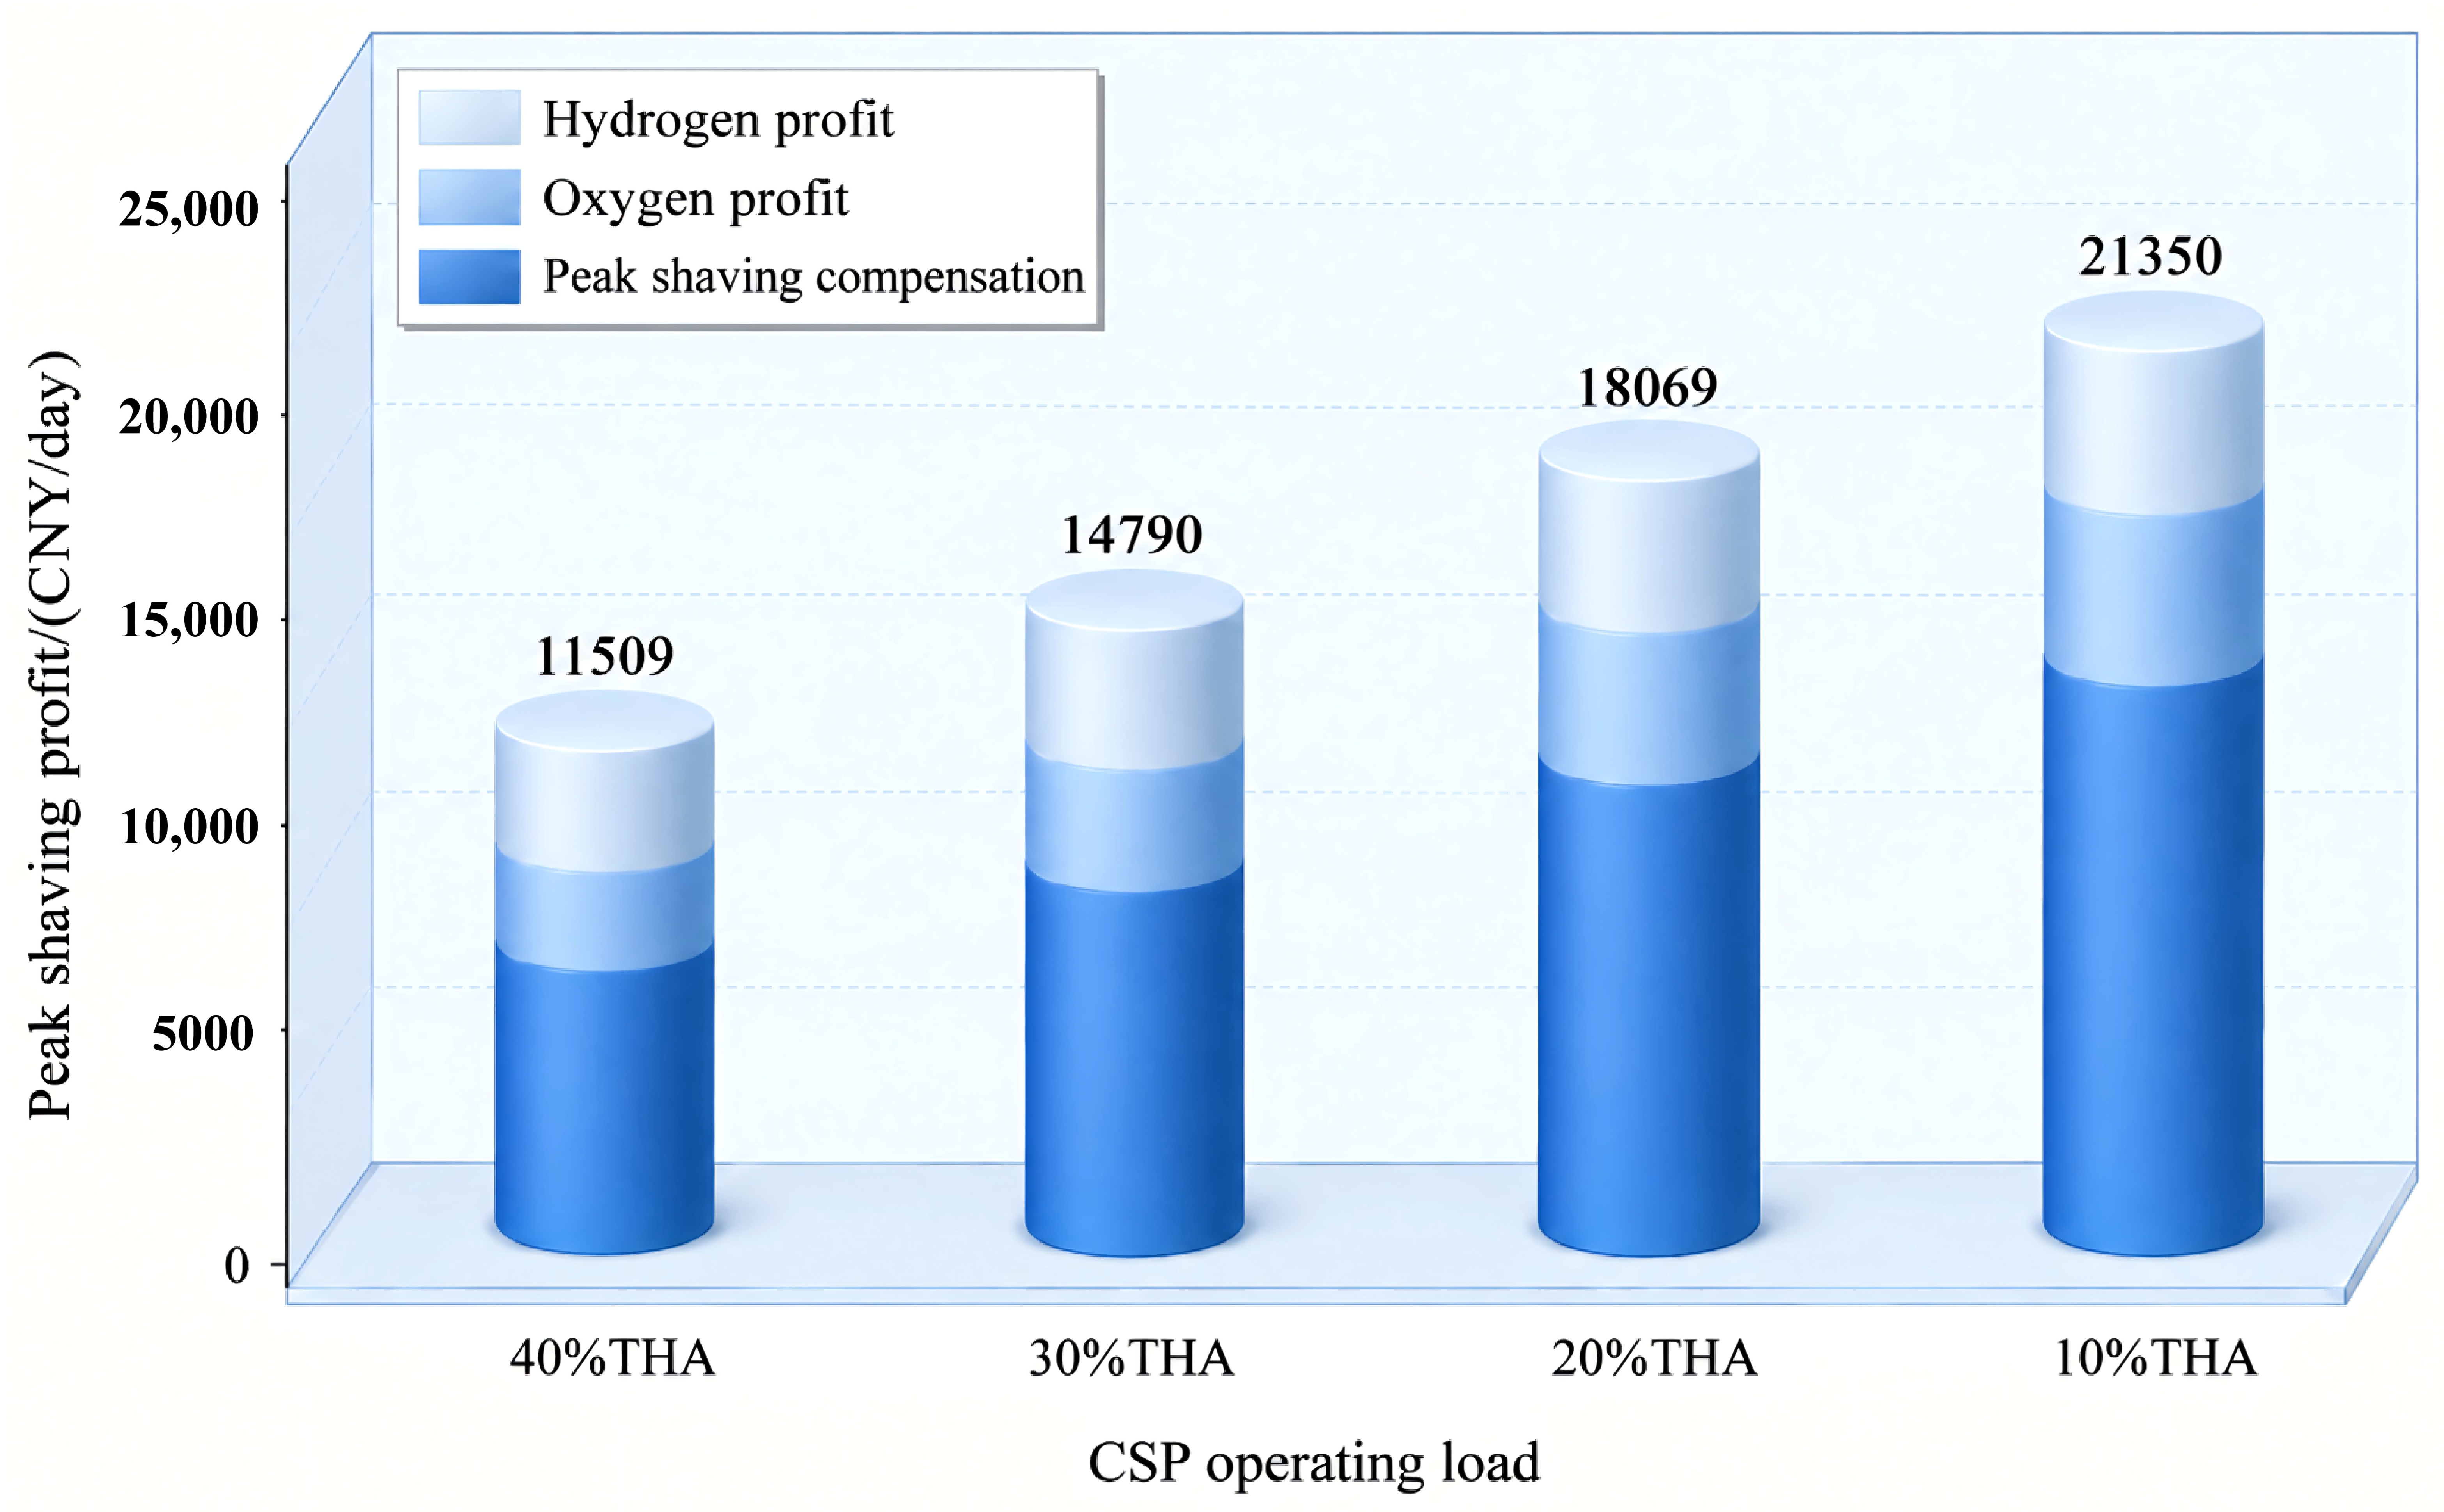
For CSP units, we assume a daily peak-shaving period of 4 h and an annual operating time of 5000 h. The benefit evaluation results are shown in Figure 9 and Figure 10. For the main steam hydrogen production scheme, as the CSP operating load decreases from 40% THA to 10% THA, the daily hydrogen profit increases from 8224 CNY to 13,940 CNY, and the daily oxygen profit increases from 2277 CNY to 3860 CNY. Directly linked to operating load, the peak-shaving compensation for CSP rises from 800 CNY to 3200 CNY. As the operating load decreases, the overall daily profit of the CSP increases from 11,301 CNY to 21,002 CNY. As shown in Figure 10, for the reheat steam hydrogen production scheme, as the CSP operating load decreases from 40% THA to 10% THA, the daily hydrogen profit increases from 8387 CNY to 14,213 CNY, and the daily oxygen profit increases from 2322 CNY to 3936 CNY. As the operating load decreases, the overall daily profit of the CSP increases from 11,301 CNY to 21,349 CNY. The higher benefits of reheat steam hydrogen production are attributed to the work performed in the high-pressure turbine. The limited difference in economic performance is mainly attributed to the similar steam temperatures supplied to the SOEC, whereas the difference in steam pressure has only a marginal effect on hydrogen production. Moreover, the limited peak-shaving capacity of the 50 MW CSP unit restricts the additional revenue achievable through different steam extraction schemes, resulting in only a slight difference in overall economic performance. It should be noted that this section only accounts for CSP peak-shaving compensation. The specific system benefits must also include other factors, such as the storage, transportation, and compression of hydrogen and oxygen, as well as the investment and operating costs of the SOEC system.
Figure 9.
The peak-shaving profits of CSP with main steam for hydrogen production.
Figure 10.
The peak-shaving profits of CSP with reheat steam for hydrogen production.
6. Conclusions
Based on CSP units, this paper proposes two approaches for hydrogen production: one utilizing main steam and the other utilizing reheat steam. Thermodynamic models were established for both approaches, and the effects of extracted steam volume and SOEC operating temperature on hydrogen production performance and energy consumption were analyzed under different schemes. In addition, this paper compares the hydrogen production efficiency of various solar-powered water electrolysis paths and evaluates the peak-shaving benefits of the CSP unit. The main conclusions are as follows:
- (1)
- Under an operating temperature of 600 °C, as the steam extraction flow rate increases from 2000 kg/h to 12,000 kg/h, the hydrogen production rates for both Scheme 1 and Scheme 2 exhibit a linear growth trend, increasing from 49.39 g/s to 296.33 g/s and from 40.11 g/s to 240.67 g/s, respectively. In Scheme 1, as the steam flow rate for hydrogen production increases, the SOEC drive power rises from 6.10 MW to 36.59 MW, the steam heating power increases approximately linearly from 0.10 MW to 0.55 MW, and the output power of the CSP unit decreases from 34.84 MW to 1.15 MW. In Scheme 2, the SOEC drive power increases from 4.96 MW to 29.74 MW, the steam heating power increases from 0.1 MW to 0.53 MW, and the CSP unit output power decreases from 36.21 MW to 9.37 MW.
- (2)
- As the SOEC operating temperature increases from 600 °C to 1000 °C, the hydrogen production capacity of Scheme 1 increases from 246.94 g/s to 271.61 g/s. Meanwhile, the steam heating power increases from 0.44 MW to 3.34 MW, the SOEC drive power rises from 30.49 MW to 34.85 MW, and the CSP unit output power reduces from 7.89 MW to 0.65 MW. Within the same temperature ranges, the hydrogen production rate for Scheme 2 improves from 200.56 g/s to 225.31 g/s. Meanwhile, the steam heating power rises from 0.46 MW to 3.54 MW, the SOEC drive power increases from 24.78 MW to 28.91 MW, and the CSP unit output power decreases from 14.74 MW to 7.52 MW. Under Scheme 1, the SOEC exergy efficiency increases from 79.8% to 82.5%, while under Scheme 2, it increases from 77.5% to 81.2%.
- (3)
- A comparison of the hydrogen production efficiencies based on solar-driven electrolysis shows that photocatalytic hydrogen production has the lowest energy conversion efficiency of 5%. The energy conversion efficiencies for photovoltaic-based water electrolysis and CSP-based water electrolysis are 14% and 15.1%, respectively. With solar-driven high-temperature steam, the energy conversion efficiency of hydrogen production via SOEC achieves the highest value of 19.5%.
- (4)
- The economic evaluation results show that the maximum peak-shaving revenues are 21,002 CNY/day for Scheme 1 and 21,350 CNY/day for Scheme 2, respectively. The corresponding minimum LCOHs are 40.91 CNY/kgH2 and 42.36 CNY/kgH2, respectively.
Author Contributions
Z.Z.: methodology, Writing—original draft, investigation, formal analysis; Z.Y.: methodology, resources, visualization; H.Z.: data curation, supervision, software; X.W.: Formal analysis, visualization; Y.D.: writing—review and editing, formal analysis, validation; H.K.: software, investigation. All authors have read and agreed to the published version of the manuscript.
Funding
This research received no external funding.
Data Availability Statement
The original contributions presented in this study are included in the article. Further inquiries can be directed to the corresponding author.
Conflicts of Interest
Zhiqiang Zhang and Hailong Kang were employed by the Gansu Longyuan New Energy Co., Ltd. and Longyuan (Dunhuang) New Energy Development Co., Ltd. Zhiyuan Yan was employed by the Guoneng Nanjing Electric and Test Research Co., Ltd. Hao Zhang was employed by the State Grid Shandong Electric Power Research Institute. The remaining authors declare that the research was conducted in the absence of any commercial or financial relationships that could be construed as a potential conflict of interest.
Nomenclature
| Abbreviations | |||
| ALK | alkaline water electrolysis | J | current density |
| CRF | capital recovery factor | h | enthalpy |
| CSP | concentrating solar power | k | pre-exponential factor |
| LCOH | levelized cost of hydrogen | L | characteristic length |
| LHV | lower Heating Value | Lstack | SOEC stack life |
| PEM | proton exchange membrane | M | molecular mass |
| PV | photovoltaic | m | Mass flow rate |
| SOEC | solid oxide electrolysis cell | Ncell | electrolyzer units number |
| Symbols | p | pressure | |
| Acell | effective area | R | gas constant |
| Bg | effective permeability | T | operating temperature |
| C | cost | U | Lennard-Jones potential |
| Deff | effective diffusivity | V | voltage |
| d | thickness | φ | potential |
| Eact | activation energy | ϕ | SOEC porosity |
| e | entropy | γ | SOEC tortuosity |
| F | Faraday’s constant | η | exergy efficiency |
| fstack | SOEC stack’s proportion | ΩD | dimensionless diffusion collision integral |
| fO&M | SOEC operation & Maintenance proportion | μ | dynamic viscosity coefficient |
References
- Wu, Z.; Wang, Z.; Yang, Q.; Li, C. Prediction Model of Electric Power Carbon Emissions Based on Extended System Dynamics. Energies 2024, 17, 472. [Google Scholar] [CrossRef] [Scilit]
- Maka, A.O.M.; Mehmood, M.; Chaudhary, T.N. Green hydrogen revolution and its pathway towards sustainable development. Clean Energy 2025, 9, 124–131. [Google Scholar] [CrossRef] [Scilit]
- Kochanek, E. The Role of Hydrogen in the Visegrad Group Approach to Energy Transition. Energies 2022, 15, 7235. [Google Scholar] [CrossRef] [Scilit]
- China Energy Statistical Yearbook. 2024. Available online: https://www.stats.gov.cn/sj/ndsj/2024/indexeh.htm (accessed on 1 January 2024).
- Li, J.; Liang, H.; Zheng, Z.; Tang, L.; Zhang, Z.; Gao, Z.; Zhang, C. A critical review of China’s hydrogen supply chain and equipment. Int. J. Hydrogen Energy 2025, 180, 151737. [Google Scholar] [CrossRef] [Scilit]
- Sahin, M.E. An Overview of Different Water Electrolyzer Types for Hydrogen Production. Energies 2024, 17, 4944. [Google Scholar] [CrossRef] [Scilit]
- Cao, X.; Li, M.; Weng, Y.; Xie, P. Hydrogen production through renewable energy and storage systems: Economic viability and market expansion. Renew. Energy 2026, 262, 125338. [Google Scholar] [CrossRef] [Scilit]
- Ning, M.; Yao, Y.; Zhan, Y.; Pan, F.; Fu, Y. Hydrogen Production from Marine Renewable Energy: A Review. Energies 2025, 18, 6490. [Google Scholar] [CrossRef] [Scilit]
- Dash, S.; Singh, K.A.; Jose, S.; Wilson, D.V.H.; Elangovan, D.; Surapraraju, S.K.; Natarajan, S.K. Advances in green hydrogen production through alkaline water electrolysis: A comprehensive review. Int. J. Hydrogen Energy 2024, 83, 614–629. [Google Scholar] [CrossRef] [Scilit]
- d’Amore-Domenech, R.; Carrillo, I.; Navarro, E.; Leo, T.J. Alkaline Electrolysis for Hydrogen Production at Sea: Perspectives on Economic Performance. Energies 2026, 16, 4033. [Google Scholar]
- Naqvi, S.A.H.; Taner, T.; Ozkaymak, M.; Ali, H.M. Hydrogen Production through Alkaline Electrolyzers: A Techno-Economic and Enviro-Economic Analysis. Chem. Eng. Technol. 2022, 46, 474–481. [Google Scholar] [CrossRef] [Scilit]
- Zhang, H.; Tang, P.; Ren, H.; Zhang, L.; Wang, Q.; Zhou, D. Uncovering the true life cycle costs of hydrogen production pathways from water electrolysis in China. Sustain. Prod. Consum. 2026, 64, 56–83. [Google Scholar] [CrossRef] [Scilit]
- Taner, T. Energy and exergy analyze of PEM fuel cell: A case study of modeling and simulations. Energy 2018, 143, 284–294. [Google Scholar] [CrossRef] [Scilit]
- Xu, Y.; Cai, S.; Chi, B.; Tu, Z. Technological limitations and recent developments in a solid oxide electrolyzer cell: A review. Int. J. Hydrogen Energy 2024, 50, 548–591. [Google Scholar] [CrossRef] [Scilit]
- Meda, U.S.; Rajyaguru, Y.V.; Pandey, A. Generation of green hydrogen using self-sustained regenerative fuel cells: Opportunities and challenges. Int. J. Hydrogen Energy 2023, 48, 28289–28314. [Google Scholar] [CrossRef] [Scilit]
- Min, G.; Choi, S.; Hong, J.S. A review of solid oxide steam-electrolysis cell systems: Thermodynamics and thermal integration. Appl. Energy 2022, 328, 120145. [Google Scholar] [CrossRef] [Scilit]
- Sansaniwal, S.K.; Sharma, V.; Mathur, J. Energy and exergy analyses of various typical solar energy applications: A comprehensive review. Renew. Sust. Energy Rev. 2018, 82, 1576–1601. [Google Scholar] [CrossRef] [Scilit]
- Xiao, G.; Zheng, G.; Qiu, M.; Li, Q.; Li, D.; Ni, M. Thermionic energy conversion for concentrating solar power. Appl. Energy 2017, 208, 1318–1342. [Google Scholar] [CrossRef] [Scilit]
- Kasaeian, A.; Nouri, G.; Ranjbaran, P.; Wen, D. Solar collectors and photovoltaics as combined heat and power systems: A critical review. Energy Convers. Manag. 2018, 156, 688–705. [Google Scholar] [CrossRef] [Scilit]
- Visitdumrongkul, N.; Tippawan, P.; Authayanun, S.; Assabumrungrat, S.; Arpornwichanop, A. Enhanced performance of solid oxide electrolysis cells by integration with a partial oxidation reactor: Energy and exergy analyses. Energy Convers. Manag. 2016, 129, 189–199. [Google Scholar] [CrossRef] [Scilit]
- Yang, H.; Zhou, M. Exploiting the operational flexibility of a concentrated solar power plant with hydrogen production. Sol. Energy 2022, 247, 158–170. [Google Scholar] [CrossRef] [Scilit]
- Zhou, H.; Wu, X. Optimization of capacity configuration and comprehensive evaluation of a renewable energy electrolysis of water for hydrogen production system. Chin. J. Chem. Eng. 2024, 76, 301–317. [Google Scholar] [CrossRef] [Scilit]
- Sanz-Bermejo, J.; Muñoz-Antón, J.; Gonzalez-Aguilar, J.; Romero, M. Optimal integration of a solid-oxide electrolyser cell into a direct steam generation solar tower plant for zero-emission hydrogen production. Appl. Energy 2014, 131, 238–247. [Google Scholar] [CrossRef] [Scilit]
- Abdulrahman, J.; Yutaro, A.; Keiichi, O. Techno-Economic Analysis of Solar Thermal Hydrogen Production in the United Arab Emirates. Hydrogen 2022, 3, 389–401. [Google Scholar] [CrossRef] [Scilit]
- Saif, A.G.H.; Alquaity, A.B.S.; Mokheimer, E.M.A. Techno-economic analysis of green hydrogen production in Saudi Arabia: A comparative study of solar PV and CSP technologies. Int. J. Hydrogen Energy 2025, 105, 1361–1374. [Google Scholar] [CrossRef] [Scilit]
- Muhammad, H.A.; Naseem, M.; Kim, J.; Kim, S.; Choi, Y.; Lee, Y.D. Solar hydrogen production: Technoeconomic analysis of a concentrated solar-powered high-temperature electrolysis system. Energy 2024, 298, 131284. [Google Scholar] [CrossRef] [Scilit]
- Cao, D. Study on Dynamic Characteristics of Conventional Solar Tower Power Station. Doctoral Dissertation, North China Electric Power University, Beijing, China, 2020. (In Chinese) [Google Scholar]
- Zhang, H.; Wang, X. A novel route for coal-fired power plants flexibility through the integration of H2/O2 burning and solid oxide electrolysis cells: Design and performance evaluation. Energy 2025, 314, 134239. [Google Scholar] [CrossRef] [Scilit]
- Ebbesen, S.D.; Graves, C.; Mogensen, M. Production of synthetic fuels by co-electrolysis of steam and carbon dioxide. Int. J. Green Energy 2009, 32, 646–660. [Google Scholar] [CrossRef] [Scilit]
- Zhang, S.; Zhang, N.; Smith, R.; Wang, W. A zero carbon route to the supply of high-temperature heat through the integration of solid oxide electrolysis cells and H2-O2 combustion. Renew. Sustain. Energy Rev. 2022, 167, 112816. [Google Scholar] [CrossRef] [Scilit]
- Pinaud, B.; Benck, J.D.; Jaramillo, T. Technical and economic feasibility of centralized facilities for solar hydrogen production via photocatalysis and photoelectrochemistry. Energy Environ. Sci. 2013, 6, 1983–2002. [Google Scholar] [CrossRef] [Scilit]
- Lakhera, S.K.; Rajan, A.; Rugma, T.P.; Bernaurdshaw, N. A review on particulate photocatalytic hydrogen production system: Progress made in achieving high energy conversion efficiency and key challenges ahead. Renew. Sustain. Energy Rev. 2021, 152, 111694. [Google Scholar] [CrossRef] [Scilit]
- Liang, H.; You, F. Reshoring silicon photovoltaics manufacturing contributes to decarbonization and climate change mitigation. Nat. Commun. 2023, 14, 1274. [Google Scholar] [CrossRef] [Scilit]
- Zuo, Y.; Bellani, S.; Ferri, M. High-performance alkaline water electrolyzers based on Ru-perturbed Cu nanoplatelets cathode. Nat. Commun. 2023, 14, 4680. [Google Scholar] [CrossRef] [Scilit]
- Lv, H.; Cao, Q.; Wang, X. Advancing solid oxide electrolysis cells for green hydrogen production: A comprehensive techno-economic and materials-centric assessment towards decarbonized energy systems. Energy Rep. 2026, 15, 109314. [Google Scholar] [CrossRef] [Scilit]
- H2A Production Analysis. 2026. Available online: https://www.hydrogen.energy.gov/program-areas/systems-analysis (accessed on 12 June 2026).
- Verde, V.; Gürbüz, E.; Khamphasith, M. Solid oxide electrolysis: Techno-Economic assessment and impact of modularity under intermittent operation. Int. J. Hydrogen Energy 2026, 221, 154144. [Google Scholar] [CrossRef] [Scilit]

Disclaimer/Publisher’s Note: The statements, opinions and data contained in all publications are solely those of the individual author(s) and contributor(s) and not of MDPI and/or the editor(s). MDPI and/or the editor(s) disclaim responsibility for any injury to people or property resulting from any ideas, methods, instructions or products referred to in the content. |
© 2026 by the authors. Licensee MDPI, Basel, Switzerland. This article is an open access article distributed under the terms and conditions of the Creative Commons Attribution (CC BY) license.