


Abstract
Interbedded shale reservoirs commonly contain multiple lithologies, such as shale and limestone, resulting in heterogeneous long-term fracture conductivity under identical proppant conditions. This lithological heterogeneity introduces uncertainty into proppant design and may lead to uneven stimulation effectiveness. This study investigates the effects of lithology, proppant size, and proppant areal concentration on the evolution of propped fracture conductivity and develops lithology-dependent empirical correlations to quantitatively describe long-term conductivity evolution within the tested parameter ranges. Conductivity experiments were performed using shale and limestone rock plates under simulated reservoir conditions of 80 °C and 40 MPa closure stress, with a long-term loading duration of 50 h. The results indicate that propped fracture conductivity exhibits strong stress sensitivity and time-dependent degradation. Continuous compaction of the proppant pack and reduction in effective flow channels are considered possible mechanisms contributing to conductivity loss during long-term loading. Under identical proppant parameters, limestone fractures generally exhibit higher long-term conductivity, while the difference in conductivity retention depends on proppant conditions rather than shale fractures, with the lithological difference becoming more pronounced under low-proppant-concentration and small-proppant-size conditions. Within the directly comparable conditions of 5 and 7.5 kg/m2, increasing proppant size and areal concentration generally reduced the conductivity difference observed between shale and limestone fractures. For shale fractures, the experiments covering 5, 7.5, and 10 kg/m2 further showed that the effect of areal concentration depended on proppant size. Based on the experimental data, lithology-dependent empirical correlations were established for shale and limestone fractures and evaluated using leave-one-condition-out cross-validation. The correlations provide a quantitative description of conductivity evolution within the tested parameter ranges. This study identifies lithology-dependent conductivity responses within the investigated proppant conditions and provides experimental evidence for adapting proppant design to heterogeneous interbedded shale reservoirs.
1. Introduction
Continental shale reservoirs commonly exhibit strong vertical lithological heterogeneity, where shale and interbedded limestone layers coexist within the same target interval. The Dongyuemiao Formation in the Fuxing area of the Sichuan Basin is a typical example, characterized by highly clay-rich and highly plastic shale interbedded with shell limestone layers, forming a representative shale–limestone lithological assemblage [1,2]. When hydraulic fractures propagate through different lithological units, variations in rock stiffness, strength, and long-term deformation behavior may result in different fracture support responses. Therefore, identical proppant size and proppant areal concentration may not necessarily provide equivalent long-term conductivity. For such interbedded reservoirs, stimulation effectiveness depends not only on fracture propagation but also on the ability of fracture segments in different lithologies to maintain effective conductivity under long-term closure stress conditions [3]. Understanding the differentiated response of propped fractures in highly plastic shale and brittle limestone interlayers is therefore critical for optimizing proppant design in heterogeneous shale reservoirs.
Research on fracture conductivity has mainly focused on the effects of closure stress and proppant pack properties. Long-term conductivity experiments have demonstrated that increasing closure stress and prolonged loading can induce proppant compaction, particle rearrangement, and crushing, resulting in pronounced reduction in fracture permeability and conductivity [4,5,6,7]. With the application of real rock plates in conductivity evaluation, researchers have further recognized that proppant embedment and fracture surface deformation can alter effective fracture width and particle contact conditions [8,9,10,11,12]. Consequently, proppant size and proppant areal concentration have become important engineering parameters controlling long-term fracture conductivity. Larger proppants generally provide larger initial pore spaces, while increasing proppant concentration enhances proppant layer thickness and load-bearing capacity [13]. However, these improvements are simultaneously restricted by proppant compaction, crushing, embedment, and fines migration during long-term loading [14,15,16,17,18]. Recent studies further indicate that the effects of proppant size and concentration are strongly dependent on stress conditions and proppant packing structures, and long-term conductivity is essentially controlled by the evolution and stability of the proppant skeleton [19,20,21,22].
The influence of rock properties becomes more pronounced in weak and highly plastic formations. Under continuous closure stress, elastic–plastic deformation and time-dependent deformation of rocks promote proppant embedment, which, together with proppant pack compaction, reduces effective fracture width and conductivity [23]. Experimental and numerical studies based on shale samples have demonstrated that proppant embedment is closely related to rock mechanical properties, particle size, proppant placement conditions, and loading duration [24,25,26,27,28]. Considering multisize proppants and shale creep behavior, the long-term conductivity of propped fractures has been further recognized as a coupled result of rock deformation and proppant skeleton evolution [29]. Katende [30] investigated proppant embedment and conductivity reduction in different brittle and plastic intervals of the Caney Shale and demonstrated that variations in rock mechanical properties lead to clearly different conductivity responses. Recently, various prediction methods incorporating embedment, creep deformation, particle damage, and proppant size effects have been developed to describe long-term fracture conductivity evolution [31,32,33,34,35].
Although previous studies have pronounced improved the understanding of propped fracture conductivity, most investigations have focused on single lithologies or specific rock conditions. For vertically heterogeneous reservoirs consisting of alternating highly plastic shale and brittle interlayers, the differences in long-term conductivity responses between different lithologies under identical proppant conditions, as well as the regulation effects of proppant size and proppant concentration on these differences, remain insufficiently understood. Consequently, conventional proppant design strategies based on uniform parameters may not adequately reflect the differentiated support requirements of fractures developed in different lithological units. Establishing lithology-dependent relationships between proppant parameters and long-term conductivity is therefore essential for adaptive proppant design in interbedded shale reservoirs.
Previous studies have mainly focused on conductivity prediction considering proppant embedment, creep deformation, or particle damage effects in single lithological formations [29,30,31,32,33,34,35]. However, the differentiated long-term conductivity response of propped fractures developed in heterogeneous interbedded shale and limestone formations under identical proppant conditions remains insufficiently understood. Therefore, this study focuses on experimentally revealing lithology-dependent conductivity evolution and establishing lithology-specific empirical correlations rather than developing a universal predictive model. In this study, the interbedded highly plastic shale reservoir in the Dongyuemiao Formation of the Fuxing area was selected as the research target. Actual downhole cores were processed into shale and limestone conductivity rock plates, and long-term fracture conductivity experiments were conducted under simulated reservoir temperature and closure stress conditions. Long-term fracture conductivity experiments were conducted using different proppant sizes and areal concentrations. Direct lithological comparisons between shale and limestone were performed at areal concentrations of 5 and 7.5 kg/m2, whereas the extended concentration range of 5–10 kg/m2 was investigated for shale fractures. On this basis, the lithology-dependent conductivity responses under matched proppant conditions and the effects of proppant size and concentration within the respective experimental matrices were evaluated. Furthermore, simplified lithology-dependent empirical correlations were established to quantitatively describe long-term conductivity evolution within the tested parameter ranges. Their robustness was evaluated using leave-one-condition-out cross-validation at the experimental-condition level. The results provide an experimental and quantitative basis for proppant selection and stimulation optimization in interbedded highly plastic shale reservoirs.
2. Materials and Methods
2.1. Experimental Materials
The rock samples were obtained from full-diameter cores collected from the Dongyuemiao Formation in the Fuxing area, Sichuan Basin. The target interval exhibits significant vertical lithological heterogeneity, consisting of highly clay-rich and plastic shale layers interbedded with shell limestone layers. The shale samples from sublayers II and IV mainly represent the highly plastic shale intervals, whereas the limestone samples from sublayer III represent the brittle interlayers.
According to previous geological investigations of the Fuxing shale gas area, the clay mineral content of shale formations ranges from 55% to 61.2% [36]. These mineralogical characteristics provide a geological basis for the high-plasticity characteristics of the shale reservoir. Previous mechanical investigations of the Fuxing shale gas area reported that the elastic moduli of shale from sublayers II and IV are 24.1 GPa and 20.2 GPa, with Poisson’s ratios of 0.42 and 0.38, respectively. The limestone samples exhibit a higher elastic modulus of approximately 33.6 GPa and a lower Poisson’s ratio of 0.28 (Table 1). These differences in stiffness and deformation characteristics provide a representative geological basis for investigating the influence of lithology on long-term fracture conductivity.
Table 1.
Main lithological and mechanical characteristics of the target interval.
The limestone plates were selected as a representative brittle lithology for comparison. Detailed mineralogical quantification of the limestone samples was not conducted in this study, which represents a limitation of the present work. The primary objective of this study was to investigate lithology-dependent conductivity behavior rather than mineralogical controls.
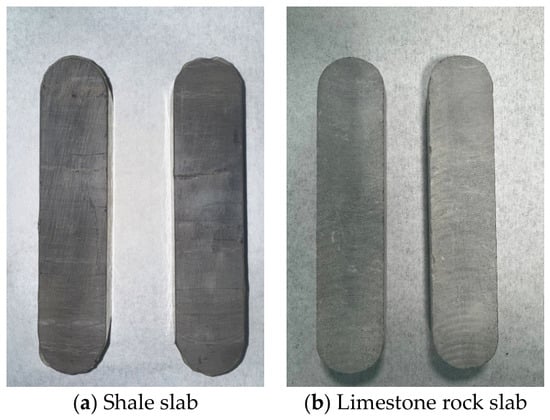
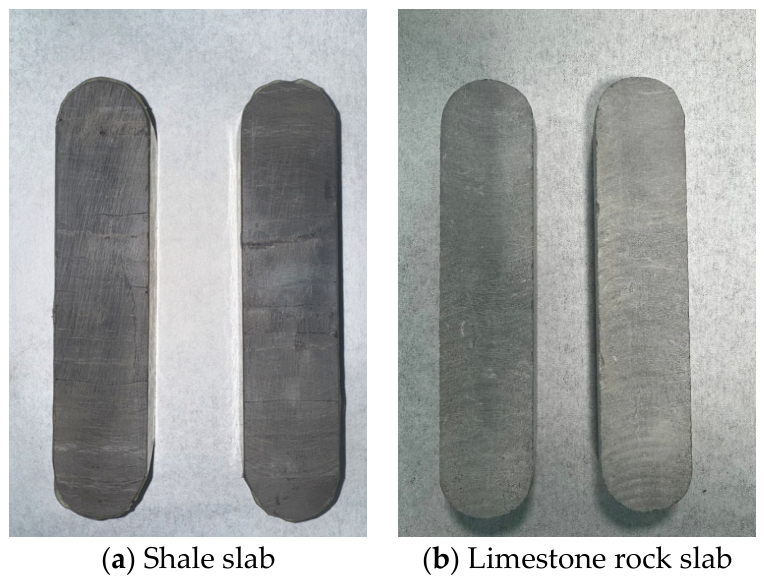
To preserve the original mineral composition, structural characteristics, and mechanical properties of the reservoir rocks, linear conductivity rock plates were prepared from the full-diameter cores. Shale plates were obtained from sublayers II and IV to represent fracture surfaces in highly plastic shale, while limestone plates from sublayer III were used to represent brittle interlayer conditions. All rock plates were machined into dimensions of 38 mm × 178 mm × 20 mm to fit the conductivity test cell (Figure 1).
Figure 1.
Conductivity rock plate specimens.
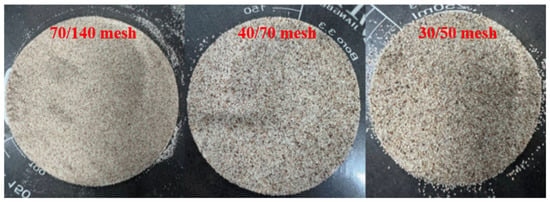
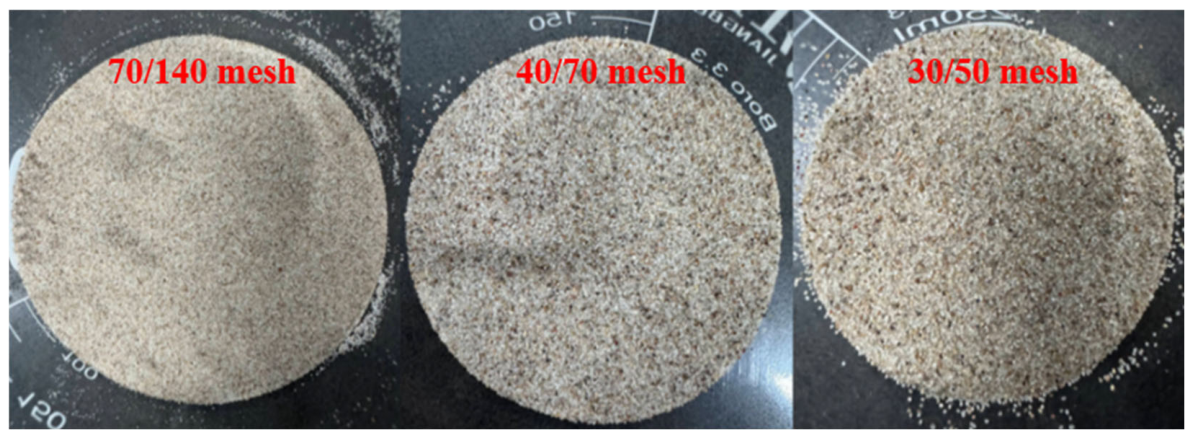
The proppant used in this study was quartz sand commonly applied in field hydraulic fracturing operations. Three particle size ranges were selected, including 70/140 mesh, 40/70 mesh, and 30/50 mesh (Figure 2). The corresponding particle diameters of these proppants were 0.15 mm, 0.30 mm, and 0.450 mm for 70/140 mesh, 40/70 mesh, and 30/50 mesh, respectively. These particle diameter values were subsequently used as the input parameter in the empirical correlations. Deionized water was used as the testing fluid to eliminate the influence of fluid property variations on conductivity measurements. The proppants used in this study were directly obtained from field hydraulic fracturing operations. Since this study focused on the effects of lithology, proppant size, and areal concentration on long-term conductivity evolution, other proppant quality parameters, including sphericity, roundness, crush resistance, and bulk density, were not treated as independent variables. All experiments were conducted using proppants from the same source to minimize the influence of variations in proppant properties.
Figure 2.
Quartz sand proppants with different particle sizes.
2.2. Experimental Apparatus and Testing Procedure
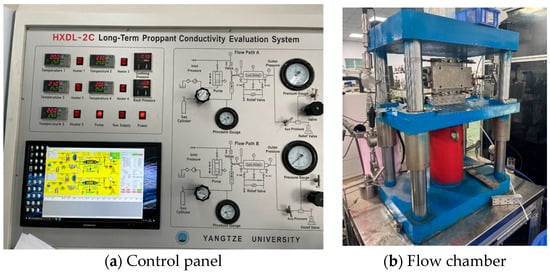
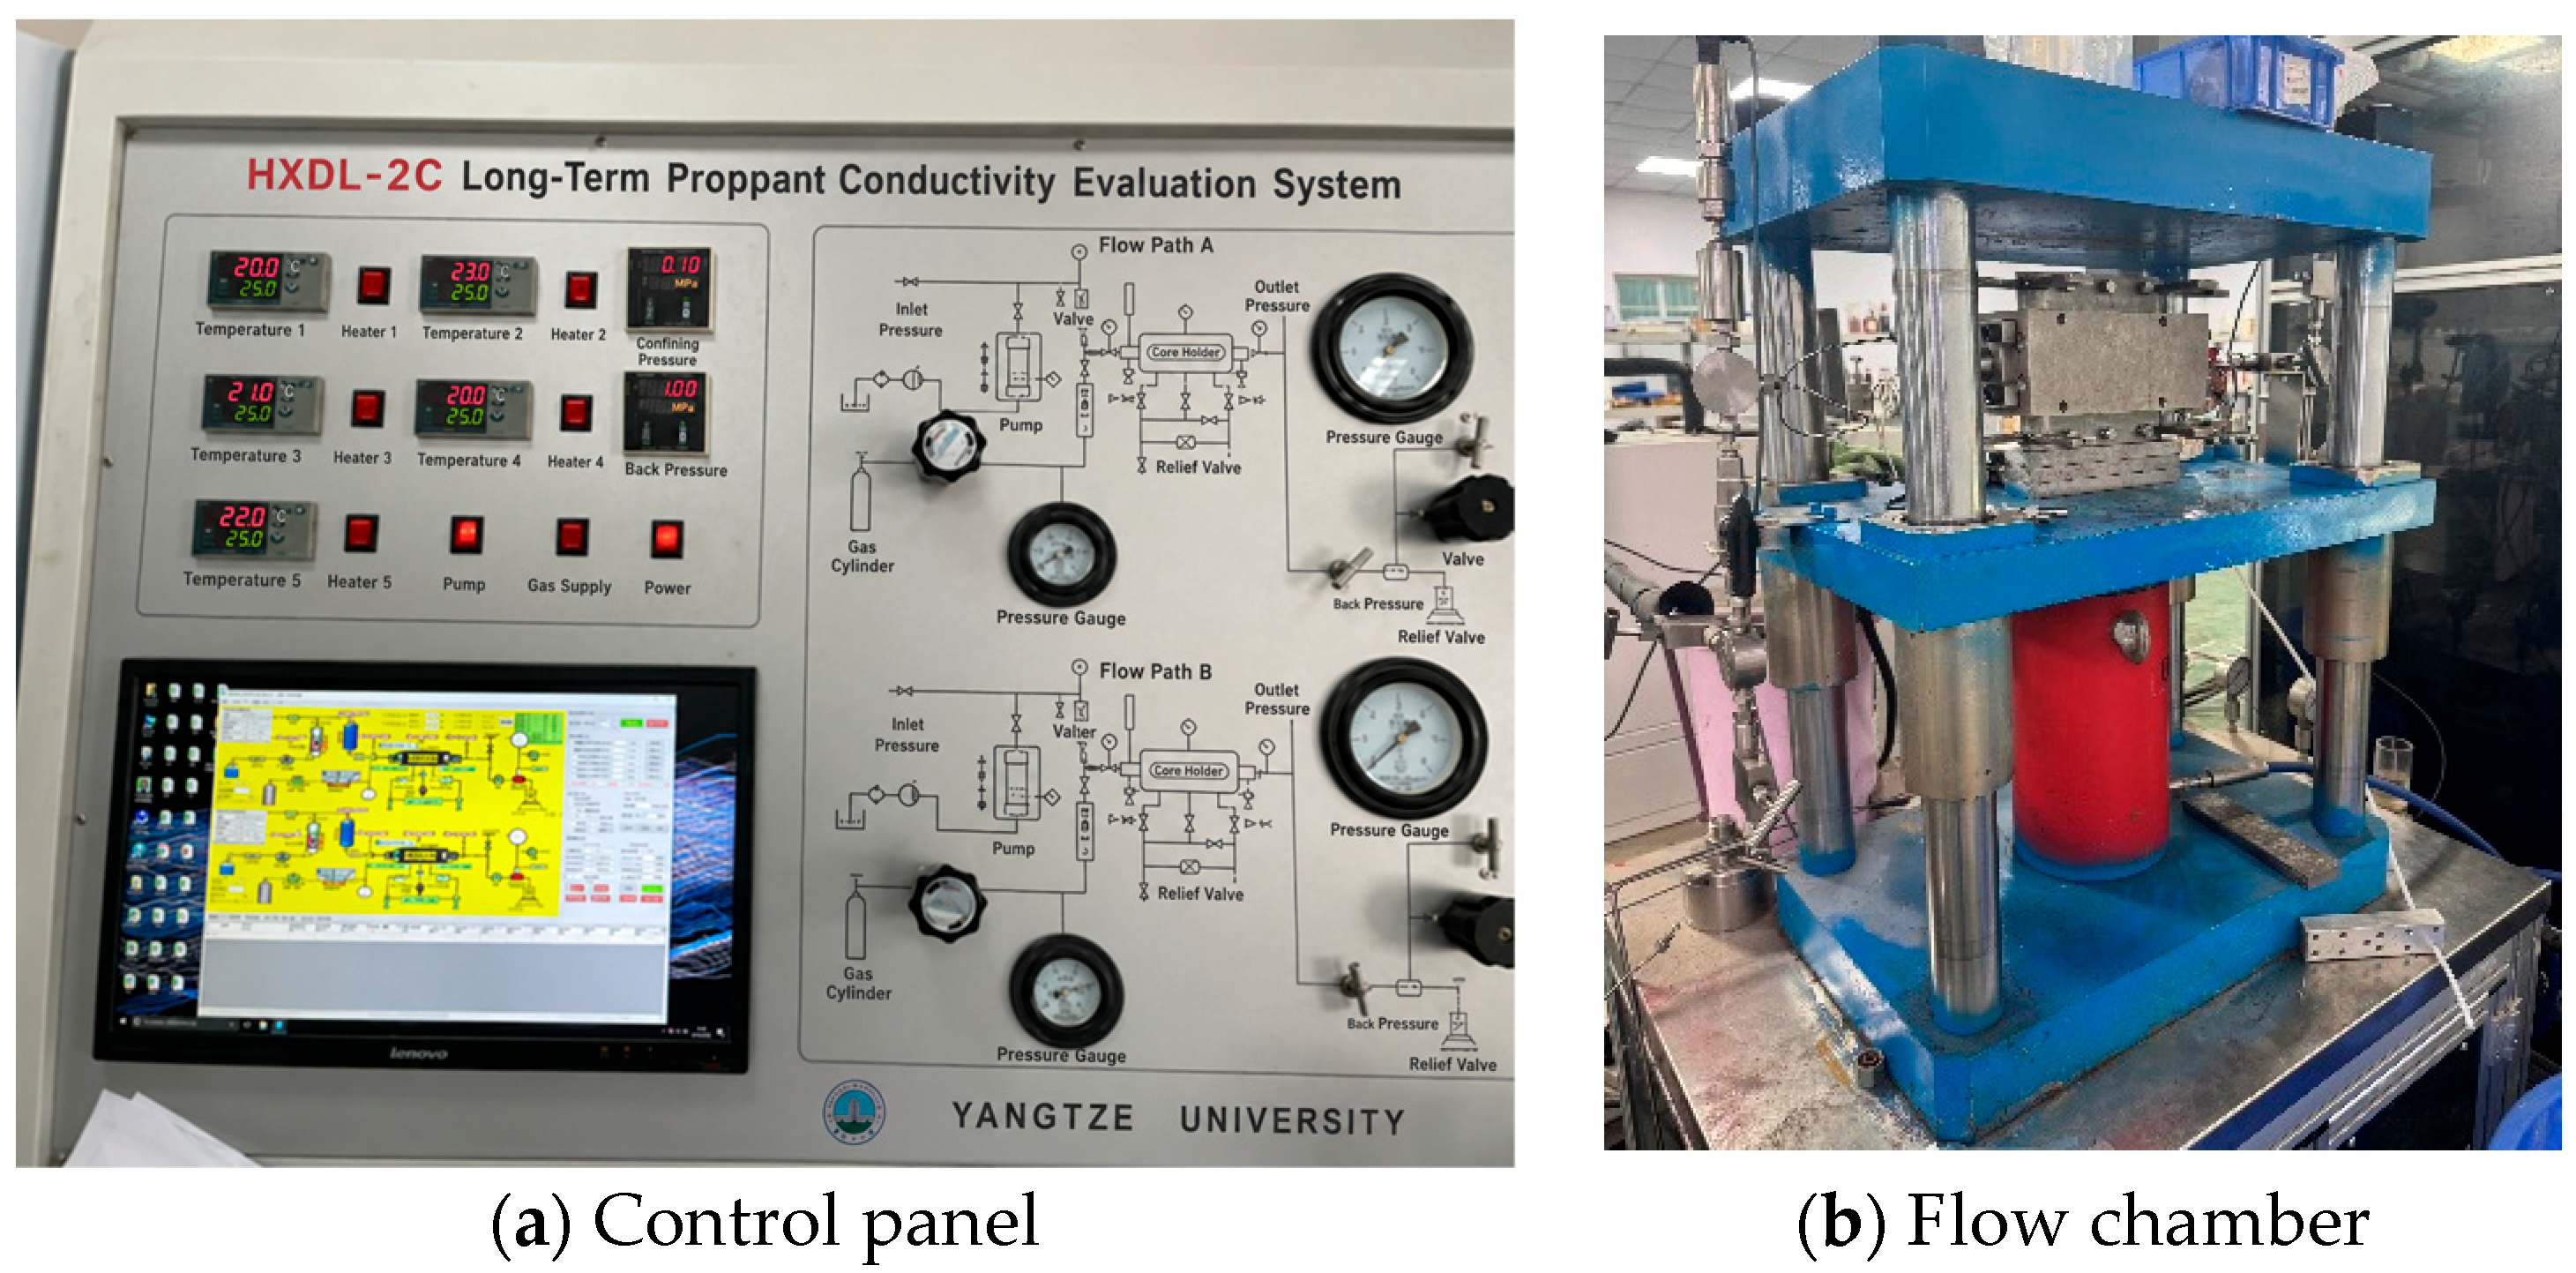
Long-term fracture conductivity experiments were conducted using an HXDL-2C proppant conductivity evaluation system (Figure 3). The system was designed according to the testing procedures specified in API RP 19D [37] and ISO 13503-5 [38] and consists of a closure stress loading system, fluid injection system, temperature control system, linear conductivity cell, and data acquisition system. The main technical specifications of the apparatus are summarized in Table 2. The maximum closure stress of the apparatus is 130 MPa, the maximum operating temperature is 200 °C, and the flow rate range is 0–200 mL/min. During the experiments, closure stress, temperature, flow rate, inlet and outlet pressures, and fracture width were simultaneously monitored.
Figure 3.
HXDL-2C system for long-term proppant conductivity evaluation.
Table 2.
Main technical specifications of the experimental apparatus.
The propped fracture was constructed using a rock plate–proppant–rock plate configuration. After assembling the conductivity cell, the temperature was adjusted to the target experimental condition, and the closure stress was subsequently increased according to the designed loading procedure. During the conductivity measurements, deionized water was injected through the propped fracture at a constant flow rate of 5 mL/min. A back pressure of 2 MPa was maintained throughout the test. The closure stress was increased stepwise to the target value of 40 MPa with increments of 10 MPa. Each loading stage was maintained until the pressure response became stable before applying the next increment. After reaching 40 MPa and obtaining a stable pressure response, the 50 h long-term conductivity test was initiated. The viscosity of deionized water at 80 °C was 3.5 mPa·s. The effective permeability of the proppant pack was calculated from the stabilized pressure difference across the proppant-filled fracture based on Darcy’s law:
where K is the permeability of the proppant pack (μm2); Q is the flow rate of the fluid through the conductivity cell (cm3/s); μ is the viscosity of the experimental fluid (mPa·s); L is the distance between the two pressure measurement points in the conductivity cell (cm); ΔP is the pressure difference between the two pressure measurement points (kPa); and A is the cross-sectional area of fluid flow (cm²).
The fracture conductivity was defined as:
where is fracture conductivity (D·cm), and is the effective fracture width, defined as the compressed thickness of the proppant layer within the conductivity cell (cm). The effective fracture width was directly obtained from the displacement measurement system of the conductivity cell, representing the compressed thickness of the proppant layer under the applied closure stress. During the long-term conductivity test, the fracture width was recorded after stabilization at the initial and final stages to characterize the width variation during closure. By monitoring pressure difference continuously and measuring fracture width at representative stages, the stress-dependent and time-dependent evolution of propped fracture conductivity was obtained.
2.3. Experimental Design and Procedure
The experiments were designed considering lithology, proppant size, and proppant areal concentration as the primary variables. Based on the temperature and pressure conditions of the Dongyuemiao Formation, the test temperature was set to 80 °C and the target closure stress was 40 MPa.
For shale samples, three proppant areal concentrations (5, 7.5, and 10 kg/m2) and three proppant sizes (70/140 mesh, 40/70 mesh, and 30/50 mesh) were selected, resulting in nine experimental groups. For limestone samples, two proppant concentrations (5 and 7.5 kg/m2) with the same three particle sizes were tested, resulting in six experimental groups. A total of 15 experiments were conducted (Table 3). Each experimental condition listed in Table 3 was tested once, and no replicate tests were performed for individual conditions. Therefore, the 15 tests constitute the complete experimental dataset of this study. Because natural shale and limestone specimens are inherently heterogeneous, specimen-to-specimen variability cannot be quantitatively separated from the effects of lithology and proppant parameters using the present dataset. Accordingly, the comparisons reported in this study are interpreted as descriptive trends within the tested specimens and experimental conditions rather than as statistically validated population-level differences. Standard deviations and error bars are therefore not reported because replicate measurements under identical conditions are unavailable. Therefore, direct shale–limestone comparisons were restricted to the matched conditions at 5 and 7.5 kg/m2. The 10 kg/m2 tests were conducted only for shale and were used to evaluate the concentration effect within shale fractures rather than to infer lithological differences at this concentration.
Table 3.
Experimental design for propped fracture conductivity tests.
Before each experiment, the required amount of proppant was weighed according to the designed areal concentration and uniformly distributed between the upper and lower rock plates. After assembling and sealing the conductivity cell, the system was prepared according to the designed testing conditions.
After temperature stabilization, closure stress was gradually increased stepwise. Each stress level was maintained until the pressure response became stable, with a minimum holding time of 10 min. After reaching the target closure stress of 40 MPa, the stress was maintained for 50 h to evaluate long-term conductivity evolution under constant closure stress. Pressure difference and flow rate were recorded continuously, while fracture width was measured at the initial and final stages of the long-term test. After completion of the test, the system was cooled and unloaded, and the recorded pressure, flow, displacement, and time data were exported for further analysis.
3. Results and Analysis
3.1. Evolution Characteristics of Propped Fracture Conductivity
Propped fracture conductivity is a key parameter for evaluating the effectiveness of hydraulic fracturing in heterogeneous shale reservoirs. Under reservoir conditions, propped fractures experience continuous closure stress loading, resulting in proppant rearrangement, pack compaction, and fracture surface deformation. These processes reduce the effective fracture width and flow channels, leading to conductivity degradation. Therefore, the evolution of fracture conductivity under stress loading and long-term closure conditions was first analyzed, with fracture width serving as an intermediate parameter for conductivity calculation.
In this study, fracture width was obtained from the displacement measurement system of the conductivity cell. Because the primary objective was to evaluate the overall conductivity evolution of propped fractures, fracture width was used to calculate conductivity rather than as an independent evaluation parameter. Therefore, the following analysis focuses on conductivity variation under different closure stress and long-term loading conditions.
The conductivity variations in all 15 experimental groups under different closure stress conditions and long-term loading are summarized in Table 4. Overall, all propped fractures exhibited a similar stress-dependent response. With increasing closure stress, fracture conductivity decreased continuously, indicating pronounced stress sensitivity of the proppant-supported fracture system. The reduction mainly occurred during the initial stress-loading stage, which was attributed to rapid compaction of the proppant pack and adjustment of particle contact structures.
Table 4.
Summary of fracture conductivity evolution under different experimental conditions.
After reaching the target closure stress of 40 MPa, fracture conductivity continued to decrease during the 50h constant-stress loading period. However, the degradation rate gradually decreased compared with the initial stress-loading stage, suggesting that the proppant pack gradually approached a relatively stable state after early-stage compaction. The long-term conductivity reduction was mainly associated with continuous compression of the proppant layer, particle rearrangement, and progressive reduction in effective flow channels.
Although short-term conductivity reflects the immediate support capacity of propped fractures during stress loading, it cannot fully represent the long-term stability of fracture conductivity under reservoir conditions. In contrast, long-term conductivity incorporates the combined effects of stress sensitivity and time-dependent deformation, and therefore provides a more representative evaluation under the tested conditions of fracture support performance.
The experimental results show that both closure stress and loading duration exert a clear influence on fracture conductivity evolution under the tested conditions. The stress-dependent conductivity decline reflects the mechanical response of the proppant-supported structure, whereas the long-term degradation reflects the gradual evolution of the fracture support system. Therefore, long-term conductivity was selected as the primary evaluation parameter in the following sections to investigate the effects of lithology, proppant size, and proppant areal concentration. It should be noted that the following comparisons are based on single tests for each experimental condition. Therefore, the observed differences among lithologies and proppant conditions are discussed in terms of the magnitude and direction of the measured responses. Because replicate tests were not available, statistical significance is not assigned to the differences among individual cases, and part of the observed variability may originate from the inherent heterogeneity of the natural rock specimens.
3.2. Effect of Lithology on Long-Term Fracture Conductivity
Lithological heterogeneity is a critical factor controlling the long-term performance of propped fractures in interbedded shale reservoirs. Due to differences in mechanical stiffness, deformation capacity, and fracture surface response, shale and limestone fractures may exhibit different long-term conductivity behaviors even under identical proppant conditions. Therefore, shale and limestone experiments with the same proppant size and areal concentration were selected to evaluate the influence of lithology on long-term fracture conductivity.
First, the lithological effect under a low-proppant-concentration condition (5 kg/m2) was analyzed. Tests 1, 2, and 3 represent shale fractures supported by 70/140 mesh, 40/70 mesh, and 30/50 mesh proppants, respectively, whereas Tests 13, 14, and 15 correspond to limestone fractures under identical proppant conditions. The corresponding long-term conductivity results are summarized in Table 5.
Table 5.
Long-term fracture conductivity of shale and limestone fractures under a proppant concentration of 5 kg/m2.
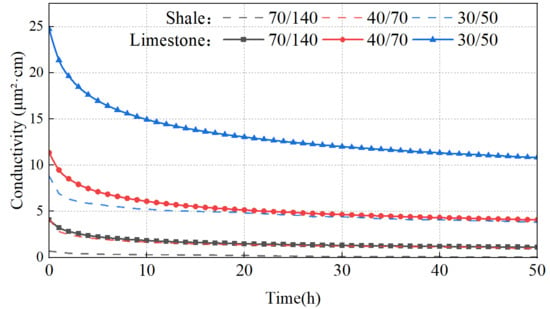
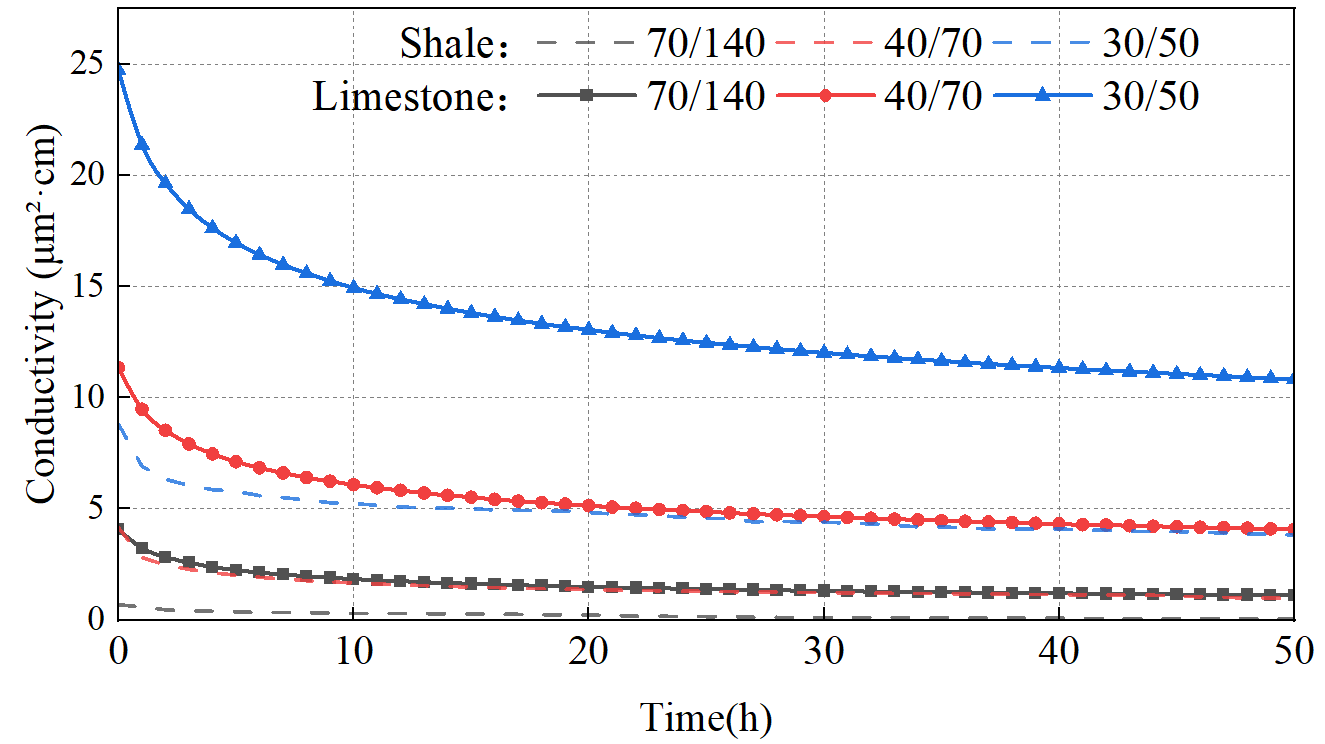
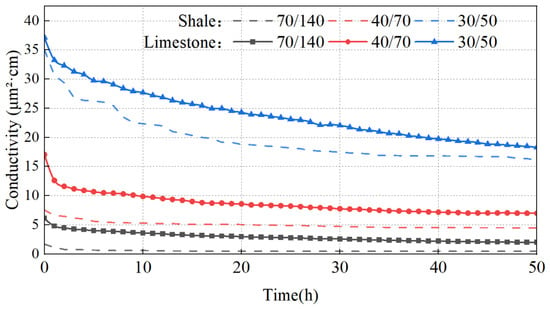
As shown in Table 5 and Figure 4, limestone fractures generally exhibited higher long-term conductivity than shale fractures under identical proppant conditions. However, the magnitude of lithological influence depended strongly on proppant size.
Figure 4.
Effect of lithology on long-term fracture conductivity at a proppant concentration of 5 kg/m2.
For 70/140 mesh proppants (Tests 1 and 13), the 50h conductivity of shale and limestone fractures was 0.07 and 1.11 μm2·cm, respectively. The conductivity of limestone fractures was approximately 16 times higher than that of shale fractures. In comparison, when 30/50 mesh proppants were used (Tests 3 and 15), the 50 h conductivity values increased to 3.83 and 10.83 μm2·cm, respectively, and the difference between the two lithologies decreased to approximately three times.
This result indicates that lithological effects are closely related to the stability of the proppant-supported structure. Under small-particle-size conditions, the supporting framework formed by proppant particles is relatively weak, and the effective flow channels are more susceptible to rock deformation. Due to the high plasticity and low stiffness of shale, prolonged closure stress promotes fracture surface deformation and proppant embedment, resulting in greater conductivity degradation. In contrast, limestone with higher stiffness provides a more stable fracture surface and better preserves the proppant-supported flow channels.
With increasing proppant size, the load-bearing capacity of the proppant pack is enhanced, reducing the influence of rock mechanical properties on conductivity evolution. For Tests 3 and 15, the conductivity retention rates of shale and limestone fractures reached 43.47% and 43.76%, respectively, indicating that strengthening the proppant framework can effectively reduce the long-term conductivity difference caused by lithological heterogeneity.
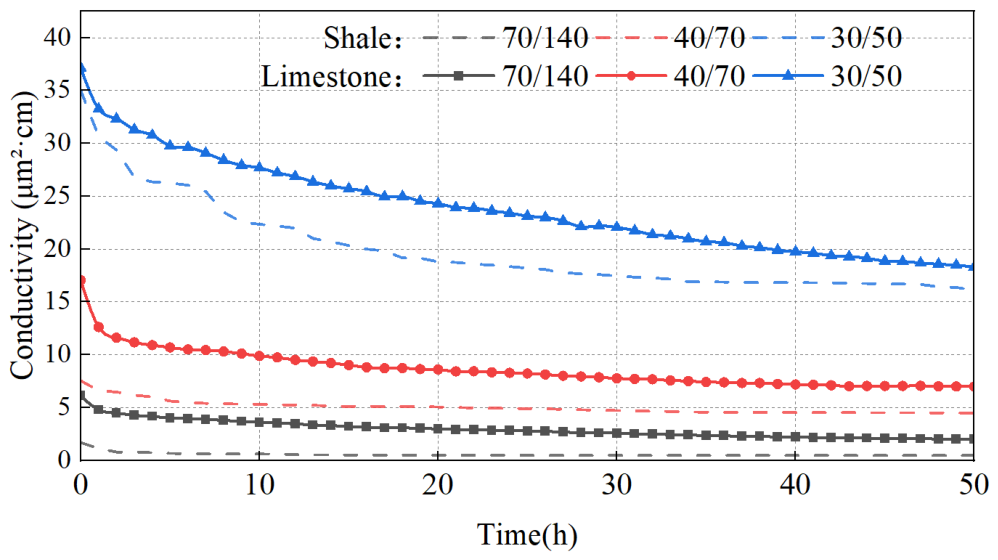
To further evaluate the influence of lithology under enhanced supporting conditions, experiments with a proppant concentration of 7.5 kg/m2 were compared. Tests 4–6 correspond to shale fractures, while Tests 10–12 represent limestone fractures with identical proppant parameters. The results are presented in Table 6 and Figure 5.
Table 6.
Long-term fracture conductivity of shale and limestone fractures under a proppant concentration of 7.5 kg/m2.
Figure 5.
Effect of lithology on long-term fracture conductivity at a proppant concentration of 7.5 kg/m2.
Compared with the 5 kg/m2 condition, increasing the proppant concentration markedly reduced the conductivity difference between shale and limestone fractures. For example, under the 30/50 mesh condition (Tests 6 and 12), the 50 h conductivity values of shale and limestone fractures were 16.07 and 18.30 μm2·cm, respectively, with a difference of only approximately 12%. Meanwhile, the conductivity retention rates were 45.93% and 49.27%, showing similar long-term stability.
The reduced lithological difference is mainly attributed to the formation of a thicker and more stable proppant-supported structure at higher proppant concentrations. The increased number of supporting particles improves load transfer within the proppant pack and reduces the influence of fracture surface deformation on effective flow channels. For highly plastic shale, enhanced proppant support partially compensates for the adverse effect of rock deformation, resulting in long-term conductivity approaching that of limestone fractures.
Overall, within the directly compared areal concentrations of 5 and 7.5 kg/m2, the measured lithological difference in long-term fracture conductivity was more pronounced under relatively weak proppant-support conditions and decreased as proppant size or areal concentration increased. These observations indicate that identical proppant parameters may produce different conductivity responses in shale and limestone intervals. Because limestone was not tested at 10 kg/m2, the lithological response at the highest investigated shale concentration remains outside the scope of the present comparison.
3.3. Effect of Proppant Size on Long-Term Fracture Conductivity
Proppant size directly controls the packing structure and effective flow space of propped fractures, and therefore plays an important role in determining long-term fracture conductivity. However, in interbedded shale reservoirs, the influence of proppant size may be affected by proppant concentration and lithological conditions due to differences in fracture surface deformation behavior. Therefore, based on the shale conductivity experiments, the effect of proppant size on long-term fracture conductivity under different proppant concentrations was systematically investigated.
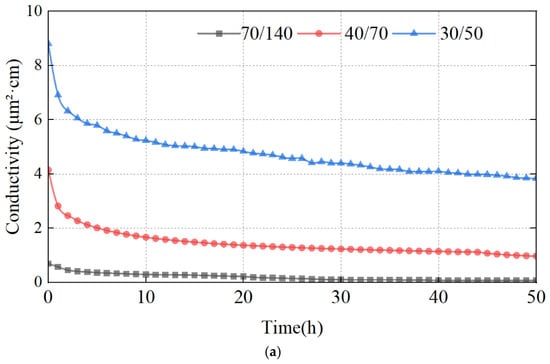
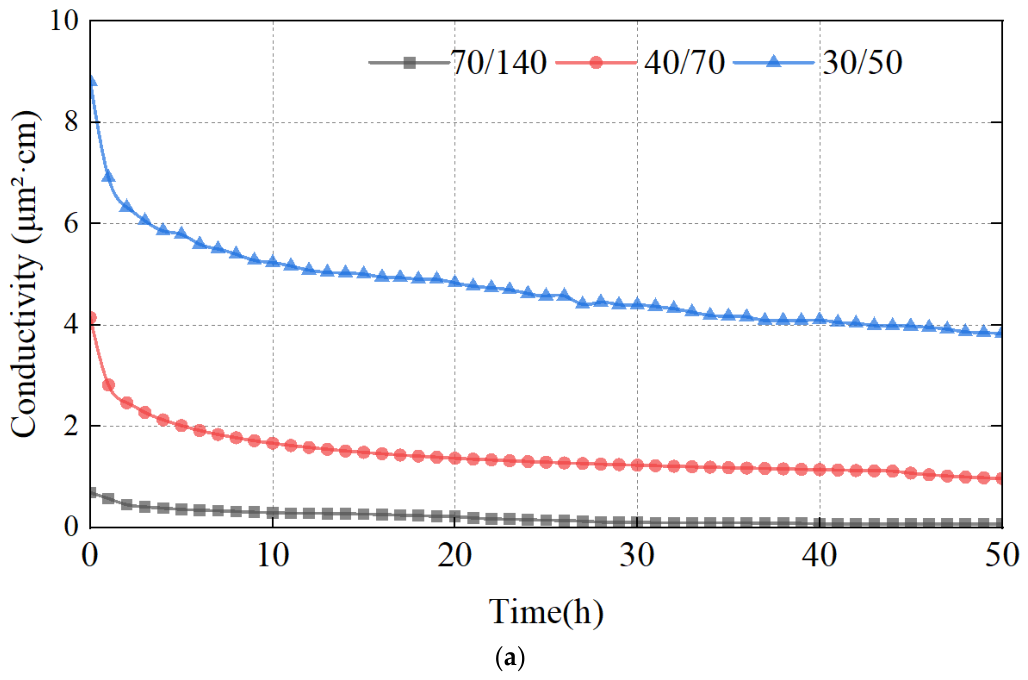
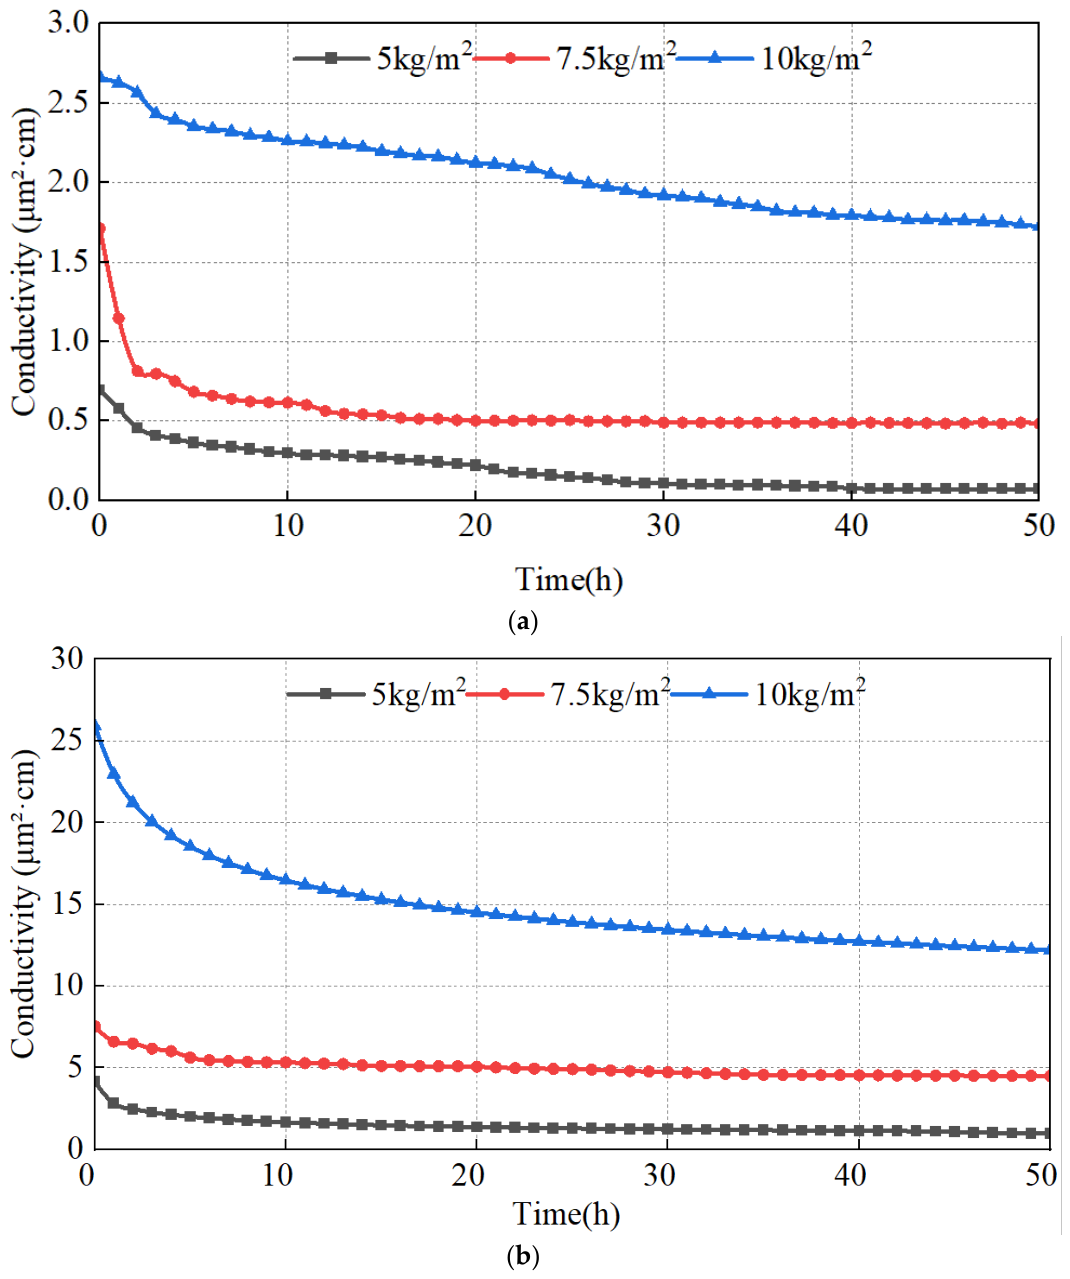
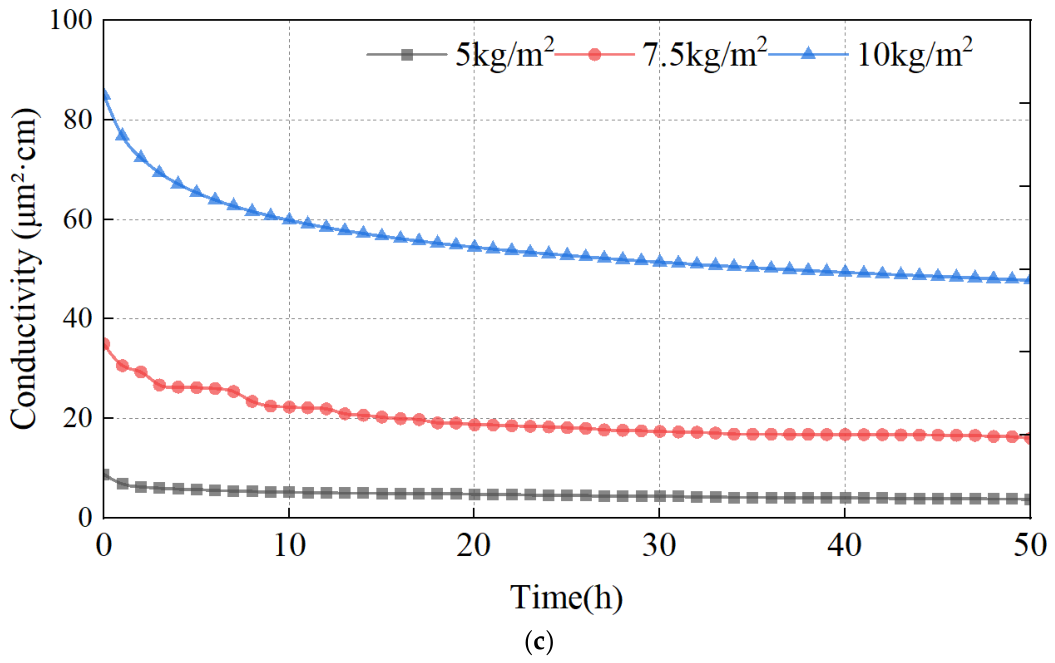
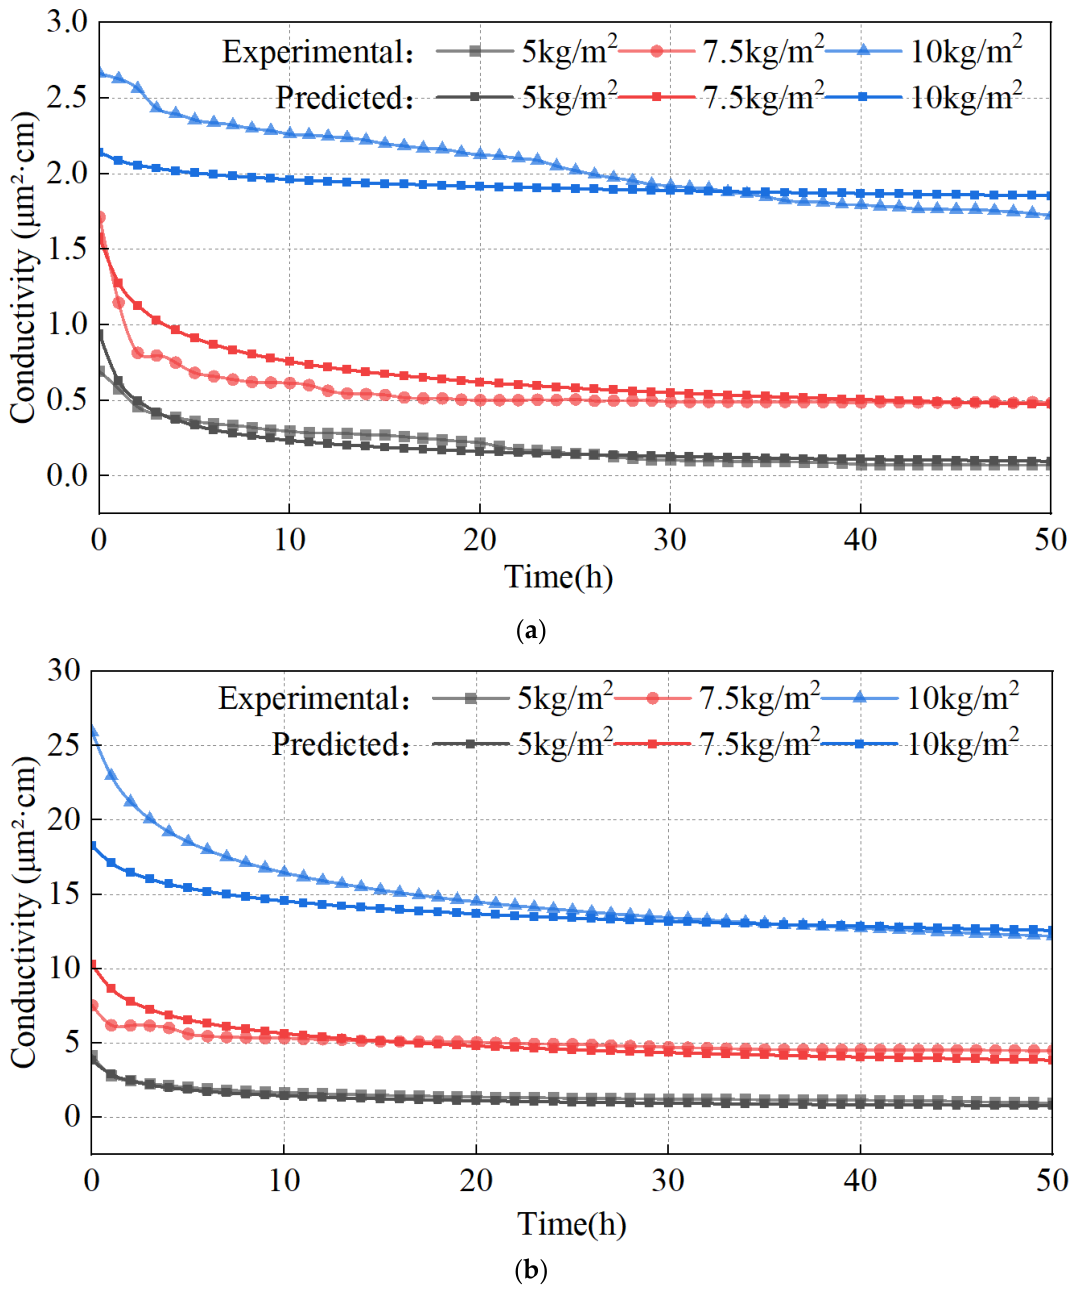
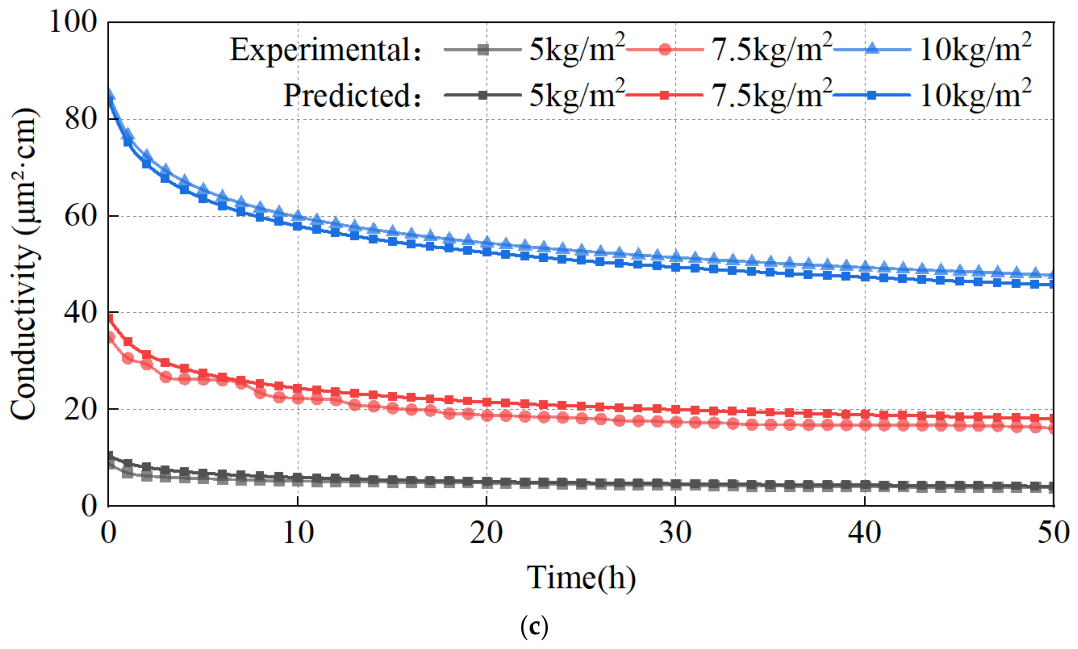
Figure 6 presents the evolution of shale fracture conductivity with different proppant sizes under various proppant concentrations. The results indicate that the influence of proppant size on long-term conductivity was strongly dependent on proppant concentration, and no single proppant size exhibited consistent superiority under all conditions.
Figure 6.
Effect of proppant size on long-term fracture conductivity of shale fractures under different proppant concentrations: (a) 5 kg/m2; (b) 7.5 kg/m2; (c) 10 kg/m2.
At a low proppant concentration of 5 kg/m2, larger proppants exhibited a clear advantage in maintaining long-term conductivity. Tests 1, 2, and 3 correspond to 70/140 mesh, 40/70 mesh, and 30/50 mesh proppants, respectively. After 50 h of loading, the corresponding fracture conductivities were 0.07, 0.97, and 3.83 μm2·cm, respectively. Increasing proppant size resulted in an increase of nearly one order of magnitude in long-term conductivity.
This behavior is attributed to the limited amount of proppant under low-concentration conditions. The supporting structure mainly depends on individual particles, and larger proppants can provide larger interparticle pore spaces while reducing particle contact density. Consequently, the degree of proppant pack compaction is reduced, allowing more effective flow channels to be preserved. Therefore, increasing proppant size is an effective approach for improving long-term conductivity under weak supporting conditions.
When the proppant concentration increased to 7.5 kg/m2, the effect of particle size became more complex. Tests 4, 5, and 6 correspond to 70/140 mesh, 40/70 mesh, and 30/50 mesh proppants, respectively. Their 50 h conductivities were 0.48, 4.49, and 16.07 μm2·cm. Although 30/50 mesh proppants exhibited the highest absolute conductivity, the 40/70 mesh proppant showed the highest conductivity retention rate (59.55%).
This result indicates that larger proppants do not always provide the best long-term stability under intermediate proppant concentrations. Although larger particles generate larger initial flow spaces, insufficient particle contact and reduced packing stability may weaken the load-bearing structure. In contrast, medium-sized proppants provide a better balance between pore space and structural stability, resulting in higher long-term conductivity retention.
With further increasing proppant concentration to 10 kg/m2, the advantage of larger proppants became dominant again. Tests 7, 8, and 9 correspond to 70/140 mesh, 40/70 mesh, and 30/50 mesh proppants, respectively. The 50 h conductivities were 1.72, 12.19, and 47.84 μm2·cm, with 30/50 mesh proppants showing the highest long-term conductivity.
At high proppant concentrations, the increased thickness of the proppant layer improves load transfer and reduces local stress concentration within the supporting structure. Under these conditions, larger proppants can fully utilize their advantages in generating larger pore spaces while avoiding severe compaction caused by insufficient support. Therefore, large-size proppants regain their superiority under high-concentration conditions.
Table 7 summarizes the long-term conductivity evolution of shale fractures with different proppant sizes and concentrations.
Table 7.
Effect of proppant size on long-term fracture conductivity of shale fractures under different proppant concentrations.
Overall, the effect of proppant size on long-term fracture conductivity is governed by the interaction between particle size and packing structure. Under low-proppant-concentration conditions, increasing particle size effectively improves conductivity by providing larger flow channels and stronger particle support. Under intermediate-concentration conditions, medium-sized proppants achieve better long-term stability due to the balance between pore space and mechanical stability. Under high-concentration conditions, large-sized proppants provide superior conductivity because of the formation of a more stable supporting framework.
Therefore, proppant size should not be selected independently of proppant concentration. Instead, an appropriate combination of particle size and proppant concentration is required to optimize the stability of the proppant-supported fracture system and maximize long-term conductivity.
3.4. Effect of Proppant Areal Concentration on Long-Term Conductivity of Shale Fractures
Proppant areal concentration determines the thickness and load-bearing capacity of the proppant-supported structure and is therefore an important parameter controlling long-term fracture conductivity. Increasing proppant concentration generally enhances fracture support capacity; however, its effectiveness may be limited by proppant size and packing characteristics. Therefore, the influence of proppant areal concentration on long-term fracture conductivity was evaluated using the shale experiments, for which three concentration levels of 5, 7.5, and 10 kg/m2 were available. The resulting concentration-dependent trends should therefore be interpreted specifically for the shale specimens investigated in this study.
Based on the shale conductivity experiments, three proppant sizes (70/140 mesh, 40/70 mesh, and 30/50 mesh) were selected to analyze the effect of proppant concentration. The conductivity evolution of Tests 1, 4, and 7; Tests 2, 5, and 8; and Tests 3, 6, and 9 represents the influence of proppant concentration for 70/140 mesh, 40/70 mesh, and 30/50 mesh proppants, respectively.
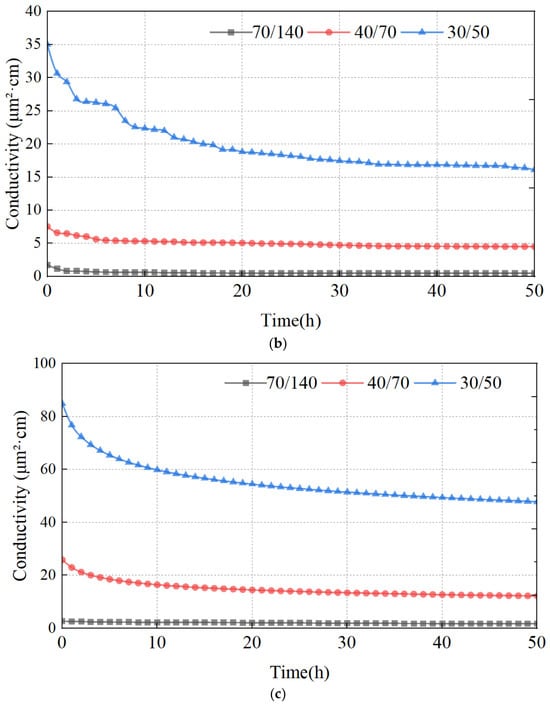
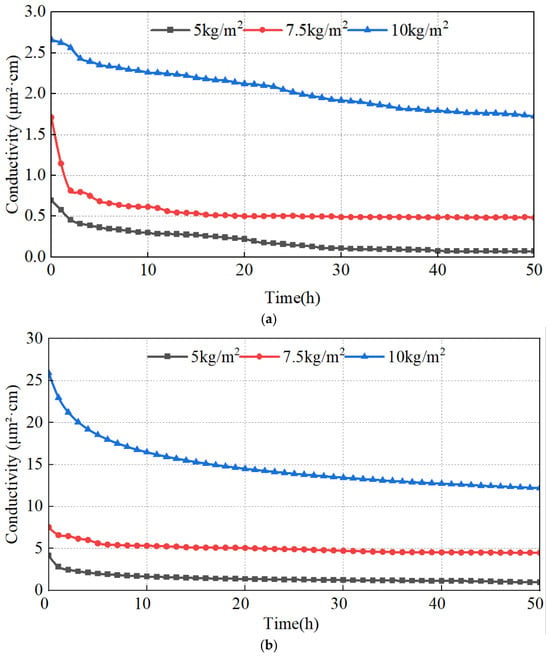
The long-term conductivity results are summarized in Table 8. The conductivity evolution under different proppant areal concentrations is further illustrated in Figure 7. Overall, increasing proppant areal concentration improved long-term fracture conductivity for all proppant sizes, but the magnitude of improvement varied substantially with particle size.
Table 8.
Effect of proppant areal concentration on long-term fracture conductivity under different proppant sizes.
Figure 7.
Effect of proppant areal concentration on long-term fracture conductivity under different proppant sizes: (a) 70/140 mesh; (b) 40/70 mesh; (c) 30/50 mesh.
For 70/140 mesh proppants (Tests 1, 4, and 7), increasing proppant concentration from 5 kg/m2 to 10 kg/m2 increased the 50h conductivity from 0.07 to 1.72 μm2·cm. Although the conductivity increased substantially, the absolute conductivity remained much lower than that of larger proppant sizes under equivalent concentration conditions. This indicates that increasing proppant concentration can improve the supporting capacity of small-size proppants, but cannot completely compensate for the limitation caused by insufficient particle size.
The relatively low conductivity of 70/140 mesh proppants is mainly attributed to their small particle diameter and high contact density within the proppant pack. Under closure stress, a larger number of particle contacts promote pack compaction and reduce the effective flow channels. Therefore, increasing proppant concentration alone is insufficient to overcome the structural limitations of small-size proppants.
For 40/70 mesh proppants (Tests 2, 5, and 8), increasing proppant concentration produced a more pronounced improvement in long-term conductivity. The 50h conductivity increased from 0.97 μm2·cm at 5 kg/m2 to 4.49 μm2·cm at 7.5 kg/m2 and further increased to 12.19 μm2·cm at 10 kg/m2. Compared with 70/140 mesh proppants, the intermediate particle size provides a better balance between pore space and structural stability.
However, the conductivity retention rate did not continuously increase with proppant concentration. The 7.5 kg/m2 condition exhibited the highest retention rate, indicating that excessive proppant concentration may increase particle contact and compaction within the proppant pack. Therefore, an appropriate proppant concentration is required to achieve a balance between conductivity enhancement and structural stability.
For 30/50 mesh proppants (Tests 3, 6, and 9), increasing proppant concentration resulted in the most substantial increase in absolute conductivity. The 50h conductivity increased from 3.83 μm2·cm at 5 kg/m2 to 16.07 μm2·cm at 7.5 kg/m2 and reached 47.84 μm2·cm at 10 kg/m2. The large particle size provides larger interconnected pore spaces, and the increased proppant layer thickness further improves the stability of the supporting structure under closure stress.
However, the relationship between proppant concentration and conductivity enhancement was not directly proportional within the investigated range. Although increasing the concentration from 7.5 to 10 kg/m2 produced a larger absolute conductivity increase than that from 5 to 7.5 kg/m2, the additional conductivity gain should be evaluated together with the increased amount of proppant placement. This indicates that higher proppant concentration can continuously enhance absolute conductivity for large-size proppants, while the efficiency of conductivity improvement per unit increase in proppant concentration may vary with the tested range.
Overall, the influence of proppant areal concentration on long-term fracture conductivity is strongly dependent on proppant size. Increasing concentration is effective for improving fracture conductivity, but the improvement is restricted by the initial supporting structure formed by the selected proppant size. Small-size proppants cannot achieve high conductivity even at increased concentrations, whereas large-size proppants can fully utilize the advantages of higher concentrations. Therefore, proppant concentration should not be optimized independently; instead, a matched design considering both proppant size and concentration is required to achieve stable long-term fracture conductivity.
3.5. Lithology-Dependent Empirical Correlations for Long-Term Fracture Conductivity
The experimental results presented above demonstrate that long-term fracture conductivity is influenced by multiple factors, including lithology, proppant size, proppant areal concentration, and closure time. Because shale and limestone exhibited different conductivity responses under identical proppant conditions, a single universal correlation may not adequately describe the conductivity evolution of different lithological fractures.
In this study, lithology-dependent empirical correlations were therefore developed separately for shale and limestone fractures. It should be noted that the available experimental matrix was not completely identical between the two lithologies. Direct shale–limestone comparisons were conducted under matched proppant conditions of 5 and 7.5 kg/m2, whereas the 10 kg/m2 condition was only investigated for shale fractures. Therefore, the proposed correlations are intended to quantitatively describe the conductivity evolution within the corresponding experimental ranges of each lithology rather than to establish a generalized coupling relationship beyond the tested conditions.
To balance model accuracy and mathematical simplicity, a unified functional form was adopted for both lithologies. The correlation considers the effects of proppant areal concentration, experimentally assigned representative proppant diameter, and closure time, while allowing lithological differences to be represented through independent regression coefficients.
Before regression analysis, all variables involved in logarithmic and power-law transformations were nondimensionalized to ensure dimensional consistency. The normalized variables were defined as follows:
The reference quantities , , , and were selected as 1 μm2·cm, 7.5 kg/m2, 0.30 mm, and 1 h, respectively. The reference proppant areal concentration corresponds to the intermediate level of the experimental design and is included in both shale and limestone datasets. The reference particle diameter corresponds to the intermediate proppant size level (40/70 mesh) among the three investigated proppant sizes. These reference values were introduced only for nondimensionalization and were not treated as regression parameters.
The general form of the empirical correlation is expressed as:
where , , , and are regression coefficients associated with the conductivity magnitude, while , , , and are regression coefficients associated with the time-dependent conductivity evolution.
The logarithmic component describes the influence of proppant placement parameters on the conductivity magnitude, whereas the time-dependent power-law term characterizes the long-term conductivity attenuation under constant closure stress. The inclusion of the interaction term between proppant concentration and particle diameter allows the correlation to describe the combined effects of proppant placement parameters on conductivity evolution.
The coefficients for shale and limestone fractures were independently determined using the corresponding experimental datasets. To avoid evaluating model applicability solely based on calibration accuracy, the robustness of the selected functional form was further assessed using leave-one-condition-out cross-validation (LOCO-CV), as described in Section 3.5.3.
3.5.1. Empirical Correlation for Shale Fractures
Based on the nine shale experimental conditions, an empirical correlation was developed to describe the long-term evolution of fracture conductivity under different proppant size and areal concentration conditions. The shale dataset included three proppant sizes (70/140 mesh, 40/70 mesh, and 30/50 mesh), corresponding to particle diameters of 0.15 mm, 0.30 mm, and 0.45 mm, respectively, and three proppant areal concentrations (5, 7.5, and 10 kg/m2).
The general functional form described in Equation (4) was adopted, and the coefficients were determined by nonlinear regression using the complete shale experimental dataset. During regression, the measured fracture conductivity values under different closure times were used as the dependent variable, while the dimensionless proppant areal concentration (), dimensionless particle diameter (), and dimensionless closure time () were used as independent variables. The regression process aims to obtain a simplified correlation capable of describing the conductivity evolution characteristics within the investigated experimental range.
For shale fractures, the obtained empirical correlation is expressed as:
where represents the dimensionless fracture conductivity of shale fractures. The parameters , , and are defined in Equation (3). The coefficients in Equation (5) were obtained exclusively from the shale experimental dataset and were not adjusted using the limestone data.
The exponential term in Equation (5) represents the conductivity magnitude under different proppant placement conditions, whereas the power-law term describes the time-dependent conductivity attenuation during long-term closure. The interaction terms between proppant concentration and particle diameter were retained because the experimental results showed that the influence of proppant size on conductivity evolution varied with proppant areal concentration.
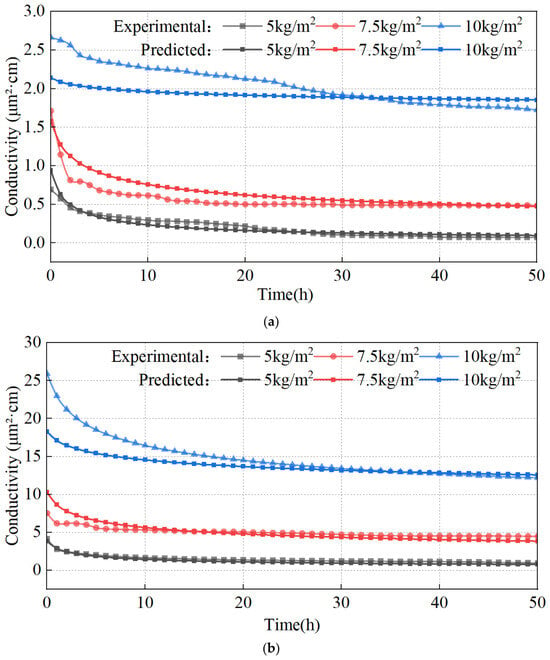
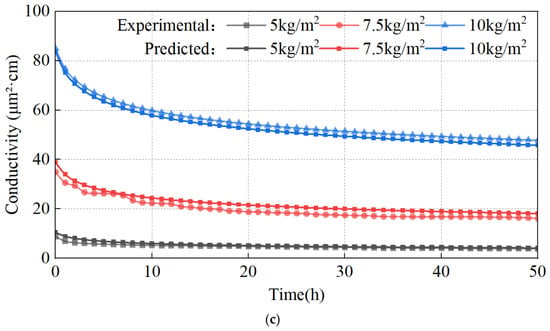
Figure 8 presents the comparison between the experimental conductivity evolution curves and the calculated results from Equation (5) for all shale fracture conditions. The calculated curves capture the overall conductivity variation caused by different proppant sizes and areal concentrations, including the differences in initial conductivity and the subsequent decline trend during long-term closure.
Figure 8.
Comparison between experimental and calculated long-term fracture conductivity of shale fractures: (a) 70/140 mesh; (b) 40/70 mesh; (c) 30/50 mesh.
3.5.2. Empirical Correlation for Limestone Fractures
Compared with shale fractures, limestone fractures exhibited different conductivity evolution characteristics under identical proppant conditions. Therefore, an independent empirical correlation was developed based on the limestone experimental dataset to describe the long-term conductivity evolution of limestone fractures.
The limestone dataset consisted of six experimental conditions, including two proppant areal concentrations (5 and 7.5 kg/m2) and three proppant size levels (70/140 mesh, 40/70 mesh, and 30/50 mesh). In the empirical correlation, the corresponding particle diameters were represented by 0.15 mm, 0.30 mm, and 0.45 mm, respectively. These values represent the actual particle size levels of the proppants used in the experiments and were introduced as fixed input parameters rather than regression variables. The dimensionless variables , , and were calculated according to Equation (3). The same reference values were used for shale and limestone correlations to ensure consistency between different lithologies.
The same functional form as the shale correlation was adopted for limestone fractures. The coefficients were determined through nonlinear regression using the complete limestone experimental dataset, where the measured fracture conductivity values were used as the dependent variable and the dimensionless proppant areal concentration, particle diameter, and closure time were used as independent variables. The resulting empirical correlation for limestone fractures is expressed as:
where represents the dimensionless fracture conductivity of limestone fractures. The parameters , , and are defined in Equation (3). The coefficients in Equation (6) were obtained only from the limestone experimental data and were independently determined from the shale correlation.
The exponential term represents the influence of proppant placement characteristics on the conductivity magnitude, while the time-dependent power-law term describes the conductivity decline during long-term closure. Compared with shale fractures, the fitted coefficients of limestone fractures exhibit different responses to proppant concentration and particle diameter. These differences describe the distinct conductivity evolution characteristics observed experimentally for different lithologies within the investigated conditions.
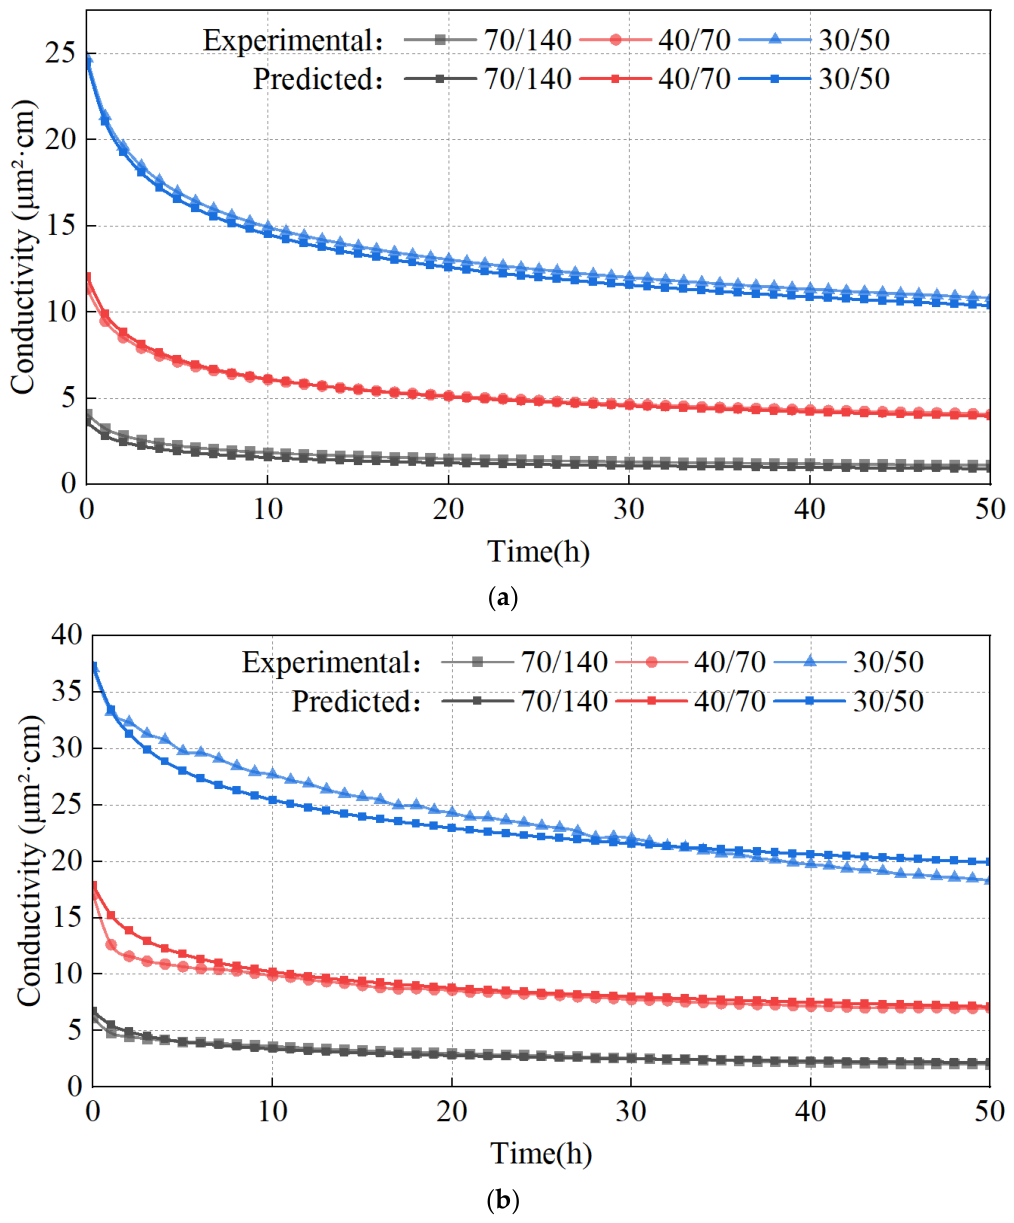
Figure 9 presents the comparison between the experimental conductivity evolution curves and the calculated results obtained from Equation (6) for all limestone fracture conditions. The calculated curves capture the general variation trend of limestone fracture conductivity under different proppant size and areal concentration conditions, including the initial conductivity differences and the subsequent conductivity reduction during long-term closure.
Figure 9.
Comparison between experimental and calculated long-term fracture conductivity of limestone fractures: (a) 5 kg/m2; (b) 7.5 kg/m2.
It should be noted that the limestone correlation was established using only six independent experimental conditions because the available limestone specimens limited the experimental matrix to 5 and 7.5 kg/m2 proppant concentrations. Therefore, the limestone correlation should be interpreted as an empirical description within the investigated parameter range, and its extrapolation beyond the tested conditions requires further experimental verification.
3.5.3. Leave-One-Condition-Out Cross-Validation and Error Assessment of Empirical Correlations
To assess the robustness of the empirical correlations beyond calibration fitting, leave-one-condition-out cross-validation (LOCO-CV) was conducted separately for the shale and limestone datasets. For shale, one complete conductivity-time curve corresponding to one independent experimental condition was excluded in each validation fold, while the remaining eight experimental conditions were used to recalibrate the coefficients of the same functional form. The recalibrated correlation was subsequently applied to the excluded condition. This procedure was repeated nine times so that each shale condition served once as the validation condition. For limestone, the same procedure was repeated six times, with five conditions used for calibration and one condition used for validation in each fold.
The correlations obtained in individual folds were used only for cross-validation. After the robustness of the functional form had been assessed, all experimental conditions for each lithology were used to determine the final coefficients reported above. The out-of-fold calculations from all validation folds were pooled and evaluated using the cross-validated coefficient of determination (), root-mean-square error (RMSE), and mean absolute error (MAE). The resulting model-performance metrics are summarized in Table 9.
Table 9.
Calibration and leave-one-condition-out cross-validation performance of the empirical correlations.
Because fracture measured conductivity values span substantially different magnitudes among the experimental conditions, the pooled RMSE and MAE represent overall absolute-error measures across the complete conductivity range and should not be interpreted as uniform relative errors for every individual condition. Residual analysis of the out-of-fold results further showed condition-dependent deviations, with relatively larger discrepancies occurring for several held-out boundary conditions and during portions of the time-dependent degradation process. These observations reflect the limited number of independent experimental conditions and support the use of the proposed relationships as empirical correlations within the investigated parameter ranges rather than as universally predictive models.
where is the experimentally measured conductivity of the -th out-of-fold data point; is the corresponding conductivity calculated from the correlation calibrated without the experimental condition containing that data point; is the mean of all experimental conductivity values included in the pooled out-of-fold dataset; and is the total number of out-of-fold observations.
The calibration and cross-validation performance of the two lithology-dependent empirical correlations is summarized in Table 9.
As shown in Table 9, the calibration values were 0.995 and 0.990 for shale and limestone, respectively, while the pooled LOCO-CV values remained at 0.977 and 0.865. The corresponding CV RMSE values were 2.58 and 2.92 μm2·cm, and the CV MAE values were 1.57 and 1.95 μm2·cm, respectively. The decrease from calibration to cross-validated was limited for both lithologies, indicating that the simplified functional form retained the principal conductivity trends when complete experimental conditions were excluded from model calibration.
It should be noted that conductivity spans substantially different magnitudes among the experimental conditions. Therefore, the pooled RMSE and MAE characterize the overall absolute deviations across the complete conductivity range and should not be interpreted as uniform relative errors for every individual experimental condition. In particular, a small absolute deviation may correspond to a relatively larger percentage deviation for low-conductivity conditions. Accordingly, the proposed relationships are treated as empirical correlations applicable within the tested parameter ranges rather than as universally predictive models. Residuals of the cross-validated results were additionally examined, and no obvious monotonic drift with closure time was observed from the residual examination. Nevertheless, because the measured conductivity spans a wide range among different experimental conditions, larger absolute residuals may occur for high-conductivity cases, while relatively larger percentage deviations may occur for low-conductivity cases.
Therefore, the error metrics in Table 9 are interpreted as overall measures of model performance, and the proposed relationships are retained as empirical correlations within the investigated parameter ranges rather than as universally predictive models.
3.6. Discussion
The present study demonstrates that the long-term conductivity evolution of propped fractures in interbedded shale reservoirs is jointly influenced by lithology, proppant size, proppant areal concentration, and closure time. The higher long-term conductivity observed in limestone fractures compared with shale fractures under matched proppant conditions is consistent with the different mechanical responses of the two lithologies. The relatively higher deformability of highly plastic shale may contribute to greater reduction in effective flow channels during long-term loading. However, direct measurements of proppant embedment, particle rearrangement, and fracture surface deformation were not conducted in this study. Therefore, these mechanisms are considered possible explanations for the observed conductivity evolution rather than directly verified processes.
The effects of lithology and proppant parameters observed in this study are generally consistent with previous investigations. Katende et al. [30] reported that variations in rock mechanical properties significantly influenced proppant embedment behavior and conductivity degradation in shale formations. Zhang et al. [9] also demonstrated that proppant embedment could reduce effective fracture width and decrease fracture conductivity. Compared with these studies focusing mainly on shale formations, the present work further reveals that lithological contrast between shale and limestone can lead to different long-term conductivity responses under identical proppant conditions. In addition, Cheng et al. [29] highlighted the importance of time-dependent deformation in long-term conductivity prediction. The empirical correlations developed in this study provide a simplified description of conductivity evolution considering lithology, proppant size, areal concentration, and loading time, while avoiding overinterpretation beyond the investigated conditions.
Several limitations should be considered when applying the results of this study. First, each experimental condition was tested once because of the limited availability of natural rock plates; therefore, the observed differences represent experimental trends rather than statistically validated differences. Second, limestone experiments were conducted only at proppant areal concentrations of 5 and 7.5 kg/m2, and the lithological response at 10 kg/m2 requires further investigation. Third, the proposed empirical correlations were established based on experiments conducted at 80 °C, 40 MPa closure stress, and 50 h loading duration. Although the leave-one-condition-out cross-validation results demonstrate the robustness of the correlations within the tested dataset, additional validation under longer loading periods and different reservoir conditions is required before field-scale application. Within the investigated conditions, the results highlight the necessity of considering lithological heterogeneity in proppant selection and fracture conductivity evaluation.
4. Conclusions
In this study, fracture conductivity experiments were conducted using shale and limestone core plates to investigate the long-term conductivity evolution of propped fractures in interbedded shale reservoirs. The effects of lithology, proppant size, and proppant areal concentration on short- and long-term fracture conductivity were systematically analyzed, and lithology-dependent empirical models were developed. The main conclusions are as follows:
(1) Propped fracture conductivity exhibits strong stress sensitivity and time dependence. All experimental cases showed a pronounced reduction in conductivity as closure stress increased from 10 MPa to 40 MPa. Under constant closure stress of 40 MPa for 50 h, conductivity further decreased, which may be associated with continuous proppant pack compaction, particle rearrangement, and reduction in effective flow space. Therefore, long-term conductivity provides a more reliable evaluation of fracture support effectiveness than initial conductivity for heterogeneous interbedded reservoirs.
(2) The experimental comparisons indicate a clear lithology-dependent difference in long-term fracture conductivity under the investigated conditions. Under the directly matched conditions at areal concentrations of 5 and 7.5 kg/m2, limestone fractures generally exhibited higher absolute long-term conductivity than shale fractures. The measured difference between the two lithologies tended to be larger under smaller proppant sizes and lower areal concentration. Because no limestone tests were performed at 10 kg/m2, the lithological response at this concentration cannot be inferred from the present dataset.
(3) For the shale fractures, increasing proppant size and areal concentration generally increased the 50 h absolute conductivity, but the magnitude of the response depended on their combination. The complete concentration series from 5 to 10 kg/m2 was available only for shale; therefore, these concentration-dependent observations should not be generalized to limestone fractures without additional experimental evidence.
(4) Simplified lithology-dependent empirical correlations were established to quantitatively describe the effects of proppant size, areal concentration, and closure time on fracture conductivity within the respective experimental matrices. The shale and limestone correlations achieved calibration R2 values of 0.995 and 0.990, respectively, while leave-one-condition-out cross-validation yielded R2 values of 0.977 and 0.865, respectively. These correlations therefore provide compact empirical descriptions of the experimental trends within the tested parameter ranges, while the limestone correlation should be interpreted with caution due to the limited number of independent experimental conditions. Further validation under longer-term loading durations and reservoir-scale conditions is required before applying these correlations for field-scale conductivity prediction.
(5) The present results demonstrate the importance of considering lithology when selecting proppant parameters for interbedded shale reservoirs. Within the tested parameter range, identical proppant conditions produced different conductivity responses in shale and limestone fractures. These findings support lithology-adaptive proppant design, while the response of limestone fractures at higher areal concentrations, including 10 kg/m2, requires further investigation before broader optimization rules can be established. These recommendations are applicable within the investigated conditions of 80 °C, 40 MPa closure stress, and 50 h loading duration.
Author Contributions
J.L.: Writing—review & editing, writing—original draft, validation, software, methodology, investigation, formal analysis. W.X.: Writing—review & editing, writing—original draft, validation, software, investigation, data curation. Z.B.: Software, methodology, conceptualization. S.Q.: Software, methodology, formal analysis. F.J.: Supervision, resources, investigation. All authors have read and agreed to the published version of the manuscript.
Funding
Hubei Provincial Natural Science Foundation (2022CFB690); the Open Foundation (UOG2024-03) of Cooperative Innovation Center of Unconventional Oil and Gas, Yangtze University (Ministry of Education & Hubei Province); the Open Foundation (YQZC202302) of Hubei Key Laboratory of Oil and Gas Drilling and Production Engineering (Yangtze University).
Data Availability Statement
Data are contained within the article.
Acknowledgments
The authors would like to thank the technical staff of Yangtze University for their assistance during the experimental work and data analysis.
Conflicts of Interest
Author Zhenwei Bai was employed by the China United Coalbed Methane (Shanxi) Co., Ltd. Author Shun Qiu was employed by the Eighth Oil Production Plant of PetroChina Changqing Oilfield Company. Author Feng Jiang was employed by CNOOC China Limited. The remaining authors declare that the research was conducted in the absence of any commercial or financial relationships that could be construed as potential conflicts of interest.
References
- Shu, Y.; Bao, H.; Zheng, Y.; Chen, M.; Lu, Y.; Liu, H.; Peng, W.; Zhou, L.; Ma, Y.; Wen, Y.; et al. Lithofacies Types, Assemblage Characteristics, and Sedimentary Evolution Model of Lacustrine Shale in Dongyuemiao Formation of Fuxing Area, Front. Earth Sci. 2021, 9, 772581. [Google Scholar] [CrossRef] [Scilit]
- Li, P.; Liu, Z.; Nie, H.; Liang, X.; Li, Q.; Wang, P. Heterogeneity Characteristics of Lacustrine Shale Oil Reservoir Under the Control of Lithofacies: A Case Study of the Dongyuemiao Member of Jurassic Ziliujing Formation, Sichuan Basin. Front. Earth Sci. 2021, 9, 736544. [Google Scholar] [CrossRef] [Scilit]
- Chapman, M.; Palisch, T. Fracture conductivity—Design considerations and benefits in unconventional reservoirs. J. Pet. Sci. Eng. 2014, 124, 407–415. [Google Scholar] [CrossRef] [Scilit]
- Much, M.G.; Penny, G.S. Long-Term Performance of Proppants Under Simulated Reservoir Conditions. In Proceedings of the SPE/DOE Joint Symposium on Low Permeability Reservoirs, Dallas, TX, USA, 27–30 September 1987; SPE: Richardson, TX, USA, 1987; p. SPE-16415-MS. [Google Scholar] [CrossRef]
- Penny, G.S. An Evaluation of the Effects of Environmental Conditions and Fracturing Fluids Upon the Long-Term Conductivity of Proppants. In Proceedings of the SPE Annual Technical Conference and Exhibition, Dallas, TX, USA, 27–30 September 1987; SPE: Richardson, TX, USA, 1987; p. SPE-16900-MS. [Google Scholar] [CrossRef]
- Volk, L.J.; Raible, C.J.; Carroll, H.B.; Spears, J.S. Embedment of High Strength Proppant into Low-Permeability Reservoir Rock. In Proceedings of the SPE/DOE Low Permeability Gas Reservoirs Symposium, Denver, CO, USA, 27–29 May 1981; SPE: Richardson, TX, USA, 1981; p. SPE-9867-MS. [Google Scholar] [CrossRef]
- Cooke, C.J. Conductivity of Fracture Proppants in Multiple Layers. J. Pet. Technol. 1973, 25, 1101–1107. [Google Scholar] [CrossRef] [Scilit]
- Wen, Q.; Zhang, S.; Wang, L.; Liu, Y.; Li, X. The effect of proppant embedment upon the long-term conductivity of fractures. J. Pet. Sci. Eng. 2007, 55, 221–227. [Google Scholar] [CrossRef] [Scilit]
- Zhang, J.; Ouyang, L.; Zhu, D.; Hill, A. Experimental and numerical studies of reduced fracture conductivity due to proppant embedment in the shale reservoir. J. Pet. Sci. Eng. 2015, 130, 37–45. [Google Scholar] [CrossRef] [Scilit]
- Chen, M.; Zhang, S.; Liu, M.; Ma, X.; Zou, Y.; Zhou, T.; Li, N.; Li, S. Calculation method of proppant embedment depth in hydraulic fracturing. Pet. Explor. Dev. 2018, 45, 159–166. [Google Scholar] [CrossRef] [Scilit]
- Tang, Y.; Ranjith, P.G.; Perera, M.S.; Rathnaweera, T.D. Influences of Proppant Concentration and Fracturing Fluids on Proppant-Embedment Behavior for Inhomogeneous Rock Medium: An Experimental and Numerical Study. SPE Prod. Oper. 2018, 33, 666–678. [Google Scholar] [CrossRef] [Scilit]
- Fredd, C.N.; McConnell, S.B.; Boney, C.L.; England, K.W. Experimental Study of Fracture Conductivity for Water-Fracturing and Conventional Fracturing Applications. SPE J. 2001, 6, 288–298. [Google Scholar] [CrossRef] [Scilit]
- Brannon, H.D.; Starks, T.R. The Impact of Effective Fracture Area and Conductivity on Fracture Deliverability and Stimulation Value. In Proceedings of the SPE Annual Technical Conference and Exhibition, Denver, CO, USA, 21–24 September 2008; SPE: Richardson, TX, USA, 2008; p. SPE-116057-MS. [Google Scholar] [CrossRef] [Scilit]
- Guo, J.; Yang, R.; Zhang, T.; Lu, Q.; Mu, K. Experimental and numerical investigations of proppant pack effect on fracture conductivity of channel fracturing. Energy Sci. Amp Eng. 2020, 8, 3995–4013. [Google Scholar] [CrossRef] [Scilit]
- Wang, J.; Huang, Y.; Zhou, F.; Liang, X. The influence of proppant breakage, embedding, and particle migration on fracture conductivity. J. Pet. Sci. Eng. 2020, 193, 107385. [Google Scholar] [CrossRef] [Scilit]
- Liu, H.; Bedrikovetsky, P.; Yuan, Z.; Liu, J.; Liu, Y. An optimized model of calculating optimal packing ratio for graded proppant placement with consideration of proppant embedment and deformation. J. Pet. Sci. Eng. 2021, 196, 107703. [Google Scholar] [CrossRef] [Scilit]
- Wang, J.; Xiong, Y.; Jiao, G.; Lei, D. Assessment of Long-Term Proppant Conductivity. Front. Energy Res. 2022, 10, 813571. [Google Scholar] [CrossRef] [Scilit]
- Xiang, Z.; Ding, Y.; Ao, X.; Zhong, Z.; Li, Z.; Xiao, H.; Chen, Z.; Xiao, Q.; Ma, X. Experimental Study on Fracturing Fracture Deformation Mechanism of Shale Reservoir. Front. Energy Res. 2022, 9, 813978. [Google Scholar] [CrossRef] [Scilit]
- Dilireba, T.; Wang, J. Effect of Proppant Damages on Fracture Conductivity and Long-Term Recovery in Shale Gas Reservoirs. Energy Fuels 2024, 38, 11695–11705. [Google Scholar] [CrossRef] [Scilit]
- Liu, Y.; Wu, L.; Guo, J.; He, S.; Wu, Y. Model for fracture conductivity considering particle size redistribution caused by proppant crushing. Geoenergy Sci. Eng. 2024, 240, 213081. [Google Scholar] [CrossRef] [Scilit]
- Yin, B.; Zhang, Y.; Lou, Y.; Liu, S. Damage mechanism of proppant and conductivity reduction post fracturing in unconventional reservoirs. Fuel 2025, 380, 133086. [Google Scholar] [CrossRef] [Scilit]
- Mack, D.J.; Myers, R.R. Proppants: Is Bigger Better or is Placement the Key? In Proceedings of the SPE Eastern Regional Meeting; SPE: Richardson, TX, USA, 2001. [Google Scholar] [CrossRef]
- Ding, X.; Zhang, F.; Zhang, G. Modelling of time-dependent proppant embedment and its influence on tight gas production. J. Nat. Gas. Sci. Eng. 2020, 82, 103519. [Google Scholar] [CrossRef] [Scilit]
- Fan, M.; Li, Z.; Han, Y.; Teng, Y.; Chen, C. Experimental and Numerical Investigations of the Role of Proppant Embedment on Fracture Conductivity in Narrow Fractures (includes associated Errata). SPE J. 2021, 26, 324–341. [Google Scholar] [CrossRef] [Scilit]
- Fan, M.; Han, Y.; Chen, C. Thermal–Mechanical Modeling of a Rock/Proppant System to Investigate the Role of Shale Creep on Proppant Embedment and Fracture Conductivity. Rock Mech. Rock Eng. 2021, 54, 6495–6510. [Google Scholar] [CrossRef] [Scilit]
- Masłowski, M.; Labus, M. Preliminary Studies on the Proppant Embedment in Baltic Basin Shale Rock. Rock Mech. Rock Eng. 2021, 54, 2233–2248. [Google Scholar] [CrossRef] [Scilit]
- Bandara, K.M.A.S.; Ranjith, P.G.; Haque, A.; Wanniarachchi, W.A.M.; Zheng, W.; Rathnaweera, T.D. An experimental investigation of the effect of long-term, time-dependent proppant embedment on fracture permeability and fracture aperture reduction. Int. J. Rock Mech. Min. Sci. 2021, 144, 104813. [Google Scholar] [CrossRef] [Scilit]
- Alramahi, B.; Sundberg, M.I. Proppant Embedment And Conductivity of Hydraulic Fractures In Shales. In Proceedings of the 46th U.S. Rock Mechanics/Geomechanics Symposium; American Rock Mechanics Association (ARMA): Alexandria, VA, USA, 2012. [Google Scholar]
- Cheng, Q.; Zhou, S.; Li, B.; Pan, Z.; Liu, D.; Yan, D. Integrating Embedment and Creep Behavior for Multisize Proppant in Shale: Conceptual Model and Validation. SPE J. 2023, 28, 3389–3408. [Google Scholar] [CrossRef] [Scilit]
- Katende, A.; Allen, C.; Rutqvist, J.; Nakagawa, S.; Radonjic, M. Experimental and numerical investigation of proppant embedment and conductivity reduction within a fracture in the Caney Shale, Southern Oklahoma, USA. Fuel 2023, 341, 127571. [Google Scholar] [CrossRef] [Scilit]
- Peng, Y.; Luo, A.; Li, Y.; Wu, Y.; Xu, W.; Sepehrnoori, K. Fractional model for simulating Long-Term fracture conductivity decay of shale gas and its influences on the well production. Fuel 2023, 351, 129052. [Google Scholar] [CrossRef] [Scilit]
- Tang, J.; Kang, Z.; Zhao, Y.; Ding, Q.; Lei, G.; Kong, L.; Zhang, X. Rod-Shaped Proppant Conductivity of a Hydraulic Fracture Considering Elastic-Plastic Deformation and Embedment: An Analytical Model. Energy Fuels 2024, 38, 14278–14293. [Google Scholar] [CrossRef] [Scilit]
- Zhang, L.; He, C.; Li, L.; Wen, R.; Liang, Y. Propped fracture conductivity in shale oil reservoirs: Prediction model and influencing factors. Geoenergy Sci. Eng. 2025, 246, 213537. [Google Scholar] [CrossRef] [Scilit]
- Che, Y.-X.; Xie, L.-Z.; He, B.; Liu, Y.-X.; Li, F.-X.; Zhang, Y. Embedment behavior of variable-radius indenters in shale: A combined experimental and theoretical approach. Pet. Sci. 2026, 23, 2758–2772. [Google Scholar] [CrossRef] [Scilit]
- Mu, S.; Zhao, L.; Zhang, A.; Liu, S. A long-term fracture conductivity model for shale considering non-linear creep damage, proppant elastic-elastoplastic-plastic embedment, and hydration swelling effects. Comput. Geotech. 2026, 196, 108134. [Google Scholar] [CrossRef] [Scilit]
- Hu, H.; Shu, Z.; Guo, Z.; Li, X.; Chen, M. Discovery of the first shale condensate gas reservoir in China from the Jurassic Formation of the Fuxing area, eastern Sichuan Basin (Well Fuye 10HF). Geol. China 2021, 48, 1980–1981. [Google Scholar]
- API RP 19D:2021; Recommended Practice for Measuring Conductivity of Proppants. American Petroleum Institute: Washington, DC, USA, 2021.
- ISO 13503-5:2006; Petroleum and Natural Gas Industries—Completion Fluids and Materials—Part 5: Procedures for Measuring the Long-Term Conductivity of Proppants. International Organization for Standardization: Geneva, Switzerland, 2006.

Disclaimer/Publisher’s Note: The statements, opinions and data contained in all publications are solely those of the individual author(s) and contributor(s) and not of MDPI and/or the editor(s). MDPI and/or the editor(s) disclaim responsibility for any injury to people or property resulting from any ideas, methods, instructions or products referred to in the content. |
© 2026 by the authors. Licensee MDPI, Basel, Switzerland. This article is an open access article distributed under the terms and conditions of the Creative Commons Attribution (CC BY) license.