


Abstract
Pressure-dependent pore-volume deformation is a critical but poorly constrained variable in dynamic reserve assessment for ultra-deep fractured-vuggy carbonate reservoirs, where fractures, dissolution pores, and vugs respond differently to effective-stress loading. In this work, a pore-structure-aware evaluation strategy was developed by integrating high-temperature and high-pressure volumetric measurements with data-driven regression. Twelve carbonate core plugs from the Ordovician Yijianfang and Yingshan formations of the Fuman Oilfield were selected to represent matrix-pore, dissolution-pore, fracture-vug, and fracture-dominated pore systems. Stepwise net-pressure experiments were performed under simulated reservoir conditions, and pore-volume compressibility (Cp) was calculated from corrected pore-volume changes. Measured Cp values reveal a distinct stress-sensitive response: Cp declines sharply during the low-net-pressure stage and then tends toward a quasi-stable level as net pressure increases, indicating progressive closure of mechanically compliant fractures, narrow throats, and weakly supported dissolution pores. Although porosity is positively associated with Cp, samples with comparable porosity display markedly different compressibility values, confirming that pore-space geometry and fracture-related compliance must be considered. Eight representative regression algorithms were then compared, using net pressure, porosity, permeability, initial pore volume, surface porosity, temperature, and a pore-structure index as model inputs. To further assess model generalization to completely unseen core plugs, additional core-ID-based leave-one-core-out (LOCO) validation was performed for k-nearest neighbors and AdaBoost. Under this grouped validation, k-nearest neighbors yielded an RMSE of 13.5978 × 10⁻⁴ MPa−1 and an R2 of 0.8408, whereas AdaBoost achieved an RMSE of 10.0160 × 10⁻⁴ MPa−1 and an R2 of 0.9136, indicating greater cross-core robustness of AdaBoost. Permutation-importance analysis of the split-specific KNN model indicated that net pressure, porosity, surface porosity, and pore-structure index made the largest predictive contributions within that model. Moreover, the predicted normalized Cp values reproduced the experimentally observed decreasing trend with increasing net pressure, supporting the physical consistency of the k-nearest neighbors predictions. The proposed experimental–machine learning framework offers a pressure-dependent method for estimating pore-volume compressibility within the geological and petrophysical domain represented by the investigated Fuman Oilfield cores, and provides more representative inputs for material-balance analysis, dynamic reserve evaluation, and production adjustment.
1. Introduction
Pore-volume compressibility is a fundamental parameter for describing the elastic storage capacity and pressure-dependent pore-volume variation of reservoir rocks. In fractured-vuggy carbonate reservoirs, this parameter is particularly important because pressure depletion changes the effective stress acting on fractures, dissolution pores, vugs, and matrix pores, thereby affecting material-balance calculation, dynamic reserve estimation, and production-performance prediction. Deep and ultra-deep carbonate reservoirs in the Tarim Basin have become important targets for hydrocarbon exploration and development, and the Fuman, Tahe, and Shunbei oilfields represent typical fractured-vuggy carbonate reservoirs controlled by strike-slip faults, karstification, and multi-stage diagenetic modification [1,2,3,4,5]. These reservoirs are commonly characterized by large burial depth, high temperature and pressure, multi-scale reservoir space, and strong spatial heterogeneity. In the Fuman Oilfield, the Ordovician Yijianfang and Yingshan formations contain complex combinations of fractures, dissolution pores, vugs, and tight matrix domains, making the stress-dependent pore-volume response much more difficult to quantify than that of conventional porous reservoirs [4,6,7,8].
Previous studies on ultra-deep fractured-vuggy carbonate reservoirs have greatly improved the understanding of reservoir architecture, fault-karst reservoir formation, seismic identification, dynamic connectivity, and development strategy [1,5,7,8,9,10,11,12,13]. These studies indicate that the storage and flow capacity of fractured-vuggy reservoirs are not determined by porosity alone, but by the spatial configuration and connectivity of fractures, vugs, dissolution pores, and matrix pores. For dynamic reserve evaluation, modified material-balance methods and comprehensive compressibility coefficients have been introduced to reduce the uncertainty caused by conventional constant-parameter assumptions [12,13]. However, most field-scale evaluations still use simplified or fixed rock-compressibility inputs. The pressure-dependent evolution of pore-volume compressibility at the core scale, especially under ultra-deep reservoir stress conditions, has not been sufficiently incorporated into reserve evaluation and production adjustment. This limitation may lead to inaccurate estimation of elastic energy contribution during different depletion stages.
Rock compressibility has been studied using theoretical derivation, empirical correlation, and laboratory measurement. Forced-oscillation and volumetric methods have improved the measurement of compressibility and poroelastic coefficients in porous and permeable rocks [14]. Analytical and semi-empirical models have also been proposed to relate pore-volume compressibility to porosity, elastic parameters, effective stress, fractal characteristics, and pore-structure classification [15,16,17,18,19,20]. These studies provide important theoretical and experimental foundations for compressibility evaluation. Nevertheless, their direct application to ultra-deep fractured-vuggy carbonate reservoirs remains limited. First, many empirical correlations were established for sandstones or relatively homogeneous carbonate rocks, and they may not adequately represent pore systems containing mechanically compliant fractures and fracture-connected vugs. Second, pore-volume compressibility is often treated as a single-valued parameter, whereas stress-sensitive rocks usually exhibit a rapid decrease in compressibility during the early loading stage and a gradual stabilization at higher effective stress [21,22,23,24]. Third, conventional prediction methods rarely include pore-structure type, fracture-related compliance, or image-derived structural indicators, although these factors may strongly influence pore-volume deformation in heterogeneous carbonate rocks.
Recent advances in digital rock physics, micro-CT imaging, image analysis, and machine learning provide new opportunities for characterizing heterogeneous carbonate pore systems and predicting reservoir properties [25,26,27,28,29]. Machine learning methods have been applied to the prediction of porosity, permeability, pore type, reservoir quality, and pressure-related parameters using core, image, well-log, and seismic data [6,27,28,29]. For pore-volume compressibility, interpretable machine learning and transfer learning have begun to show potential in capturing nonlinear relationships among effective stress, porosity, and pore-structure-related variables [20]. Compared with traditional empirical equations, data-driven models can better describe nonlinear and multi-factor coupling effects. However, several issues still need to be addressed. Many machine learning studies emphasize prediction accuracy, while the physical consistency of predicted compressibility trends is not always examined. In addition, if multiple pressure points from the same core plug are randomly assigned to both training and testing subsets, model performance may be overestimated. Therefore, for small experimental datasets from ultra-deep carbonate reservoirs, a reliable prediction workflow should consider not only numerical accuracy but also pore-structure constraints, stress-dependent behavior, and geological plausibility [20,30].
To address these issues, this study develops a pore-structure-constrained workflow for evaluating pressure-dependent pore-volume compressibility in ultra-deep fractured-vuggy carbonate reservoirs. Representative carbonate core plugs from the Ordovician Yijianfang and Yingshan formations in the Fuman Oilfield were selected to cover different porosity levels and pore-structure types. High-temperature and high-pressure volumetric experiments were conducted under stepwise net-pressure loading, and the measured compressibility data were further used to construct and evaluate multiple regression models. The main contributions of this study are as follows:
- Stepwise net-pressure volumetric experiments were performed to quantify the pressure-dependent evolution of pore-volume compressibility under simulated ultra-deep reservoir conditions.
- The effects of porosity, image-derived surface porosity, and pore-structure type were analyzed to clarify the structural causes of compressibility differences among samples with similar porosity.
- Eight representative regression algorithms spanning distinct model families were compared for pore-volume compressibility prediction, and the optimized model was evaluated using prediction accuracy, feature contribution, and physical-consistency analysis.
- A pore-structure-constrained and pressure-dependent compressibility evaluation framework was proposed to provide more representative inputs for material-balance analysis, dynamic reserve evaluation, and development adjustment in ultra-deep fractured-vuggy carbonate reservoirs.
2. Geological Setting and Core Samples
The Fuman Oilfield is located in the Tarim Basin, northwestern China, and its main productive intervals are the Ordovician Yijianfang and Yingshan formations. These formations are typical ultra-deep fractured-vuggy carbonate reservoirs, with reservoir development mainly controlled by strike-slip faulting and modified by karstification. The target intervals are buried at depths greater than 7000 m, with formation temperatures of approximately 150–180 °C and formation pressure coefficients ranging from 1.2 to 1.5. Such high-temperature and high-pressure conditions make the mechanical and pore-volume responses of the reservoir rocks more sensitive to pressure depletion.
The reservoir space in the Yijianfang and Yingshan formations is highly heterogeneous. Fractures, dissolution pores, vugs, and matrix pores coexist at different scales, and their spatial combinations vary among samples. In fault-karst development zones, fractures and dissolution-modified pores provide the main storage and flow space, while locally developed tight carbonate matrix and shale-rich intervals may act as barriers or internal heterogeneity. For the ultra-deep fault-karst carbonate samples considered in this study, the feature most relevant to pressure-dependent deformation is that a relatively small proportion of mechanically compliant fractures or fracture-connected vugs may contribute disproportionately to pore-volume deformation under changing effective stress.
Representative carbonate core plugs from the Yijianfang and Yingshan formations were selected for pore-volume compressibility testing. The samples were chosen to cover different porosity levels and pore-structure types, including matrix-pore-dominated, dissolution-pore-dominated, fracture-vug mixed, and fracture-dominated samples. This classification was based on the quantitative end-face image metrics described in Section 3.3, supplemented by macroscopic core observation, and the assigned type represents the dominant pore-space architecture rather than an exclusive pore type, because matrix pores, dissolution pores and vugs, and fractures may coexist within an individual plug. Accordingly, the porosity and permeability reported for each sample represent integral plug-scale petrophysical properties rather than separate properties of individual pore domains. This classification was used to support the subsequent analysis of pore-structure controls on compressibility response. For clarity in the subsequent experimental analysis and machine learning modeling, the original laboratory registration IDs were retained throughout the study. Accordingly, the 12 tested core plugs are identified as C-1, C-2, C-3, C-4, C-5, C-6, C-8, C-9, C-11, C-15, C-18, and C-23, exactly as listed in Table 1; no sequential renumbering to C-1–C-12 was performed. These original IDs were consistently used in the text, figures, tables, and model inputs.
Table 1.
Basic properties and pore-structure classification of the tested carbonate core samples.
Before testing, the carbonate samples were trimmed into cylindrical core plugs. The plug dimensions, dry mass, porosity, permeability, and initial pore volume were measured and recorded. The core plugs were then cleaned, dried to a stable mass, and vacuum-saturated with NaCl brine before the high-temperature and high-pressure volumetric tests. The NaCl solution had a salinity of 84.5 g/L and was used to approximate the mineralization level of the formation water. These pretreatment steps were designed to reduce the influence of residual fluids, loose particles, and trapped air on pore-volume measurement.
The basic properties and test conditions of the tested core samples are summarized in Table 1.
3. Materials and Methods
The complete workflow from core selection and volumetric measurement to data processing, feature engineering, and machine learning prediction is summarized in Supplementary Figure S1.
3.1. Experimental Materials and Equipment
The carbonate core plugs listed in Table 1 were used for the pore-volume compressibility experiments. Before testing, each sample was trimmed into a standard cylindrical plug with a nominal diameter of 25 mm and a length of 50 mm and cleaned to remove residual oil, salts, and loose particles. The cleaned samples were then dried at 105 °C in a DHG-9240A forced-air drying oven (Shanghai Yiheng Scientific Instrument Co., Ltd., Shanghai, China) until the change in mass became negligible between successive measurements. The dry mass, dimensions, porosity, permeability, surface porosity, and initial pore volume of each plug were recorded before the compressibility test. Dry bulk density (ρb) was calculated from the oven-dried mass and geometric bulk volume of each cylindrical plug. High-purity helium and nitrogen (both 99.999%; Linde Gas, Shanghai, China) were used as the measurement gases for porosity and permeability, respectively. Connected porosity was measured on the cleaned and dried plugs by helium gas expansion at laboratory temperature using an M9170 High-Pressure Porosity and Permeability System (Grace Instrument Company, Houston, TX, USA). Permeability was determined by steady-state N2 flow under a reference confining pressure of 5 MPa and corrected for gas-slip effects using the Klinkenberg approach. These measurements were completed before brine saturation and before the subsequent high-temperature and high-pressure compressibility loading; therefore, the porosity and permeability values in Table 1 are pre-compression plug-scale reference properties rather than pressure-dependent properties measured at individual net-pressure steps. The 5 MPa confining pressure used for the permeability measurement served only to maintain sleeve sealing and was not intended to reproduce the reservoir overburden stress.
Surface porosity (Sp) was determined independently from high-resolution reflected-light optical images of the two planar end faces of each cleaned and dried plug rather than from a scan of the entire cylindrical surface. The images were acquired using a VHX-7000 digital microscope equipped with reflected LED illumination (KEYENCE Corporation, Osaka, Japan). The images were converted to grayscale and segmented using an intensity-threshold procedure, followed by visual checking of the pore and fracture masks. Sp was calculated as Ap+f/AROI × 100%, where Ap+f is the projected area occupied by visible pores, dissolution cavities, and fractures and AROI is the total analyzed area; the mean value from the two end faces was reported for each plug. Thus, surface porosity was treated as a two-dimensional initial-state morphological descriptor rather than as three-dimensional volumetric porosity. Micro-CT and SEM were not used to derive the surface-porosity values employed in the present dataset.
A NaCl solution with a salinity of 84.5 g/L was prepared using analytical-grade sodium chloride (NaCl, AR, ≥99.5%, Cat. No. C111533; Shanghai Aladdin Biochemical Technology Co., Ltd., Shanghai, China) and deionized water as the pore fluid to approximate the mineralization level of the formation water. Before the high-temperature and high-pressure volumetric measurement, the dried core plugs were vacuum-saturated with the prepared brine using an M9106 Automated Core Saturator System (Grace Instrument Company, Houston, TX, USA). This pretreatment was used to reduce the influence of trapped air and residual impurities on the subsequent pore-volume measurement.
The experimental system mainly consisted of an overburden porosity–permeability tester (M9170, Grace Instrument Company, Houston, TX, USA), a high-temperature and high-pressure reservoir physical simulation platform, a core holder, a confining-pressure pump, a pore-pressure pump, a back-pressure pump, a volumetric metering pump, a high-temperature drying oven (DHG-9240A, Shanghai Yiheng Scientific Instrument Co., Ltd., Shanghai, China), a core cleaning device, and a vacuum saturation system (M9106, Grace Instrument Company, Houston, TX, USA). The porosity–permeability tester was used for the pre-compression reference petrophysical measurements described above, whereas the high-temperature and high-pressure physical simulation platform was used for the subsequent pressure-dependent pore-volume compressibility measurements. The physical simulation platform can provide a maximum confining pressure of 200 MPa and a maximum temperature of 200 °C, which is suitable for simulating the pressure and temperature conditions of ultra-deep carbonate reservoirs. The compressibility experiments were not conducted at a single common temperature for all samples. Instead, a core-specific controlled temperature was used for each plug, ranging from 162 to 177 °C, as listed in Table 1. For an individual core plug, the assigned temperature was maintained constant throughout all eight net-pressure loading steps, whereas the test temperature differed among the 12 core plugs. The produced-fluid volume was recorded using a volumetric metering pump with a range of 1 mL and a resolution of 0.01 mL. Pressure sensors and flow-control units were used to monitor the stability of confining pressure, pore pressure, and fluid displacement during each pressure step.
During the volumetric measurement, the brine-saturated core plug was placed in the core holder and subjected to the preset temperature and confining pressure. After the system reached thermal and pressure equilibrium, the pore pressure was adjusted stepwise to generate different net pressures. The corresponding fluid-volume changes were recorded by the volumetric metering pump and then used to calculate the pore-volume compressibility of each sample. The detailed measurement procedure and calculation method are described in Section 3.2.
3.2. Volumetric Measurement of Pore-Volume Compressibility
Pore-volume compressibility was measured using a high-temperature and high-pressure volumetric method. The core plug was placed in the core holder, and the confining pressure, pore pressure, and temperature were adjusted to the target experimental conditions.
The net pressure was defined as the difference between confining pressure and pore pressure:
where Pnet is the net pressure, MPa; Pc is the confining pressure, MPa; and Pp is the pore pressure, MPa.
During the test, the confining pressure was maintained at the preset value, while the pore pressure was reduced stepwise to increase the net pressure acting on the pore system. A constant confining pressure of 160 MPa was applied to all 12 core plugs. The pore pressure was sequentially adjusted to 150, 140, 120, 100, 80, 60, 40, and 20 MPa, corresponding to net pressures of 10, 20, 40, 60, 80, 100, 120, and 140 MPa, respectively. Thus, the net-pressure increment was 10 MPa between the first two pressure levels and 20 MPa for each subsequent loading step. Except for the core-specific test temperature listed in Table 1, the same confining-pressure and pore-pressure sequence was applied to all 12 core plugs. Net pressure was increased stepwise to the prescribed levels by reducing pore pressure, rather than varied at a fixed continuous loading rate, and measurements at each net-pressure level were recorded only after the equilibrium criteria described below were satisfied. The corresponding fluid-volume change was recorded using a volumetric metering pump, and the pore-volume variation of the core was then calculated after system-volume correction.
This loading mode was used to simulate the gradual increase in effective stress during reservoir pressure depletion.
Before testing the core samples, the blank volume of the core chamber was calibrated using a stainless-steel standard plug. The standard plug was placed in the core holder, and the system was brought to the preset temperature and confining pressure. After pressure stabilization, the pore-pressure system was evacuated and then filled with degassed brine. The initial reading of the volumetric metering pump was recorded as V0. After opening the pore-pressure inlet valve and allowing the chamber pressure to stabilize, the pump reading was recorded as V1. The blank chamber volume was calculated as:
where Vd is the calibrated blank volume of the chamber, mL; V0 and V1 are the pump readings before and after chamber filling, respectively. The blank-volume calibration was repeated at each pressure level to reduce the influence of system deformation and dead volume on the measured pore volume.
After calibration, the stainless-steel standard plug was replaced with a brine-saturated carbonate core plug. The same temperature and pressure procedure was then repeated. At each net-pressure step, the system was allowed to reach pressure equilibrium before the fluid-volume reading was recorded.
The raw pump displacement was not interpreted directly as rock pore-volume change because reducing pore pressure also produces pressure-dependent expansion of the brine and deformation of the experimental system. Accordingly, the measured displacement was corrected for the cumulative brine-volume change and the apparatus-volume response determined during the volumetric calibration procedure. These non-rock contributions were removed before calculating the change in rock pore volume; therefore, the ΔVp used in the subsequent compressibility calculation represents the corrected pore-volume change of the core rather than the total fluid-volume response. The pore volume at each net pressure was obtained, and the pore-volume compressibility was calculated as:
where Cp is the pore-volume compressibility, MPa−1; Vp is the pore volume of the core, mL; and Pnet is the net pressure, MPa. For discrete experimental pressure steps, Cp was calculated using the finite-difference form:
where ΔVp is the corrected rock pore-volume change after removal of the brine-volume and apparatus-volume contributions between two adjacent pressure points, ΔPnet is the corresponding net-pressure increment, and is the average pore volume over the pressure interval.
The uncertainty of Cp was further quantified by first-order propagation of the uncertainties associated with the corrected pore-volume change, mean pore volume, and net-pressure increment. Assuming independent uncertainty contributions, the combined relative standard uncertainty was calculated as:
where , , and are the standard uncertainties of the corrected pore-volume change, mean pore volume, and net-pressure increment, respectively. The corresponding absolute uncertainty of Cp was obtained as:
The uncertainty of the corrected volume change was determined from the repeatability of the three replicate volumetric determinations, while the pressure and pore-volume contributions were evaluated from the corresponding measurement uncertainties.
To quantitatively compare the pressure sensitivity among different pore-structure types, a stress sensitivity index (SSI) was defined based on the relative decrease in pore-volume compressibility during pressure loading:
where Cp,low and Cp,high represent the pore-volume compressibility at the initial and final net-pressure stages, respectively. The SSI is dimensionless and reflects the relative attenuation degree of compressibility with increasing net pressure; a higher SSI indicates a stronger stress-sensitive response of the pore system.
To ensure measurement stability, each pressure step was held until the pressure fluctuation and pump reading became stable. A fixed holding time was not imposed because the equilibration rate varied among samples and pressure levels. Equilibration time was defined as the elapsed time from completion of the pore-pressure adjustment until both the pressure fluctuation remained within ±0.05 MPa and the volumetric-pump reading changed by no more than 0.01 mL over a continuous 10 min period. Across all core plugs and net-pressure steps, the required equilibration time ranged from approximately 20 to 65 min. Samples with relatively high permeability generally stabilized within 20–35 min, whereas the lowest-permeability plugs required approximately 45–65 min, particularly at the higher net-pressure stages, where progressive closure of compliant flow pathways prolonged pressure equilibration. All pore-volume readings used for Cp calculation were recorded only after these stability criteria had been satisfied. The produced-fluid volume was measured using a volumetric metering pump with a 1 mL range and a resolution of 0.01 mL, while the high-temperature and high-pressure physical simulation platform provided a maximum confining pressure of 200 MPa and a maximum temperature of 200 °C (Figure 1). The 0.01 mL value represents the instrumental resolution and was not directly used as the standard uncertainty of the corrected pore-volume change in the uncertainty-propagation calculation. Instead, the uncertainty contribution associated with the corrected volume change was evaluated from the repeatability of the three technical volumetric determinations performed at each pressure point. Blank-volume calibration was performed at each pressure level using the stainless-steel standard plug, with a calibration repeatability criterion of 0.01 mL before the correction was applied to the measured pore-volume change. In addition, the raw pump displacement was corrected for brine compressibility and pressure-dependent deformation of the experimental system, as described above, so that the ΔVp used for Cp calculation represents the corrected rock pore-volume change rather than the total fluid-volume response. The temperature assigned to each core plug was maintained constant throughout its eight pressure-loading steps, while pressure stability was controlled using the ±0.05 MPa equilibrium criterion described above. Each pressure-point measurement was repeated three times, and the variability of the resulting Cp values is reported as the standard deviation of the replicate measurements. Because Cp was calculated using the finite-difference method between adjacent pressure points, no additional smoothing filter was applied to the measured volume data before calculation. The discrete experimental values were directly used to preserve the measured pressure-dependent response. Curve fitting shown in the results section was only used to illustrate overall trends and was not used to derive Cp values. Based on the first-order uncertainty propagation described above, the estimated relative standard uncertainty of the calculated Cp values ranged from 3.2% to 5.6%, with a median value of approximately 4.2% across the investigated pressure range. The relative uncertainty increased moderately toward the higher net-pressure stages because the corrected pore-volume differences became progressively smaller. These triplicate measurements represent repeated volumetric determinations on the same core plug and were used to quantify measurement repeatability rather than being treated as independent core samples. The three replicate measurements at each pressure point were repeated volumetric determinations after stabilization of the same core plug at that pressure level, rather than three independent full loading–unloading cycles. The overall experiment followed a single monotonic net-pressure loading path from 10 to 140 MPa, and no unloading step was introduced between adjacent pressure levels. Because each core plug was measured at all eight net-pressure levels, the pressure-dependent observations were treated as repeated measurements within the same core, with the core plug regarded as the independent experimental unit. Given the limited and unequal numbers of independent cores among the four pore-structure groups, the comparisons in Section 4.1, Section 4.2 and Section 4.3 are presented descriptively rather than using independent-sample significance tests that would incorrectly treat the repeated pressure observations as statistically independent. During the pore-volume compressibility experiments, the confining pressure was maintained above the applied pore pressure to preserve core confinement. The measured Cp values were used to analyze the effects of net pressure, porosity, and pore-structure indicators, and were further used as the target variable for machine learning prediction.
Figure 1.
Schematic diagram of the volumetric system for pore-volume compressibility measurement.
3.3. Feature Construction and Dataset Preparation
The experimentally measured pore-volume compressibility data were further organized into a structured dataset for machine learning prediction. Each data record corresponded to one core sample tested at a specific net-pressure point. The target variable was the pore-volume compressibility Cp, while the input variables were selected according to the experimental observations and the physical factors controlling pore-volume deformation.
The main input features included net pressure, porosity, permeability, temperature, initial pore volume, image-derived surface porosity, and pore-structure type. Each feature was linked to a defined experimental or image-analysis measurement. Net pressure was calculated from the measured confining and pore pressures as described in Section 3.2. Porosity and permeability were the pre-compression helium-porosity and Klinkenberg-corrected N2-permeability values described in Section 3.1. Temperature corresponded to the core-specific controlled temperature of the volumetric experiment. It remained constant across the eight net-pressure observations of a given core but varied among the 12 core plugs from 162 to 177 °C, as reported in Table 1 and Supplementary Data S1, while initial pore volume (Vp0) was the blank-volume-corrected pore volume obtained before the first net-pressure increment. Surface porosity and pore-structure type were derived from the calibrated optical images of the two core-plug end faces. These parameters were selected because the experimental results showed that Cp was jointly affected by pressure loading, pore volume, and pore-structure heterogeneity. To make the dataset directly accessible for inspection and reproduction of the model analysis, the complete record-level dataset is provided as Supplementary Data S1 in CSV format. It contains 96 records obtained from 12 core plugs at eight net-pressure levels and includes the core ID, net pressure, porosity, permeability, temperature, initial pore volume, surface porosity, pore-structure type and index, and the corresponding measured Cp value. Among these records, 64 observations from eight core plugs were used for model training, 16 observations from two core plugs were used for validation and hyperparameter selection, and 16 observations from two independent core plugs were reserved for final test evaluation. Because all pressure observations from the same core plug were assigned to the same subset, the dataset partitioning was performed at the core-plug level rather than the individual-record level.
To make the pore-structure classification reproducible, the optical images were quantitatively segmented into fractures, dissolution pores, and vugs. Image scale was calibrated using the measured plug diameter. For each segmented void, the equivalent circular diameter was calculated as , where A is the projected void area. Connected elongated voids with a major-to-minor-axis ratio AR ≥ 5 were identified as fractures and cross-checked against macroscopic core observations. For the remaining non-fracture voids, an operational equivalent-diameter threshold of 2.0 mm was adopted: features with deq < 2.0 mm were classified as dissolution pores, whereas cavity-like features with deq ≥ 2.0 mm were classified as vugs. The projected area fractions of fractures (fF), dissolution pores (fD), and vugs (fV) were calculated relative to the total visible secondary-pore area and averaged between the two plug end faces. The fractures identified by this procedure were therefore defined morphologically as elongated, connected, open, or partially open void features visible before pressure loading; the term “fracture” in this study does not by itself imply a specific tectonic or diagenetic origin.
The final pore-structure class was assigned using a hierarchical criterion. Samples with surface porosity Sp < 0.30% and without a dominant visible fracture system were classified as matrix-pore-dominated. For the remaining samples, fracture-dominated and dissolution-pore-dominated classes required fF ≥ 50% and fD ≥ 50%, respectively. Samples in which neither component reached 50% but both fractures and vugs contributed at least 20% of the visible secondary-pore area (fF ≥ 20% and fV ≥ 20%) were classified as fracture-vug mixed. These thresholds were fixed before numerical labeling and were applied consistently to all samples.
For machine learning modeling, categorical pore-structure types were converted into numerical labels. Based on the quantitative classification described above, matrix-pore-dominated, dissolution-pore-dominated, fracture-vug mixed, and fracture-dominated samples were assigned pore-structure index (PSI) values of 0, 1, 2, and 3, respectively. The numerical ordering was introduced as a rank-based descriptor reflecting the generally increasing mechanical compliance from matrix-pore-dominated to fracture-dominated pore systems; however, the values 0–3 were not intended to imply equal physical intervals in mechanical compliance between adjacent pore-structure classes. Importantly, the numerical PSI value was assigned only after image-based classification and was not itself used to determine the pore-structure class. This treatment allowed the pore-structure information to be included in regression models while retaining its physical meaning. Because ordinal encoding nevertheless imposes a numerical distance between categories, its influence on model performance was additionally examined using one-hot encoding as a sensitivity test. In the alternative encoding, the four pore-structure classes were represented by four binary indicator variables without imposing either an ordinal distance or uniform spacing between classes. KNN and AdaBoost were re-evaluated under the same nested core-ID-based LOCO procedure described in Section 3.4, including re-optimization of their hyperparameters within each training fold. The feature set used in this study is summarized in Table 2.
Table 2.
Input features used for pore-volume compressibility prediction.
Before model training, all continuous features were normalized to reduce the influence of different units and numerical scales. min–max normalization was used:
where x∗ is the normalized value, x is the original feature value, and xmin and xmax are the minimum and maximum values of the corresponding feature in the training set.
Although min–max normalization removes differences caused by measurement units, it assigns equal numerical ranges to different features in the Euclidean distance calculation. Therefore, a full-range variation of net pressure and porosity can contribute similarly to the distance metric after normalization, even though their physical meanings and effects on Cp are different.
For permeability, direct min–max normalization was retained because the measured values in the present dataset range from 0.018 to 0.74 mD, corresponding to a variation of approximately 1.61 orders of magnitude rather than the multi-order nano- to millidarcy range that would normally warrant logarithmic transformation. Within this restricted permeability interval, normalization was used primarily to place permeability on a scale comparable to the other continuous model inputs, particularly for distance- and kernel-based algorithms, rather than to imply that identical absolute permeability changes have identical physical significance at all permeability levels. The present preprocessing strategy is therefore intended for the permeability range represented by the experimental dataset and should not be extrapolated directly to datasets spanning substantially broader permeability ranges. The normalization parameters obtained from the training set were then applied to the validation and testing data to avoid information leakage.
Because multiple pressure points were measured from the same core plug, the dataset was not treated as a set of fully independent random samples. A purely random split may place different pressure steps of the same core into both the training and testing subsets, which can overestimate prediction accuracy. Accordingly, all pressure points from a given core were kept within the same subset or fold, and the additional nested core-ID-based leave-one-core-out (LOCO) validation used to assess generalization to completely unseen cores is described in Section 3.4. For transparency and reproducibility, the complete row-level dataset used for the machine learning analysis is provided as Supplementary Data S1 in machine-readable CSV format. Each record corresponds to one core plug at one net-pressure point and includes the core ID, net pressure, porosity, permeability, temperature, initial pore volume, surface porosity, pore-structure index, and experimentally measured pore-volume compressibility. The dataset is provided before feature normalization, with core ID retained as the grouping identifier.
The final dataset was used to compare different regression algorithms, including linear regression, regularized regression, tree-based models, ensemble learning models, support vector regression, and k-nearest neighbors regression. Model performance was evaluated using RMSE and R2 on the held-out test set, and the best-performing model was further examined through feature-importance and physical-consistency analyses.
3.4. Machine Learning Models and Hyperparameter Optimization
To capture the nonlinear relationship between pore-volume compressibility and the controlling factors, eight representative regression algorithms were constructed and compared in this study. The selected models included linear regression, ElasticNet regression, decision tree regression, random forest regression, support vector regression (SVR), k-nearest neighbors regression, AdaBoost regression, and XGBoost regression. The model set was designed to represent distinct learning paradigms while avoiding unnecessary duplication among closely related formulations, covering unregularized and regularized linear regression, single-tree and bagging-based tree models, kernel-based regression, distance-based regression, adaptive boosting, and gradient-boosted trees. Given that the 96 pressure-dependent records originated from only 12 independent core plugs, the candidate set was intentionally restricted to these eight representative algorithms rather than expanded through additional closely related regression variants. The purpose of this comparison was therefore to evaluate distinct model families under an identical experimental dataset and validation framework, rather than to conduct an unrestricted algorithm search in which model-selection bias could increase with the number of candidate models.
Linear regression was used as the baseline model to examine whether Cp could be approximated by a simple linear mapping of the input variables. ElasticNet was selected as the representative regularized linear model because its combined L1–L2 penalty allows coefficient shrinkage and feature selection to be considered within a single framework. Decision tree and random forest regression were used to capture nonlinear interactions among net pressure, porosity, permeability, and pore-structure indicators, with the former representing a single hierarchical partitioning model and the latter a bagging-based ensemble. SVR was included as a continuous regression model because of its ability to capture nonlinear relationships through kernel functions. The prediction target was the continuous variable Cp; therefore, no classification or segmentation classes were defined or used in SVR. The pore-structure index was treated only as one of the numerical predictor variables. K-nearest neighbors regression was used to evaluate whether local similarity among samples could be used to predict Cp, which is relevant for heterogeneous fractured-vuggy carbonate rocks. AdaBoost was retained as a sequential reweighting ensemble, whereas XGBoost was used as the representative gradient-boosted-tree model with regularized tree construction.
All models were trained using the same input feature set and the same preprocessing strategy. For models sensitive to feature scale, such as support vector regression and k-nearest neighbors regression, feature normalization was particularly important. To ensure a fair comparison, the same training, validation, and testing partitions were used for all models. The complete dataset comprised 96 records obtained from 12 core plugs, with eight net-pressure observations for each core. Eight core plugs (64 records) were assigned to the training set, two core plugs (16 records) to the validation set, and the remaining two core plugs (16 records) to the independent test set, corresponding to 66.7%, 16.7%, and 16.7% of the total dataset, respectively. All pressure-point records from a given core were retained within the same subset. Accordingly, although 96 pressure-dependent records were available for regression, the effective number of independent experimental units was 12 core plugs, and this distinction was explicitly considered when interpreting model performance and generalization. The core-level train–validation–test assignment was fixed throughout the model comparison rather than generated by random splitting of individual pressure-point records. For stochastic model components, a fixed random seed of 42 was used to ensure computational reproducibility. The training set was used to fit the model parameters, the validation set was used for hyperparameter selection, and the test set was held out from both procedures and used only for the designated test-set performance evaluation reported in Section 4.4. Hyperparameters for this designated train–validation–test comparison were optimized using grid search over the candidate ranges listed in Table 3. For each model, the candidate parameter combinations were evaluated using the training and validation subsets, and the combination yielding the lowest validation RMSE was selected and fixed before evaluation on the independent test set. For the two leading models in the designated test-set comparison, grid search selected five neighbors with distance weighting and Euclidean distance for KNN, and 100 estimators with a learning rate of 0.05 for AdaBoost. These values correspond to the final models fitted under the designated train–validation–test partition; during nested LOCO validation, hyperparameters were re-optimized independently within each outer training set to prevent information leakage.
Table 3.
Hyperparameter search ranges used for grid-search optimization of the regression models.
To further evaluate whether the models could generalize to completely unseen core plugs and to reduce the dependence of performance evaluation on a single grouped train–validation–test partition, an additional nested leave-one-core-out (LOCO) group-validation procedure was performed for k-nearest neighbors and AdaBoost, which showed the best prediction performance in the designated test-set comparison. In each outer iteration, all eight pressure-point records from one core plug were withheld as an independent unseen-core test group, while the remaining 11 core plugs were used for model development. Hyperparameter optimization was conducted only within the remaining cores using five-fold GroupKFold validation, and the feature-normalization parameters were determined exclusively from the corresponding training data to avoid information leakage during preprocessing. The procedure was repeated until each of the 12 core plugs had served once as the unseen test group. The predictions from all 12 held-out core groups (96 observations in total) were subsequently pooled to calculate the group-based RMSE, R2, and mean bias error (MBE). A simple feature-set ablation analysis was additionally performed using AdaBoost under the same nested core-ID-based LOCO framework. Four progressively enriched feature sets were compared: net pressure only; net pressure plus porosity; net pressure, porosity, surface porosity, and PSI; and the full feature set comprising net pressure, porosity, permeability, temperature, initial pore volume, surface porosity, and PSI.
The main hyperparameters and their search ranges are summarized in Table 3. For models with few tunable parameters, such as linear regression, only the default least-squares solution was used. For ElasticNet, both the regularization strength and L1 mixing ratio were optimized. For tree-based and ensemble models, the number of estimators, tree depth, learning rate, and minimum samples per leaf were optimized as applicable to each algorithm. For support vector regression, the penalty coefficient, kernel function, kernel scale, and insensitive-loss width were tuned. For k-nearest neighbors regression, the number of neighbors, weighting strategy, and distance metric were optimized. Thus, Table 3 defines the complete candidate search space from which the model hyperparameters were selected rather than arbitrary parameter values assigned after model evaluation. For SVR specifically, the predefined search space comprised linear and radial-basis-function (RBF) kernels, penalty coefficients C = 1, 10, and 100, kernel-scale settings of “scale” and “auto”, and ε values of 0.01, 0.05, and 0.10. These candidate settings were evaluated using only the training and validation data, and the independent test set was not used during SVR hyperparameter selection. To improve readability, the hyperparameters in Table 3 are described using their physical or algorithmic meanings rather than software-specific parameter names.
To improve the interpretability of the tree-based regression models, the fitted tree structures were further examined after hyperparameter optimization. For the optimized decision tree model, the variables and threshold values at the root and upper-level internal nodes were extracted directly. For the ensemble tree models, including random forest, AdaBoost, and XGBoost, reporting every constituent tree would be impractical and would provide limited additional insight. Therefore, the occurrence frequency of predictor variables within the upper three levels of the constituent trees was calculated, and the most frequently occurring split-threshold ranges were summarized. These diagnostics were derived from the fitted models after hyperparameter selection and were used only for model interpretation; the held-out test responses were not used to determine the split rules or thresholds.
3.5. Evaluation Criteria and Model Interpretation
Model performance was evaluated using root mean squared error (RMSE), the coefficient of determination (R2), and mean bias error (MBE). RMSE quantifies the magnitude of the prediction error and is expressed on the same scale as the predicted pore-volume compressibility, whereas R2 characterizes the agreement between the measured and predicted values. MBE was additionally used to quantify the direction of the prediction error and to distinguish systematic over-prediction from under-prediction. All three metrics reported for model comparison were calculated using the held-out test set. A lower RMSE indicates a smaller prediction error, whereas an R2 value closer to 1 indicates better agreement between measured and predicted values.
The evaluation metrics were calculated as follows:
where is the number of samples, is the experimentally measured pore-volume compressibility of the -th sample, is the predicted value, and is the mean of the measured values in the test set. RMSE was used as the primary error metric because of its direct physical interpretability in the same numerical scale as Cp, while R2 provided a complementary dimensionless measure of predictive agreement. For MBE, a positive value indicates that the model tends to over-predict Cp, whereas a negative value indicates a tendency to under-predict Cp. An MBE close to zero indicates little systematic directional bias, although individual positive and negative residuals may still occur. For the nested LOCO analysis, the residual at each pressure point was defined as predicted Cp minus measured Cp, and was examined separately for each completely held-out core. Core-wise RMSE, MBE, and maximum absolute residual were calculated from the eight pressure-point predictions of each held-out core.
In addition to numerical accuracy, model interpretation was performed to examine whether the prediction model was consistent with the physical behavior observed in the experiments. For the best-performing model, permutation importance was used to evaluate the relative contribution of each input feature. In this method, one feature is randomly shuffled while the other features are kept unchanged. The reduction in model performance after shuffling is used to quantify the importance of that feature. A larger decrease in performance indicates a stronger contribution to the prediction of Cp.
The physical consistency of the prediction model was further examined using the pressure-dependent trend of pore-volume compressibility. According to the volumetric experiments, Cp should generally decrease with increasing net pressure and gradually approach a stable stage at higher net pressures. Therefore, the predicted results were compared with the measured normalized Cp values under increasing net pressure. This comparison was used to check whether the model preserved the stress-sensitive response of the fractured-vuggy carbonate samples rather than only minimizing numerical prediction errors.
The evaluation and interpretation workflow provided a combined assessment of prediction accuracy, feature contribution, and physical plausibility. This was necessary because a model with good numerical performance may still produce physically unreasonable trends if the training data are limited or if the data splitting strategy introduces information leakage. Therefore, the final model selection was based not only on RMSE and test-set R2, but also on feature-importance analysis and consistency with the experimentally observed pressure-dependent compressibility behavior.
4. Results and Discussion
4.1. Experimental Pore-Volume Compressibility Under Different Net Pressures
The pore-volume compressibility (Cp) of representative fractured-vuggy carbonate samples was measured under stepwise increasing net pressures. This pressure path was used to reproduce the progressive increase in effective stress during reservoir pressure depletion. As shown in Figure 2a, Cp decreased markedly at lower net pressures and then progressively leveled off as net pressure increased, while the magnitude of the pressure-dependent response varied markedly among different pore-structure types.
Figure 2.
Stress-sensitive pore-volume compressibility of representative fractured-vuggy carbonate samples under different net pressures. (a) Variation in pore-volume compressibility with net pressure; error bars represent the standard deviation of three replicate volumetric measurements performed at each pressure point on the same core plug (n = 3 measurement replicates). (b) Normalized pore-volume compressibility as a function of net pressure. Cp10 represents the pore-volume compressibility measured at the first experimental net-pressure level of 10 MPa and is used only as the normalization reference. Core IDs correspond to the original laboratory registration IDs listed in Table 1; no sequential renumbering was applied.
The fracture-dominated sample C-1 (ϕ = 0.62%, Vp0 = 0.152 mL; Table 1) showed the highest compressibility, with Cp decreasing from 118.6 × 10⁻⁴ MPa−1 at 10 MPa to 23.8 × 10⁻⁴ MPa−1 at 140 MPa. The fracture-vug mixed sample C-3 decreased from 91.3 × 10⁻⁴ MPa−1 to 20.9 × 10⁻⁴ MPa−1 over the same pressure range. In contrast, the matrix-pore-dominated sample C-6 maintained lower values, decreasing from 38.4 × 10⁻⁴ MPa−1 to 12.8 × 10⁻⁴ MPa−1. The dissolution-pore-dominated sample C-8 showed an intermediate response, with Cp changing from 63.7 × 10⁻⁴ MPa−1 to 20.2 × 10⁻⁴ MPa−1. These results indicate that samples containing more compliant pore space, especially open fractures and fracture-connected vugs, have greater initial compressibility.
Because 10 MPa was the first net-pressure level included in the experimental loading sequence, the compressibility measured at this pressure was used only as the reference value for normalization and is denoted hereafter as Cp,10. It does not represent a zero-stress or atmospheric-pressure compressibility. No atmospheric-pressure Cp value was used in the normalization, and no assumption of linear or constant compressibility between atmospheric pressure and 10 MPa was made.
The normalized curves in Figure 2b further show that the decline in Cp was not linear over the entire pressure range. From 10 to 40 MPa, Cp/Cp10 decreased rapidly. At 40 MPa, the normalized values of C-1, C-3, C-6, and C-8 were 0.444, 0.426, 0.484, and 0.496, respectively. This early-stage decrease is interpreted as being associated with the progressive closure of mechanically compliant fractures, narrow pore throats, and weakly supported dissolution pores. When the net pressure exceeded 60 MPa, the curves gradually flattened. After approximately 100 MPa, only slight changes were observed in most samples; for example, Cp of C-6 decreased from 13.5 × 10⁻⁴ MPa−1 at 100 MPa to 12.8 × 10⁻⁴ MPa−1 at 140 MPa.
This pressure-dependent response suggests that the pore-fracture system experienced two main stages during loading. The first stage is characterized by rapid compaction of mechanically sensitive pore space under relatively low net pressure. The second stage corresponds to a more stable compaction state, where the remaining pore volume is mainly supported by the carbonate skeleton and becomes less sensitive to additional pressure increments. Therefore, Cp should not be treated as a constant parameter in ultra-deep fractured-vuggy carbonate reservoirs, particularly during the early stage of pressure depletion.
Although net pressure is the direct external factor controlling pore-volume compression, the differences among samples at the same pressure level indicate that internal rock properties also play an important role. Porosity and pore-structure indicators are therefore further examined in the following sections.
4.2. Effects of Porosity on Pore-Volume Compressibility
Porosity was further examined to clarify whether the pressure-dependent compressibility described in Section 4.1 can be partly explained by the amount of pore space in the carbonate samples. As shown in Figure 3, Cp generally increased with porosity at the three selected net pressures. The fitted curve at 20 MPa was steeper than those at 60 and 100 MPa, indicating that the influence of porosity was more pronounced when the pore-fracture system had not yet been strongly compacted. As net pressure increased, the fitted curves shifted downward and became gentler, suggesting that part of the deformable pore space was progressively closed during loading. Within an isotropic Biot-type poroelastic approximation, pore-volume compressibility can be expressed as , where Kd and Ks are the drained-frame and solid-grain bulk moduli, respectively. Because Kd depends not only on porosity but also on pore geometry and effective stress, compliant fractures and low-aspect-ratio pores can strongly increase Cp at low net pressure. Progressive closure and stiffening of these features with increasing net pressure increase Kd and reduce its sensitivity to porosity, providing a poroelastic explanation for the weaker porosity–Cp relationship at higher pressure.
Figure 3.
Relationship between porosity and pore-volume compressibility under different net pressures. The scattered points represent individual core samples, and the fitted curves were obtained using second-order polynomial fitting to show the overall variation trend at each pressure level.
The scattered distribution of the data points is also important. Although the overall trend is positive, several samples deviate from the fitted curves. Some low-porosity samples still show relatively high Cp, while samples with similar porosity may exhibit different compressibility values. This behavior is reasonable for fractured-vuggy carbonate rocks, where the measured compressibility is controlled not only by total pore volume but also by the geometry, connectivity, and mechanical compliance of the pore space. A limited number of open fractures or irregular dissolution pores may produce greater pore-volume deformation than a larger proportion of well-supported matrix pores.
The separation among the three pressure levels further indicates that porosity and net pressure jointly control Cp. At low net pressure, fractures and weakly supported pores remain more open, so the difference in pore volume is more directly reflected in the compressibility response. At higher net pressure, these compliant pore spaces are partly compacted, and the remaining pore volume becomes increasingly constrained by the carbonate framework. As a result, the porosity–Cp relationship remains positive at 100 MPa, but its sensitivity is weaker than that observed at 20 MPa.
These results suggest that porosity is a necessary input for predicting pore-volume compressibility, but it is insufficient as a standalone parameter in ultra-deep fractured-vuggy carbonate reservoirs. The dispersion in Figure 3 indicates that pore-structure indicators should be considered together with porosity to improve the physical reliability of compressibility prediction.
4.3. Pore-Structure Controls on Compressibility Response
The scatter observed in Figure 3 indicates that porosity alone cannot fully describe the compressibility response of the fractured-vuggy carbonate samples. To further clarify this effect, the samples were classified according to their dominant pore-structure types using the quantitative image-based criteria defined in Section 3.3, including fracture-dominated, fracture-vug mixed, dissolution-pore-dominated, and matrix-pore-dominated samples. Image-derived surface porosity was used as a structural indicator to describe the visible proportion of pores and fractures in optical images of the two planar core-plug end faces obtained before pressure loading.
The fracture features considered in this classification were predominantly elongated and connected open or partially open voids distinguished from more equant dissolution pores and vugs by their image morphology. In fracture-vug mixed samples, such elongated features occurred together with cavity-like vugs, forming visible fracture–vug associations on the plug end faces. These fractures were already present in the pre-test images and therefore were not generated by the subsequent high-pressure compressibility loading. However, because no in situ imaging of the rock before core recovery was available, their genetic origin cannot be determined uniquely from the present dataset. In particular, a contribution from stress release or decompression during core recovery cannot be completely excluded. Accordingly, the terms “fracture-dominated” and “fracture-vug mixed” are used here as morphological pore-structure descriptors rather than as genetic classifications of fracture origin.
As shown in Figure 4a, Cp at 60 MPa generally increased with image-derived surface porosity, but the data points were not distributed along a single trend line. Fracture-dominated samples were mainly located in the high-Cp range, with Cp values higher than 40 × 10−4 MPa−1. Matrix-pore-dominated samples showed the lowest compressibility, with Cp values below 20 × 10−4 MPa−1. Dissolution-pore-dominated and fracture-vug mixed samples were distributed between these two end members. This distribution suggests that the mechanical compliance of pore space, rather than surface porosity alone, controls the measured compressibility.
Figure 4.
Pore-structure controls on pore-volume compressibility of fractured-vuggy carbonate samples. (a) Relationship between surface porosity and pore-volume compressibility at 60 MPa. (b) Stress sensitivity index of different pore-structure types. Error bars in (b) represent the standard deviation among the cores within each pore-structure group; the group sizes are n = 4 for fracture-dominated, n = 3 for fracture-vug mixed, n = 3 for dissolution-pore-dominated, and n = 2 for matrix-pore-dominated samples. Surface porosity was obtained from image analysis.
The difference among pore-structure types is further reflected by the stress sensitivity index in Figure 4b. The group-mean SSI was highest for fracture-dominated samples (0.67; n = 4 cores), followed by fracture-vug mixed samples (0.61; n = 3), dissolution-pore-dominated samples (0.49; n = 3), and matrix-pore-dominated samples (0.44; n = 2). The relatively broad range of surface porosity within the fracture-dominated group is not inconsistent with its high SSI, because Sp measures the initial two-dimensional projected abundance of visible voids, whereas SSI reflects the relative pressure-induced attenuation of compressibility and is therefore more strongly controlled by the mechanical compliance and closure behavior of those voids than by their projected area alone. This ordering describes the present samples rather than a universal mechanical-compliance hierarchy, because fracture compliance also depends on the resolved normal stress, mineral filling or cementation, and fracture geometry. A fracture-dominated plug may therefore exhibit relatively low compressibility when fractures are unfavorably oriented for normal closure, strongly mineral-filled, or geometrically stiff. Accordingly, this group-level ordering does not imply a linear or equally spaced relationship between pore-structure classes and compressibility. The scatter in Figure 4a demonstrates that individual samples from different classes can partially overlap because compressibility is jointly affected by pore geometry, connectivity, porosity, and the relative abundance of mechanically compliant features. Accordingly, the PSI should be interpreted as an ordinal structural descriptor rather than a quantitative mechanical-compliance scale. Open fractures and fracture-connected vugs are expected to be more susceptible to compaction during loading, whereas matrix pores and well-supported dissolution pores are more constrained by the carbonate framework.
These results help explain why samples with similar porosity may show different Cp values. In fractured-vuggy carbonate rocks, a small number of open fractures can contribute disproportionately to pore-volume deformation. Conversely, a sample with relatively high visible pore area may still show moderate compressibility if the pore space is dominated by isolated or well-supported dissolution pores. Therefore, pore-structure type should be considered together with porosity and net pressure when constructing a predictive model for pore-volume compressibility.
4.4. Machine Learning Prediction Performance
Based on the experimentally measured pore-volume compressibility data, eight representative regression algorithms were evaluated to identify a suitable prediction model for the fractured-vuggy carbonate samples. The tested models were linear regression, ElasticNet, decision tree, random forest, support vector regression, k-nearest neighbors, AdaBoost, and XGBoost, representing distinct linear, tree-based, kernel-based, distance-based, and ensemble-learning strategies. The model performance was assessed using RMSE, test-set R2, and mean bias error (MBE), as summarized in Table 4; RMSE and R2 are additionally compared in Figure 5. RMSE provides a direct measure of prediction error on the same numerical scale as Cp, whereas R2 provides a complementary measure of the agreement between measured and predicted values, and MBE provides the signed prediction error required to determine whether a model preferentially over-predicts or under-predicts Cp.
Table 4.
Performance comparison and prediction bias of different regression algorithms for pore-volume compressibility prediction.
Figure 5.
Prediction performance of different machine learning models for pore-volume compressibility. (a) Comparison of RMSE values among different regression algorithms. (b) Comparison of R2 values among different regression algorithms.
The comparison shows clear differences among the tested algorithms. Linear regression and ElasticNet produced RMSE values of 11.0991 and 10.7709 × 10⁻⁴ MPa−1, respectively, with corresponding R2 values of 0.7771 and 0.7901. Although regularization slightly improved the prediction relative to the unregularized linear baseline, both models remained less accurate than the principal nonlinear models. Their MBE values were −3.2146 and −2.7819 × 10⁻⁴ MPa−1, respectively, indicating that both linear models tended to under-predict Cp. This indicates that a simple linear mapping is insufficient to describe the nonlinear relationship between compressibility and the controlling parameters. Tree-based models improved the prediction accuracy to some extent. Decision tree and random forest reduced RMSE to 8.3891 and 8.1735 × 10⁻⁴ MPa−1, respectively, while their R2 values increased to 0.8727 and 0.8791. Their relatively small positive MBE values of +1.6348 and +0.9287 × 10⁻⁴ MPa−1 indicate slight overall over-prediction. However, their errors remained higher than those of the best-performing models.
Among all tested algorithms, k-nearest neighbors achieved the lowest RMSE of 4.1843 × 10⁻⁴ MPa−1 and the highest R2 of 0.9683. Its MBE was +0.3876 × 10⁻⁴ MPa−1, which was the smallest absolute bias among the tested models and indicates an almost unbiased prediction with only a slight tendency toward over-prediction. AdaBoost also showed good performance, with an RMSE of 5.4390 × 10⁻⁴ MPa−1 and an R2 of 0.9465, together with a small positive MBE of +0.6412 × 10⁻⁴ MPa−1. Support vector regression (SVR) produced continuous Cp predictions rather than classification or segmentation outputs. However, its predictive performance was substantially poorer than that of the other nonlinear models, with the highest RMSE of 21.7477 × 10⁻⁴ MPa−1 and the lowest R2 of 0.1442. Its strongly negative MBE of −15.4625 × 10⁻⁴ MPa−1 further shows that the poor performance was accompanied by marked systematic under-prediction. XGBoost also exhibited an overall under-prediction tendency, with an MBE of −2.1064 × 10⁻⁴ MPa−1. Therefore, the low R2 represents weak agreement between the measured and predicted continuous Cp values rather than an inability of SVR to generate predictions. For SVR, hyperparameter selection was performed by grid search over both linear and radial basis function (RBF) kernels, with penalty coefficients C = 1, 10, and 100, kernel-scale settings of “scale” and “auto”, and ε values of 0.01, 0.05, and 0.10. The target Cp was handled on the ×10−4 MPa−1 numerical scale used for model evaluation; therefore, the tested penalty coefficients were applied relative to target values on this numerical scale rather than directly to raw values of order 10−4 MPa−1. The reported SVR performance consequently represents the configuration selected from this predefined search space rather than the result of an arbitrarily fixed RBF kernel. Given the limited number of independent core plugs, the search grid was intentionally kept compact to restrict model-selection variability and should not be regarded as an exhaustive exploration of all possible C values. The low R2 and strongly negative MBE therefore indicate that SVR generalized poorly to the held-out cores within the tested configuration space, rather than demonstrating that SVR is intrinsically unsuitable for pore-volume-compressibility prediction.
Although k-nearest neighbors achieved the highest numerical prediction accuracy, its distance-based formulation does not provide explicit variable thresholds or hierarchical decision rules. This behavior is physically reasonable because the pressure-dependent Cp response shows local continuity, and samples with similar net pressure and pore-structure characteristics tend to exhibit comparable compressibility responses. In contrast, SVR relies on a global kernel mapping, which may be less effective for the limited and heterogeneous dataset investigated here. To provide a more interpretable complement to the KNN prediction, the fitted tree-based models were therefore further examined in terms of their dominant split variables and upper-level decision thresholds. The quantitative test-set performance of all eight regression algorithms is reported in Table 4 and Figure 5, whereas Figure 6b presents the measured–predicted normalized Cp comparison used for the physical-consistency assessment of the selected KNN model.
Figure 6.
Permutation importance and aggregate physical consistency of the split-specific KNN model. (a) Permutation importance of input features for pore-volume compressibility prediction. (b) Comparison between measured and predicted normalized pore-volume compressibility under increasing net pressure.
KNN prediction should nevertheless be interpreted within the range represented by the present dataset. Because KNN relies on local neighborhoods in the normalized feature space, its reliability is affected by feature scaling, sample density, and the availability of sufficiently similar training observations. Although all pressure observations from an individual core were retained within the same training, validation, or test subset to reduce information leakage, prediction uncertainty may still increase for cores whose petrophysical and pore-structure characteristics are insufficiently represented in the training data. The additional nested leave-one-core-out (LOCO) group-validation analysis provided a more stringent assessment of generalization to completely unseen core plugs. Under this framework, KNN yielded an RMSE of 13.5978 × 10⁻⁴ MPa−1 and an R2 of 0.8408, whereas AdaBoost achieved an RMSE of 10.0160 × 10⁻⁴ MPa−1 and an R2 of 0.9136, indicating greater unseen-core robustness of AdaBoost. Across the 12 held-out-core folds, the fold-wise RMSE was 12.90 ± 4.49 × 10⁻⁴ MPa−1 for KNN and 9.60 ± 2.98 × 10⁻⁴ MPa−1 for AdaBoost, while the corresponding fold-wise R2 values were 0.819 ± 0.118 and 0.900 ± 0.067, respectively. The lower mean prediction error and smaller fold-to-fold variability of AdaBoost further support its greater robustness when generalizing to completely unseen core plugs. A simple feature-set ablation analysis was therefore performed for AdaBoost under the same nested core-ID-based LOCO framework, as summarized in Supplementary Table S3. Using net pressure alone yielded an RMSE of 23.8980 × 10⁻⁴ MPa−1 and an R2 of 0.5081; adding porosity reduced the RMSE to 17.5085 × 10⁻⁴ MPa−1 and increased R2 to 0.7360, while further inclusion of surface porosity and PSI reduced the RMSE to 11.1904 × 10⁻⁴ MPa−1 and increased R2 to 0.8921. The full feature set further improved the RMSE to 10.0160 × 10⁻⁴ MPa−1 and R2 to 0.9136, indicating that the structural descriptors provided additional predictive information beyond pressure and porosity, although this incremental value should be interpreted within the limited 12-core dataset rather than as a causal feature effect. To further examine whether these results depended on the ordinal encoding of pore-structure type, the PSI feature was replaced by one-hot encoding under the same nested LOCO framework. The corresponding RMSE/R2 values were 13.4935 × 10⁻⁴ MPa−1/0.8432 for KNN and 9.7083 × 10⁻⁴ MPa−1/0.9188 for AdaBoost. These changes were modest relative to the ordinal-encoding results, indicating that the principal conclusions regarding unseen-core generalization are not strongly dependent on the numerical spacing imposed by the PSI encoding.
To provide an explicit rule-based interpretation complementary to KNN, the tree-based regression models were further examined. Among these models, AdaBoost showed the best predictive performance, with an RMSE of 5.4390 × 10⁻⁴ MPa−1 and an R2 of 0.9465, followed by random forest and decision tree, with R2 values of 0.8791 and 0.8727, respectively. XGBoost achieved an R2 of 0.8000. Because a single decision tree provides directly traceable hierarchical splits, whereas the ensemble models contain multiple constituent trees, the root and upper-level nodes of the decision tree and the dominant upper-level split patterns of random forest, AdaBoost, and XGBoost were examined. The principal decision variables and representative threshold ranges are summarized in Table 5.
Table 5.
Dominant decision variables and representative upper-level split characteristics of the tree-based regression models.
The decision tree provides the clearest representation of the hierarchical decision process. The first and most influential switch occurs at a net pressure of approximately 50 MPa. At Pnet ≤ 50 MPa, the pore-structure index becomes an important secondary discriminator. Samples with PSI > 1.5, corresponding mainly to fracture-vug mixed and fracture-dominated pore systems, are directed toward higher-compressibility branches, particularly when surface porosity exceeds approximately 0.75%. Samples with lower PSI values tend to occupy lower-compressibility branches, with porosity providing an additional separation. At higher net pressures, a second important pressure-related switch occurs at approximately 110 MPa. Above this level, the predicted Cp becomes considerably less sensitive to additional increases in net pressure, and the residual differences among samples are controlled mainly by porosity and pore-structure indicators.
The ensemble tree models exhibit a consistent hierarchy despite their more complex structures. Net pressure accounts for approximately 35–40% of the upper-level splits in random forest, AdaBoost, and XGBoost, followed by porosity, surface porosity, and pore-structure index. Two recurrent pressure intervals, approximately 40–60 MPa and 90–110 MPa, appear as the principal decision-switch ranges. These thresholds are consistent with the experimental response in Figure 2, where rapid pore-fracture compaction dominates the lower-pressure stage and the compressibility response progressively weakens at higher net pressures. Porosity thresholds of approximately 0.8–1.2% and surface-porosity thresholds of approximately 0.6–1.0% provide secondary discrimination among samples, whereas PSI thresholds near 1.5 and 2.5 distinguish matrix/dissolution-pore systems from fracture-connected and fracture-dominated pore systems. The consistency between these tree-based decision rules and the experimental trends indicates that the models primarily respond to physically meaningful pressure and pore-structure controls.
4.5. Feature Importance and Physical Consistency of the Prediction Model
Although k-nearest neighbors achieved the lowest prediction error on the designated core-held-out test split, the LOCO analysis in Section 4.4 showed that AdaBoost provided greater robustness for completely unseen cores. KNN was nevertheless retained for the following permutation-importance and physical-consistency analyses because it was the best-performing model in the designated test-set comparison. Accordingly, the interpretation below characterizes the feature dependence and physical behavior of the split-specific KNN model rather than implying superior cross-core generalization. Since KNN does not provide built-in feature importance, permutation importance was used to evaluate the relative contribution of each input variable.
As shown in Figure 6a, within the split-specific KNN model, net pressure showed the largest permutation importance (38.6%), followed by porosity (24.8%), surface porosity (15.7%), and pore-structure index (10.6%). The relatively low contribution of temperature should be interpreted within the experimental design. Although temperature was included as a physical input because the 12 core plugs were tested under different formation-relevant temperatures (162–177 °C), the temperature range was narrower than the variation of net pressure and pore-structure-related parameters. Therefore, its lower permutation importance reflects the limited temperature variability within the present dataset rather than the absence of a thermodynamic effect on pore-volume compressibility. The PSI contribution represents the predictive importance of the ordinal pore-structure descriptor used in the KNN model rather than a direct quantitative measure of mechanical compliance. Because adjacent PSI values do not necessarily represent equal physical differences among pore-structure classes, the sensitivity of model performance to the encoding scheme was further evaluated using one-hot encoding. The limited variation after one-hot transformation indicates that the main predictive conclusions are not strongly dependent on the ordinal spacing assumption. Because several core-level descriptors characterize related aspects of pore space, the permutation-importance values should not be interpreted as independent causal contributions of individual variables. In particular, porosity, initial pore volume, and surface porosity may contain overlapping information regarding pore-space abundance; therefore, the reported importance values represent feature contributions within the combined prediction framework rather than isolated effects after removal of inter-feature dependence.
Temperature was retained as an input feature because the experimental temperatures differed among the 12 core plugs, ranging from 162 to 177 °C. However, for each individual core plug, temperature remained constant during the eight pressure-loading steps. Therefore, temperature represents a core-level experimental variable rather than a pressure-dependent variable within a single core. Its permutation importance should be interpreted as a predictive contribution associated with cross-core variations and possible covariance with other core-level characteristics, rather than as an independent causal temperature effect. This model-specific ranking is broadly consistent with the experimental trends in Section 4.1, Section 4.2 and Section 4.3, but should not be interpreted as a universal feature hierarchy for unseen cores. Net pressure directly controls the compaction state of the pore-fracture system, while porosity and pore-structure indicators determine the amount and mechanical compliance of deformable pore space.
The physical consistency of the prediction model was further checked using the pressure-dependent trend of normalized pore-volume compressibility. As shown in Figure 6b, the predicted normalized Cp followed the same decreasing trend as the measured values when net pressure increased. The model reproduced the rapid decline at low net pressures and the gradual flattening at higher net pressures. To make this assessment quantitative, monotonicity was evaluated over the seven adjacent pressure intervals between the eight experimental net-pressure levels. For the aggregate predicted normalized Cp curve shown in Figure 6b, no monotonicity violation was observed (0 of 7 intervals), and the maximum positive increment between two successive pressure levels was therefore zero. This confirms quantitatively that the displayed prediction preserves the expected pressure-dependent decrease rather than demonstrating consistency only through visual agreement. This consistency indicates that the model did not merely fit numerical values, but also retained the main stress-sensitive behavior observed in the volumetric experiments. In addition to monotonicity assessment, the predicted Cp values were checked for physical plausibility. No negative Cp predictions were obtained within the evaluated test responses, indicating that the optimized model did not generate physically impossible compressibility values. Core-wise residual analysis of the nested LOCO predictions showed that prediction errors varied among the 12 completely held-out cores. For KNN, the core-wise RMSE ranged from 3.7406 to 26.9320 × 10⁻⁴ MPa−1 and the MBE ranged from −21.6375 to +6.7108 × 10⁻⁴ MPa−1; for AdaBoost, the corresponding ranges were 3.9786–16.9290 × 10⁻⁴ MPa−1 and −12.2942 to +13.1071 × 10⁻⁴ MPa−1, respectively. The largest KNN errors occurred for C-15 and C-23, and the maximum absolute residual occurred at 10 MPa for 10 of the 12 held-out cores, indicating that unseen-core prediction errors were concentrated mainly in the low-net-pressure, high-compressibility regime; detailed core-wise statistics are provided in Supplementary Table S2.
However, the interpretation of KNN should remain cautious. The model relies on local similarity among samples, and its prediction accuracy can be affected by data scaling, sample density, and the splitting strategy of the dataset. If different pressure points from the same core are simultaneously included in the training and testing sets, the model performance may be overestimated. The LOCO analysis reported in Section 4.4 directly addresses this potential information leakage associated with multiple pressure observations from the same core and provides a more conservative assessment of unseen-core generalization. Because porosity, permeability, initial pore volume, surface porosity, and pore-structure type are core-level static descriptors, they could act as core-specific fingerprints under record-wise random splitting. The core-ID-based LOCO procedure removes this potential leakage pathway by excluding all observations from the held-out core during model development. Nevertheless, the LOCO results should be interpreted as generalization to unseen cores within the petrophysical and pore-structure domain represented by the present dataset rather than extrapolation to carbonate reservoirs outside this domain. In the LOCO procedure, each of the 12 core plugs, together with all eight of its pressure observations, served once as a completely held-out test group; therefore, the RMSE and R2 values reported in Section 4.4 represent prediction performance for cores that were entirely excluded from model development. However, Figure 6b represents the aggregate pressure-dependent physical-consistency comparison rather than separate core-wise LOCO prediction trajectories. Accordingly, the absence of monotonicity violations in the aggregate curve should not be interpreted as proof that every individual unseen-core prediction is strictly monotonic. Because only 12 independent cores are currently available and KNN does not directly provide a probabilistic predictive distribution, a statistically robust core-specific uncertainty band cannot yet be estimated without imposing additional distributional assumptions. Rather than introducing a potentially misleading confidence band, this limitation is explicitly acknowledged here. Nevertheless, the present dataset contains only 12 core plugs; therefore, further validation using additional independent core samples and field production data is still required before applying the model to reservoir-scale prediction.
4.6. Implications for Dynamic Reserve Evaluation and Potential Development Applications
The pressure-dependent behavior of pore-volume compressibility may have important implications for dynamic reserve evaluation in ultra-deep fractured-vuggy carbonate reservoirs. In conventional material-balance or pressure-decline analysis, rock compressibility is often treated as a constant parameter. This simplification may be acceptable for reservoirs with relatively uniform pore systems and weak stress sensitivity, but it is less suitable for fractured-vuggy carbonate reservoirs, where fractures, vugs, and dissolution pores respond differently to increasing effective stress.
The results in Section 4.1, Section 4.2 and Section 4.3 show that Cp changes markedly during pressure loading. At low net pressures, the closure of open fractures and weakly supported pore space contributes to a higher compressibility response. As net pressure increases, the pore-fracture system becomes progressively compacted, and the compressibility gradually decreases. Therefore, a single constant Cp may overestimate or underestimate the elastic energy contribution of the rock framework at different development stages. A pressure-dependent Cp(p) relationship is more appropriate for describing the changing storage capacity of fractured-vuggy carbonate rocks during depletion.
For example, taking representative experimental values of Cp ≈ 40 × 10−4 MPa−1 during the relatively early depletion stage and Cp ≈ 13 × 10−4 MPa−1 at a later, more compacted stage, a 20 MPa pressure decline would correspond to an approximate rock-elastic pore-volume change of 8.0% and 2.6% of pore volume, respectively, according to ΔVp/Vp ≈ CpΔp. If the late-stage value were incorrectly used as a constant during the early stage, the rock-compressibility contribution would be underestimated by approximately 67.5%; conversely, using the early-stage value at the late stage would overestimate this contribution by about 208%. This calculation is intended only as an illustrative sensitivity estimate of the rock-compressibility contribution and does not constitute a field-scale reserve calculation; the actual reserve response also depends on fluid properties, production history, reservoir connectivity, and other material-balance terms.
The machine learning model is intended to complement, rather than replace, core characterization by reducing the need to determine a complete high-temperature and high-pressure Cp(P) curve for every additional core plug. This is particularly relevant to the Fuman Oilfield, where the target Ordovician intervals are buried at depths greater than 7000 m and full Cp(P) characterization requires repeated high-temperature and high-pressure equilibrium measurements over multiple pressure steps. Porosity, permeability, initial pore volume, surface porosity, and pore-structure type are static or once-per-core descriptors; these descriptors can generally be obtained once for each core. Within the experimental domain represented by the present cores, these descriptors, together with reservoir temperature and target net pressure, may provide a supplementary basis for estimating pressure-dependent Cp and for identifying cores for which complete high-temperature and high-pressure characterization would be most valuable. Such estimates should not be regarded as substitutes for independent core measurements or field-scale calibration. The experimental net-pressure interval of 10–140 MPa defines the applicable pressure domain of the present model. Net pressures within this interval, such as 60–90 MPa, are therefore treated as interpolation within the trained range, whereas predictions outside 10–140 MPa represent extrapolation and require additional validation.
To examine whether this multivariable approach provides information beyond a simple pressure–compressibility relationship, a pore-structure-specific exponential benchmark was additionally evaluated using the same training and test partition. The benchmark was expressed as
where A, b, and C∞ were fitted separately for each pore-structure type using only the training data. On the independent test set, this type-specific exponential baseline yielded an RMSE of 6.9872 × 10⁻⁴ MPa−1, an R2 of 0.9116, and an MBE of −0.9643 × 10⁻⁴ MPa−1. In comparison, KNN achieved an RMSE of 4.1843 × 10⁻⁴ MPa−1, an R2 of 0.9683, and an MBE of +0.3876 × 10⁻⁴ MPa−1. Thus, the multivariable model reduced RMSE by approximately 40.1% relative to the pore-type-specific exponential baseline. This comparison indicates that pressure and pore-structure class capture much of the first-order trend, but additional sample-specific information is required to describe the variability among cores belonging to the same broad pore-structure category. The benchmark results are summarized in Supplementary Table S1.
The apparent grouping of C-1/C-3 and C-6/C-8 in the normalized curves of Figure 2b should not be interpreted as two additional reservoir classes. Normalization removes the absolute magnitude of Cp and emphasizes the shape of its pressure-dependent decline. For example, C-1 and C-3 have permeability values of 0.38 and 0.12 mD, whereas C-6 and C-8 have values of 0.018 and 0.075 mD, respectively. Although the permeability contrast is pronounced between some samples, such as C-1 and C-6, it is much smaller between C-3 and C-8. Across all 12 cores, permeability is also strongly associated with pore-structure index and surface porosity (Spearman ρ = 0.957 and 0.837, respectively; p < 0.001). Consequently, its relatively low permutation importance does not imply that permeability is physically unimportant; rather, much of its predictive information is shared with the pore-structure variables already present in the model. Min–max scaling changes the numerical range of permeability but does not remove its rank ordering or underlying relationship with pore structure.
The present dataset nevertheless remains limited in its coverage of the multidimensional parameter space. The 12 core plugs do not constitute a fully factorial combination of porosity, permeability, surface porosity, and pore-structure type, and the present model should therefore be interpreted as a sample-scale prediction framework rather than a universal carbonate-reservoir correlation. The importance of explicitly accounting for such heterogeneity is also supported by Al-Yaari et al. [31], who showed that variations in porosity and permeability within heterogeneous porous media materially affect the simulation and performance of nanofluid-assisted enhanced oil recovery, further illustrating the sensitivity of reservoir-development responses to heterogeneous porous-medium properties. To make the degree of parameter overlap directly assessable, the complete 96-record dataset, including core ID, net pressure, porosity, permeability, temperature, initial pore volume, surface porosity, pore-structure index, and measured Cp, is provided in Supplementary Data S1. Further validation with additional cores that increase the overlap among pore-structure and petrophysical-property ranges is required before broader field-scale application. Accordingly, the present results should be regarded as a laboratory- and sample-scale framework for informing future reserve evaluation rather than as a validated basis for direct field-scale reserve calculation or production-adjustment decisions.
4.7. Limitations and Future Work
Although the experimental and machine learning results provide useful insights into pore-volume compressibility prediction in ultra-deep fractured-vuggy carbonate reservoirs, several limitations should be acknowledged. First, the experimental dataset is still limited by the number and representativeness of available core samples. Fractured-vuggy carbonate rocks are highly heterogeneous, and plug-scale measurements may not fully capture the large-scale fracture-vug networks developed in the reservoir. Therefore, the predicted Cp values should be interpreted as sample-scale responses rather than direct field-scale compressibility values.
Second, the pore-structure indicators used in this study mainly describe the visible pore and fracture features of the tested samples. Although surface porosity and pore-structure type help explain the scatter in the porosity–compressibility relationship, they cannot fully represent three-dimensional pore connectivity, fracture aperture distribution, or vug connectivity. The equivalent diameter and aspect ratio derived from the optical images were used primarily for object-level segmentation and pore-structure classification rather than as complete three-dimensional pore-shape descriptors. A sample-averaged pore size or aspect ratio was therefore not introduced because such values would be strongly affected by two-dimensional sectioning, image resolution, and the simultaneous presence of matrix pores, dissolution pores, vugs, and fractures at very different scales. Fractal dimension was also not calculated because the two-dimensional end-face images do not provide a sufficiently broad and controlled spatial scale range for robust multi-scale fractal characterization. In addition, because no pre-recovery in situ imaging was available, a possible contribution of stress-release fractures generated during core recovery cannot be completely excluded. Future work should incorporate micro-CT, thin-section image analysis, nuclear magnetic resonance, ultrasonic P- and S-wave measurements, quantitative pore-shape characterization, or image logging data to build a more quantitative multi-scale pore-structure description and to distinguish natural fracture architecture from possible recovery-induced fracture features.
Third, the current machine learning model was trained within the pressure, porosity, temperature, and pore-structure ranges covered by the experimental dataset. Although temperature varied among the 12 core plugs, each individual plug was tested at only one fixed temperature. Consequently, the present dataset does not contain within-core temperature variation and cannot independently separate a direct temperature effect from other core-specific petrophysical and pore-structure differences. Temperature should therefore be regarded as a core-level experimental covariate in the present model, and dedicated repeated-temperature tests on the same core plugs would be required to quantify its independent physical effect. Its predictive reliability may decrease when applied to samples outside these ranges or to reservoirs with different diagenetic histories and fracture-vug architectures. In particular, KNN is sensitive to sample density, feature scaling, and dataset partitioning. The additional core-ID-based LOCO validation reduces the risk of information leakage and provides a more conservative assessment of unseen-core generalization; nevertheless, validation using a larger number of independent core plugs remains necessary. The limited number of independent cores also restricts robust estimation of core-specific prediction intervals; therefore, formal uncertainty bands are not interpreted as statistically established confidence limits in the present study. Further validation using additional independent core samples and field-production data is needed to evaluate the broader generalization capability of the model.
Finally, the present work mainly focuses on monotonic loading under controlled laboratory conditions. Because no unloading–reloading cycle was performed, irreversible compaction and hysteresis could not be independently quantified, and the reported Cp values should therefore be interpreted as the apparent compressibility response along the imposed monotonic loading path. Accordingly, integration of Cp over net pressure can be used to estimate the total logarithmic pore-volume strain along the imposed loading path, but this strain cannot be uniquely attributed to fracture closure without independently separating the deformation contributions of fractures, vugs, dissolution pores, and matrix pores. During actual reservoir development, the stress path may involve pressure depletion, injection-induced pressure recovery, cyclic loading, and fluid–rock interactions. These processes may alter pore-fracture compressibility in a way that cannot be fully reproduced by a single loading path. Future studies should therefore consider loading–unloading experiments, variable fluid environments, and coupling with production-performance analysis. Such work would help establish a more robust pressure-dependent Cp(p) model for dynamic reserve evaluation and development adjustment in ultra-deep fractured-vuggy carbonate reservoirs.
5. Conclusions
This study investigated the pore-volume compressibility of ultra-deep fractured-vuggy carbonate reservoirs using high-temperature and high-pressure volumetric experiments combined with machine learning prediction. Representative carbonate core plugs from the Ordovician Yijianfang and Yingshan formations in the Fuman Oilfield were selected to cover different pore-structure types, including matrix-pore dominated, dissolution-pore-dominated, fracture-vug mixed, and fracture-dominated samples. The experimental results show that pore-volume compressibility is strongly pressure-dependent. With increasing net pressure, Cp decreases rapidly at the early loading stage and then gradually approaches a relatively stable state. For representative samples, the decline is most pronounced before approximately 40 MPa, whereas the variation becomes much weaker after about 100 MPa. This behavior indicates that open fractures, fracture-connected vugs, and weakly supported dissolution pores are progressively compacted during pressure loading, while the remaining pore volume is increasingly constrained by the carbonate framework.
In terms of pore-property controls, porosity shows a positive relationship with Cp, but it cannot independently explain the compressibility response of fractured-vuggy carbonate rocks. The porosity–Cp relationship becomes less sensitive as net pressure increases, suggesting that part of the deformable pore space is gradually closed during loading. Further analysis of pore-structure indicators shows that fracture-dominated samples generally exhibit higher compressibility and stronger stress sensitivity than matrix-pore-dominated samples. The stress sensitivity index follows the order of fracture-dominated, fracture-vug mixed, dissolution-pore-dominated, and matrix-pore-dominated samples. These results demonstrate that the compressibility response is jointly controlled by net pressure, total pore volume, pore-space geometry, and the mechanical compliance of the pore-fracture system.
Based on the experimental dataset, eight representative regression algorithms were compared for pore-volume compressibility prediction. Because the 96 pressure-dependent observations originated from only 12 independent core plugs, the algorithm comparison was interpreted as a comparative assessment of representative model families under the present experimental conditions rather than as a universal ranking of regression methods. On the designated core-held-out test partition, the k-nearest neighbors model achieved the lowest prediction error among the tested models, with an RMSE of 4.1843 × 10⁻⁴ MPa−1 and an R2 of 0.9683, followed by AdaBoost. However, nested leave-one-core-out group validation further showed that KNN yielded an RMSE of 13.5978 × 10⁻⁴ MPa−1 and an R2 of 0.8408, whereas AdaBoost achieved an RMSE of 10.0160 × 10⁻⁴ MPa−1 and an R2 of 0.9136. These results indicate that KNN provides higher prediction accuracy on the designated test partition, whereas AdaBoost exhibits greater robustness when generalizing to completely unseen core plugs. Linear regression and ElasticNet showed relatively limited predictive capability compared with the leading nonlinear models, indicating that the relationship between Cp and its controlling factors is evidently nonlinear. Feature-importance analysis of the split-specific KNN model indicated that net pressure, porosity, surface porosity, and pore-structure index made the largest predictive contributions within that model; this ranking should therefore be interpreted as model- and split-specific rather than as a universal hierarchy for unseen cores. The predicted normalized Cp also follows the experimentally observed pressure-dependent decreasing trend, suggesting that the KNN prediction results retain the main physical behavior of stress-sensitive pore-volume compression. These findings provide a pressure-dependent compressibility evaluation framework for the investigated Fuman Oilfield cores and illustrate its potential relevance to similar ultra-deep fractured-vuggy carbonate settings. Further validation using additional independent core samples from other geological settings and field production data is still needed before extending the model to reservoir-scale applications.
Supplementary Materials
The following supporting information can be downloaded at: https://www.mdpi.com/article/10.3390/pr14182952/s1, Supplementary Figure S1: Overall workflow from core selection and volumetric measurement to data processing, feature engineering, and machine learning prediction; Supplementary Data S1: Complete record-level dataset used for pore-volume compressibility modeling and model evaluation (.csv); Table S1: Comparison between the pore-structure-specific exponential baseline and the optimized KNN model on the independent test set; Table S2: Core-wise residual statistics for KNN and AdaBoost under nested leave-one-core-out validation; Table S3: Feature-set ablation results for AdaBoost under nested core-ID-based leave-one-core-out validation.
Author Contributions
Conceptualization, P.W., Y.S., and J.S.; methodology, P.W., F.Z., and Y.D.; software, C.X. and M.W.; validation, Y.D., C.X., and M.W.; formal analysis, P.W., F.Z., and Y.S.; investigation, P.W., Y.D., and C.X.; resources, F.Z. and J.S.; data curation, M.W. and Y.D.; writing—original draft preparation, P.W.; writing—review and editing, Y.S., J.S., and F.Z.; visualization, C.X. and M.W.; supervision, Y.S. and J.S.; project administration, F.Z. and Y.S. All authors have read and agreed to the published version of the manuscript.
Funding
This research was funded by the Natural Science Foundation of Shandong Province, grant number ZR2023YQ034.
Data Availability Statement
The original contributions presented in this study are included in the article/Supplementary Material. Further inquiries can be directed to the corresponding author.
Conflicts of Interest
Authors Peng Wang, Fei Zhou, Yao Ding, Cong Xu and Mimi Wu were employed by the Tarim Oilfield Company, PetroChina. The remaining authors declare that the research was conducted in the absence of any commercial or financial relationships that could be construed as a potential conflict of interest. The Tarim Oilfield Company, PetroChina had no role in the design of the study; in the collection, analyses, or interpretation of data; in the writing of the manuscript, or in the decision to publish the results.
References
- Jiao, F. Practice and Knowledge of Volumetric Development of Deep Fractured-Vuggy Carbonate Reservoirs in Tarim Basin, NW China. Pet. Explor. Dev. 2019, 46, 576–582. [Google Scholar] [CrossRef] [Scilit]
- Ma, Y.; Cai, X.; Yun, L.; Li, Z.; Li, H.; Deng, S.; Zhao, P. Practice and Theoretical and Technical Progress in Exploration and Development of Shunbei Ultra-Deep Carbonate Oil and Gas Field, Tarim Basin, NW China. Pet. Explor. Dev. 2022, 49, 1–20. [Google Scholar] [CrossRef] [Scilit]
- Ma, Y.; Cai, X.; Li, M.; Li, H.; Zhu, D.; Qiu, N.; Pang, X.; Zeng, D.; Kang, Z.; Ma, A.; et al. Research Advances on the Mechanisms of Reservoir Formation and Hydrocarbon Accumulation and the Oil and Gas Development Methods of Deep and Ultra-Deep Marine Carbonates. Pet. Explor. Dev. 2024, 51, 795–812. [Google Scholar] [CrossRef] [Scilit]
- Zhang, Y.; Lin, C.; Ren, L.; Sun, C.; Li, J.; Zhao, X.; Wu, M. Multi-Scale Characterization of Reservoir Space Features in Yueman Area of Fuman Oilfield in Tarim Basin. Processes 2025, 13, 310. [Google Scholar] [CrossRef] [Scilit]
- Li, M.; Wang, Q.; Yao, C.; Chen, F.; Wang, Q.; Zhang, J. Optimization of Development Strategies and Injection-Production Parameters in a Fractured-Vuggy Carbonate Reservoir by Considering the Effect of Karst Patterns: Taking C Oilfield in the Tarim Basin as an Example. Energies 2025, 18, 319. [Google Scholar] [CrossRef] [Scilit]
- Deng, Z.; Zhou, D.; Dong, H.; Huang, X.; Wei, S.; Kang, Z. Deep Learning for Predicting Porosity in Ultra-Deep Fractured Vuggy Reservoirs from the Shunbei Oilfield in Tarim Basin, China. Sci. Rep. 2024, 14, 29605. [Google Scholar] [CrossRef] [Scilit] [PubMed]
- Gong, W.; Wen, X.; Zhou, D. Characteristics and Seismic Identification Mode of Ultra-Deep Carbonate Fault-Controlled Reservoir in Northwest China. Energies 2022, 15, 8598. [Google Scholar] [CrossRef] [Scilit]
- Wang, X.; Wang, J.; Cao, Y.; Han, J.; Wu, K.; Liu, Y.; Liu, K.; Xie, M. Characteristics, Formation Mechanism and Evolution Model of Ordovician Carbonate Fault-Controlled Reservoirs in the Shunnan Area of the Shuntuogole Lower Uplift, Tarim Basin, China. Mar. Pet. Geol. 2022, 145, 105878. [Google Scholar] [CrossRef] [Scilit]
- Li, Y.; Sun, J.; Wei, H.; Song, S. Architectural Features of Fault-Controlled Karst Reservoirs in the Tahe Oilfield. J. Pet. Sci. Eng. 2019, 181, 106208. [Google Scholar] [CrossRef] [Scilit]
- Wang, Y.; Xie, P.; Zhang, H.; Liu, Y.; Yang, A. Fracture-Vuggy Carbonate Reservoir Characterization Based on Multiple Geological Information Fusion. Front. Earth Sci. 2024, 11, 1345028. [Google Scholar] [CrossRef] [Scilit]
- Li, B.; He, Y.; Chen, W.; Shang, H.; Wang, L. Geological Modeling of Carbonate Fracture-Cavity Reservoir: Case Study of Shunbei Fault Zone No. 5. Front. Earth Sci. 2025, 13, 1559030. [Google Scholar] [CrossRef] [Scilit]
- He, S.; Chen, B.; Yuan, F.; Wang, X.; Wang, T. Dynamic Reserve Calculation Method of Fractured-Vuggy Reservoir Based on Modified Comprehensive Compression Coefficient. Processes 2024, 12, 640. [Google Scholar] [CrossRef] [Scilit]
- Tang, J.; Zhang, Z.; Xie, J.; Meng, S.; Xu, J.; Ehlig-Economides, C.; Liu, H. Re-Evaluation of CO2 Storage Capacity of Depleted Fractured-Vuggy Carbonate Reservoir. Innov. Energy 2024, 1, 100019. [Google Scholar] [CrossRef] [Scilit]
- Pimienta, L.; Fortin, J.; Guéguen, Y. New Method for Measuring Compressibility and Poroelasticity Coefficients in Porous and Permeable Rocks. J. Geophys. Res. Solid Earth 2017, 122, 2670–2689. [Google Scholar] [CrossRef] [Scilit]
- Zhu, S.; Du, Z.; Li, C.; You, Z.; Peng, X.; Deng, P. An Analytical Model for Pore Volume Compressibility of Reservoir Rock. Fuel 2018, 232, 543–549. [Google Scholar] [CrossRef] [Scilit]
- Lei, G.; Cao, N.; McPherson, B.J.; Liao, Q.; Chen, W. A Novel Analytical Model for Pore Volume Compressibility of Fractal Porous Media. Sci. Rep. 2019, 9, 14472. [Google Scholar] [CrossRef] [Scilit] [PubMed]
- Sui, W.; Quan, Z.; Hou, Y.; Cheng, H. Estimating Pore Volume Compressibility by Spheroidal Pore Modeling of Digital Rocks. Pet. Explor. Dev. 2020, 47, 603–612. [Google Scholar] [CrossRef] [Scilit]
- Ashena, R.; Behrenbruch, P.; Ghalambor, A. Log-Based Rock Compressibility Estimation for Asmari Carbonate Formation. J. Pet. Explor. Prod. Technol. 2020, 10, 2771–2783. [Google Scholar] [CrossRef] [Scilit]
- Farahani, M.; Aghaei, H.; Saki, M.; Asadolahpour, S.R. Prediction of Pore Volume Compressibility by a New Non-Linear Equation in Carbonate Reservoirs. Energy Geosci. 2022, 3, 290–299. [Google Scholar] [CrossRef] [Scilit]
- Moosavi, S.A.; Aloki Bakhtiari, H.; Honarmand, J. Estimation of Pore Volume Compressibility in Carbonate Reservoir Rocks Based on a Classification. Geotech. Geol. Eng. 2022, 40, 3225–3244. [Google Scholar] [CrossRef] [Scilit]
- Hu, Y.; Guo, Y.; Qing, H.; Hou, Y. Study on Influencing Factors and Mechanism of Pore Compressibility of Tight Sandstone Reservoir—A Case Study of Upper Carboniferous in Ordos Basin. Front. Earth Sci. 2023, 10, 1100951. [Google Scholar] [CrossRef] [Scilit]
- Cheng, M.; Fu, X.; Kang, J. Compressibility of Different Pore and Fracture Structures and Its Relationship with Heterogeneity and Minerals in Low-Rank Coal Reservoirs: An Experimental Study Based on Nuclear Magnetic Resonance and Micro-CT. Energy Fuels 2020, 34, 10894–10903. [Google Scholar] [CrossRef] [Scilit]
- Vali, J.; Haji Zadeh, F. Comparative Evaluation of Pore Volume Compressibility of Carbonate Reservoir Rocks: Different Laboratory Measurement Approaches. Pet. Sci. Technol. 2025, 43, 2922–2942. [Google Scholar] [CrossRef] [Scilit]
- Vali, J.; Haji Zadeh, F. Prediction of Reservoir Compressibility Using Subsurface Cores, Well Logs, and Seismic Data by Neural Network. Geopersia 2025, 15, 1–13. [Google Scholar] [CrossRef]
- Kalule, R.; Sassi, M.; Alameri, W.; Ait Abderrahmane, H. Stacked Ensemble Machine Learning for Porosity and Absolute Permeability Prediction of Carbonate Rock Plugs. Sci. Rep. 2023, 13, 9855. [Google Scholar] [CrossRef] [Scilit] [PubMed]
- Alqahtani, N.; Alzubaidi, F.; Armstrong, R.T.; Swietojanski, P.; Mostaghimi, P. Machine Learning for Predicting Properties of Porous Media from 2D X-Ray Images. J. Pet. Sci. Eng. 2020, 184, 106514. [Google Scholar] [CrossRef] [Scilit]
- Mohammadian, E.; Kheirollahi, M.; Liu, B.; Ostadhassan, M.; Sabet, M. A Case Study of Petrophysical Rock Typing and Permeability Prediction Using Machine Learning in a Heterogeneous Carbonate Reservoir in Iran. Sci. Rep. 2022, 12, 4505. [Google Scholar] [CrossRef] [Scilit]
- Zhou, W.; Liu, C.; Liu, Y.; Zhang, Z.; Chen, P.; Jiang, L. Machine Learning in Reservoir Engineering: A Review. Processes 2024, 12, 1219. [Google Scholar] [CrossRef] [Scilit]
- Tong, K.; Qin, X.; Zhang, B.; Jiang, J.; Luo, Z.; Luo, W. An Interpretable XGBoost-Based Transfer Learning Framework for Stress-Sensitive Pore Volume Compressibility Prediction in Carbonate Rocks. Front. Earth Sci. 2026, 14, 1798079. [Google Scholar] [CrossRef] [Scilit]
- Wang, J.; Zhang, M.; Huang, W.; Zhao, C.; Wang, Y. Pore Pressure Prediction Using DASP-Based Feature Selection and a Physics-Constrained Attention-Enhanced CNN. Processes 2026, 14, 1779. [Google Scholar] [CrossRef] [Scilit]
- Al-Yaari, A.; Ching, D.L.C.; Sakidin, H.; Muthuvalu, M.S.; Zafar, M.; Haruna, A.; Merican, Z.M.A.; Yunus, R.B.; Al-dhawi, B.N.S.; Jagaba, A.H. The Effects of Nanofluid Thermophysical Properties on Enhanced Oil Recovery in a Heterogenous Porous Media. Case Stud. Chem. Environ. Eng. 2024, 9, 100556. [Google Scholar] [CrossRef] [Scilit]
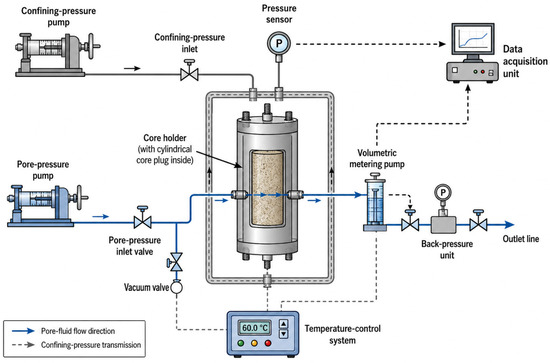
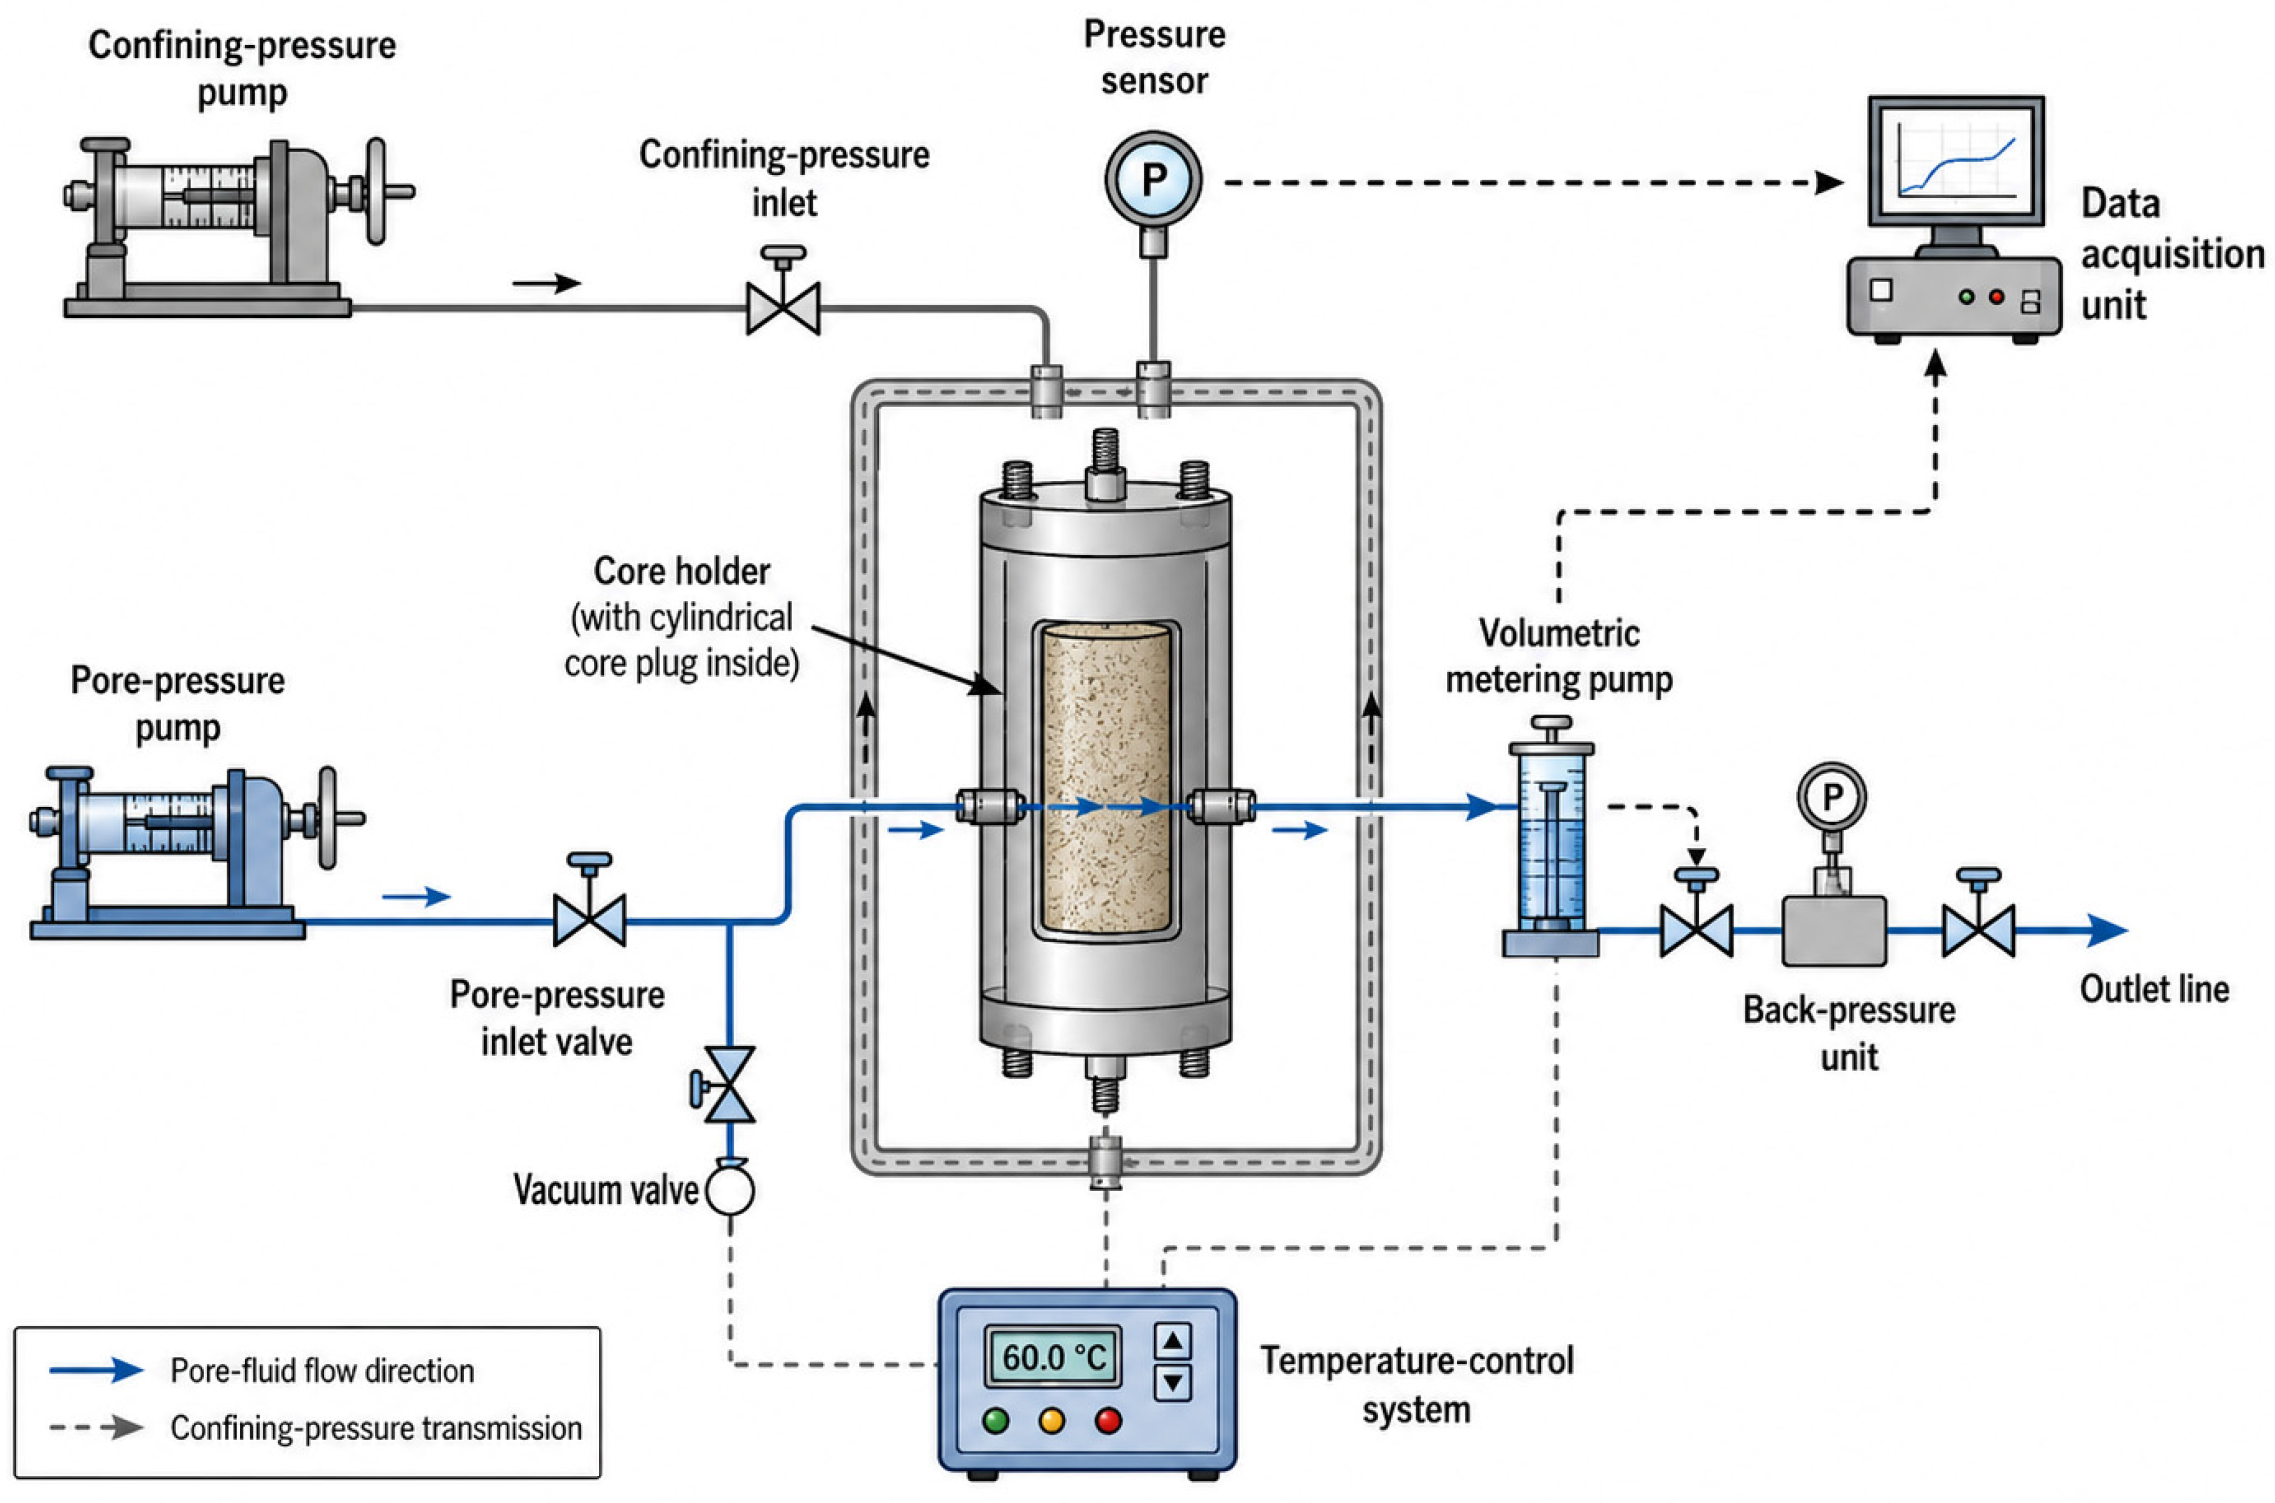
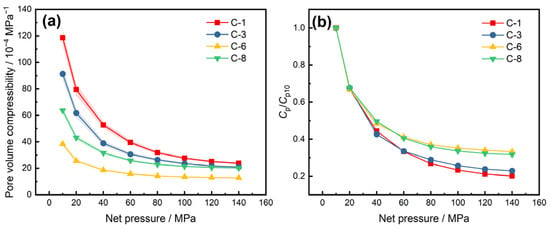
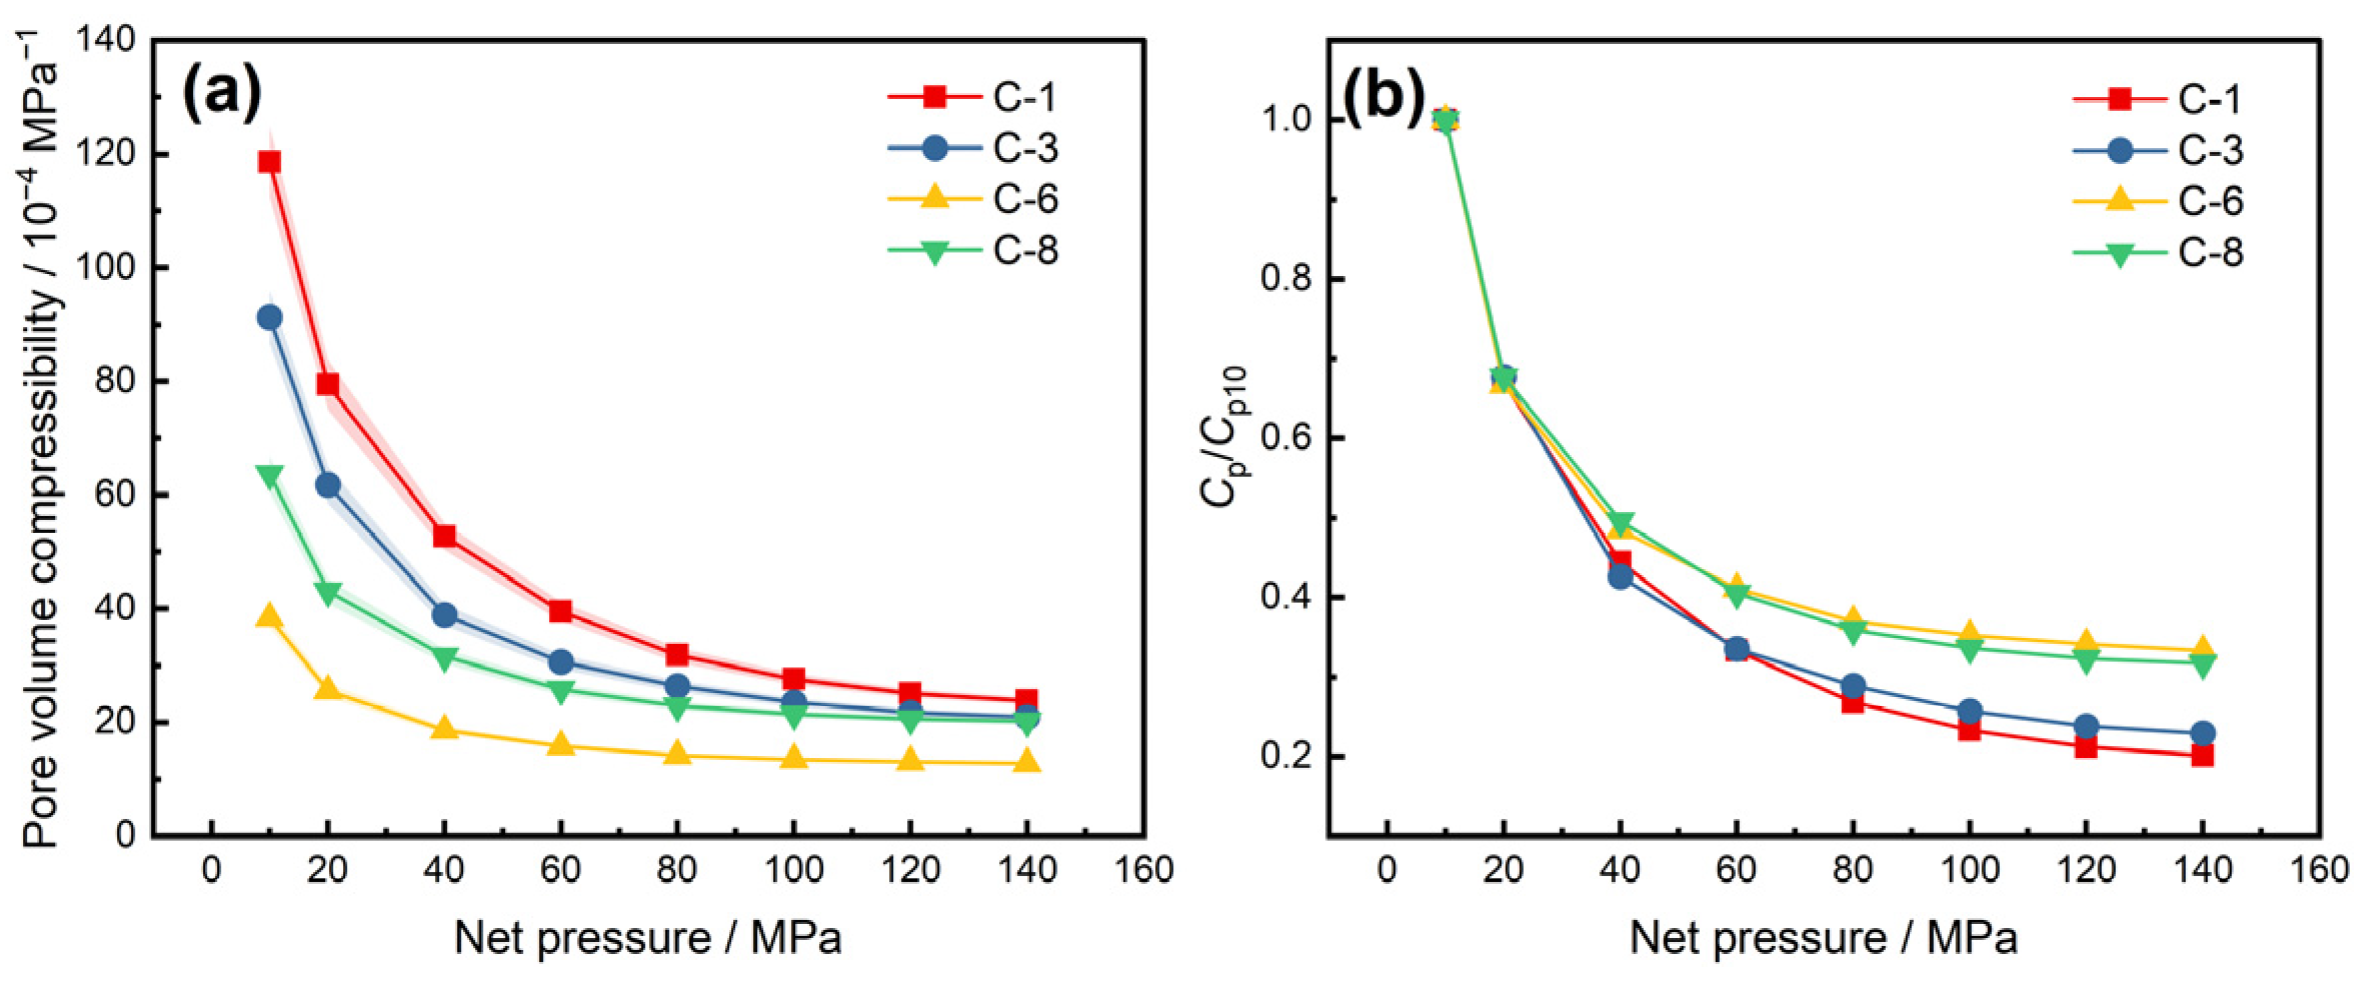
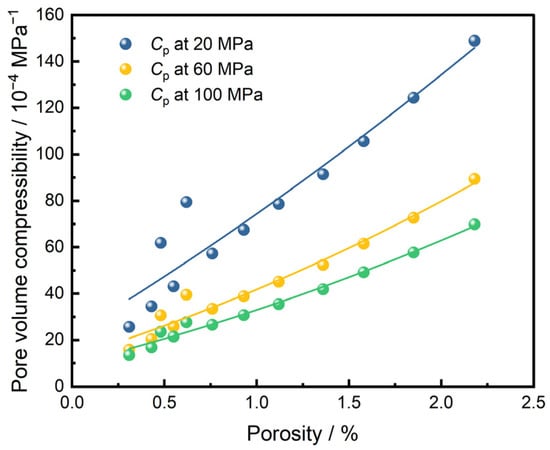
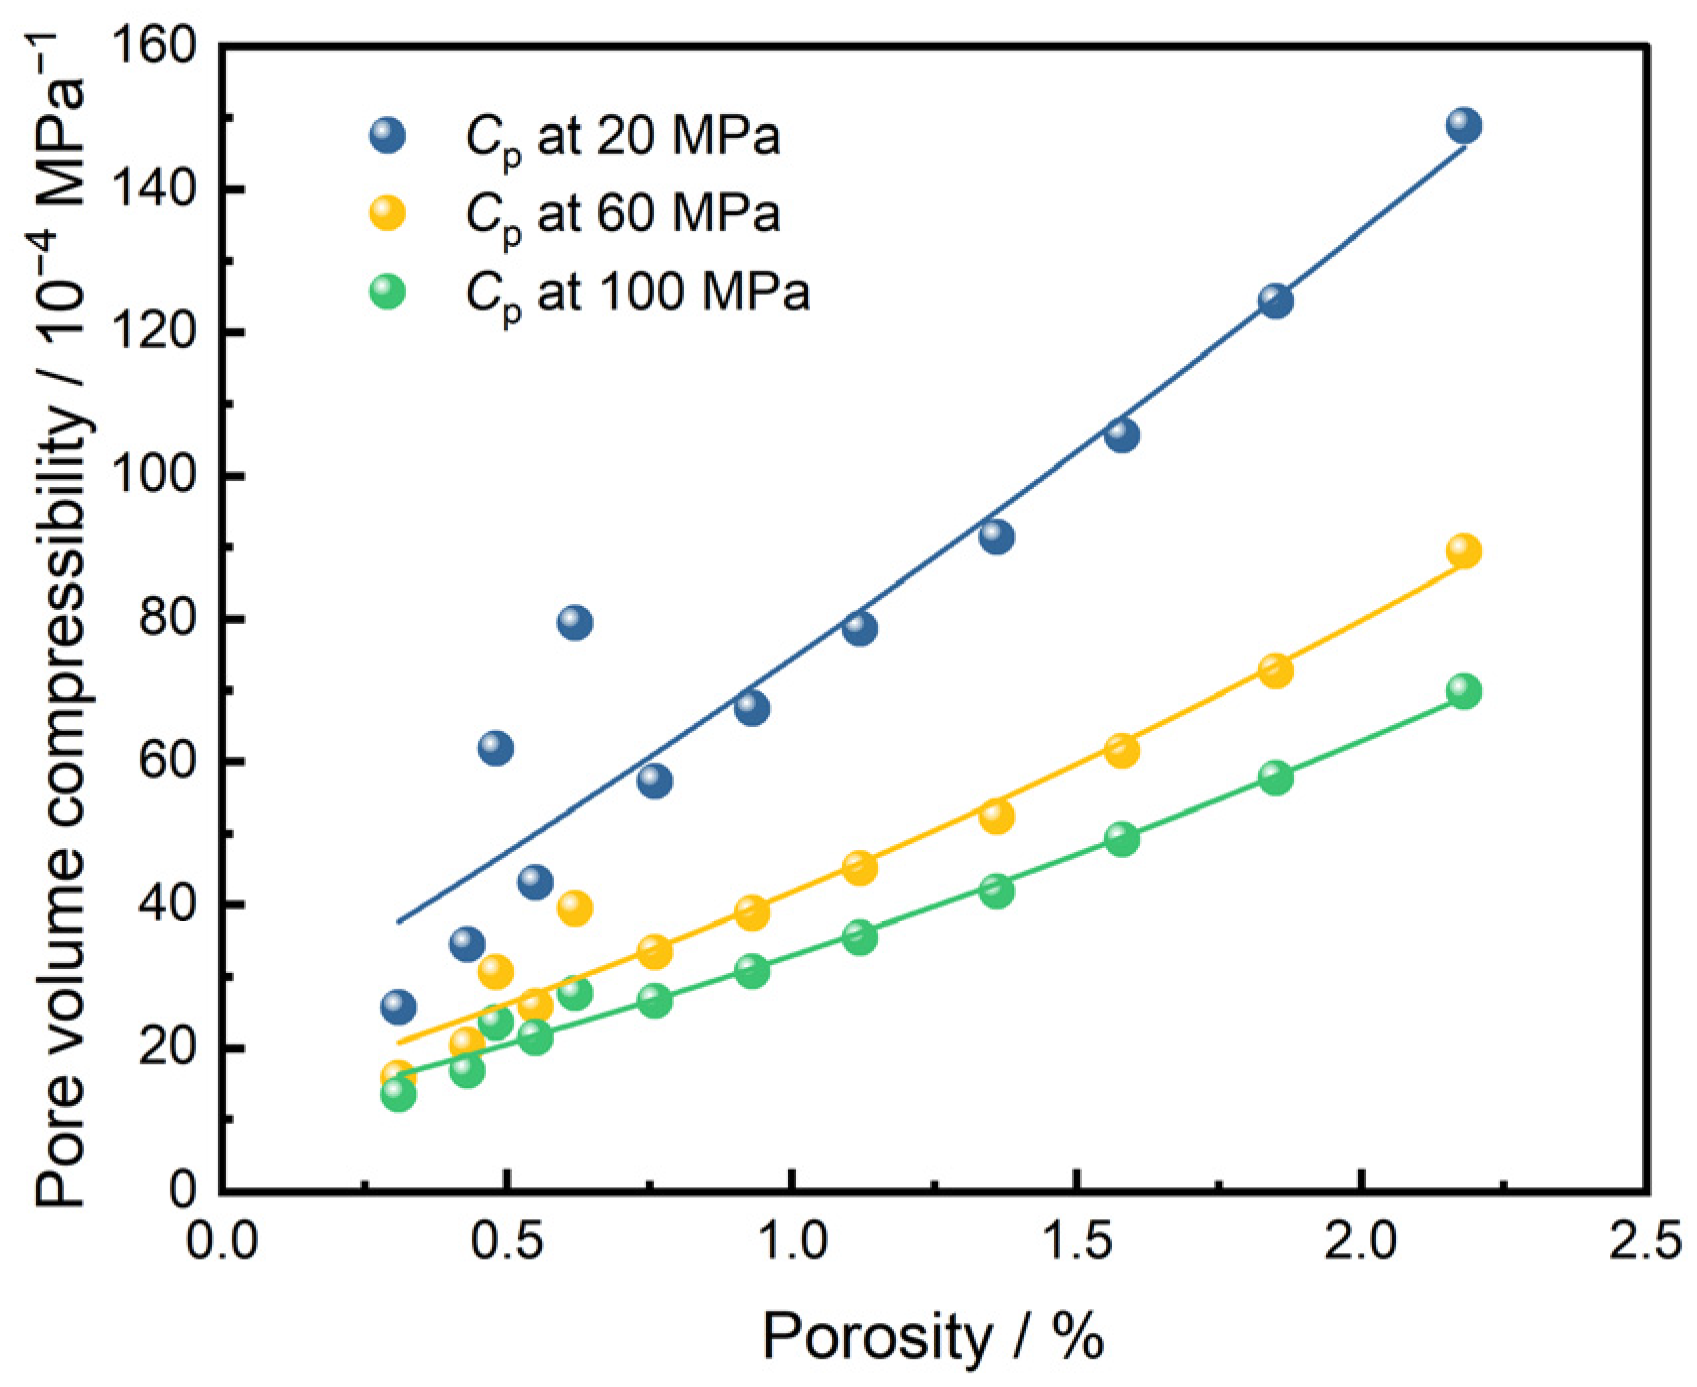
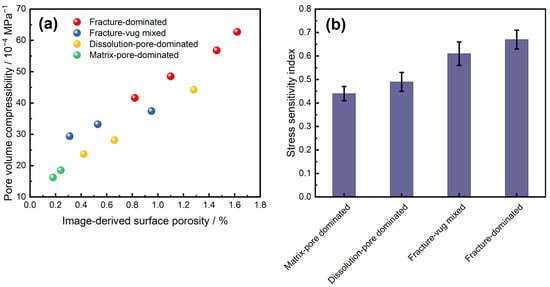
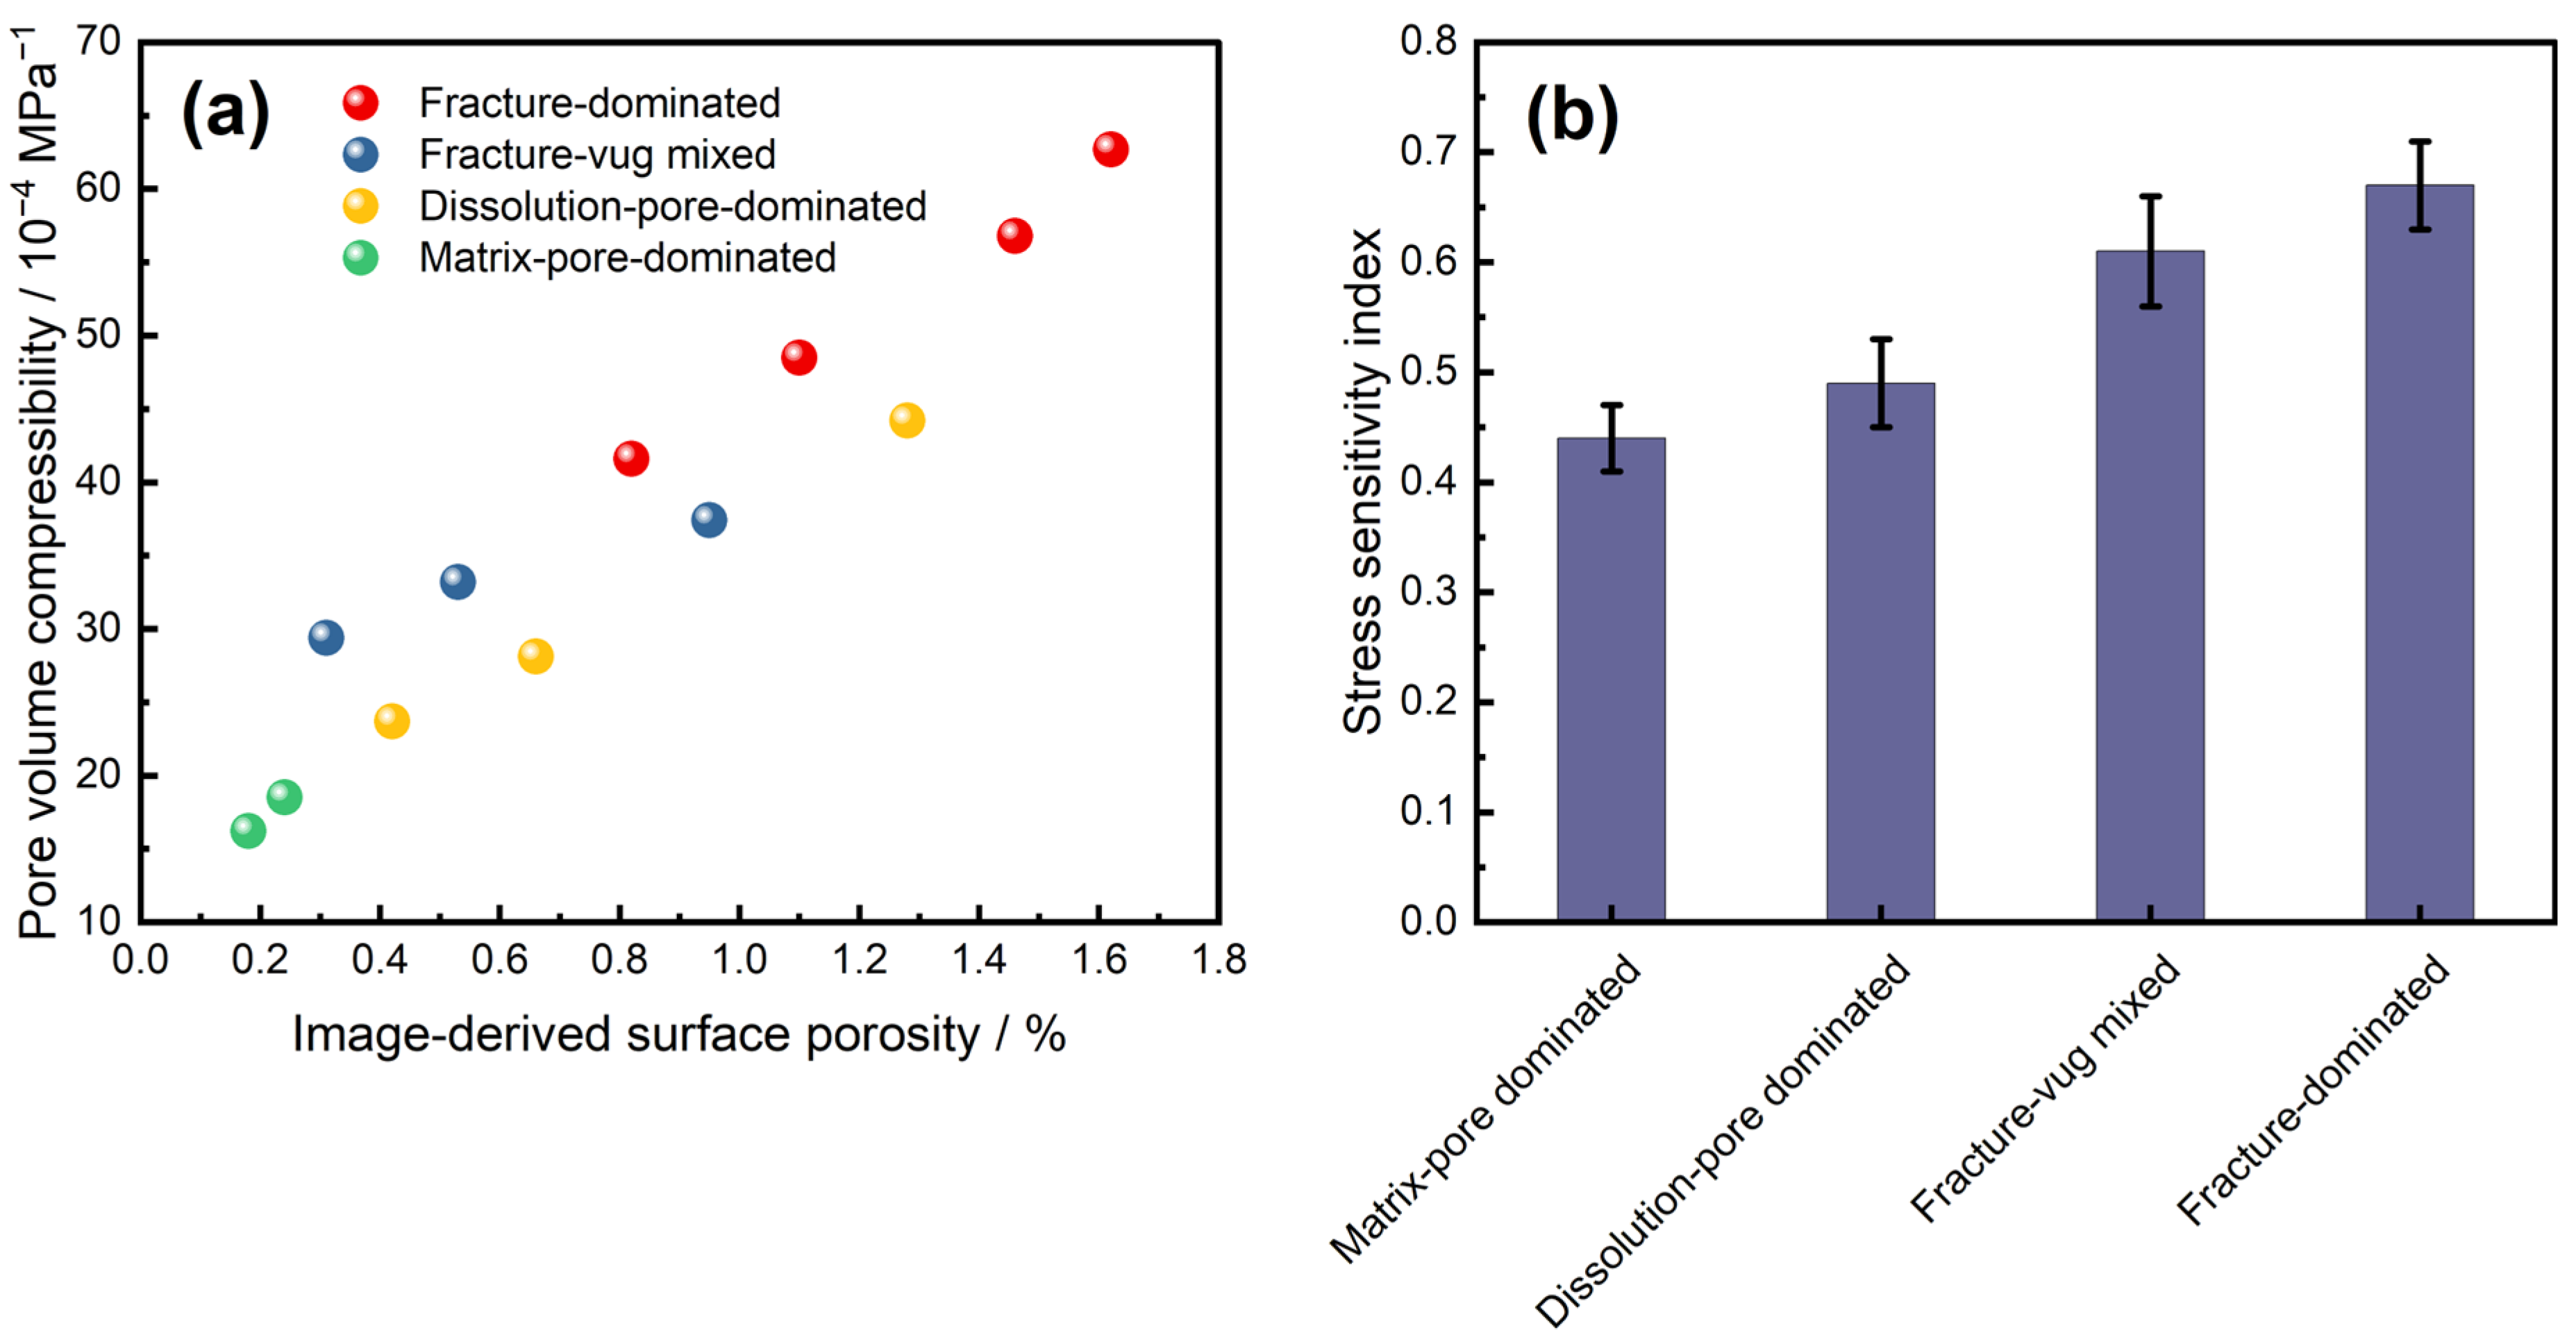
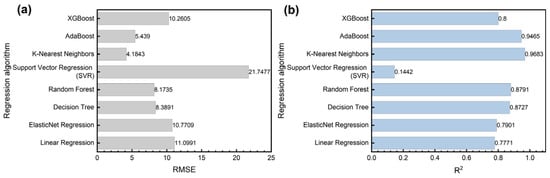
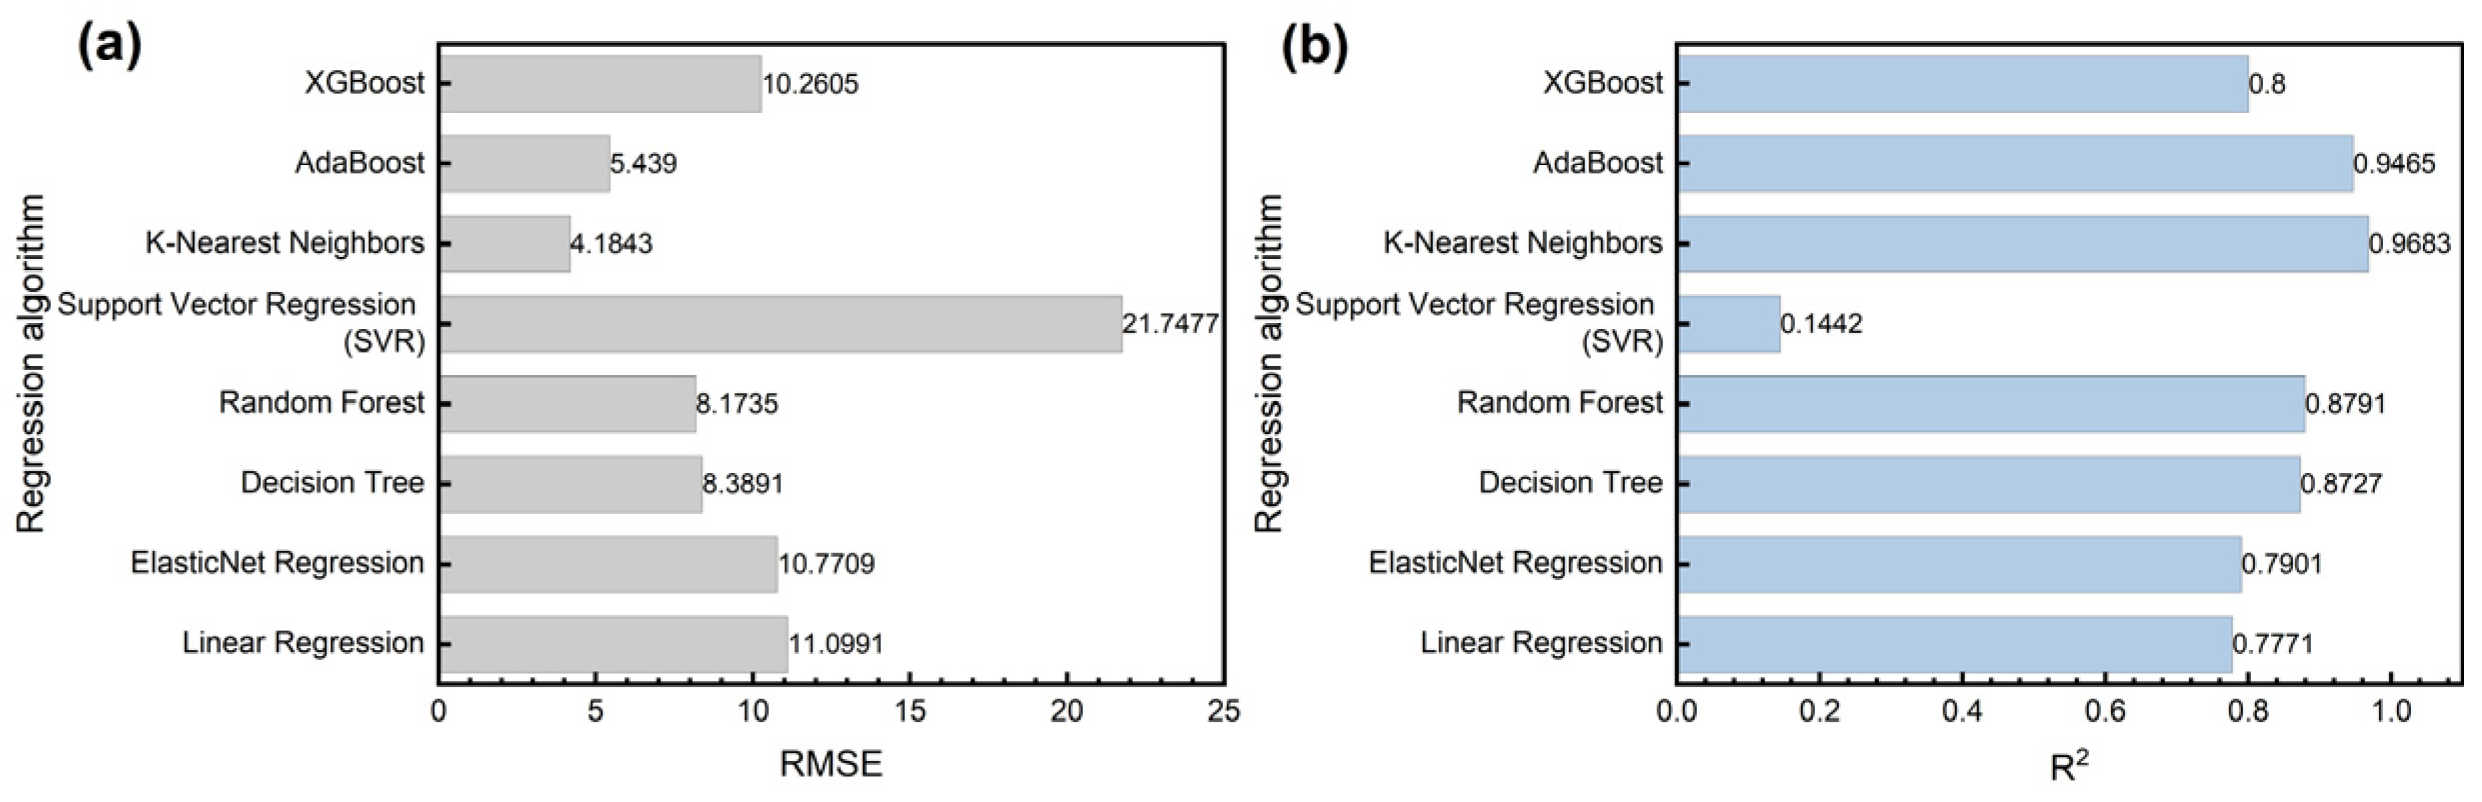
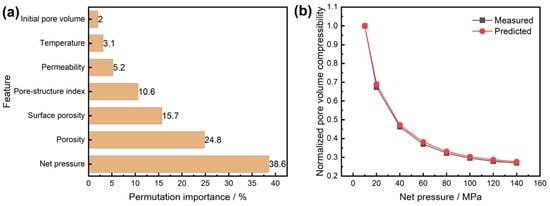
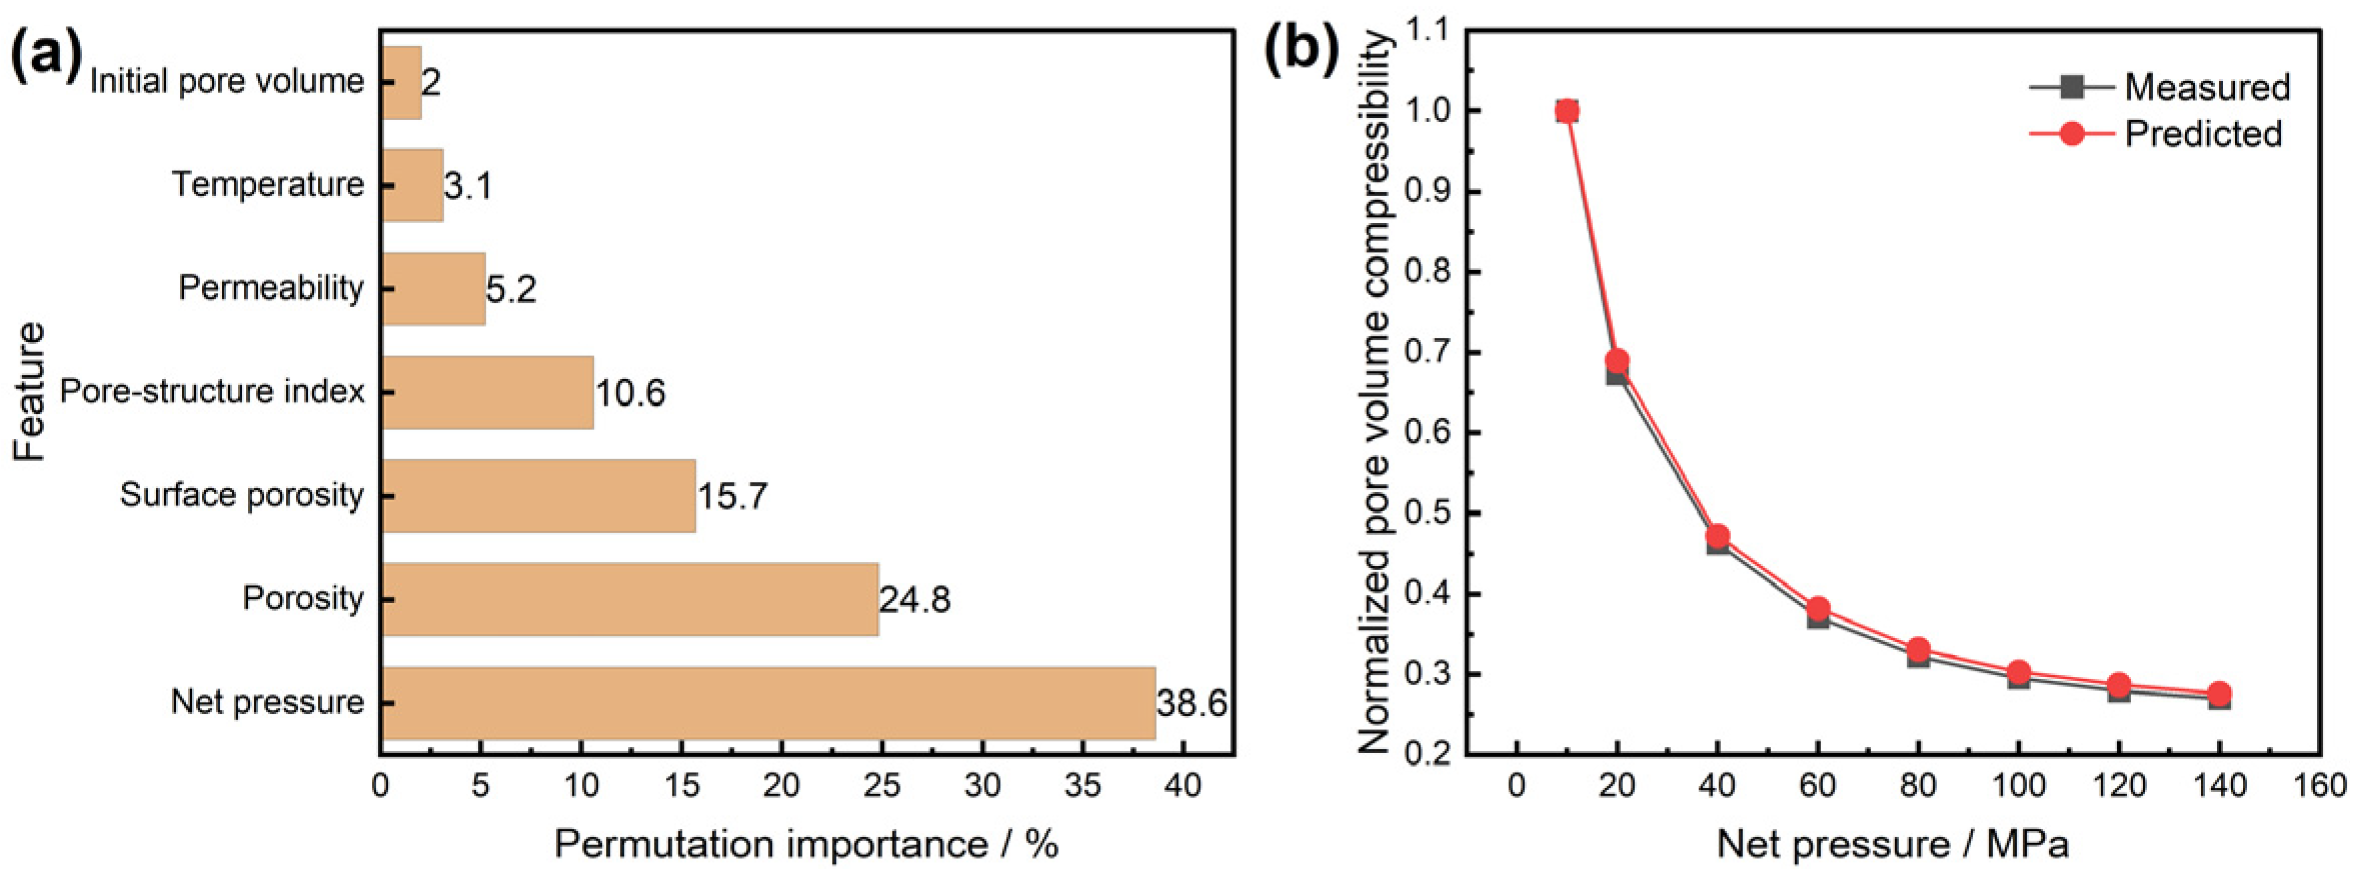

Disclaimer/Publisher’s Note: The statements, opinions and data contained in all publications are solely those of the individual author(s) and contributor(s) and not of MDPI and/or the editor(s). MDPI and/or the editor(s) disclaim responsibility for any injury to people or property resulting from any ideas, methods, instructions or products referred to in the content. |
© 2026 by the authors. Licensee MDPI, Basel, Switzerland. This article is an open access article distributed under the terms and conditions of the Creative Commons Attribution (CC BY) license.