4.1. Experimental Pore-Volume Compressibility Under Different Net Pressures
The pore-volume compressibility (
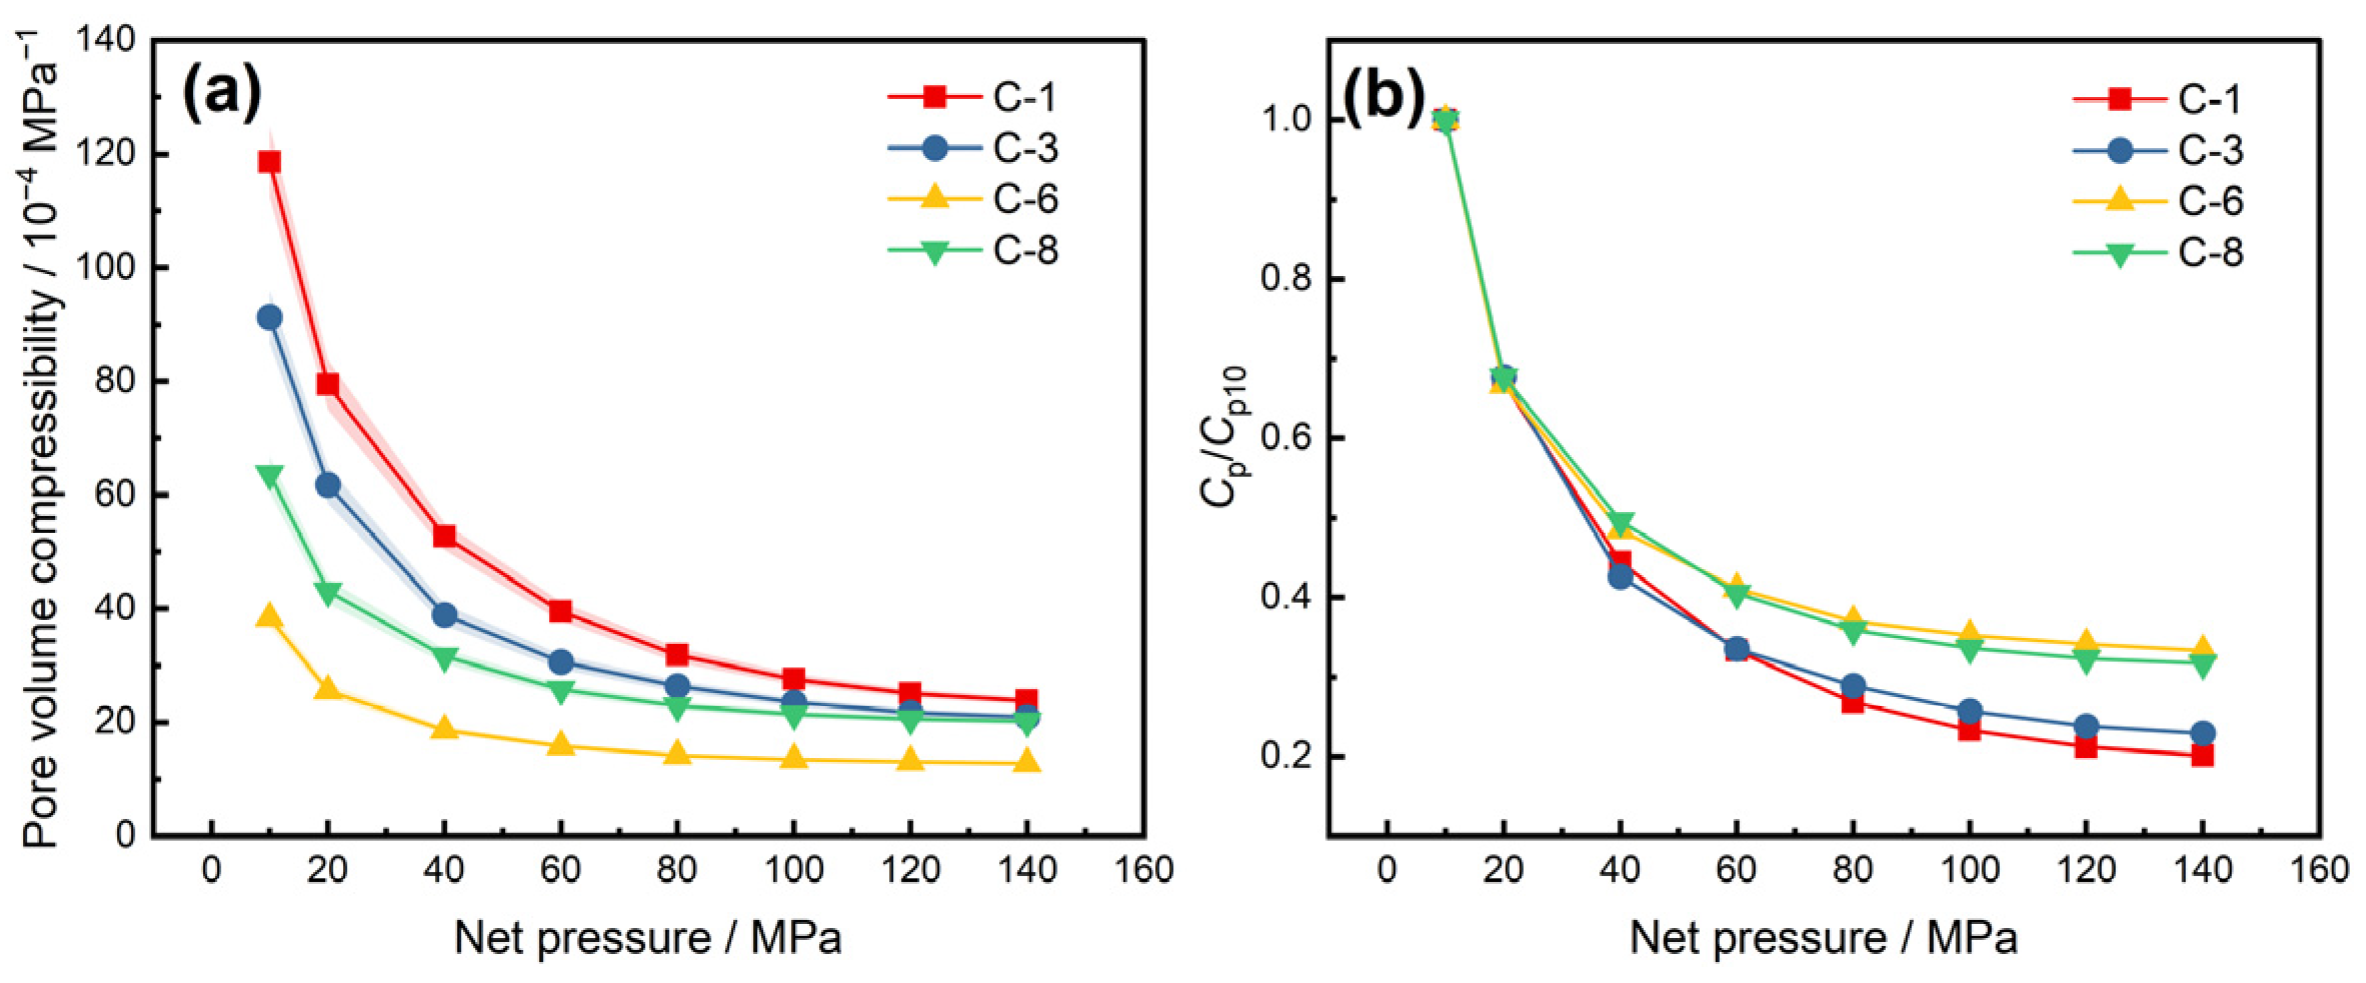
Cp) of representative fractured-vuggy carbonate samples was measured under stepwise increasing net pressures. This pressure path was used to reproduce the progressive increase in effective stress during reservoir pressure depletion. As shown in
Figure 2a,
Cp decreased markedly at lower net pressures and then progressively leveled off as net pressure increased, while the magnitude of the pressure-dependent response varied markedly among different pore-structure types.
The fracture-dominated sample C-1 (
ϕ = 0.62%,
Vp0 = 0.152 mL;
Table 1) showed the highest compressibility, with
Cp decreasing from 118.6 × 10
−4 MPa
−1 at 10 MPa to 23.8 × 10
−4 MPa
−1 at 140 MPa. The fracture-vug mixed sample C-3 decreased from 91.3 × 10
−4 MPa
−1 to 20.9 × 10
−4 MPa
−1 over the same pressure range. In contrast, the matrix-pore-dominated sample C-6 maintained lower values, decreasing from 38.4 × 10
−4 MPa
−1 to 12.8 × 10
−4 MPa
−1. The dissolution-pore-dominated sample C-8 showed an intermediate response, with
Cp changing from 63.7 × 10
−4 MPa
−1 to 20.2 × 10
−4 MPa
−1. These results indicate that samples containing more compliant pore space, especially open fractures and fracture-connected vugs, have greater initial compressibility.
Because 10 MPa was the first net-pressure level included in the experimental loading sequence, the compressibility measured at this pressure was used only as the reference value for normalization and is denoted hereafter as Cp,10. It does not represent a zero-stress or atmospheric-pressure compressibility. No atmospheric-pressure Cp value was used in the normalization, and no assumption of linear or constant compressibility between atmospheric pressure and 10 MPa was made.
The normalized curves in
Figure 2b further show that the decline in
Cp was not linear over the entire pressure range. From 10 to 40 MPa,
Cp/
Cp10 decreased rapidly. At 40 MPa, the normalized values of C-1, C-3, C-6, and C-8 were 0.444, 0.426, 0.484, and 0.496, respectively. This early-stage decrease is interpreted as being associated with the progressive closure of mechanically compliant fractures, narrow pore throats, and weakly supported dissolution pores. When the net pressure exceeded 60 MPa, the curves gradually flattened. After approximately 100 MPa, only slight changes were observed in most samples; for example,
Cp of C-6 decreased from 13.5 × 10
−4 MPa
−1 at 100 MPa to 12.8 × 10
−4 MPa
−1 at 140 MPa.
This pressure-dependent response suggests that the pore-fracture system experienced two main stages during loading. The first stage is characterized by rapid compaction of mechanically sensitive pore space under relatively low net pressure. The second stage corresponds to a more stable compaction state, where the remaining pore volume is mainly supported by the carbonate skeleton and becomes less sensitive to additional pressure increments. Therefore, Cp should not be treated as a constant parameter in ultra-deep fractured-vuggy carbonate reservoirs, particularly during the early stage of pressure depletion.
Although net pressure is the direct external factor controlling pore-volume compression, the differences among samples at the same pressure level indicate that internal rock properties also play an important role. Porosity and pore-structure indicators are therefore further examined in the following sections.
4.2. Effects of Porosity on Pore-Volume Compressibility
Porosity was further examined to clarify whether the pressure-dependent compressibility described in
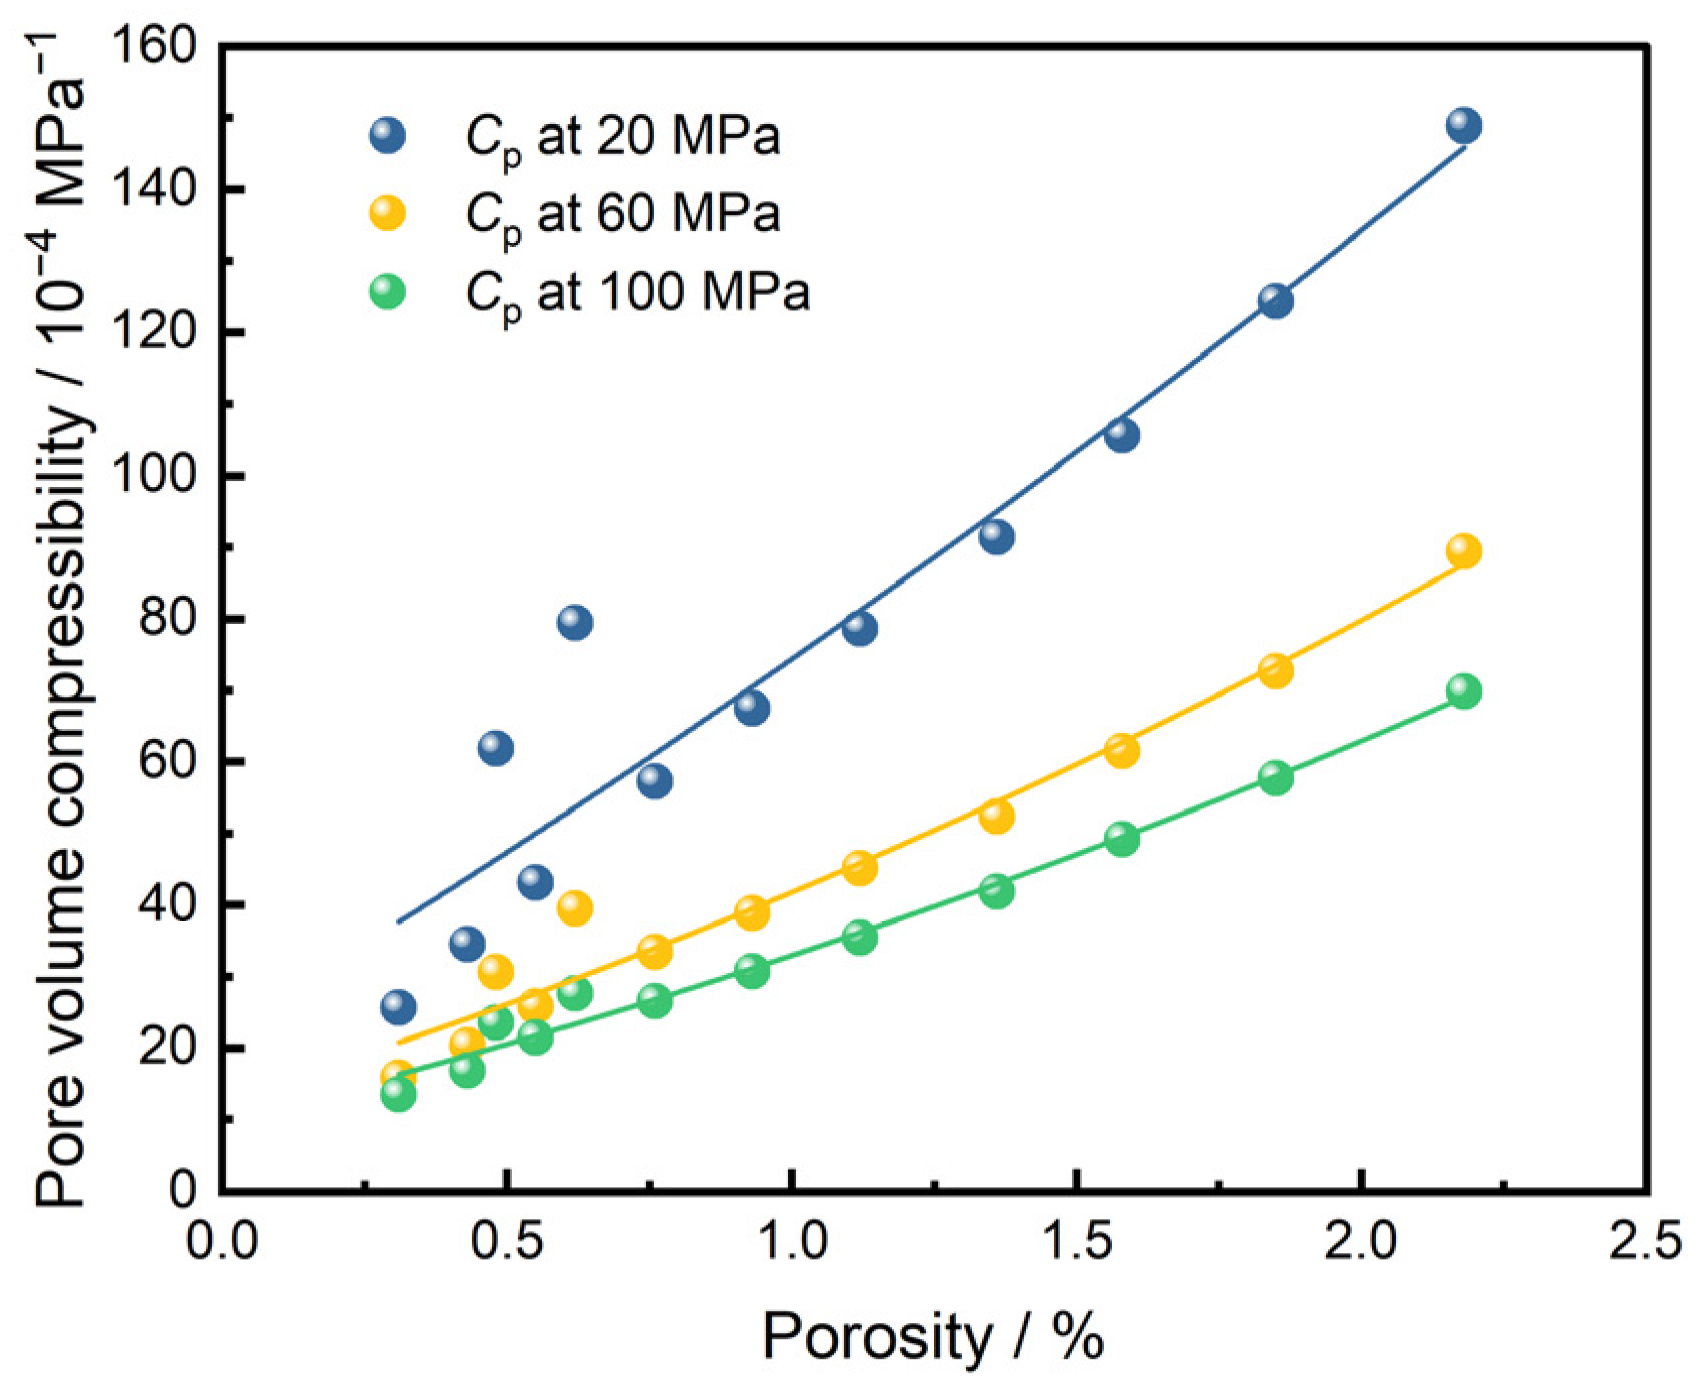
Section 4.1 can be partly explained by the amount of pore space in the carbonate samples. As shown in
Figure 3,
Cp generally increased with porosity at the three selected net pressures. The fitted curve at 20 MPa was steeper than those at 60 and 100 MPa, indicating that the influence of porosity was more pronounced when the pore-fracture system had not yet been strongly compacted. As net pressure increased, the fitted curves shifted downward and became gentler, suggesting that part of the deformable pore space was progressively closed during loading. Within an isotropic Biot-type poroelastic approximation, pore-volume compressibility can be expressed as
, where
Kd and
Ks are the drained-frame and solid-grain bulk moduli, respectively. Because
Kd depends not only on porosity but also on pore geometry and effective stress, compliant fractures and low-aspect-ratio pores can strongly increase
Cp at low net pressure. Progressive closure and stiffening of these features with increasing net pressure increase
Kd and reduce its sensitivity to porosity, providing a poroelastic explanation for the weaker porosity–
Cp relationship at higher pressure.
The scattered distribution of the data points is also important. Although the overall trend is positive, several samples deviate from the fitted curves. Some low-porosity samples still show relatively high Cp, while samples with similar porosity may exhibit different compressibility values. This behavior is reasonable for fractured-vuggy carbonate rocks, where the measured compressibility is controlled not only by total pore volume but also by the geometry, connectivity, and mechanical compliance of the pore space. A limited number of open fractures or irregular dissolution pores may produce greater pore-volume deformation than a larger proportion of well-supported matrix pores.
The separation among the three pressure levels further indicates that porosity and net pressure jointly control Cp. At low net pressure, fractures and weakly supported pores remain more open, so the difference in pore volume is more directly reflected in the compressibility response. At higher net pressure, these compliant pore spaces are partly compacted, and the remaining pore volume becomes increasingly constrained by the carbonate framework. As a result, the porosity–Cp relationship remains positive at 100 MPa, but its sensitivity is weaker than that observed at 20 MPa.
These results suggest that porosity is a necessary input for predicting pore-volume compressibility, but it is insufficient as a standalone parameter in ultra-deep fractured-vuggy carbonate reservoirs. The dispersion in
Figure 3 indicates that pore-structure indicators should be considered together with porosity to improve the physical reliability of compressibility prediction.
4.3. Pore-Structure Controls on Compressibility Response
The scatter observed in
Figure 3 indicates that porosity alone cannot fully describe the compressibility response of the fractured-vuggy carbonate samples. To further clarify this effect, the samples were classified according to their dominant pore-structure types using the quantitative image-based criteria defined in
Section 3.3, including fracture-dominated, fracture-vug mixed, dissolution-pore-dominated, and matrix-pore-dominated samples. Image-derived surface porosity was used as a structural indicator to describe the visible proportion of pores and fractures in optical images of the two planar core-plug end faces obtained before pressure loading.
The fracture features considered in this classification were predominantly elongated and connected open or partially open voids distinguished from more equant dissolution pores and vugs by their image morphology. In fracture-vug mixed samples, such elongated features occurred together with cavity-like vugs, forming visible fracture–vug associations on the plug end faces. These fractures were already present in the pre-test images and therefore were not generated by the subsequent high-pressure compressibility loading. However, because no in situ imaging of the rock before core recovery was available, their genetic origin cannot be determined uniquely from the present dataset. In particular, a contribution from stress release or decompression during core recovery cannot be completely excluded. Accordingly, the terms “fracture-dominated” and “fracture-vug mixed” are used here as morphological pore-structure descriptors rather than as genetic classifications of fracture origin.
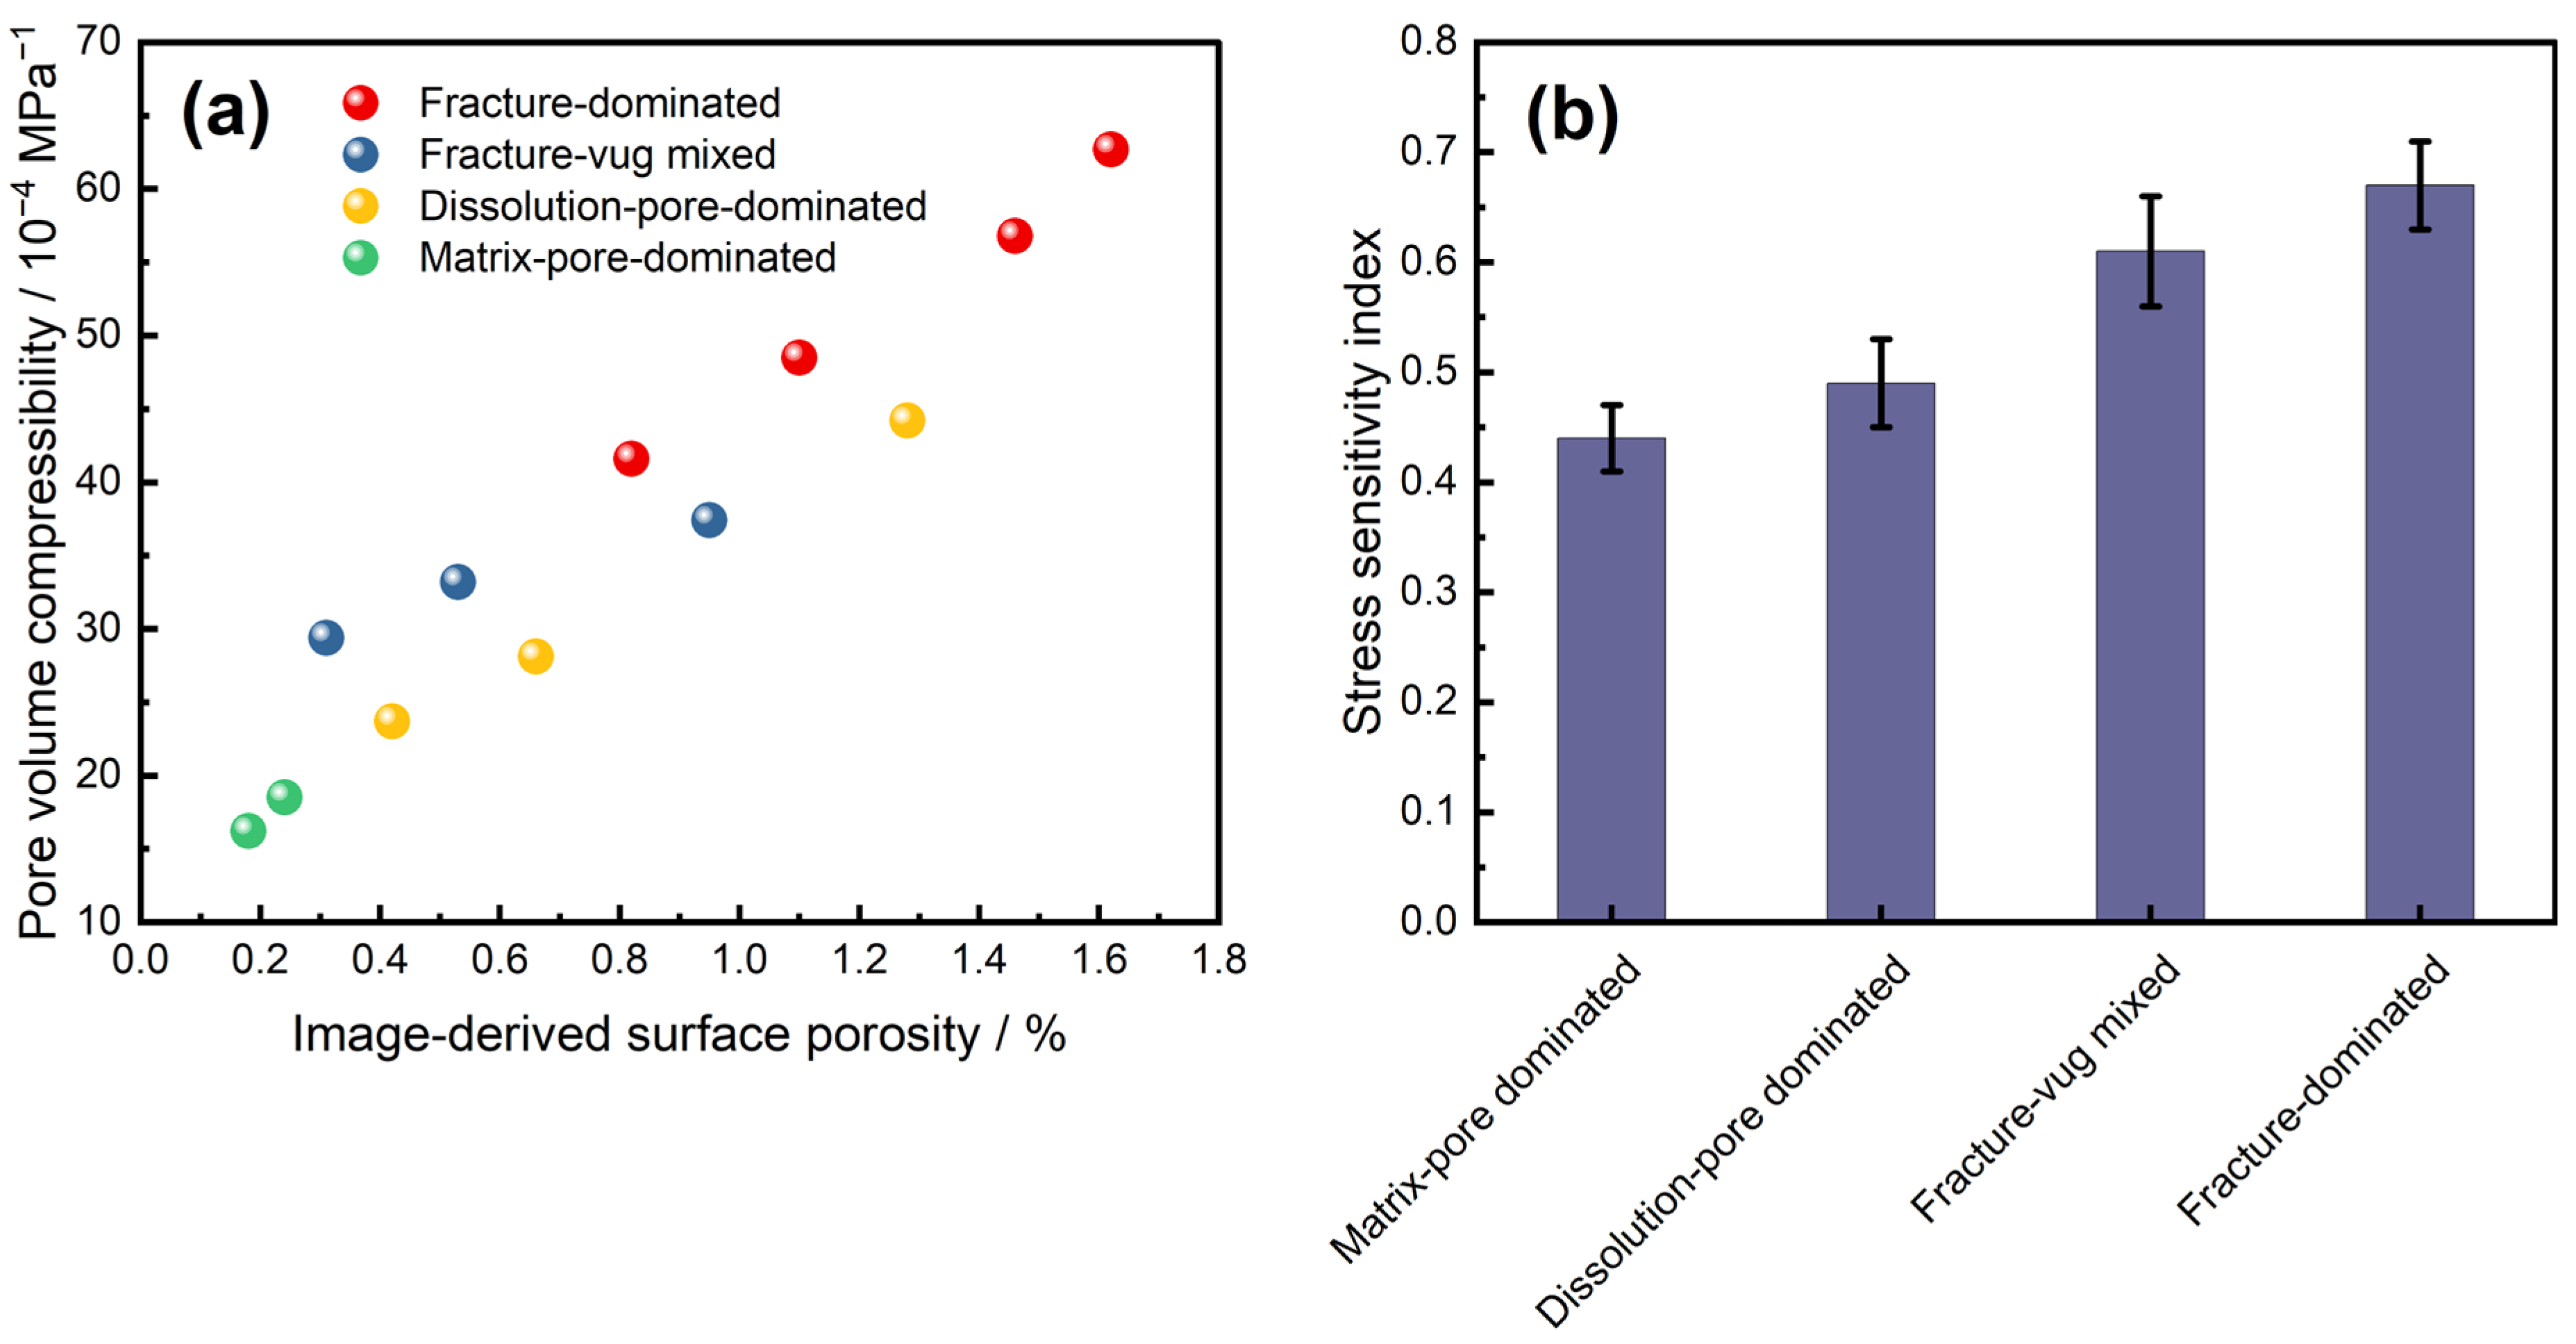
As shown in
Figure 4a,
Cp at 60 MPa generally increased with image-derived surface porosity, but the data points were not distributed along a single trend line. Fracture-dominated samples were mainly located in the high-
Cp range, with
Cp values higher than 40 × 10
−4 MPa
−1. Matrix-pore-dominated samples showed the lowest compressibility, with
Cp values below 20 × 10
−4 MPa
−1. Dissolution-pore-dominated and fracture-vug mixed samples were distributed between these two end members. This distribution suggests that the mechanical compliance of pore space, rather than surface porosity alone, controls the measured compressibility.
The difference among pore-structure types is further reflected by the stress sensitivity index in
Figure 4b. The group-mean SSI was highest for fracture-dominated samples (0.67;
n = 4 cores), followed by fracture-vug mixed samples (0.61;
n = 3), dissolution-pore-dominated samples (0.49;
n = 3), and matrix-pore-dominated samples (0.44;
n = 2). The relatively broad range of surface porosity within the fracture-dominated group is not inconsistent with its high SSI, because
Sp measures the initial two-dimensional projected abundance of visible voids, whereas SSI reflects the relative pressure-induced attenuation of compressibility and is therefore more strongly controlled by the mechanical compliance and closure behavior of those voids than by their projected area alone. This ordering describes the present samples rather than a universal mechanical-compliance hierarchy, because fracture compliance also depends on the resolved normal stress, mineral filling or cementation, and fracture geometry. A fracture-dominated plug may therefore exhibit relatively low compressibility when fractures are unfavorably oriented for normal closure, strongly mineral-filled, or geometrically stiff. Accordingly, this group-level ordering does not imply a linear or equally spaced relationship between pore-structure classes and compressibility. The scatter in
Figure 4a demonstrates that individual samples from different classes can partially overlap because compressibility is jointly affected by pore geometry, connectivity, porosity, and the relative abundance of mechanically compliant features. Accordingly, the PSI should be interpreted as an ordinal structural descriptor rather than a quantitative mechanical-compliance scale. Open fractures and fracture-connected vugs are expected to be more susceptible to compaction during loading, whereas matrix pores and well-supported dissolution pores are more constrained by the carbonate framework.
These results help explain why samples with similar porosity may show different Cp values. In fractured-vuggy carbonate rocks, a small number of open fractures can contribute disproportionately to pore-volume deformation. Conversely, a sample with relatively high visible pore area may still show moderate compressibility if the pore space is dominated by isolated or well-supported dissolution pores. Therefore, pore-structure type should be considered together with porosity and net pressure when constructing a predictive model for pore-volume compressibility.
4.4. Machine Learning Prediction Performance
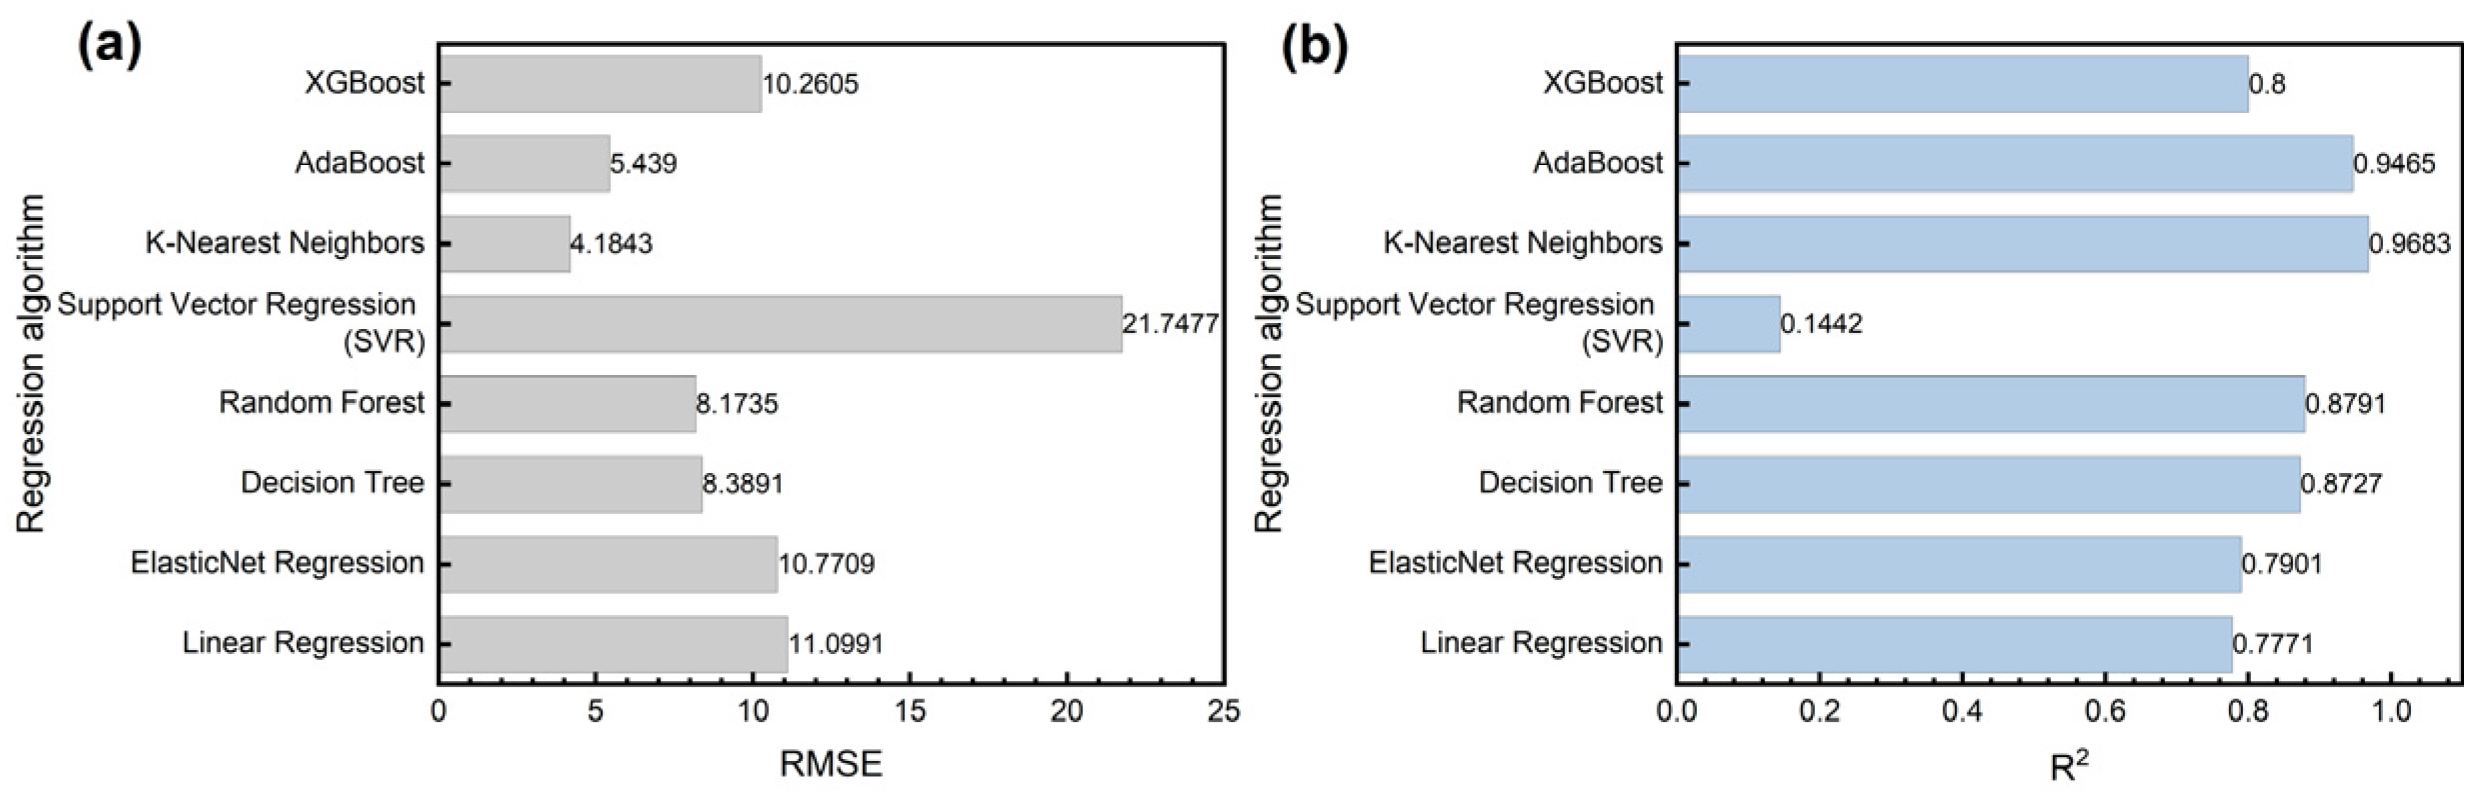
Based on the experimentally measured pore-volume compressibility data, eight representative regression algorithms were evaluated to identify a suitable prediction model for the fractured-vuggy carbonate samples. The tested models were linear regression, ElasticNet, decision tree, random forest, support vector regression, k-nearest neighbors, AdaBoost, and XGBoost, representing distinct linear, tree-based, kernel-based, distance-based, and ensemble-learning strategies. The model performance was assessed using RMSE, test-set R
2, and mean bias error (MBE), as summarized in
Table 4; RMSE and R
2 are additionally compared in
Figure 5. RMSE provides a direct measure of prediction error on the same numerical scale as
Cp, whereas R
2 provides a complementary measure of the agreement between measured and predicted values, and MBE provides the signed prediction error required to determine whether a model preferentially over-predicts or under-predicts
Cp.
The comparison shows clear differences among the tested algorithms. Linear regression and ElasticNet produced RMSE values of 11.0991 and 10.7709 × 10⁻⁴ MPa−1, respectively, with corresponding R2 values of 0.7771 and 0.7901. Although regularization slightly improved the prediction relative to the unregularized linear baseline, both models remained less accurate than the principal nonlinear models. Their MBE values were −3.2146 and −2.7819 × 10⁻⁴ MPa−1, respectively, indicating that both linear models tended to under-predict Cp. This indicates that a simple linear mapping is insufficient to describe the nonlinear relationship between compressibility and the controlling parameters. Tree-based models improved the prediction accuracy to some extent. Decision tree and random forest reduced RMSE to 8.3891 and 8.1735 × 10⁻⁴ MPa−1, respectively, while their R2 values increased to 0.8727 and 0.8791. Their relatively small positive MBE values of +1.6348 and +0.9287 × 10⁻⁴ MPa−1 indicate slight overall over-prediction. However, their errors remained higher than those of the best-performing models.
Among all tested algorithms, k-nearest neighbors achieved the lowest RMSE of 4.1843 × 10⁻⁴ MPa−1 and the highest R2 of 0.9683. Its MBE was +0.3876 × 10⁻⁴ MPa−1, which was the smallest absolute bias among the tested models and indicates an almost unbiased prediction with only a slight tendency toward over-prediction. AdaBoost also showed good performance, with an RMSE of 5.4390 × 10⁻⁴ MPa−1 and an R2 of 0.9465, together with a small positive MBE of +0.6412 × 10⁻⁴ MPa−1. Support vector regression (SVR) produced continuous Cp predictions rather than classification or segmentation outputs. However, its predictive performance was substantially poorer than that of the other nonlinear models, with the highest RMSE of 21.7477 × 10⁻⁴ MPa−1 and the lowest R2 of 0.1442. Its strongly negative MBE of −15.4625 × 10⁻⁴ MPa−1 further shows that the poor performance was accompanied by marked systematic under-prediction. XGBoost also exhibited an overall under-prediction tendency, with an MBE of −2.1064 × 10⁻⁴ MPa−1. Therefore, the low R2 represents weak agreement between the measured and predicted continuous Cp values rather than an inability of SVR to generate predictions. For SVR, hyperparameter selection was performed by grid search over both linear and radial basis function (RBF) kernels, with penalty coefficients C = 1, 10, and 100, kernel-scale settings of “scale” and “auto”, and ε values of 0.01, 0.05, and 0.10. The target Cp was handled on the ×10−4 MPa−1 numerical scale used for model evaluation; therefore, the tested penalty coefficients were applied relative to target values on this numerical scale rather than directly to raw values of order 10−4 MPa−1. The reported SVR performance consequently represents the configuration selected from this predefined search space rather than the result of an arbitrarily fixed RBF kernel. Given the limited number of independent core plugs, the search grid was intentionally kept compact to restrict model-selection variability and should not be regarded as an exhaustive exploration of all possible C values. The low R2 and strongly negative MBE therefore indicate that SVR generalized poorly to the held-out cores within the tested configuration space, rather than demonstrating that SVR is intrinsically unsuitable for pore-volume-compressibility prediction.
Although k-nearest neighbors achieved the highest numerical prediction accuracy, its distance-based formulation does not provide explicit variable thresholds or hierarchical decision rules. This behavior is physically reasonable because the pressure-dependent
Cp response shows local continuity, and samples with similar net pressure and pore-structure characteristics tend to exhibit comparable compressibility responses. In contrast, SVR relies on a global kernel mapping, which may be less effective for the limited and heterogeneous dataset investigated here. To provide a more interpretable complement to the KNN prediction, the fitted tree-based models were therefore further examined in terms of their dominant split variables and upper-level decision thresholds. The quantitative test-set performance of all eight regression algorithms is reported in
Table 4 and
Figure 5, whereas
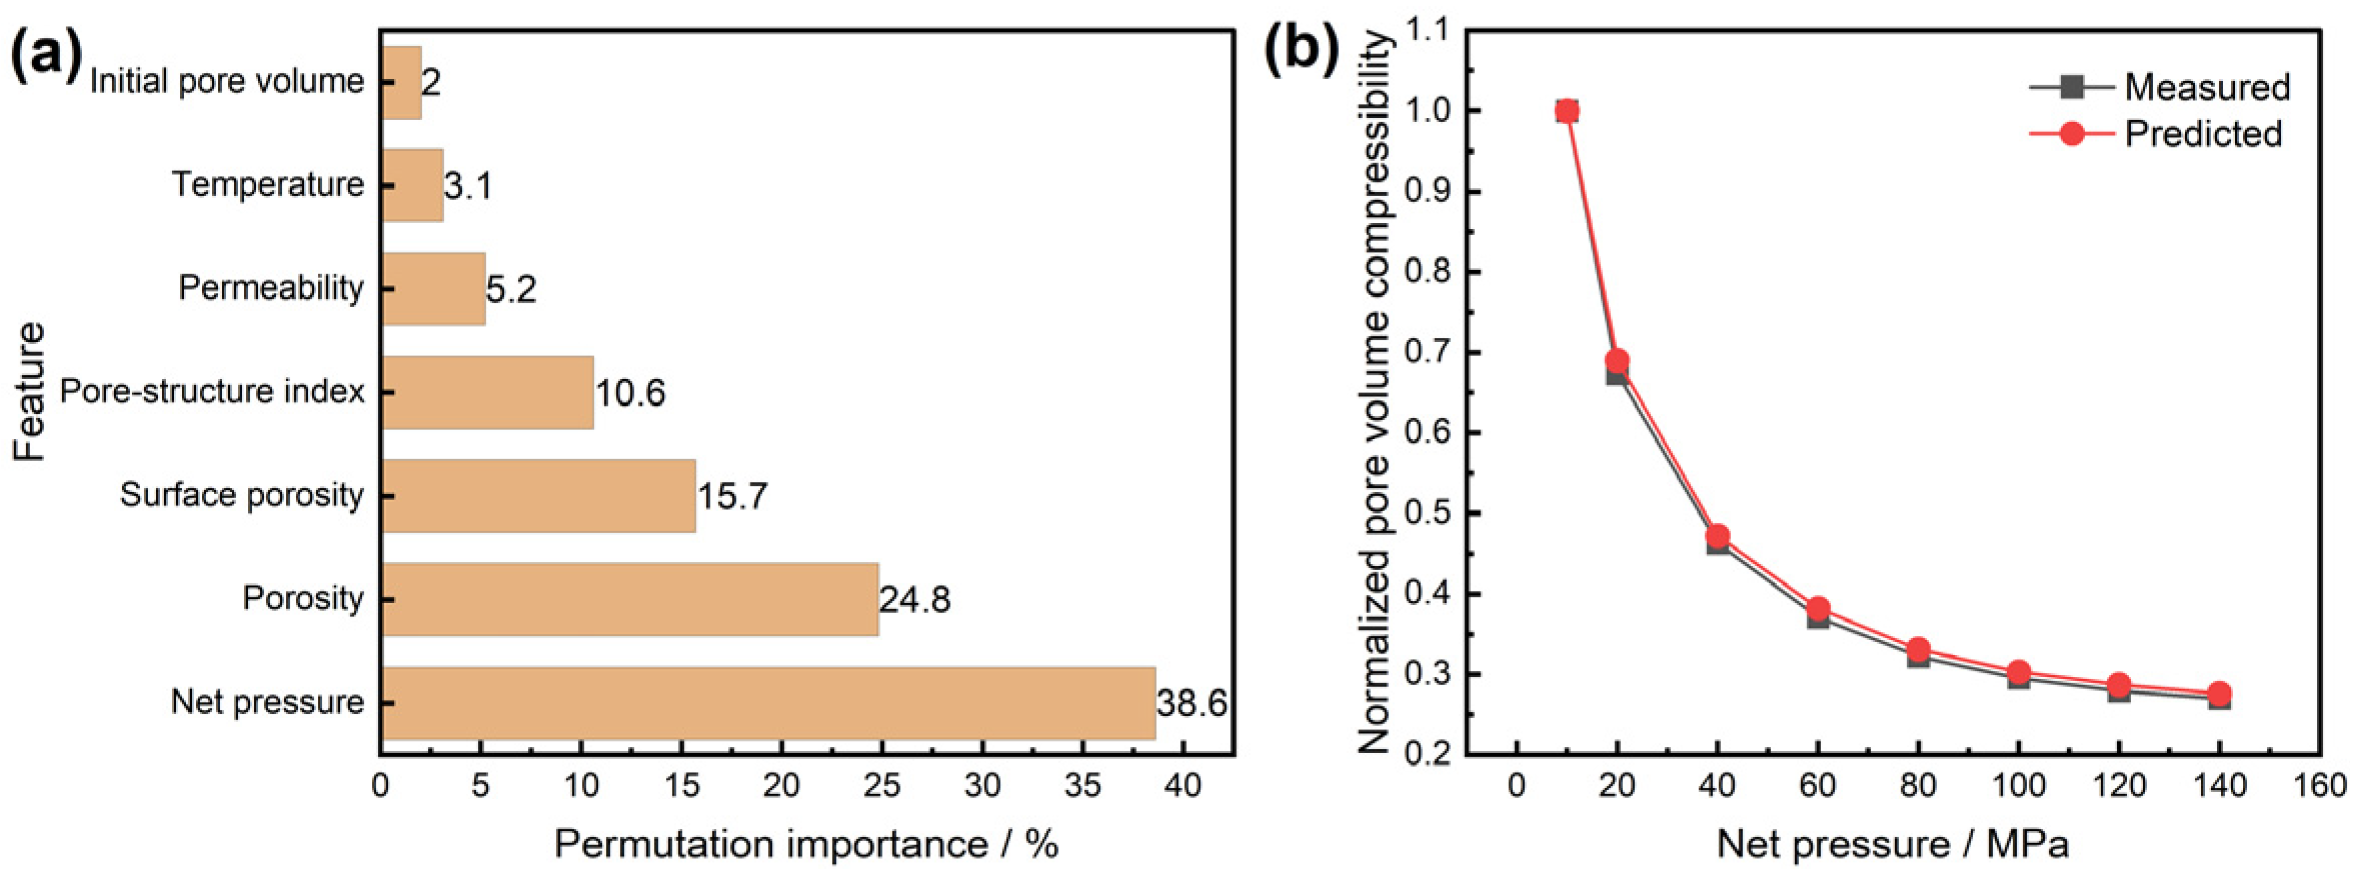
Figure 6b presents the measured–predicted normalized Cp comparison used for the physical-consistency assessment of the selected KNN model.
KNN prediction should nevertheless be interpreted within the range represented by the present dataset. Because KNN relies on local neighborhoods in the normalized feature space, its reliability is affected by feature scaling, sample density, and the availability of sufficiently similar training observations. Although all pressure observations from an individual core were retained within the same training, validation, or test subset to reduce information leakage, prediction uncertainty may still increase for cores whose petrophysical and pore-structure characteristics are insufficiently represented in the training data. The additional nested leave-one-core-out (LOCO) group-validation analysis provided a more stringent assessment of generalization to completely unseen core plugs. Under this framework, KNN yielded an RMSE of 13.5978 × 10
−4 MPa
−1 and an R
2 of 0.8408, whereas AdaBoost achieved an RMSE of 10.0160 × 10
−4 MPa
−1 and an R
2 of 0.9136, indicating greater unseen-core robustness of AdaBoost. Across the 12 held-out-core folds, the fold-wise RMSE was 12.90 ± 4.49 × 10
−4 MPa
−1 for KNN and 9.60 ± 2.98 × 10
−4 MPa
−1 for AdaBoost, while the corresponding fold-wise R
2 values were 0.819 ± 0.118 and 0.900 ± 0.067, respectively. The lower mean prediction error and smaller fold-to-fold variability of AdaBoost further support its greater robustness when generalizing to completely unseen core plugs. A simple feature-set ablation analysis was therefore performed for AdaBoost under the same nested core-ID-based LOCO framework, as summarized in
Supplementary Table S3. Using net pressure alone yielded an RMSE of 23.8980 × 10
−4 MPa
−1 and an R
2 of 0.5081; adding porosity reduced the RMSE to 17.5085 × 10
−4 MPa
−1 and increased R
2 to 0.7360, while further inclusion of surface porosity and PSI reduced the RMSE to 11.1904 × 10
−4 MPa
−1 and increased R
2 to 0.8921. The full feature set further improved the RMSE to 10.0160 × 10
−4 MPa
−1 and R
2 to 0.9136, indicating that the structural descriptors provided additional predictive information beyond pressure and porosity, although this incremental value should be interpreted within the limited 12-core dataset rather than as a causal feature effect. To further examine whether these results depended on the ordinal encoding of pore-structure type, the PSI feature was replaced by one-hot encoding under the same nested LOCO framework. The corresponding RMSE/R
2 values were 13.4935 × 10
−4 MPa
−1/0.8432 for KNN and 9.7083 × 10
−4 MPa
−1/0.9188 for AdaBoost. These changes were modest relative to the ordinal-encoding results, indicating that the principal conclusions regarding unseen-core generalization are not strongly dependent on the numerical spacing imposed by the PSI encoding.
To provide an explicit rule-based interpretation complementary to KNN, the tree-based regression models were further examined. Among these models, AdaBoost showed the best predictive performance, with an RMSE of 5.4390 × 10
−4 MPa
−1 and an R
2 of 0.9465, followed by random forest and decision tree, with R
2 values of 0.8791 and 0.8727, respectively. XGBoost achieved an R
2 of 0.8000. Because a single decision tree provides directly traceable hierarchical splits, whereas the ensemble models contain multiple constituent trees, the root and upper-level nodes of the decision tree and the dominant upper-level split patterns of random forest, AdaBoost, and XGBoost were examined. The principal decision variables and representative threshold ranges are summarized in
Table 5.
The decision tree provides the clearest representation of the hierarchical decision process. The first and most influential switch occurs at a net pressure of approximately 50 MPa. At Pnet ≤ 50 MPa, the pore-structure index becomes an important secondary discriminator. Samples with PSI > 1.5, corresponding mainly to fracture-vug mixed and fracture-dominated pore systems, are directed toward higher-compressibility branches, particularly when surface porosity exceeds approximately 0.75%. Samples with lower PSI values tend to occupy lower-compressibility branches, with porosity providing an additional separation. At higher net pressures, a second important pressure-related switch occurs at approximately 110 MPa. Above this level, the predicted Cp becomes considerably less sensitive to additional increases in net pressure, and the residual differences among samples are controlled mainly by porosity and pore-structure indicators.
The ensemble tree models exhibit a consistent hierarchy despite their more complex structures. Net pressure accounts for approximately 35–40% of the upper-level splits in random forest, AdaBoost, and XGBoost, followed by porosity, surface porosity, and pore-structure index. Two recurrent pressure intervals, approximately 40–60 MPa and 90–110 MPa, appear as the principal decision-switch ranges. These thresholds are consistent with the experimental response in
Figure 2, where rapid pore-fracture compaction dominates the lower-pressure stage and the compressibility response progressively weakens at higher net pressures. Porosity thresholds of approximately 0.8–1.2% and surface-porosity thresholds of approximately 0.6–1.0% provide secondary discrimination among samples, whereas PSI thresholds near 1.5 and 2.5 distinguish matrix/dissolution-pore systems from fracture-connected and fracture-dominated pore systems. The consistency between these tree-based decision rules and the experimental trends indicates that the models primarily respond to physically meaningful pressure and pore-structure controls.
4.5. Feature Importance and Physical Consistency of the Prediction Model
Although k-nearest neighbors achieved the lowest prediction error on the designated core-held-out test split, the LOCO analysis in
Section 4.4 showed that AdaBoost provided greater robustness for completely unseen cores. KNN was nevertheless retained for the following permutation-importance and physical-consistency analyses because it was the best-performing model in the designated test-set comparison. Accordingly, the interpretation below characterizes the feature dependence and physical behavior of the split-specific KNN model rather than implying superior cross-core generalization. Since KNN does not provide built-in feature importance, permutation importance was used to evaluate the relative contribution of each input variable.
As shown in
Figure 6a, within the split-specific KNN model, net pressure showed the largest permutation importance (38.6%), followed by porosity (24.8%), surface porosity (15.7%), and pore-structure index (10.6%). The relatively low contribution of temperature should be interpreted within the experimental design. Although temperature was included as a physical input because the 12 core plugs were tested under different formation-relevant temperatures (162–177 °C), the temperature range was narrower than the variation of net pressure and pore-structure-related parameters. Therefore, its lower permutation importance reflects the limited temperature variability within the present dataset rather than the absence of a thermodynamic effect on pore-volume compressibility. The PSI contribution represents the predictive importance of the ordinal pore-structure descriptor used in the KNN model rather than a direct quantitative measure of mechanical compliance. Because adjacent PSI values do not necessarily represent equal physical differences among pore-structure classes, the sensitivity of model performance to the encoding scheme was further evaluated using one-hot encoding. The limited variation after one-hot transformation indicates that the main predictive conclusions are not strongly dependent on the ordinal spacing assumption. Because several core-level descriptors characterize related aspects of pore space, the permutation-importance values should not be interpreted as independent causal contributions of individual variables. In particular, porosity, initial pore volume, and surface porosity may contain overlapping information regarding pore-space abundance; therefore, the reported importance values represent feature contributions within the combined prediction framework rather than isolated effects after removal of inter-feature dependence.
Temperature was retained as an input feature because the experimental temperatures differed among the 12 core plugs, ranging from 162 to 177 °C. However, for each individual core plug, temperature remained constant during the eight pressure-loading steps. Therefore, temperature represents a core-level experimental variable rather than a pressure-dependent variable within a single core. Its permutation importance should be interpreted as a predictive contribution associated with cross-core variations and possible covariance with other core-level characteristics, rather than as an independent causal temperature effect. This model-specific ranking is broadly consistent with the experimental trends in
Section 4.1,
Section 4.2 and
Section 4.3, but should not be interpreted as a universal feature hierarchy for unseen cores. Net pressure directly controls the compaction state of the pore-fracture system, while porosity and pore-structure indicators determine the amount and mechanical compliance of deformable pore space.
The physical consistency of the prediction model was further checked using the pressure-dependent trend of normalized pore-volume compressibility. As shown in
Figure 6b, the predicted normalized
Cp followed the same decreasing trend as the measured values when net pressure increased. The model reproduced the rapid decline at low net pressures and the gradual flattening at higher net pressures. To make this assessment quantitative, monotonicity was evaluated over the seven adjacent pressure intervals between the eight experimental net-pressure levels. For the aggregate predicted normalized
Cp curve shown in
Figure 6b, no monotonicity violation was observed (0 of 7 intervals), and the maximum positive increment between two successive pressure levels was therefore zero. This confirms quantitatively that the displayed prediction preserves the expected pressure-dependent decrease rather than demonstrating consistency only through visual agreement. This consistency indicates that the model did not merely fit numerical values, but also retained the main stress-sensitive behavior observed in the volumetric experiments. In addition to monotonicity assessment, the predicted
Cp values were checked for physical plausibility. No negative
Cp predictions were obtained within the evaluated test responses, indicating that the optimized model did not generate physically impossible compressibility values. Core-wise residual analysis of the nested LOCO predictions showed that prediction errors varied among the 12 completely held-out cores. For KNN, the core-wise RMSE ranged from 3.7406 to 26.9320 × 10
−4 MPa
−1 and the MBE ranged from −21.6375 to +6.7108 × 10
−4 MPa
−1; for AdaBoost, the corresponding ranges were 3.9786–16.9290 × 10
−4 MPa
−1 and −12.2942 to +13.1071 × 10
−4 MPa
−1, respectively. The largest KNN errors occurred for C-15 and C-23, and the maximum absolute residual occurred at 10 MPa for 10 of the 12 held-out cores, indicating that unseen-core prediction errors were concentrated mainly in the low-net-pressure, high-compressibility regime; detailed core-wise statistics are provided in
Supplementary Table S2.
However, the interpretation of KNN should remain cautious. The model relies on local similarity among samples, and its prediction accuracy can be affected by data scaling, sample density, and the splitting strategy of the dataset. If different pressure points from the same core are simultaneously included in the training and testing sets, the model performance may be overestimated. The LOCO analysis reported in
Section 4.4 directly addresses this potential information leakage associated with multiple pressure observations from the same core and provides a more conservative assessment of unseen-core generalization. Because porosity, permeability, initial pore volume, surface porosity, and pore-structure type are core-level static descriptors, they could act as core-specific fingerprints under record-wise random splitting. The core-ID-based LOCO procedure removes this potential leakage pathway by excluding all observations from the held-out core during model development. Nevertheless, the LOCO results should be interpreted as generalization to unseen cores within the petrophysical and pore-structure domain represented by the present dataset rather than extrapolation to carbonate reservoirs outside this domain. In the LOCO procedure, each of the 12 core plugs, together with all eight of its pressure observations, served once as a completely held-out test group; therefore, the RMSE and R
2 values reported in
Section 4.4 represent prediction performance for cores that were entirely excluded from model development. However,
Figure 6b represents the aggregate pressure-dependent physical-consistency comparison rather than separate core-wise LOCO prediction trajectories. Accordingly, the absence of monotonicity violations in the aggregate curve should not be interpreted as proof that every individual unseen-core prediction is strictly monotonic. Because only 12 independent cores are currently available and KNN does not directly provide a probabilistic predictive distribution, a statistically robust core-specific uncertainty band cannot yet be estimated without imposing additional distributional assumptions. Rather than introducing a potentially misleading confidence band, this limitation is explicitly acknowledged here. Nevertheless, the present dataset contains only 12 core plugs; therefore, further validation using additional independent core samples and field production data is still required before applying the model to reservoir-scale prediction.
4.6. Implications for Dynamic Reserve Evaluation and Potential Development Applications
The pressure-dependent behavior of pore-volume compressibility may have important implications for dynamic reserve evaluation in ultra-deep fractured-vuggy carbonate reservoirs. In conventional material-balance or pressure-decline analysis, rock compressibility is often treated as a constant parameter. This simplification may be acceptable for reservoirs with relatively uniform pore systems and weak stress sensitivity, but it is less suitable for fractured-vuggy carbonate reservoirs, where fractures, vugs, and dissolution pores respond differently to increasing effective stress.
The results in
Section 4.1,
Section 4.2 and
Section 4.3 show that
Cp changes markedly during pressure loading. At low net pressures, the closure of open fractures and weakly supported pore space contributes to a higher compressibility response. As net pressure increases, the pore-fracture system becomes progressively compacted, and the compressibility gradually decreases. Therefore, a single constant
Cp may overestimate or underestimate the elastic energy contribution of the rock framework at different development stages. A pressure-dependent
Cp(
p) relationship is more appropriate for describing the changing storage capacity of fractured-vuggy carbonate rocks during depletion.
For example, taking representative experimental values of Cp ≈ 40 × 10−4 MPa−1 during the relatively early depletion stage and Cp ≈ 13 × 10−4 MPa−1 at a later, more compacted stage, a 20 MPa pressure decline would correspond to an approximate rock-elastic pore-volume change of 8.0% and 2.6% of pore volume, respectively, according to ΔVp/Vp ≈ CpΔp. If the late-stage value were incorrectly used as a constant during the early stage, the rock-compressibility contribution would be underestimated by approximately 67.5%; conversely, using the early-stage value at the late stage would overestimate this contribution by about 208%. This calculation is intended only as an illustrative sensitivity estimate of the rock-compressibility contribution and does not constitute a field-scale reserve calculation; the actual reserve response also depends on fluid properties, production history, reservoir connectivity, and other material-balance terms.
The machine learning model is intended to complement, rather than replace, core characterization by reducing the need to determine a complete high-temperature and high-pressure Cp(P) curve for every additional core plug. This is particularly relevant to the Fuman Oilfield, where the target Ordovician intervals are buried at depths greater than 7000 m and full Cp(P) characterization requires repeated high-temperature and high-pressure equilibrium measurements over multiple pressure steps. Porosity, permeability, initial pore volume, surface porosity, and pore-structure type are static or once-per-core descriptors; these descriptors can generally be obtained once for each core. Within the experimental domain represented by the present cores, these descriptors, together with reservoir temperature and target net pressure, may provide a supplementary basis for estimating pressure-dependent Cp and for identifying cores for which complete high-temperature and high-pressure characterization would be most valuable. Such estimates should not be regarded as substitutes for independent core measurements or field-scale calibration. The experimental net-pressure interval of 10–140 MPa defines the applicable pressure domain of the present model. Net pressures within this interval, such as 60–90 MPa, are therefore treated as interpolation within the trained range, whereas predictions outside 10–140 MPa represent extrapolation and require additional validation.
To examine whether this multivariable approach provides information beyond a simple pressure–compressibility relationship, a pore-structure-specific exponential benchmark was additionally evaluated using the same training and test partition. The benchmark was expressed as
where
A,
b, and
C∞ were fitted separately for each pore-structure type using only the training data. On the independent test set, this type-specific exponential baseline yielded an RMSE of 6.9872 × 10
−4 MPa
−1, an R
2 of 0.9116, and an MBE of −0.9643 × 10
−4 MPa
−1. In comparison, KNN achieved an RMSE of 4.1843 × 10
−4 MPa
−1, an R
2 of 0.9683, and an MBE of +0.3876 × 10
−4 MPa
−1. Thus, the multivariable model reduced RMSE by approximately 40.1% relative to the pore-type-specific exponential baseline. This comparison indicates that pressure and pore-structure class capture much of the first-order trend, but additional sample-specific information is required to describe the variability among cores belonging to the same broad pore-structure category. The benchmark results are summarized in
Supplementary Table S1.
The apparent grouping of C-1/C-3 and C-6/C-8 in the normalized curves of
Figure 2b should not be interpreted as two additional reservoir classes. Normalization removes the absolute magnitude of
Cp and emphasizes the shape of its pressure-dependent decline. For example, C-1 and C-3 have permeability values of 0.38 and 0.12 mD, whereas C-6 and C-8 have values of 0.018 and 0.075 mD, respectively. Although the permeability contrast is pronounced between some samples, such as C-1 and C-6, it is much smaller between C-3 and C-8. Across all 12 cores, permeability is also strongly associated with pore-structure index and surface porosity (Spearman ρ = 0.957 and 0.837, respectively;
p < 0.001). Consequently, its relatively low permutation importance does not imply that permeability is physically unimportant; rather, much of its predictive information is shared with the pore-structure variables already present in the model. Min–max scaling changes the numerical range of permeability but does not remove its rank ordering or underlying relationship with pore structure.
The present dataset nevertheless remains limited in its coverage of the multidimensional parameter space. The 12 core plugs do not constitute a fully factorial combination of porosity, permeability, surface porosity, and pore-structure type, and the present model should therefore be interpreted as a sample-scale prediction framework rather than a universal carbonate-reservoir correlation. The importance of explicitly accounting for such heterogeneity is also supported by Al-Yaari et al. [
31], who showed that variations in porosity and permeability within heterogeneous porous media materially affect the simulation and performance of nanofluid-assisted enhanced oil recovery, further illustrating the sensitivity of reservoir-development responses to heterogeneous porous-medium properties. To make the degree of parameter overlap directly assessable, the complete 96-record dataset, including core ID, net pressure, porosity, permeability, temperature, initial pore volume, surface porosity, pore-structure index, and measured
Cp, is provided in Supplementary Data S1. Further validation with additional cores that increase the overlap among pore-structure and petrophysical-property ranges is required before broader field-scale application. Accordingly, the present results should be regarded as a laboratory- and sample-scale framework for informing future reserve evaluation rather than as a validated basis for direct field-scale reserve calculation or production-adjustment decisions.
4.7. Limitations and Future Work
Although the experimental and machine learning results provide useful insights into pore-volume compressibility prediction in ultra-deep fractured-vuggy carbonate reservoirs, several limitations should be acknowledged. First, the experimental dataset is still limited by the number and representativeness of available core samples. Fractured-vuggy carbonate rocks are highly heterogeneous, and plug-scale measurements may not fully capture the large-scale fracture-vug networks developed in the reservoir. Therefore, the predicted Cp values should be interpreted as sample-scale responses rather than direct field-scale compressibility values.
Second, the pore-structure indicators used in this study mainly describe the visible pore and fracture features of the tested samples. Although surface porosity and pore-structure type help explain the scatter in the porosity–compressibility relationship, they cannot fully represent three-dimensional pore connectivity, fracture aperture distribution, or vug connectivity. The equivalent diameter and aspect ratio derived from the optical images were used primarily for object-level segmentation and pore-structure classification rather than as complete three-dimensional pore-shape descriptors. A sample-averaged pore size or aspect ratio was therefore not introduced because such values would be strongly affected by two-dimensional sectioning, image resolution, and the simultaneous presence of matrix pores, dissolution pores, vugs, and fractures at very different scales. Fractal dimension was also not calculated because the two-dimensional end-face images do not provide a sufficiently broad and controlled spatial scale range for robust multi-scale fractal characterization. In addition, because no pre-recovery in situ imaging was available, a possible contribution of stress-release fractures generated during core recovery cannot be completely excluded. Future work should incorporate micro-CT, thin-section image analysis, nuclear magnetic resonance, ultrasonic P- and S-wave measurements, quantitative pore-shape characterization, or image logging data to build a more quantitative multi-scale pore-structure description and to distinguish natural fracture architecture from possible recovery-induced fracture features.
Third, the current machine learning model was trained within the pressure, porosity, temperature, and pore-structure ranges covered by the experimental dataset. Although temperature varied among the 12 core plugs, each individual plug was tested at only one fixed temperature. Consequently, the present dataset does not contain within-core temperature variation and cannot independently separate a direct temperature effect from other core-specific petrophysical and pore-structure differences. Temperature should therefore be regarded as a core-level experimental covariate in the present model, and dedicated repeated-temperature tests on the same core plugs would be required to quantify its independent physical effect. Its predictive reliability may decrease when applied to samples outside these ranges or to reservoirs with different diagenetic histories and fracture-vug architectures. In particular, KNN is sensitive to sample density, feature scaling, and dataset partitioning. The additional core-ID-based LOCO validation reduces the risk of information leakage and provides a more conservative assessment of unseen-core generalization; nevertheless, validation using a larger number of independent core plugs remains necessary. The limited number of independent cores also restricts robust estimation of core-specific prediction intervals; therefore, formal uncertainty bands are not interpreted as statistically established confidence limits in the present study. Further validation using additional independent core samples and field-production data is needed to evaluate the broader generalization capability of the model.
Finally, the present work mainly focuses on monotonic loading under controlled laboratory conditions. Because no unloading–reloading cycle was performed, irreversible compaction and hysteresis could not be independently quantified, and the reported Cp values should therefore be interpreted as the apparent compressibility response along the imposed monotonic loading path. Accordingly, integration of Cp over net pressure can be used to estimate the total logarithmic pore-volume strain along the imposed loading path, but this strain cannot be uniquely attributed to fracture closure without independently separating the deformation contributions of fractures, vugs, dissolution pores, and matrix pores. During actual reservoir development, the stress path may involve pressure depletion, injection-induced pressure recovery, cyclic loading, and fluid–rock interactions. These processes may alter pore-fracture compressibility in a way that cannot be fully reproduced by a single loading path. Future studies should therefore consider loading–unloading experiments, variable fluid environments, and coupling with production-performance analysis. Such work would help establish a more robust pressure-dependent Cp(p) model for dynamic reserve evaluation and development adjustment in ultra-deep fractured-vuggy carbonate reservoirs.