


Abstract
Against the backdrop of the “dual-carbon” goals, the penetration of distributed photovoltaics (PV) in distribution networks continues to increase. Under the combined effects of stochastic PV generation and load variability, assessing PV hosting capacity in distribution networks under fault conditions has become increasingly challenging. To address the limited consideration of uncertainty and fault conditions in existing studies, this paper proposes a stochastic optimization framework for evaluating PV hosting capacity under fault conditions that considers load uncertainty and mobile shared energy storage (MSES). First, historical data are used to generate representative uncertainty scenarios through Latin hypercube sampling. An optimization model is then formulated subject to secure distribution network operation constraints to determine the optimal capacities and locations of distributed PV installations. Meanwhile, MSES is incorporated to further enhance PV hosting capacity through flexible spatial and temporal energy transfer. Finally, simulations on the modified IEEE 33-bus system demonstrate that MSES can effectively increase PV hosting capacity and renewable energy accommodation. However, under fault conditions, changes in voltage profiles and the emergence of reverse power flows further reduce PV hosting capacity. Although incorporating load uncertainty increases the system cost, the resulting PV hosting capacity is more representative of practical operating conditions, thereby providing quantitative decision-making support for the planning and operation of distribution networks with high PV penetration.
1. Introduction
With the deepening implementation of the “dual carbon” strategy and the accelerating pace of energy transition, the penetration level of distributed photovoltaics (PV) in distribution networks continues to rise, a trend that is profoundly reshaping the structural configuration and operational characteristics of traditional distribution networks [1,2]. PV output exhibits significant randomness and volatility due to the influence of weather conditions [3]. On the other hand, the temporal fluctuation characteristics of load demand further exacerbate the operational uncertainty of distribution networks. Under fault conditions, the main grid supply is interrupted, and some PV units are disconnected due to undervoltage protection. Relying solely on main grid restoration for power supply compromises operational reliability. While distributed PV possesses black-start potential, uncoordinated restoration may exacerbate fault risks. Under the influence of uncertainties, the assessment of distribution network hosting capacity under fault conditions becomes particularly complex, emerging as both a research hotspot and a challenge in the field of electrical engineering [4]. In this paper, PV hosting capacity is defined as the maximum amount of distributed PV generation that can be accommodated by an existing distribution network while satisfying the specified operational and security constraints under the considered operating conditions [5,6].
When a fault occurs in the distribution network, partial islanded operation may be formed to ensure supply security. Under such circumstances, the risks induced by these uncertainties become more pronounced. On one hand, severe fluctuations in PV output may trigger issues such as voltage violations and line overloads, thereby affecting the PV hosting capacity [7]. On the other hand, changes in the network topology following a fault alter the power flow distribution, further exacerbating system operational risks. Large-scale blackouts in California, USA in 2019 [8] and South Australia in 2021 [9] have demonstrated that alongside the transformation of power systems, greater attention must be paid to the safe and stable operation of distribution networks. Since distributed PV is typically connected at the end of distribution feeders, operates at lower voltage levels, and suffers from poor integration of operational information, this leads to lax management of distributed PV systems and suboptimal PV utilization rates. Consequently, research into the optimal PV hosting capacity of distribution networks has become critically important. Traditional distribution network operation optimization is often based on deterministic conditions, failing to adequately account for the coupled effects of source-load dual uncertainties. Particularly under fault scenarios, such simplifications may cause evaluation results to deviate from reality, failing to accurately reflect the true hosting capacity of the distribution network [10].
Against the backdrop of the emerging power system paradigm, conducting an assessment of the optimal PV hosting capacity in distribution networks under fault conditions while accounting for load variability holds significant theoretical importance and engineering value. This research can provide theoretical support for distribution network operation and dispatch, thereby enhancing the operational safety and stability of distribution networks with high PV penetration [11]. The prevailing definition of PV hosting capacity in distribution networks is “the maximum PV installation capacity that a distribution network can accommodate while maintaining safe and stable operation, given its existing infrastructure and control modes” [12,13]. In the following sections, this concept will be uniformly referred to as the maximum PV hosting capacity of the distribution network. Currently, China has also issued relevant technical standards and guidelines, such as the “Guidelines for Assessing the Hosting Capacity of Distributed Generation Connected to Power Grids” (DL/T 2041) [14]. Internationally, the International Electrotechnical Commission (IEC) has also issued the “Guidelines for Evaluating the Hosting Capacity of Distributed Generation in Distribution Networks” (IEC TS 63276:2024) [15], which imposes constraints on the integration capacity of distributed PV in distribution networks. The integration of distributed PV can alleviate part of the supply pressure and improve the voltage profile. Distribution networks generally permit operational indices to vary within a prescribed safety range, provided that the integration of distributed PV does not compromise the secure and stable operation of the network. The PV hosting capacity investigated in the subsequent sections of this paper is likewise determined based on the condition that distribution network indices do not exceed their permissible limits.
Regarding the assessment of PV hosting capacity in distribution networks, scholars worldwide have proposed a variety of evaluation methodologies from diverse perspectives. In terms of uncertainty modeling, existing studies predominantly employ methods such as probability distribution fitting, scenario generation, and interval analysis. Reference [10] analyzes the characteristics of PV output under different weather types and proposes a generalized weather type clustering method based on PV output fluctuation features. Reference [11] presents an interval analysis method for distributed PV hosting capacity in distribution networks, decomposing the problem into optimistic and pessimistic sub-models, and simplifying the solution process through equivalent transformations. Reference [16] proposes a stochastic method for evaluating PV hosting capacity and applies it to a typical rural low-voltage four-wire network in Slovakia. Reference [17] analyzes the hosting capacity of distributed generation in distribution networks from the perspective of harmonic emission levels. Reference [18] calculates the optimal PV penetration level subject to distribution network security constraints stipulated by system operators, and identifies the maximum tolerable PV capacity. Reference [19] analyzes the predominant limiting factors affecting distributed PV integration in low- and medium-voltage distribution networks across 98 cities, concluding that voltage violation is the most significant constraint, followed by line capacity limitation. Reference [20] restricts the maximum line current based on the rated current of protective devices, and subsequently analyzes the PV hosting capacity of the distribution network. Reference [21] analyzes the PV hosting capacity of distribution networks by varying the per-unit voltage of the upstream substation, revealing that line transmission capacity emerges as the dominant limiting factor for PV hosting.
Regarding the optimization of distributed PV integration in distribution networks, researchers have proposed a variety of models and algorithms. Reference [22] considers extreme PV scenarios and establishes a planning model with the grid-connected nodes and capacities of PV systems as decision variables, aiming to maximize both total installed PV capacity and voltage security margin. A Benders decomposition method is employed to solve the resulting bi-level optimization model comprising master and sub-problems. Reference [23] proposes a multi-objective optimal dispatch model for distribution networks that accounts for the joint source-load output characteristics. The Pareto front solution set is obtained via NSGA-III, and the entropy-weighted TOPSIS method is subsequently employed to select the optimal multi-objective solution. Reference [24] evaluates the hosting capacity of distributed generation in distribution networks by considering on-load tap changers (OLTCs) and static var compensators (SVCs). Reference [25] proposes a cluster-oriented planning method for distributed PV and establishes a bi-level coordinated siting and sizing model. Reference [26] constructs a bi-level joint optimal configuration model for photovoltaic and storage systems that accounts for whole-life-cycle economy, grid vulnerability, and carbon emissions, and solves it cooperatively using K-means++ clustering and a hybrid intelligent algorithm. Reference [27] optimizes the integration capacity and connection nodes of distributed PV in distribution networks based on distributionally robust optimization. Reference [28] optimizes the distributed PV integration capacity in distribution networks using a heuristic algorithm while accounting for multiple factors such as voltage fluctuation and short-circuit capacity. However, intelligent algorithms such as heuristic methods are prone to becoming trapped in local optima. References [29,30] optimize the grid-connected locations and quantities of distributed PV in distribution networks based on typical daily historical data, employing Monte Carlo simulation methods. Reference [31] proposes a dynamic assessment method for distributed PV hosting capacity based on quasi-static time-series simulation.
Currently, research on PV hosting capacity in distribution networks under fault scenarios remains scarce, with most scholars focusing on modeling and analyzing PV integration capacity under normal operating conditions. As the penetration level of distributed PV in distribution networks increases, voltage and frequency are adversely affected, and the operational risk of the distribution network escalates accordingly [32]. According to the relationship between PV output and load demand at the point of interconnection, the scenarios can be broadly categorized into three types. The first corresponds to the early stage of low penetration, where feeder load demand generally exceeds distributed PV generation, and thus PV integration exerts little noticeable impact on distribution network operation. The second occurs as penetration increases to the point where PV output begins to approach and eventually exceed local load demand, causing reverse power flow on the feeder during certain periods. The third is the high-penetration scenario, where distributed PV generation substantially exceeds local load, and sustained reverse power flow may trigger operational issues such as voltage violations, excessive line loading, and maloperation or failure of protection systems [33]. Reference [34] proposes a two-stage stability enhancement framework, where weak-node parameters are optimized in the planning stage and data-driven predictive control is adopted in the operation stage, so as to suppress the broadband oscillation risk in power systems with high renewable penetration. Reference [35] analyzes the current-voltage relationship of distributed PV equipment under fault conditions and establishes an equivalent model. Reference [36] characterizes the output behavior of distributed PV under fault scenarios based on a positive- and negative-sequence voltage source model. However, the aforementioned models do not specifically address the PV hosting capacity of distribution networks under fault scenarios. Under fault conditions, the maximum PV integration capacity decreases, which constitutes a non-negligible aspect of distribution network PV hosting capacity research.
The integration of mobile shared energy storage (MSES) can further enhance the PV hosting capacity of distribution networks. As a critical infrastructure supporting the construction of new-type power systems, the large-scale development of energy storage technology has become an inevitable future trend. Some scholars have introduced the concept of the sharing economy into the energy storage sector, innovatively proposing a novel business model termed shared energy storage. This model decouples the ownership and usage rights of energy storage facilities, establishing a market-based sharing mechanism grounded in capacity, power, and energy. It enables diverse market entities on the generation side, grid side, and demand side to obtain on-demand services—including peak shaving, frequency regulation, reserve provision, and electricity price arbitrage—without owning storage assets. Reference [37] proposes a shared energy storage mechanism on the generation side and validates it using historical wind power data. Reference [38] reviews the development status and key technologies of mobile energy storage in distribution networks, and elucidates its distinctive role in distribution network operation and management. Reference [39] proposes a two-stage stochastic planning method for determining the siting and sizing of mobile energy storage, accounting for spatiotemporal correlations of uncertain factors, with the aim of ensuring the secure and stable operation of distribution networks under high penetration of distributed renewable energy. Reference [40] proposes a post-disaster restoration strategy for distribution networks that accounts for the spatiotemporal characteristics of mobile energy storage, based on a traffic impedance model and the Floyd algorithm, validating the effectiveness of mobile storage in enhancing supply restoration capability.
Although existing studies have made certain progress in assessing the PV hosting capacity of distribution networks, the following shortcomings remain. First, most existing studies optimize the PV integration capacity at fixed nodes within the distribution network, failing to encompass all feasible interconnection nodes in a holistic investigation, thereby introducing bias into the calculation of the maximum PV hosting capacity. Second, if the research focuses solely on maximizing the hosting capacity while overlooking critical factors such as economic viability, the findings will lack practical engineering applicability. Furthermore, the majority of current studies emphasize hosting capacity assessment under normal operating conditions, with relatively few investigations dedicated to fault scenarios. Under fault conditions, alterations in the distribution network topology and reverse power flows may cause operational indices to exceed their limits, consequently diminishing the PV hosting capacity-a characteristic that existing methods fail to adequately capture.
Addressing the planning of distributed PV in distribution networks, this paper proposes an analytical method for determining the optimal PV hosting capacity and interconnection nodes that accounts for load stochasticity and fault scenarios. This study departs from the conventional deterministic analysis paradigm based on single historical datasets, employing Latin hypercube sampling to extract representative load scenarios and conducting joint optimization. Concurrently, a distribution network planning model incorporating MSES is constructed. By balancing PV hosting capacity with operational economics and exploiting the flexible dispatchability of mobile storage, the model achieves enhanced effective PV accommodation and provides emergency power support under fault conditions. The main innovations are summarized in the following three aspects.
- (1)
- A stochastic optimization framework that couples uncertainties with fault scenarios is proposed. This framework establishes a globally consistent PV interconnection decision variable that remains invariant across all random scenarios. This global-local decision architecture enables the optimal solution to guarantee distribution network security under both normal operating and anticipated contingency conditions, thereby yielding a more robust and physically realistic hosting capacity estimate.
- (2)
- A collaborative optimization model incorporating MSES is constructed. By introducing MSES into the distribution network collaborative optimization framework, the model not only further exploits the PV regulation potential through its spatiotemporal transferability, but also effectively addresses the supply reliability issue under fault conditions by leveraging its emergency power supply capability. It also reveals how MSES deployment alters the sensitivity of hosting capacity to fault disturbances.
- (3)
- A multi-objective trade-off mechanism that balances distribution operation security with economic benefits is proposed. By combining the minimization of operating cost with the maximization of PV hosting capacity, a multi-objective coordinated optimization that balances technical performance and economic efficiency is realized. The optimal hosting capacity and interconnection nodes are simultaneously and synergistically optimized, providing a more valuable reference scheme for practical engineering applications.
2. Optimal PV Integration Capacity Model
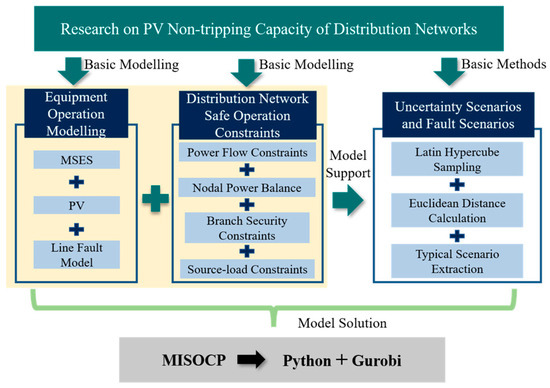
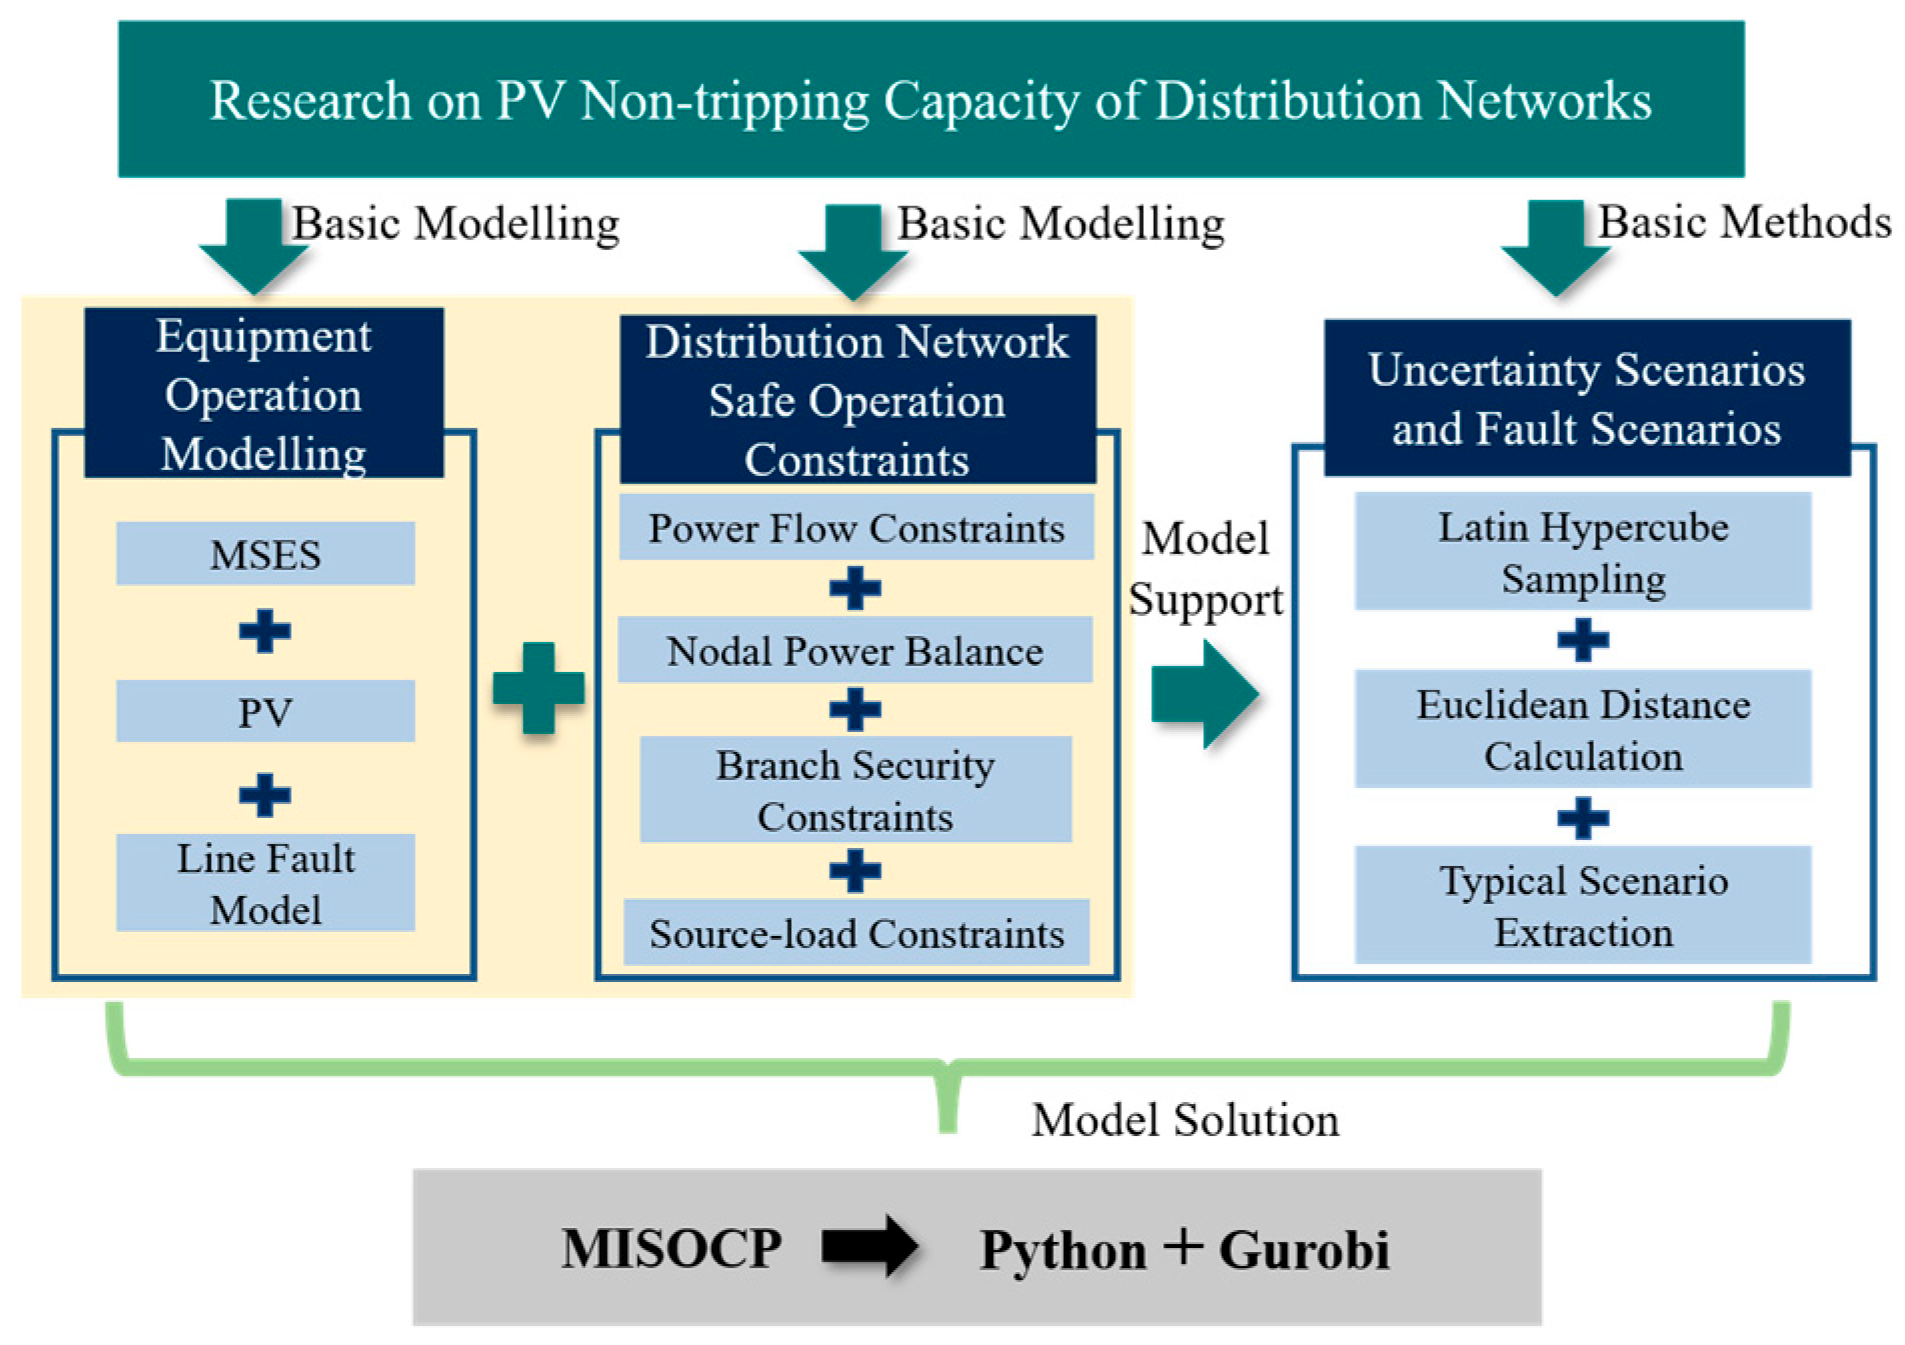
The optimization model for the maximum PV integration capacity in distribution networks is established under the premise of secure and stable network operation, and investigates the accommodated PV generation. The model adopts the operating cost as the objective function and optimizes the PV integration capacity while accounting for economic benefits. Given the inherently low cost of PV generation, the optimization process prioritizes the utilization of green renewable energy from PV sources. Furthermore, to further explore the maximum PV generation capacity, incentive measures are also incorporated for PV output. The constraints of the model include safety measures such as node voltage limits and line transmission capacity, thereby ensuring that the investigation of PV integration capacity is conducted under the precondition of secure distribution network operation. The research content flowchart is shown in Figure 1.
Figure 1.
Research framework.
2.1. Objective Function
The model adopts the minimization of system operating cost as the optimization objective (1), which primarily comprises the distribution network operating cost (2), the MSES cost (3), and the PV-related cost (4). Specifically, the distribution network operating cost includes the cost of purchasing electricity from the upstream grid and the penalty cost for unserved load. Since the operator of the MSES considered in this paper is not the grid operator but merely a provider of ancillary support services, its operating cost is calculated based on the number of dispatch instances. We took into account the scheduling costs associated with each instance of charging or discharging for ancillary services. This represents a composite single-dispatch cost that implicitly accounts for the transportation, labor, equipment depreciation, and logistics management expenses associated with mobile storage deployment. The distributed PV cost mainly comprises three components: the average daily cost of PV node integration, the incentive cost granted by the government in response to national policies promoting green electricity utilization, and the penalty cost for PV curtailment. This design aims to both encourage green power supply and prevent excessive industry competition and arbitrage.
where j is the index of distribution network nodes; t is the time index; r is the index of the PV; , , and denote the sets of upstream substations, shared energy storage units, and distributed PV systems, respectively; is the time-of-use electricity price of the upstream grid; is the cost of purchasing electricity from the upstream grid; is the penalty cost for load curtailment; is the amount of unserved load at node j; is the average cost per dispatch of the energy storage unit; is a binary variable indicating the operational state of mobile shared storage unit a, where a value of 1 signifies that the unit is connected to the distribution network at time t, and 0 otherwise; is the average daily cost of PV node integration; is a binary variable representing the connection status of PV unit r, where a value of 1 indicates that PV unit r is connected to the distribution network node; is the incentive fee per unit of PV generation; is the power generation of PV unit r; is the penalty cost per unit of curtailed PV generation; and is the amount of curtailed PV generation of unit r.
2.2. Constraints
The secure and stable operation of the distribution network must also satisfy certain constraints, including nodal active/reactive power balance, upper and lower bounds on nodal voltage, upper and lower limits on line power flow, and equipment safety operation constraints.
2.2.1. Power Flow Constraints
This paper constrains the power flow and voltage relationships of the distribution network based on the DistFlow model. The relevant constraints are expressed in (5) and (6).
where is the voltage magnitude at node i of the distribution network at time t; and are the resistance and reactance of the line between nodes i and j, respectively; is the current flowing through line (i, j); and and are the active and reactive power transmitted on line (i, j), respectively.
Due to the quadratic terms in (5) and (6), the model becomes nonlinear, rendering its solution more difficult. Therefore, the second-order cone relaxation (SOCR) method is considered for linearization. Let and . The DistFlow model in (5) can be rewritten as (7). The second-order cone relaxation form of (6) can be relaxed into (8). (8) can be further expressed as (9).
2.2.2. Nodal Power Balance Constraints
To better investigate the transmission of active and reactive power on lines during distribution network faults, this paper adopts the AC power flow method to enforce nodal power balance. The active and reactive power balance constraints at each node are given by (10) and (11), respectively.
where denotes the reactive power purchased from the upstream grid; and are the forecasted active and reactive load values at node j, respectively; is the power flow of MSES unit a; is the reactive power output of PV unit r; and is the set of end nodes for which node j serves as the sending-end bus.
2.2.3. Line Safety Constraints
To further account for the thermal stability characteristics of lines following PV integration in practical engineering operation, the safe operating conditions of the distribution network are constrained in accordance with actual production practices. The upper and lower limits on active and reactive power transmitted through lines during distribution network operation are given by (12) and (13), where (12) specifically restricts the reverse power overload capability caused by PV feed-in. The branch current constraint is expressed in (14), which limits the current-carrying capacity of the line. The upper and lower bounds on nodal voltage are given by (15). Voltage constraint (15) applies to all nodes in the distribution network, including the PCC bus. Together with the reverse power flow limits (12) and (13), it ensures that overvoltage and reverse power flow induced by PV injection are properly constrained.
where and are the maximum allowable active and reactive power transmitted on the line, respectively; and are the upper and lower bounds for reverse power flow on the branch; is the maximum allowable current of the line; and and are the minimum and maximum voltage magnitudes at node j, respectively.
2.2.4. Electricity Purchase Constraints
The power flow transmitted from the upstream substation to the distribution network must ensure the security of the upstream grid. The upper and lower limits on power purchased from the upstream grid are given by (16) and (17).
where and denote the maximum allowable active and reactive power purchased from the upstream grid, respectively.
2.2.5. Load Curtailment Constraint
The load curtailment at each load node in the distribution network shall not exceed its forecasted load value, as expressed in Equation (18).
2.2.6. Energy Storage Device Operation Constraints
The integration of energy storage devices can enhance the operational flexibility of distribution networks, improve the utilization of distributed photovoltaic generation, and facilitate economically viable and environmentally friendly operation of the distribution system. This paper considers mobile energy storage as an emergency resource to be dispatched following line faults, with the aim of achieving maximum power supply restoration. The constraint on the maximum number of MSES units allowed to participate at each time interval is given by (19). Within this prescribed limit, the shared storage units can be relocated according to dispatcher instructions and connected to the most suitable nodes. The charging and discharging constraints of the energy storage device are given by (20). The relationship between stored energy and power flow of the storage device is expressed in (21). The stored energy must reach a balanced state within one operating day, as constrained by (22). The charging and discharging constraints of the storage device are further detailed in (23) and (24). The storage capacity constraint is given by (25). However, factors such as positioning delays and traffic constraints are neglected in this study, which introduces certain limitations to the model. Nevertheless, as this study focuses on the fundamental electrical benefits of MSES under fault conditions, these assumptions are acceptable for the qualitative investigation of PV hosting capacity in distribution networks during contingencies.
where is the number of emergency storage units deployed to the grid in each hour; and represent the discharging and charging power of the storage unit, respectively; denotes the current stored energy level of the storage device; and are the minimum and maximum discharging power of the storage device, respectively; and are the minimum and maximum charging power of the storage device, respectively; and and are the minimum and maximum stored energy capacity of the storage device, respectively.
2.2.7. Distributed PV-Related Constraints
The integration of distributed PV can provide power support to the distribution network, but it must also satisfy certain constraints. (26) constrains the admissible PV capacity at each interconnection location. (27) imposes the maximum PV generation limit at each time interval. (28) represents the active power support capability constraint, requiring that the PV active power output satisfies the condition corresponding to its minimum power factor angle. (29) describes the coupling constraint between reactive and active power of distributed PV. (30) expresses the relationship between the forecasted and actual PV output.
where and are the minimum and maximum hosting capacity of PV unit r, respectively; is the power conversion coefficient of the PV unit; is the minimum output level of PV unit r; and are the minimum and maximum power factor angles of PV unit r, respectively; and is the forecasted output of PV unit r at time t after accounting for fluctuations.
2.2.8. Distribution Network Line Fault Constraints
During operation, the distribution network may encounter extreme weather events, load overloading, maloperation of protective devices, or human errors, leading to temporary outages on certain feeders. This paper considers fault scenarios in which lines are rendered inoperative by extreme weather, and further analyzes the PV hosting capacity under such conditions. The line fault constraint is given by (31).
where is the set of faulted lines; is the set of fault time periods; is a binary variable indicating the operational status of the line, where a value of 0 signifies that line (i,j) is deactivated due to the fault, and a value of 1 denotes normal operation; and M is a sufficiently large positive constant.
2.3. Abstracted Model Formulation
To facilitate the subsequent introduction of the stochastic optimization model for PV hosting capacity in distribution networks, the above optimization model is abstracted into Equations (32)–(34). Equation (32) represents the objective function of the optimization model; Equation (33) encapsulates the constraints pertaining to the integration of distributed PV or MSES into the distribution network, as well as the line fault-related constraints. Equation (34) denotes the constraints related to distribution network operation.
where x is a vector of binary decision variables, encompassing auxiliary variables representing line fault status and variables indicating the interconnection status of facilities to the distribution network; is a vector of continuous decision variables; is a vector comprising the curtailed PV generation and the unserved load; and a, b, g, e, fbc, A, H, D, and E denote the coefficient vectors or matrices associated with the objective function, the constraints on facility interconnection to the distribution network, the line fault constraints, and the operational dispatch constraints, respectively.
3. Stochastic Optimization Model for PV Hosting Capacity in Distribution Networks
Existing methods for evaluating the PV hosting capacity of distribution networks mainly include simulation search, probabilistic scenario analysis, mathematical optimization, and data-driven approaches. Simulation search and Monte Carlo methods are simple to implement and capable of accounting for operational uncertainties; however, they rely heavily on numerous power-flow calculations and offer limited synergy between capacity assessment and network resource allocation. Data-driven approaches feature high computational efficiency, yet they depend on high-quality data and exhibit limited physical interpretability and generalization capability. Mathematical optimization methods can incorporate PV capacity, interconnection locations, and network regulation resources into a unified decision-making framework. Among these, stochastic programming characterizes source–load uncertainties through probabilistic scenarios, striking a balance between economic performance and operational risk, and is less conservative than robust optimization. Therefore, this paper adopts a stochastic programming approach to optimize the PV hosting capacity of distribution networks considering source–load uncertainties.
Since the load level of a distribution system is influenced by various factors such as user consumption habits, time of day, and weather conditions, it exhibits significant spatiotemporal randomness. The model established in this paper is an uncertainty model. Numerous solution methods exist for this class of models [41], such as stochastic optimization, robust optimization, and chance-constrained optimization. This paper adopts the scenario-based stochastic optimization method. Compared with other methods, the scenario-based stochastic approach can explicitly trade off expected return and risk, and does not impose stringent analytical requirements on the distribution shape of the random variables. This paper adopts a stochastic optimization algorithm to efficiently address the uncertainty in load levels. First, the load data of a typical day in a certain region are selected as the baseline dataset. Then, a large set of scenarios is generated through random sampling, followed by a clustering method to reduce the data into a compact set of representative scenarios, thereby facilitating a more tractable treatment of uncertainty. The optimization is then performed on this reduced scenario set.
3.1. Generation of Typical Uncertainty Scenarios
Based on stochastic scenario analysis theory, a large number of forecast scenarios are first randomly generated using Latin hypercube sampling (LHS), from which a set of M random scenarios is produced. A scenario clustering method is then employed to reduce the scenario set to N representative scenarios, and the optimization is performed based on the occurrence probabilities of these N scenarios. This paper leverages LHS to generate a large number of forecast scenarios based on regional historical baseline load data and error profiles, which are then reduced to representative scenarios for subsequent analysis. This process mainly comprises the following steps.
- (1)
- Uniform sampling: The input historical load data are partitioned into intervals, and a single sample is randomly drawn from each interval, thereby generating M samples.
- (2)
- Reordering: The sequence of the sampled load scenarios is permuted, and Cholesky decomposition is applied to reduce the correlation among the individual random scenarios.
- (3)
- Representative scenario selection: The generated scenarios are reduced to N using the simultaneous backward reduction method.
Steps of the simultaneous backward reduction method:
- (1)
- Initialize the occurrence probabilities of the M scenarioswhere is the occurrence probability of the mth scenario, and M is the total number of scenarios.
- (2)
- Calculate the Euclidean distance between each pair of random scenarioswhere is the Euclidean distance between scenario and scenario in the random scenario set.
- (3)
- Denote the obtained Euclidean distance matrix as , and multiply this matrix by the scenario occurrence probabilities to obtain the probability-weighted Euclidean distance matrix
- (4)
- Identify the scenario pair with the smallest entry in the probability-weighted Euclidean distance matrix. Remove one of the two scenarios, delete the corresponding row and column associated with the removed scenario from the distance matrix , and recompute the Euclidean distance matrix, denoted as . Add the probability of the deleted scenario to that of the remaining scenario in the pair. Update M = M − 1.
- (5)
- Repeat steps (2) through (4) until the total number of scenarios M is reduced to N.
In this manner, N random scenarios that account for load fluctuations are sampled.
3.2. The Stochastic Optimization Abstracted Model Formulation
The stochastic optimization model for PV hosting capacity in distribution networks under fault conditions is presented in Equations (38)–(42). Equation (38) represents the objective function; Equations (39) and (40) capture the constraints related to the integration of distributed PV or mobile shared storage into the distribution network along with the line fault constraints; Equations (41) and (42) denote the operational constraints of the distribution network. Since the decision variables for PV interconnection nodes are identical across all random scenarios, they are independent of the extracted representative scenario k. The remaining optimization decision variable are scenario-dependent.
where k is the index of the random scenario; K is the number of representative scenarios obtained after stochastic sampling and reduction; is the decision variable for the interconnection of distributed PV to the distribution network, which is common across all random scenarios; denotes the auxiliary decision variables for line fault status and the decision variables for the interconnection of MSES to the distribution network in scenario; represents the curtailed PV generation and the unserved load in scenario; and , , , and denote the coefficient vectors or matrices associated with the facility interconnection constraints, line fault constraints, and operational dispatch constraints within the stochastic simulation.
By applying SOCR processing to the power flow model of the distribution network, the computational complexity of the model was reduced. Ultimately, the model was formulated as a mixed-integer second-order conic programming (MISOCP) problem and solved using the commercial solver Gurobi.
4. Case Study
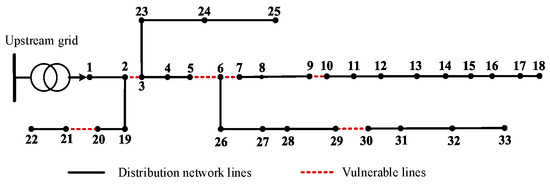
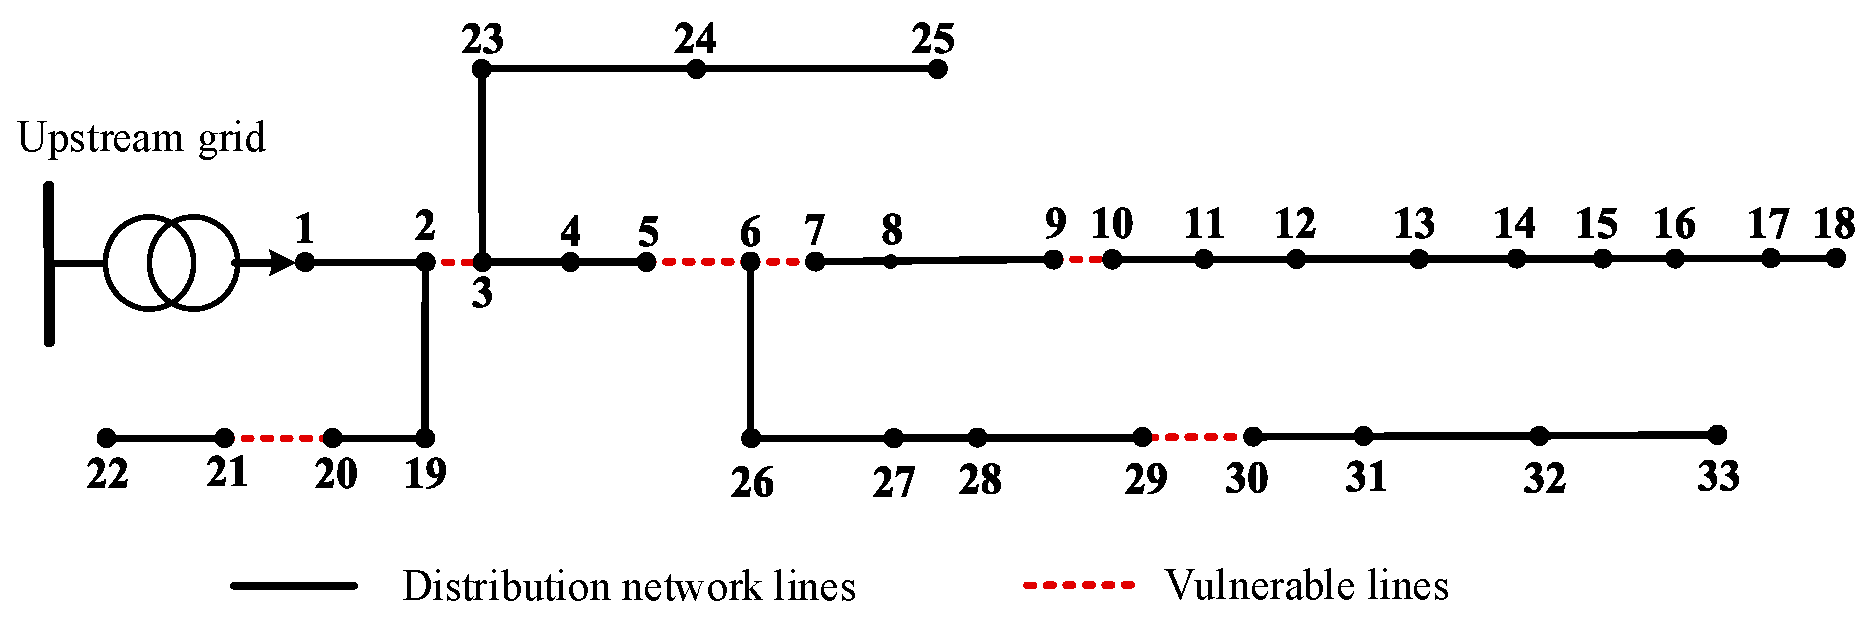
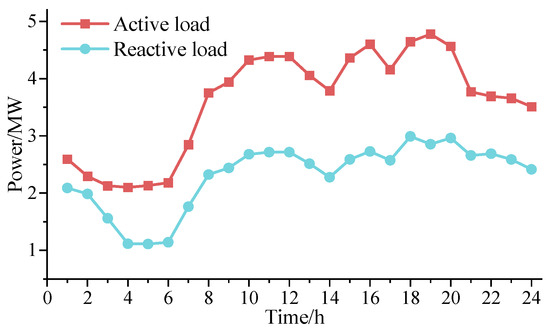
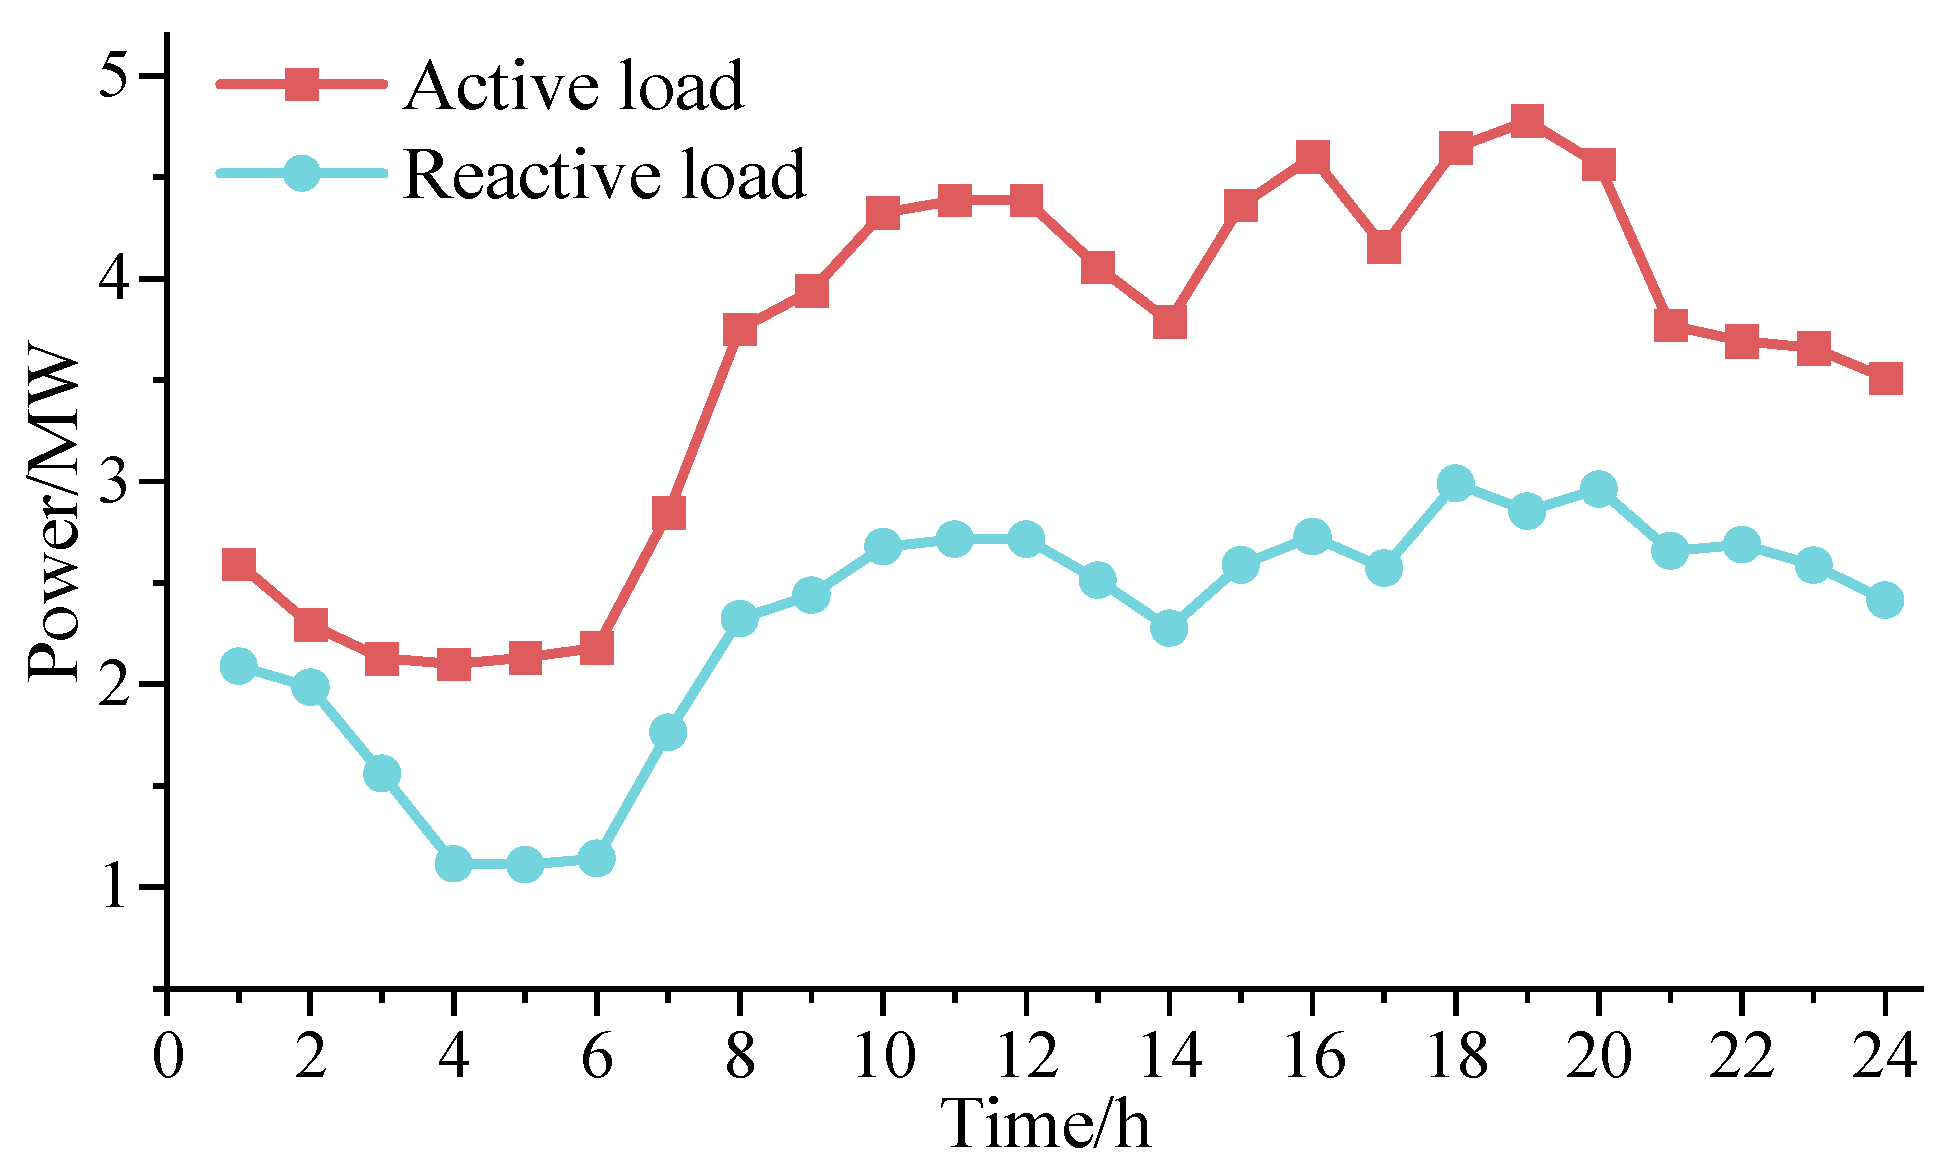
The case study in this paper is conducted on a modified IEEE 33-bus system to validate the correctness and practicality of the proposed model for determining the optimal PV hosting capacity in distribution networks, considering load uncertainty and line fault conditions. The topology of the test system is illustrated in Figure 2. The load data for the test system is shown in Figure 3.
Figure 2.
Topology of the case system.
Figure 3.
Load curves of the case system.
In the optimization of optimal PV hosting capacity, all nodes except the head-end node connected to the upstream substation are considered candidate interconnection nodes. To further investigate the optimal PV hosting capacity under fault conditions, this paper identifies vulnerable lines with potential risks and assumes that these lines experience transmission failure during the peak load period (18:00–20:00) due to extreme weather and overload operation. The case study settings are summarized in Table 1. In Cases 1 through 6, the maximum number of PV installations is set to 32, the maximum number of mobile emergency storage units is set to 10, and all nodes except the head-end node connected to the upstream substation are eligible for interconnection. The time-of-use electricity tariff is adopted from the document issued by the Jiangsu Provincial Development and Reform Commission, while parameters such as the PV curtailment penalty cost and the storage dispatch cost are sourced from Reference [42]. The case simulations are implemented in Python 3.13 and solved using the Gurobi optimizer 12 on a computer equipped with an Intel i9-12900K processor.
Table 1.
Case study settings.
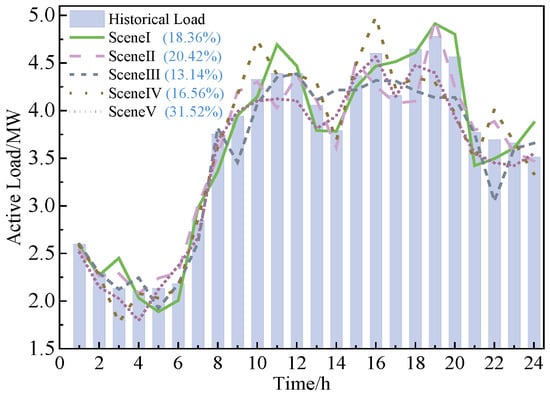
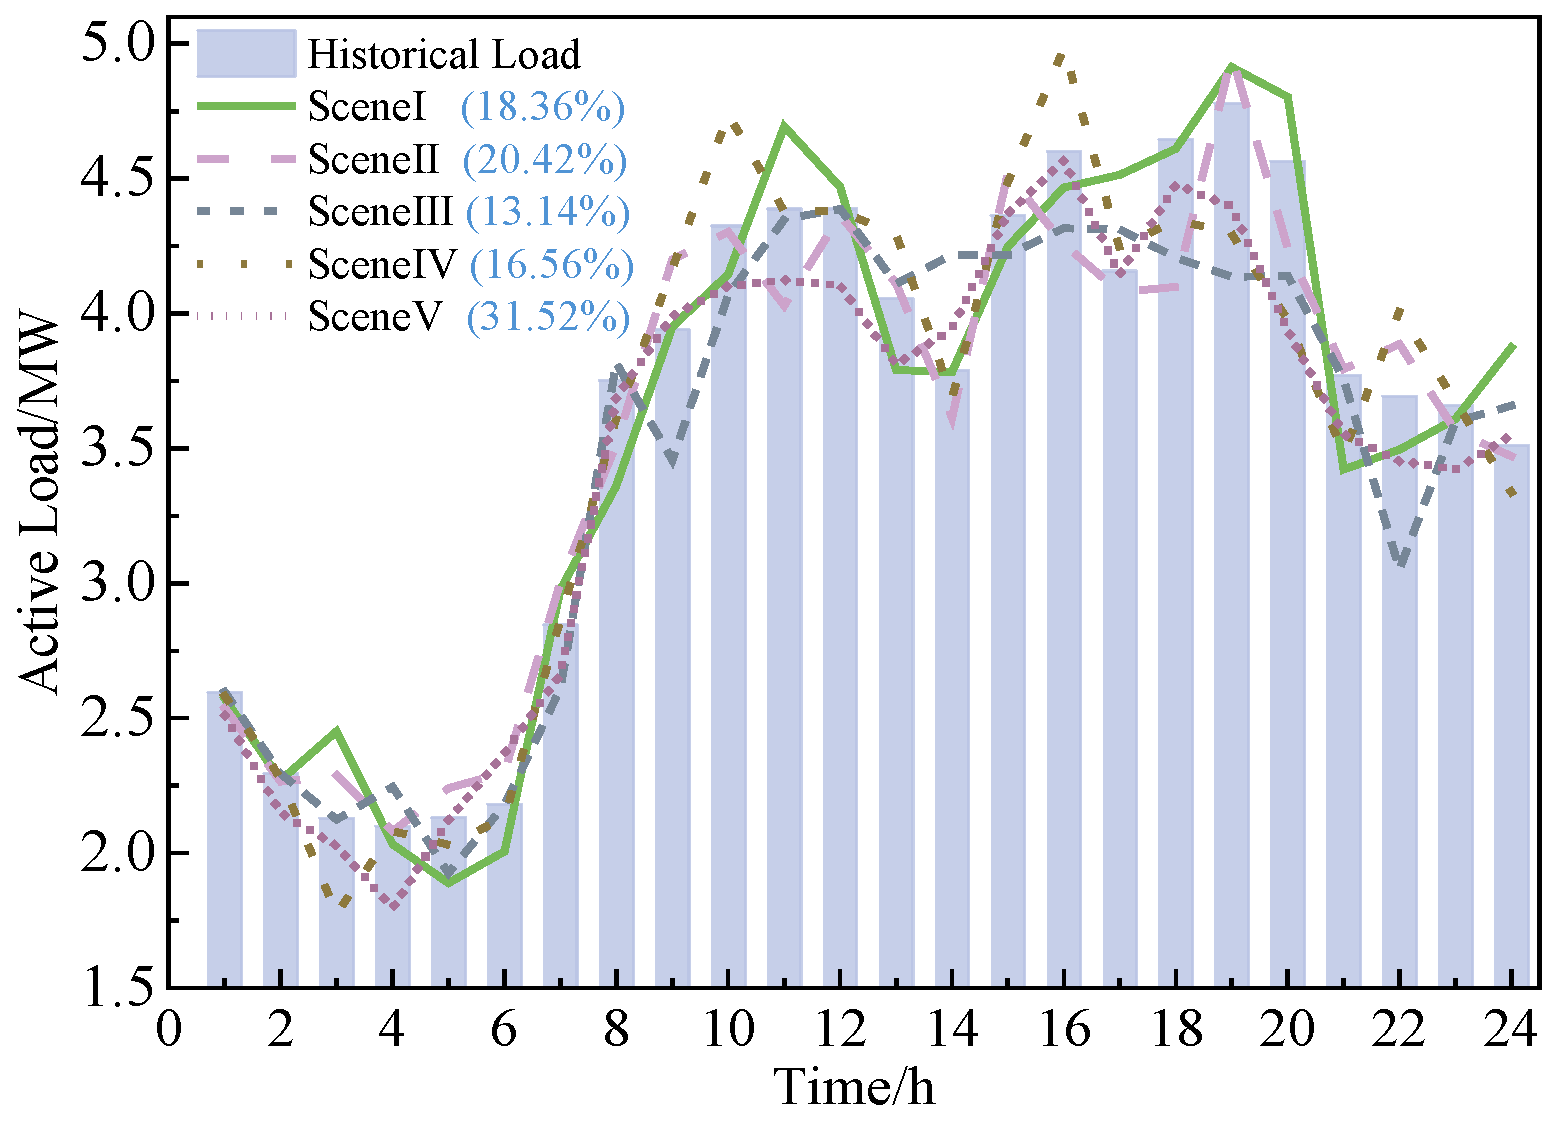
Existing studies on the optimal PV hosting capacity in distribution networks typically consider only the thermal stability limits and operational limits of the equipment themselves, and are conducted based on historical load data. Cases 1–4 are therefore optimized based on historical load data. In contrast, Cases 5 and 6 account for the stochastic nature of load fluctuations. In this paper, 5000 scenarios are first randomly generated from historical load data using Latin hypercube sampling, and then reduced to five representative scenarios via clustering for simulation. This approach ensures both the diversity and randomness of the stochastic scenarios while preserving the authenticity of the forecast data, and avoids the degradation of simulation efficiency caused by an excessively large dataset. The historical baseline load and the load profiles of the five random scenarios are displayed in Figure 4, where the occurrence probabilities of the five scenarios are also annotated.
Figure 4.
Load profiles of the stochastic scenarios and the historical baseline load.
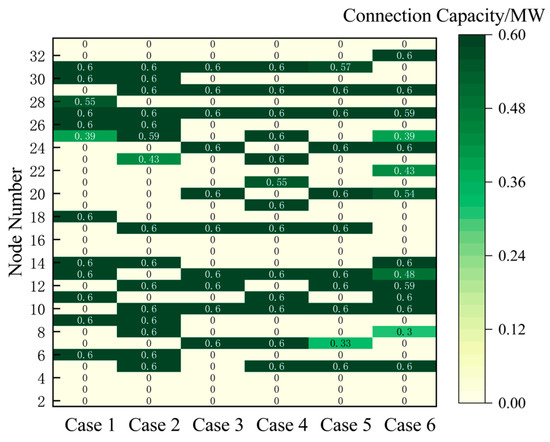
The distributed PV integration configurations for Cases 1 through 6 are illustrated in Figure 5. The figure shows the PV interconnection nodes and the corresponding installed capacities for each case. It can be observed from the figure that the PV installations are concentrated at downstream nodes along the feeder, such as Nodes 17, 18, 27, 30, 31, and 32. This is because, without PV integration, the distribution network relies entirely on the upstream substation for power supply, and the nodal voltage declines progressively along the transmission path. To prevent excessively low voltages that could compromise the secure operation of the distribution network, distributed PV is needed to provide local power support and ensure adequate load supply. Under fault-free conditions, PV units are concentrated at the end nodes of the feeder. These nodes exhibit the lowest voltage levels in the absence of PV, so local PV injection delivers the greatest voltage support benefit. The siting logic is to interconnect at the locations where voltage support is most needed. In contrast, under contingency-constrained scenarios, a portion of PV is allocated to upstream nodes. This is because a fault on an upstream feeder may isolate these nodes from the main grid, trapping PV generation and causing overvoltage within the islanded zone. The siting logic thus transitions to interconnecting at locations that maintain electrical connectivity under the most probable fault scenarios.
Figure 5.
Distributed PV integration configurations.
Case 2 builds upon Case 1 by incorporating MSES, which further absorbs surplus PV generation and thereby increases the PV hosting capacity of the distribution network. The PV hosting capacity is increased by 27.09% with the inclusion of MSES. The enhancement of PV accommodation capability by MSES stems from three mechanisms. The first is temporal decoupling: absorbing surplus generation at midday and releasing it in the evening, thereby overcoming the temporal mismatch between PV peaks and load peaks. The second is spatial flexibility: MSES can be strategically relocated to voltage-sensitive nodes, yielding greater voltage regulation benefits per unit capacity compared to stationary storage. The third is fault coordination: during contingencies, MSES supplies islanded power and supports voltage, preventing PV disconnection due to voltage dips and ensuring sustained operation. Case 3 extends Case 1 by accounting for distribution network faults, where line contingencies affect the PV integration decision, resulting in a 13.54% reduction in PV hosting capacity. Compared to Case 2, the PV hosting capacity in Case 4 is reduced by 12.13% due to the consideration of distribution network faults. Building upon Case 3, Case 4 further incorporates MSES, achieving a 29.17% increase in PV hosting capacity. Cases 5 and 6 account for load stochasticity. With the integration of MSES, Case 6 achieves a 19.37% increase in PV hosting capacity over Case 5. Cases 5 and 6 are simulated using historical data with Latin hypercube sampling, thereby accounting for load variability compared to Cases 1–4. After incorporating uncertainty, the PV hosting capacity is influenced by load variability, and the dispatch decision variables differ across typical scenarios. The final solution is a globally optimal decision scheme derived from multiple stochastic scenarios. Such a result offers greater practical reference value and can be combined with multi-year historical data from the corresponding region for joint optimization.
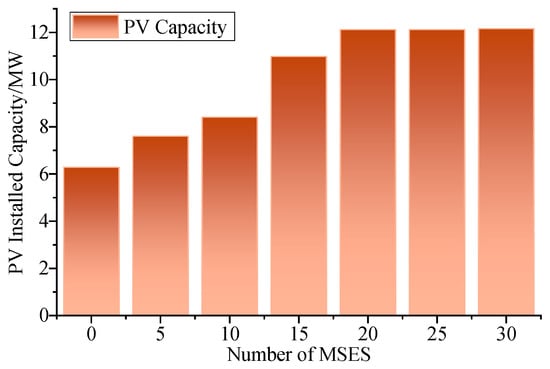
To further demonstrate the impact of the number of MSES units on the PV hosting capacity, simulations are conducted by varying the number of MSES units based on the settings of Case 2, and the results are presented in Figure 6. It can be observed from the figure that the PV hosting capacity increases with the addition of MSES units. This indicates that the participation of MSES can further enhance the PV hosting capacity of the distribution network. However, once the number of MSES units reaches 20, the incremental benefit to the PV hosting capacity becomes marginal. This is because the integration of MSES alleviates the voltage and power flow constraints. Once the number of MSES units reaches a certain threshold, the distribution network’s capacity to accommodate MSES approaches saturation, and further additions yield little breakthrough in this constraint; hence, the PV capacity stabilizes.
Figure 6.
Analysis of PV hosting capacity under different numbers of MSES units.
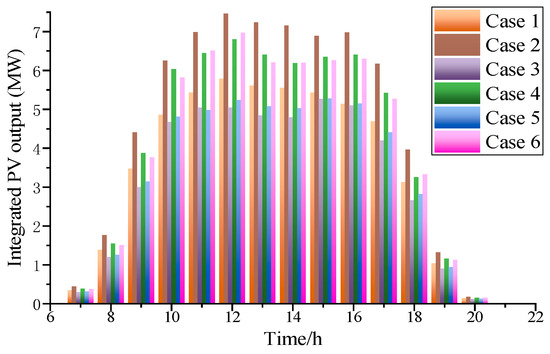
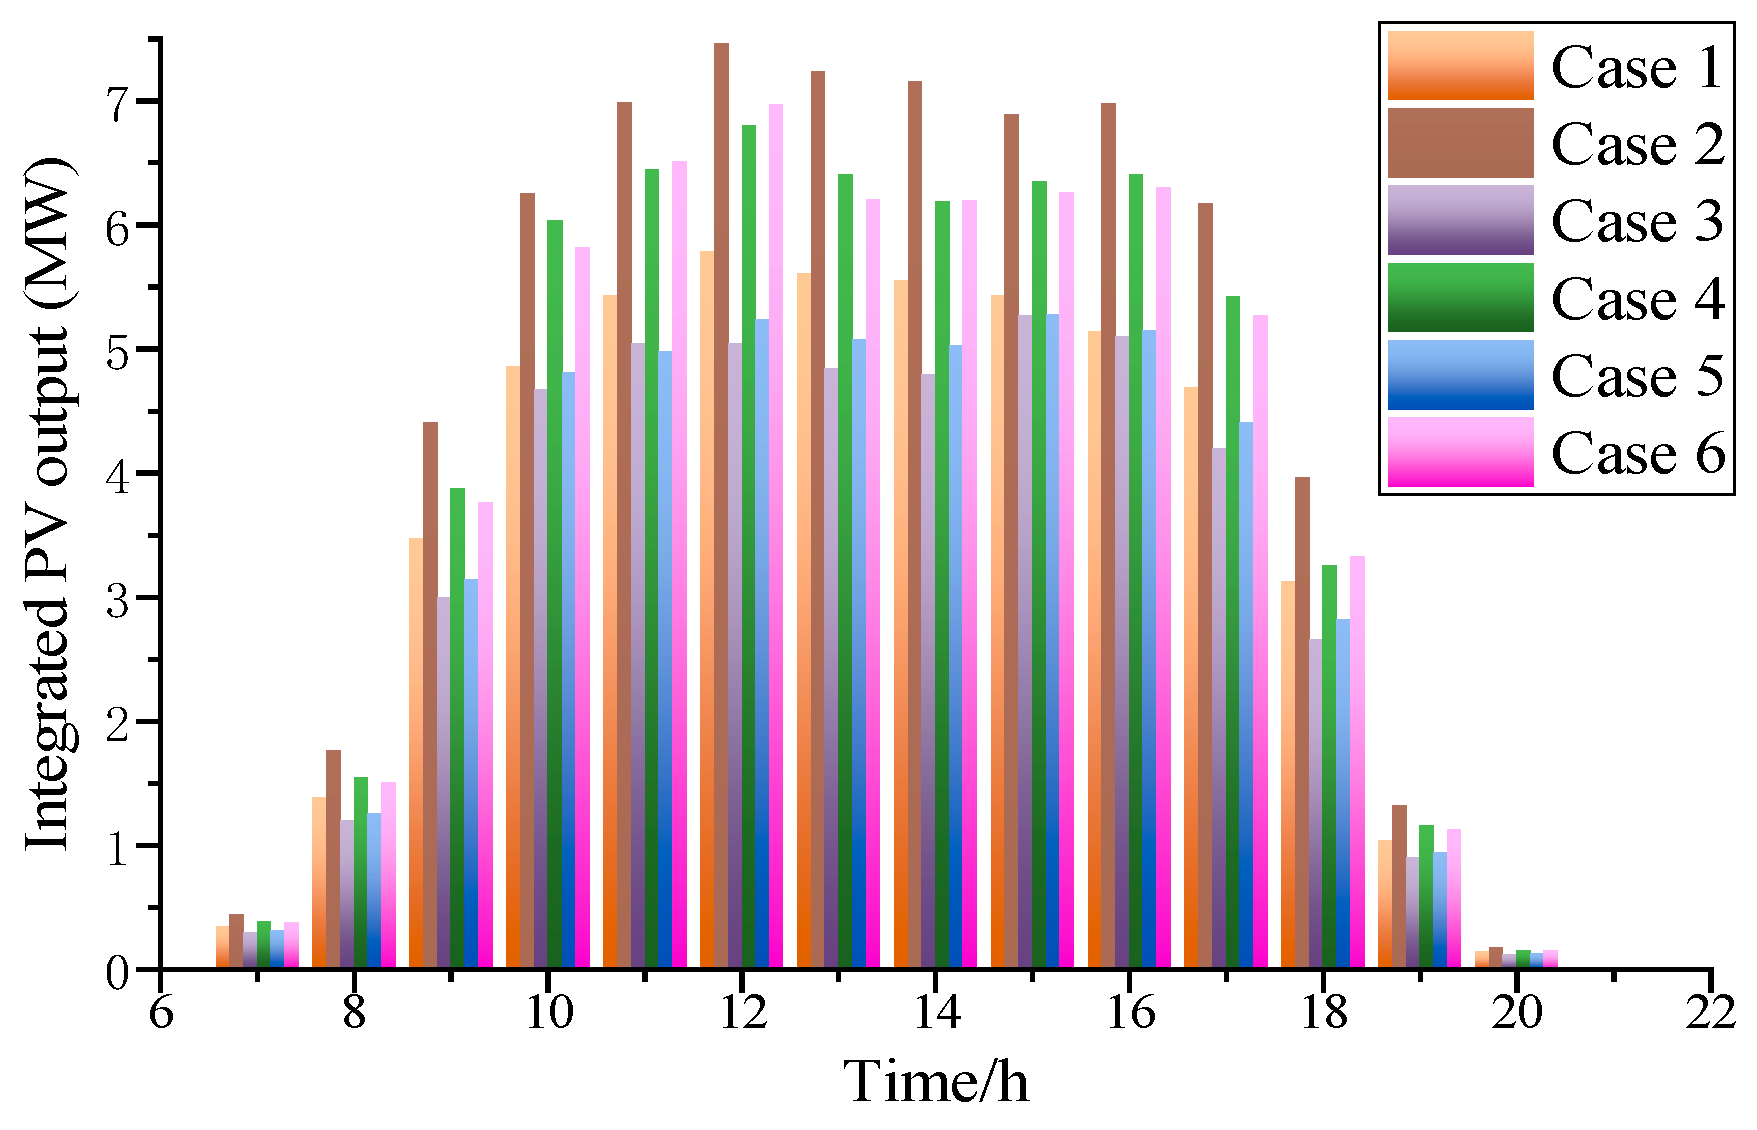
The active power output profiles of PV systems for Cases 1 through 6 are presented in Figure 7. The figure displays the aggregated PV output across all interconnected nodes in the distribution network. It can be observed from the figure that the distributed PV units receive sunlight and generate electricity between 7:00 and 20:00, reaching their peak output around noon (12:00). The PV output patterns across the cases follow a similar trend to the optimized PV hosting capacity results, and thus are not reiterated here. It is evident from the figure that Case 2, which incorporates MSES while neglecting load variability and line faults, achieves the highest PV absorption level. This configuration provides favorable conditions for effective distributed PV absorption. In contrast, Case 3, which considers line faults but does not include MSES, exhibits the lowest PV absorption.
Figure 7.
Distributed PV output profiles.
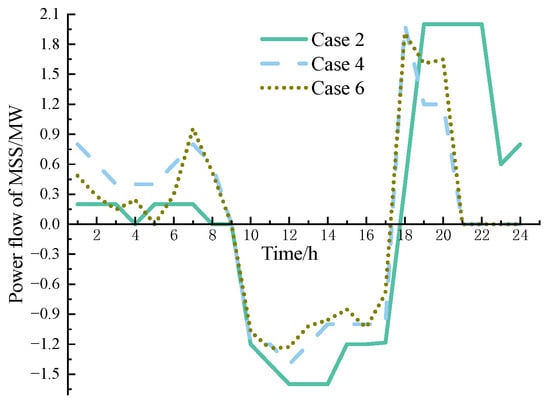
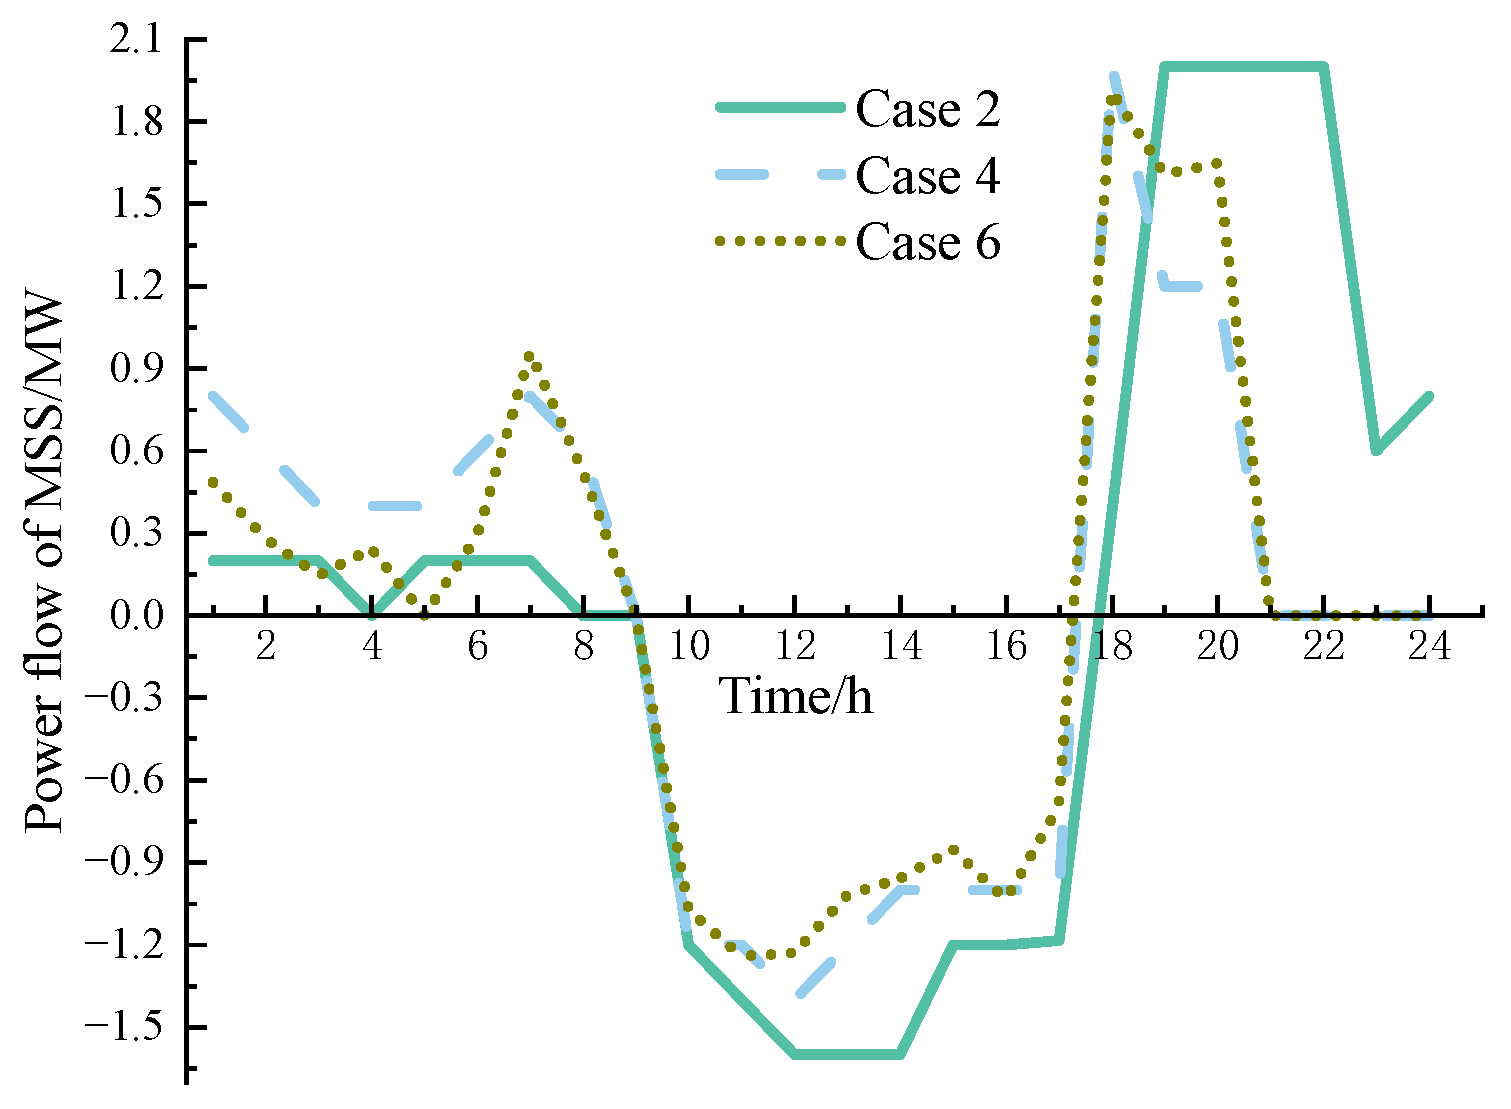
The total charging and discharging power of the MSES units at each time interval for Cases 2, 4, and 6 is illustrated in Figure 8.
Figure 8.
Charging and discharging power of MSES.
The trend also reveals that the MSES discharges during nighttime hours when PV output is absent or low, supplying power to the distribution network load. Conversely, during midday when PV output is abundant, the MSES charges to absorb the surplus PV generation. This enables efficient utilization of renewable energy. Cases 4 and 6 account for distribution network faults. During the contingency period from 18:00 to 20:00, the MSES urgently supplies power to the distribution network, providing critical power support and reducing the curtailed load. Specifically, Cases 4 and 6 delivered 4.4 MWh and 5.16 MWh of electricity, respectively, to the distribution network during the outage period. This significantly improves the reliability of power supply.
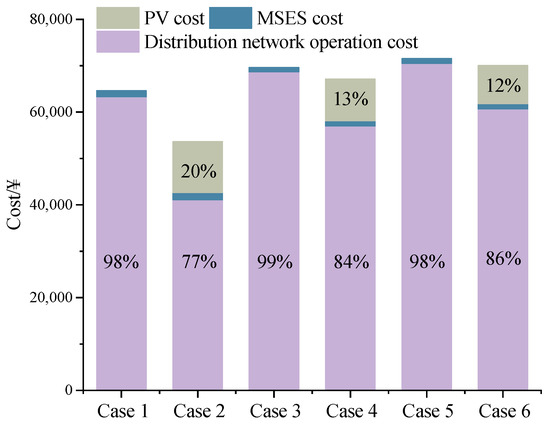
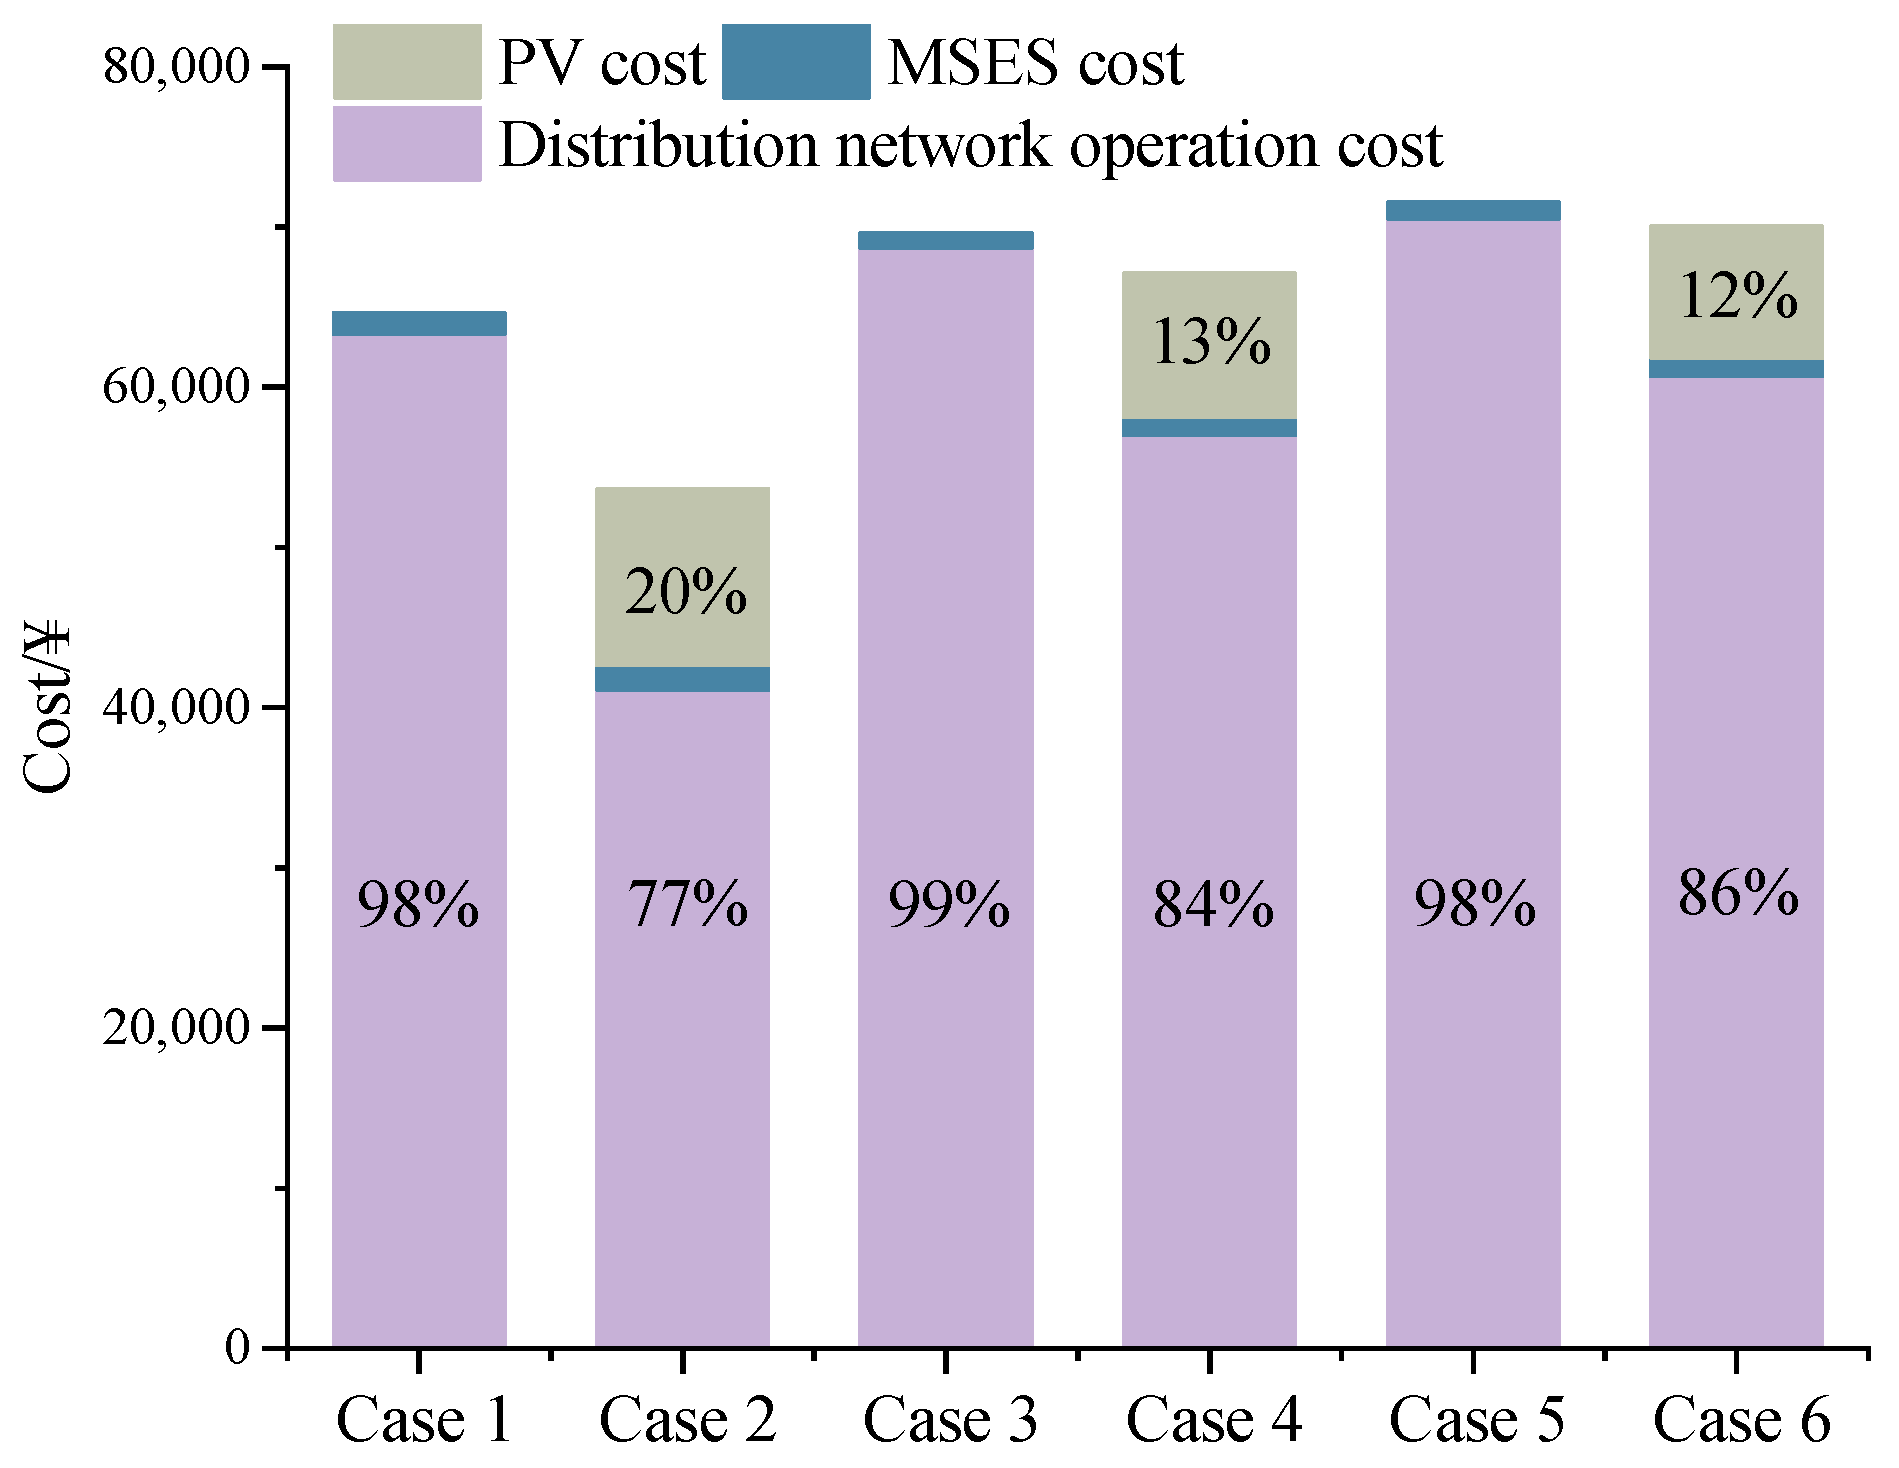
The associated costs for Cases 1 through 6 are presented in Figure 9. This is a stacked bar chart showing the proportion of each of the three cost categories within the total cost. It can be observed from the figure that Case 2, which incorporates MSES while excluding fault scenarios, achieves the lowest cost, whereas Case 5, which accounts for both load uncertainty and line faults without mobile shared storage, incurs the highest cost. MSES can fully absorb surplus distributed PV generation and leverage time-of-use electricity tariffs to achieve more economical power consumption. This substantially reduces the electricity cost: compared to Case 1, the cost in Case 2 is reduced by 17.03%; relative to Case 3, the cost in Case 4 decreases by 3.61%; and compared to Case 5, the cost in Case 6 drops by 2.09%. The costs of scenarios that consider faults are higher than those that do not, because the occurrence of a fault prevents a portion of the load from being served, leading to substantially increased compensation payments for load curtailment. Furthermore, after accounting for uncertainty, load fluctuations cause demand to increase during certain periods, which further drives up the operating cost. Consequently, the costs under uncertainty are higher than those under deterministic conditions.
Figure 9.
Cost comparison across all cases.
The number of variables and the solution time for Cases 1–6 are reported in Table 2. It can be seen from Table 2 that the inclusion of mobile energy storage introduces a larger number of variables into the model, and consequently, both the modeling time and the solution time increase. The introduction of MSES increases the variable count by 93.8% and the solution time by 47.9 s. This increase is expected, as MSES introduces binary variables for each unit in every time period, substantially enlarging the combinatorial search space. Nevertheless, the resulting 27.09% improvement in PV hosting capacity justifies this computational overhead. After adding the fault constraints, the solution time increases from 20.6 s to 77.5 s. This reflects the increased complexity introduced by the binary fault-status variables and the big-M constraints, which create additional branching nodes in the branch-and-bound tree. Shifting from deterministic to stochastic simulation increases the variable count by 397% and the solution time by 60.7 s. The most complex case involves 37,142 variables and a solution time of 205.2 s, which is acceptable for offline planning studies. In contrast, Cases 1–4, which are based on historical load data, involve fewer variables and shorter modeling and solution times compared to Cases 5–6 that adopt stochastic optimization under uncertainty. However, Cases 1–4 neglect forecast errors and fail to accurately capture sudden load changes or fluctuations. Although Cases 5–6 are more complex, this represents a reasonable computational cost for achieving superior economic performance and robustness, and their modeling and solution times do not escalate rapidly and remain acceptable.
Table 2.
Computational efficiency of the case studies.
5. Conclusions
This paper investigates the optimal PV hosting capacity in distribution networks, taking into account load uncertainty and fault conditions. The proposed model minimizes the total cost comprising distribution network electricity procurement cost, PV-related cost, and MSES cost, and is employed to examine the optimal PV hosting capacity under load uncertainty and fault conditions. The model is ultimately validated on the IEEE 33-bus system, leading to the following conclusions.
- (1)
- Distribution network faults can cause voltage redistribution or reverse power flow, which further reduces the PV hosting capacity. A reassessment of the PV hosting capacity under such conditions enables targeted configuration of PV capacity and siting, thereby improving economic efficiency. Case 4 demonstrates that the occurrence of a fault reduces the PV hosting capacity of the distribution network by more than 12%.
- (2)
- The introduction of MSES can enhance energy absorption and reduce system operating costs. In Case 2, the integration of shared storage reduces the total distribution network cost by up to 17%. Case 6 indicates that the integration of MSES can further increase the PV hosting capacity by more than 19%.
- (3)
- In environments with high load uncertainty, deterministic hosting capacity assessments may suffer from significant deviations. The stochastic framework provides a robust estimate, avoiding costly overbuilding or underbuilding. Compared to the direct analysis based on historical load data, the simulation using Latin hypercube sampling to account for load uncertainty yields results that are closer to reality, and the obtained optimal PV hosting capacity offers greater reference value. The distribution network operating cost under uncertainty is higher than that under deterministic simulation.
In future work, we will incorporate the practical operational requirements of distributed PV integration, and further elaborate on the impact of equipment thermal limits—such as the overload capability of upstream main transformers under reverse PV power flow and the siting of mobile storage—on PV hosting capacity. These factors will be modeled in greater detail, and an enhanced optimization model will be developed to assess the optimal PV hosting capacity in distribution networks. In addition, we will fully account for fluctuations in PV output caused by factors such as weather and terrain, as well as random power line failures, to further enhance the model’s practical relevance. Network reconfiguration can alter the post-fault topology to facilitate power flow rerouting, while MSES provides localized voltage and power support. A joint optimization framework that integrates both strategies holds promise for further enhancing PV hosting capacity and system resilience.
Author Contributions
Methodology, G.L.; software, H.Y.; validation, J.J.; formal analysis, G.L.; investigation, R.Y.; data curation, F.X. and R.Y.; writing—original draft, H.Y. and L.H.; writing—review and editing, H.Y., R.Y. and L.H.; project administration, J.J. and F.X. All authors have read and agreed to the published version of the manuscript.
Funding
This research was funded by State Grid Jiangsu Electric Power Co., Ltd. Technology Project, grant number J2025144.
Data Availability Statement
The original contributions presented in this study are included in the article. Further inquiries can be directed to the corresponding author.
Conflicts of Interest
Author Jiangping Jing was employed by the State Grid Jiangsu Electric Power Co., Ltd. Authors Gaige Liang, Hui Yan and Ruiji Yu was employed by the State Grid Jiangsu Electric Power Co., Ltd., Xuzhou Power Supply Branch. The remaining authors declare that the research was conducted in the absence of any commercial or financial relationships that could be construed as a potential conflict of interest. The authors declare that this study received funding from State Grid Jiangsu Electric Power Co., Ltd. Technology Project. The funder had the following involvement with the study: substantial contributions to the scientific research and manuscript preparation.
References
- Ma, H.; Zhuang, K.; Yang, J.; Yin, W.; Liu, L.; Wu, Y.; Ye, J. Optimization Configuration of Microgrid Under Multiple Operation Strategies Based on HOMER. Processes 2026, 14, 1821. [Google Scholar] [CrossRef] [Scilit]
- Fu, Y.; Li, H.; Yu, P.; Huang, Y.; Zeng, W. DFDR-NLNet: A dual-frequency differentiated representation non-local network for photovoltaic panel segmentation. Appl. Energy 2025, 401, 126761. [Google Scholar] [CrossRef] [Scilit]
- Zhao, B.; Jiang, M.; Wang, X.; Wang, R.; Xiong, J.; Yang, N.; Li, Z. A Typical Scenario Generation Method Based on KDE-Copula for PV Hosting Capacity Analysis in Distribution Networks. Processes 2026, 14, 617. [Google Scholar] [CrossRef] [Scilit]
- Yan, H.; Pang, X.; Wang, Z.; Wang, H. Research on Evaluation Model Method for Distributed Photovoltaic Hosting Capacity in Distribution Networks. Power Syst. Technol. 2026, 50, 303–311. [Google Scholar] [CrossRef]
- Koirala, A.; Van Acker, T.; D’hulst, R.; Van Hertem, D. Hosting capacity of photovoltaic systems in low voltage distribution systems: A benchmark of deterministic and stochastic approaches. Renew. Sustain. Energy Rev. 2022, 155, 111899. [Google Scholar] [CrossRef] [Scilit]
- Benzerga, A.; Bahmanyar, A.; Derval, G.; Ernst, D. A Unified Definition of Hosting Capacity, Applications, and Review. IEEE Access 2024, 13, 7819–7836. [Google Scholar] [CrossRef] [Scilit]
- Liu, X.; Huang, J.; Zheng, D.; Xin, H.; Bi, T. Analysis and Suppression for Temporary Overvoltage Considering Dynamic Interactions Between LCC-HVDC and Renewable Energy Plants. IEEE Trans. Sustain. Energy 2025, 16, 1849–1859. [Google Scholar] [CrossRef] [Scilit]
- Wang, Z.; Ding, T.; Li, L.; Wang, K.; Chi, F. Public Safety Power Shutoff Policies and Measures for Enhancing Grid Resilience under Wildfire Disasters in California. Electr. Power Autom. Equip. 2022, 42, 36–44. [Google Scholar] [CrossRef]
- Ni, Y.; Zheng, Z.; Feng, L.; Shen, Y. Enlightenment of Recent Serious Power Outage Accidents Abroad on Building a New-Type Power System in China. Electr. Appar. Energy Effic. Manag. Technol. 2023, 1–8. [Google Scholar] [CrossRef]
- Munikoti, S.; Abujubbeh, M.; Jhala, K.; Natarajan, B. Spatio-Temporal Probabilistic Voltage Sensitivity Analysis—A Novel Framework for Hosting Capacity Analysis. Int. J. Electr. Power Energy Syst. 2022, 134, 107426. [Google Scholar] [CrossRef] [Scilit]
- ALi, A.; Mahmoud, K.; Lehtonen, M. Maximizing Hosting Capacity of Uncertain Photovoltaics by Coordinated Management of OLTC, VAr Sources and Stochastic EVs. Int. J. Electr. Power Energy Syst. 2021, 127, 106627. [Google Scholar] [CrossRef] [Scilit]
- Zain ul Abideen, M.; Ellabban, O.; Al-Fagih, L. A Review of the Tools and Methods for Distribution Networks’ Hosting Capacity Calculation. Energies 2020, 13, 2758. [Google Scholar] [CrossRef] [Scilit]
- Bollen, M.H.J.; Rönnberg, S.K. Hosting Capacity of the Power Grid for Renewable Electricity Production and New Large Consumption Equipment. Energies 2017, 10, 1325. [Google Scholar] [CrossRef] [Scilit]
- DL/T 2041—2025; Guideline for the Evaluation of Hosting Capacity of Distributed Energy Resources Connected to Power System. National Energy Administration: Beijing, China, 2025.
- IEC TS 63276:2024; Guidelines for the Hosting Capacity Evaluation of Distribution Networks for Distributed Energy Resources. IEC: Geneva, Switzerland, 2024.
- JBendík, J.; Cenký, M.; Cintula, B.; Beláń, A.; Eleschová, Ž.; Janiga, P. Stochastic Approach for Increasing the PV Hosting Capacity of a Low-Voltage Distribution Network. Processes 2023, 11, 9. [Google Scholar] [CrossRef] [Scilit]
- Zhong, Q.; Gao, X.; Yu, N.; Li, L.; Wang, L. Hosting Capacity and Connection Mode of Distributed Generation in Active Distribution Networks under Harmonic Constraints. Autom. Electr. Power Syst. 2014, 38, 108–113. [Google Scholar]
- Fatima, S.; Puvi, V.; Lehtonen, M. Review on the PV Hosting Capacity in Distribution Networks. Energies 2020, 13, 4756. [Google Scholar] [CrossRef] [Scilit]
- Torquato, R.; Salles, D.; Oriente Pereira, C.; Meira, P.C.M.; Freitas, W. A Comprehensive Assessment of PV Hosting Capacity on Low-Voltage Distribution Systems. IEEE Trans. Power Deliv. 2018, 33, 1002–1012. [Google Scholar] [CrossRef] [Scilit]
- Hoke, A.; Butler, R.; Hambrick, J.; Kroposki, B. Steady-State Analysis of Maximum Photovoltaic Penetration Levels on Typical Distribution Feeders. IEEE Trans. Sustain. Energy 2013, 4, 350–357. [Google Scholar] [CrossRef] [Scilit]
- Shayani, R.A.; de Oliveira, M.A.G. Photovoltaic Generation Penetration Limits in Radial Distribution Systems. IEEE Trans. Power Syst. 2011, 26, 1625–1631. [Google Scholar] [CrossRef] [Scilit]
- Xu, F.; Feng, H.; Qin, H.; Wen, H.; Xie, Z.; Ye, S.; Qiu, Y. Interval Analysis Method for Distributed Photovoltaic Hosting Capacity in Distribution Networks Considering Uncertainty. Zhejiang Electr. Power 2023, 42, 86–95. [Google Scholar] [CrossRef]
- Al-Rousan, W.; Aljarrah, R.; Karimi, M.; Obeidat, F.; Salem, Q. Impact of Loads and Photovoltaic Uncertainties on Cascaded Failure in Transmission Networks of Future Power Grids. IEEE Access 2025, 13, 23924–23934. [Google Scholar] [CrossRef] [Scilit]
- Wang, S.; Chen, S.; Ge, L.; Wu, L. Distributed Generation Hosting Capacity Evaluation for Distribution Systems Considering the Robust Optimal Operation of OLTC and SVC. IEEE Trans. Sustain. Energy 2017, 7, 1111–1123. [Google Scholar] [CrossRef] [Scilit]
- Liu, X.; Zhao, P.; Qu, H.; Liu, N.; Zhao, K.; Xiao, C. Optimal Placement and Sizing of Distributed PV-Storage in Distribution Networks Using Cluster-Based Partitioning. Processes 2025, 13, 1765. [Google Scholar] [CrossRef] [Scilit]
- Ji, Y.; Xun, Z.; He, P.; Congshan, L.; Yukun, T.; Hongfei, Z. Vulnerability-Oriented Bilevel Planning for Carbon Emission Reduction in Distribution Networks with Photovoltaic and Energy Storage. IEEE Syst. J. 2026, 1–12. [Google Scholar] [CrossRef] [Scilit]
- Chen, X.; Wu, W.; Zhang, B.; Lin, C. Data-Driven DG Capacity Assessment Method for Active Distribution Networks. IEEE Trans. Power Syst. 2016, 32, 3946–3957. [Google Scholar] [CrossRef] [Scilit]
- Zou, H.; Han, X.; Liao, Q.; Liu, D.; Zhu, Z.; Chen, W. Analysis of Distributed Generation Hosting Capacity Considering Voltage Quality and Short-Circuit Capacity Constraints. Power Syst. Technol. 2016, 40, 2273–2280. [Google Scholar] [CrossRef]
- Dubey, A.; Santoso, S. On Estimation and Sensitivity Analysis of Distribution Circuit’s Photovoltaic Hosting Capacity. IEEE Trans. Power Syst. 2017, 32, 2779–2789. [Google Scholar] [CrossRef] [Scilit]
- Ding, F.; Mather, B. On Distributed PV Hosting Capacity Estimation, Sensitivity Study and Improvement. In Proceedings of the IEEE Power & Energy Society General Meeting (PESGM), Portland, OR, USA, 5–10 August 2018. [Google Scholar] [CrossRef] [Scilit]
- Jain, A.K.; Horowitz, K.; Ding, F.; Sedzro, K.S.; Palmintier, B.; Mather, B.; Jain, H. Dynamic hosting capacity analysis for distributed photovoltaic resources—Framework and case study. Appl. Energy 2020, 280, 115633. [Google Scholar] [CrossRef] [Scilit]
- Huang, S.; Zhou, Y.; Xiong, L.; Dong, Z.Y.; Huang, W.; Gao, F.; Zhou, Q.; Li, X.; Zhu, L.; Li, Y. Resilient Distributed Observer-Based Fault-Tolerant Control for Islanded AC Microgrids Subject to Actuator Fault and Saturation Constraints. IEEE Trans. Consum. Electron. 2026, 72, 2787–2801. [Google Scholar] [CrossRef] [Scilit]
- Sun, H.; Guo, Q.; Qi, J.; Ajjarapu, V.; Bravo, R.; Chow, J.; Li, Z.; Moghe, R.; Nasr-Azadani, E.; Tamrakar, U.; et al. Review of Challenges and Research Opportunities for Voltage Control in Smart Grids. IEEE Trans. Power Syst. 2019, 34, 2790–2801. [Google Scholar] [CrossRef] [Scilit]
- Li, Y.; Hu, P.; Liu, W.; Yang, Z. Two-stage stability enhancement framework based on S-domain modal analysis for renewable energy power systems. Int. J. Electr. Power Energy Syst. 2026, 175, 111663. [Google Scholar] [CrossRef] [Scilit]
- Han, H.; Mou, L.; Zhang, F.; Guo, W. Microgrid Protection Considering Low-Voltage Ride-Through of IIDG. Proc. CSEE 2017, 37, 110–120. [Google Scholar]
- Zhao, H.; Shuai, Z.; Ge, J.; Luo, A.; Wu, W.; Shen, Z.J. Asymmetrical Fault Current Calculation Method and Influencing Factors Analysis of Droop-Controlled Inverters. CSEE J. Power Energy Syst. 2024, 10, 562–573. [Google Scholar] [CrossRef] [Scilit]
- Sun, C.; Chen, L.; Qiu, X.; Zheng, T.; Mei, S. Planning Model for Shared Energy Storage on Generation Side Based on Cooperative Game. Glob. Energy Interconnect. 2019, 2, 360–366. [Google Scholar] [CrossRef]
- Lyu, C.; Lyu, X.; Zhang, W. Application of Mobile Energy Storage Technology in Distribution Net-works. In Proceedings of the 6th Distribution Technology Summit Forum, Beijing, China, 2 March 2023. [Google Scholar]
- Liu, L.; Wang, K.; Chen, S.; Zhang, S.; Leng, J.; Gao, J. Mobile Energy Storage Planning under High Propor-tion Renewable Energy. Sichuan Hydropower 2023, 42, 13–21+59. [Google Scholar]
- Yang, B.; Fu, B.; Zhu, K.; Liu, Y.; Liu, F.; Tian, S. Post-disaster Recovery Strategy for Distribution Networks Considering Spatiotemporal Characteristics of Mobile Energy Storage. Electron. Devices 2025, 48, 1172–1181. [Google Scholar]
- Zheng, X.; Chen, H. Data-Driven Distributionally Robust Unit Commitment with Wasserstein Metric: Tractable Formulation and Efficient Solution Method. IEEE Trans. Power Syst. 2020, 35, 4940–4943. [Google Scholar] [CrossRef] [Scilit]
- He, C.; Zhou, Y.; Liu, X.; Nan, L.; Liu, T.; Wu, L. Reliability-constrained distributionally robust expansion planning of integrated electricity-gas distribution system with demand response. Energy 2025, 321, 135409. [Google Scholar] [CrossRef] [Scilit]

Disclaimer/Publisher’s Note: The statements, opinions and data contained in all publications are solely those of the individual author(s) and contributor(s) and not of MDPI and/or the editor(s). MDPI and/or the editor(s) disclaim responsibility for any injury to people or property resulting from any ideas, methods, instructions or products referred to in the content. |
© 2026 by the authors. Licensee MDPI, Basel, Switzerland. This article is an open access article distributed under the terms and conditions of the Creative Commons Attribution (CC BY) license.