


Abstract
High shrinkage-related defect rates in aluminum die casting reduce effective production capacity. They also create energy-intensive re-melting loops, which weaken production planning reliability and environmental performance. This study examines how Green Lean Six Sigma can stabilize a resource-constrained Small and Medium-Sized Enterprise (SME) die-casting process and translate quality improvement into measurable capacity recovery and Scope 2 electricity-related carbon savings. Based on a 10-month case study, the Define–Measure–Analyze–Improve–Control (DMAIC) framework was integrated with factorial ANOVA, the Response Surface Methodology (RSM), one-way analysis of variance (ANOVA) and statistical process control (SPC). These methods supported process parameter identification, operating-window development and shop-floor process stabilization. The analysis identified the filling speed and mold temperature as significant shrinkage drivers, developed a mold temperature control map, and determined the standardized filling speed at 800 mm/s. The intervention reduced the shrinkage defect rate from 7.19% to 1.46%, reduced the overall scrap rate from 7.60% to 2.71%, and improved the overall sigma level from 2.93 to 3.42. This yield improvement generated a 4.89 percentage-point yield-equivalent capacity gain, avoided 4401 kWh of re-melting electricity, reduced Scope 2 emissions by 2.36 t CO2e, and generated gross annualized savings of RMB 249,214 (USD 35,783). Considering a one-time implementation cost of RMB 31,445 (USD 4515), the first-year net saving was RMB 217,769 (USD 31,268). The findings show that accessible statistical process control methods can provide SMEs with a resource-efficient pathway to improve process stability, capacity utilization and electricity-related environmental performance before investing in advanced digital technologies.
1. Introduction
Aluminum die casting involves energy-intensive stages [1], and process energy studies show that die casting has substantial manufacturing energy requirements [2]. As a result, scrap creates a double penalty of lost productive capacity and additional re-melting energy demand. For operations with a 7–8% scrap rate, approximately 15–16% of total furnace energy is wasted on producing and reprocessing defective parts. This creates a hidden operational inefficiency. It weakens production planning reliability [3] and reduces profitability through the unquantified cost of poor quality (COPQ) [4].
SMEs are important participants in the global die-casting supply chain, especially in dense urban transport systems and rapidly growing Asian markets [5,6]. For these firms, manufacturing high-strength aluminum components through high-pressure die casting (HPDC) presents significant operational challenges. Recent research on Al5052 alloy shows that hybrid in situ Al3Ni and nano-SiC reinforcement can simultaneously improve strength, ductility and wear resistance, indicating the increasing demand for high-performance aluminum alloy components [7]. In addition, studies on AlCrN-coated cemented carbide tools show that wear mechanisms are highly sensitive to process parameters and thermo-mechanical conditions [8]. This further emphasizes the need for robust process modeling and control in alloy component manufacturing. Aluminum die casting is energy-intensive. Dalquist and Gutowski [2] identify die casting as an energy-demanding conventional manufacturing process, while He et al. [1] show that melting is a major energy-consuming stage in aluminum die-casting operations. High defect rates not only erode production capacity and profitability but also amplify the manufacturing carbon footprint through repeated rework and re-melting cycles. In die-casting operations, rejected castings commonly return to melting or re-melting operations. This internal recycling loop is important because melting is one of the most energy-intensive stages in aluminum die casting. Therefore, this operational instability creates a significant practical challenge for SMEs. Unlike large corporations, SMEs often face limited financial and technical resources when adopting advanced manufacturing technologies. Mittal et al. [9] show that many Industry 4.0 maturity models are hard for SMEs to apply. Separately, Moeuf et al. [10] find that SMEs face resource, data, and management barriers when adopting Industry 4.0. These constraints are increasingly problematic as SMEs face tightening customer quality requirements, rising energy costs and increasingly stringent environmental regulations.
From a production performance perspective, unstable defect rates reduce effective capacity, weaken schedule reliability and increase the gap between planned and actual output. These disruptions are especially problematic for SMEs because limited buffer capacity makes production plans more sensitive to scrap, rework and parameter drift. Cao et al. [11] show that the EU Carbon Border Adjustment Mechanism (CBAM) raises carbon pressure on aluminum-intensive supply chains. Meanwhile, Mohsin et al. [12] find that Scope 3 disclosure demands from customers are spreading through supplier networks. As a result, process control excellence has shifted from a competitive advantage to a strategic operational requirement [13]. Typical Lean Six Sigma (LSS) approaches have proven effective at improving operational efficiency and production performance [14,15,16], but conventional implementations often treat environmental sustainability as an implicit byproduct rather than an explicit objective [17]. The Green Lean Six Sigma (GLSS) framework addresses this limitation. It embeds environmental metrics into the DMAIC roadmap and uses statistical process control (SPC) to ensure long-term stability [18,19]. Under GLSS, energy waste and pollutants are treated as operational defects [20].
Despite growing academic interest in GLSS, the current literature exhibits three critical gaps. First, existing studies predominantly focus on large enterprises, leaving SME-specific implementation challenges underexplored [21]. Second, recent frameworks increasingly emphasize expensive Industry 4.0/5.0 technologies, such as AI-based manufacturing analytics [22] and digital twins [23,24], which remain financially prohibitive for resource-constrained manufacturers. Third, while several studies have applied LSS to casting processes, they either focus exclusively on quality metrics while ignoring environmental externalities [25] or provide engineering-based energy models lacking integration with systematic management frameworks [1]. More broadly, empirical evidence demonstrating how process capability improvements translate into measurable gains in production efficiency and environmental performance simultaneously remains limited [14].
This study addresses these gaps through a 10-month longitudinal investigation of a representative Chinese SME specializing in aluminum die casting for e-bike components. The study implements a GLSS-DMAIC framework supported by factorial ANOVA, RSM-based mold temperature modeling, one-way ANOVA for filling-speed standardization, and SPC. Rather than emphasizing capital-intensive digital technologies, the study focuses on process parameter identification, operating-window development and executable shop-floor control rules. This process control perspective is particularly relevant to SMEs because it provides a resource-efficient pathway for improving process stability, effective capacity and electricity-related environmental performance.
This study contributes to quality improvement and production process control research in three ways. First, it links shrinkage reduction to yield-equivalent capacity recovery, showing how process capability improvement can enhance effective capacity and production planning reliability. Second, it introduces the carbon footprint of quality in an energy-intensive re-melting-loop context and provides an empirical calculation of avoided Scope 2 electricity-related emissions from reduced internal re-melting. Third, it provides case-based evidence that accessible statistical process control methods can support SME process stabilization. These methods convert experimental findings into practical operating windows, SOP updates and SPC routines. Although prior GLSS studies have reported defect reductions, cost savings and environmental-performance improvements [14,19,26], limited empirical evidence explains how process stabilization improves production performance through yield-equivalent capacity recovery and reduced internal recycling loops in energy-intensive SME manufacturing.
2. Literature Review
2.1. Theoretical Evolution from Lean Six Sigma to Green Lean Six Sigma
Womack and Jones [27] conceptualize Lean as a waste elimination philosophy, while Montgomery [20] presents Six Sigma and statistical quality control as structured approaches to variation reduction. Lean Six Sigma (LSS) combines these two traditions into a widely adopted framework for operational excellence. Early LSS applications focused primarily on cost reduction, defect elimination and process capability improvement [16,28]. With the increasing importance of sustainable manufacturing, however, the scope of LSS has expanded toward environmental and resource-efficiency objectives [17,29]. Rathi et al. [19] and Hussain et al. [18] describe GLSS as an extension of LSS that incorporates environmental pollutants, energy inefficiency and material loss into the DMAIC improvement logic. Ghasemibojd et al. [21], through a systematic review, further show that GLSS research has increasingly moved toward sustainability-oriented performance measurement.
This theoretical shift is important because environmental performance is no longer viewed merely as an incidental outcome of efficiency improvement. Instead, GLSS treats environmental waste as a measurable operational problem that can be reduced through structured problem solving, statistical analysis and standardized process control [14,19]. In energy-intensive manufacturing, this logic is particularly relevant because defects create both economic losses and redundant energy consumption. For example, Milewska and Milewski [30] demonstrated that applying GLSS methodologies can significantly reduce total energy demands in energy-intensive die-casting processes. Prior research has shown that Lean and quality improvement practices can support environmental performance, and comprehensive frameworks like total quality management have been proven to effectively bridge broader corporate social responsibility initiatives with concrete quality outcomes [31]. However, the mechanisms linking process capability, capacity recovery and carbon reduction require further empirical clarification [17,32]. Addressing this need for systematic evaluation, Gandhi and Thanki [26] recently validated the substantial environmental and economic gains of integrating Lean, Green, and Six Sigma into foundry operations.
As summarized in Table 1, GLSS applications have expanded across different manufacturing sectors. Existing empirical evidence, however, remains concentrated on large or relatively mature organizations, while SME-specific implementation pathways are less developed [21,33]. Recent studies also increasingly connect GLSS with Industry 4.0/5.0 technologies, including artificial intelligence, digital twins and blockchain [23]. Concurrently, Pongboonchai-Empl [34] introduced DMAIC 4.0 to innovate Lean Six Sigma process control specifically within high-pressure die-casting environments. Although these technologies can strengthen monitoring and decision support, they may exceed the financial, technical and data infrastructure capabilities of many SMEs [35,36]. Therefore, the SME context requires greater attention to GLSS approaches based on established statistical tools, SOP discipline and SPC rather than capital-intensive digital systems.
Table 1.
A comparative analysis of the literature on GLSS and energy-intensive production sustainability.
2.2. Process Control Challenges in Aluminum Die Casting
Aluminum die casting is widely used for complex lightweight components because of its high productivity and geometric capability. However, HPDC remains highly sensitive to filling, pressure, thermal and solidification conditions. Bonollo et al. [39] describe HPDC as a process characterized by strong interactions among process variables, while Dargusch et al. [40] show that solidification pressure affects the quality of high-pressure die-cast aluminum components. Tsoukalas [41] further demonstrates that process optimization can reduce porosity formation in AlSi9Cu3 pressure die castings. Thermal control is therefore particularly important because die temperature behavior influences filling stability, solidification and shrinkage-related defect formation [42]. From a production control perspective, this thermodynamic sensitivity creates significant process capability challenges, as even minor parameter drift can trigger defect cascades that disrupt production schedules and capacity utilization [20]. The recent literature emphasizes the “energy footprint of quality”, noting that aluminum melting accounts for over 50% of die-casting energy consumption [1]. Defective castings often re-enter the melting loop, thereby adding avoidable electricity consumption and material oxidation losses to the direct quality cost [43,44]. This mechanism explains why process instability in die casting should be examined not only as a quality-control problem but also as a source of capacity loss and electricity-related carbon emissions.
2.3. Critical Success Factors for LSS Implementation in SMEs
Beyond methodological rigor, successful LSS implementation depends critically on organizational factors. Recent empirical studies consistently identify leadership commitment and cross-functional team engagement as pivotal determinants of project success [45,46]. For SMEs specifically, the ability to transform tacit operational knowledge into explicit, documented control procedures represents a key capability development challenge [47,48]. Furthermore, the DMAIC framework serves not only as a problem-solving tool. It can also function as a knowledge management system. In this role, it may enhance organizational absorptive capacity, which refers to the ability to recognize, assimilate and apply new information [49]. This learning dimension proves particularly valuable in manufacturing contexts where process understanding often resides in individual operators’ experience rather than formalized documentation. Recent case studies in similar manufacturing environments [50,51] confirm that systematic problem-solving methodologies foster continuous improvement cultures, though the specific mechanisms linking statistical training to organizational capability development remain underexplored in SME contexts [52].
3. Research Methodology
3.1. Research Design and Case Selection
This research uses a single-case study approach [53]. It examines how optimizing process control can improve quality, cost, and environmental performance in a resource-constrained manufacturer. The subject is a Chinese SME specializing in aluminum die casting for electric bicycle components. The firm employs approximately 120 workers, operates six 400-ton die-casting machines, and produces more than 200,000 aluminum rear fork assemblies annually. This firm was selected because it faces stringent quality standards and tightening environmental requirements, two pressures common among similar suppliers.
The empirical boundary of this case should be clearly specified. This study focuses on ADC12 aluminum alloy components produced by high-pressure die-casting machines with a clamping force of 400 tons. The focal defect mode is shrinkage-related scrap in aluminum rear fork components. Therefore, the findings are most applicable to aluminum alloy HPDC processes with comparable component sizes, thermal conditions, die-casting machine capacities and internal re-melting practices. The results should be generalized cautiously to other alloy systems, substantially different machine-tonnage ranges, large structural castings, or defect modes dominated by different mechanisms, such as cold shuts, gas porosity, inclusions or surface cracks.
3.2. The Integrated GLSS-DMAIC Framework
This study operationalizes an integrated GLSS framework (Figure 1) that reframes shrinkage-related scrap as a multidimensional operational problem rather than a purely financial loss. The framework conceptualizes scrap as a double penalty because it consumes productive capacity and creates redundant energy demand through the aluminum re-melting loop. The DMAIC phases are used to connect shrinkage-related process instability with three outcomes: improved process capability, yield-equivalent capacity recovery and quantifiable environmental abatement.
Figure 1.
Conceptual framework of integrated GLSS for die-casting process control optimization.
Figure 2 presents the integrated GLSS-DMAIC roadmap used to guide the case implementation. The roadmap links each DMAIC phase with the corresponding tools, including Green Suppliers–Inputs–Process–Outputs–Customers (SIPOC), measurement system analysis, Pareto analysis, factorial ANOVA, RSM, one-way ANOVA, Standard Operating Procedure (SOP) revision and SPC monitoring [54]. The Define phase establishes a dual-objective baseline by aligning Critical-To-Quality (CTQ) requirements with Critical-To-Environment (CTE) metrics through a Green SIPOC framework (Figure 3). In this study, “Green SIPOC” extends the conventional SIPOC tool by explicitly adding energy use, scrap generation, re-melting loops and carbon-relevant outputs to the process map [55]. It was used to identify where quality defects generated environmental burdens in addition to production losses. The Measure phase verifies data reliability through measurement system analysis and uses Pareto analysis to identify the defect modes that drive both quality losses and redundant energy consumption. The Analyze phase applies ANOVA to isolate the process variables associated with shrinkage-related defects. The Improve phase develops the mold temperature control map and filling-speed standard, while the Control phase institutionalizes the improved settings through SOP updates and SPC monitoring. In this way, the GLSS-DMAIC framework converts statistical learning into sustained organizational capability.
Figure 2.
Integrated GLSS-DMAIC roadmap for manufacturing process control.
Figure 3.
Green SIPOC framework for systemic analysis of die-casting process.
3.3. Statistical Optimization and Process Control Methods
The method selection was guided by the research problem. This study needed to identify shrinkage drivers, define feasible operating windows, and convert the results into shop-floor control rules. A fully digital solution was not the best first option. AI-based control needs large datasets and analytics capability [22]. Digital twins require real-time data and model integration [24]. Many SMEs lack such data infrastructure and specialist skills [9]. They also face financial and managerial constraints in digital adoption [10]. Therefore, accessible statistical methods were more suitable for this case.
DMAIC was used because the project required diagnosis, improvement and control. Antony et al. [13] describe DMAIC as a structured route for Lean Six Sigma problem solving. Rathi et al. [19] show that GLSS extends DMAIC by adding environmental performance. This fit the case because shrinkage scrap caused both capacity loss and electricity-consuming re-melting. Cherrafi et al. [17] argue that sustainability-oriented LSS should treat resource waste as an explicit improvement target. Ruben et al. [14] also show that LSS can connect process improvement with environmental outcomes.
Factorial ANOVA was selected for factor screening. Montgomery [20] presents ANOVA as a standard method for testing factor effects and interactions. This was suitable because HPDC defects are affected by coupled thermal and filling conditions. Bonollo et al. [39] note that HPDC quality depends on interacting process variables. Tsoukalas [41] shows that parameter optimization can reduce porosity in aluminum pressure die casting. Thus, ANOVA helped identify which factors needed further control.
The RSM was used for mold temperature control because the mold temperature was affected by the cycle time and pouring temperature. Myers et al. [56] show that the RSM can model input–response relationships and define practical operating regions. One-way ANOVA was used to standardize the filling speed because it directly compares mean responses across factor levels [20]. SPC was used to sustain the improved settings. Does et al. [57] describe SPC as a practical method for routine process monitoring. Woodall [58] notes that control charts help distinguish normal variation from abnormal variation. This combination matched the SME context because it converted statistical results into SOP updates, parameter standards and routine control without expensive digital investment.
3.4. Data Collection and Analysis
The empirical data were collected during a 10-month longitudinal investigation from December 2022 to September 2023. The dataset included production logs, machine parameter settings, defect inspection records and energy consumption reports captured directly from the shop floor. During the 10-month study period, the project team reviewed production records to identify possible confounding changes. No major equipment replacement, die redesign, material specification change or customer specification change occurred during the baseline and validation periods. Routine maintenance activities followed the company’s regular maintenance schedule. Seasonal temperature variation was recognized as a potential background factor; however, the key validation comparison was based on process parameters and final inspection outcomes under the updated control rules. Therefore, while seasonal and operational noise cannot be completely eliminated in a real production case study, no major concurrent process improvement project was identified that could independently explain the observed reduction in shrinkage-related scrap. All statistical analyses, including sigma-level conversion, attribute-based capability summaries, ANOVA and RSM modeling, were conducted using Minitab 19®.
A key methodological decision was to use intermediate defect response measures during parameter analysis rather than relying only on final pass/fail inspection results. In the factorial screening experiment, shrinkage-related indications were measured as counts/cm2 to improve sensitivity in identifying significant process variables. The inspection area was fixed at 10 cm2; thus, each defect indication represented 0.1 counts/cm2. Repeatability tests on representative samples showed that the difference between repeated counts was within two defect indications, corresponding to an estimated measurement uncertainty of ±0.2 counts/cm2. The final validation stage translated these parameter control improvements into shop-floor outcomes, including the shrinkage defect rate as the primary CTQ indicator and the overall scrap rate as the aggregate production performance indicator.
The statistical analysis followed a sequential logic. First, factorial ANOVA was conducted within the company’s historical stable filling-speed window of 300–500 mm/s for low-risk factor screening rather than final optimization. The screening experiment used a 24 full factorial design with four two-level factors, corresponding to 16 factorial runs, plus two center points for checking curvature and estimating error near the center of the operating region. Thus, 18 experimental runs were conducted in total. Consistent with recent manufacturing optimization frameworks [59], full replication at every factorial point was excluded. In routine SME environments, executing additional experimental runs inherently exacerbates material waste, monopolizes critical machine time, and risks unacceptable production disruptions [60].
The ANOVA error term was obtained from the residual variation after fitting the specified main effects and two-way interaction terms. Because the factorial points were not fully replicated, this residual error mainly reflected unmodeled higher-order effects, lack-of-fit variation and information from the center points. Therefore, the factorial ANOVA results were interpreted as screening evidence for identifying influential factors and interactions. After the filling speed was confirmed as significant and process engineers verified machine capability, mold safety and production feasibility, a follow-up one-way ANOVA compared four expanded production-feasible settings: 700, 800, 900 and 1000 mm/s. In parallel, the RSM was applied to model the mold temperature as a function of the production cycle time and pouring temperature, thereby establishing a controllable thermal operating map. In this study, the filling speed refers to the machine-set plunger filling speed rather than the gate velocity, and all values are reported in mm/s.
3.5. Carbon Accounting Protocol
To quantify the environmental co-benefits of process control improvement, this study establishes a carbon accounting protocol aligned with the Greenhouse Gas (GHG) Protocol. The environmental impact is categorized under Scope 2 emissions (purchased electricity), with carbon footprint reduction calculated by translating the electrical energy saved through defect elimination (ΔE_saved) into equivalent emissions using the 2025 Chinese national grid emission factor of 0.5366 kg CO2/kWh. This Scope 2 abatement represents a conservative baseline, as reduced scrap also decreases “melt loss” (4–5% aluminum lost to oxidation per re-melting cycle).
Scope 1 emissions were excluded because fuel consumption data for the specific re-melting process were unavailable. Using plant-level fuel data would have required allocation and could have increased uncertainty [61]. Scope 3 emissions were also excluded because upstream aluminum production, alloy procurement, and transport activities were beyond the company’s control boundary. In addition, supplier-specific primary data were not available for verification [62]. Therefore, this study only reports avoided Scope 2 emissions as a conservative and auditable estimate. Potential Scope 3 benefits from reduced oxidation loss and aluminum procurement are discussed qualitatively but not included in the carbon-saving calculation.
4. Case Study Implementation
4.1. Define and Measure Phase
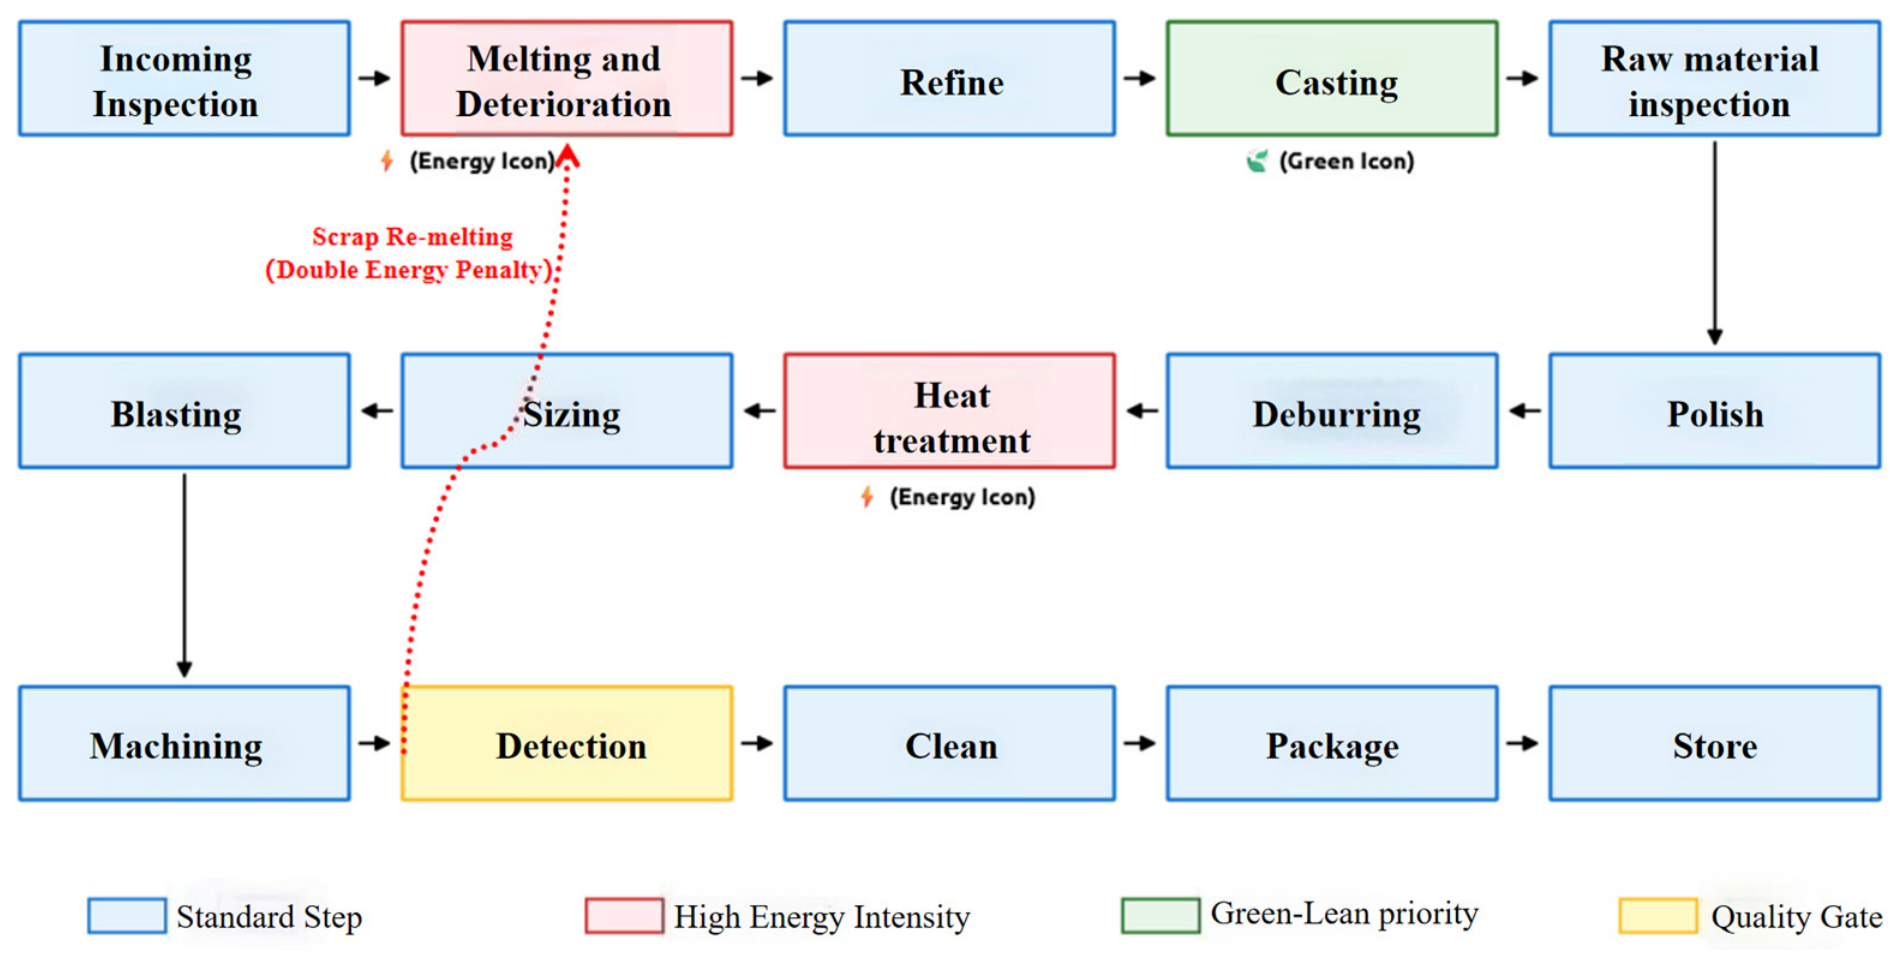
The project focused on the die-casting process of ADC12 aluminum rear forks. The baseline overall scrap rate was 7.60%, based on three months of historical production data. Pareto analysis (Figure 4) used initial non-conformity records collected at the shop-floor inspection station. Shrinkage-related indications accounted for 26.8% of all detected defect indications. This result reflects the initial defect distribution and is different from the final scrap statistics. After secondary inspection, some non-shrinkage defects could be reworked or accepted, while shrinkage defects were generally irreversible and entered the internal re-melting loop. Therefore, the baseline shrinkage defect rate of 7.19% represented approximately 94.6% of the final scrap rate (7.60%). Each shrinkage-related rejection required additional re-melting, which increased the furnace energy consumption and reduced the production capacity. The measurement system analysis confirmed acceptable inspection consistency, with both within-inspector agreement and inspector-to-standard agreement exceeding 85%. The project aimed to reduce the shrinkage defect rate below 2.00%, while the overall scrap rate was used as a final validation indicator. The manufacturing workflow was further mapped using the Energy–Scrap Loop framework (Figure 5), showing that shrinkage defects during die filling and solidification caused repeated re-melting, additional energy use, and avoidable production losses.
Figure 4.
Pareto analysis of rear fork scrap modes. (Integrating Quality Counts with Environmental Carbon Waste). Note: Figure 4 is based on initial shop-floor inspection records, whereas Table 8 reports final irreversible scrap entering the re-melting loop. Carbon savings are calculated from avoided Scope 2 electricity use.
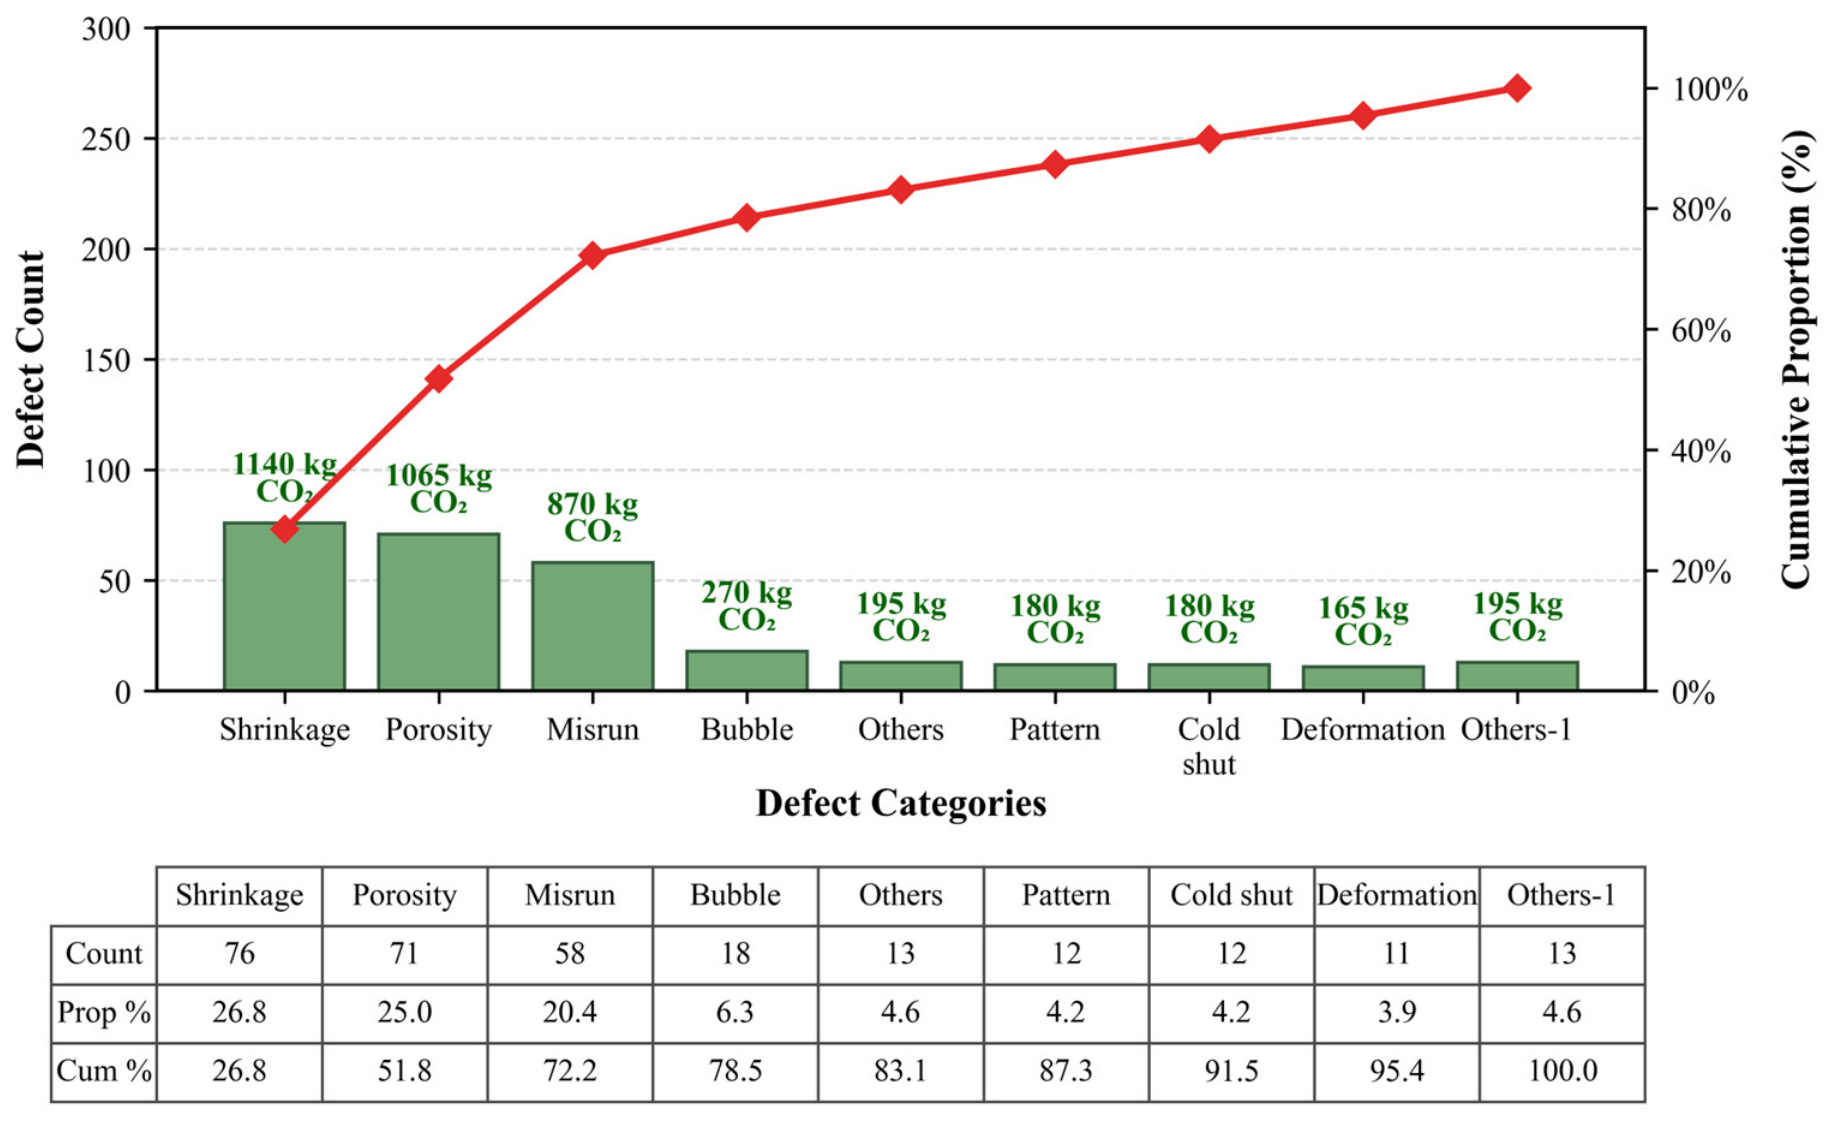
Figure 5.
Manufacturing flow with Energy–Scrap Loop.
4.2. Analyze Phase
An “Eco-Quality” Fishbone Diagram (Figure 6) was developed to systematically decode root causes, stratifying potential factors into 5M1E dimensions and explicitly linking process variations to their operational and environmental consequences. A Function Deployment Matrix (Table 2) was then used to quantitatively prioritize potential process factors associated with shrinkage defects through cross-functional team scoring. The mold temperature, casting shift, pouring temperature, and filling speed received the highest priority scores and were therefore selected for subsequent statistical screening. Although the filling speed ranked fourth in the expert-based deployment matrix, the subsequent factorial experiment revealed it to be the strongest statistically significant factor affecting shrinkage, illustrating the value of combining shop-floor expertise with designed experiments.
Figure 6.
Eco-Quality Fishbone Diagram.
Table 2.
Function Deployment Matrix for major casting defects.
Based on these priority scores, four key parameters were selected for statistical screening: casting shift (A), pouring temperature (B), filling speed (C), and mold temperature (D). A full factorial experiment was conducted using the shrinkage density (counts/cm2) as a continuous response variable (Table 3). This response measure improved the sensitivity of factor screening compared with conventional binary pass/fail classification. The two center points were included to provide an initial check for possible curvature in the response surface and to obtain an estimate of the experimental error near the middle of the tested operating range. They were not used to define the final operating condition but to assess whether the response trend could be adequately represented by a first-order factorial model within the initial screening region.
Table 3.
Pouring-process full factorial experiment data table.
The full-model ANOVA results are reported in Table 4. The filling speed and mold temperature were statistically significant factors affecting the shrinkage density (p < 0.05). The speed × temperature interaction was also significant (p = 0.009), indicating that the effect of the filling speed depended on the mold temperature condition.
Table 4.
Analysis-of-variance table for casting-process parameters (full model).
The curvature term was significant in the full model (p = 0.048), indicating that a linear model may not fully describe the relationship between the process parameters and shrinkage density within the screening range. Therefore, the factorial experiment was used for factor screening rather than final optimization. This finding guided the Improve phase, where the RSM was applied for mold temperature control and one-way ANOVA was used to determine the practical filling-speed setting.
Residual analysis was considered during the ANOVA evaluation to examine the fundamental assumptions of normality, independence, and constant variance. No obvious violation of these assumptions was observed, indicating that the ANOVA model was statistically appropriate for factor screening. Since several non-significant interaction terms were identified in the full model (Table 4), a simplified ANOVA model was subsequently developed by retaining the main effects and the statistically significant filling speed × mold temperature interaction. The results of the simplified model are presented in Table 5.
Table 5.
ANOVA for shrinkage defects (simplified model).
The simplified model confirmed the significant effects of the filling speed, mold temperature and their interaction. The curvature term remained significant in the simplified model (p = 0.037), further indicating that the reduced factorial model should not be used for direct extrapolation or final parameter optimization. Instead, it was used to identify influential factors and interactions that required further investigation in the Improve phase.
These statistical findings were visually supported by the Pareto chart of standardized effects (Figure 7) and the main-effects plot (Figure 8). Figure 8 illustrates the direction and relative magnitude of the main effects of the four screened process parameters on the shrinkage density. The relatively flat lines for the casting shift and pouring temperature indicate limited main effects within the tested range. In contrast, the filling speed and mold temperature show steeper response slopes, suggesting that changes in these two parameters have stronger effects on shrinkage density. This graphical pattern is consistent with the ANOVA results reported in Table 4 and Table 5.
Figure 7.
Pareto chart of factor effects in casting process.
Figure 8.
Main-effects plot for screened casting parameters affecting shrinkage density. Note: Error bars represent standard deviation (simulated). Steeper slopes in factors (C) and (D) indicate significant main effects.
Figure 9 shows that the effect of the filling speed on the shrinkage density depended on the mold temperature. When the filling speed increased from 300 to 500 mm/s, the mean shrinkage density increased only slightly under the 220 °C mold temperature condition. Under the 230 °C condition, however, the shrinkage density increased more sharply. This interaction indicates that the filling speed and mold temperature should not be managed as isolated process settings.
Figure 9.
Interaction effect of filling speed and mold temperature on shrinkage density.
These findings provided the statistical basis for the Improve phase. Because the mold temperature is affected by upstream thermal-control parameters during routine production, the RSM was used to model and control the mold temperature through the production cycle time and pouring temperature. The filling speed was then further investigated through one-way ANOVA to determine a feasible low-defect setting. Together, these analyses supported the development of executable shop-floor control rules for mold temperature control and filling-speed standardization.
4.3. Improve Phase
The initial factorial screening experiment was conducted within the historical operating range of 300–500 mm/s because this interval had been validated as a stable production window with acceptable mold impact and flash risk. The purpose of this stage was factor screening rather than final optimization. The results showed that the filling speed was the most significant factor affecting shrinkage-related defects (F = 31.90, p < 0.001), suggesting that the historical range might not represent the optimal condition. Previous studies have reported that filling speed strongly influences melt flow behavior, gas entrapment and defect formation in high-pressure die casting, and excessive filling speed may deteriorate casting quality due to unstable flow and increased porosity [63,64]. Therefore, after confirming machine capability and mold safety, the filling-speed range was expanded to 700–1000 mm/s for further investigation.
A follow-up one-way ANOVA was conducted at four filling speeds (700, 800, 900 and 1000 mm/s) with ten repeated observations at each level, and the average shrinkage defect counts were 3.900, 1.500, 1.600 and 4.900, respectively. The defect count decreased by 61.5% when the speed increased from 700 to 800 mm/s but increased significantly at 1000 mm/s, indicating that higher filling speed does not continuously improve casting quality. Therefore, 800 mm/s was selected as the standard filling-speed setting because it achieved the lowest defect level while maintaining a sufficient production safety margin.
The Improve phase translated the statistical evidence from the Analyze phase into executable process control rules. The RSM was used to develop a mold temperature control map based on the production cycle time and pouring temperature, while one-way ANOVA was used to select a feasible filling-speed standard. The purpose was not to identify a unique mathematical optimum but to define a practical operating window and standardized parameter settings that could be maintained under routine SME shop-floor conditions. Based on the screening results, the filling speed and mold temperature were treated as the two key process variables associated with shrinkage-related casting defects. Therefore, the project adopted a layered parameter control strategy in which the mold temperature was managed through an RSM-based thermal-control map, while the filling speed was standardized through a follow-up one-way ANOVA.
The mold temperature was regarded as a critical thermal condition for die-casting stability. Although it was identified as a significant defect-driving variable in the factorial screening experiment, it is not fully independent during routine production. In practice, the mold temperature is influenced by upstream operating conditions, particularly the production cycle time and pouring temperature. A two-factor RSM experiment was therefore conducted using the production cycle time and pouring temperature as input factors, with the mold temperature as the response variable.
Based on the simplified RSM model, the fitted regression equation for the mold temperature in actual units was:
where is the predicted mold temperature, CT is the production cycle time in seconds, and PT is the pouring temperature in °C. The interaction term CT × PT was excluded from the final model because it was not statistically significant, as shown in Table 6. This regression equation was used to generate the mold temperature control map shown in Figure 10.
Table 6.
ANOVA results for RSM-based mold temperature control model.
Figure 10.
A contour plot of the predicted mold temperature as a function of the production cycle time and pouring temperature. Note: The plot shows the RSM-based mold temperature control map. The mold temperature is the response variable; the production cycle time and pouring temperature are the input factors.
The ANOVA results in Table 6 indicate that the production cycle time and pouring temperature had statistically significant linear effects on the mold temperature. By contrast, the interaction and curvature terms were not significant at the 5% level. The simplified linear model was therefore retained as a parsimonious and operationally useful representation of mold temperature control. The model summary also showed strong explanatory power, with an adjusted R2 of 92.50%. The predicted R2 was 89.20%, calculated from a PRESS value of 51.66. However, because the RSM experiment involved a limited number of observations, the predicted R2 was interpreted cautiously and used as supplementary evidence together with the non-significant lack-of-fit result and engineering feasibility.
The purpose of the RSM analysis was not to claim a nonlinear optimum for defect minimization. Instead, it translated thermal process behavior into a practical control map that operators could use to maintain the mold temperature within the desired operating range. Figure 10 presents the resulting contour plot, which visualizes the predicted mold temperature under different combinations of production cycle times and pouring temperatures. This map provided a practical basis for routine thermal-process control.
After the screening experiment confirmed the significance of the filling speed, this parameter was further examined as a directly adjustable production setting. The initial 300–500 mm/s range represented the firm’s historical stable operating window and was used for low-risk factor screening. Because the screening model showed a significant filling-speed effect and curvature, the project team extended the test range after process engineers confirmed machine capability and mold safety. A follow-up production-scale one-way ANOVA was then conducted at 700, 800, 900 and 1000 mm/s. For each filling-speed level, ten repeated observations were collected under the same mold temperature control condition, resulting in 40 observations in total. Each observation corresponded to the shrinkage-related defect count measured within a predefined inspection area on the casting surface. The repeated observations were used to estimate the within-group variation and support the one-way ANOVA comparison among the four filling-speed levels. The response variable was the shrinkage-related defect count per inspection area. The one-way ANOVA showed that the filling speed had a statistically significant effect on the shrinkage-related defect occurrence (F = 13.16, p < 0.001), confirming that the filling speed required formal standardization in the Control phase.
The mean comparison showed a non-monotonic pattern across the tested filling-speed levels. The observed mean shrinkage-related defect counts were 3.900 at 700 mm/s, 1.500 at 800 mm/s, 1.600 at 900 mm/s and 4.900 at 1000 mm/s. This pattern suggests that both insufficient and excessive filling speeds may increase shrinkage-related defects. Although 900 mm/s produced a similar mean response, 800 mm/s was selected because it had the lowest observed defect count and provided a more conservative operating condition for routine production.
The final improvement scheme combined mold temperature control with filling-speed standardization. The mold temperature was controlled through the RSM-derived production cycle time and pouring-temperature control map, while the filling speed was standardized at 800 mm/s. These settings were implemented as feasible shop-floor control rules rather than as a unique mathematical optimum. This approach was suitable for the SME context because it relied on operator discipline, SOP updates and routine parameter monitoring rather than additional capital investment.
After implementation, SOPs were updated to include the mold temperature control map, the standardized filling-speed setting of 800 mm/s, and the associated process-monitoring requirements. Subsequent validation based on the company’s final inspection criteria showed that the shrinkage defect rate decreased to 1.46% and the overall scrap rate decreased to 2.71%, supporting the practical effectiveness of the improved process control rules.
4.4. Control Phase and Performance Validation
Following the implementation of the RSM-derived mold temperature control map and the standardized filling-speed setting of 800 mm/s, the improved process control rules were validated using the company’s routine final inspection criteria. Because this study used a pre–post case design without a parallel control group, potential operator-awareness effects were considered during validation. Similar industrial improvement studies have used routine production conditions, standardized procedures, and operational controls to strengthen the reliability of before–after evaluations [53,65]. The validation batches were therefore produced under normal production conditions rather than under a specially announced trial. The same operators, inspection criteria, machines and reporting systems were maintained before and after improvement. In addition, the improvement was institutionalized through parameter settings, SOP updates and SPC monitoring, consistent with recent Six Sigma manufacturing applications [66,67]. Although a Hawthorne effect cannot be completely excluded, these measures reduced its potential influence on the validation results. This validation step was necessary because the statistical analyses in the Improve phase established controllable process settings, whereas production performance and financial benefits ultimately depend on the final binary rejection outcome.
A confirmatory production run was conducted across six validation batches, with 80 units inspected in each batch. The P-control chart in Figure 11 provides preliminary evidence of post-improvement process stability, with the scrap rate remaining within the calculated control limits during the initial validation period. Given the attribute nature of the defect data, shrinkage improvement was evaluated using defect rates and sigma-level conversion rather than conventional continuous-variable capability indices. The sigma levels reported in this study are short-term sigma values converted from observed defect or scrap rates using the conventional 1.5σ shift assumption. The benchmark sigma level was calculated as follows:
where p is the observed defect or scrap rate and is the inverse cumulative distribution function of the standard normal distribution. The short-term sigma level was then calculated as follows:
Figure 11.
The P-control chart for the overall casting scrap rate after improvement. Note: All sample proportions are within the control limits (LCL, UCL), indicating that the process is in statistical control.
For example, the baseline overall scrap rate of 7.60% gives:
while the improved overall scrap rate of 2.71% gives:
Using the same conversion method, the shrinkage defect rate-based sigma level increased from 2.96 at the baseline shrinkage defect rate of 7.19% to 3.68 at the improved shrinkage defect rate of 1.46%. The shrinkage defect rate was used as the primary CTQ outcome, while the overall scrap rate was monitored as an aggregate validation indicator that also captured non-target defects. Detailed defect statistics from the validation batches are reported in Table 7. Figure 12 summarizes the reduction in the overall scrap rate and the corresponding improvement in the short-term sigma level before and after implementation.
Table 7.
Validation results after shrinkage-focused improvement.
Figure 12.
The defect rate and sigma-level summary for the rear fork scrap performance before and after improvement. Note: The sigma levels are short-term sigma values converted from overall scrap rates using the conventional 1.5σ shift.
The comprehensive project results are consolidated in Table 8, which integrates quality, environmental and economic performance indicators. The overall sigma level increased from 2.93 to 3.42, while the overall scrap rate decreased from 7.60% to 2.71%. This reduction prevented approximately 7335 kg of aluminum from entering the internal re-melting loop annually, corresponding to 4401 kWh of avoided re-melting electricity and 2362 kg CO2e of avoided Scope 2 emissions. Figure 13 visualizes the Scope 2 carbon footprint associated with the internal re-melting loop, which decreased from 3670 kg CO2e to 1309 kg CO2e. To institutionalize the improvement, SOPs were updated to include mold temperature control through the production cycle time and pouring temperature, filling-speed standardization at 800 mm/s, and SPC-based monitoring for ongoing process control.
Figure 13.
Process control impact: annual carbon footprint of quality (CFQ) reduction.
Table 8.
Comprehensive project improvement comparison (quality and environmental metrics).
5. Economic Benefit Analysis
The economic impact of the project shows how process stability can be translated into measurable production and financial benefits. With the overall scrap rate decreasing from 7.60% to 2.71%, the facility generated a 4.89 percentage-point yield-equivalent capacity gain. Based on an annual gross production volume of 200,000 units, this corresponds to 9780 avoided defective units, or approximately 7335 kg of aluminum, that no longer entered the internal re-melting loop. This should be interpreted as equivalent production capacity recovered from avoided defective output rather than as a directly observed increase in market shipments.
The annualized savings were calculated from three sources. The first source was avoided re-melting electricity. Eliminating the re-melting of 7335 kg of aluminum saved 4401 kWh of electricity annually, equivalent to RMB 3677 (The equivalent RMB values were calculated using the central parity rate of 1 USD = 6.9646 RMB announced by the People’s Bank of China on 30 December 2022. This date was selected as a contemporaneous exchange-rate reference at the beginning of the study period, which extended from December 2022 to September 2023. A 2025 or 2026 exchange rate was not used because it would retrospectively revalue the historical cost and savings estimates. Available at: http://m.ce.cn/bwzg/202212/30/t20221230_38318068.shtml (accessed on 17 August 2026).) (USD 528) at an electricity price of USD 0.12 per kWh [68]. The second source was avoided material loss. During the re-melting process, approximately 5% of the aluminum mass is irreversibly lost to oxidation (melt loss). By preventing 7335 kg of scrap from entering the internal re-melting loop, the project preserved approximately 366 kg of aluminum alloy (calculated as 7335 kg × 0.05). The baseline material cost was established at USD 2.80 per kg, reflecting the average actual procurement price of ADC12 aluminum ingots provided by the participating SME’s purchasing department during the 2023 baseline period. Therefore, this preservation translates to an explicit calculation of 366 kg × USD 2.80/kg, yielding RMB 7139 (USD 1025) in direct material savings. The third and largest source was avoided conversion loss associated with defective output. Following the (COPQ) framework [4], the estimated avoidable conversion cost was calculated at USD 3.50 per defective unit. This figure represents a fully loaded cost derived from selecting and aggregating specific production data: direct labor handling, machine depreciation, consumables, inspection effort, and related production overhead consumed by defective output. With this fully loaded estimate, the reduction of 9780 defective units generated RMB 238,398 (USD 34,230) in annual savings.
The total annualized COPQ saving was therefore RMB 249,214 (USD 35,783). This value represents the gross annualized savings before deducting the GLSS implementation cost. The one-time project implementation cost was estimated at RMB 31,445 (USD 4515), including engineering labor, GLSS training, experimental machine downtime, trial material consumption, thermal measurement hardware, SOP revision and SPC-related training. After deducting this one-time cost, the first-year net saving was RMB 217,769 (USD 31,268). The benefit–cost ratio was approximately 7.9:1, calculated as USD 35,783 divided by USD 4515. To ensure transparency and demonstrate the resource-efficient nature of this SME intervention, the exact estimated implementation cost of RMB 31,445 (USD 4515) is detailed in Table 9. This cost avoids expensive digital infrastructure and instead reflects the actual engineering effort, machine downtime required for the 71 designed experimental runs (factorial, RSM, and one-way ANOVA), and basic thermal sensing tools needed to establish the process control map.
Table 9.
Breakdown of one-time GLSS implementation costs.
The avoidable conversion-cost component accounted for most of the financial benefit, highlighting an important production planning implication: in this case, the dominant economic penalty of poor quality was not direct material or energy loss alone but the productive capacity consumed by defective output. This finding reinforces the argument that accessible statistical process control methods can provide a high-leverage improvement pathway for resource-constrained SMEs by converting process stability into recovered capacity, lower operating losses and improved planning reliability.
6. Discussion
The following discussion is grounded in the empirical results of this single-case study rather than intended as a general claim for all SME die-casting operations. The observed improvements were a reduction in the overall scrap rate from 7.60% to 2.71%, a decrease in the shrinkage defect rate from 7.19% to 1.46%, an avoided re-melting electricity use of 4401 kWh, and gross annualized savings of RMB 249,214 (USD 35,783). These results are interpreted within the specific boundary conditions of ADC12 aluminum rear fork production, 400-ton HPDC equipment and an internal re-melting loop. Therefore, the discussion focuses on how the observed process control changes contributed to quality, capacity and Scope 2 carbon outcomes in this case.
6.1. Process Control as a Multi-Dimensional Value Driver
The case results suggest that process capability improvement in aluminum die casting may have implications beyond conventional quality performance. By reducing the overall scrap rate from 7.60% to 2.71% and increasing the sigma level from 2.93 to 3.42, the intervention generated a 4.89 percentage-point yield-equivalent capacity gain. Ruben et al. [14] demonstrate that LSS can generate environmental benefits when combined with environmental assessment, while Rathi et al. [19] emphasize the sustainability orientation of GLSS, and Francescatto et al. [16] focus on operational improvement outcomes. Building on these studies, the present case links shrinkage reduction, effective capacity recovery and carbon reduction within a single production control mechanism. In this case, the same process control intervention was associated with improved quality performance, recovered yield-equivalent capacity and reduced avoidable Scope 2 emissions. Therefore, the results suggest a case-specific “triple dividend” mechanism rather than prove a universal effect across all die-casting SMEs.
From a production planning and control perspective, the capacity effect is particularly important. Defective parts consume machine time, labor handling, inspection effort and downstream reprocessing resources. Feiring et al. [4] show that cost-of-poor-quality models capture these hidden operational losses, while Hopp and Spearman [69] explain how variability and flow disruptions reduce production system performance. Such disruptions also weaken production planning reliability when information accuracy and uncertainty are not properly managed [3]. The observed capacity gain should therefore be interpreted not simply as a quality improvement result but as recovered production potential that had previously been hidden within the COPQ structure. This finding aligns with the interpretation that process capability and production planning performance are closely linked, especially in operations where scrap rates are high and rework loops are energy-intensive [20].
The environmental results further indicate that quality defects carried a measurable carbon burden in this case. Avoiding 7335 kg of aluminum scrap from the internal re-melting loop saved 4401 kWh of electricity and reduced Scope 2 emissions by 2362 kg CO2e. This result supports the concept of the carbon footprint of quality: when rejected castings return to energy-intensive melting or re-melting operations, defects may generate not only financial waste but also redundant energy use and avoidable emissions [1,2,70]. Consistent with the Lean-and-Green literature, the case suggests that environmental performance may be improved through operational stabilization rather than only through end-of-pipe environmental technologies or large-scale energy-efficiency investments [29,32].
6.2. Statistical Rigor as a Resource-Efficient Alternative to Trial and Error
The results also illustrate how accessible statistical methods complemented experience-based improvement in this SME manufacturing environment. The factorial ANOVA identified the filling speed and mold temperature as significant drivers of shrinkage-related defects in this case, while the interaction between these variables indicated that they should not be managed independently. This finding is in line with statistical quality-control theory, which emphasizes the importance of identifying significant factors and interactions before standardizing control settings [20,58]. It also aligns with prior casting studies that have reported the usefulness of ANOVA and experimental design for process parameter analysis [38,71].
This mechanism is especially relevant for resource-constrained SMEs. While Industry 4.0/5.0 technologies offer potential for real-time monitoring and predictive control, they often require data infrastructure, integration capability and specialist expertise that resource-constrained firms may lack [23,35]. The case is consistent with a “knowledge before capital” pathway, in which an SME can first improve its process stability and capacity utilization through disciplined statistical learning before considering more advanced digital systems. The benefit–cost ratio of approximately 7.9:1 indicates the practical value of this pathway in the studied case, especially because most savings came from avoided conversion losses rather than direct energy savings alone.
6.3. Organizational Capability Development Through DMAIC
Beyond technical optimization, DMAIC also functions as an organizational learning mechanism. In SMEs, Six Sigma implementation often depends on visible leadership support, cross-functional participation and the ability to formalize improvement routines. Leadership commitment has been identified as a key success factor for Six Sigma projects [45], while SME implementation is frequently constrained by limited resources and weak procedural formalization [46]. In this case, these challenges were partly addressed through a cross-functional team involving managers, engineers, inspectors and operators, which helped translate shop-floor problems into measurable variables and standardized actions. The project also helped convert tacit operational knowledge into explicit routines. This finding is consistent with Nonaka’s [48] view that organizational learning involves transforming experience-based knowledge into codified organizational knowledge. Here, operators’ practical experience was formalized into the mold temperature control map, the 800 mm/s filling-speed standard and SPC-based monitoring requirements. In this study, operational absorptive capacity was not measured as an independent quantitative construct. Instead, it was evaluated through process-level evidence. This included the team’s ability to identify critical variables from shop-floor data, convert ANOVA and RSM results into SOP revisions, train operators on new control rules, and maintain improved settings through SPC monitoring. Therefore, this term represents an observed organizational learning capability rather than a directly measured latent variable [49]. This is consistent with the argument that Six Sigma projects improve absorptive capacity when teams can convert data analysis into operational control actions [47].
This capability appeared particularly useful in the studied die-casting process, where product quality was sensitive to thermal and process variation. Prior HPDC research has emphasized the importance of thermal-process control for casting quality [72], and die temperature behavior has been shown to affect casting stability and defect formation [42]. Therefore, the project did not merely reduce shrinkage defects; it also improved the SME’s ability to learn from data, codify process knowledge and sustain improvements through standardized routines.
6.4. Process Stability as a Prerequisite for Digitalization
The findings also clarify the relationship between GLSS and digital transformation. GLSS should not be viewed as an alternative to Industry 4.0 but as a foundation for it. Lean and Industry 4.0 are often considered complementary because Lean provides process discipline and standardization while digital technologies improve visibility and responsiveness [73]. Empirical evidence also suggests that Industry 4.0 benefits are stronger when firms already have mature Lean practices [36]. In this case, GLSS created this foundation by identifying key variables, defining operating windows and institutionalizing SPC monitoring.
This sequence matters because digital tools may not fully compensate for unstable processes. Industry 4.0 adoption requires organizational readiness, including process standardization and employee capability [74]. Lean routines can therefore prepare firms for digital transformation by clarifying process flows and stabilizing operational practices [75]. For this SME, premature installation of sensors or dashboards might have increased data availability without necessarily improving root-cause control because the mold temperature and filling speed had not yet been standardized.
Based on the observed results, a staged pathway of “stabilize, standardize and then digitize” appears appropriate for this case. Quality 4.0 has been described as an evolution of Six Sigma, meaning that digital quality systems still rely on measurement, analysis and control logic [76]. Similarly, successful integration of Industry 4.0 and LSS requires alignment between digital technologies and existing improvement systems [77]. Thus, the RSM-based control map, filling-speed standard and SPC routine may create a more reliable baseline for future sensor-based monitoring or real-time optimization while reducing the risk of premature digital investment in similar SMEs.
6.5. Boundary Conditions and Interpretation Limits
The case offers a practical roadmap for comparable SMEs seeking to implement GLSS as a stepwise improvement approach: first stabilizing critical process variables, then standardizing operating windows, and finally preparing the foundation for digital transformation. Nevertheless, the transferability of this roadmap depends on several preconditions. These include reliable shop-floor data, management support, cross-functional participation, feasible parameter adjustability, and a clear link between defect reduction, capacity recovery and environmental improvement.
Similar improvement results may be expected when several key conditions are satisfied. The target process should have a relatively high baseline scrap rate and a dominant defect mechanism that can be linked to controllable process parameters. Sufficient historical production data should also be available to support defect analysis, factor screening and process optimization. In addition, the manufacturing system should allow for parameter adjustment and process stabilization through standardized procedures and statistical process control. Defective products should enter an internal re-melting loop so that defect reduction may be translated into energy savings and emission reductions. Under these conditions, the proposed data-driven improvement framework may be transferable to comparable aluminum die-casting applications. However, the actual improvement magnitude may vary depending on alloy properties, equipment capability, product geometry, baseline defect distribution and local energy factors.
The interpretation of these findings should remain cautious. This study used a pre–post case design without a parallel control group, and the validation was conducted under routine production conditions. Although no major concurrent changes in equipment, material specification, supplier, die design or customer requirements were identified during the study period, unobserved operational factors cannot be fully excluded. In addition, the carbon reduction was limited to avoided Scope 2 electricity-related emissions from re-melting. Therefore, the discussion should be understood as an explanation of the observed case results rather than as a universal causal claim.
7. Conclusions
This study applied Green Lean Six Sigma to improve aluminum die-casting process control in a resource-constrained SME. By integrating the DMAIC framework with factorial ANOVA, RSM-based mold temperature modeling, one-way ANOVA and SPC, the project identified the filling speed and mold temperature as the key process variables associated with shrinkage-related defects. The statistical findings were translated into executable shop-floor control rules, including a mold temperature control map based on the production cycle time and pouring temperature and a standardized filling-speed setting of 800 mm/s.
The implementation results demonstrate that accessible statistical process control methods can generate substantial operational benefits in SME die casting without requiring capital-intensive digital technologies. The overall scrap rate decreased from 7.60% to 2.71%, while the overall sigma level increased from 2.93 to 3.42. This improvement generated a 4.89 percentage-point yield-equivalent capacity gain. It also avoided 4401 kWh of re-melting electricity and reduced Scope 2 emissions by 2362 kg CO2e. The gross annualized savings were RMB 249,214 (USD 35,783). After deducting the one-time GLSS implementation cost of RMB 31,445 (USD 4515), the first-year net saving was RMB 217,769 (USD 31,268).
The main contribution of this study is to clarify how process capability improvement can simultaneously support quality improvement, effective capacity recovery and carbon reduction. Defective castings reduce product quality and consume machine time, labor, inspection resources, and additional electricity through the internal re-melting loop. Therefore, reducing shrinkage defects creates a “triple dividend” by improving production stability, releasing hidden capacity and lowering the carbon footprint of poor quality.
From a managerial perspective, the findings provide a practical improvement pathway for SMEs facing quality, cost and carbon pressures. Rather than relying first on advanced sensors, artificial intelligence or digital twins, SMEs can begin by identifying critical process variables, defining feasible operating windows, updating SOPs and sustaining improvements through SPC. This “stabilize, standardize and then digitalize” logic can help resource-constrained manufacturers build a reliable foundation for future digital transformation.
This study has several limitations. The evidence is based on a single case involving ADC12 aluminum alloy HPDC rear fork components, and the results should be generalized cautiously to other alloys, machine-tonnage ranges, product geometries or defect mechanisms. In addition, the carbon accounting was limited to avoided Scope 2 electricity-related emissions from reduced internal re-melting, while upstream Scope 3 effects were not quantified. Future research should conduct multi-case validation across different casting contexts, extend the carbon accounting boundary and explore how SPC infrastructure can be integrated with IoT or machine learning tools for real-time process control.
Author Contributions
Conceptualization, Y.R. and W.L.; methodology, Y.R. and Q.Z.; software, Q.Z. and R.G.; validation, Y.R., Q.Z. and R.G.; formal analysis, Y.R. and Q.Z.; investigation, Q.Z. and R.G.; resources, Y.R. and W.L.; data curation, Q.Z. and R.G.; writing—original draft preparation, Y.R.; writing—review and editing, Y.R., Q.Z., R.G., W.L. and Y.S.; visualization, Q.Z. and R.G.; supervision, W.L.; project administration, Y.R., W.L. and Y.S.; funding acquisition, Y.R. and W.L. All authors have read and agreed to the published version of the manuscript.
Funding
This research was funded by the National Natural Science Foundation of China, grant numbers 72261147706 and 72171166.
Institutional Review Board Statement
Not applicable.
Informed Consent Statement
Not applicable.
Data Availability Statement
The datasets presented in this article are not readily available because of a strict confidentiality agreement with the participating enterprise, which only authorizes the disclosure of analyzed results rather than the underlying raw production data.
Acknowledgments
The authors would like to thank the participating enterprise for providing production data and technical support during the case study. The authors also thank the engineers, inspectors and operators who supported the on-site data collection and process validation.
Conflicts of Interest
The authors declare no conflicts of interest. The funders had no role in the design of the study; in the collection, analyses, or interpretation of the data; in the writing of the manuscript; or in the decision to publish the results.
References
- He, K.; Tang, R.; Jin, M.; Cao, Y.; Nimbalkar, S.U. Energy modeling and efficiency analysis of aluminum die-casting processes. Energy Effic. 2019, 12, 1167–1182. [Google Scholar] [CrossRef] [Scilit]
- Dalquist, S.; Gutowski, T. Life Cycle Analysis of Conventional Manufacturing Techniques: Die Casting; Massachusetts Institute of Technology: Cambridge, MA, USA, 2004. [Google Scholar]
- Busert, T.; Fay, A. Information quality dimensions for identifying and handling inaccuracy and uncertainty in production planning and control. In Proceedings of the 2018 IEEE 23rd International Conference on Emerging Technologies and Factory Automation (ETFA), Turin, Italy, 4–7 September 2018; pp. 581–588. [Google Scholar]
- Feiring, B.R.; Sastri, T.C.P.; Rao Tummala, V.M.; Mak, R.W. Modelling the cost of poor quality in a five-state part manufacturing operation: A case study. J. Oper. Res. Soc. 1998, 49, 1249–1253. [Google Scholar] [CrossRef] [Scilit]
- Cherry, C.R.; Weinert, J.X.; Xinmiao, Y. Comparative environmental impacts of electric bikes in China. Transp. Res. Part D Transp. Environ. 2009, 14, 281–290. [Google Scholar] [CrossRef] [Scilit]
- Fishman, E.; Cherry, C. E-bikes in the mainstream: Reviewing a decade of research. Transp. Rev. 2016, 36, 72–91. [Google Scholar] [CrossRef] [Scilit]
- He, X.; Yu, X.; Zhao, D.; Suo, Z.; Li, T.; Ding, Y.; Yao, B.; Yu, J.; Hou, X. Simultaneous enhancement of strength, ductility and wear resistance in Al5052 alloy via hybrid in-situ Al3Ni and nano-SiC reinforcement during friction stir processing. Ceram. Int. 2026, 52, 25597–25611. [Google Scholar] [CrossRef] [Scilit]
- Yu, G.; Hu, L.; Qu, Y. Fretting slip wear mechanism of AlCrN coated cemented carbide tool on titanium alloy TC4 under ultimate continuous cutting. Int. J. Refract. Met. Hard Mater. 2026, 140, 107859. [Google Scholar] [CrossRef] [Scilit]
- Mittal, S.; Khan, M.A.; Romero, D.; Wuest, T. A critical review of smart manufacturing & Industry 4.0 maturity models: Implications for small and medium-sized enterprises (SMEs). J. Manuf. Syst. 2018, 49, 194–214. [Google Scholar] [CrossRef] [Scilit]
- Moeuf, A.; Pellerin, R.; Lamouri, S.; Tamayo-Giraldo, S.; Barbaray, R. The industrial management of SMEs in the era of Industry 4.0. Int. J. Prod. Res. 2018, 56, 1118–1136. [Google Scholar] [CrossRef] [Scilit]
- Cao, J.; Fang, C.; Wang, B.; Hu, X.; Yan, S. Assessment of the impact of the EU’s Carbon Border Adjustment Mechanism on China in the context of global climate governance. Procedia Comput. Sci. 2025, 266, 16–23. [Google Scholar] [CrossRef] [Scilit]
- Mohsin, A.K.M.; Rashed, M.; Gerschberger, M.; Ahmed, S.F.; Plasch, M.; Rahman, A.; Noor, A. Can supply chains decarbonize? Exploring the potential of Scope 3 emission reduction for sustainable transformation. Sustain. Futur. 2025, 10, 101512. [Google Scholar] [CrossRef] [Scilit]
- Antony, J.; Snee, R.; Hoerl, R. Lean Six Sigma: Yesterday, today and tomorrow. Int. J. Qual. Reliab. Manag. 2017, 34, 1073–1093. [Google Scholar] [CrossRef] [Scilit]
- Ruben, R.B.; Vinodh, S.; Asokan, P. Implementation of Lean Six Sigma framework with environmental considerations in an Indian automotive component manufacturing firm: A case study. Prod. Plan. Control 2017, 28, 1193–1211. [Google Scholar] [CrossRef] [Scilit]
- Abbas, J. Impact of total quality management on corporate green performance through the mediating role of corporate social responsibility. J. Clean. Prod. 2020, 242, 118458. [Google Scholar] [CrossRef] [Scilit]
- Francescatto, M.; Neuenfeldt Júnior, A.; Kubota, F.I.; Guimarães, G.; de Oliveira, B. Lean Six Sigma case studies literature overview: Critical success factors and difficulties. Int. J. Product. Perform. Manag. 2022, 72, 1–23. [Google Scholar] [CrossRef] [Scilit]
- Cherrafi, A.; Elfezazi, S.; Chiarini, A.; Mokhlis, A.; Benhida, K. The integration of lean manufacturing, Six Sigma and sustainability: A literature review and future research directions for developing a specific model. J. Clean. Prod. 2016, 139, 828–846. [Google Scholar] [CrossRef] [Scilit]
- Hussain, K.; Sun, H.; Ahmad, N.; Iqbal, M. Assessment of risk factors to Green, Lean, Six Sigma adoption in construction sector: Integrated ISM-MICMAC approach. Heliyon 2024, 10, e32749. [Google Scholar] [CrossRef] [Scilit] [PubMed]
- Rathi, R.; Kaswan, M.S.; Garza-Reyes, J.A.; Antony, J.; Cross, J. Green Lean Six Sigma for improving manufacturing sustainability: Framework development and validation. J. Clean. Prod. 2022, 345, 131130. [Google Scholar] [CrossRef] [Scilit]
- Montgomery, D.C. Introduction to Statistical Quality Control, 6th ed.; John Wiley & Sons: Hoboken, NJ, USA, 2009. [Google Scholar]
- Ghasemibojd, F.; Franchetti, M.J.; George, B. Green lean six sigma for sustainable development: A systematic review of evolution, challenges, and future pathways. Clean Technol. Environ. Policy 2025, 27, 9239–9262. [Google Scholar] [CrossRef] [Scilit]
- Lee, J.; Davari, H.; Singh, J.; Pandhare, V. Industrial artificial intelligence for Industry 4.0-based manufacturing systems. Manuf. Lett. 2018, 18, 20–23. [Google Scholar] [CrossRef] [Scilit]
- Boumsisse, I.; Benhadou, M.; Haddout, A. Optimizing Green Lean Six Sigma using Industry 5.0 technologies. Clean. Waste Syst. 2025, 10, 100234. [Google Scholar] [CrossRef] [Scilit]
- Tao, F.; Zhang, H.; Liu, A.; Nee, A.Y. Digital twin in industry: State-of-the-art. IEEE Trans. Ind. Inform. 2019, 15, 2405–2415. [Google Scholar] [CrossRef] [Scilit]
- Barot, R.S.; Patel, J.; Sharma, B.; Rathod, B.; Solanki, H.; Patel, Y. Lean Six Sigma feasibility and implementation aspect in cast iron foundry. Mater. Today Proc. 2020, 28, 1084–1091. [Google Scholar] [CrossRef] [Scilit]
- Gandhi, J.D.; Thanki, S. Sustainability index development by integrating lean green and Six Sigma tools: A case study of the Indian manufacturing industry. Int. J. Product. Perform. Manag. 2025, 74, 793–818. [Google Scholar] [CrossRef] [Scilit]
- Womack, J.P.; Jones, D.T. Lean Thinking: Banish Waste and Create Wealth in Your Corporation; Simon & Schuster: New York, NY, USA, 1996. [Google Scholar]
- Antony, J.; Scheumann, T.; Sunder, M.V.; Cudney, E.; Rodgers, B.; Grigg, N.P. Using Six Sigma DMAIC for Lean project management in education: A case study in a German kindergarten. Total Qual. Manag. Bus. Excell. 2021, 33, 1489–1509. [Google Scholar] [CrossRef] [Scilit]
- Garza-Reyes, J.A. Lean and green: A systematic review of the state of the art literature. J. Clean. Prod. 2015, 102, 18–29. [Google Scholar] [CrossRef] [Scilit]
- Milewska, B.; Milewski, D. Lean, Agile, and Six Sigma: Efficiency and the challenges of today’s world: Is it time for a change? Sustainability 2025, 17, 3617. [Google Scholar] [CrossRef] [Scilit]
- Ren, Y.; Huang, M.; Zhang, M.; He, Z. Corporate social responsibility practices and quality performance among Chinese dairy companies: The mediating role of total quality management. Comput. Ind. Eng. 2026, 212, 111745. [Google Scholar] [CrossRef] [Scilit]
- King, A.A.; Lenox, M.J. Lean and green? An empirical examination of the relationship between lean production and environmental performance. Prod. Oper. Manag. 2001, 10, 244–256. [Google Scholar] [CrossRef] [Scilit]
- Al Koliby, I.S.; Al-Swidi, A.K.; Al-Hakimi, M.A.; Mehat, N.A.B.; Gelaidan, H.M.; Al-Hattami, H.M. From data to green innovation: The role of green organizational learning capability and total quality management. Sustain. Futur. 2025, 10, 101191. [Google Scholar] [CrossRef] [Scilit]
- Pongboonchai-Empl, T.; Antony, J.; Garza-Reyes, J.A.; Tortorella, G.L.; Komkowski, T.; Stemann, D. DMAIC 4.0: Innovating the Lean Six Sigma methodology with Industry 4.0 technologies. Prod. Plan. Control 2026, 37, 170–191. [Google Scholar] [CrossRef] [Scilit]
- Gupta, H.; Kumar, A.; Wasan, P. Industry 4.0, cleaner production and circular economy: An integrative framework for evaluating ethical and sustainable business performance of manufacturing organizations. J. Clean. Prod. 2021, 295, 126253. [Google Scholar] [CrossRef] [Scilit]
- Rossini, M.; Costa, F.; Tortorella, G.L.; Portioli-Staudacher, A. The interrelation between Industry 4.0 and lean production: An empirical study on European manufacturers. Int. J. Adv. Manuf. Technol. 2019, 102, 3963–3976. [Google Scholar] [CrossRef] [Scilit]
- McGlinchey, Y.; Iqbal, J.; Trubetskaya, A.; Thenarasu, M.; McDermott, O. Design for green lean six sigma to improve sustainability in the pharmaceutical industry: A case study. Prod. Manuf. Res. 2025, 13, 2461010. [Google Scholar] [CrossRef] [Scilit]
- Ranade, P.B.; Reddy, G.; Koppal, P.; Paithankar, A.; Shevale, S. Implementation of DMAIC methodology in green sand-casting process. Mater. Today Proc. 2021, 42, 500–507. [Google Scholar] [CrossRef] [Scilit]
- Bonollo, F.; Gramegna, N.; Timelli, G. High-pressure die-casting: Contradictions and challenges. JOM 2015, 67, 901–908. [Google Scholar] [CrossRef] [Scilit]
- Dargusch, M.S.; Dour, G.; Schauer, N.; Dinnis, C.; Savage, G. The influence of pressure during solidification of high pressure die cast aluminium telecommunications components. J. Mater. Process. Technol. 2006, 180, 37–43. [Google Scholar] [CrossRef] [Scilit]
- Tsoukalas, V.D. Optimization of porosity formation in AlSi9Cu3 pressure die castings using genetic algorithm analysis. Mater. Des. 2008, 29, 2027–2033. [Google Scholar] [CrossRef] [Scilit]
- Haban, A.; Kracun, S.F.; Rohde, D.N.; Fehlbier, M. Development and characterisation of a new die-casting die cooling system based on internal spray cooling. Metals 2024, 14, 956. [Google Scholar] [CrossRef] [Scilit]
- Stochioiu, F.P.G.; Nechita, R.M.; Ulerich, O.; Stochioiu, C. Defect networks and waste reduction in additive manufacturing. Sustainability 2025, 17, 8498. [Google Scholar] [CrossRef] [Scilit]
- Riedel, E.; Ahmed, M.; Hellmann, B.; Horn, I. Foundry 4.0: Digitally recordable casting ladle for the application of Industry 4.0-ready manual casting processes. Procedia CIRP 2023, 116, 95–100. [Google Scholar] [CrossRef] [Scilit]
- Bagherian, A.; Gershon, M.; Kumar, S. Unraveling the key determinants of successful Six Sigma implementation: An empirical investigation. Total Qual. Manag. Bus. Excell. 2023, 35, 114–136. [Google Scholar] [CrossRef] [Scilit]
- Ibikunle, A.K.; Rajemi, M.F.; Mohd Zahari, F.; Faqera, A.F.O.; Ali, G.A. Factors hindering lean manufacturing and Six Sigma implementation within manufacturing SMEs: PRISMA-based approach for future research directions. J. Asia Bus. Stud. 2025, 19, 511–526. [Google Scholar] [CrossRef] [Scilit]
- Arumugam, V.; Linderman, K. Six Sigma and operational absorptive capacity: The role of project leader. Total Qual. Manag. Bus. Excell. 2020, 33, 509–528. [Google Scholar] [CrossRef] [Scilit]
- Nonaka, I. A dynamic theory of organizational knowledge creation. Organ. Sci. 1994, 5, 14–37. [Google Scholar] [CrossRef] [Scilit]
- Boon Sin, A.; Zailani, S.; Iranmanesh, M.; Ramayah, T. Structural equation modelling on knowledge creation in Six Sigma DMAIC project and its impact on organizational performance. Int. J. Prod. Econ. 2015, 168, 105–117. [Google Scholar] [CrossRef] [Scilit]
- Ren, Y.; Zhang, B.; Zhang, M.; Hu, F.; Huang, H. Deploying Lean Six Sigma to improve assembly precision of NEV component: Evidence from Chinese SME. Qual. Reliab. Eng. Int. 2025, 41, 2897–2908. [Google Scholar] [CrossRef] [Scilit]
- Hien, D.N.; Duc, M.L.; Tuan, T.D. Integrating Six Sigma into an Industry 4.0 system for enhanced productivity: A case study in CNC processes. Manag. Prod. Eng. Rev. 2024, 15, 44–62. [Google Scholar] [CrossRef] [Scilit]
- Zu, X.; Fredendall, L.D.; Douglas, T.J. The evolving theory of quality management: The role of Six Sigma. J. Oper. Manag. 2008, 26, 630–650. [Google Scholar] [CrossRef] [Scilit]
- Yin, R.K. Case Study Research and Applications: Design and Methods, 6th ed.; SAGE Publications, Inc.: Thousand Oaks, CA, USA, 2018. [Google Scholar]
- Garza-Reyes, J.A. Green lean and the need for Six Sigma. Int. J. Lean Six Sigma 2015, 6, 226–248. [Google Scholar] [CrossRef] [Scilit]
- Kaswan, M.S.; Rathi, R. Green Lean Six Sigma for sustainable development: Integration and framework. Environ. Impact Assess. Rev. 2020, 83, 106396. [Google Scholar] [CrossRef] [Scilit]
- Myers, R.H.; Montgomery, D.C.; Anderson-Cook, C.M. Response Surface Methodology: Process and Product Optimization Using Designed Experiments, 4th ed.; John Wiley & Sons: Hoboken, NJ, USA, 2016. [Google Scholar]
- Does, R.J.M.M.; Trip, A.; Schippers, W.A.J. A framework for implementation of statistical process control. Int. J. Qual. Sci. 1997, 2, 181–198. [Google Scholar] [CrossRef] [Scilit]
- Woodall, W.H. Controversies and contradictions in statistical process control. J. Qual. Technol. 2000, 32, 341–350. [Google Scholar] [CrossRef] [Scilit]
- Pantas, T.; Besseris, G. Lean-and-Green fractional factorial screening of 3D-printed ABS mechanical properties using a Gibbs sampler and a neutrosophic profiler. Sustainability 2024, 16, 5998. [Google Scholar] [CrossRef] [Scilit]
- Istokovic, D.; Lucin, I.; Pesevic, A.; Vlatković, M. A combined discrete event simulation and factorial design experiment for the scheduling problem in a hybrid flow shop. Teh. Glas. 2024, 18, 418–424. [Google Scholar] [CrossRef] [Scilit]
- Weyand, A.; Bausch, P.; Engel, B.; Metternich, J.; Weigold, M. Analysis of uncertainty factors in part-specific greenhouse gas accounting. Sustainability 2023, 15, 16871. [Google Scholar] [CrossRef] [Scilit]
- Stenzel, A.; Waichman, I. Supply-chain data sharing for Scope 3 emissions. npj Clim. Action 2023, 2, 7. [Google Scholar] [CrossRef] [Scilit]
- Yang, J.; Liu, B.; Shu, D.; Li, H.; Yang, Q.; Hu, T.; Wang, Z.; Zeng, Y.; Huang, J.; Tang, X. Influence of High Injection Speed on Porosity and Mechanical Properties of High-Pressure Die-Casting Al-Si-Mg-Mn Alloy. Metall. Mater. Trans. B 2025, 56, 5296–5314. [Google Scholar] [CrossRef] [Scilit]
- Iwata, Y.; Dong, S.; Sugiyama, Y.; Iwahori, H. Compression behavior of entrapped gas in high pressure diecasting. Mater. Trans. 2012, 53, 483–488. [Google Scholar] [CrossRef] [Scilit][Green Version]
- Coughlan, P.; Coghlan, D. Action research for operations management. Int. J. Oper. Prod. Manag. 2002, 22, 220–240. [Google Scholar] [CrossRef] [Scilit]
- Ren, Y.; Zhang, M.; Bai, Y.; Bai, H. Six Sigma for improving tensile strength: A case study in the impregnating resin manufacturing company. Int. J. Lean Six Sigma 2022, 13, 1346–1366. [Google Scholar] [CrossRef] [Scilit]
- Liu, Y.; Ren, Y.; Zhang, M.; Wei, K.; Hao, L. Solenoid valves quality improvement based on Six Sigma management. Int. J. Lean Six Sigma 2023, 14, 72–93. [Google Scholar] [CrossRef] [Scilit]
- GlobalPetrolPrices.com. China Business Electricity Prices. Available online: https://www.globalpetrolprices.com/China/electricity_prices/ (accessed on 29 July 2026).
- Hopp, W.J.; Spearman, M.L. To pull or not to pull: What is the question? Manuf. Serv. Oper. Manag. 2004, 6, 133–148. [Google Scholar] [CrossRef] [Scilit]
- Salonitis, K.; Jolly, M.; Pagone, E.; Papanikolaou, M. Life-cycle and energy assessment of automotive component manufacturing: The dilemma between aluminum and cast iron. Energies 2019, 12, 2557. [Google Scholar] [CrossRef] [Scilit]
- Muangyai, S.; Chutima, P. Defects reduction in spheroidal graphite iron casting process of a jackscrew manufacturer. Key Eng. Mater. 2021, 891, 174–182. [Google Scholar] [CrossRef] [Scilit]
- Anand, A.; Nagarajan, D.; El Mansori, M.; Sivarupan, T. of additive fabrication with high-pressure die casting for quality structural castings of aluminium alloys: Optimising energy consumption. Trans. Indian Inst. Met. 2023, 76, 347–379. [Google Scholar] [CrossRef] [Scilit]
- Buer, S.V.; Strandhagen, J.O.; Chan, F.T.S. The link between Industry 4.0 and lean manufacturing: Mapping current research and establishing a research agenda. Int. J. Prod. Res. 2018, 56, 2924–2940. [Google Scholar] [CrossRef] [Scilit]
- Sony, M. Industry 4.0 and lean management: A proposed integration model and research propositions. Prod. Manuf. Res. 2018, 6, 416–432. [Google Scholar] [CrossRef] [Scilit]
- Saabye, H.; Kristensen, T.B.; Wæhrens, B.V. Developing a learning-to-learn capability: Insights on conditions for Industry 4.0 adoption. Int. J. Oper. Prod. Manag. 2022, 42, 25–53. [Google Scholar] [CrossRef] [Scilit]
- Escobar, C.A.; Macias, D.; McGovern, M.; Hernandez-De-Menendez, M.; Morales-Menendez, R. Quality 4.0: An evolution of Six Sigma DMAIC. Int. J. Lean Six Sigma 2022, 13, 1200–1238. [Google Scholar] [CrossRef] [Scilit]
- Skalli, D.; Charkaoui, A.; Cherrafi, A.; Garza-Reyes, J.A.; Antony, J.; Shokri, A. Industry 4.0 and Lean Six Sigma integration in manufacturing: A literature review, an integrated framework and proposed research perspectives. Qual. Manag. J. 2023, 30, 16–40. [Google Scholar] [CrossRef] [Scilit]
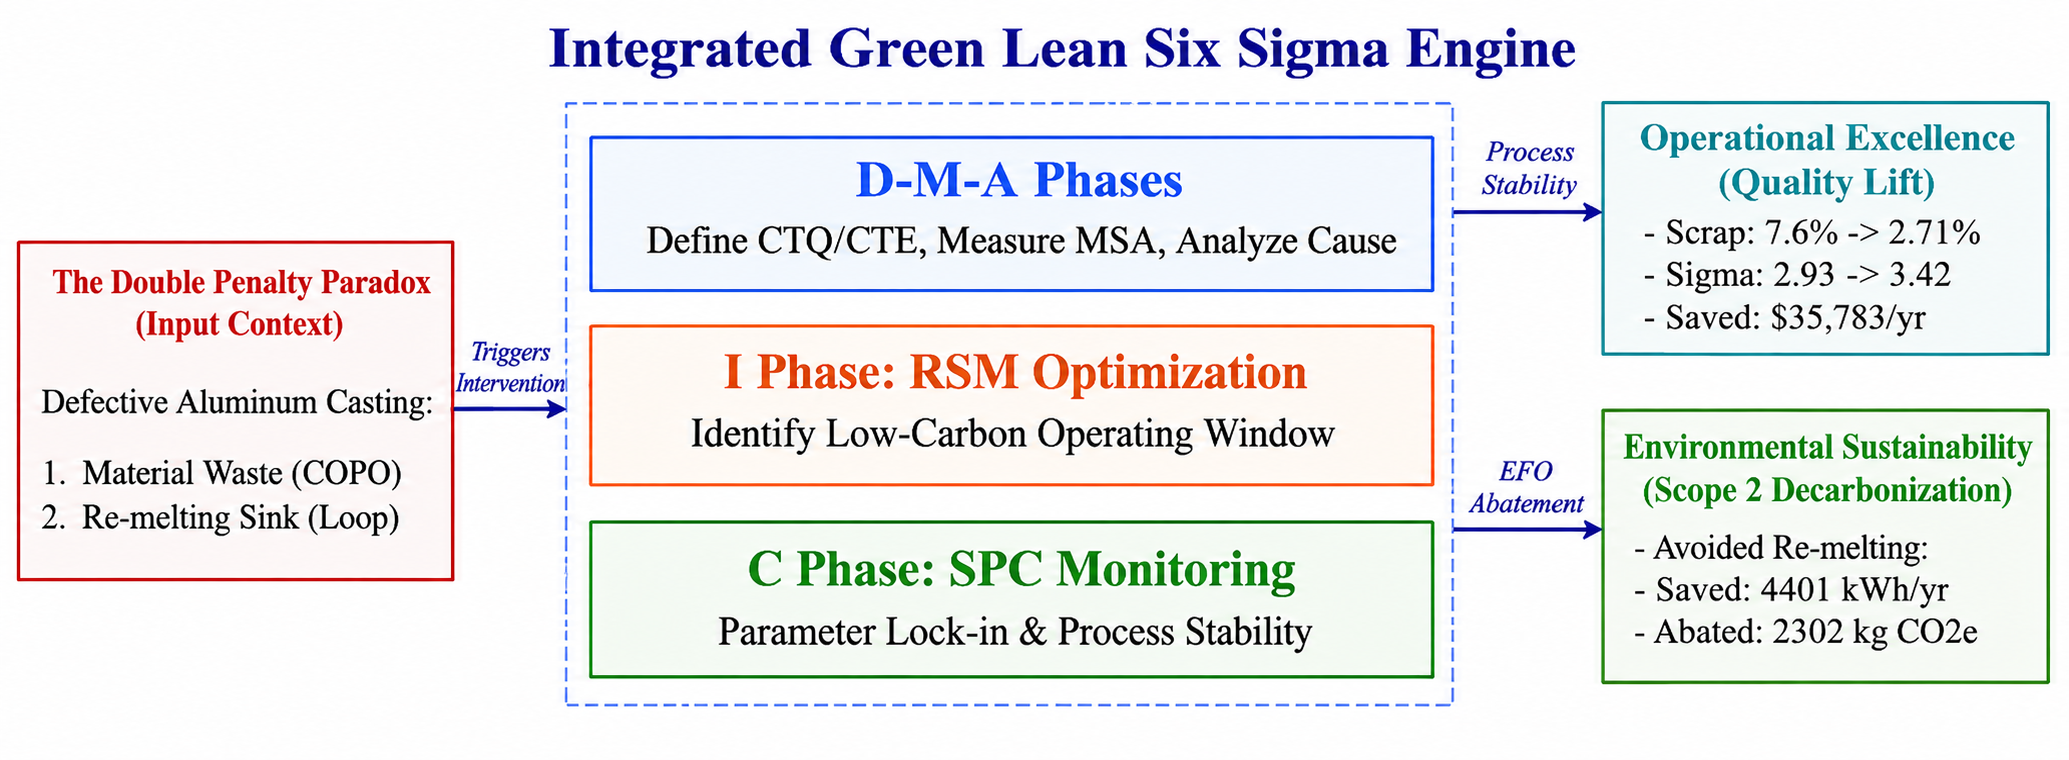
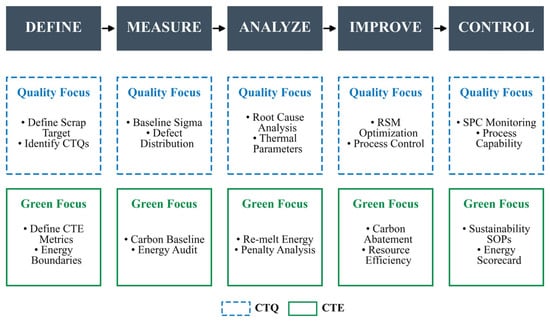
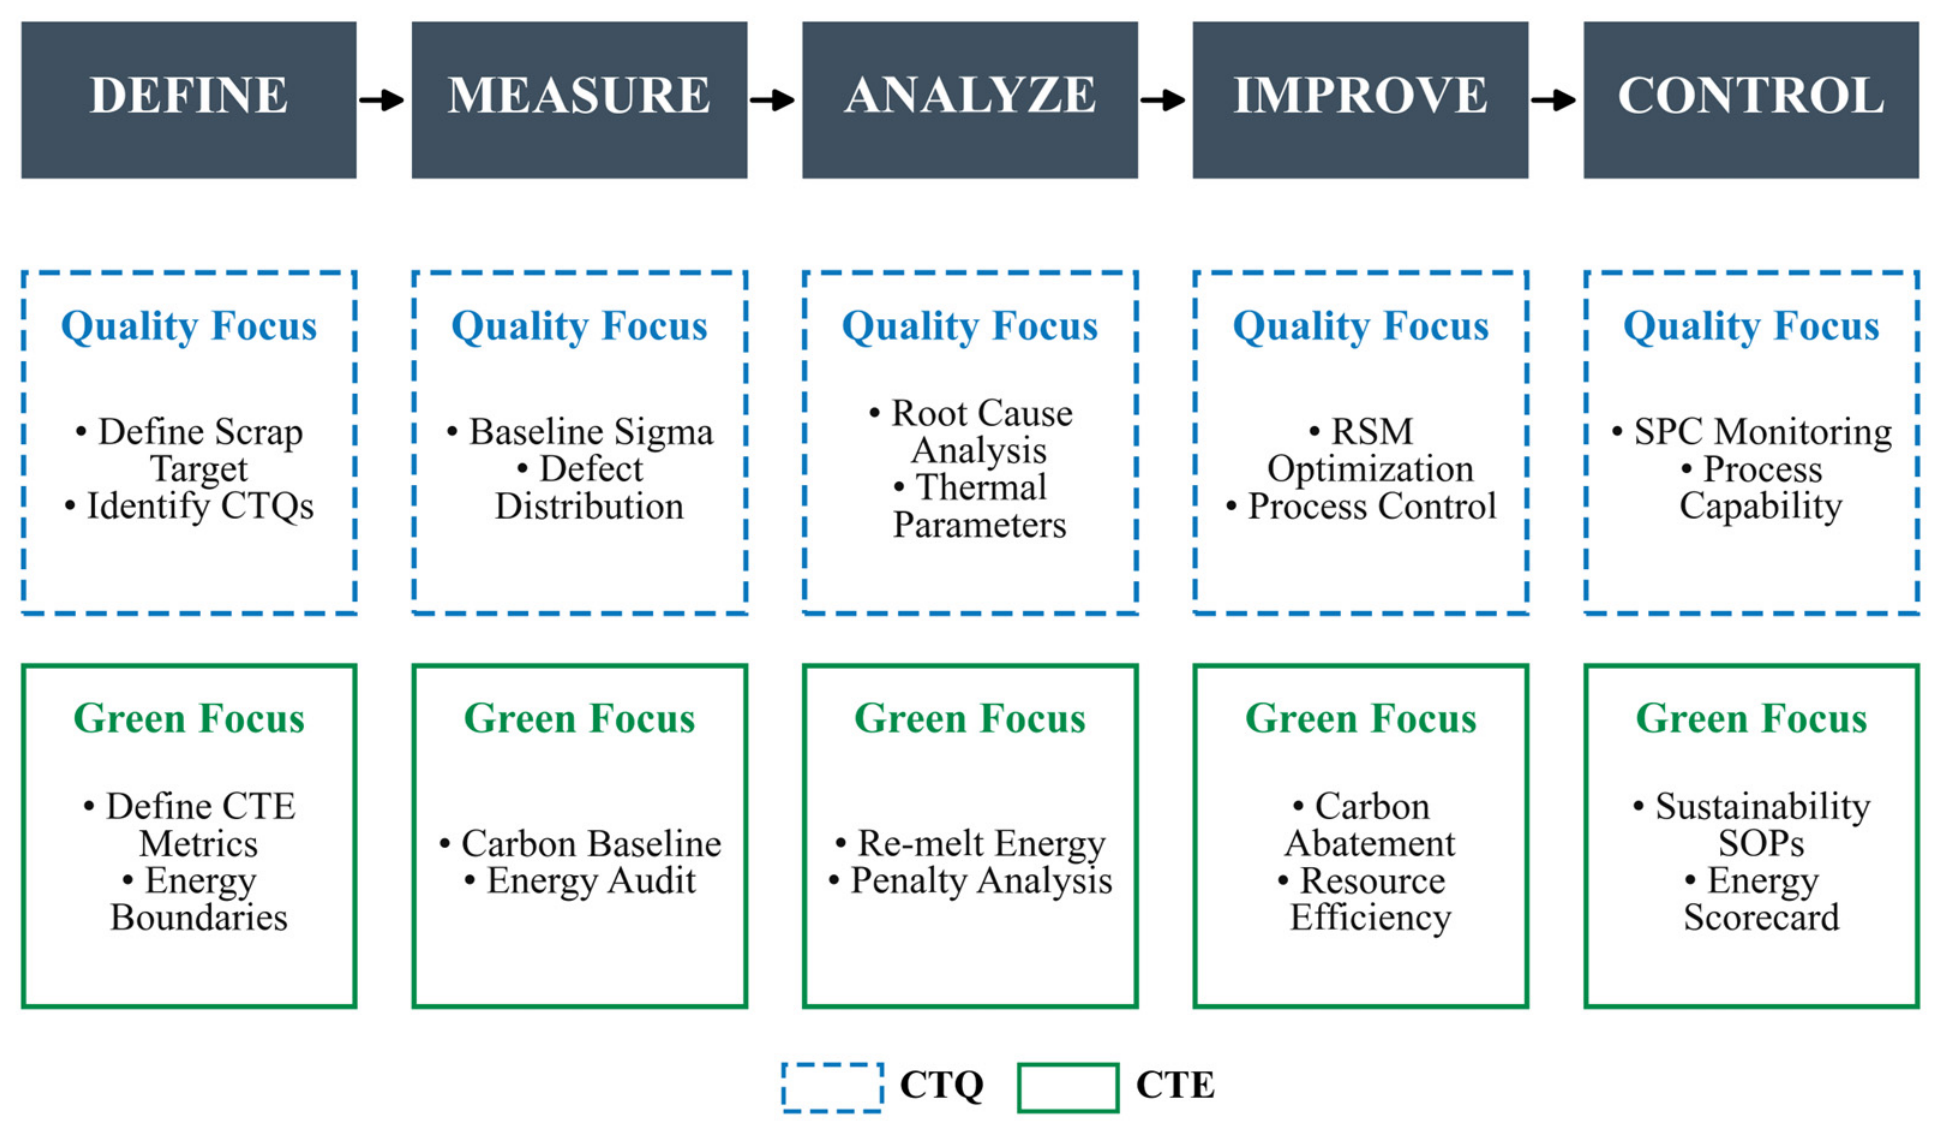
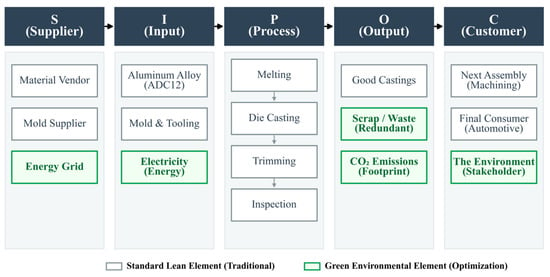
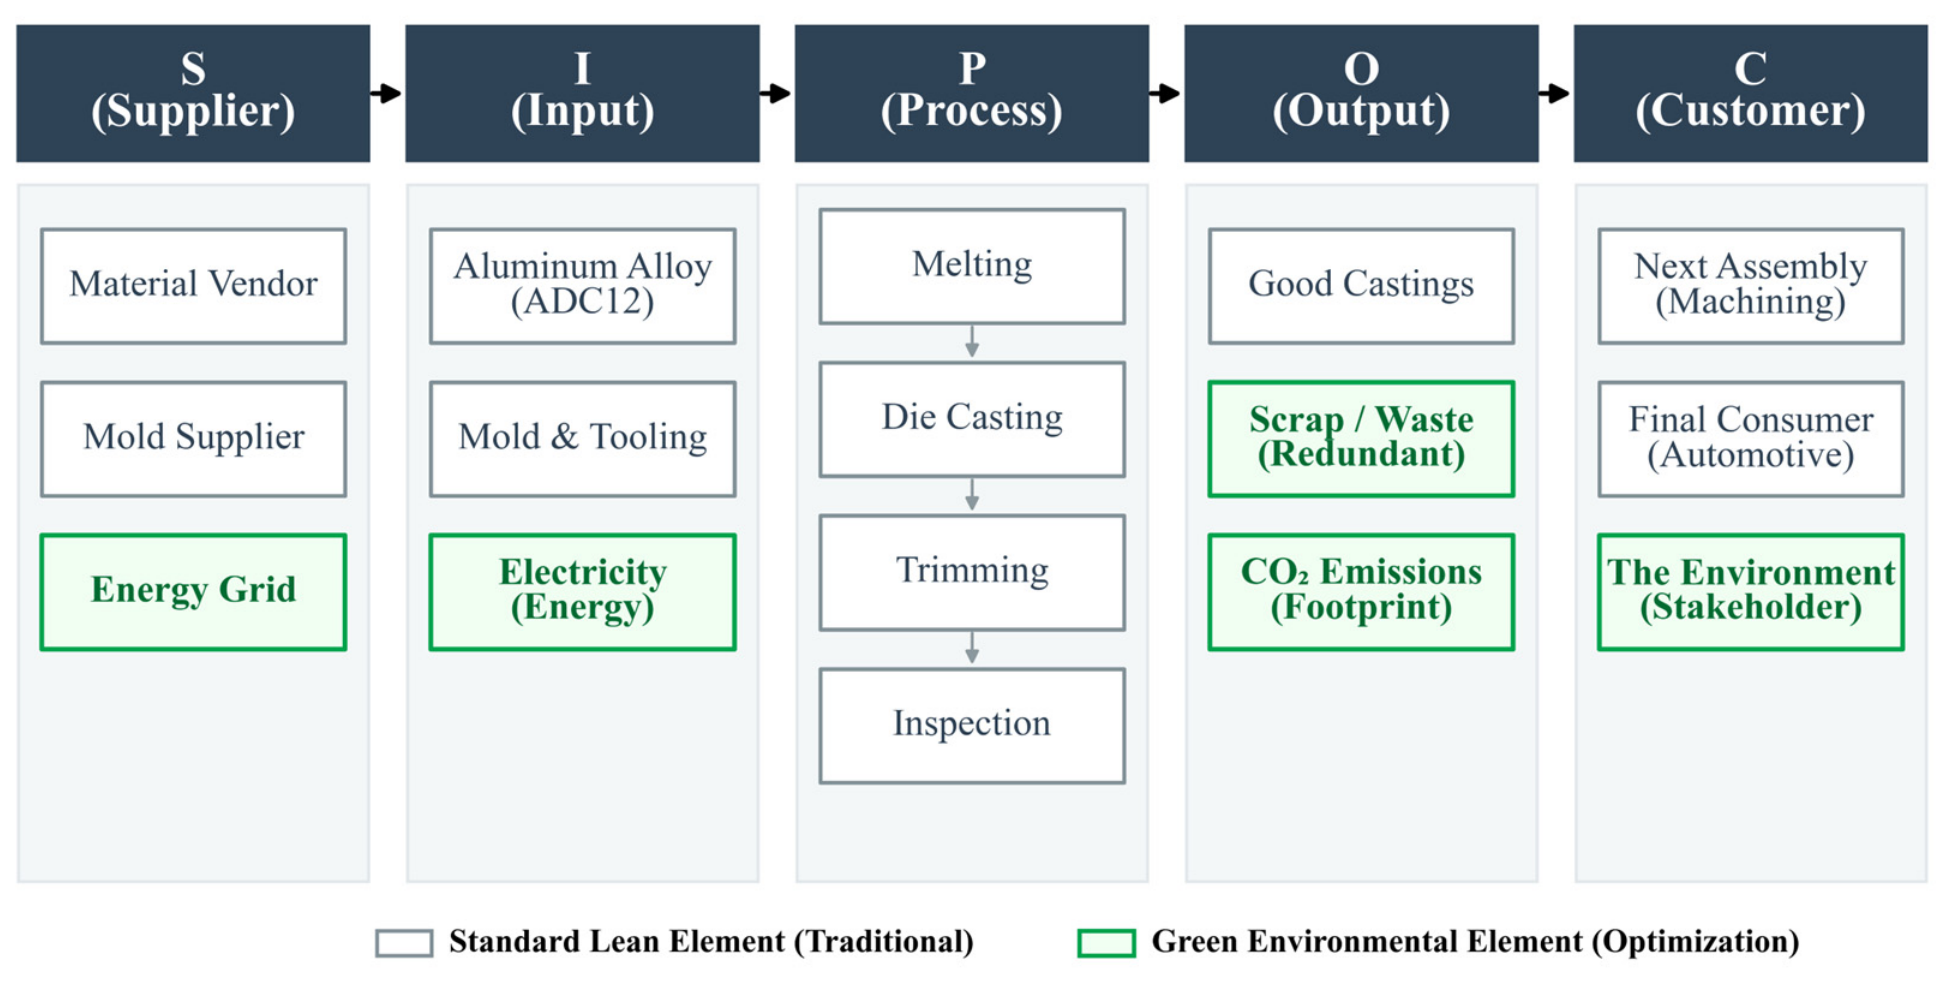
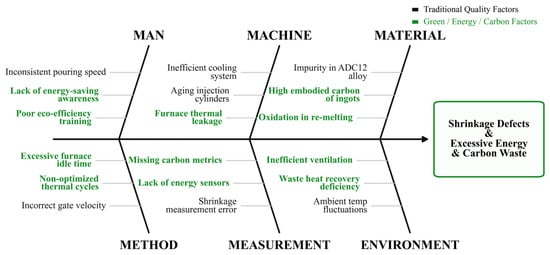
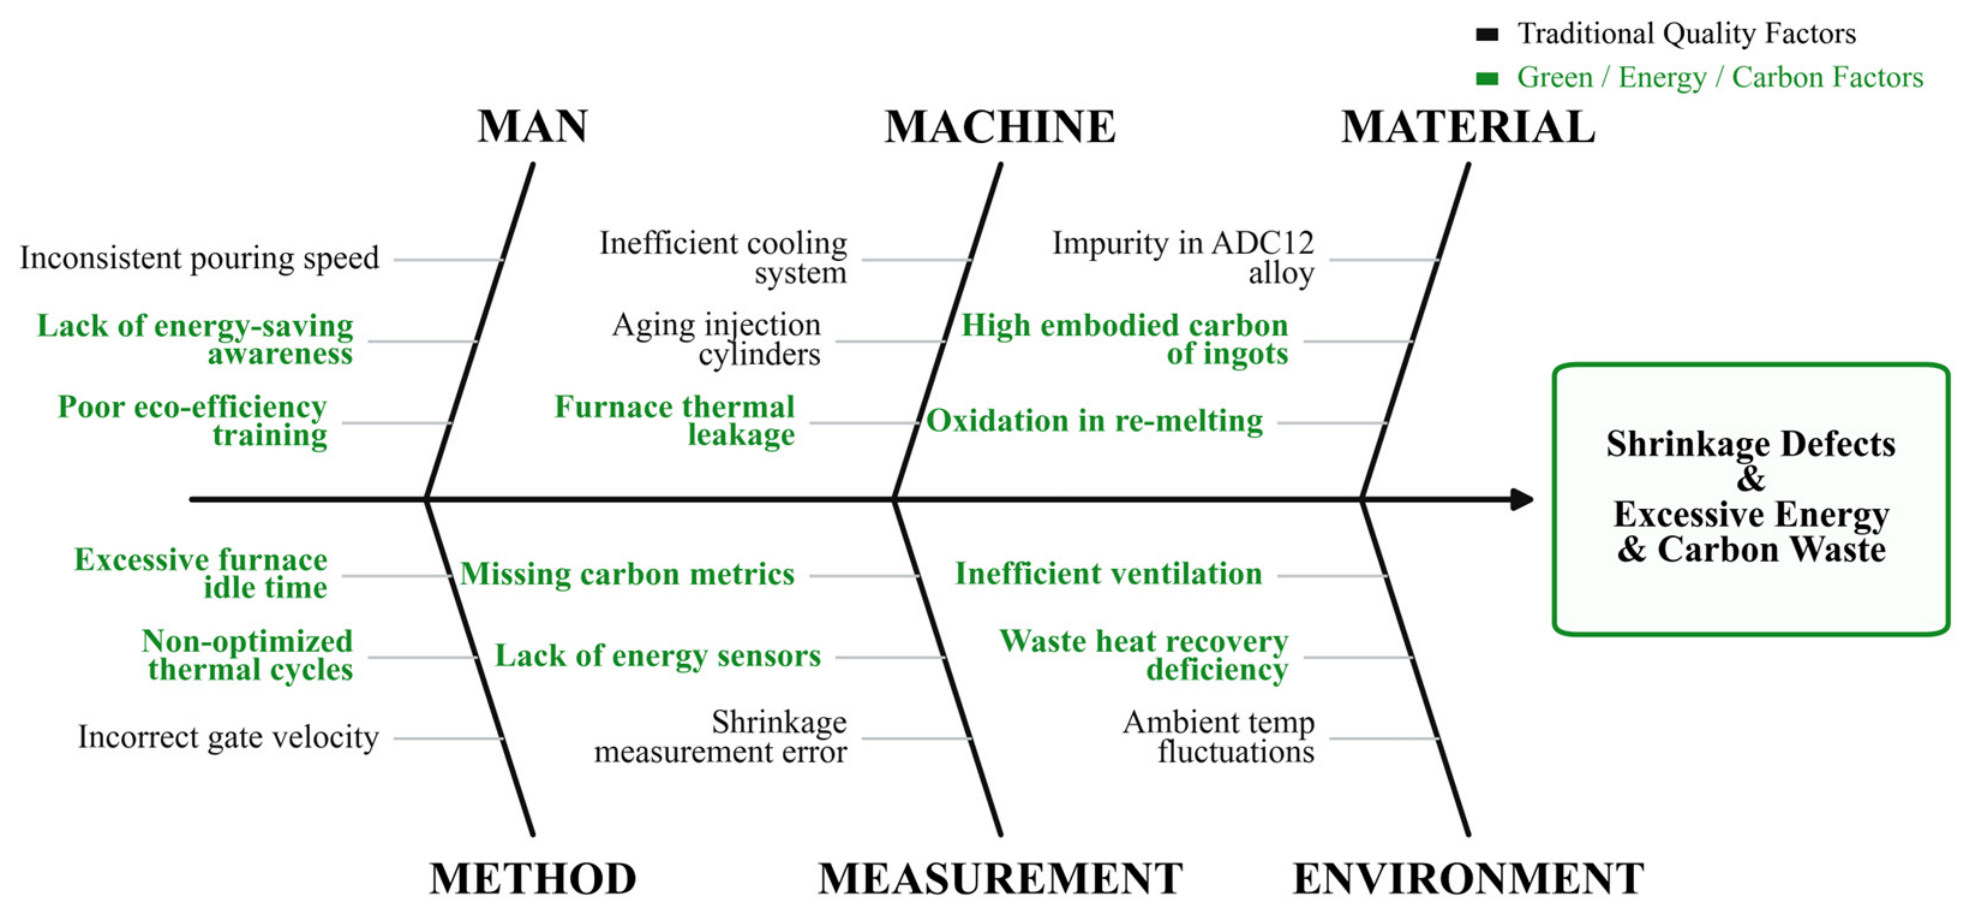
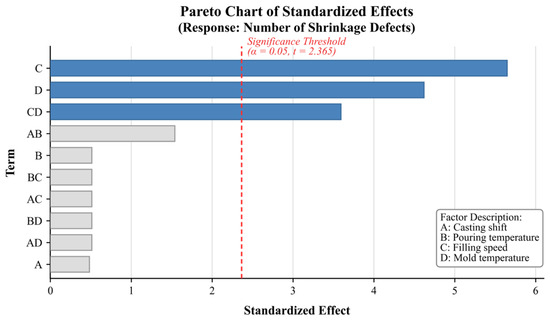
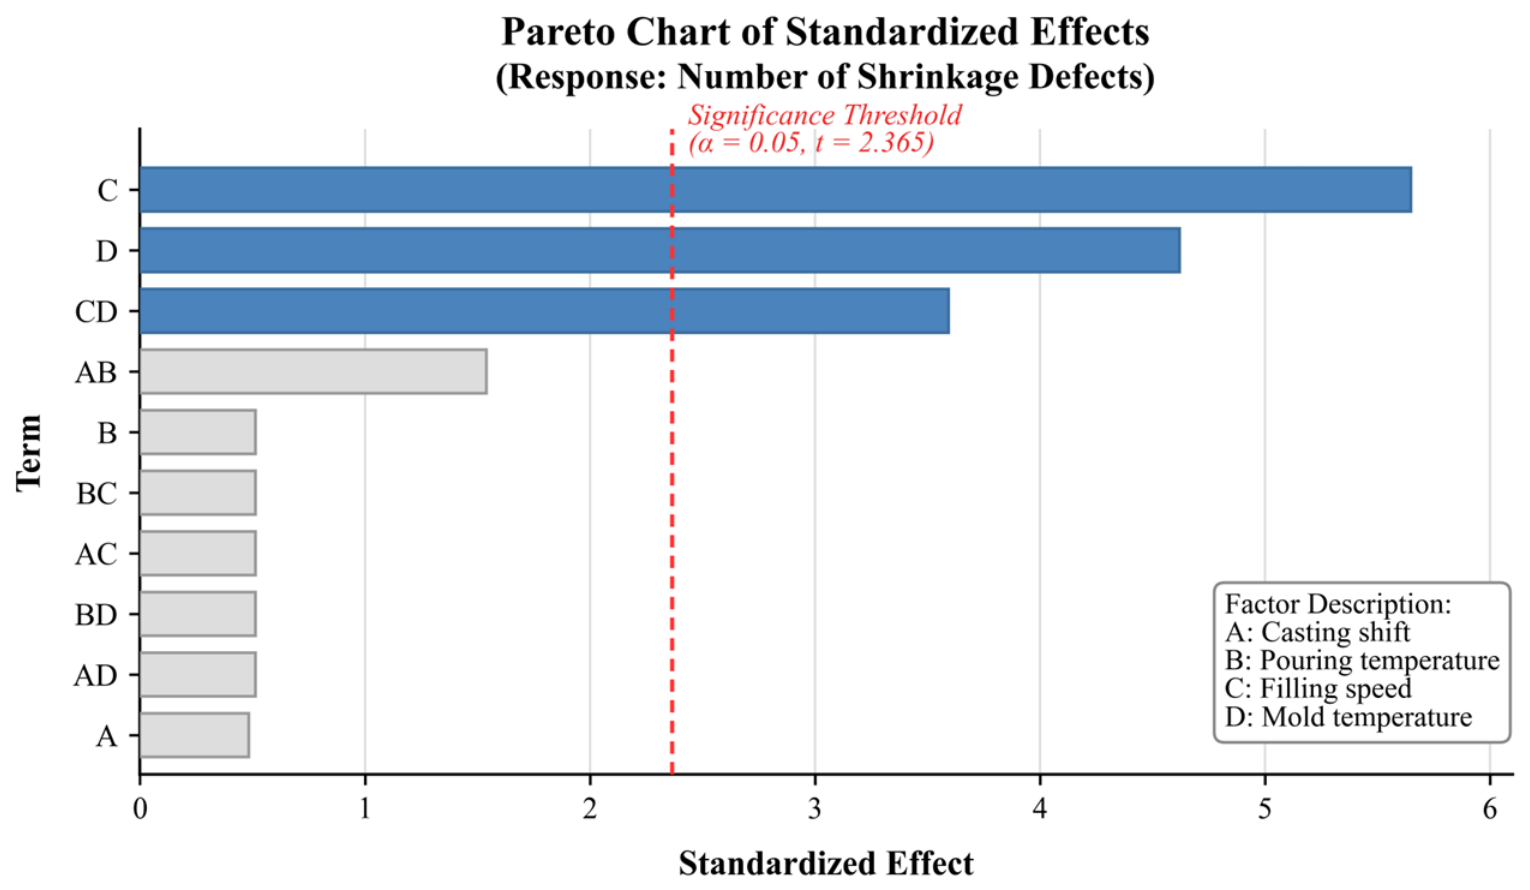
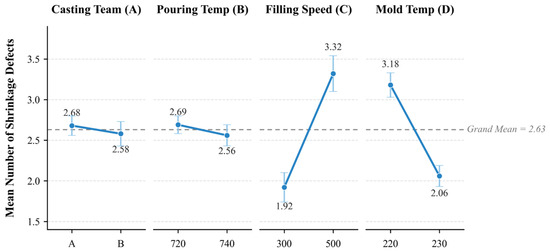
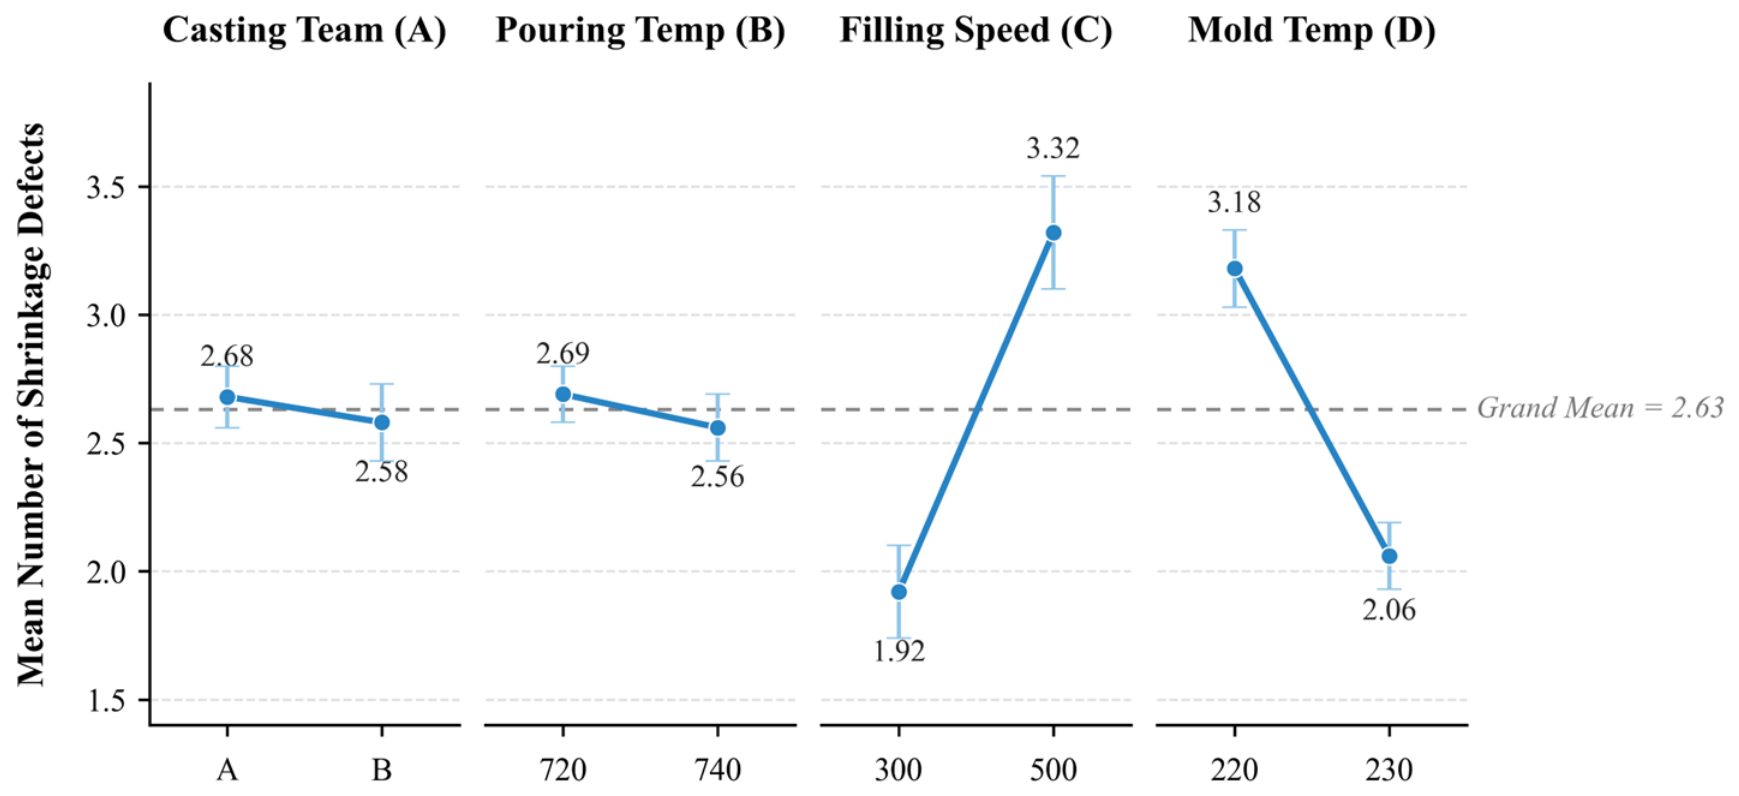
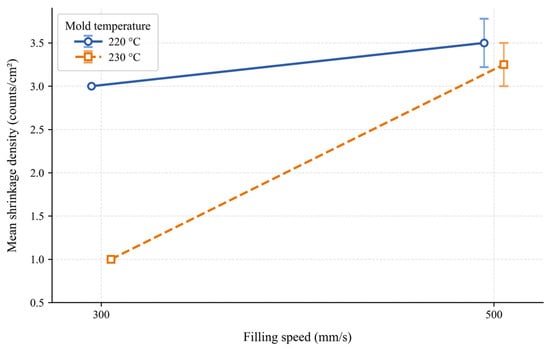
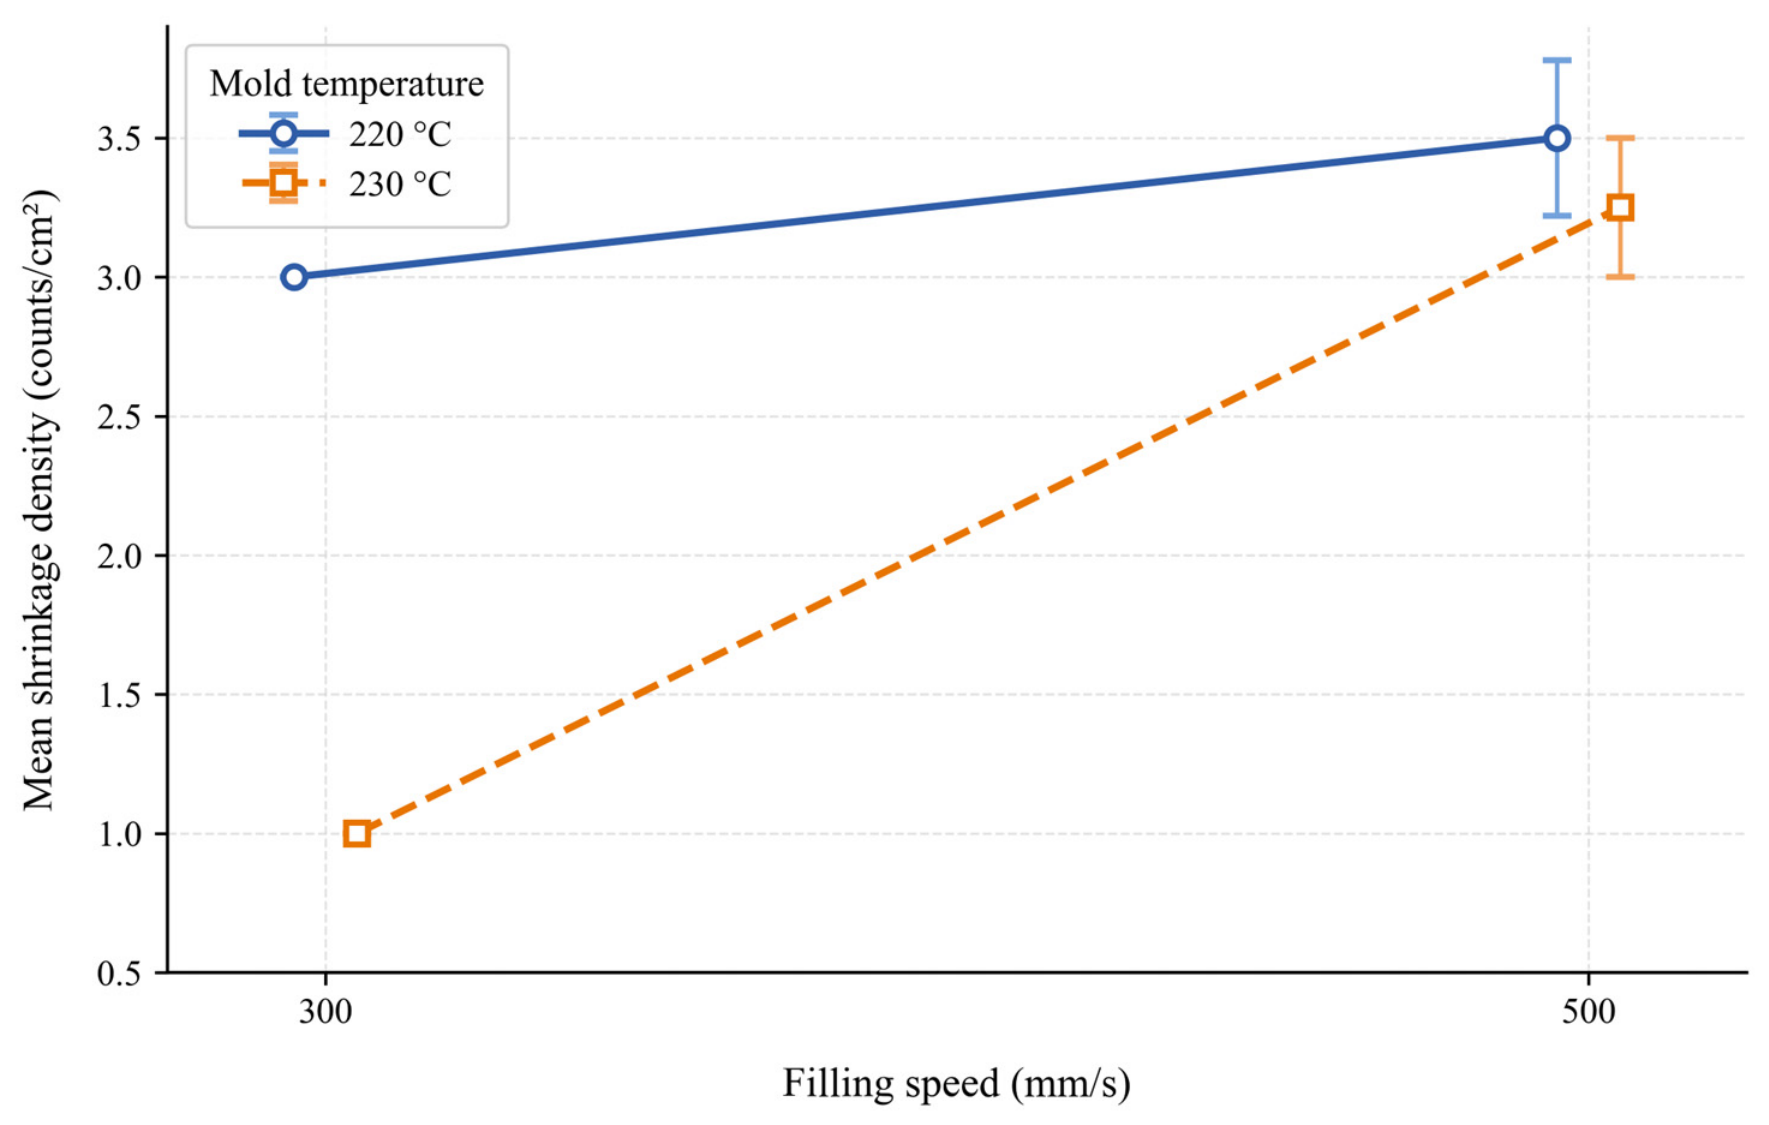
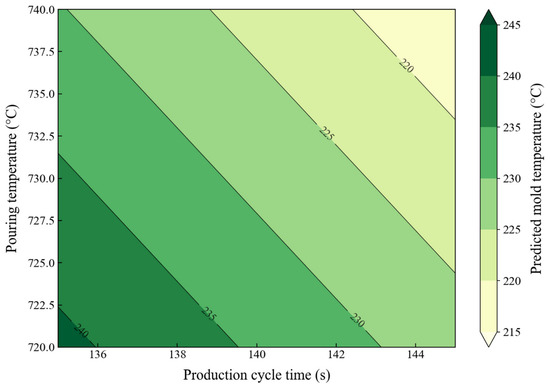
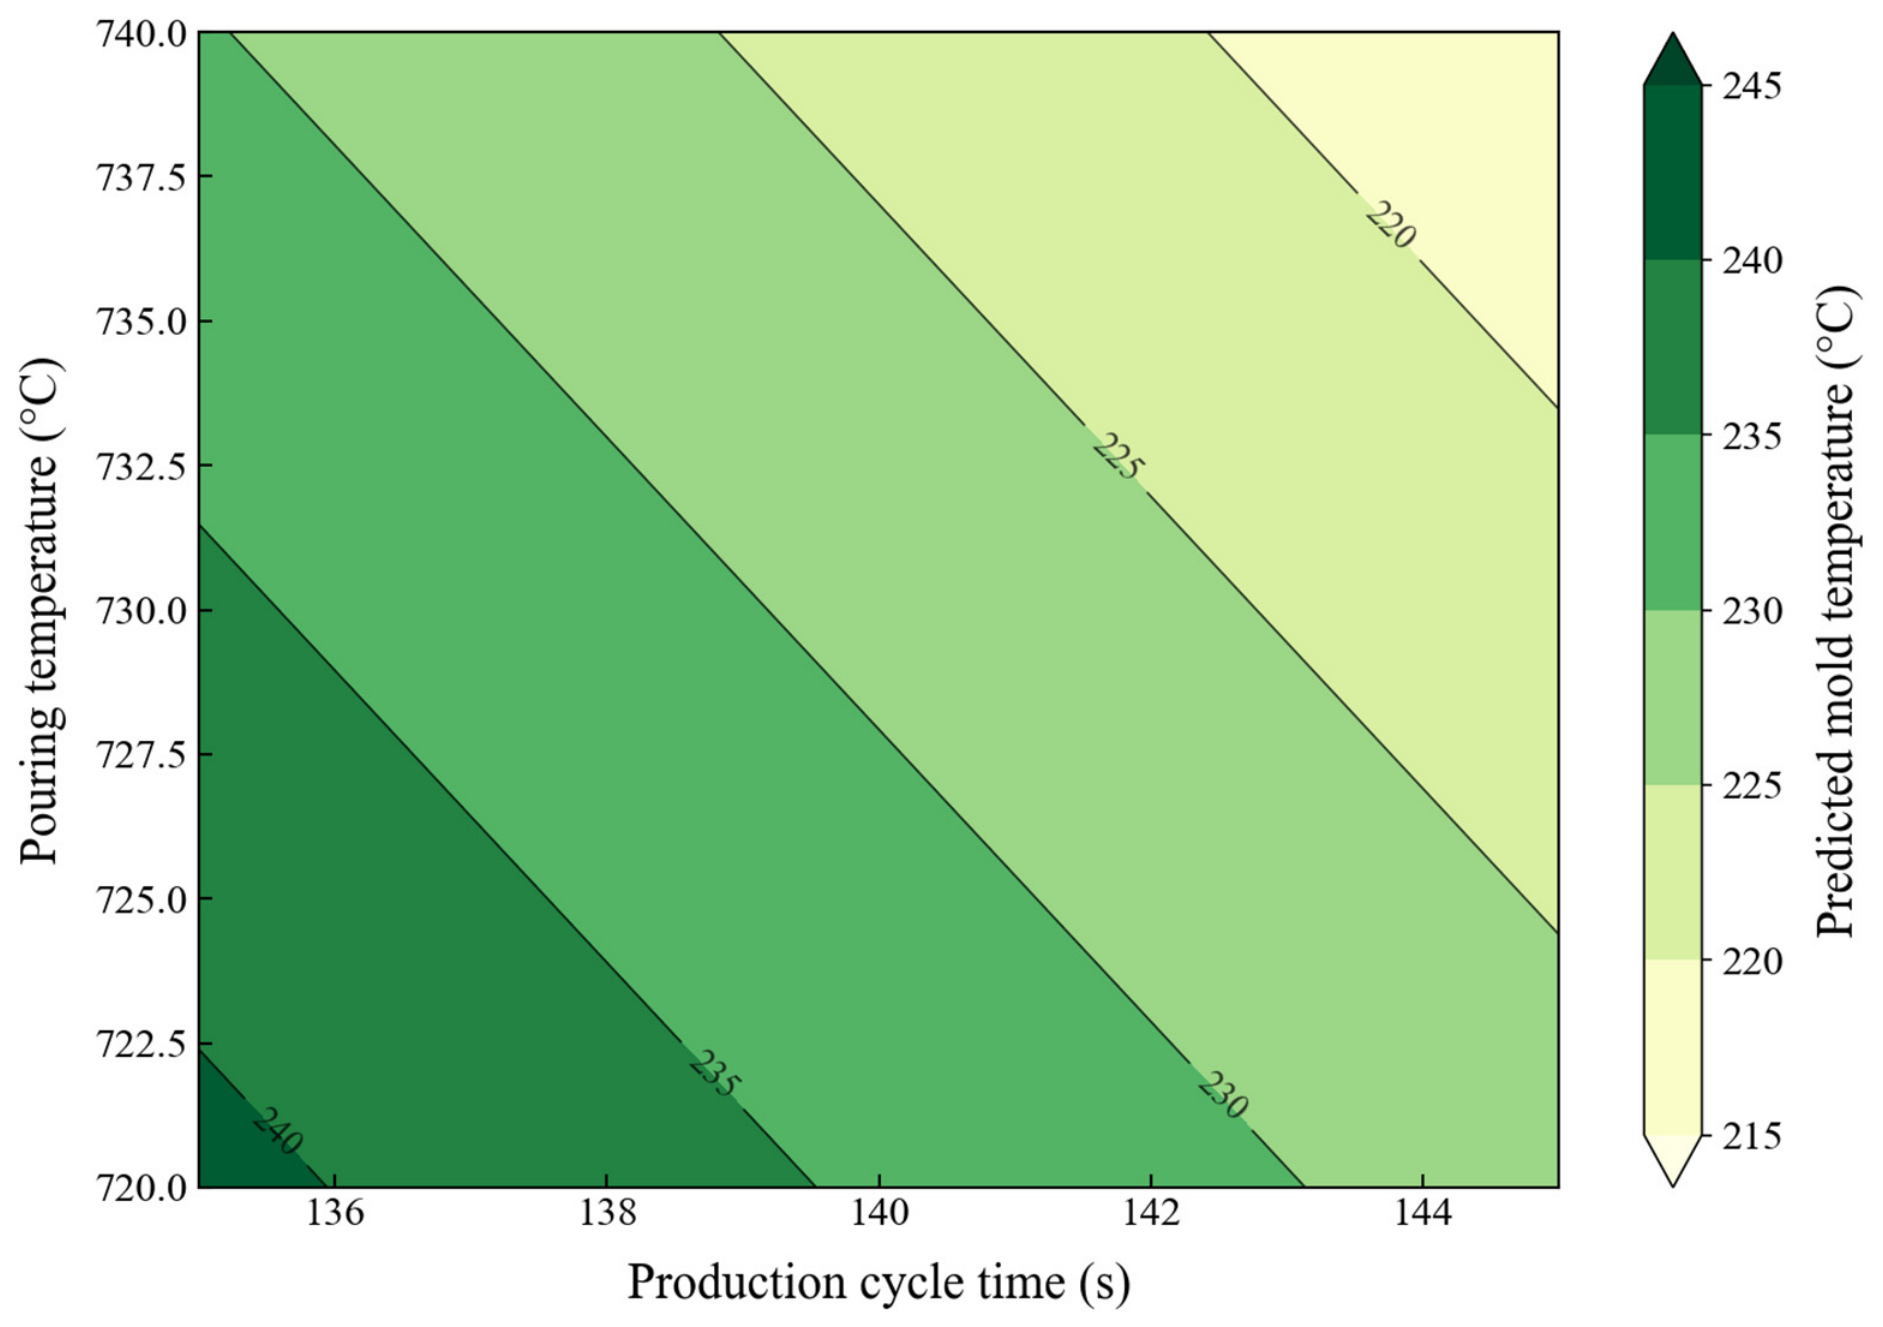
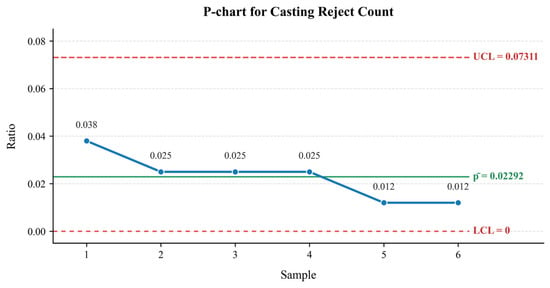
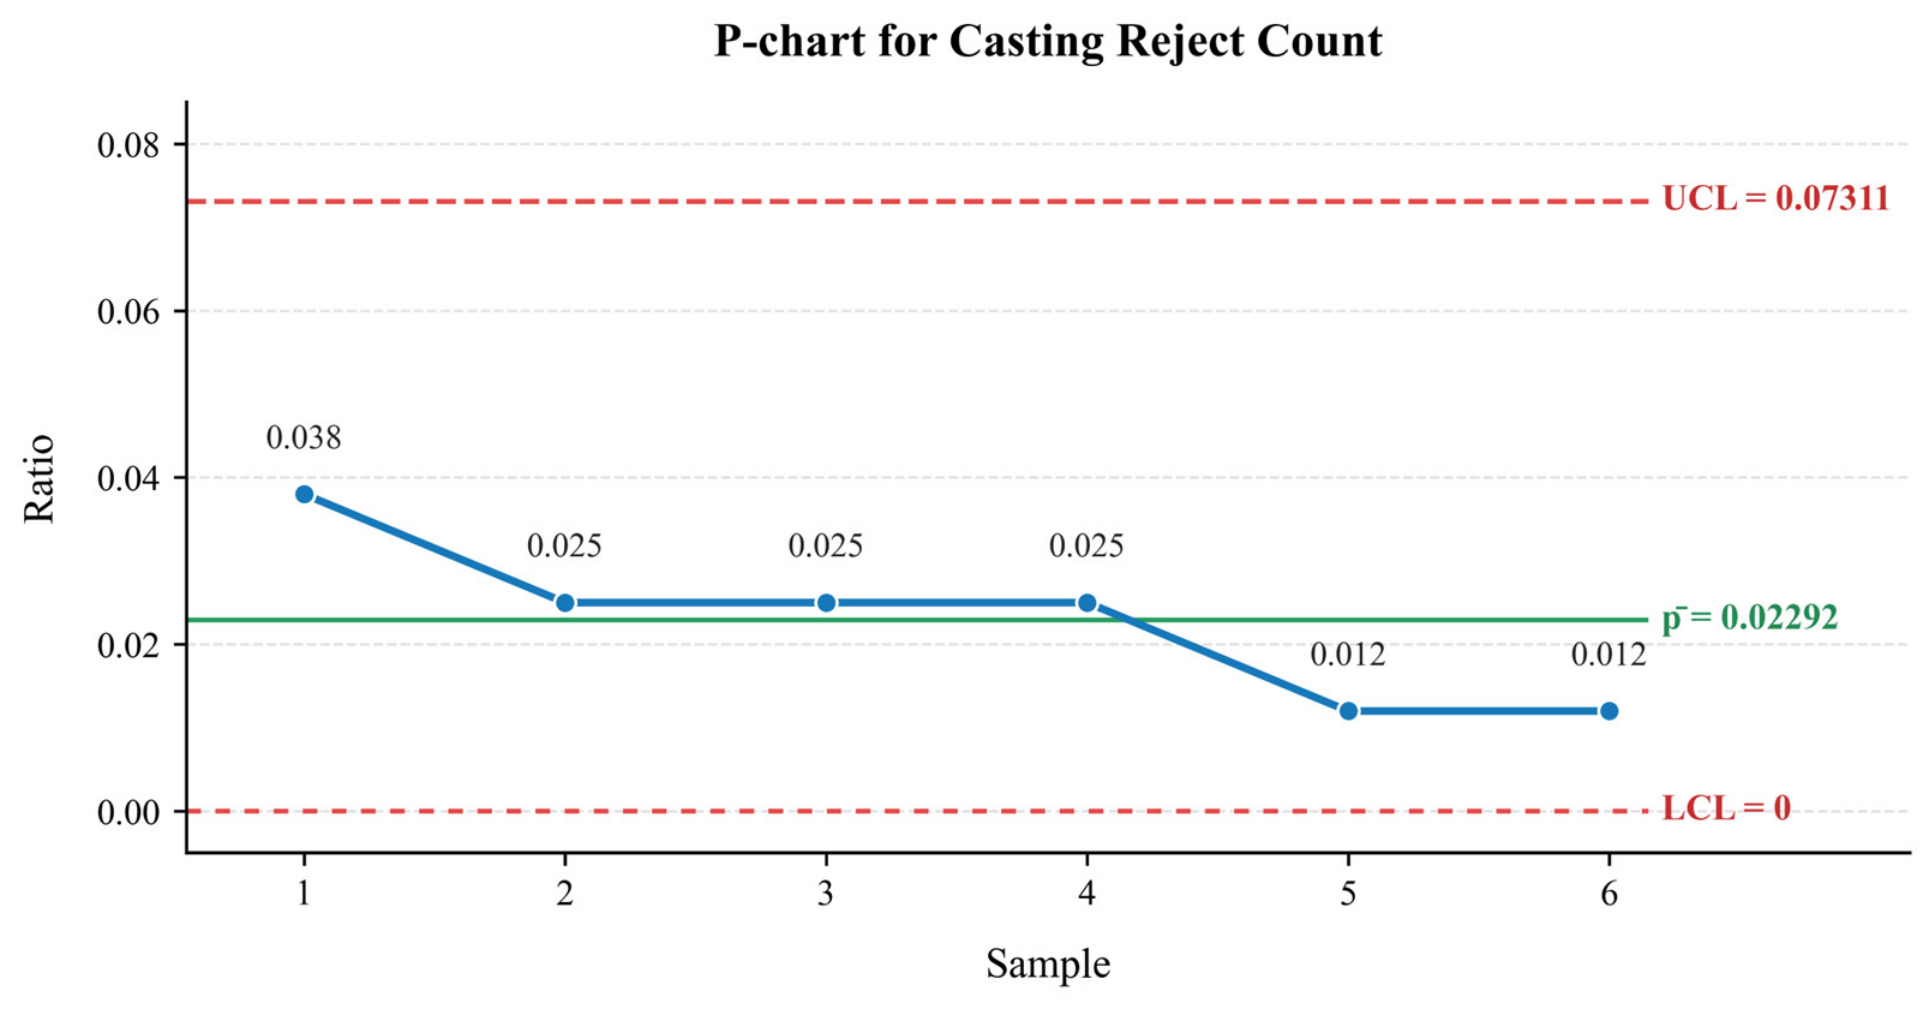
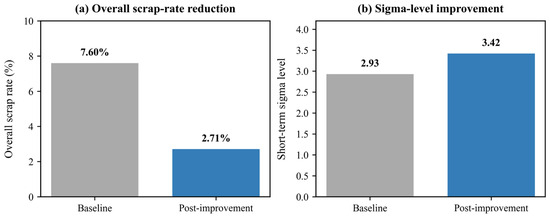
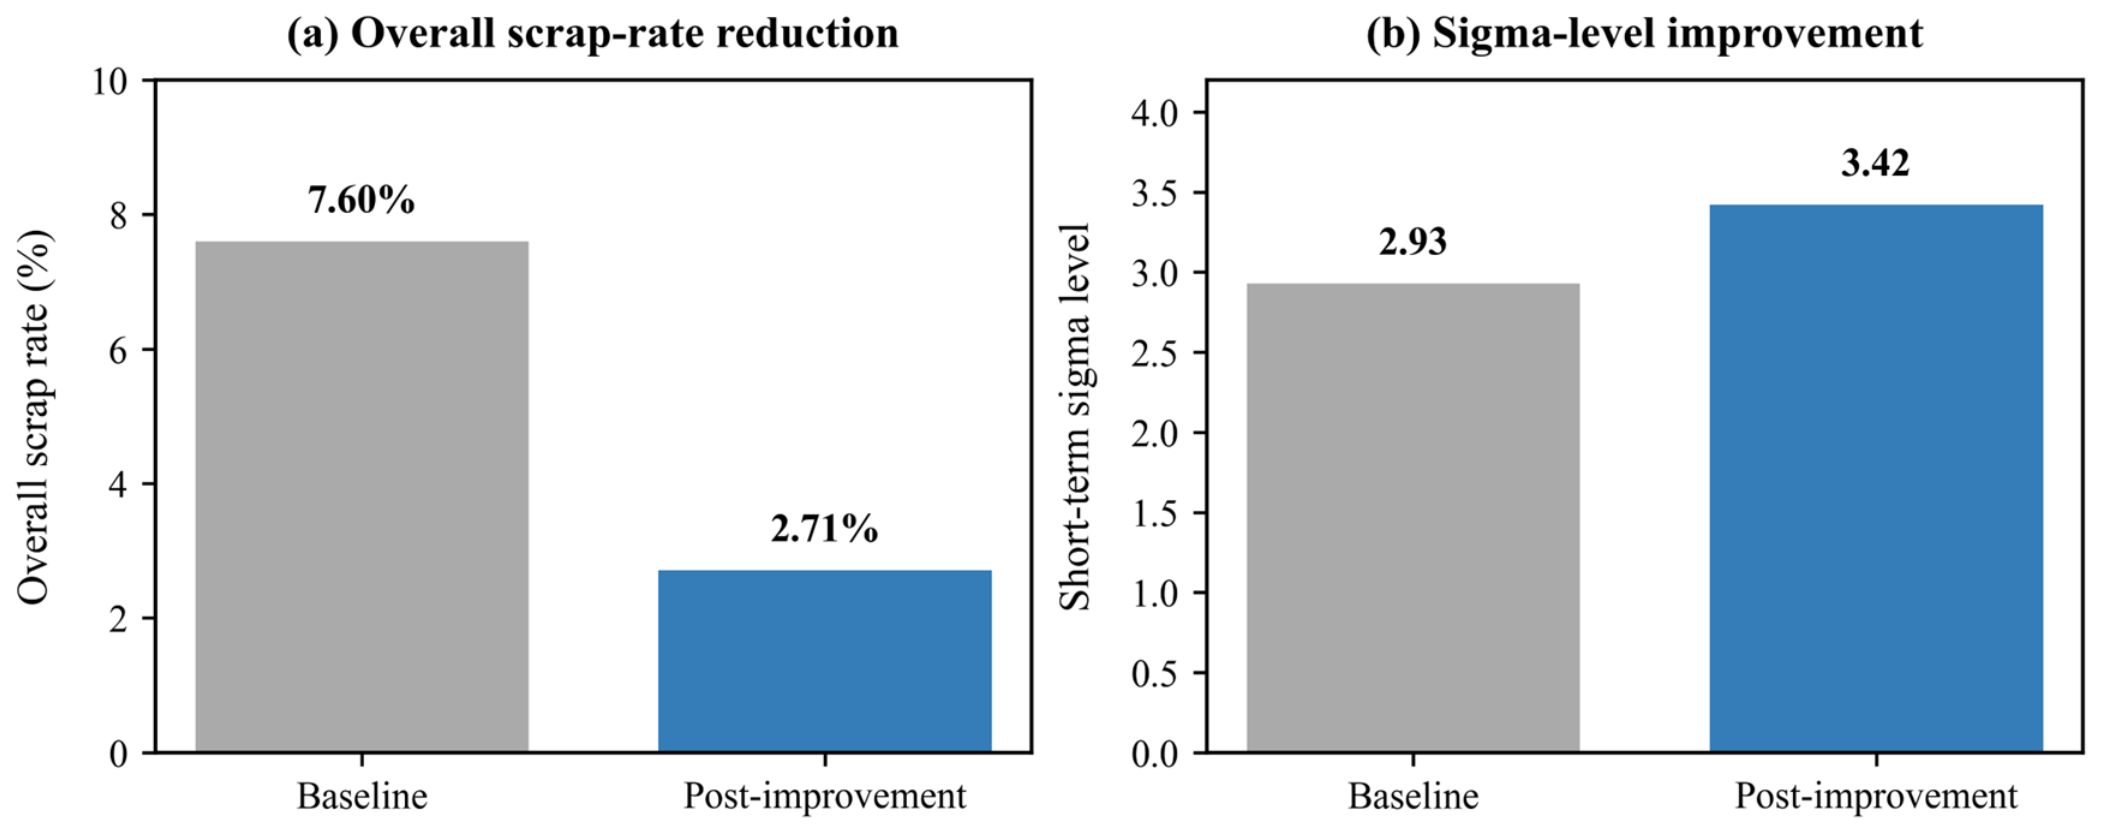
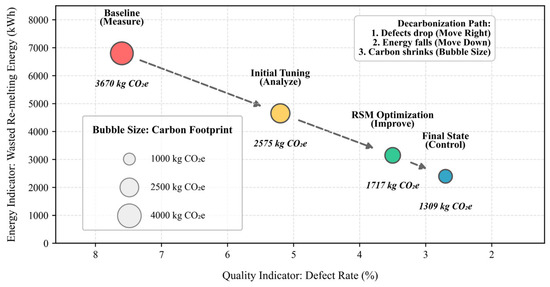
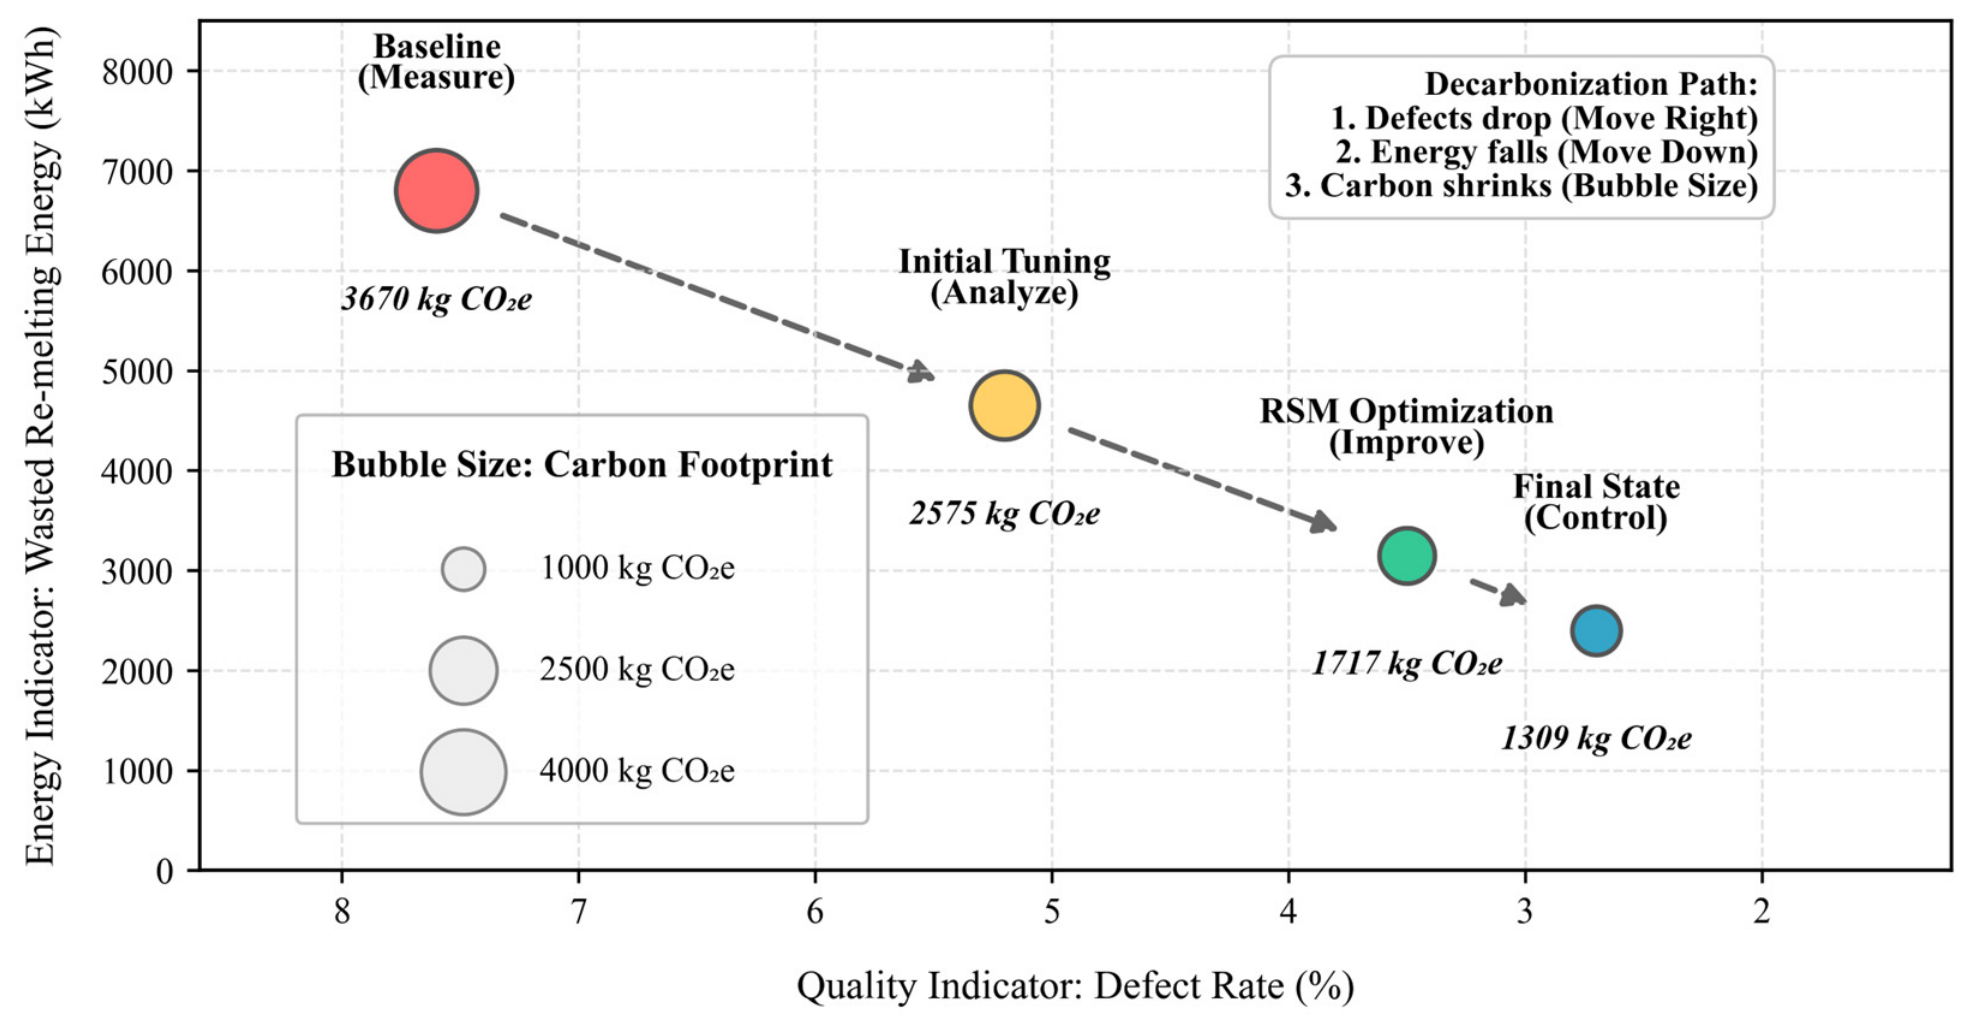

Disclaimer/Publisher’s Note: The statements, opinions and data contained in all publications are solely those of the individual author(s) and contributor(s) and not of MDPI and/or the editor(s). MDPI and/or the editor(s) disclaim responsibility for any injury to people or property resulting from any ideas, methods, instructions or products referred to in the content. |
© 2026 by the authors. Licensee MDPI, Basel, Switzerland. This article is an open access article distributed under the terms and conditions of the Creative Commons Attribution (CC BY) license.