


Abstract
Smart energy meters are widely deployed electronic terminals. Under large-scale deployment and long-term operation, their life cycle carbon emissions can become significant. Based on the life cycle assessment (LCA) framework, this review critically examines the life cycle carbon-emission characteristics and mitigation pathways of smart energy meters. Particular attention is given to system boundaries, data requirements, stage-specific hotspots, and cross-stage trade-offs. Representative studies indicate that use-stage electricity can account for approximately 70.1–88.5% oflife cyclee GWP. However, the dominant stage varies with electricity mix, service life, product configuration, and assessment boundary. Accordingly, mitigation priorities should include reducing operating power and communication demand, lowering the embodied carbon of printed circuit boards (PCBs), printed circuit board assemblies (PCBAs), and key electronic components, extending reliable service life, and improving end-of-life recovery. This review also distinguishes direct meter-level emissions from indirect system-level benefits. Key future needs include standardized accounting rules, component-level carbon data, anlife cyclele-based mitigation assessment.
1. Introduction
With growing attention to product carbon footprints under global climate and decarbonization targets, life cycle emissions from electrical equipment—from raw-material acquisition and manufacturing to operation and end-of-life management—have received increasing attention [1,2]. Smart energy meters are terminal devices for electricity metering, data acquisition, and grid-operation monitoring [3], and their functions have expanded from conventional metering to remote data collection, communication, and operational feedback [4,5]. By the end of December 2022, the number of smart energy meters deployed in China had exceeded 650 million; under an approximately eight-year rotation cycle, annual replacement demand is on the order of 80 million units [6]. Thus, although an individual meter has relatively low mass and operating power, large-scale deployment, long service periods, and periodic replacement can amplify material consumption, embodied carbon, operational emissions, and end-of-life impacts [7,8,9]. Quantifying these sources within a consistent life cycle boundary and identifying effective mitigation priorities are therefore important for low-carbon smart-meter development.
Life-cycle assessment provides a systematic approach to the issues outlined above [10]. ISO 14040 [11], ISO 14044 [12] and ISO 14067 [1] provide guidance on aspects such as principles for life cycle assessment, implementation requirements and frameworks for the quantification of the carbon footprint of products. The GHG Protocol Product Standard, the PAS 2050 and the EU Guidelines on the Environmental Footprint of Products also add to the supply chain, data quality, functional units and reporting rules [13]. These standards and methods consistently emphasize life cycle-based assessment, with clearly defined functional units, system boundaries, data requirements, and reporting rules. For smart energy meters, parameters such as functional units, system boundaries, background databases, service life, operating power consumption, and recycling assumptions may all affect the carbon footprint results. Therefore, it is necessary to identify the emission reduction priorities at different stages within a unified evaluation framework.
Research on the carbon footprint of electrical equipment provides an important methodological basis for smart-meter assessment. Existing reviews have mainly addressed transmission and distribution equipment or electrical equipment more broadly, with emphasis on life cycle accounting methods, system boundary definition, and mitigation assessment [14,15]. Smart-meter research has gradually progressed from technical and operational evaluation toward product- and system-level environmental assessment. Earlier work quantified the energy and resource requirements of smart-metering equipment [16], while subsequent LCA studies directly compared smart and conventional meters. For example, Rizwan et al. [7] reported climate-change impacts of 7.60 kg CO2-eq for a smart meter and 9.61 kg CO2-eq for a conventional meter. More recent studies have further focused on product-level carbon-footprint accounting for single-phase and household smart electricity meters [17]. Despite this progress, the literature remains fragmented across product cases, digital infrastructure, and broader power-equipment assessments. Smart-meter-specific features—including high electronic-component intensity, miniaturization, mass deployment, continuous online operation, and periodic replacement—have not been synthesized sufficiently. In addition, cross-stage trade-offs and the distinction between direct meter-level carbon mitigation and indirect system-level energy-saving benefits have not been sufficiently synthesized. Therefore, it is necessary to further systematically sort out the carbon emission sources and emission reduction paths of the full life cycle of smart energy meters by combining their product structure, operation mode, and retirement and recycling attributes.
From a life cycle assessment perspective, this review aims to develop a systematic framework for identifying life cycle carbon-emission characteristics and mitigation priorities for smart energy meters. Firstly, the product structure and operational characteristics of smart meters are combined to address life cycle boundaries, functional units, data requirements, and uncertainty sources. Secondly, carbon-emission characteristics are reviewed across the manufacturing, use, and end-of-life stages. The main pathways toward low-carbon smart energy meters are then summarized, including optimization of materials and components during manufacturing, low-power operation and smart operation and maintenance during use, and circular-economy practices and end-of-life recovery. Finally, future research needs are proposed for consistent accounting boundaries, improved carbon data for key components, low-carbon supply-chain collaboration, and cross-stage assessment of mitigation benefits. Different from broader reviews of electrical equipment, this review focuses specifically on the electronic, continuously operating, and mass-deployed characteristics of smart energy meters. It also emphasizes cross-stage trade-offs and distinguishes direct meter-level carbon mitigation from indirect system-level benefits.
2. Evaluation Framework for Life Cycle Carbon Mitigation of Smart Energy Meters
2.1. LCA Methodology and Functional Unit
Life cycle assessment (LCA) provides a systematic framework for quantifying the life cycle carbon emissions of smart energy meters. The assessment generally comprises four steps: goal and scope definition, life cycle inventory analysis, life cycle impact assessment, and interpretation, as summarized in Figure 1. These four phases form the methodological backbone of the framework, while smart-meter-specific life cycle data and quality-control feedback are integrated around this backbone. Within a consistent system boundary, LCA can identify major emission sources, support hotspot identification, and compare alternative mitigation options.
Figure 1.
Integrated iterative LCA framework for smart energy meters, showing the forward LCA workflow, life cycle inventory-data integration, and quality-control feedback loop.
For smart energy meters, the primary evaluation target is the life cycle carbon footprint of the meter itself, expressed as the global warming potential (GWP) associated with material and component production, manufacturing and assembly, transportation, operation and maintenance, and end-of-life treatment. The assessment should primarily identify the total life cycle carbon footprint, the contribution of individual life cycle stages, and the carbon-reduction potential of alternative design or operating strategies. In this review, indirect system-level benefits, such as demand response, load shifting, and user-side electricity savings, are excluded from the product carbon footprint of the smart meter. If these benefits are evaluated under an expanded system boundary, they should be reported separately from meter-level emissions and should not be directly used as carbon credits against the meter footprint. The same boundary principle applies to shared digital infrastructure. Gateways, communication-network equipment, master stations, cloud servers, and data-center resources should be treated as a separate enabling layer unless their embodied and operational emissions are explicitly allocated to the smart meter under the defined functional unit.
Accordingly, the functional unit should not be defined simply as “one smart energy meter”. A more appropriate functional unit is “one smart energy meter providing the required electricity metering, information acquisition, display, and communication services over a defined reference service life under specified operating conditions.” The reference conditions should include, where applicable, the accuracy class, rated current, communication mode and frequency, installation environment, operating power, and service life. This service-based functional unit allows material use, manufacturing, operating electricity, maintenance and replacement, and end-of-life treatment to be compared on a consistent basis. When comparing different types of intelligent electricity meters, it is also necessary to unify the accuracy level, rated current, communication method, design lifespan and installation scenarios to avoid mistakenly interpreting functional differences as carbon emission reduction differences.
Given that smart energy meters have the characteristics of long-term online operation and batch deployment, parameters such as stage power consumption, design lifespan, maintenance frequency, recovery rate, and grid emission factors may significantly affect the carbon footprint results [18]. Therefore, in addition to presenting the baseline scenario, relevant studies should also conduct sensitivity analyses on these key parameters to enhance the reliability and comparability of the evaluation results [19].
The proposed framework integrates the major life cycle stages of smart energy meters with the core steps of LCA. Goal and scope definition establishes the evaluation objective, functional unit, system boundary, and key assumptions. Within the defined system boundary, manufacturing, use and O&M, and end-of-life constitute the principal life cycle stages. Stage-specific BOM and activity data are combined with applicable emission factors in the inventory-data integration module and subsequently incorporated into the LCI. The resulting inventory is translated through LCIA into stage-specific and total GWP, which supports hotspot identification, mitigation comparison, and priority setting. Data-quality evaluation, uncertainty analysis, and sensitivity/scenario analysis form a quality-control loop for testing the robustness of the results and refining the scope, inventory data, assumptions, and mitigation priorities. This integrated and iterative structure is summarized in Figure 1.
2.2. Life Cycle Stages and System-Boundary Definition
Based on the evaluation target and functional unit defined above, the system boundary should be specified according to the purpose of the assessment. The manufacturing, use and O&M, and end-of-life modules shown in Figure 1 are therefore included according to the selected system boundary. In this review, two nested boundaries are distinguished, as illustrated in Figure 2. The cradle-to-gate boundary covers raw-material acquisition, component production, printed circuit board (PCB) fabrication, printed circuit board assembly (PCBA), final meter production, packaging, and logistics. The cradle-to-grave boundary extends this scope to installation, operation, and maintenance and end-of-life dismantling, recycling, and disposal [20,21,22,23,24,25]. The cradle-to-gate boundary is suitable for product carbon-footprint disclosure and procurement comparison, whereas the cradle-to-grave boundary is required when evaluating operating-energy effects, service-life extension, and recycling benefits. Unless otherwise stated, the discussion of life cycle carbon mitigation in this review refers to the cradle-to-grave boundary.
Figure 2.
Life cycle stages and carbon-footprint system boundaries of smart energy meters.
2.3. Data Requirements and Uncertainty in Carbon-Mitigation Assessment
Reliable life cycle carbon-mitigation assessment of smart energy meters requires inventory data at sufficient product, component, and process resolution. Studies of electronic and ICT products show that embodied carbon, supply-chain opacity, and the environmental burdens of key electronic components are major sources of uncertainty in hotspot identification [26]. Accordingly, smart-meter assessment should not rely only on total product mass or the quantities of a few bulk materials. A whole-product bill of materials (BOM), component-level inventory, and key process data should be combined so that carbon-intensive components and operations can be identified explicitly.
The LCA data of the electric energy meter can be classified into three categories. The first category is the enterprise’s actual measurement data, which includes the bill of materials (BOM), material quality, PCB area and layer count, SMT yield rate, process power consumption, aging test time, average operating power consumption, failure rate and recovery rate, etc. This type of data is highly representative and should be used as the primary data source. The second category is database and literature data, including material emission factors, power emission factors, PCB manufacturing process data, semiconductor device background data and electronic waste disposal data, which can be used as supplements when actual measurement data is insufficient. The third category is estimated or expert judgment data, mainly used for suppliers’ processes that are difficult to directly obtain, chip manufacturing nodes, waste PCB processing efficiency and future recycling scenarios, but this type of data has higher uncertainty and should be explained through sensitivity analysis.
The uncertainty mainly comes from four aspects. First, the data of the supply chain is opaque, which makes it difficult to accurately account for the hidden carbon of outsourced components such as chips, PCB substrates and communication modules. Secondly, the functional boundaries are not unified, and different studies may set different boundaries for communication frequency, maintenance and replacement, system energy-saving benefits, and recycling returns. Thirdly, the power emission factors and recovery rates vary by region, affecting the results in the usage stage and the end-of-life stage. Fourthly, product design iterations are rapid, and BOM versions, component replacements, and supplier changes can lead to the rapid invalidation of the database. Therefore, the carbon footprint assessment of electric energy meters should simultaneously provide the main assumptions, data quality grades, and sensitivity parameters [27].
Accordingly, the carbon emission reduction analysis of the entire life cycle of smart energy meters should be based on detailed, transparent and traceable data. Compared with the rough judgment based on the quality of the whole machine or the amount of a few materials, the component-level list, the measured data of the enterprise and the key process parameters are more helpful to identify the real emission hotspots and judge the actual effect of different emission reduction measures. Uncertainties caused by missing supply chain data, differences in boundary assumptions, and variations in regional parameters should be explained through data quality evaluation and sensitivity analysis to improve the reliability and comparability of emission reduction path identification.
To clarify the relationships among data sources, inventory development, carbon accounting, and uncertainty evaluation, Figure 3 presents a traceable data-to-decision workflow for smart energy meters. Primary measured data, database and literature data, and estimated or expert data are first consolidated into a component- and process-level inventory. The inventory is then assigned to the manufacturing, use and O&M, and end-of-life stages according to the defined system boundary and key assumptions. Activity data and emission factors are subsequently used to calculate stage-specific and total GWP. Data quality and uncertainty are then evaluated in terms of representativeness, completeness, boundary assumptions, and emission-factor uncertainty, followed by sensitivity or scenario analysis of key parameters. These results support hotspot identification and mitigation prioritization. If dominant uncertainty remains, the system boundary, key assumptions, and inventory data should be revised iteratively before the final mitigation priorities are determined.
Figure 3.
Data-input, carbon-accounting, uncertainty-evaluation, and iterative decision workflow for smart energy meters.
3. Carbon-Emission Characteristics Across Life Cycle Stages
Published studies report substantial differences in the life cycle impacts of smart meters and related intelligent metering systems because their functional units, hardware configurations, service lives, electricity mixes, and system boundaries differ. Table 1 summarizes representative quantitative evidence. Product-level and system-level values are therefore presented for comparison but should not be interpreted as directly interchangeable.
Table 1.
Representative quantitative studies on smart meters and related energy-management systems.
Two recent LCA studies provide quantitative evidence for the carbon impacts of smart metering. Wohlschlager et al. [34] reported annual climate-change impacts of approximately 36–59 kg CO2-eq per household for German smart metering infrastructure, with a medium scenario of about 47 kg CO2-eq year−1. Bai et al. [35] further conducted a cradle-to-gate carbon-footprint assessment of single-phase smart electricity meters and other electrical equipment. These studies demonstrate that the reported carbon footprint varies considerably with system boundary, hardware configuration, electricity mix, and service conditions.
Overall, the available studies do not support a single fixed life cycle hotspot ranking. The relative importance of manufacturing and use-stage emissions varies with product configuration, service life, electricity mix, and system boundary, while end-of-life benefits depend strongly on recycling assumptions. Therefore, mitigation approaches should be compared under consistent functional units and boundaries rather than evaluated solely from individual case results.
3.1. Carbon Emissions During Manufacturing
Manufacturing-stage emissions arise mainly from raw-material and component production, PCB/PCBA fabrication and assembly, and final-product manufacturing. The carbon intensity per unit mass of different materials and components varies significantly, so merely judging the carbon emission hotspots based on the proportion of mass is not sufficient. Aleksic et al. [16] conducted a heat-of-combustion life cycle assessment using the REX2 smart electricity meter as the object, comparing the quality proportions of different materials/components and their contributions to the acquisition of raw materials and the manufacturing and assembly stages. The results showed that the plastic housing is an important source of heat-of-combustion consumption in terms of mass and raw material acquisition, but in the manufacturing and assembly stage, electronic components such as PCBs, integrated circuits, and processors contribute more significantly. This study indicates that the carbon emission hotspots at the manufacturing end of smart energy meters not only depend on the material usage but are also closely related to the complexity of electronic component manufacturing and the assembly process.
Quantitative studies further demonstrate that manufacturing-related impacts can contribute substantially to the life cycle burden. Weigel et al. [30] reported 82 kg CO2-eq from production within a total life cycle footprint of 558 kg CO2-eq over 18 years, corresponding to approximately 14.7%. Gangolells et al. [31] reported that assembly contributed approximately 30–46% of life cycle impacts, compared with 54–70% from the use stage and less than 0.5% from maintenance. These differences highlight the strong influence of system boundary, service life, and product configuration on the relative importance of manufacturing.
The plastic housing and metal components are the most obvious material inputs in smart energy meters. Shell materials usually need to meet requirements such as flame retardancy, insulation, heat resistance, weather resistance and mechanical protection. Their carbon emissions are mainly related to the type of resin, flame retardant system, material dosage and processing process [36]. Martins et al. [33] took the polycarbonate components of smart energy meters as the object and compared the environmental performance of the original polycarbonate/10% glass fiber material under different recycled material ratios and end-of-life treatment methods. The results showed that the scenario with 100% recycled material and complete recycling performed the best, while the scenario with 100% original material and landfill treatment performed the worst. This study indicates that the low carbonization of the plastic housing of electricity meters should not only focus on weight reduction but also consider the resin source, reinforcing materials, recycled material ratio, and end-of-life recycling method comprehensively. Metal parts mainly include terminals, conductors, relay contacts, screws and small transformers, etc. Their carbon emissions are affected by factors such as the type of metal, material source, processing method and coating treatment. Due to these components being subject to constraints such as electrical safety, contact resistance, temperature rise, and mechanical lifespan, their emission reduction potential needs to be comprehensively evaluated among material substitution, structural optimization, and reliability requirements [37].
PCB/PCBA is the part with the most characteristic features of electronic products in the manufacturing end of intelligent electricity meters. Its influence is not only derived from the amount of materials such as FR-4 glass fiber reinforced epoxy resin substrate, copper foil, and solder but also closely related to the PCB manufacturing process, including electroplating, etching, drilling, cleaning and surface treatment, as well as the PCBA process, including SMT placement, through-hole assembly, soldering and testing. Zhang et al. [9] conducted a PCB/PCBA life cycle assessment for micro-electronic products like smartwatches and TV remote controls, finding that the environmental impact of high-integration electronic products is mainly influenced by the IC production process, while simpler-structured electronic products are more susceptible to the influence of the FR-4 glass fiber epoxy substrate. This result indicates that the carbon emission hotspots of PCB/PCBA manufacturing end will change with the complexity of product functions, component density and substrate type. Therefore, in the carbon accounting of the intelligent electricity meter manufacturing end, PCB/PCBA should not be simply estimated as ordinary materials by quality but should further consider the differences in IC, substrate, welding and assembly processes.
The production stage of the complete machine mainly includes the assembly and integration of components such as PCBA boards, shells, metal terminals, power modules, communication modules and display units, as well as processes such as parameter writing, functional verification, aging tests, sealing and packaging for warehousing. This stage is usually directly controlled by manufacturing enterprises, and the data availability is relatively high. Therefore, it is an important link for conducting process energy consumption accounting and process optimization. However, smart energy meters are considered measuring instruments, and energy conservation at the production end cannot be achieved at the expense of reducing reliability and measurement stability. If early failure occurs due to shortening the aging test or simplifying the verification process, subsequent rework, replacement and operation emissions may offset the short-term energy-saving benefits.
3.2. Carbon Emissions During the Use Stage
The usage stage is a phase in the entire life cycle of an electric energy meter that has a long-term cumulative effect. Although the operating power of a single electric energy meter is relatively low, its long-term continuous operation and large-scale deployment will amplify the minute power consumption differences [38]. Therefore, emission reduction during the usage stage should not only focus on the rated power consumption, but also consider the actual operating mode, communication frequency, display status, temperature environment, design lifespan, and grid emission factor [39].
Quantitative evidence confirms the potential importance of the use stage. Gangolells et al. [31] reported that the use stage accounted for approximately 54–70% of the life cycle impacts of an intelligent energy-management system, compared with 30–46% from assembly and less than 0.5% from maintenance. Although these percentages depend on the system boundary, service life, electricity mix, and operating conditions, they demonstrate that cumulative electricity consumption during long-term operation can become a major life cycle contributor.
From the perspective of the product itself, the power consumption during the usage stage mainly comes from the metering chip, MCU, power module, communication module, display unit and auxiliary circuit. Low-power metering chips and MCUs can reduce static current and standby power consumption; efficient power modules can improve light-load efficiency and reduce idle losses; the display module can adopt strategies such as on-demand illumination, low-power backlighting or electronic paper; at the firmware level, task scheduling, peripheral sleep and abnormal wake-up management can reduce ineffective power consumption. The communication module is an important source of energy consumption, which distinguishes smart meters from conventional ones. If the data coverage and frequency of reporting continue to increase, the final energy consumption and data processing workload may also increase.
For use-stage accounting, the operating electricity consumption of a smart energy meter should preferably be based on measured operating power rather than rated power alone. IEC 62052-11:2020 [40] includes requirements for meter power consumption, relevant test conditions, measurement uncertainty, and repeatability. Accordingly, input power can be recorded using calibrated electrical measurement equipment under representative operating states, such as normal metering, standby, display activation, and communication/transmission. The time-weighted average operating power can be expressed as
where Pi is the measured input power under operating state i, and fi is the fraction of total operating time spent in that state (Σ fi = 1).
The cumulative electricity consumption over the service life is then calculated from the average power and operating time:
In accordance with the GHG Protocol Product Life Cycle Accounting and Reporting Standard and ISO 14067, product carbon-footprint quantification should be based on life cycle activity data and appropriate emission factors [41,42]. Therefore, the use-stage carbon footprint can be calculated as
where Euse is the life cycle electricity consumption (kWh), L is the service life (years), and EF grid is the applicable electricity grid emission factor (kg CO2-eq kWh−1). The factor 8760 represents 24 h day−1 × 365 days year−1 and therefore assumes continuous operation. The GHG Protocol recommends using electricity emission factors that are geographically representative of the electricity source used in the product inventory. To avoid conflating product-level emissions with broader digital-system effects, the use-stage accounting boundary distinguishes direct meter-level emissions, enabling digital infrastructure, and indirect system-level benefits, as illustrated in Figure 4.
Figure 4.
Accounting boundaries among direct meter-level emissions, enabling digital infrastructure, and indirect system-level benefits during the use stage.
3.3. Carbon Emissions During End-of-Life Recycling
The end-of-life stage generates emissions from collection, transportation, dismantling, and treatment, while material recovery may provide credits by avoiding primary production. A model-specific carbon-footprint study provides a quantitative reference. For one DDZY285-M single-phase smart energy meter, a third-party-verified cradle-to-grave assessment reported a total life cycle footprint of 50.67 kg CO2-eq. Waste transportation at the end of life contributed 0.140 kg CO2-eq per meter, corresponding to approximately 0.28% of the total footprint. The scenario assumed transportation of the discarded meter for 1000 km by a 16–32 t EURO5 truck [43]. However, dismantling, material recycling, and final-treatment energy were not separately quantified. Therefore, this value represents a partial end-of-liefe burden rather than the complete carbon footprint of recycling.
This limitation highlights the need to quantify recycling processes beyond waste transportation. Martins et al. [33] evaluated polycarbonate components from smart electricity meters under different recycled-content and end-of-life scenarios. The scenario combining 100% recycled material with complete recycling showed the best environmental performance, whereas the use of 100% virgin material followed by landfill disposal performed the worst. These results indicate that end-of-life assessment should explicitly consider recycling routes, recovery efficiency, treatment inputs, and avoided primary-material production.
Waste PCBs and PCBAs have high resource value but are among the most difficult fractions of retired smart meters to treat because they contain copper, tin, precious metals, resins, and glass fibers. Improper treatment can cause resource loss and environmental burdens, whereas compliant recycling can recover valuable metals through combinations of mechanical pretreatment, pyrolysis, hydrometallurgical leaching, and refining. Xue et al. [44] performed an LCA of a waste printed-wiring-board metal-recycling chain from liberation and separation through metal refining. Leaching and refining were major contributors to the recycling burden because of energy and chemical consumption, while recovered metals provided benefits by displacing primary production. More recently, Nan et al. [45] combined process simulation with LCA to compare hydrometallurgical recycling routes for waste PCBs, further demonstrating that the choice of treatment route can substantially affect the environmental performance of metal recovery.
The end-of-life performance is also closely linked to decisions made during product design. Permanent adhesives, irreversible composite structures, and unclear material labeling increase the difficulty of dismantling and reduce recovery efficiency [46]. As illustrated in Figure 5, design-stage measures and LCA accounting parameters play different roles in end-of-life assessment. Material labeling, detachable connections, and reduced use of permanent adhesives primarily influence dismantling, sorting, and subsequent material recovery. In contrast, recovery rate, recycling yield, treatment inputs, and allocation rules are incorporated into the end-of-life LCA inventory. The associated transport, energy use, chemical consumption, and residual disposal constitute environmental burdens, whereas recovered materials may provide recycling credits by avoiding primary-material production. The balance between these burdens and credits determines the net end-of-life carbon impact.
Figure 5.
LCA-oriented end-of-life accounting framework for smart energy meters, including recycling burdens and avoided-production credits.
The quantitative evidence reviewed above provides the basis for the mitigation pathways discussed in Section 4. Manufacturing-related impacts can account for a substantial share of life cycle emissions, while long-term operation may become dominant in some systems. End-of-life impacts depend strongly on transportation, treatment routes, recovery efficiency, and avoided primary-material production. Therefore, the mitigation pathways discussed below are not intended as a universal ranking, but as stage-specific strategies that should be prioritized according to product-specific LCA results and identified carbon hotspots.
4. Life Cycle Carbon-Mitigation Pathways for Smart Energy Meters
Based on the stage-specific carbon-emission evidence summarized in Section 3, the following mitigation pathways are organized around the main controllable sources of life cycle impacts rather than presented as a fixed priority ranking.
4.1. Coordinated Optimization of Manufacturing-Stage Materials and Components
Coordinated optimization of materials and components in smart-meter manufacturing should begin at product design and extend through material selection, component configuration, PCB/PCBA design and manufacturing, assembly, reliability testing, and end-of-life disassembly. The relevant measures can be grouped into four areas: optimization of materials and structures; low-carbon selection of key electronic components; PCB/PCBA ecodesign and green manufacturing; and coordinated optimization of assembly, reliability, and disassemblability (Figure 6). Because smart energy meters must satisfy stringent requirements for metrological accuracy, electrical safety, environmental adaptability, and long-term reliability, manufacturing-stage mitigation cannot be reduced to material minimization or lower process energy alone. Alternative designs should instead be compared on the basis of their net life cycle mitigation benefits.
Figure 6.
Coordinated optimization pathways for materials and components during smart electricity meter manufacturing.
For materials and structures, plastic housings and metal parts are the principal targets for optimization. Material-related emissions from housings can be reduced through structural lightweighting, increased recycled content, and improved flame-retardant systems. Maga et al. [36] compared the environmental impacts of different flame-retardant systems in engineering plastics for electronic equipment and found that the type of flame retardant can substantially alter environmental performance. Housing-material selection should therefore consider not only resin consumption but also flame retardancy, insulation, weatherability, processability, and service life. Metal terminals, conductors, relay contacts, and small current transformers can be optimized in terms of material sourcing, structural dimensions, plating thickness, and processing methods. Metal reduction, however, must not compromise contact resistance, temperature rise, mechanical strength, or electrical safety. Redundant material should be minimized only after functional requirements have been satisfied, while recycled and low-carbon metals should be progressively introduced into the supply chain.
For key electronic components, low-carbon selection should jointly consider manufacturing-related embodied carbon, use-stage power consumption, reliability, and supply-chain stability. Pirson et al. [47] systematically analyzed the environmental footprint of integrated-circuit production and showed that the impacts are closely related to process node, environmental burden per unit area, chip integration, and growth in total silicon area. The carbon performance of metering chips, MCUs, and communication chips, therefore, cannot be judged solely from component count or integration level. The size of the chips, packaging format, production complexity, operating power, failure rate and availability of data in the supply chain should also be taken into account. For smart meters that remain online for a long time, low-quiescent metering chips, high-efficiency light-load modules and low-energy communication modules can provide long-term mitigation benefits. Excessive integration, however, may reduce repairability or require replacement of an entire board after a localized failure, thereby increasing resource consumption during maintenance and at end of life. Zikulnig et al. [48] further identified the silicon chip required for data communication as an environmental hotspot in a printed sensor system, indicating that communication-related electronic components should also be considered in component-level carbon assessment.
PCB/PCBA is a key target for low-carbon design during smart electricity meter manufacturing. Board-level optimization should first address PCB area, layer count, copper thickness, hole count, component layout, and panel utilization. Reducing unused board area, consolidating redundant interfaces, optimizing module placement, and improving panel yield can directly lower substrate and copper consumption. Layer-count decisions must also balance electromagnetic compatibility, heat dissipation, insulation distances, and manufacturing complexity. Although multilayer boards may reduce board area and improve interference resistance, they require additional lamination, drilling, electroplating, and inspection. Scenario-based assessment is therefore needed to compare the net mitigation effects of alternative board designs.
Substitution of PCB substrates has also received considerable attention. Farkas et al. [49] prepared flame-retardant poly(lactic acid)/flax-fiber composite PCB substrates and assembled and tested circuits of different complexity. The substrates offer potential environmental benefits, but their thermal stability, mechanical strength and reliability when soldered require further testing. Géczy et al. [50] subsequently implemented a microcontroller circuit on this type of substrate, demonstrating the potential of bio-based boards to support embedded electronics. Nassajfar et al. [51] compared conventional FR-4, polymer composites, paper-based materials, and printed conductive solutions and found that PCB impacts depend not only on substrate type but also on conductive materials, manufacturing processes, electricity sources, and metal-recovery rates. Honarbari et al. [52] validated a thermoformable PCB based on renewable materials and likewise showed that emerging substrates must satisfy both processing and use requirements. More recently, Harwell et al. [53] developed a biodegradable zinc-based PCB architecture and reported a 79% reduction in GWP relative to a conventional fiberglass–copper PCB, while also enabling the recovery of high-value electronic components. In the near term, the more practical approach is to optimize conventional PCB structures, improve material utilization, and promote lower-carbon FR-4 production and green electricity. In the medium and long term, bio-based, degradable, and recyclable PCB materials may be explored after systematic reliability verification.
These material-reduction and substitution strategies may introduce trade-offs in durability, reliability, and production cost. Higher recycled-material content can reduce embodied carbon, but material variability may affect mechanical properties, flame retardancy, and processing consistency. Structural lightweighting can reduce material consumption, whereas excessive reduction may compromise mechanical protection, insulation distance, or long-term durability. Bio-based PCB substrates can provide environmental benefits, but their thermal stability, moisture resistance, soldering compatibility, and long-term electrical reliability require further verification. Recent studies on renewable and biodegradable PCB substrates therefore combine environmental assessment with thermal, mechanical, electrical, and process-reliability testing before considering practical application [49,50,51,52,53].
A practical way forward is therefore to adopt a staged screening and qualification strategy. Candidate recycled materials, lightweight structures, and alternative PCB substrates should first be screened through scenario-based LCA to identify designs with meaningful whole-life carbon benefits. These candidates should then undergo application-specific qualification for mechanical protection, flame retardancy, insulation, thermal and moisture resistance, soldering compatibility, and long-term electrical reliability. Only alternatives that satisfy these requirements should proceed to pilot-scale manufacturing and cost assessment. The final design should be selected according to net life cycle carbon reduction under equivalent functional performance and service life, rather than material carbon reduction alone. This approach allows conventional material optimization to be implemented in the near term while progressively introducing recycled and bio-based alternatives as their reliability and manufacturing readiness are demonstrated.
In PCB manufacturing and PCBA, mitigation should focus on improving process yield, reducing material losses, recovering copper, decreasing cleaning water and chemical consumption, and increasing the share of low-carbon electricity. Chou et al. [54] applied material-flow analysis and material-flow cost accounting to copper recovery in PCB manufacturing and found that material losses increase both environmental burdens and hidden production costs. In-plant copper recovery can reduce external treatment demand and improve resource utilization. PCB manufacturers should therefore minimize defects in cutting, drilling, etching, electroplating, and solder-mask processes and strengthen the recovery of copper-bearing waste liquids and offcuts.
PCBA and final-product manufacturing should jointly consider equipment efficiency, production-line takt time, quality stability, and energy sources. Reflow soldering, surface mounting, through-hole assembly, inspection, and aging tests can all generate sustained energy demand. Xia et al. [55] proposed a digital-twin-based method for real-time energy optimization of production lines that incorporated equipment status, production rhythm, and fault disturbances into scheduling, demonstrating that data-driven production management can reduce energy consumption per unit product. For smart electricity meter production lines, emissions can be lowered by optimizing reflow temperature profiles, reducing equipment idling, decreasing standby power of test systems, improving first-pass yield, and limiting rework. Distributed photovoltaics and green-electricity procurement can further reduce electricity-related manufacturing emissions. These savings must not be achieved by shortening necessary tests or compromising product quality; otherwise, early failures, repairs, and batch replacement may offset upstream benefits.
Production and assembly optimization should also account for product reliability, repairability, and end-of-life disassemblability. Yan et al. [56] proposed a Solderless PCB, which replaces conventional solder joints with detachable three-dimensional-printed retaining structures, allowing surface-mounted components to be removed and reused during PCB prototyping. Although this approach currently targets prototyping and interactive electronic design, it indicates that reducing irreversible joining, improving component detachability, retaining board-level design information, and strengthening PCB identification and traceability can increase the reuse potential of electronic assemblies. For smart energy meters, manufacturing-stage mitigation should combine process energy savings with quality stability and reliability verification. Excessive simplification of assembly or testing must not reduce metrological stability or increase early failures and repair-related emissions.
Overall, manufacturing-stage mitigation for smart energy meters requires coordinated consideration of materials and structures, key electronic components, PCB/PCBA design and manufacturing, and assembly and reliability. Subject to metrological accuracy, electrical safety, and long-term reliability, LCA should be used to compare manufacturing-stage emission reductions, use-stage energy savings, service-life extension, and end-of-life resource-recovery benefits, thereby preventing environmental burdens from being shifted from one life cycle stage to another.
4.2. Low-Power Operation and Smart Operation and Maintenance During the Use Stage
Use-stage mitigation centers on reducing long-term online power consumption and extending reliable service through smart operation and maintenance (O&M). Metering chips, MCUs, power-supply modules, communication modules, displays, and auxiliary circuits all contribute to operating demand, which is also affected by sampling intervals, communication and reporting strategies, firmware task scheduling, and environmental conditions. As shown in Figure 7, low-carbon operation should coordinate low-power device design, communication and edge optimization, lifetime management, and smart O&M. However, edge computing and communication optimization are not inherently low-carbon. Additional processors, memory, gateways, and communication modules increase embodied carbon during manufacturing, while high-frequency data acquisition and transmission may also increase terminal power consumption [8]. Therefore, their benefits should be evaluated on a life cycle basis by comparing the added hardware and operating burdens with the energy savings achieved through reduced transmission or local processing. Wagih et al. [57] similarly applied life cycle assessment to wireless RF systems, providing a comparative framework for evaluating the environmental impacts associated with wireless hardware and communication technologies. This further supports the need to assess smart-meter communication strategies beyond terminal operating power alone.
Figure 7.
Coordinated mitigation pathways for low-power operation and smart O&M during the use stage.
At the system level, this assessment should also consider the infrastructure required to support data transmission and processing, including gateways, communication networks, master stations, cloud platforms, and data centers. Their impacts may include both embodied emissions from additional hardware and operational emissions from communication, storage, and computation. Because these resources are usually shared by many meters, their emissions should not be directly assigned to a single meter without an explicit allocation rule.
At the device and communication levels, Kumari et al. [58] developed an energy-efficient smart-metering system based on edge computing and a LoRa network. Time-series data were compressed at the edge, and LoRa spreading-factor selection was optimized, reducing transmission energy and communication delay. The study shows that use-stage mitigation should not rely solely on low-power hardware; local data processing, communication-parameter optimization, and network-transmission strategies should be evaluated together. Huang et al. [59] further proposed an edge-computing framework for real-time user-side energy monitoring and optimization. Data acquisition, feature extraction, and local decision-making were performed at edge nodes, reducing the communication overhead and response delay associated with centralized cloud processing. Low-power metering chips, low-quiescent-current MCUs, high-light-load-efficiency power supplies, sleep/wake communication, on-demand displays, and firmware-level power management are therefore major routes for reducing meter-level operating emissions. For a large installed base, even a small reduction per unit can generate substantial cumulative benefits over the service life.
Communication strategies should balance data value against terminal energy consumption. Smart-meter data can support high-resolution load identification, anomaly detection, demand response, and distribution-system optimization. Higher data granularity and more frequent communication, however, increase terminal-side acquisition, storage, and transmission loads as well as platform-side processing demand. Wang et al. [60] reviewed artificial-intelligence methods for load forecasting, anomaly detection, and demand response and concluded that data-driven approaches can support demand-side energy optimization and grid-operation decisions, although their performance depends on data quality, feature extraction, and deployment conditions. Hernández et al. [61] used household electricity data from commercial smart meters to develop short-term alert models to detect anomalies in everyday activities, comparing them with recurrent neural nets, convolutional nets, random forests and decision trees. The results confirmed the value of smart meter data for anomaly detection and behavior pattern analysis but also showed that the complexity of the models and the frequency of processing need to be adapted to practical deployment conditions. Therefore, low-power communications design should not simply reduce the frequency of messages. Event-triggered reporting, timed communication, edge processing, priority sending of anomalies, and optimized remote update windows can ensure a better balance between availability of data, reliability of communications, and the terminal. It is therefore necessary to distinguish direct meter-level mitigation from indirect system-level benefits. Accordingly, these indirect benefits are treated as enabling system-level effects rather than avoided emissions of the meter itself. Any assessment that includes them should be presented as a separate system-level scenario with an explicitly defined boundary and baseline.
Consumer acceptance and data governance are also important constraints on smart-meter-enabled mitigation. High-resolution consumption data can support demand response and energy management, but greater data granularity may also raise concerns regarding privacy, data access, and cybersecurity. Such concerns can reduce users’ willingness to accept smart-meter services or participate in data-driven energy programs. Therefore, communication and data-processing strategies should balance energy-management benefits with data minimization, access control, cybersecurity, and transparent data-use rules [62,63,64,65,66].
Life cycle management complements use-stage power reduction by extending reliable service and avoiding premature replacement. Service-life extension can spread upstream embodied emissions over a longer period, provided that metrological accuracy, communication security, data reliability, and operational stability are maintained. Li et al. [67] constructed 25 candidate features for smart-meter group-failure-rate prediction and combined NSGA-II, Jaccard similarity, and XGBoost for multi-objective feature selection, reducing the feature set from 25 to 7 while improving prediction performance. This demonstrates the potential of condition features and online data for fleet-level condition assessment and maintenance decisions. Dong et al. [68] developed a field-data-based method for predicting smart-meter failures and optimizing replacement strategies, indicating that retirement and replacement need not rely solely on fixed cycles. Reliability measures should therefore combine durable components, surge and thermal design, enclosure and weather resistance, PCB moisture robustness, electromagnetic compatibility, and condition monitoring to reduce carbon emissions associated with premature failure, concentrated replacement, and repeated maintenance.
4.3. Circular Economy and End-of-Life Recycling
From a circular-economy perspective, low-carbon development of smart energy meters should not be limited to end-of-life recycling. It should establish a closed-loop pathway covering low-carbon design, green procurement, use and maintenance, end-of-life recovery, and the reintegration of recycled materials. As shown in Figure 8, data and material flows from end-of-life treatment should be fed back to design and procurement to improve product traceability, closed-loop material utilization, and LCA-supported low-carbon decision-making.
Figure 8.
Closed-loop pathway for the circular economy and end-of-life recycling of smart energy meters.
Quantitative comparisons show that a more circular end-of-life route does not necessarily result in a lower carbon footprint. Ahamed et al. [69] compared three end-of-life scenarios for PET packaging incorporating RFID tags. The total GWP values were 111.0, 223.6, and 111.8 g CO2-eq for Scenarios 1–3, respectively, while the corresponding downstream end-of-life contributions were −6.8, +105.8, and −6.0 g CO2-eq. Scenario 2, based on chemical recycling of both PET and RFID components, therefore generated substantially higher impacts than the other two routes because the additional catalyst, electricity, and solvent inputs outweighed part of the avoided-production benefits.
Evidence from waste PCB management provides a closer reference for smart energy meters. Islam and Iyer-Raniga [70] compared an overseas-recycling baseline with alternative local treatment scenarios for waste PCBs. Integrated material and energy recovery showed the best overall environmental performance, whereas landfill and direct energy recovery without material recovery were among the least favorable options. Local material recovery reduced the global warming-related impact by approximately 53% compared with overseas recycling. Smart-meter-specific evidence also supports the importance of end-of-life choices: Martins et al. [33] identified the combination of 100% recycled polycarbonate and complete recycling as the best scenario for smart-meter plastic parts, whereas the combination of virgin material and landfill disposal performed worst.
These comparisons indicate that end-of-life strategies for smart energy meters should not be ranked simply according to whether recycling is implemented. Disposal, material recovery, and high-recovery or closed-loop scenarios should be compared under a consistent functional unit by considering collection and transport, treatment energy and chemical inputs, recovery efficiency, residual disposal, and credits from avoided primary-material production. The preferred route should therefore be selected according to its net life cycle carbon benefit rather than its nominal level of circularity.
The circular-economy perspective emphasizes that low-carbon development cannot end with manufacturing and operation; it requires a closed loop among design, procurement, manufacturing, use, and recovery. Zoka et al. [71] surveyed the perceptions, benefits, barriers, and incentives associated with circular-economy implementation in the electrical and electronic equipment industry. They concluded that circular transition involves not only end-of-life recycling but also corporate strategy, supply-chain coordination, product design, and policy incentives. For smart energy meters, which are electronic metering terminals deployed in large batches, mitigation should therefore shift from isolated stage optimization to cross-stage closed-loop management. Product design should reduce permanent adhesives, avoid irreversible composites, use detachable connections, and provide clear material labels. Procurement should include recycled materials, low-carbon metals and compliant suppliers of PCBs. End-of-life systems should support standardized dismantling, metal recovery, use of waste PCBs and specialized treatment of batteries.
Circular pathways for smart energy meters extend beyond material recycling to modular upgrading, spare-part reuse, returnable packaging, and closed-loop procurement of recycled materials. Yu et al. [72] developed a framework for assessing the sustainability of household e-waste back-end supply chains and analyzed interactions between several factors. The results show that efficient back-up supply chains depend on coordinated optimization of collection networks, cooperation between stakeholders, environmental management and resource recovery efficiency. Moheb-Alizadeh et al. [73] developed a reverse-logistics network model for e-waste systems to assess the economic and environmental effects of take-back legislation across life cycle stages. These studies indicate that large batches of retired smart energy meters require registration, dismantling and sorting, material-flow tracking, and mechanisms for reintegrating recycled materials, rather than simple post-retirement dismantling and disposal.
Ownership also affects the incentives for life cycle mitigation. Because smart meters are commonly procured and managed as utility assets, utilities can coordinate procurement, maintenance, replacement, take-back, and recycling across large meter fleets. This centralized ownership can facilitate standardized collection, component reuse, closed-loop procurement, and condition-based service-life extension. However, these incentives may be weakened by fixed replacement cycles, metrological requirements, technology obsolescence, cybersecurity concerns, and liability for reused components. Therefore, ownership and asset-management rules should be considered together with technical recyclability when designing circular-economy strategies for smart energy meters.
Policy and regulatory instruments can further influence the implementation of life cycle mitigation. Potential instruments include life cycle-based procurement criteria, take-back and recycling requirements, incentives for repair and service-life extension, and data-governance requirements for smart-meter operation. At the same time, metrological certification, interoperability requirements, cybersecurity and data-protection obligations, and established replacement rules may constrain reuse, upgrading, or extended service life. Effective policy should therefore coordinate carbon reduction with product reliability, data security, consumer protection, and end-of-life responsibility rather than treating these objectives independently.
Singh et al. [74] concluded from a systematic review that circular implementation in the electronics industry should integrate reduce, reuse, recycle, remanufacture, redesign, and recover strategies and should further consider closed-loop supply chains, blockchain-enabled traceability, and intelligent reverse logistics. For smart energy meters, the BOM, material sources, service lives of key components, maintenance records, dismantling information, recycling destinations, and recycled-material shares should be incorporated into a common data framework so that end-of-life information can inform the next generation of product design. Only through such a cross-stage data loop can LCA evolve from a retrospective accounting tool into a decision tool for low-carbon design, green procurement, and circular supply chains.
4.4. Cross-Stage Trade-Offs and Mitigation Prioritization
To systematically prioritize the mitigation strategies, three criteria are considered: whole-life carbon-reduction potential, implementation feasibility, and the risk of cross-stage burden shifting. Carbon-reduction potential is used as the primary criterion, while technical feasibility and possible effects on reliability, service life, and end-of-life recovery are considered as secondary constraints. Based on these criteria and the quantitative evidence summarized above, the mitigation strategies can be grouped into high-, medium-, and supplementary-priority measures. Representative LCA studies show that life cycle carbon emissions of smart energy meters are unevenly distributed across stages. The use stage is generally the dominant hotspot, contributing approximately 70–89% of life cycle GWP in reported cases [27,75]. Raw materials and electronic components form the second major source, particularly PCB/PCBA, chips, and communication modules [57,58]. Manufacturing and assembly make a smaller contribution, while transportation is generally secondary. End-of-life treatment contributes little to gross emissions and may provide a carbon credit through material recovery [16,75]. Table 2 summarizes the approximate ranking.
Table 2.
Approximate life cycle carbon contributions and indicative mitigation potentials of major mitigation strategies.
Three recurring trade-off patterns can be identified across the life cycle. First, material lightweighting, recycled content, and alternative PCB substrates can reduce embodied carbon, but excessive material reduction or substitution may compromise durability, electrical safety, reliability, or production cost. Second, edge processing and communication optimization may reduce transmission demand, but additional processors, gateways, and data traffic can increase embodied and operational burdens. Third, end-of-life recovery can provide avoided-production credits, but these benefits may be offset by collection distance, treatment energy, chemical inputs, and limited recovery efficiency. These trade-offs should therefore be evaluated according to net life cycle carbon reduction rather than the benefit of an individual stage alone.
Accordingly, reducing long-term operating power and communication demand is assigned the highest priority because of its relatively large whole-life reduction potential. Low-carbon substitution of PCB/PCBA, chips, and other key materials is assigned medium-to-high priority, followed by improvements in manufacturing efficiency and yield. Logistics optimization provides a smaller but readily implementable benefit. End-of-life recycling is treated as a case-dependent complementary strategy because its net benefit depends strongly on recovery efficiency, treatment inputs, and avoided-primary-material assumptions.
The ranking represents a synthesis of the currently available evidence rather than a fixed hierarchy for every product. Actual contributions vary with electricity mix, service life, product configuration, system boundary, supplier data, and recycling assumptions [7]. Table 2 therefore combines directly reported stage contributions with transparent reduction scenarios. Where the literature does not support a robust meter-specific percentage, the table reports the limitation rather than extrapolating a universal value.
The mitigation pathways discussed above involve different carbon-reduction mechanisms, implementation constraints, and levels of technical maturity. Table 3 summarizes the main life cycle mitigation strategies, their underlying mechanisms, major implementation challenges, representative evidence, and remaining research gaps.
Table 3.
Comprehensive summary of life cycle carbon-mitigation pathways for smart energy meters.
5. Conclusions and Outlook
The reviewed evidence indicates that the life cycle carbon footprint of smart energy meters is determined not by product mass alone, but by the combined effects of electronic-component intensity, long-term online operation, service life, and large-scale deployment. Available LCA studies show that the use stage can become the dominant carbon hotspot because operating and communication energy accumulates over long service periods. PCB/PCBA, integrated circuits, and communication modules are also important sources of embodied carbon during manufacturing, while end-of-life impacts are generally smaller and may be partly offset by material-recovery credits.
Based on this synthesis, we propose that the first mitigation priority should be to reduce long-term operating and communication energy consumption, followed by reducing the embodied carbon of PCB/PCBA and key electronic components and improving manufacturing efficiency. End-of-life recycling should be treated as a complementary and case-dependent strategy because its net benefit depends on recovery efficiency, treatment inputs, and avoided primary-material production. These priorities represent the authors’ synthesis of the available evidence and should be adjusted according to product-specific LCA results.
From the authors’ perspective, future research should focus on standardized accounting rules, component- and process-level carbon databases, primary operating and supply-chain data, and integrated assessment of carbon reduction, reliability, cost, and circularity. These developments would help move smart-meter LCA from retrospective accounting toward quantitative support for low-carbon design and life cycle management.
Author Contributions
Investigation, writing—original draft, B.M.; formal analysis, S.L.; data curation, R.L.; investigation, J.Y.; methodology, Q.Y.; resources, investigation, C.L.; project administration, supervision, writing—review and editing, G.Z. All authors have read and agreed to the published version of the manuscript.
Funding
This research was funded by the Research and Development Project of China Electric Power Research Institute Co. Ltd. (HL83-25-002).
Data Availability Statement
No new data were created or analyzed in this study. Data sharing is not applicable to this article.
Conflicts of Interest
Authors Bo Miao, Shuzhen Li, Rui Liu, Jun Yi, Qiujie Yuan, and Chao Liu were employed by the China Electric Power Research Institute Co., Ltd. The remaining authors declare that the research was conducted in the absence of any commercial or financial relationships that could be construed as a potential conflict of interest. The authors declare that this study received funding from China Electric Power Research Institute Co. Ltd. The funder was not involved in the study design, collection, analysis, or interpretation of data; the writing of this article; or the decision to submit it for publication.
References
- Wu, P.; Xia, B.; Wang, X. The contribution of ISO 14067 to the evolution of global greenhouse gas standards—A review. Renew. Sustain. Energy Rev. 2015, 47, 142–150. [Google Scholar] [CrossRef] [Scilit]
- Sinden, G. The contribution of PAS 2050 to the evolution of international greenhouse gas emission standards. Int. J. Life Cycle Assess. 2009, 14, 195–203. [Google Scholar] [CrossRef] [Scilit]
- Avancini, D.B.; Rodrigues, J.J.P.C.; Martins, S.G.B.; Rabêlo, R.A.L.; Al-Muhtadi, J.; Solic, P. Energy meters evolution in smart grids: A review. J. Clean. Prod. 2019, 217, 702–715. [Google Scholar] [CrossRef] [Scilit]
- Alahakoon, D.; Yu, X. Smart Electricity Meter Data Intelligence for Future Energy Systems: A Survey. IEEE Trans. Ind. Inform. 2016, 12, 425–436. [Google Scholar] [CrossRef] [Scilit]
- Wang, Z.; Zhang, H.; Deconinck, G.; Song, Y. A Unified Model for Smart Meter Data Applications. IEEE Trans. Smart Grid 2025, 16, 2451–2463. [Google Scholar] [CrossRef] [Scilit]
- Sovacool, B.K.; Hook, A.; Sareen, S.; Geels, F.W. Global sustainability, innovation and governance dynamics of national smart electricity meter transitions. Glob. Environ. Change 2021, 68, 102272. [Google Scholar] [CrossRef] [Scilit]
- Rizwan, A.; Rasheed, R.; Javed, H.; Farid, Q.; Ahmad, S.R. Environmental sustainability and life cycle cost analysis of smart versus conventional energy meters in developing countries. Sustain. Mater. Technol. 2022, 33, e00464. [Google Scholar] [CrossRef] [Scilit]
- Pirson, T.; Bol, D. Assessing the embodied carbon footprint of IoT edge devices with a bottom-up life-cycle approach. J. Clean. Prod. 2021, 322, 128966. [Google Scholar] [CrossRef] [Scilit]
- Zhang, T.; Bainbridge, A.; Harwell, J.; Zhang, S.; Wagih, M.; Kettle, J. Life cycle assessment (LCA) of circular consumer electronics based on IC recycling and emerging PCB assembly materials. Sci. Rep. 2024, 14, 29183. [Google Scholar] [CrossRef] [Scilit]
- Shah, H.H.; Piso, G.; Mancusi, E.; Bareschino, P.; Pepe, F. Life-cycle assessment and triple planetary crisis: A review on methodological gaps and potential future improvements. Sustain. Prod. Consum. 2026, 67, 47–63. [Google Scholar] [CrossRef] [Scilit]
- Pryshlakivsky, J.; Searcy, C. Fifteen years of ISO 14040: A review. J. Clean. Prod. 2013, 57, 115–123. [Google Scholar] [CrossRef] [Scilit]
- Finkbeiner, M.; Inaba, A.; Tan, R.; Christiansen, K.; Klüppel, H.-J. The New International Standards for Life Cycle Assessment: ISO 14040 and ISO 14044. Int. J. Life Cycle Assess. 2006, 11, 80–85. [Google Scholar] [CrossRef] [Scilit]
- European Union. Product Environmental Footprint Method. In Commission Recommendation (EU) 2021/2279 of 15 December 2021 on the Use of the Environmental Footprint Methods to Measure and Communicate the Life Cycle Environmental Performance of Products and Organisations; European Union: Brussels, Belgium, 2021. [Google Scholar]
- Wang, Z.; Zhang, Y.; Wang, J.; Zhang, Y.; Zhao, J. Carbon footprint calculation for power transmission and distribution equipment: A comprehensive review of methodologies, standards, and applications. Resour. Conserv. Recycl. Adv. 2025, 28, 200295. [Google Scholar] [CrossRef] [Scilit]
- Li, S.; Jiang, Y.; Yi, J.; Miao, B.; Liu, C.; Ling, Z.; Zhang, G. Lifecycle Carbon Emissions and Mitigation Strategies of Electrical Equipment: A Comprehensive Review. Processes 2026, 14, 40. [Google Scholar] [CrossRef] [Scilit]
- Aleksic, S.; Mujan, V. Exergy cost of information and communication equipment for smart metering and smart grids. Sustain. Energy Grids Netw. 2018, 14, 1–11. [Google Scholar] [CrossRef] [Scilit]
- Miao, B.; Wen, J.; Yuan, Q.; Aisikaer, K.; Zhao, D.; Zhao, Z. Research on Carbon Footprint Analysis Method of A-Class Single-Phase Cost-Controlled Intelligent Energy Meter Product. In Proceedings of the 2024 8th International Conference on Electrical, Mechanical and Computer Engineering (ICEMCE), Xi’an, China, 25–27 October 2024. [Google Scholar]
- Alcaraz, M.L.; Noshadravan, A.; Zgola, M.; Kirchain, R.E.; Olivetti, E.A. Streamlined life cycle assessment: A case study on tablets and integrated circuits. J. Clean. Prod. 2018, 200, 819–826. [Google Scholar] [CrossRef] [Scilit]
- de Bortoli, A. Environmental performance of shared micromobility and personal alternatives using integrated modal LCA. Transp. Res. Part D Transp. Environ. 2021, 93, 102743. [Google Scholar] [CrossRef] [Scilit]
- Depuru, S.S.S.R.; Wang, L.; Devabhaktuni, V. Smart meters for power grid: Challenges, issues, advantages and status. Renew. Sustain. Energy Rev. 2011, 15, 2736–2742. [Google Scholar] [CrossRef] [Scilit]
- Jha, A.V.; Appasani, B.; Ghazali, A.N.; Pattanayak, P.; Gurjar, D.S.; Kabalci, E.; Mohanta, D.K. Smart grid cyber-physical systems: Communication technologies, standards and challenges. Wirel. Netw. 2021, 27, 2595–2613. [Google Scholar] [CrossRef] [Scilit]
- Malmodin, J.; Lundén, D.; Moberg, Å.; Andersson, G.; Nilsson, M. Life Cycle Assessment of ICT. J. Ind. Ecol. 2014, 18, 829–845. [Google Scholar] [CrossRef] [Scilit]
- Kiddee, P.; Naidu, R.; Wong, M.H. Electronic waste management approaches: An overview. Waste Manag. 2013, 33, 1237–1250. [Google Scholar] [CrossRef] [Scilit]
- Kaya, M. Recovery of metals and nonmetals from electronic waste by physical and chemical recycling processes. Waste Manag. 2016, 57, 64–90. [Google Scholar] [CrossRef] [Scilit]
- Cucchiella, F.; D’Adamo, I.; Lenny Koh, S.C.; Rosa, P. Recycling of WEEEs: An economic assessment of present and future e-waste streams. Renew. Sustain. Energy Rev. 2015, 51, 263–272. [Google Scholar] [CrossRef] [Scilit]
- Lövehagen, N.; Malmodin, J.; Bergmark, P.; Matinfar, S. Assessing embodied carbon emissions of communication user devices by combining approaches. Renew. Sustain. Energy Rev. 2023, 183, 113422. [Google Scholar] [CrossRef] [Scilit]
- Miao, B.; Liu, C.; Wen, J.; Liu, R.; Xing, Y.; Zhu, Z.; Yang, Q. Carbon footprint analysis of Chinese household smart electricity meters based on life cycle assessment. In Proceedings of the 2024 4th International Conference on Intelligent Power and Systems (ICIPS), Yichang, China, 6–8 December 2024; pp. 1141–1151. [Google Scholar] [CrossRef] [Scilit]
- Li, Z.; Cao, X. Analysis of Information Feedback on Residential Energy Conservation and the Implications: The Case of China. Front. Environ. Sci. 2021, 9, 626890. [Google Scholar] [CrossRef] [Scilit]
- Mao, Y.; Shiju, E.; Zhu, C. Modern developments and analysis of household electricity utilization by applying smart meter and its findings. Energy 2024, 310, 132116. [Google Scholar] [CrossRef] [Scilit]
- Weigel, P.; Fischedick, M.; Viebahn, P. Holistic Evaluation of Digital Applications in the Energy Sector—Evaluation Framework Development and Application to the Use Case Smart Meter Roll-Out. Sustainability 2021, 13, 6834. [Google Scholar] [CrossRef] [Scilit]
- Gangolells, M.; Casals, M.; Forcada, N.; Macarulla, M.; Giretti, A. Environmental impacts related to the commissioning and usage phase of an intelligent energy management system. Appl. Energy 2015, 138, 216–223. [Google Scholar] [CrossRef] [Scilit]
- Louis, J.-N.; Pongrácz, E. Life cycle impact assessment of home energy management systems (HEMS) using dynamic emissions factors for electricity in Finland. Environ. Impact Assess. Rev. 2017, 67, 109–116. [Google Scholar] [CrossRef] [Scilit]
- Martins, M.G.; Nunes, A.O.; Mancini, S.D.; Belli, C.; Rocha, T.B.; Moris, V.A.S. Comparative analysis of life cycle assessment and material circularity indicator: Study applied to smart electricity meter polycarbonate parts. J. Mater. Cycles Waste Manag. 2024, 26, 3777–3786. [Google Scholar] [CrossRef] [Scilit]
- Wohlschlager, D.; Neitz-Regett, A.; Lanzinger, B. Environmental Assessment of Digital Infrastructure in Decentralized Smart Grids. In Proceedings of the 2021 IEEE 9th International Conference on Smart Energy Grid Engineering (SEGE), Oshawa, ON, Canada, 11–13 August 2021. [Google Scholar]
- Bai, X.; Li, J.; Tan, R.; Liu, K. Towards Sustainable Product Carbon Footprint Accounting Through Green Electricity and Green Certificate Mechanisms. Sustainability 2026, 18, 7353. [Google Scholar] [CrossRef] [Scilit]
- Maga, D.; Aryan, V.; Beard, A. Toward Sustainable Fire Safety: Life Cycle Assessment of Phosphinate-Based and Brominated Flame Retardants in E-Mobility and Electronic Devices. ACS Sustain. Chem. Eng. 2024, 12, 3652–3658. [Google Scholar] [CrossRef] [Scilit]
- Shahraki, H.; Einollahipeer, F.; Abyar, H.; Erfani, M. Assessing the environmental impacts of copper cathode production based on life cycle assessment. Integr. Environ. Assess. Manag. 2024, 20, 1180–1190. [Google Scholar] [CrossRef] [Scilit]
- Chen, Z.; Amani, A.M.; Yu, X.; Jalili, M. Control and Optimisation of Power Grids Using Smart Meter Data: A Review. Sensors 2023, 23, 2118. [Google Scholar] [CrossRef] [Scilit]
- Anbazhagan, S.; Mugelan, R.K. Adaptive power-saving mode control in NB-IoT networks using soft actor-critic reinforcement learning for optimal power management. Sci. Rep. 2025, 15, 34618. [Google Scholar] [CrossRef] [Scilit]
- IEC 62052-11:2020; Electricity Metering Equipment—General Requirements, Tests and Test Conditions—Part 11: Metering Equipment. International Electrotechnical Commission: Geneva, Switzerland, 2020.
- ISO 14067:2018; Greenhouse Gases—Carbon Footprint of Products—Requirements and Guidelines for Quantification. International Organization for Standardization: Geneva, Switzerland, 2018.
- 978-1-56973-773-6; Greenhouse Gas Protocol Product Life Cycle Accounting and Reporting Standard. World Resources Institute and World Business Council for Sustainable Development: Washington, DC, USA, 2011.
- CQMZJ-2022-CFP-HC-001; Carbon Footprint Verification Report for Holley Technology Co., Ltd. Single-Phase Smart Energy Meter DDZY285-M. China Quality Mark Certification Group Co., Ltd.: Beijing, China, 2022.
- Xue, M.; Kendall, A.; Xu, Z.; Schoenung, J.M. Waste Management of Printed Wiring Boards: A Life Cycle Assessment of the Metals Recycling Chain from Liberation through Refining. Environ. Sci. Technol. 2015, 49, 940–947. [Google Scholar] [CrossRef] [Scilit]
- Nan, T.; Yang, J.; Aromaa-Stubb, R.; Zhu, Q.; Lundström, M. Process simulation and life cycle assessment of hydrometallurgical recycling routes of waste printed circuit boards. J. Clean. Prod. 2024, 435, 140458. [Google Scholar] [CrossRef] [Scilit]
- Roskladka, N.; Bressanelli, G.; Saccani, N.; Miragliotta, G. Repairable electronic products for the circular economy: A review of design for repair features, practices and measures to contrast obsolescence. Discov. Sustain. 2025, 6, 66. [Google Scholar] [CrossRef] [Scilit]
- Pirson, T.; Delhaye, T.P.; Pip, A.G.; Brun, G.L.; Raskin, J.P.; Bol, D. The Environmental Footprint of IC Production: Review, Analysis, and Lessons From Historical Trends. IEEE Trans. Semicond. Manuf. 2023, 36, 56–67. [Google Scholar] [CrossRef] [Scilit]
- Zikulnig, J.; Carrara, S.; Kosel, J. A life cycle assessment approach to minimize environmental impact for sustainable printed sensors. Sci. Rep. 2025, 15, 10866. [Google Scholar] [CrossRef] [Scilit]
- Farkas, C.; Gál, L.; Csiszár, A.; Grennerat, V.; Jeannin, P.-O.; Xavier, P.; Rigler, D.; Krammer, O.; Plachy, Z.; Dusek, K.; et al. Sustainable printed circuit board substrates based on flame-retarded PLA/flax composites to reduce environmental load of electronics: Quality, reliability, degradation and application tests. Sustain. Mater. Technol. 2024, 40, e00902. [Google Scholar] [CrossRef] [Scilit]
- Géczy, A.; Piffkó, D.; Berényi, R.; Dusek, K.; Xavier, P.; Cuartielles, D. Implementation of microcontroller board on a sustainable and degradable PLA/flax composite substrate: A case study. Nanotechnology 2024, 35, 435201. [Google Scholar] [CrossRef] [Scilit]
- Nassajfar, M.N.; Deviatkin, I.; Leminen, V.; Horttanainen, M. Alternative Materials for Printed Circuit Board Production: An Environmental Perspective. Sustainability 2021, 13, 12126. [Google Scholar] [CrossRef] [Scilit]
- Honarbari, A.; Cataldi, P.; Zych, A.; Merino, D.; Paknezhad, N.; Ceseracciu, L.; Perotto, G.; Crepaldi, M.; Athanassiou, A. A Green Conformable Thermoformed Printed Circuit Board Sourced from Renewable Materials. ACS Appl. Electron. Mater. 2023, 5, 5050–5060. [Google Scholar] [CrossRef] [Scilit]
- Harwell, J.R.; Zhang, T.; Rollo, A.; Wagih, M.; Kettle, J. Additively manufacturing printed circuit boards with low waste footprint by transferring electroplated zinc tracks. Commun. Mater. 2025, 7, 17. [Google Scholar] [CrossRef] [Scilit]
- Chou, F.-R.; Chauvy, R.; Chen, P.-C. Exploring efficient copper recovery and recycling in Taiwan’s printed circuit board manufacturing through material-flow cost accounting. Sustain. Prod. Consum. 2024, 48, 84–98. [Google Scholar] [CrossRef] [Scilit]
- Xia, T.; Sun, H.; Ding, Y.; Han, D.; Qin, W.; Seidelmann, J.; Xi, L. Digital twin-based real-time energy optimization method for production line considering fault disturbances. J. Intell. Manuf. 2025, 36, 569–593. [Google Scholar] [CrossRef] [Scilit]
- Yan, Z.; Li, J.; Zhang, Z.; Peng, H. SolderlessPCB: Reusing Electronic Components in PCB Prototyping through Detachable 3D Printed Housings. arXiv 2024, arXiv:2403.18797. [Google Scholar]
- Wagih, M.; Bainbridge, A.; Alsulami, B.; Kettle, J. Environmental Life-Cycle Assessment (LCA) of Wireless RF Systems: A Comparative Sustainability Analysis and a Microwave Engineers’ Guide to LCA. IEEE J. Microw. 2024, 4, 987–1000. [Google Scholar] [CrossRef] [Scilit]
- Kumari, P.; Mishra, R.; Gupta, H.P.; Dutta, T.; Das, S.K. An Energy Efficient Smart Metering System Using Edge Computing in LoRa Network. IEEE Trans. Sustain. Comput. 2022, 7, 786–798. [Google Scholar] [CrossRef] [Scilit]
- Huang, J.; Zhou, S.; Li, G.; Shen, Q. Real-time monitoring and optimization methods for user-side energy management based on edge computing. Sci. Rep. 2025, 15, 24890. [Google Scholar] [CrossRef] [Scilit]
- Wang, X.; Wang, H.; Bhandari, B.; Cheng, L. AI-Empowered Methods for Smart Energy Consumption: A Review of Load Forecasting, Anomaly Detection and Demand Response. Int. J. Precis. Eng. Manuf.-Green Technol. 2024, 11, 963–993. [Google Scholar] [CrossRef] [Scilit]
- Hernández, Á.; Nieto, R.; de Diego-Otón, L.; Pérez-Rubio, M.C.; Villadangos-Carrizo, J.M.; Pizarro, D.; Ureña, J. Detection of Anomalies in Daily Activities Using Data from Smart Meters. Sensors 2024, 24, 515. [Google Scholar] [CrossRef] [Scilit]
- Commission Recommendation of 9 March 2012 on Preparations for the Roll-Out of Smart Metering Systems (2012/148/EU); European Union: Brussels, Belgium, 2012; pp. 9–22.
- Directive 2012/19/EU of the European Parliament and of the Council of 4 July 2012 on Waste Electrical and Electronic Equipment (WEEE) (Recast); European Union: Brussels, Belgium, 2012; pp. 38–71.
- Regulation (EU) 2016/679 of the European Parliament and of the Council of 27 April 2016 on the Protection of Natural Persons with Regard to the Processing of Personal Data and on the Free Movement of Such Data, and Repealing Directive 95/46/EC (General Data Protection Regulation); European Union: Brussels, Belgium, 2016; pp. 1–88.
- Directive (EU) 2019/944 of the European Parliament and of the Council of 5 June 2019 on Common Rules for the Internal Market for Electricity and Amending Directive 2012/27/EU (Recast); European Union: Brussels, Belgium, 2019; pp. 125–199.
- Alabdulkarim, A.; Lukszo, Z.; Fens, T.W. Acceptance of Privacy-Sensitive Infrastructure Systems: A Case of Smart Metering in The Netherlands. In Third International Engineering Systems Symposium Design and Governance in Engineering Systems; Delft University of Technology: Delft, The Netherlands, 2012. [Google Scholar]
- Li, Y.; Xiao, X.; Zhang, Z.; Liu, W. A Feature Engineering Framework for Smart Meter Group Failure Rate Prediction. Mathematics 2025, 13, 2472. [Google Scholar] [CrossRef] [Scilit]
- Dong, X.; Jing, Z.; Dai, Y.; Wang, P.; Chen, Z. Failure Prediction and Replacement Strategies for Smart Electricity Meters Based on Field Failure Observation. Sensors 2022, 22, 9804. [Google Scholar] [CrossRef] [Scilit]
- Ahamed, A.; Huang, P.; Young, J.; Gallego-Schmid, A.; Price, R.; Shaver, M.P. Technical and environmental assessment of end-of-life scenarios for plastic packaging with electronic tags. Resour. Conserv. Recycl. 2024, 201, 107341. [Google Scholar] [CrossRef] [Scilit]
- Islam, M.T.; Iyer-Raniga, U. Life cycle assessment of e-waste management system in Australia: Case of waste printed circuit board (PCB). J. Clean. Prod. 2023, 418, 138082. [Google Scholar] [CrossRef] [Scilit]
- Zoka, M.; Korez Vide, R. Circular Economy Implementation in the Electric and Electronic Equipment Industry: Challenges and Opportunities. Sustainability 2025, 17, 7700. [Google Scholar] [CrossRef] [Scilit]
- Yu, X.; Sun, Z.; Sun, D.; He, R. Sustainable development assessment of household e-waste reverse supply chains from an environmental ethic perspective. Humanit. Soc. Sci. Commun. 2025, 12, 811. [Google Scholar] [CrossRef] [Scilit]
- Moheb-Alizadeh, H.; Sadeghi, A.H.; Fakhrabad, A.S.; Jaunich, M.K.; Kemahlioglu-Ziya, E.; Handfield, R.B. Reverse Logistics Network Design to Estimate the Economic and Environmental Impacts of Take-back Legislation: A Case Study for E-waste Management System in Washington State. arXiv 2023, arXiv:2301.09792. [Google Scholar]
- Singh, H.; Aggarwal, R.; Garg, P. Circular economy implementation in the electronics sector: A systematic literature review and future research directions. Cogent Bus. Manag. 2025, 12, 2509794. [Google Scholar] [CrossRef] [Scilit]
- Sias, G.G. Characterization of the Life Cycle Environmental Impacts and Benefits of Smart Electric Meters and Consequences of their Deployment in California. Ph.D. Thesis, University of California, Los Angeles, CA, USA, 2017. [Google Scholar]
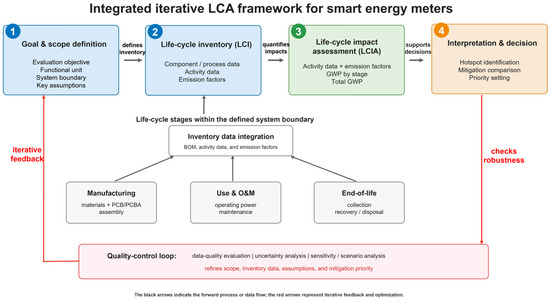
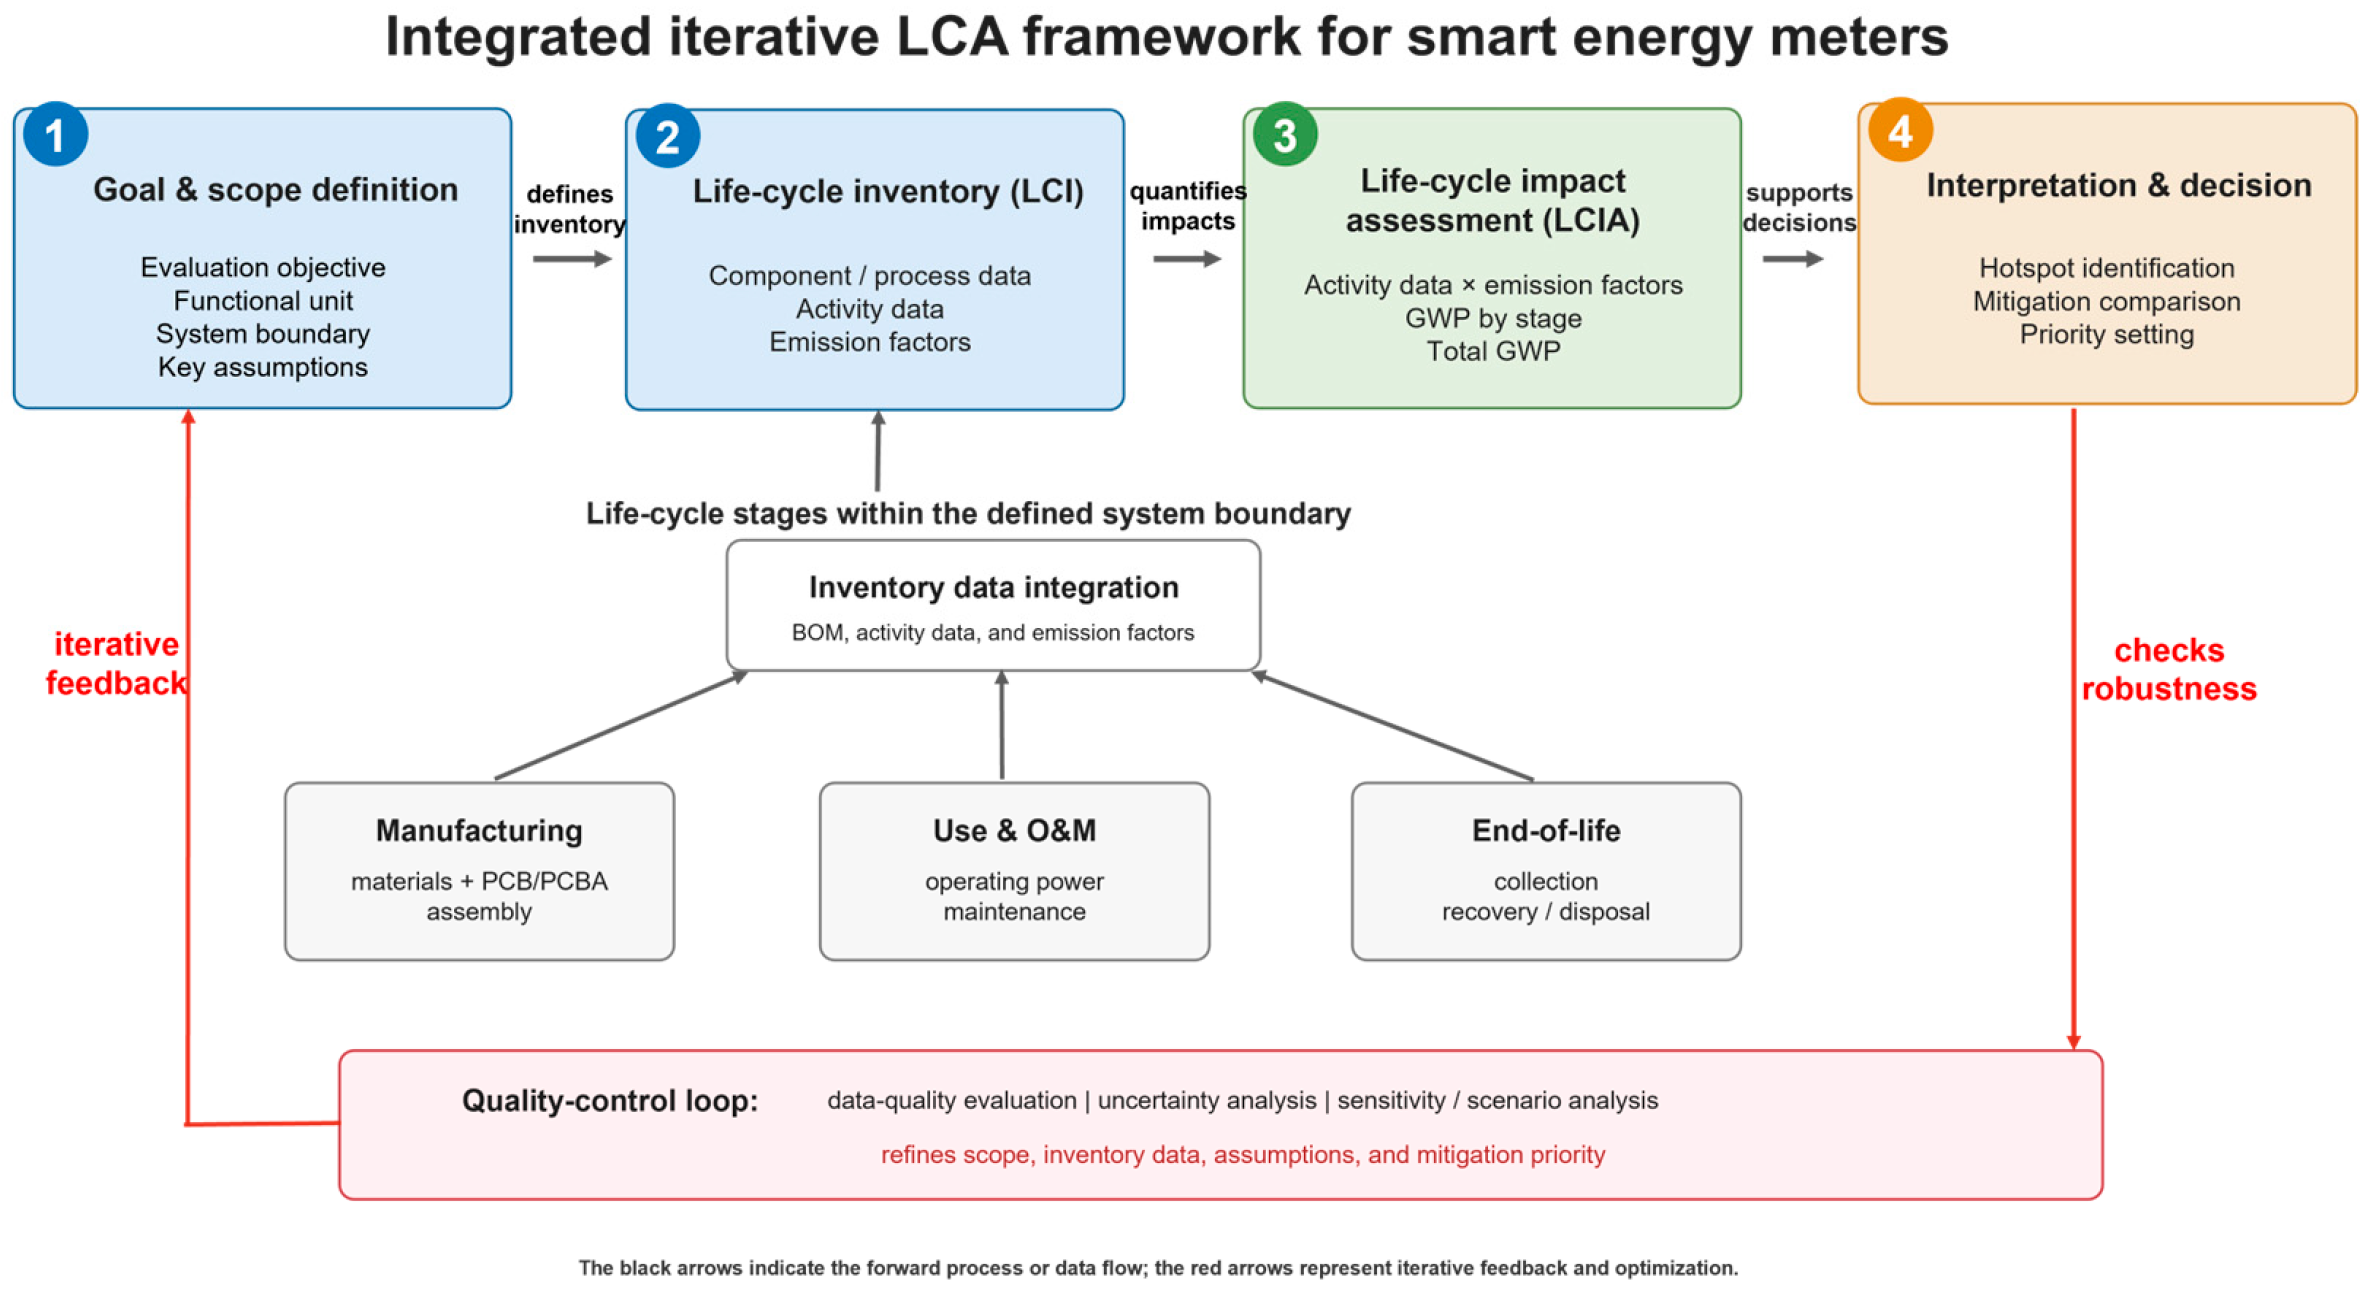
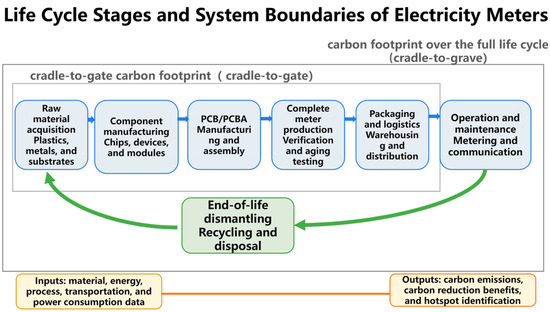
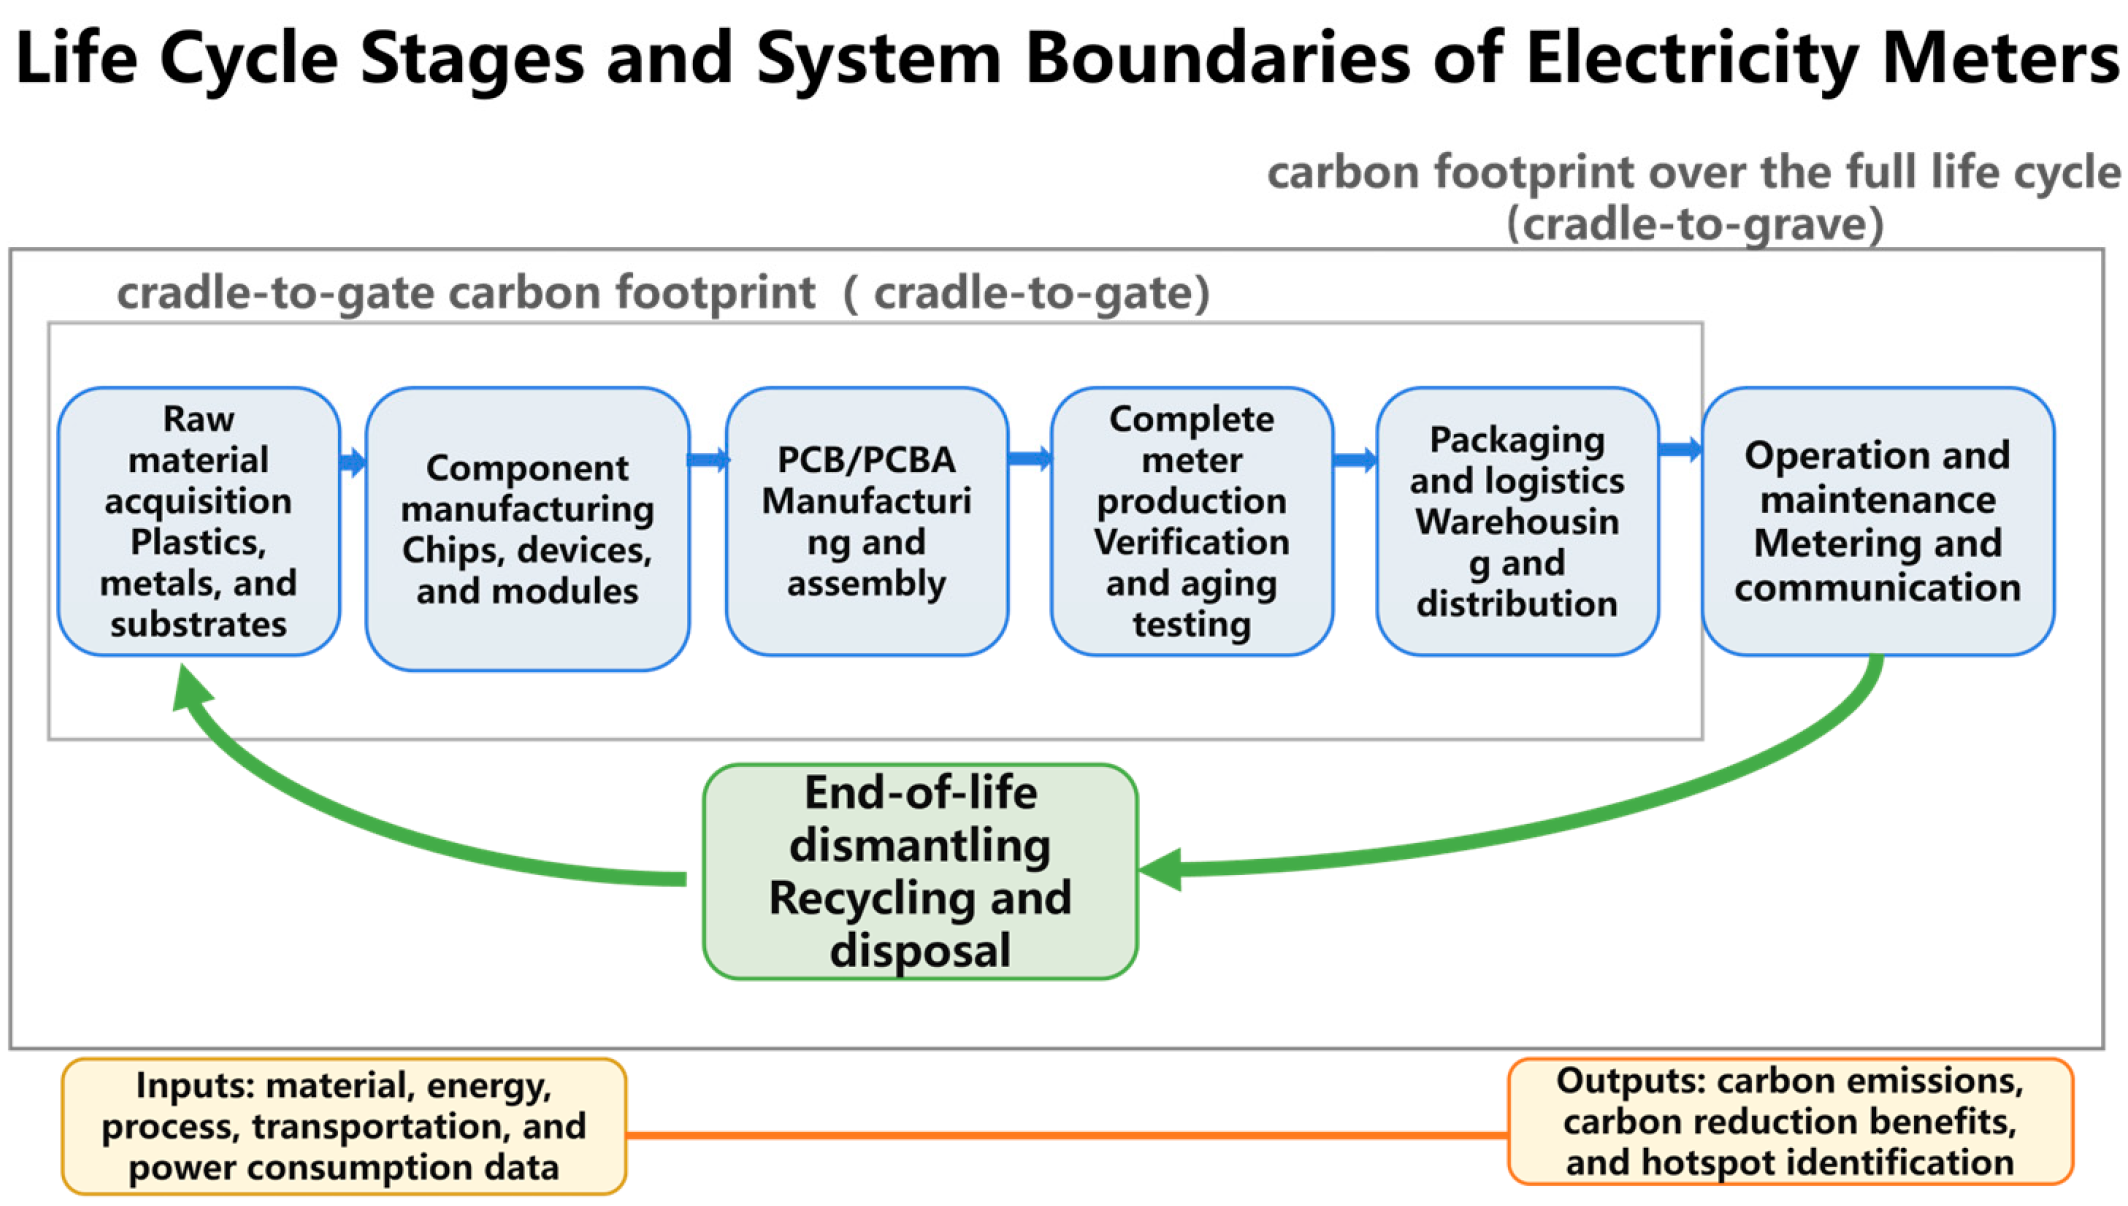
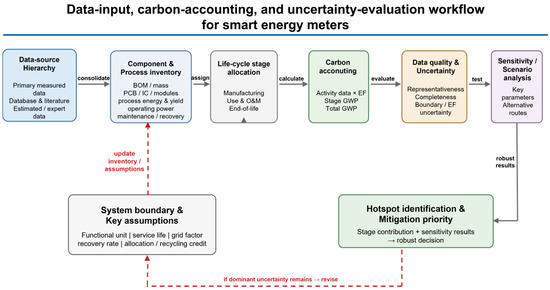
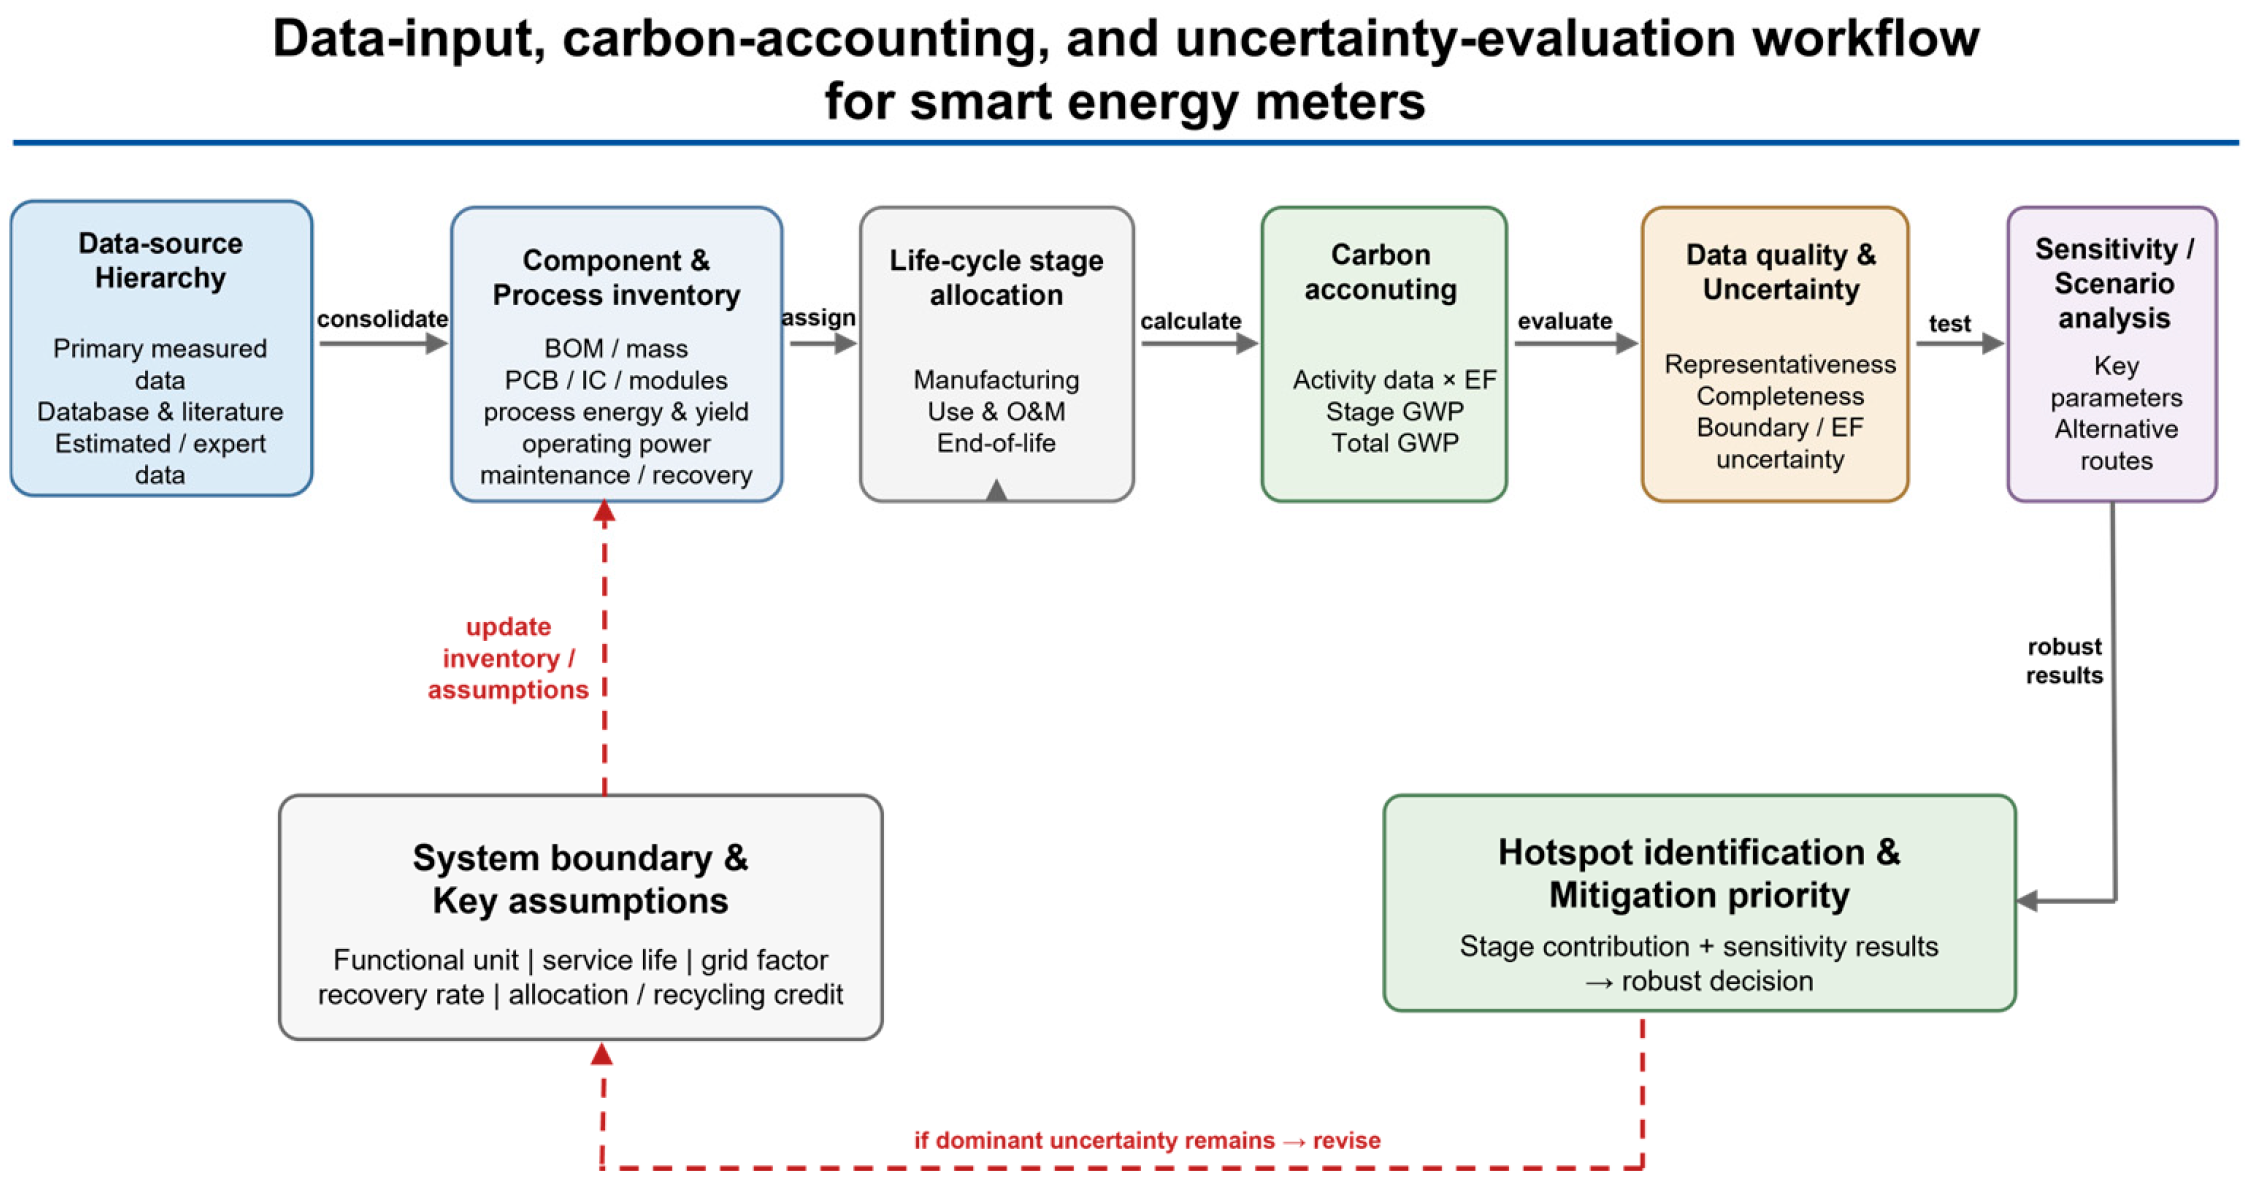
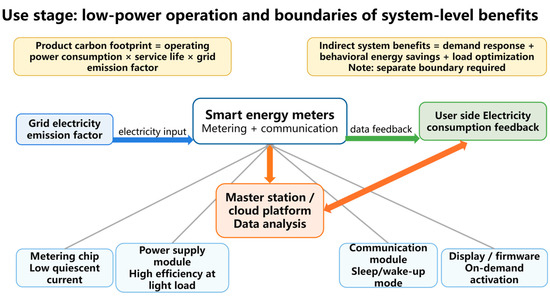
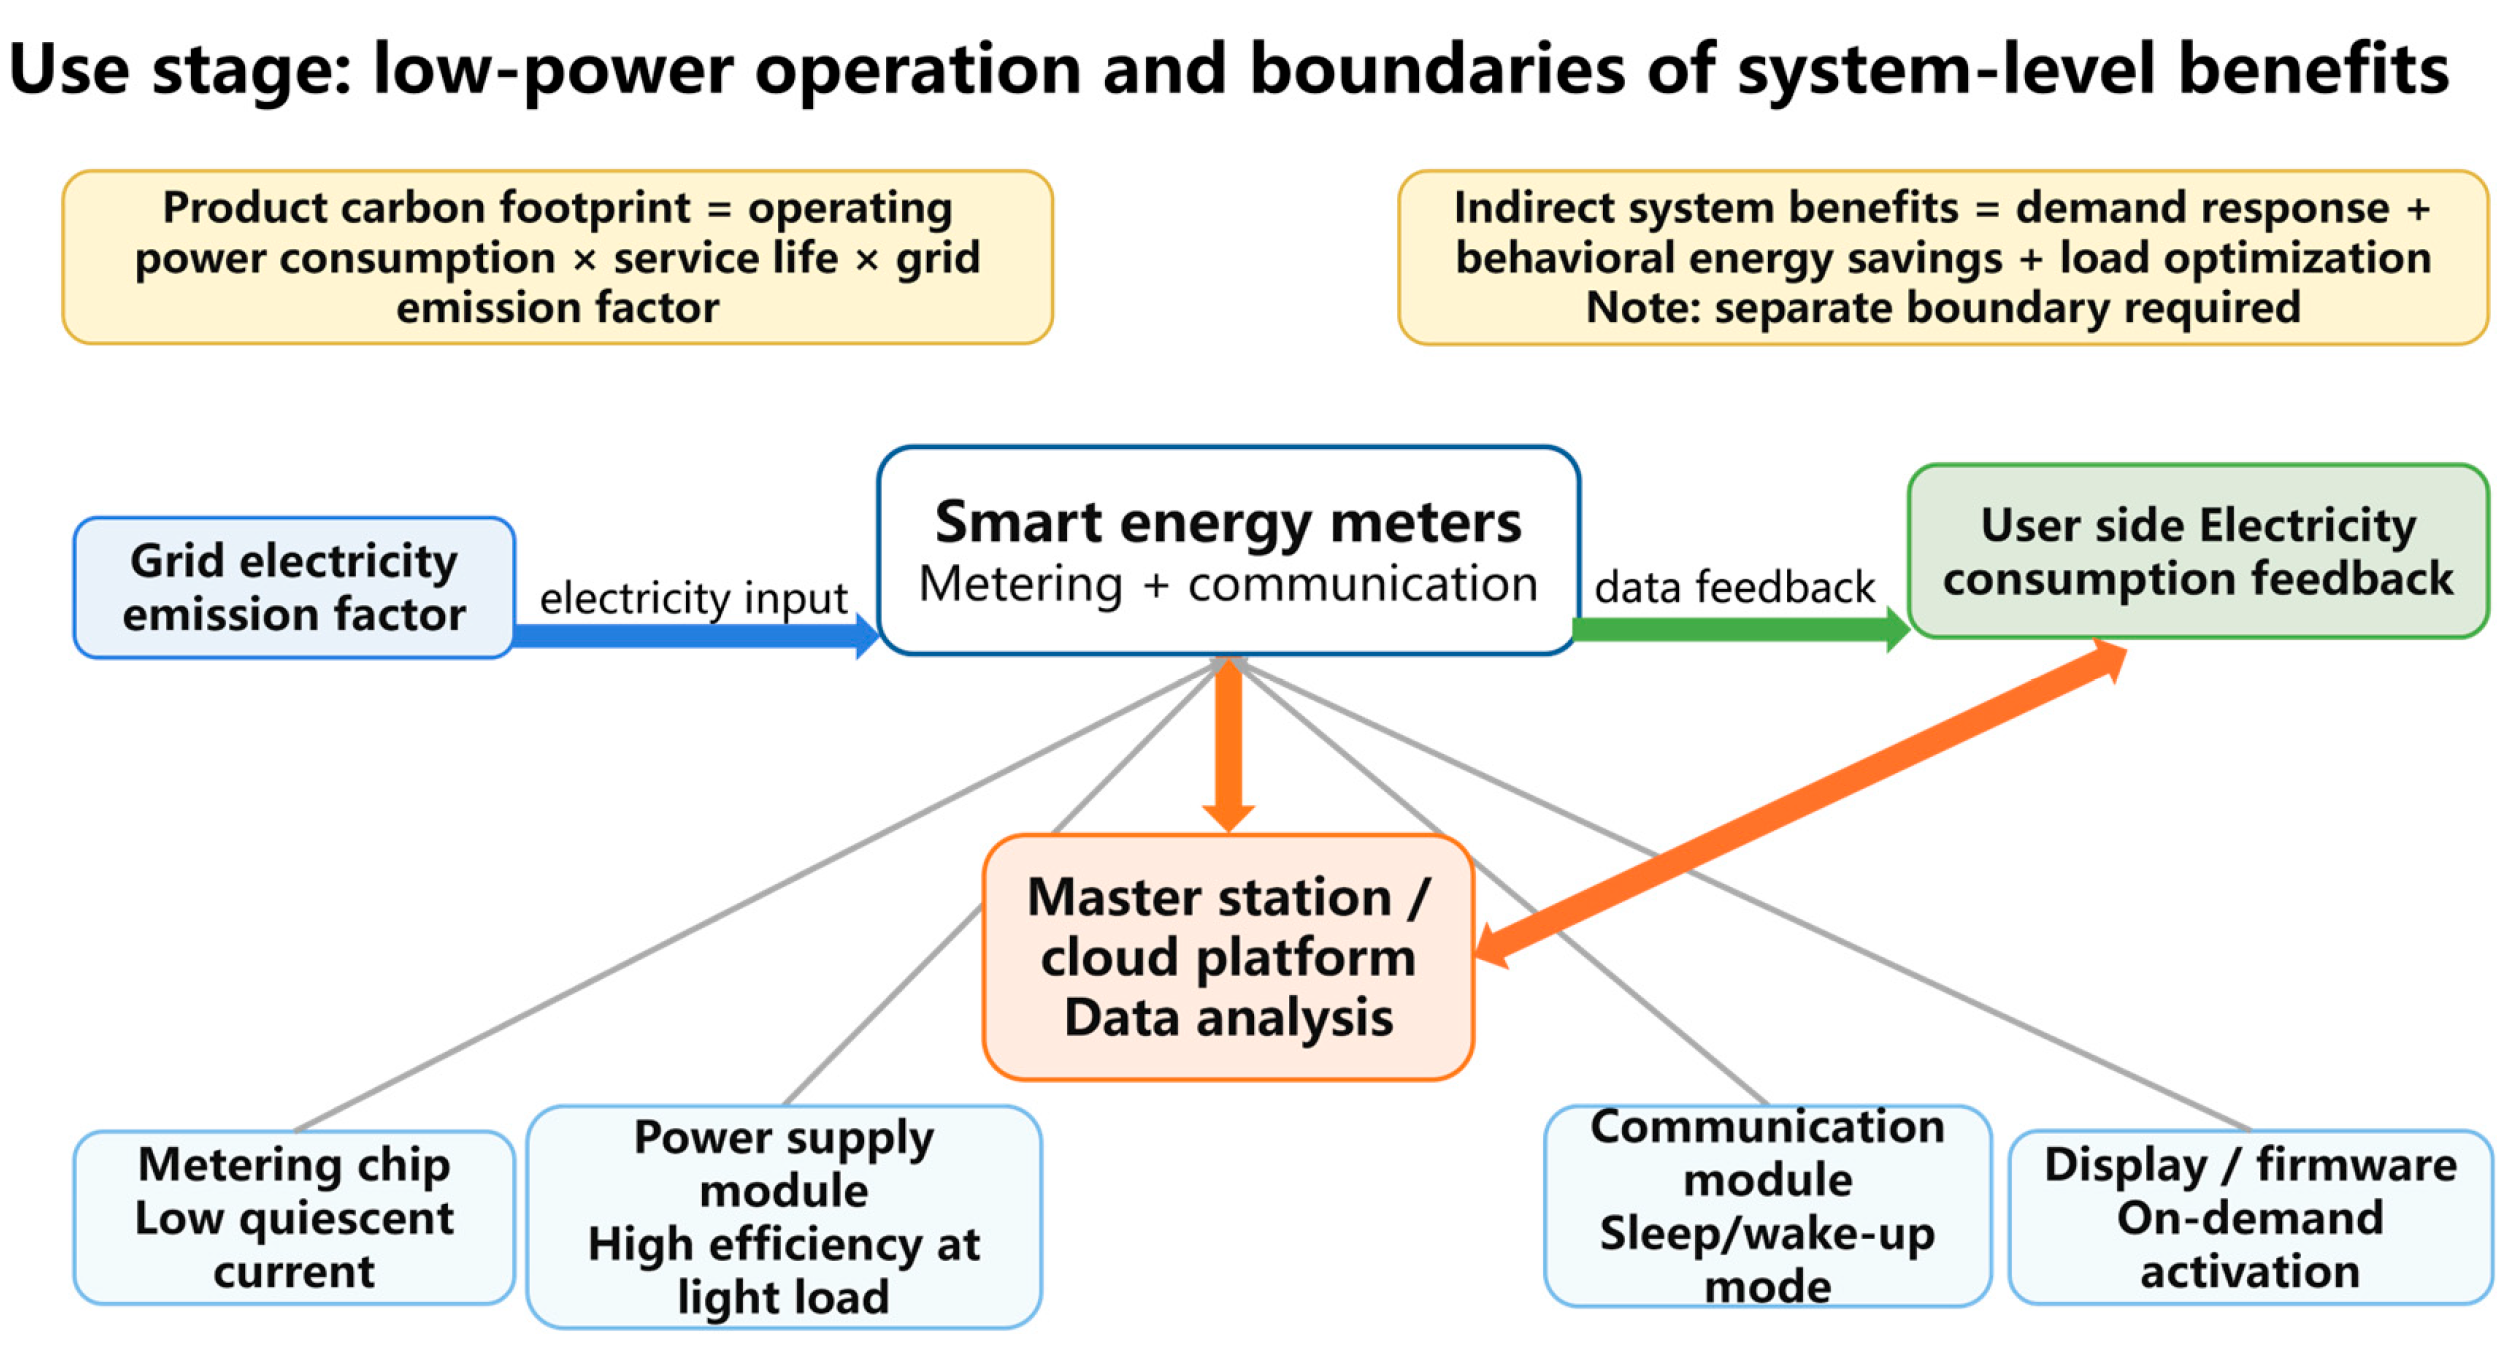
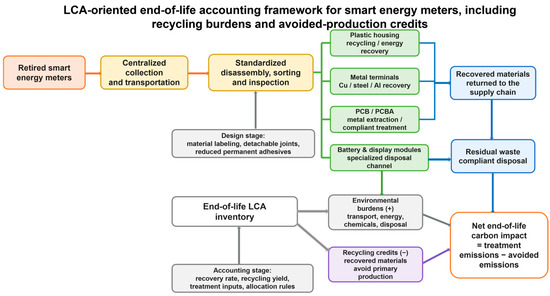
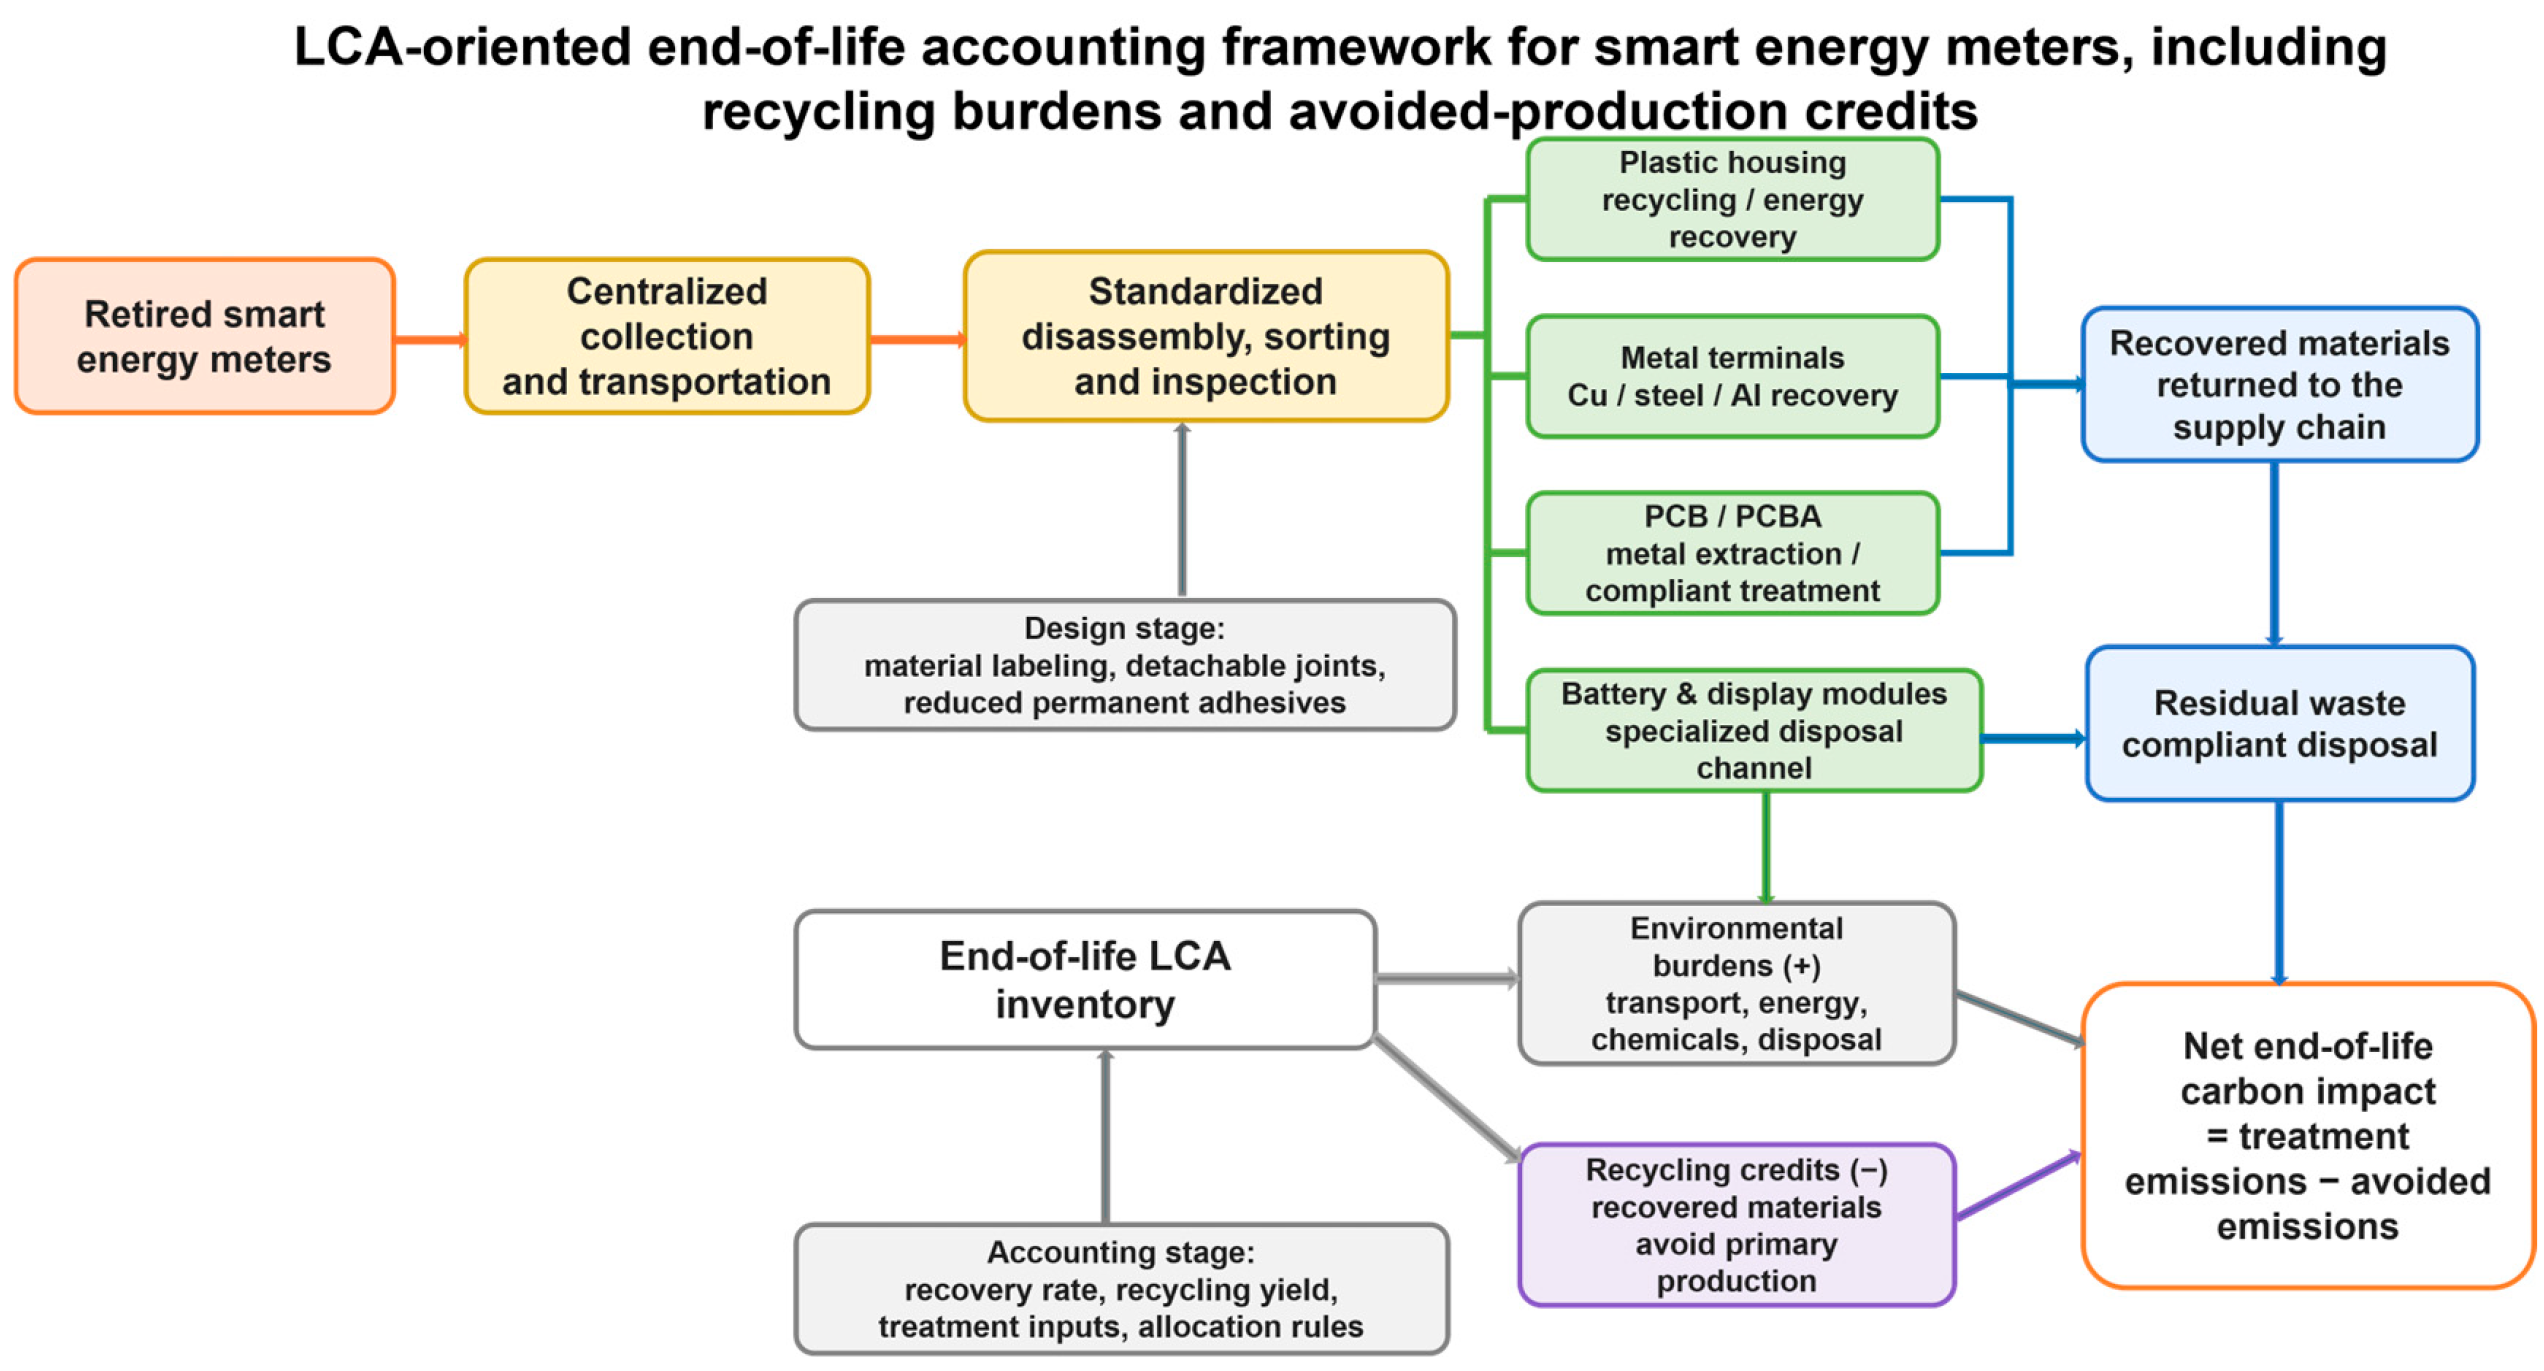
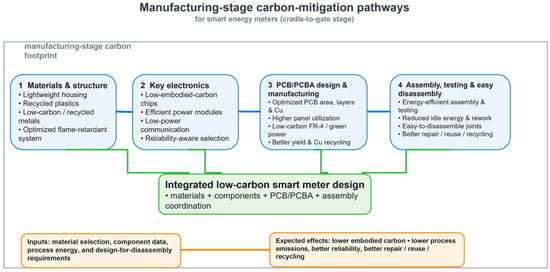
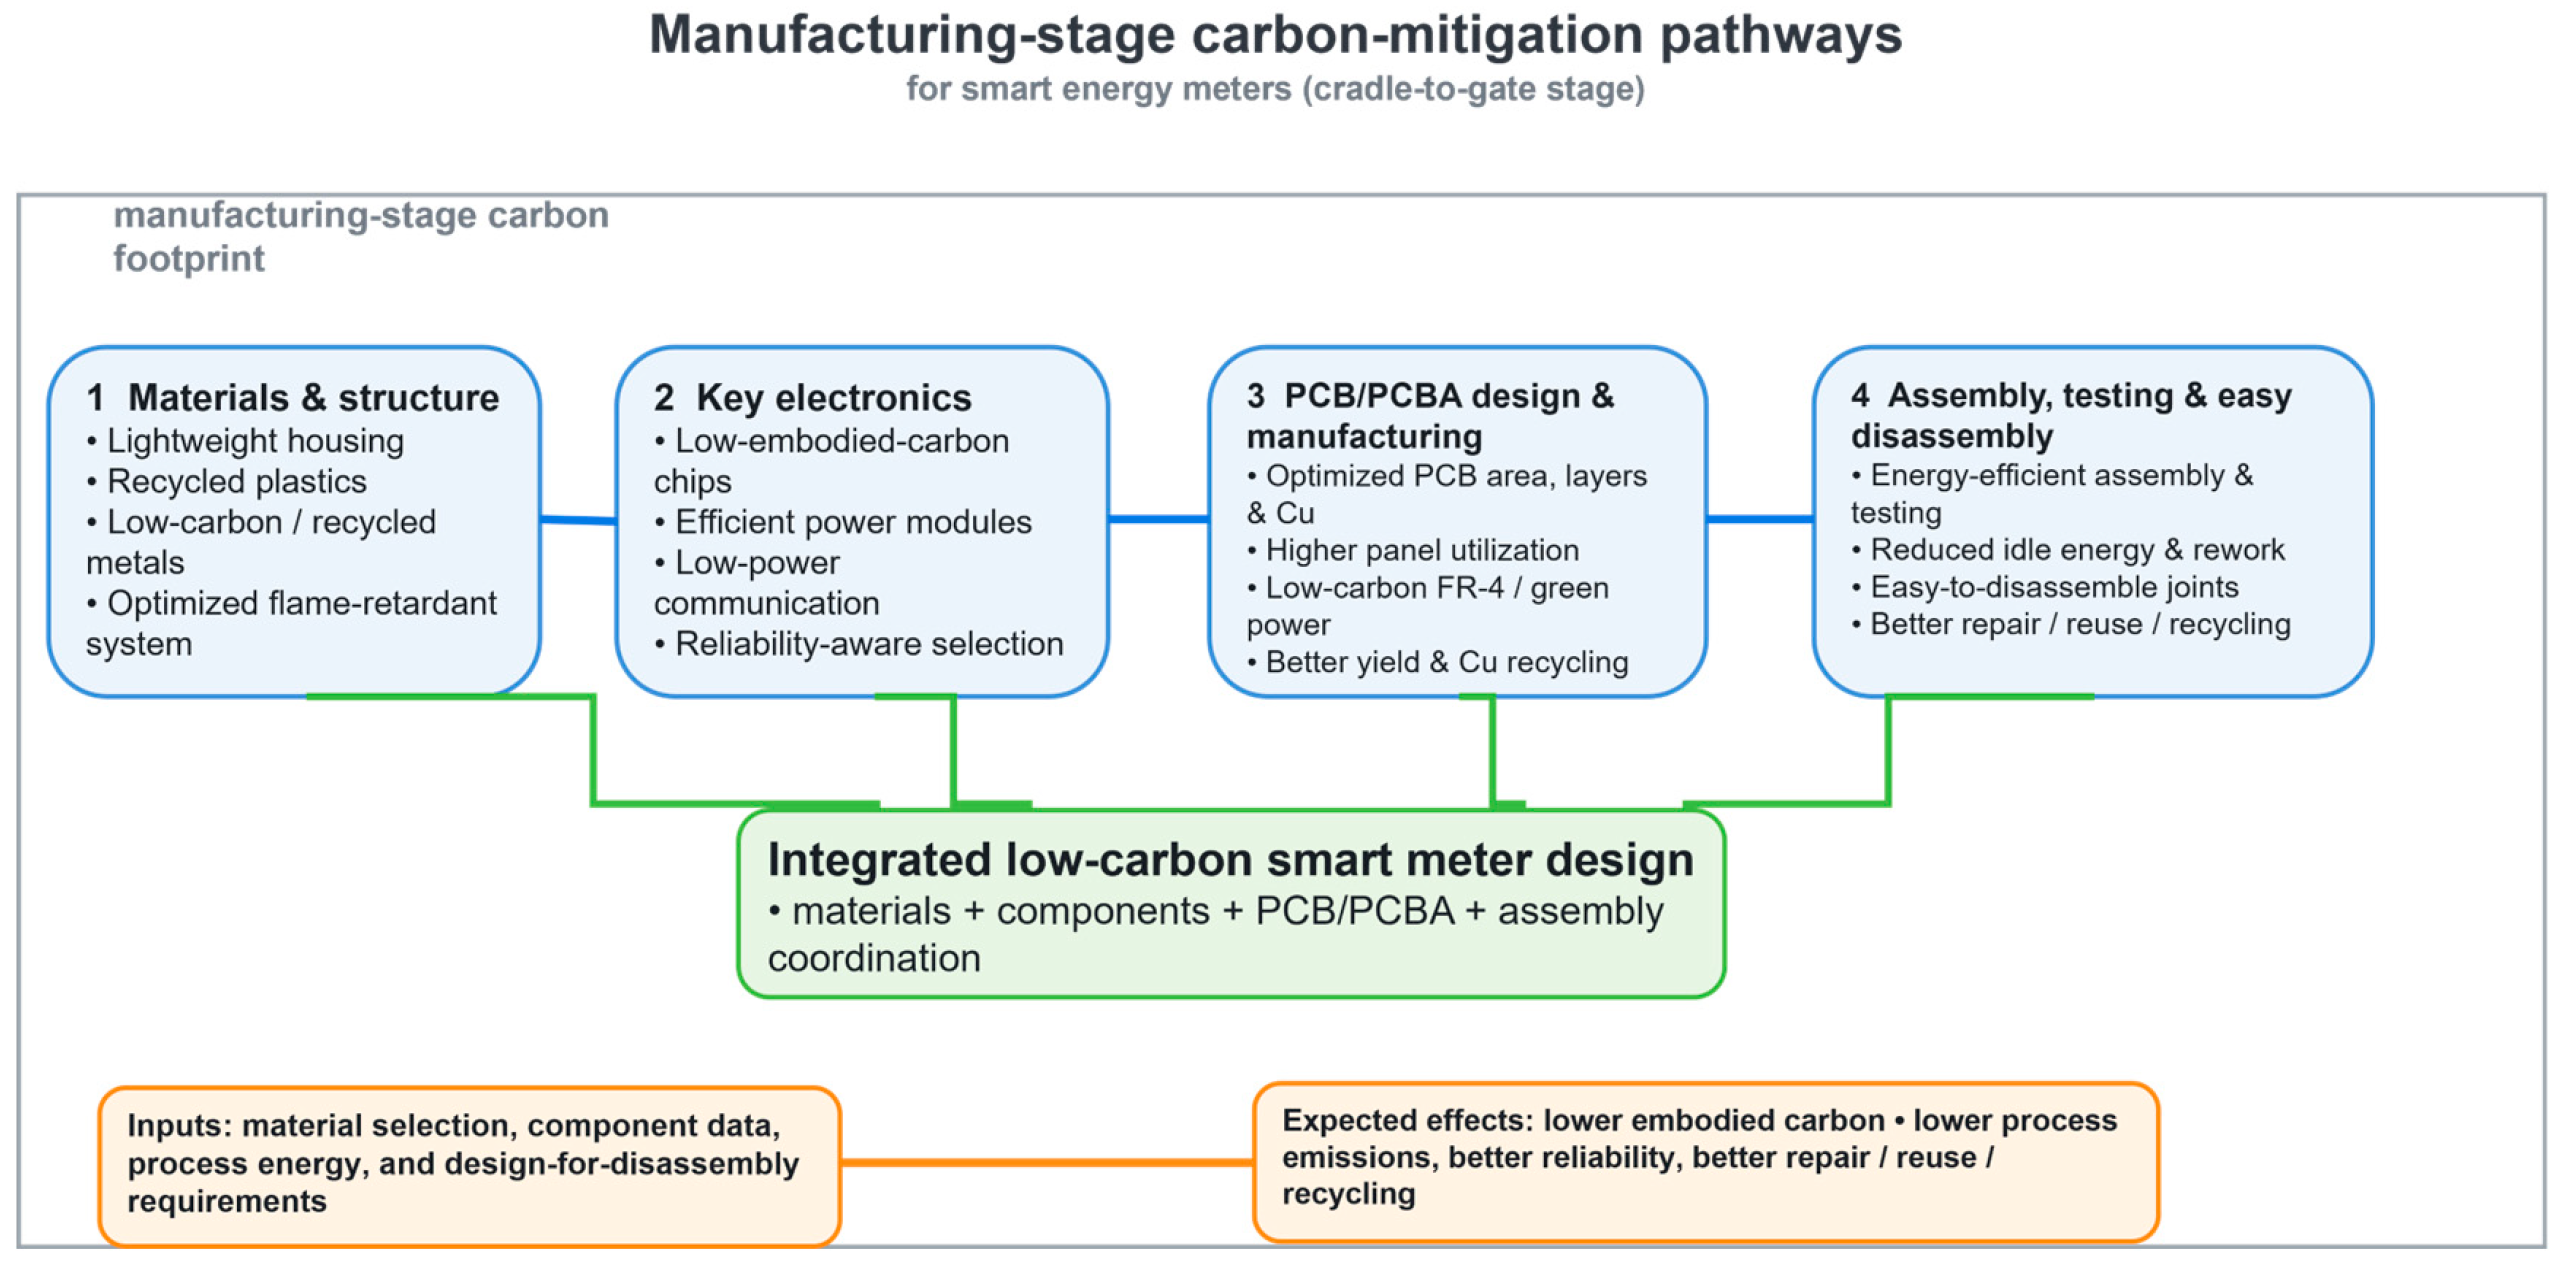
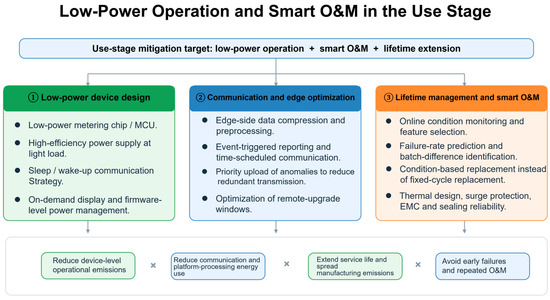
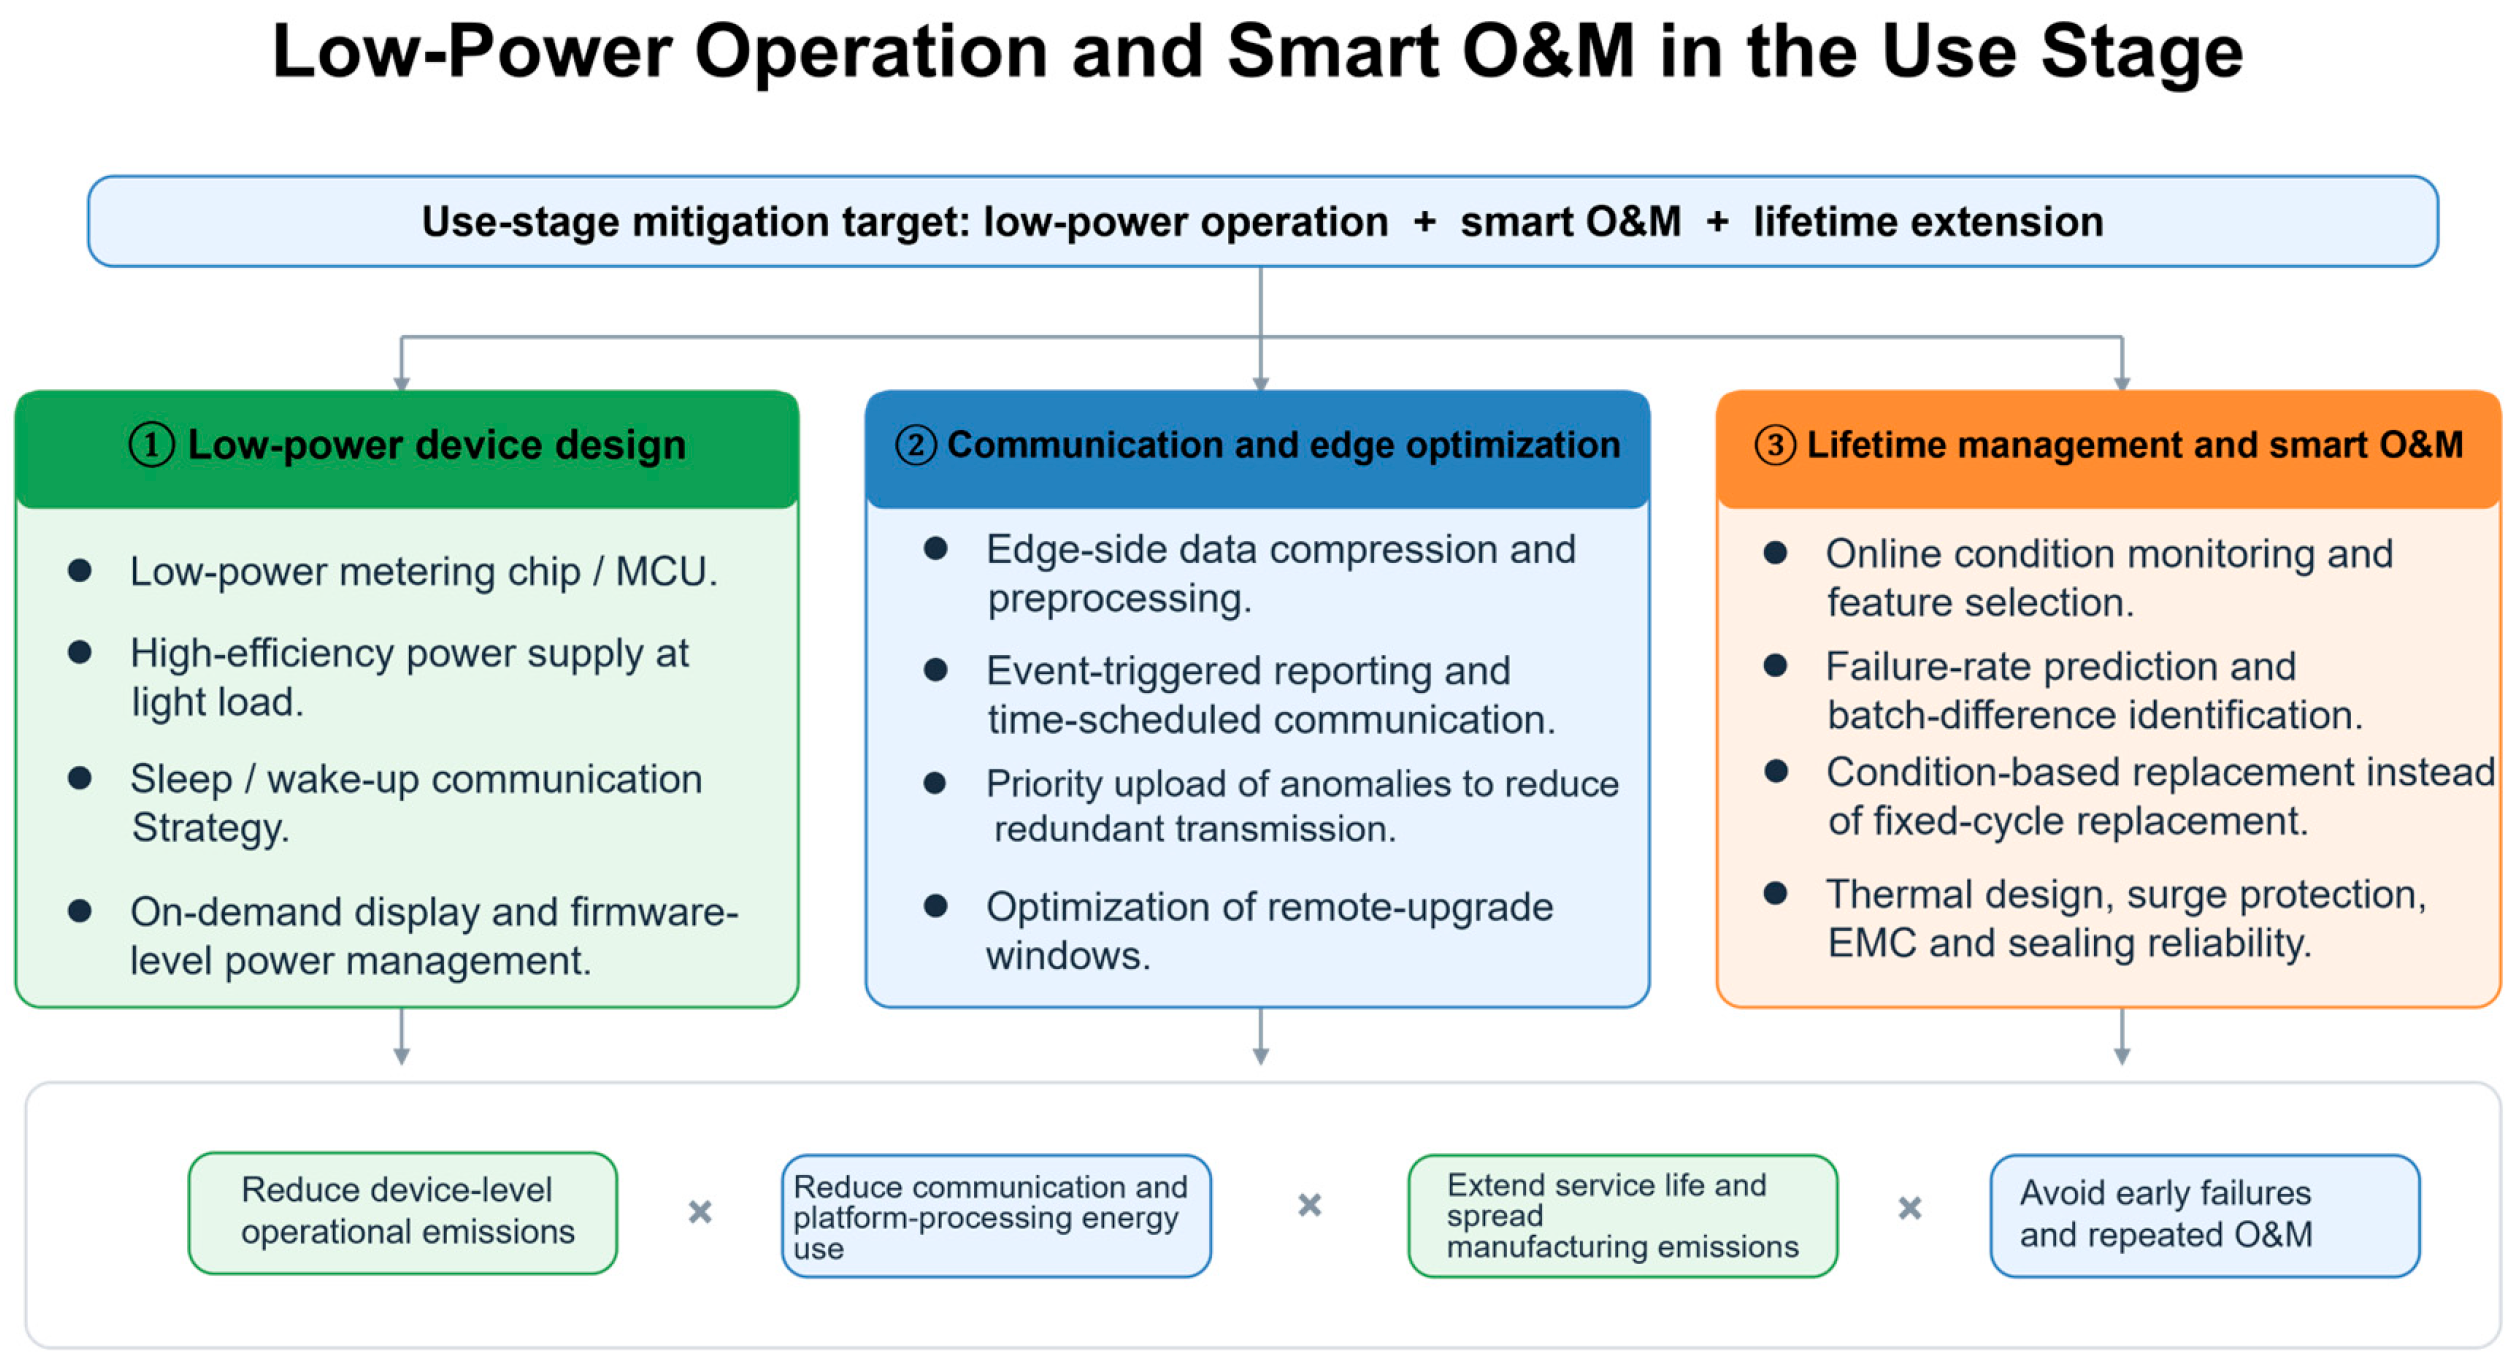
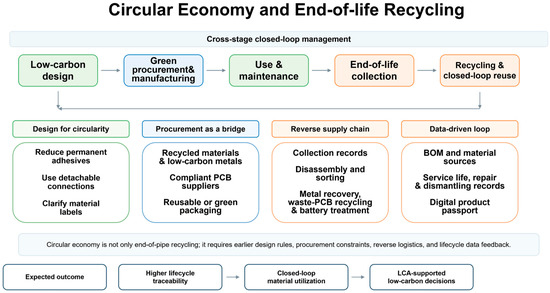
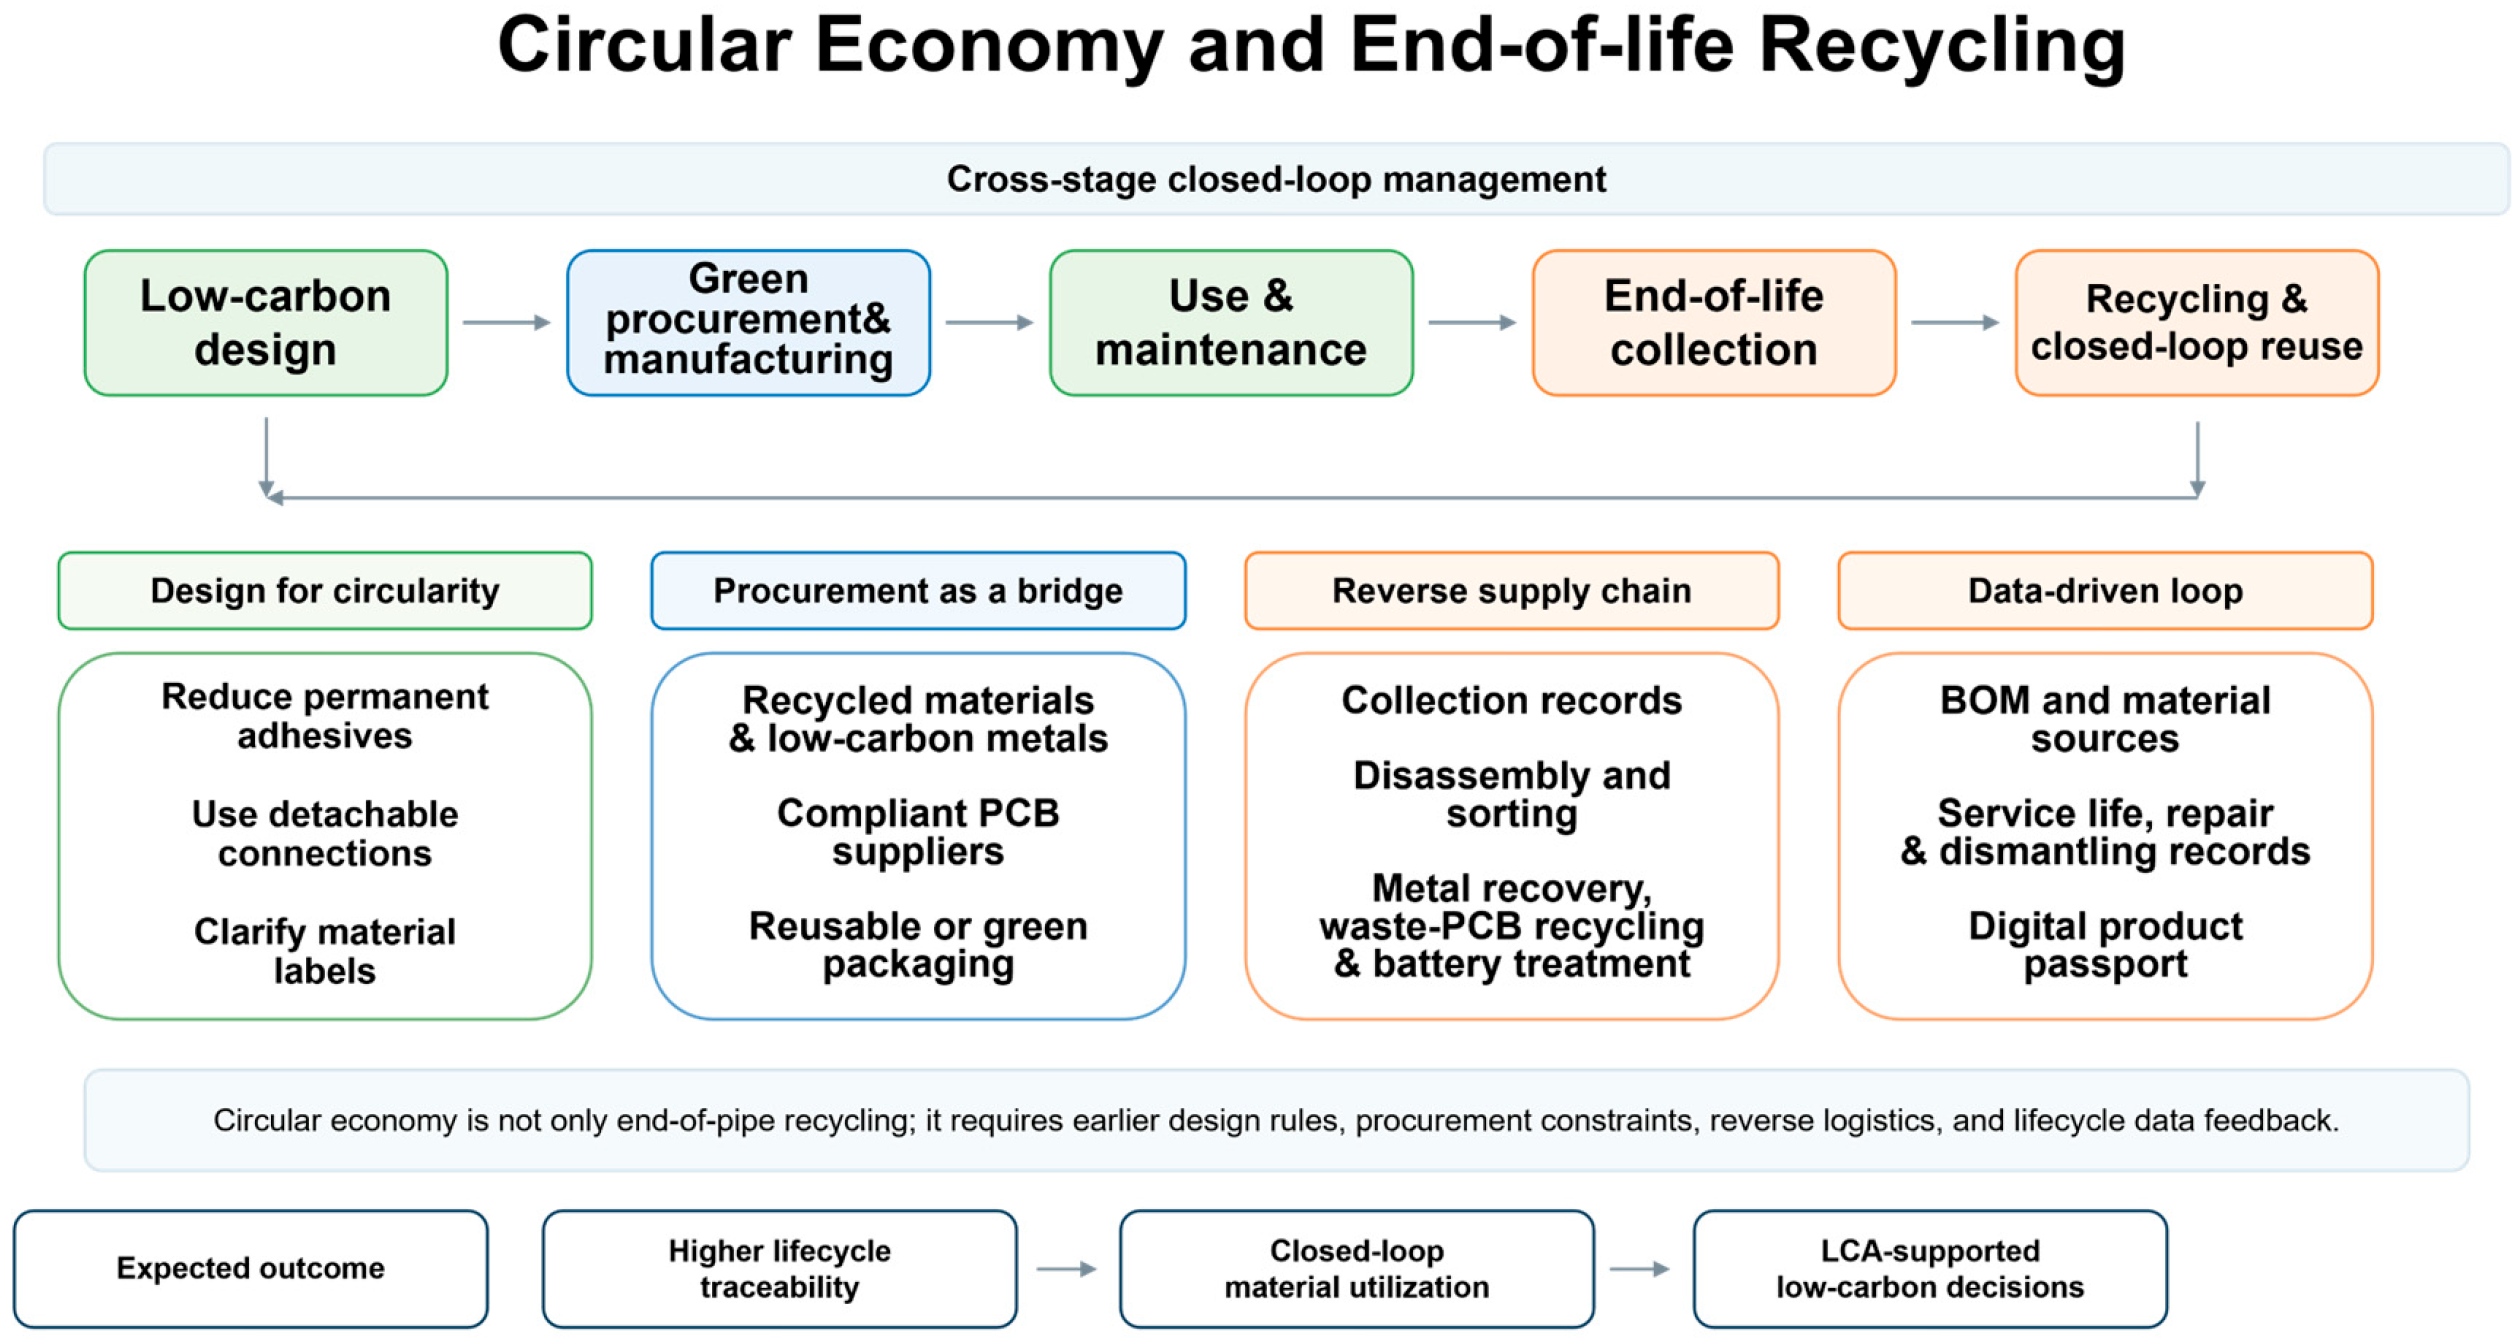

Disclaimer/Publisher’s Note: The statements, opinions and data contained in all publications are solely those of the individual author(s) and contributor(s) and not of MDPI and/or the editor(s). MDPI and/or the editor(s) disclaim responsibility for any injury to people or property resulting from any ideas, methods, instructions or products referred to in the content. |
© 2026 by the authors. Licensee MDPI, Basel, Switzerland. This article is an open access article distributed under the terms and conditions of the Creative Commons Attribution (CC BY) license.