


Abstract
This study investigates the effects of the length-to-diameter (L/D) ratio on the indirect tensile strength of red sandstone using Brazilian splitting tests combined with acoustic emission (AE) and digital image correlation (DIC) technology. Brazilian splitting tests were conducted on red sandstone disk specimens with a constant diameter of 50 mm and L/D ratios of 1.0, 0.8, 0.6, and 0.5. The results show that the apparent splitting strength decreased from 5.05 MPa at L/D = 0.5 to 1.35 MPa at L/D = 1.0, a reduction of 73.3%. As the L/D ratio decreased, the AE ring counts and energy release became increasingly concentrated near the peak load and exhibited more pronounced burst-like characteristics. Shear-type AE events increased from 62.4% to 82.9%, and tensile-type events decreased from 37.6% to 17.1%. The decrease in the AE b-value prior to failure indicates a transition of damage evolution from distributed small-scale microcrack activity to localized large-scale crack initiation, propagation, and coalescence. DIC showed that primary cracks initiated near the specimen center, whereas lower L/D ratios produced stronger localization, more secondary inclined cracks, and more abrupt failure. The higher calculated strengths obtained under low L/D conditions should be interpreted as apparent Brazilian splitting strengths resulting from the combined effects of specimen geometry and boundary constraints, rather than being directly regarded as the intrinsic tensile strength of red sandstone.
1. Introduction
Tensile failure is one of the fundamental modes of catastrophic failure and instability in rocks. Because the tensile strength of rock is generally much lower than its compressive strength, local tensile stresses can readily induce crack initiation even in geological environments dominated by compressive stress [1,2,3]. Therefore, tensile failure affects the stability of tunnels, slopes, underground openings, and energy-related operations involving excavation, blasting, or hydraulic fracturing. Reliable characterization of rock tensile strength is consequently essential for laboratory interpretation, engineering design, and risk assessment.
Direct tensile testing provides the most straightforward measurement, but specimen preparation, gripping, and load alignment remain technically demanding for brittle and heterogeneous rocks [3,4]. The Brazilian test is widely used due to its simplicity of operation [5]. The mechanical properties of rock are scale-dependent. As the size of the specimen increases, so too does the number of internal defects such as primary pores, microcracks, weak structural planes and mineral heterogeneity; these microstructural features collectively contribute to and influence the mechanical response of the rock. At the same time, boundary constraints and stress redistribution patterns may also change with size, thereby leading to differences in failure modes. This scale-dependent mechanical behavior is collectively referred to as the size effect in rock.
In recent years, research on the influence of the L/D ratio on rock mechanical properties has been continuously developed [6]. It is widely accepted that the uniaxial compressive strength (UCS) of rocks tends to decrease with increasing L/D ratio [7,8]. This phenomenon has been verified by the studies of Liu et al. [9] and Li et al. [10]. They attributed this to the fact that a larger L/D ratio is more prone to induce stress concentration inside the specimen, which causes earlier initiation and rapid propagation of cracks, thereby leading to a sharp decline in rock strength. In triaxial compression tests, the triaxial strength of rocks is usually enhanced with the increase in confining pressure, yet the increase in L/D ratio will inhibit this strengthening effect. For instance, Zhu et al. [11] conducted triaxial compression tests on siltstone samples with the same diameter but different heights. The results demonstrated that under the same confining pressure condition, the compressive strength of rocks decreases with the increase in L/D ratio. Manuel et al. [5] investigated the mechanical properties of rock samples with different diameters but the same L/D ratio by performing multiple triaxial tests on granite samples with confining pressures ranging from 0.2 to 15 MPa and diameters ranging from 30 to 84 mm. The test results indicated that under low confining pressure, the peak strength first increases and then decreases with the increase in diameter, whereas this trend becomes less pronounced under high confining pressure. They argued that the closure of microcracks under high confining pressure weakens the impact of this effect, which is consistent with the viewpoint of Aubertin et al. [12]. With the increase in the L/D ratio, the tensile strength of rocks shows a certain degree of decreasing trend [13,14]. Su et al. [15] pointed out that the tensile strength of red sandstone decreases significantly with the increase in the L/D ratio. Yin et al. [16] further verified this phenomenon, and the results showed that with the increase in the L/D ratio, the tensile strength decreases in a cubic relationship. Xu et al. [17] prepared samples of marble, siliceous gritstone, and carbonaceous mudstone with the same diameter (50 mm) but different thicknesses (20–50 mm). Their analysis revealed the influence of the sample L/D ratio on the indirect tensile strength of rocks: the higher the uniaxial compressive strength of the rock, the more obvious the change in Brazilian splitting strength with the L/D ratio. He et al. [18] improved the measurement method via digital image correlation (DIC) technology and found that an increase in the L/D ratio not only gradually reduces the tensile strength but also exerts a significant influence on the crack initiation position and propagation path.
Although the effect of the L/D ratio on rock mechanical behavior has been extensively studied, most investigations have focused on uniaxial and triaxial compression tests, while studies under tensile loading, especially Brazilian splitting tests, remain limited. Existing research typically evaluates the L/D effect in terms of peak intensity. The influence of L/D ratio on the coupled evolution of strain localization, crack propagation, and failure modes in Brazilian splitting tests remains unclear.
To address this gap, through Brazilian splitting tests combined with AE-DIC technology, the influence of the L/D ratio on the tensile strength, microcrack evolution law, energy characteristics, failure process, and surface strain evolution law of sandstone is investigated. The research results can provide a scientific theoretical basis for the optimal structural design in rock engineering and are of great significance for ensuring the construction safety of projects and reducing accident risks.
2. Materials and Methods
2.1. Sample Preparation
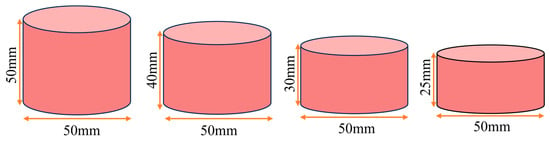
Red sandstone from Yunnan Province, China, was selected as the test material. Its mineral composition was determined using a polarizing microscope: quartz accounts for 60%, feldspar 20%, calcite 15%, and sericite 1%. In rigid compliance with the testing standards regulated by the ISRM, all specimens were prepared through sequential processes of drilling, cutting, and grinding [19]. The upper and lower surfaces of the specimens were carefully polished, with the flatness of the surfaces controlled within ±0.05 mm. In addition, the angular deviation between the upper and lower surfaces was maintained within ±0.25° to ensure proper parallelism. As shown in Figure 1, cylindrical samples with a diameter of 50 mm and heights of 25 mm, 30 mm, 40 mm, and 50 mm were prepared. For each L/D ratio, three valid replicate specimens were tested, resulting in a total of 12 specimens.
Figure 1.
Rock samples with different L/D ratios.
To reduce the discreteness of the specimens, samples with abnormal wave velocities were excluded. Subsequently, three parallel tests were conducted for each group of specimens with similar P-wave velocities to ensure the reliability of the experimental results. The basic physical parameters of the tested specimens are listed in Table 1.
Table 1.
Basic mechanical properties of red sandstone.
2.2. Experimental Equipment
The test equipment was an ISTRON universal testing machine, which mainly consists of a control panel, a loading unit, and a data acquisition unit. The maximum axial static stress it can apply reaches 1000 KN with a displacement rate range of 0–100 mm/min and a load application rate range of 0.01–50 KN/s. In this test, force-controlled loading was employed at a loading rate of 1 KN/min.
Acoustic emission (AE) monitoring was conducted using a PCI-2 AE system (Mistras Group Inc., Princeton Junction, NJ, USA), consisting of an AE acquisition unit, preamplifiers, sensors, and associated data acquisition and analysis software. The system provides an 18-bit A/D resolution, a maximum sampling rate of 40 MSPS, and a frequency response range of 1 kHz to 3000 kHz. During the Brazilian splitting tests, AE signals were continuously recorded throughout the entire loading and failure process of the rock specimens. The main acquisition parameters were set as follows: a threshold of 45 dB, a floating threshold parameter of 6 dB, a preamplifier gain of 40 dB, an analog band-pass filter range of 1 kHz–3 MHz, a sampling rate of 10 MSPS, and a pre-trigger setting of 256 samples. Two AE sensors were attached to the cylindrical lateral surface on the same side of the specimen. To ensure effective transmission of AE signals and minimize interfacial coupling loss, petroleum jelly was uniformly applied between the AE sensor and the specimen surface as a coupling agent.
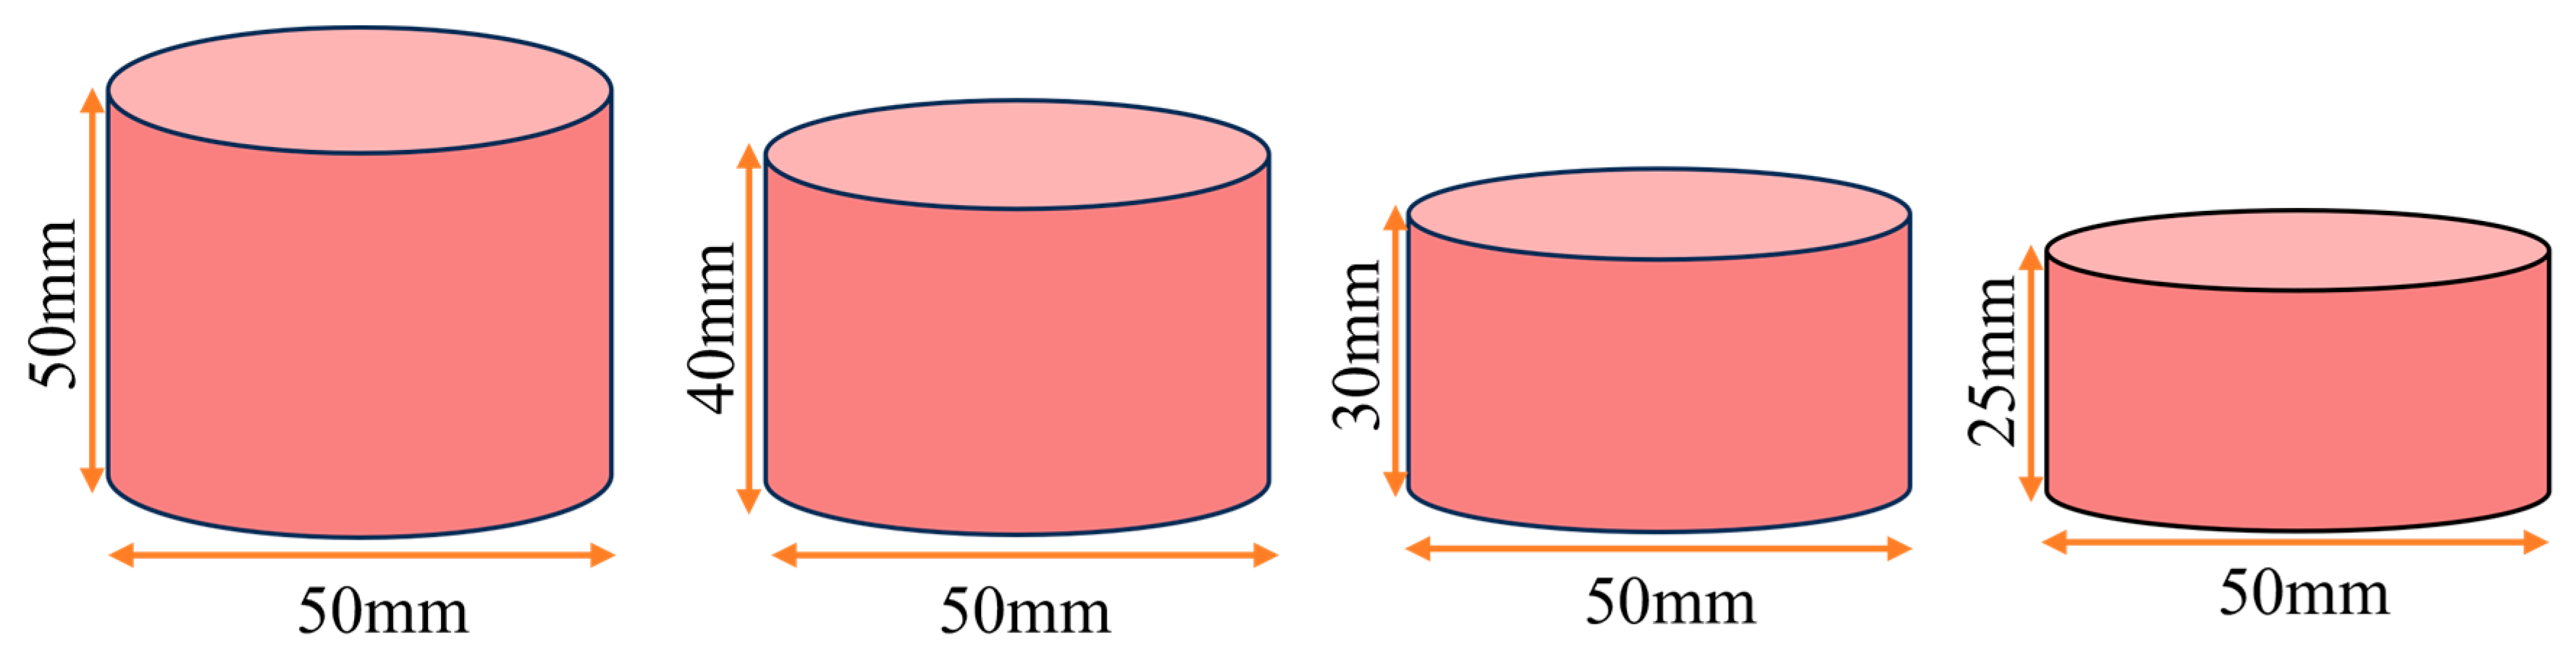
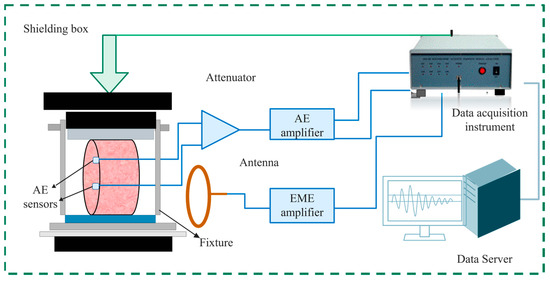
Digital image correlation (DIC) was employed to continuously monitor the full-field deformation, strain evolution, and crack propagation of the rock specimens throughout the loading process. To obtain a high-contrast surface texture with reliable image correlation, the specimen surfaces were first coated with a thin and uniform layer of matte white paint. Subsequently, randomly distributed black speckles were applied using a black marker pen to generate a stochastic speckle pattern suitable for full-field displacement and strain measurements. Images were acquired using a FASTCAM Mini AX 200 high-speed camera (Photron Ltd., Tokyo, Japan)equipped with a 1-megapixel CMOS sensor. The image sequences used for DIC analysis were recorded at a resolution of 1024 × 1024 pixels and a frame rate of 120 fps. A schematic diagram of the test system is shown in Figure 2.
Figure 2.
Brazilian splitting test system.
3. Results
3.1. Influence of L/D Ratio on Brazilian Splitting Strength
In the central cracking mode, the tensile strength of rock in the Brazilian split test can be calculated using the following mathematical expression:
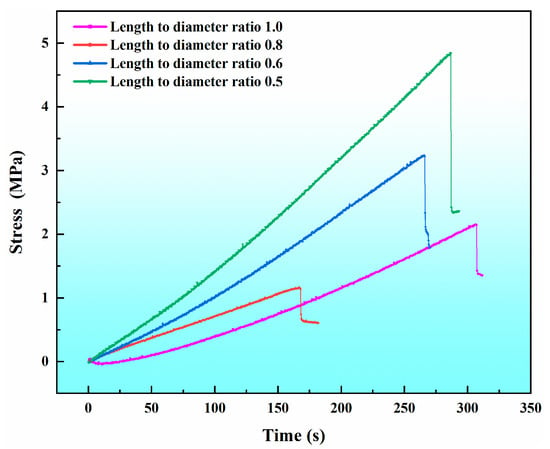
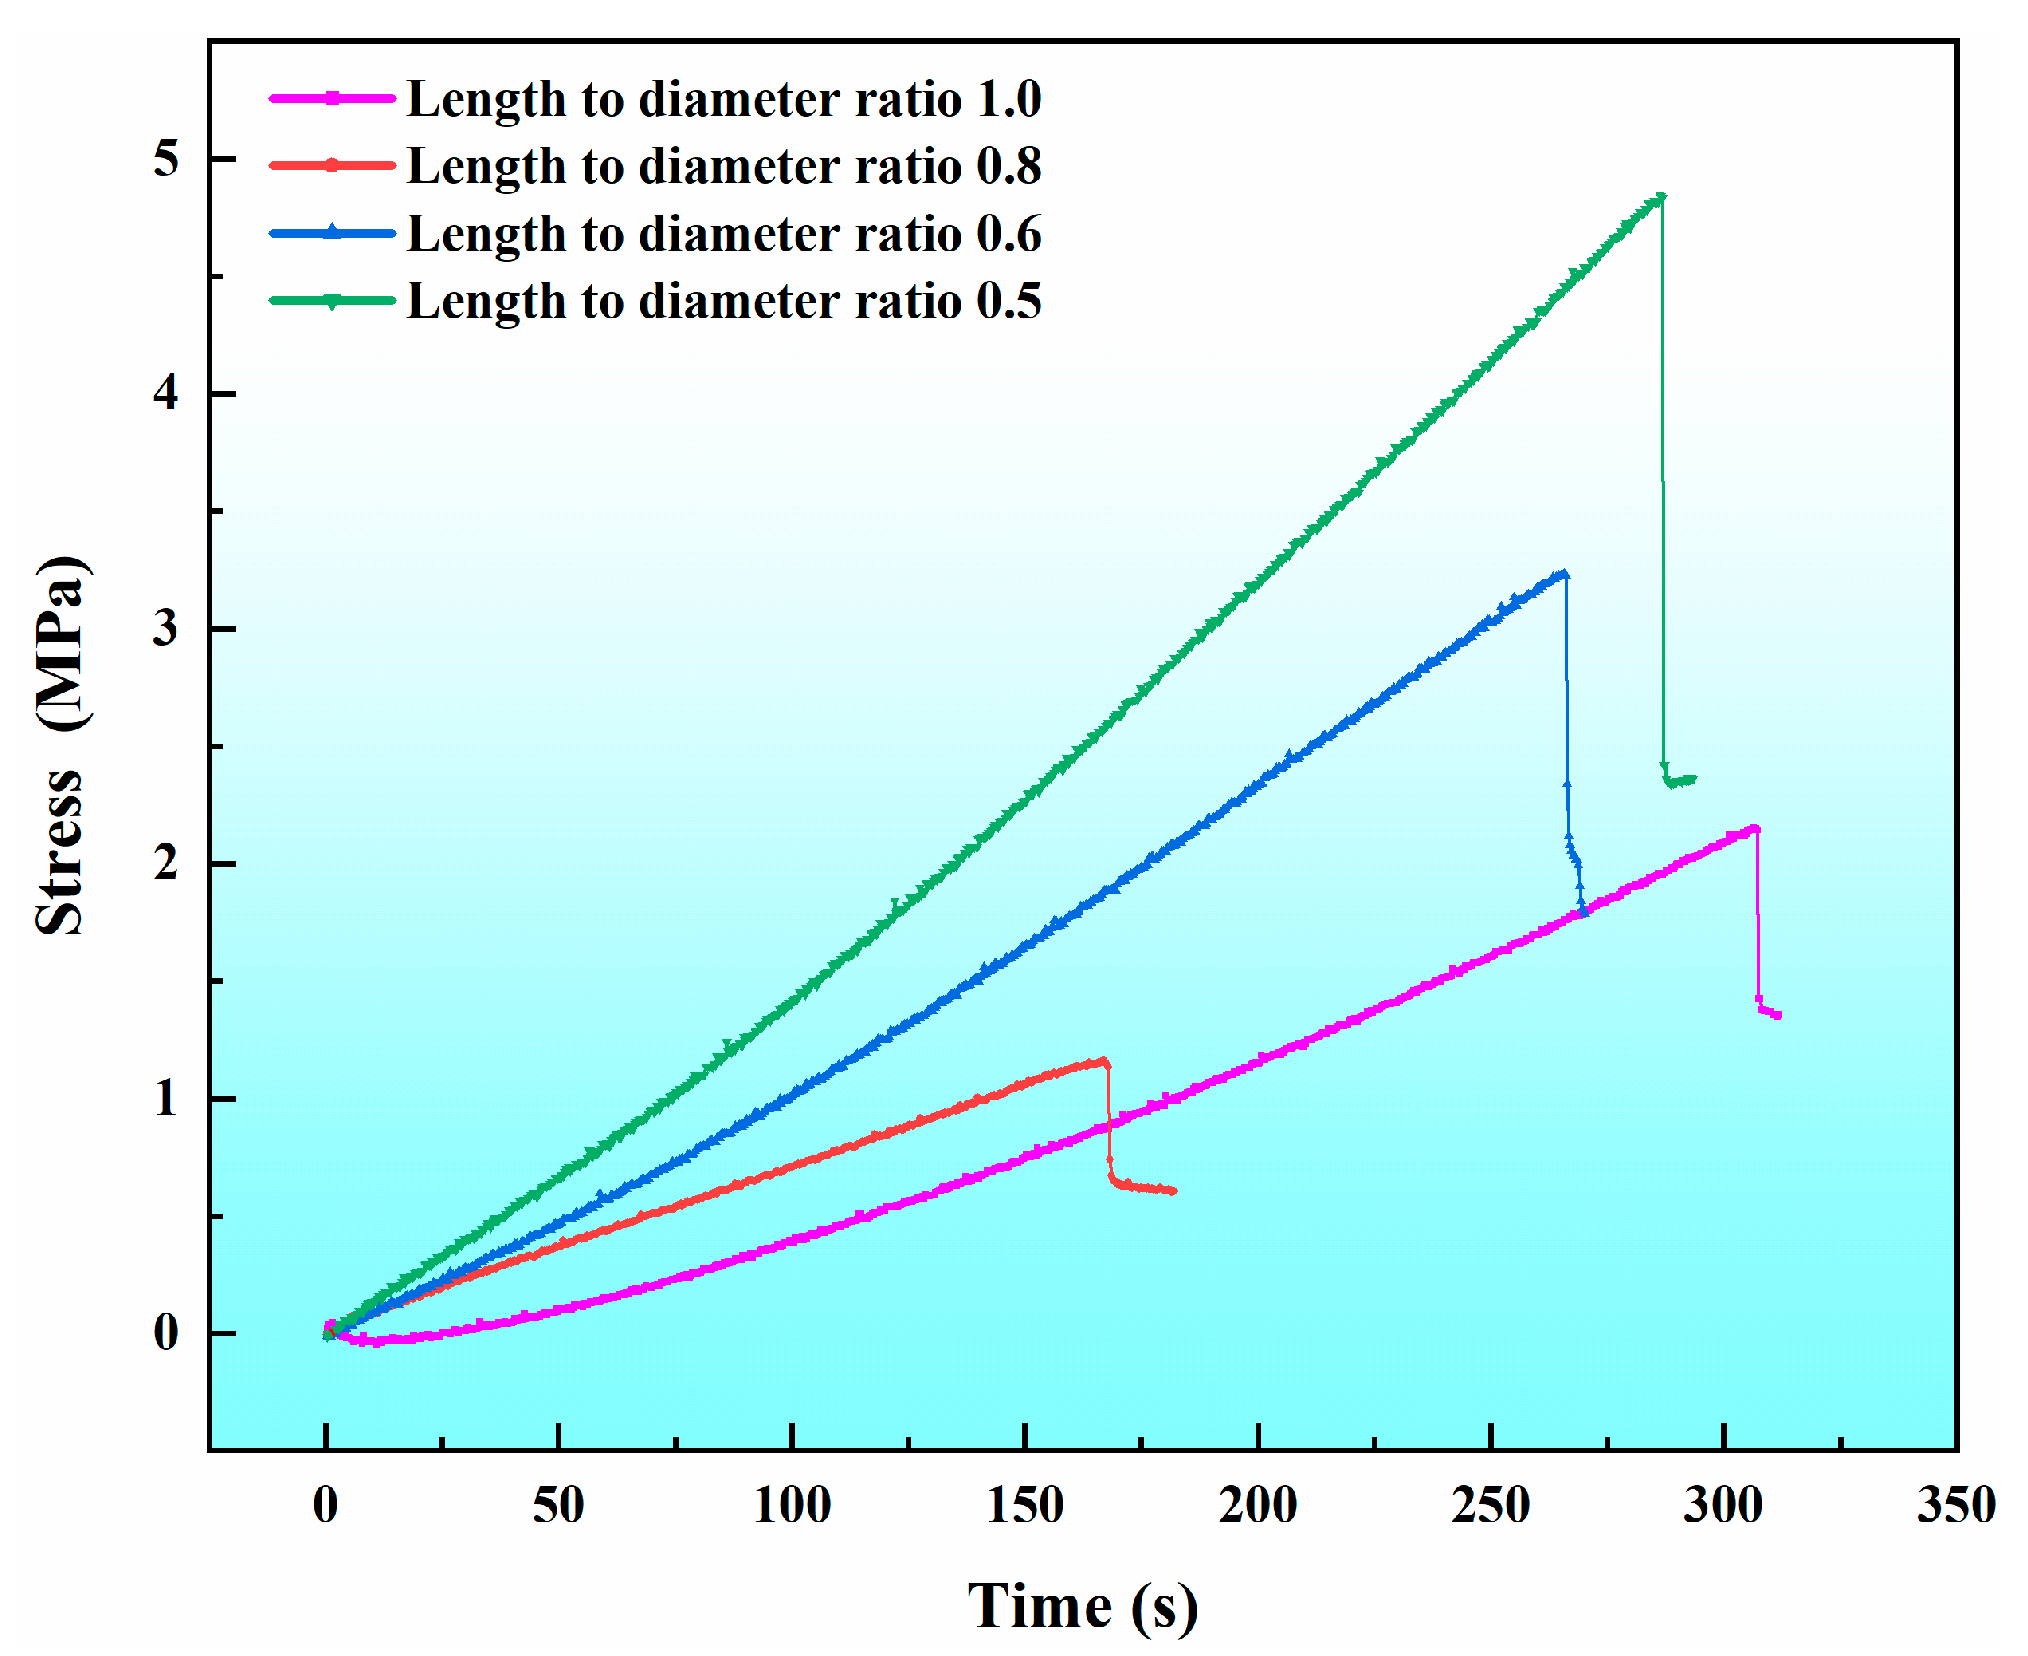
where P is the peak load at failure, and D and H denote the diameter and thickness of the disk specimen, respectively. Based on the above equation, the tensile strength of the rock specimens with different L/D ratios was calculated. Figure 3 presents the representative stress–time curves of specimens with different L/D ratios.
Figure 3.
Representative stress–time curves of specimens with different L/D ratios.
The coefficient of variation (CV) was defined as the ratio of the standard deviation to the mean of the experimentally measured peak stress, and was used to characterize the dispersion of the experimental results. The individual results and corresponding statistical parameters are summarized in Table 2. The mean calculated peak stresses were 1.35 ± 0.15, 2.01 ± 0.15, 3.32 ± 0.09, and 5.05 ± 0.05 MPa for L/D ratios of 1.0, 0.8, 0.6, and 0.5, respectively. The values of CV were 11.07%, 7.23%, 2.71%, and 1.02%, indicating relatively limited within-group variability. The results showed that the specimens exhibited almost no post-peak stage, indicating pronounced brittle failure characteristics. As the thickness of the disk specimens decreased, the peak strength of the sandstone gradually increased. In addition, the dispersion of peak stress, as characterized by the coefficient of variation, decreased with decreasing L/D ratio. Overall, the experimental results exhibited relatively low variability.
Table 2.
Statistical summary of the calculated Brazilian splitting strength for specimens with different L/D ratios.
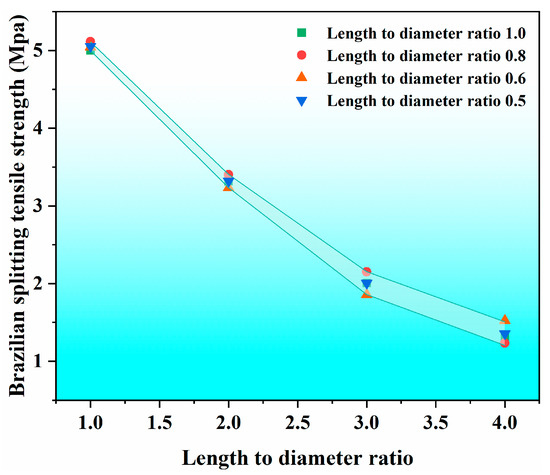
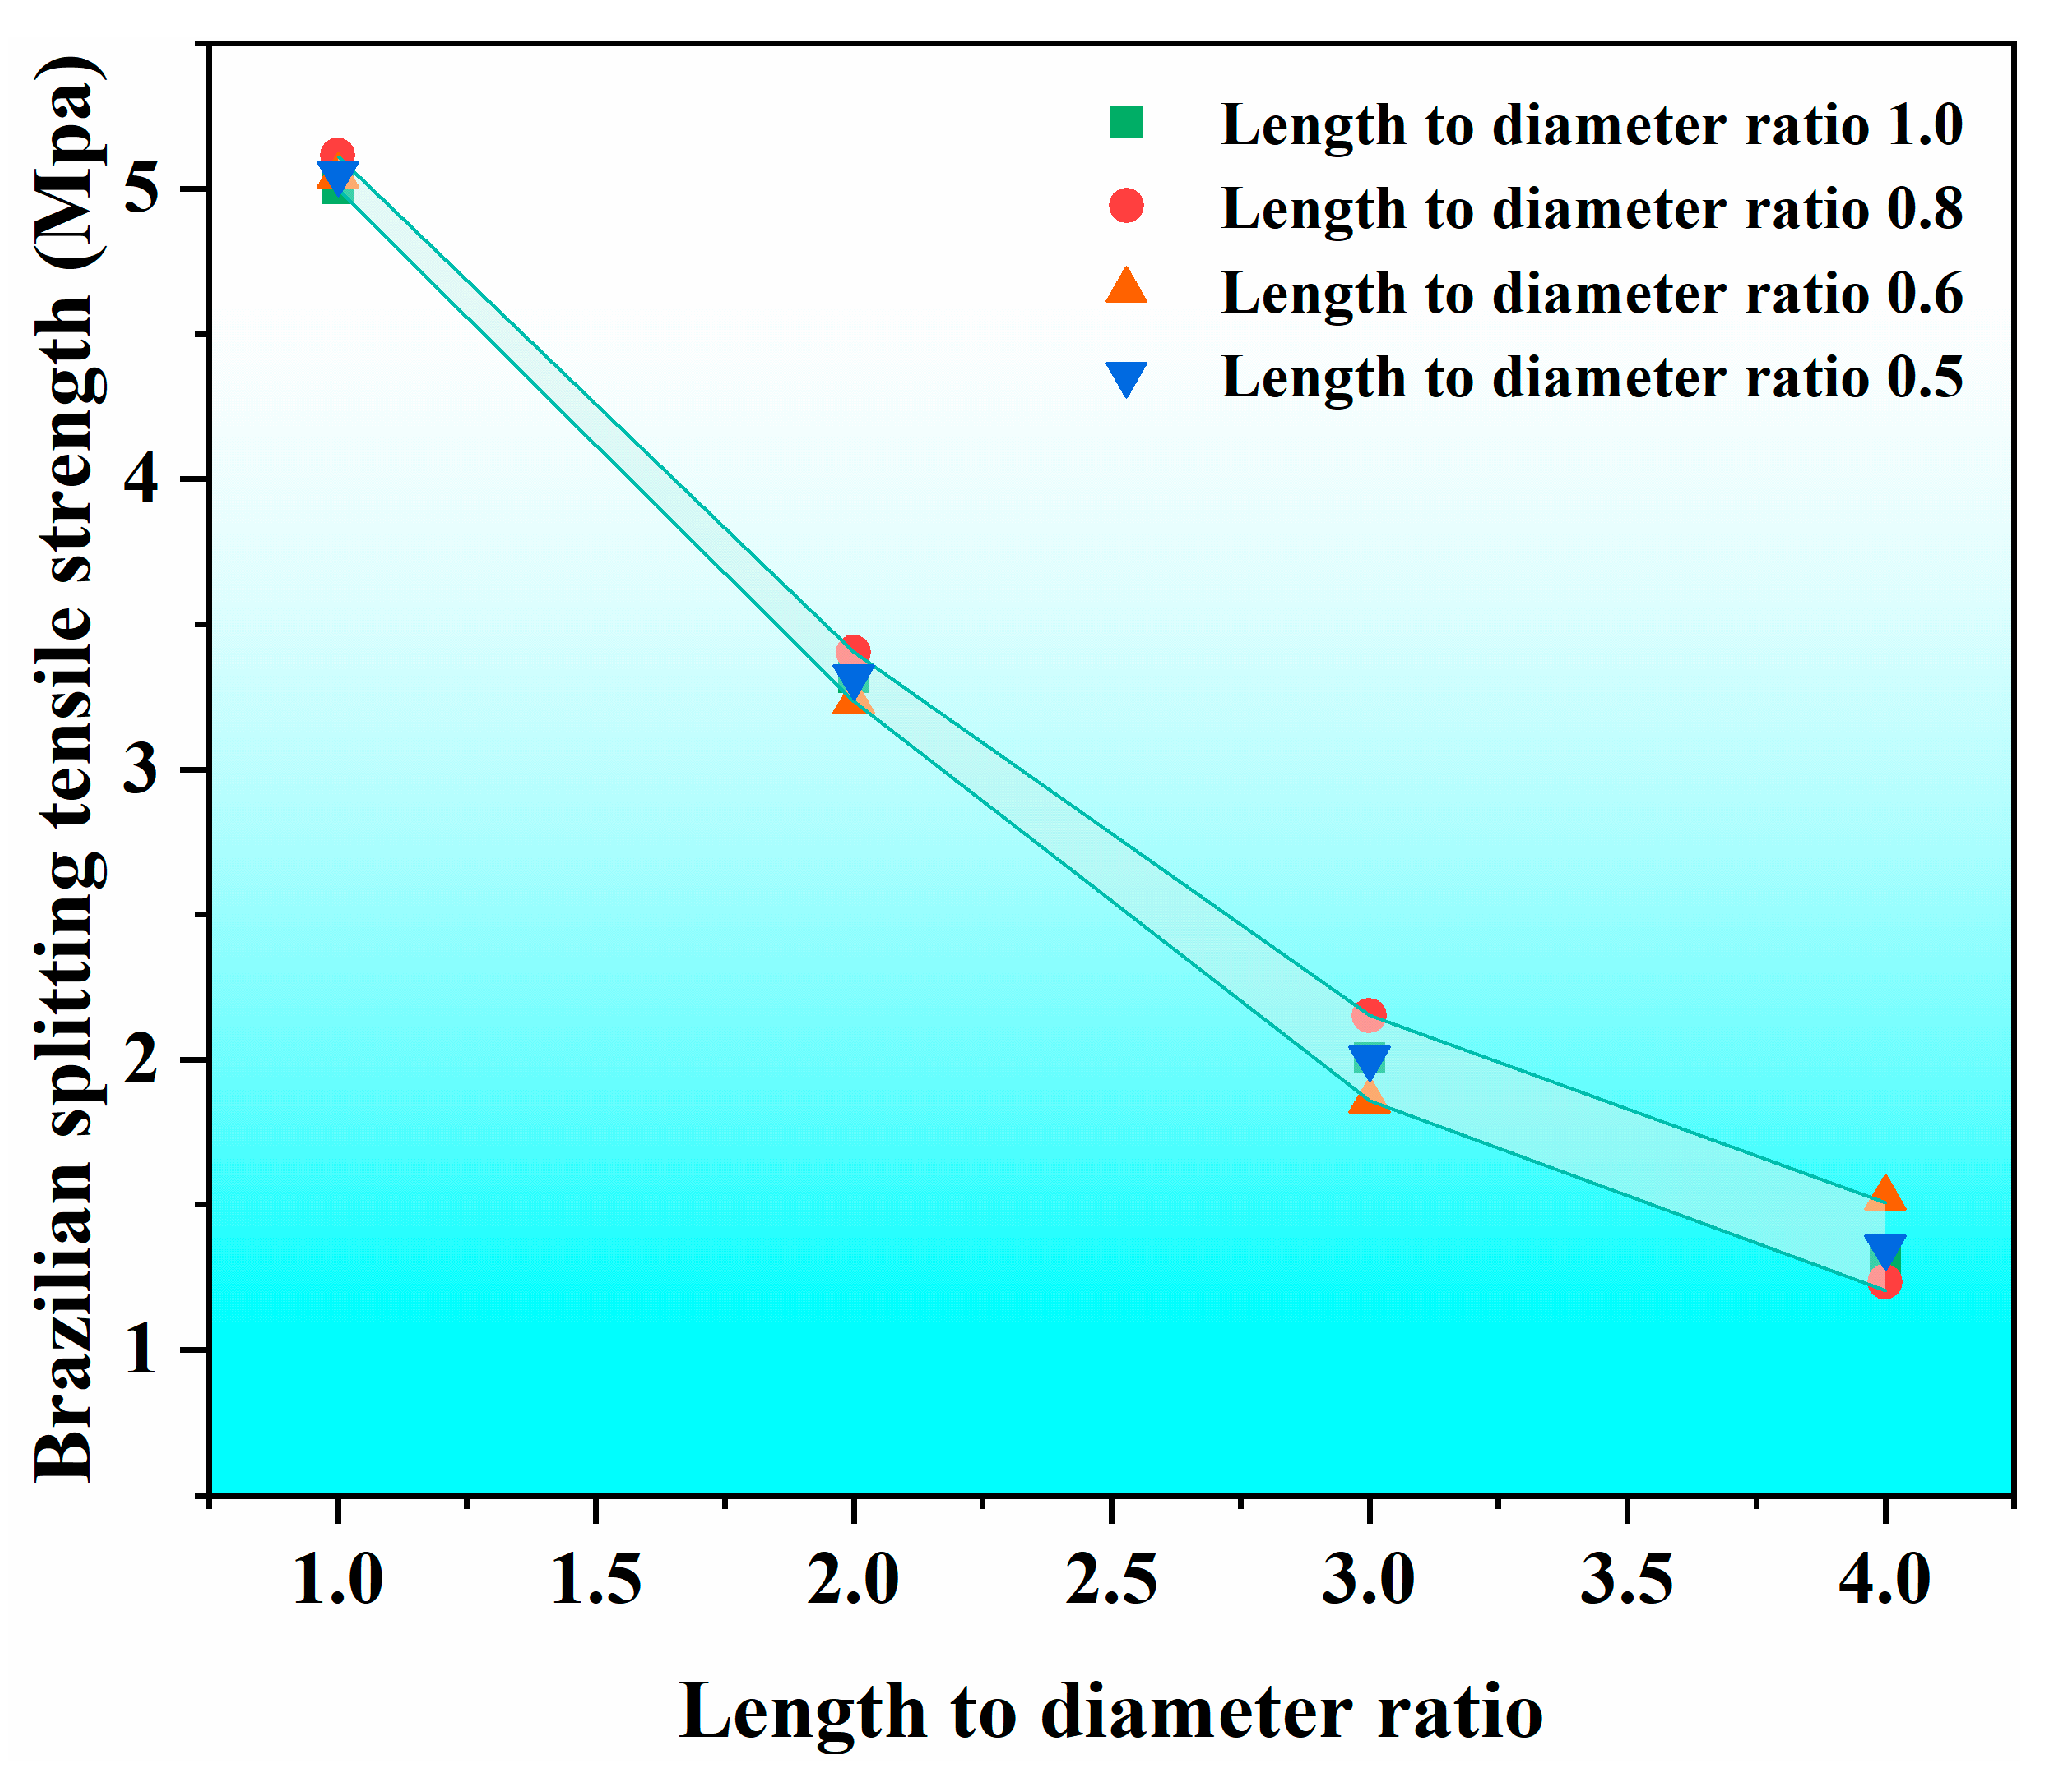
Figure 4 further illustrates the relationship between the L/D ratio and the Brazilian splitting strength. The mean values and the corresponding standard deviations obtained from three replicate specimens are presented together with the individual experimental results. As the L/D ratio increased from 0.5 to 1.0, the mean calculated Brazilian splitting strength decreased from 5.05 MPa to 1.35 MPa, corresponding to a reduction of approximately 73.3%. This result demonstrates a pronounced geometry-dependent variation in the calculated Brazilian splitting strength within the investigated L/D range. An empirical quadratic function was fitted to the four group-mean values, yielding R2 = 0.961. However, because only four L/D levels were investigated, the fitted relationship is used only to describe the variation within the tested range of 0.5–1.0 and should not be extrapolated beyond this range.
Figure 4.
Brazilian splitting strength of rock samples with different L/D ratios.
3.2. Failure Modes
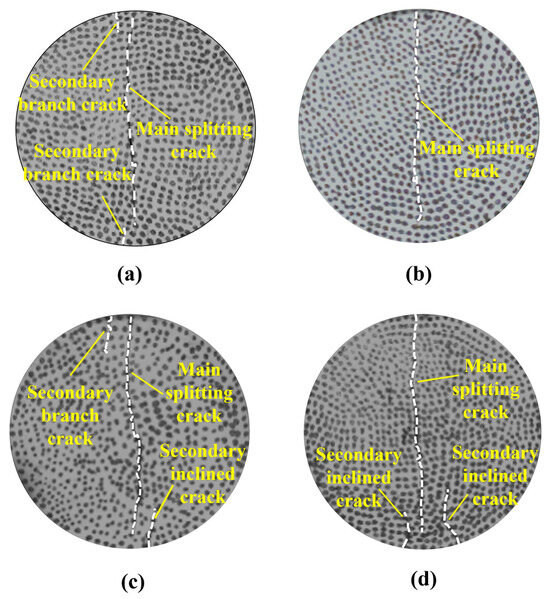
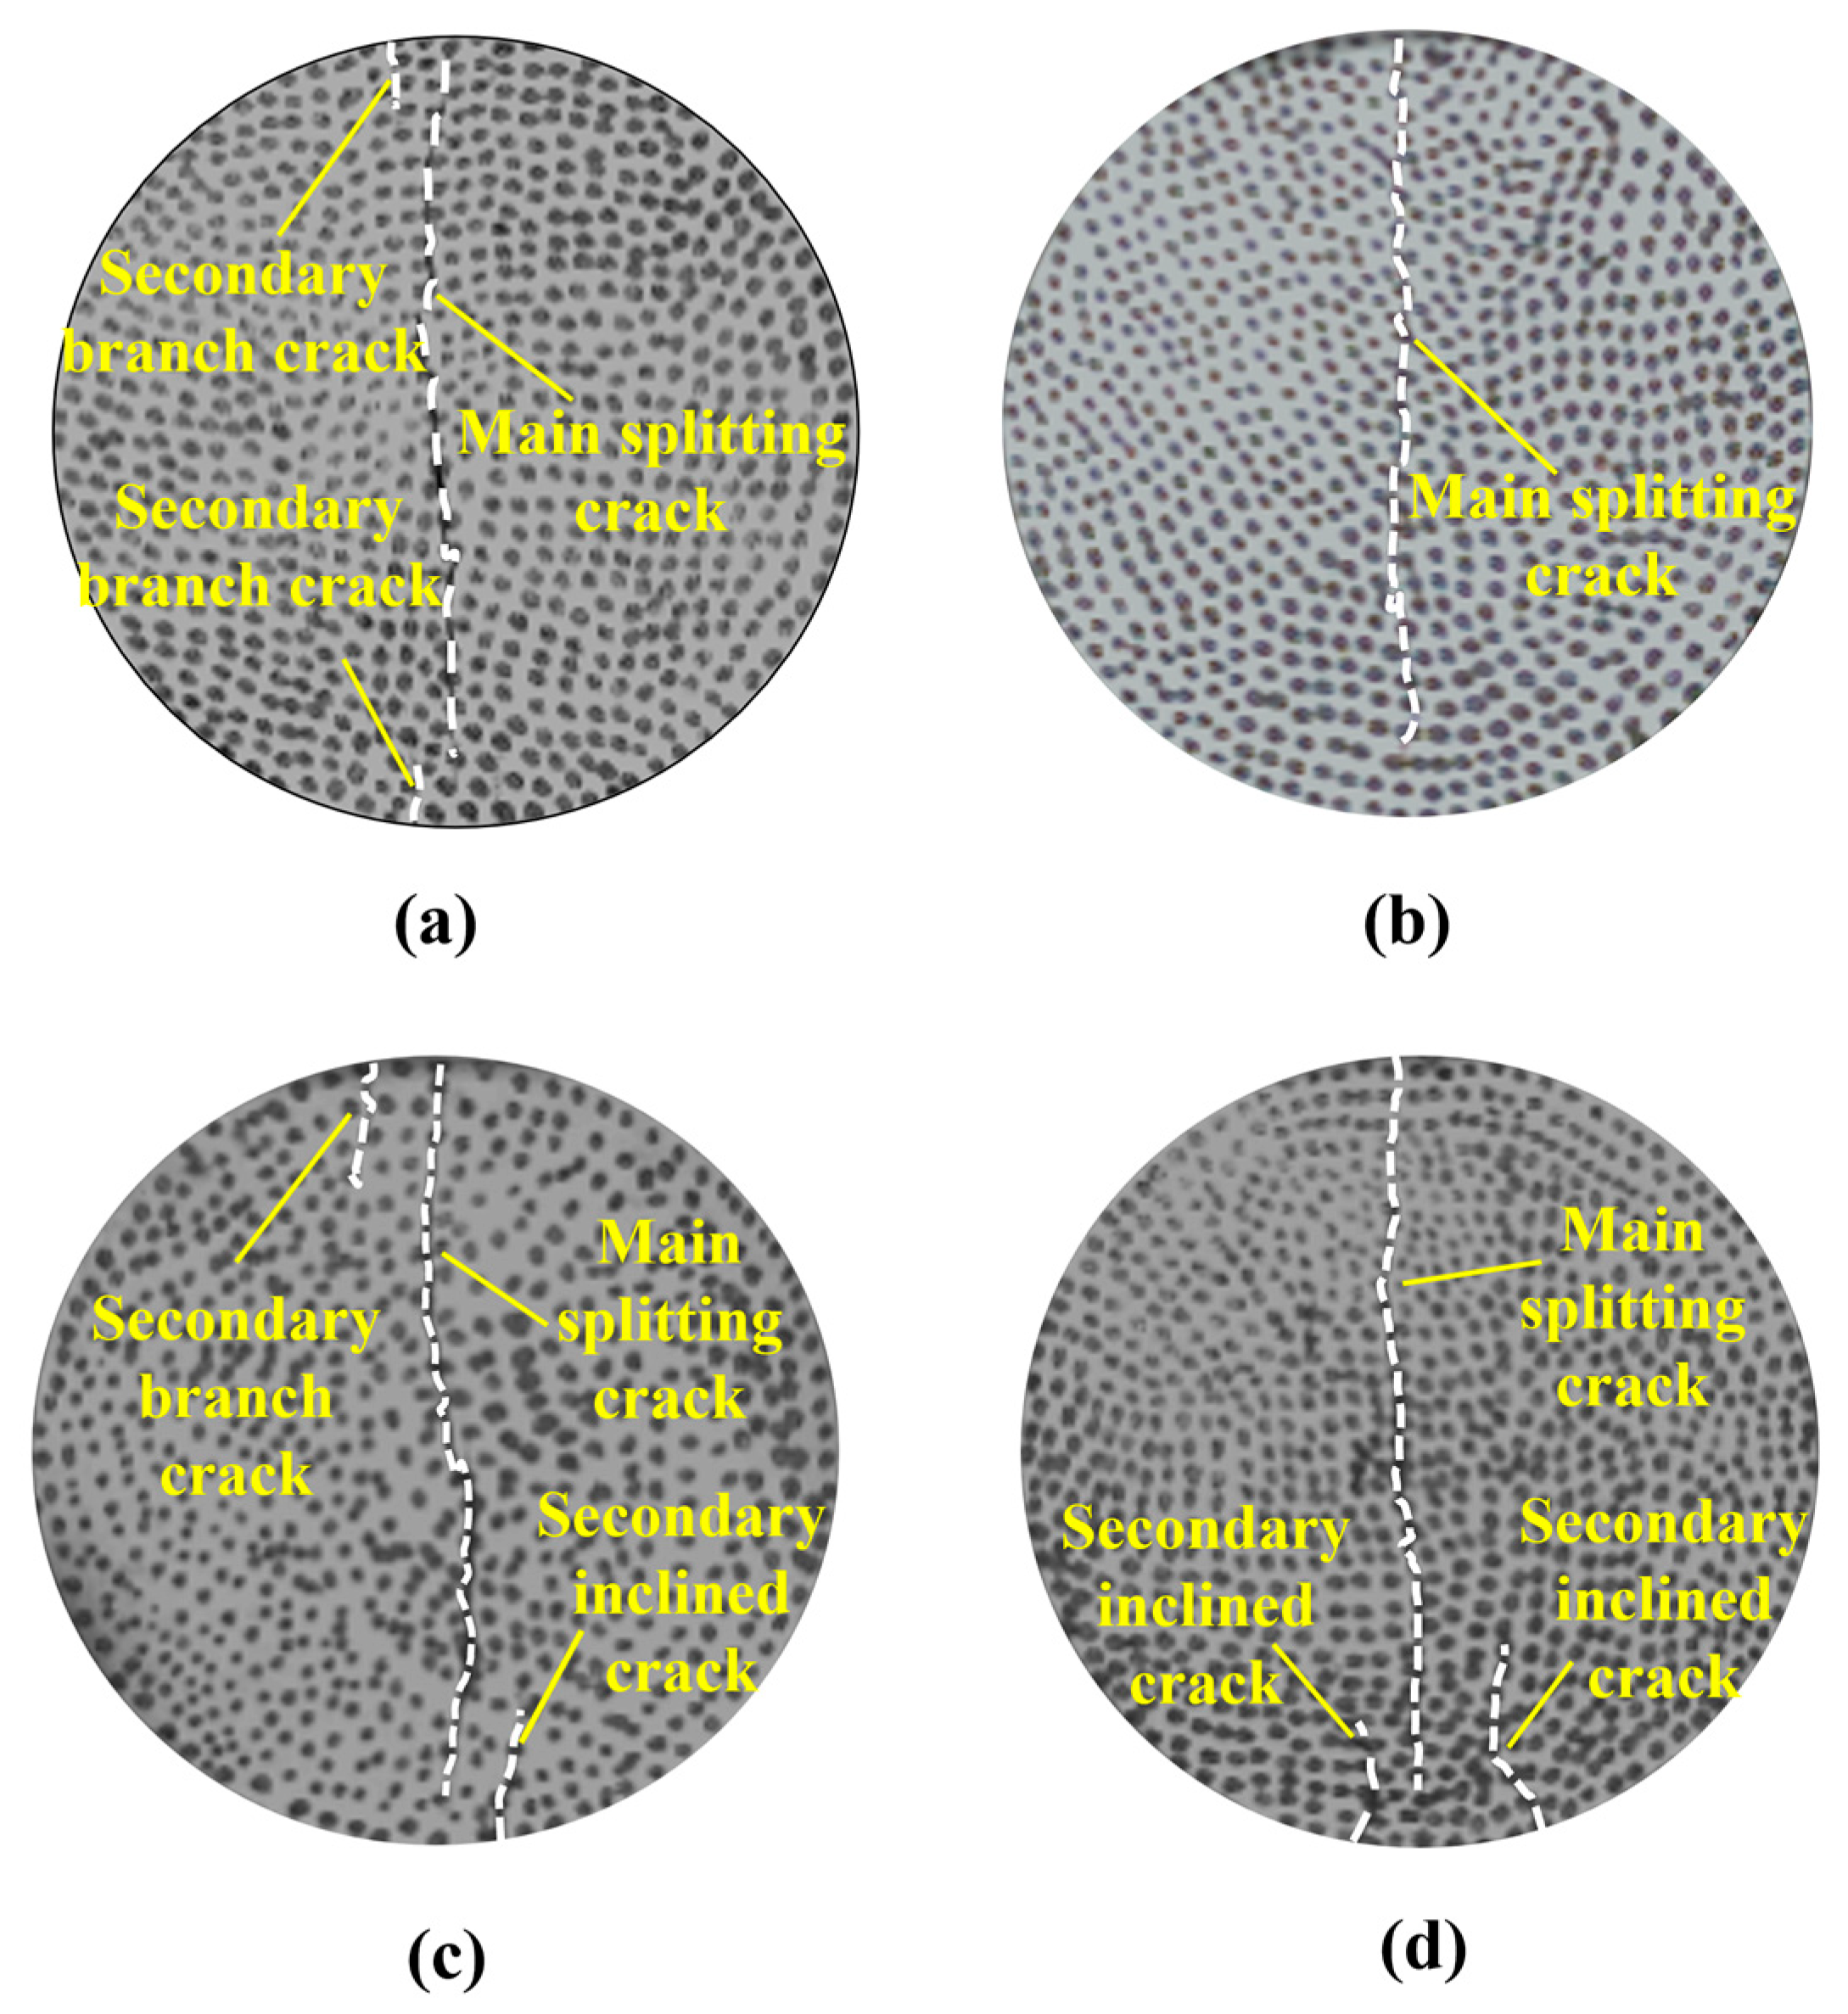
Typical final macroscopic fracture patterns of the specimens after Brazilian splitting tests are shown in Figure 5. Overall, the specimens exhibited a tensile-dominated failure mode, as the main fracture generally develops along the loading diameter. However, the occurrence of secondary inclined cracks, branch cracks, and crack deflection in specimens with lower L/D ratios suggests that the fracture process becomes more complex as the L/D ratio decreases. Therefore, the identification of the underlying cracking mechanism is further supported by AE RA–AF classification and DIC strain localization analysis. For the specimen with an L/D ratio of 1.0, the fracture pattern is characterized by a dominant main splitting crack accompanied by several secondary branch cracks. When the L/D ratio decreases to 0.8, the specimen mainly exhibits a single main splitting crack, and the final fracture morphology is relatively simple. For specimens with L/D ratios of 0.6 and 0.5, the fracture morphology becomes more complex, with secondary inclined cracks, branch cracks, and local crack deflection observed near the main splitting path. These observations indicate that the L/D ratio affects the final macroscopic fracture pattern of the disk specimens.
Figure 5.
Final failure modes of typical rock samples with different L/D ratios: (a) L/D ratio = 1.0, (b) L/D ratio = 0.8, (c) L/D ratio = 0.6, (d) L/D ratio = 0.5.
3.3. Rock Failure Based on DIC Technology
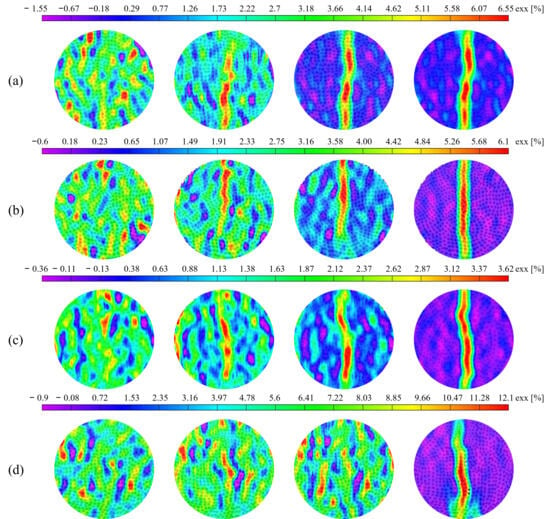
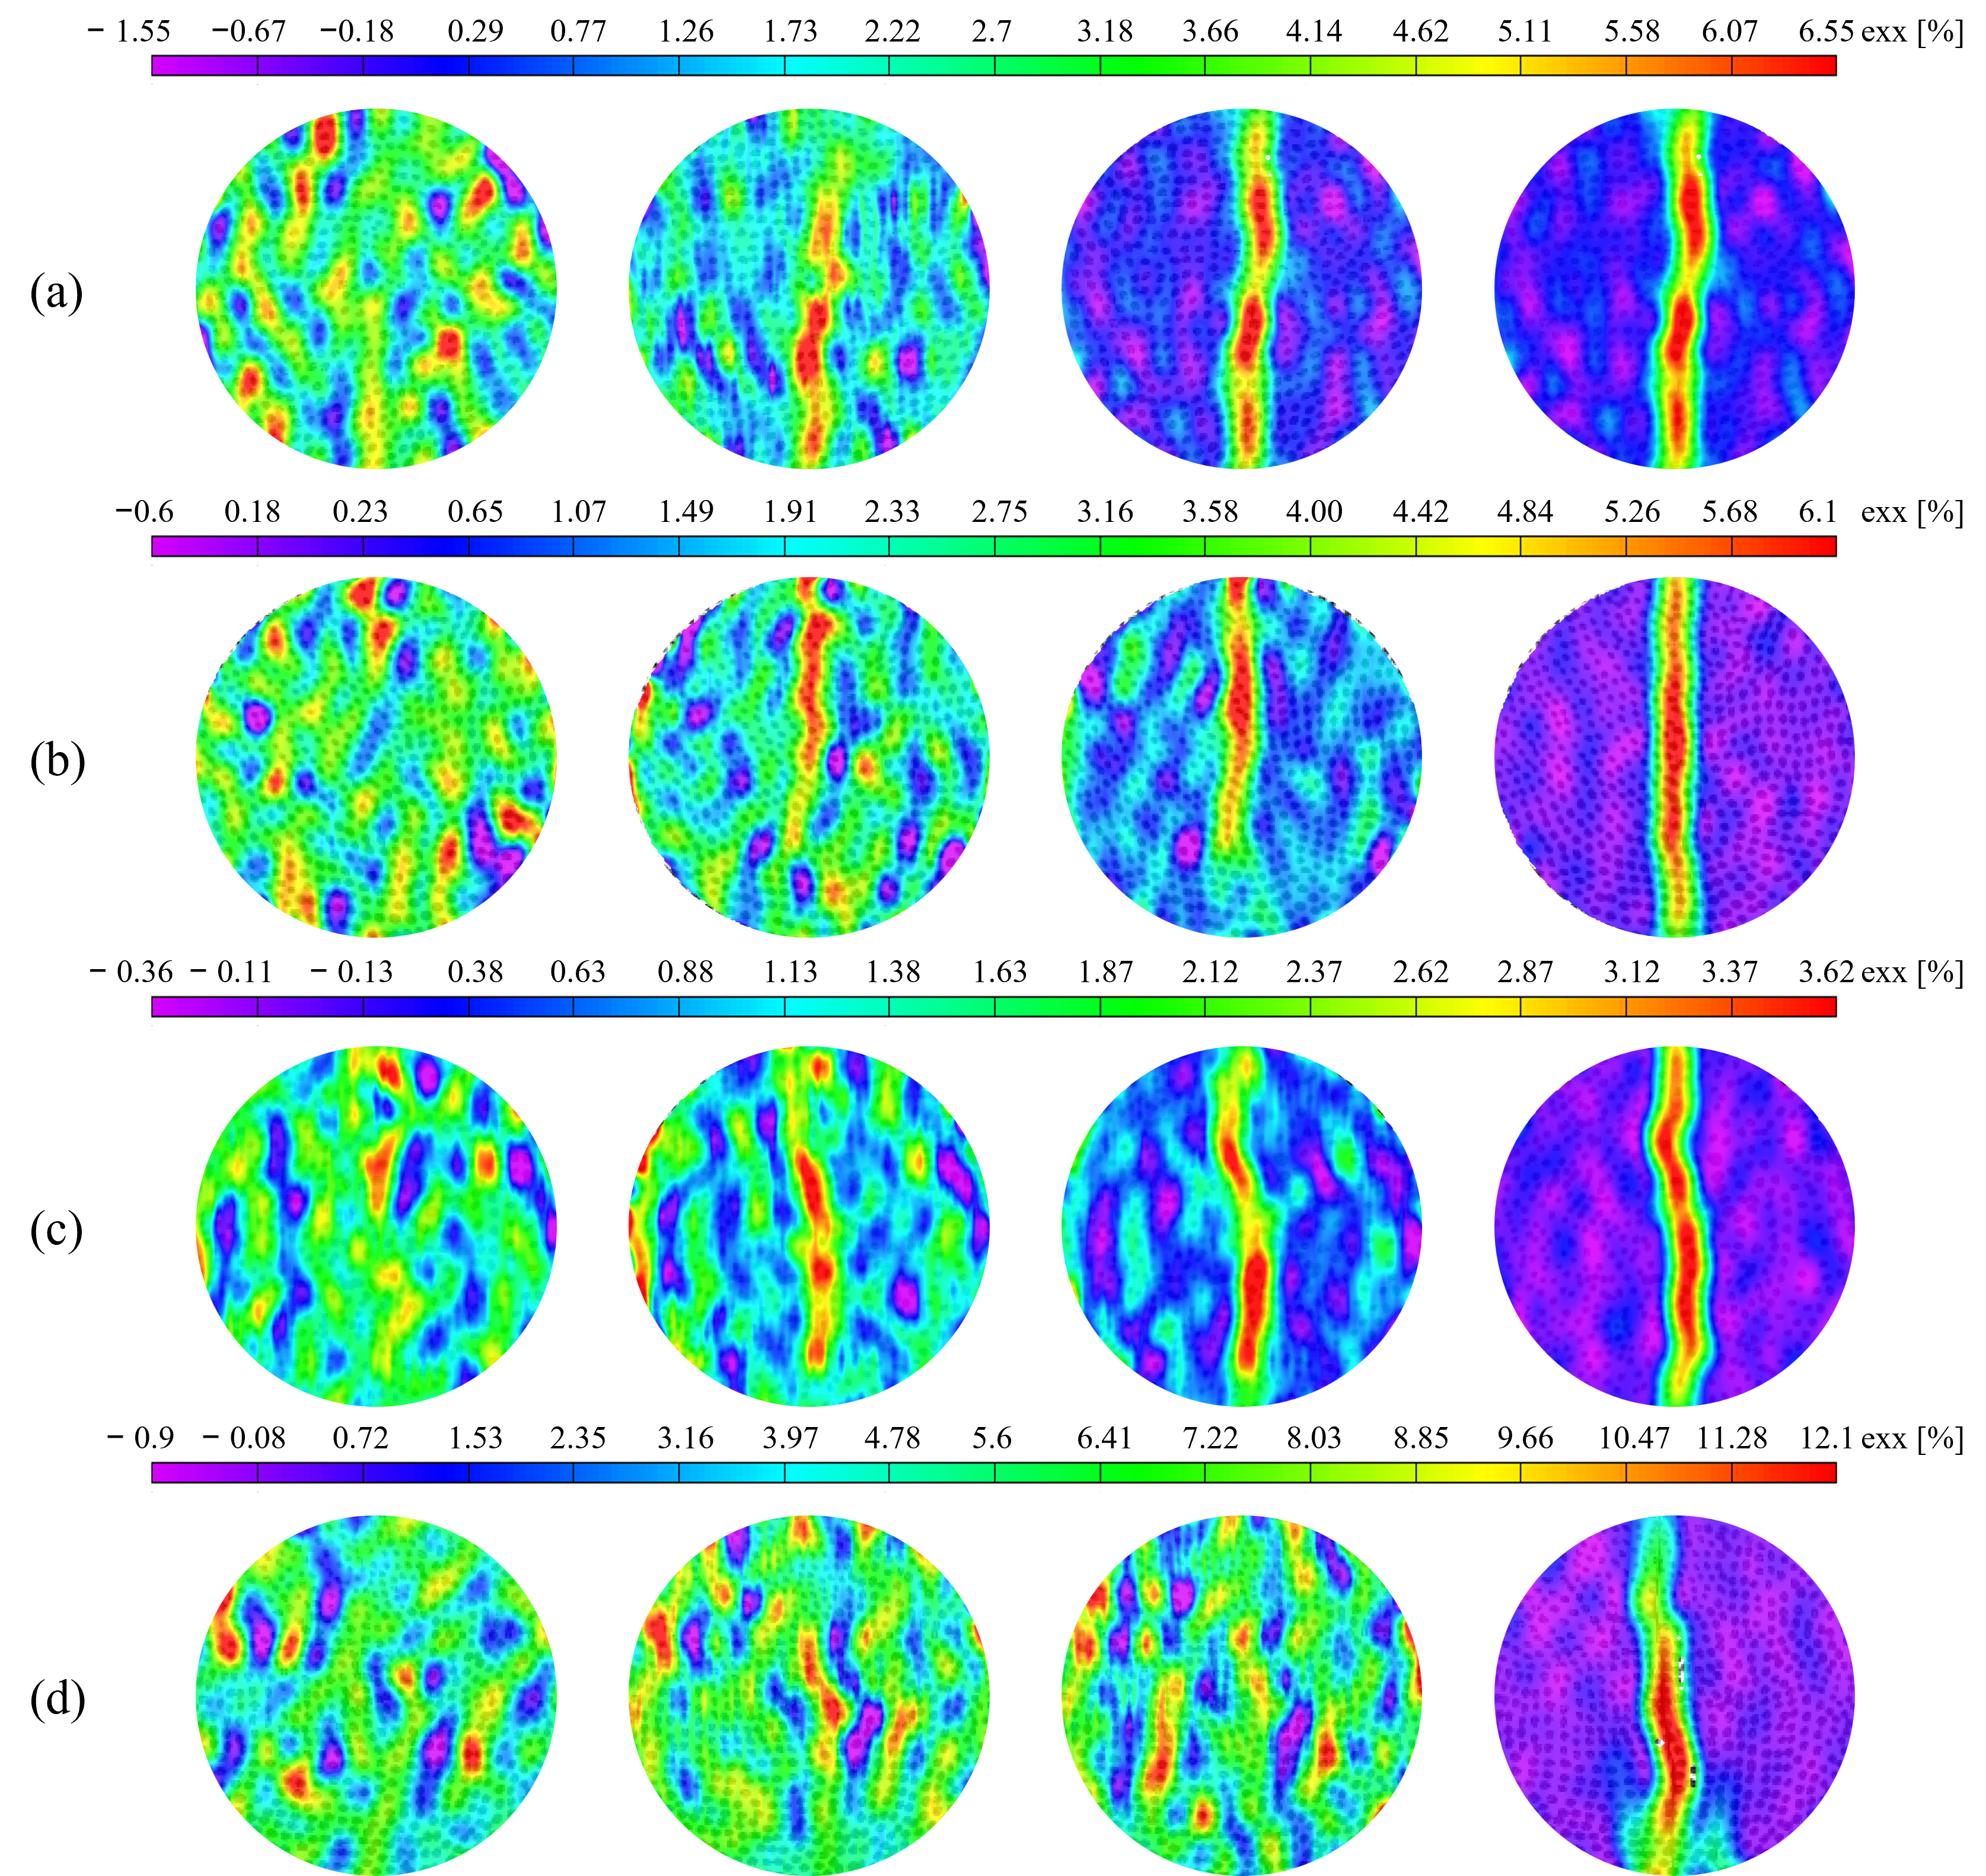
In this test, the changes in the surface displacement and strain fields were analyzed via DIC technology, which can effectively determine the timing of microcrack initiation and propagation [20,21]. Vic-2D software was used with a uniform weight For the digital image correlation analysis, the subset size of 15 and a step size of 1. The zero-mean normalized sum of squared differences (ZNSSD) correlation criterion was selected to analyze the speckle pattern samples. The average transformation method was adopted to eliminate rigid body motion, the tensor type was set to “Engineering”, and strains were calculated to generate data images. By setting the data variable to “exx”, the initiation and propagation of sample cracks throughout the process can be clearly observed through the color changes in the data images. Figure 6 shows the evolution of the surface strain field obtained by DIC during Brazilian splitting tests of specimens with different L/D ratios. The color scale represents the x-direction strain, exx (%). Purple and blue regions correspond to low or negative strain, green and yellow regions indicate moderate strain, and orange and red regions represent high strain concentration. The maximum exx values extracted from the color bars are summarized in Table 3. In this study, because the complete DIC dataset was not fully retained, the temporal durations of the deformation stages under different L/D ratios were not quantitatively characterized. Therefore, the DIC results are interpreted mainly from the perspective of strain-field evolution analysis. As illustrated, the locations of major cracks are basically concentrated in the middle of the samples, and differences in the L/D ratio do not change the positions of primary crack initiation. In a word, the DIC results indicate that decreasing the L/D ratio does not significantly change the main crack initiation region, but it enhances strain localization and promotes a more concentrated and abrupt fracture process.
Figure 6.
Surface strain evolution of samples with different L/D ratios: (a) L/D ratio = 1.0, (b) L/D ratio = 0.8, (c) L/D ratio = 0.6, (d) L/D ratio = 0.5.
Table 3.
Summary of x-direction strain (exx) and deformation-stage duration for specimens with different L/D ratios.
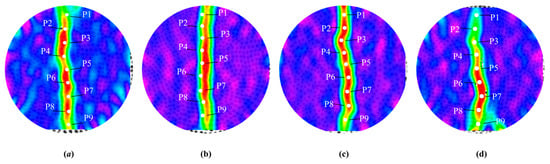
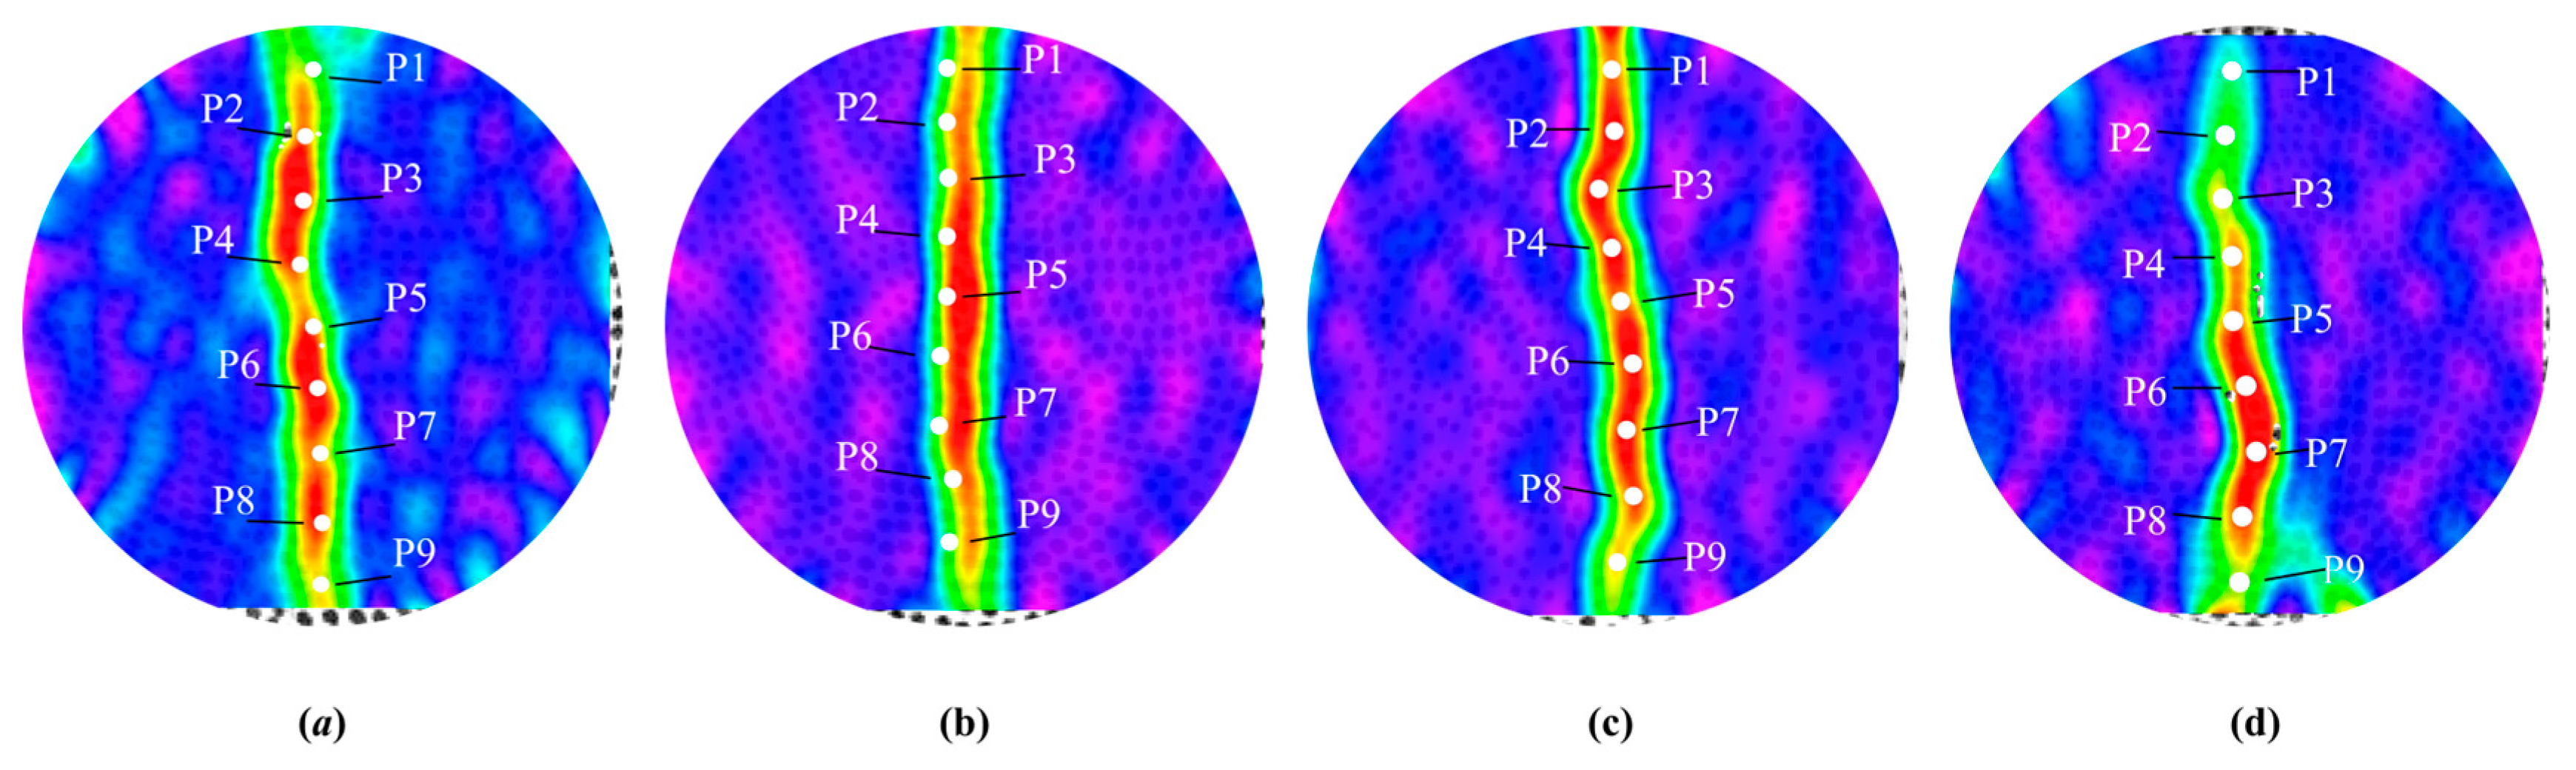
Nine displacement monitoring points (P1, P2, P3, …, P9) were further arranged along the macroscopic cracks formed by the Brazilian splitting test on rock samples with different L/D ratios, as shown in Figure 7.
Figure 7.
Distribution of displacement monitoring points on rock samples with different L/D ratios: (a) L/D ratio = 1.0, (b) L/D ratio = 0.8, (c) L/D ratio = 0.6, (d) L/D ratio = 0.5.
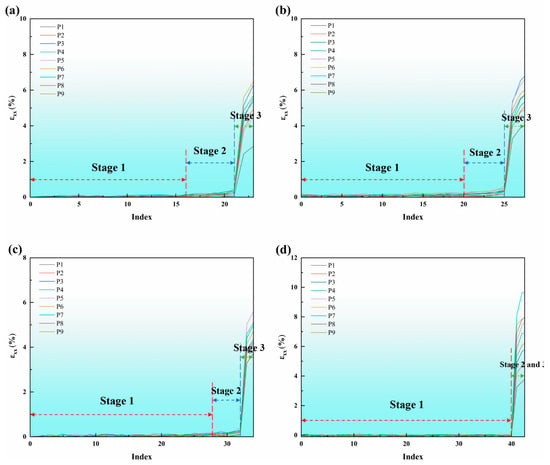
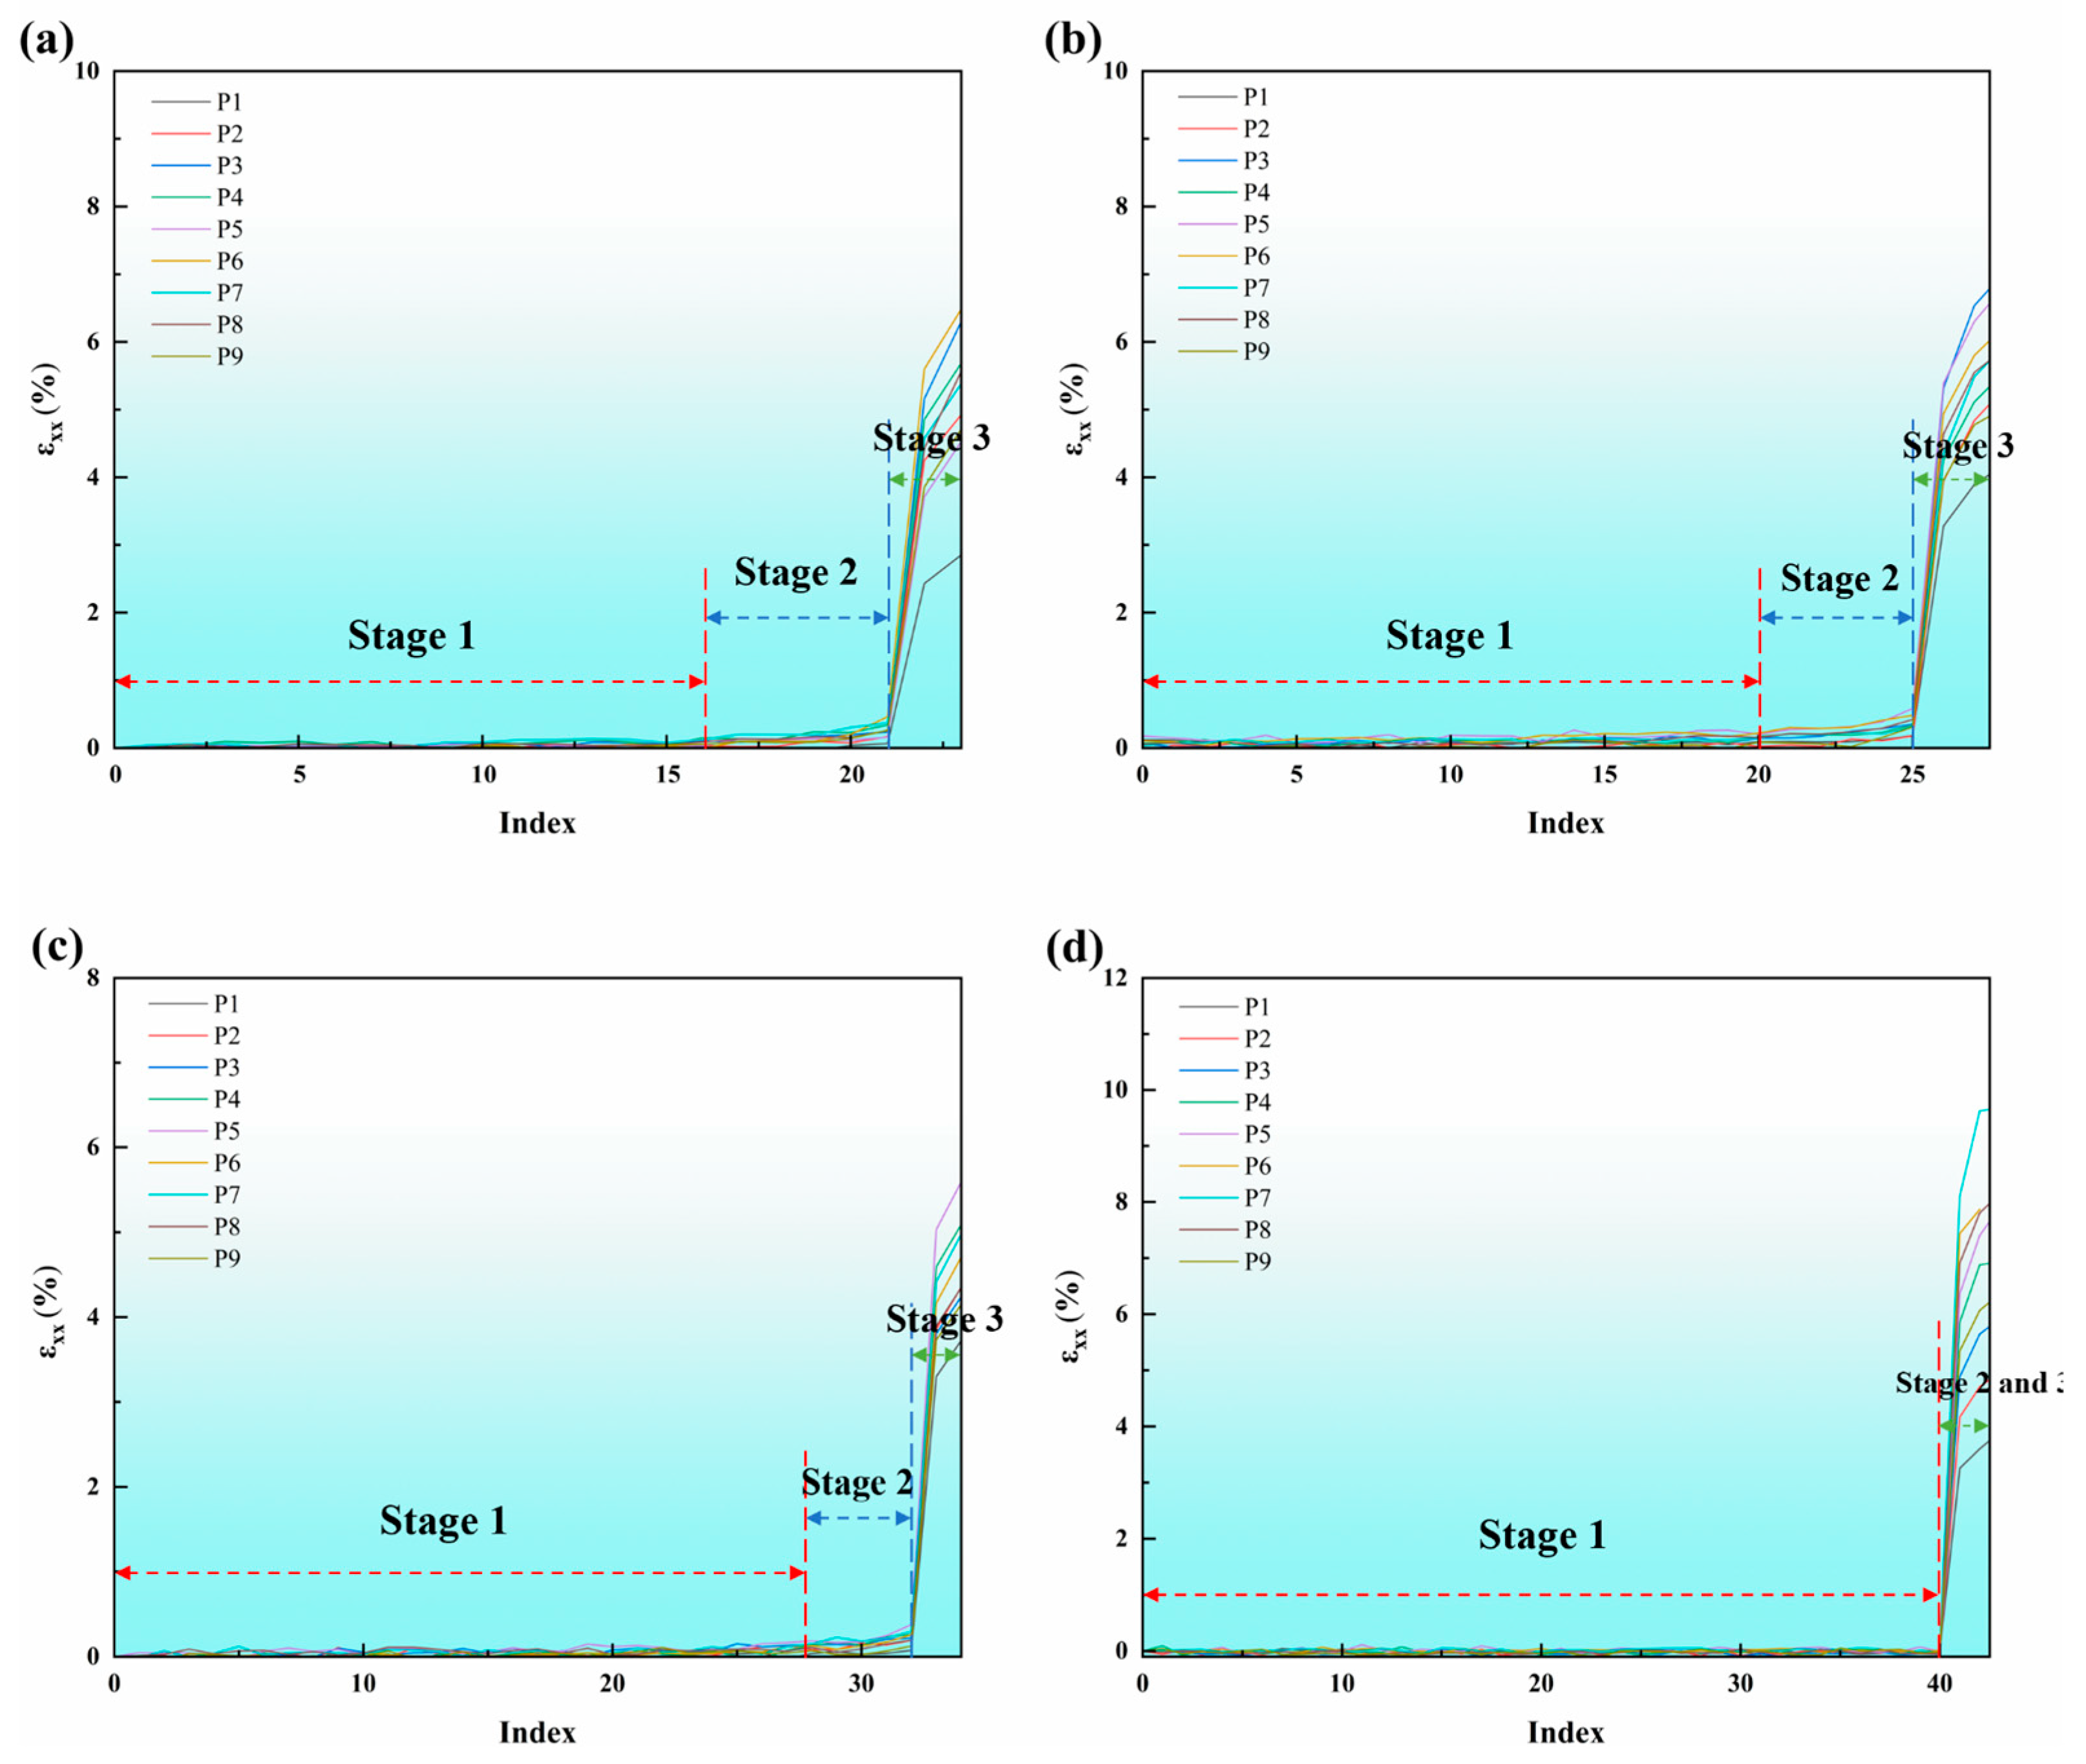
The strain data in the x-direction of the nine monitoring points was extracted using mean value statistics, and curves of the strain at each point in the x-direction versus the frame number of the captured images were plotted, as shown in Figure 7. From the curve characteristics, it can be concluded that the variation in the sample’s x-direction strain with frame number is divided into three stages: the elastic deformation stage, the slow strain accumulation stage, and the rapid strain increase stage in sequence. The mechanical characteristics of these three stages differ from the internal damage evolution characteristics of the samples. As illustrated in Figure 8, the key features of the strain curves in each stage are as follows. In the first stage, the strain percentage increase is almost parallel to the horizontal axis, and the curves of all monitoring points are highly overlapping in the early period. Entering the second stage, the strain begins to increase slowly with a relatively gentle growth rate. In the third stage, the strain rises sharply, and the curve shows a steep upward trend. With the decrease in the sample’s L/D ratio, the number of continuous frames in the first stage increases continuously from approximately 16 frames to 40 frames, while the number of continuous frames in the second stage decreases gradually.
Figure 8.
Strain–time evolution curves of each monitoring point on rock samples with different L/D ratios: (a) L/D ratio = 1.0, (b) L/D ratio = 0.8, (c) L/D ratio = 0.6, (d) L/D ratio = 0.5.
3.4. Acoustic Emission Characteristics
3.4.1. Acoustic Emission Count Characteristics
During the deformation and failure process of rock, energy signals are released to the outside in the form of elastic waves, which are referred to as acoustic emission (AE) signals [22]. AE signals can effectively identify the processes of crack formation, propagation, and coalescence. In the Brazilian splitting test, based on the characteristics of AE signals and the internal damage evolution process of rock, the test process can be divided into the following four stages: the microcrack closure and compaction stage, the stable microcrack propagation stage, the accelerated microcrack propagation and coalescence stage, and the macroscopic failure stage [23].
The AE ring count test is an experimental technique that investigates the evolution law of internal damage in materials by monitoring the ring count characteristics of AE signals during the material’s stress-induced deformation process. Ring count reflects the instantaneous crack activity intensity, while cumulative ring count represents the total damage throughout the entire process [24,25]. The evolution laws of both are affected by the L/D ratio of rock samples, and the essence lies in the fact that the L/D ratio alters the internal stress distribution and crack propagation path of rock samples.
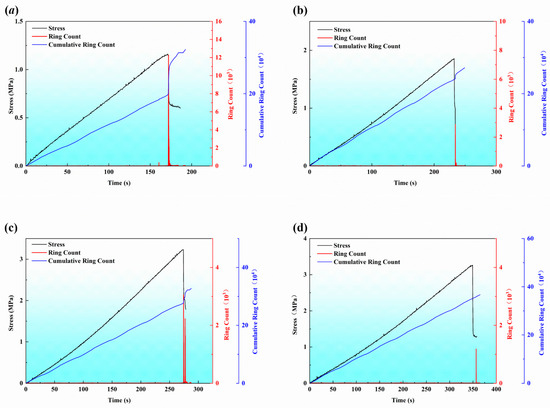
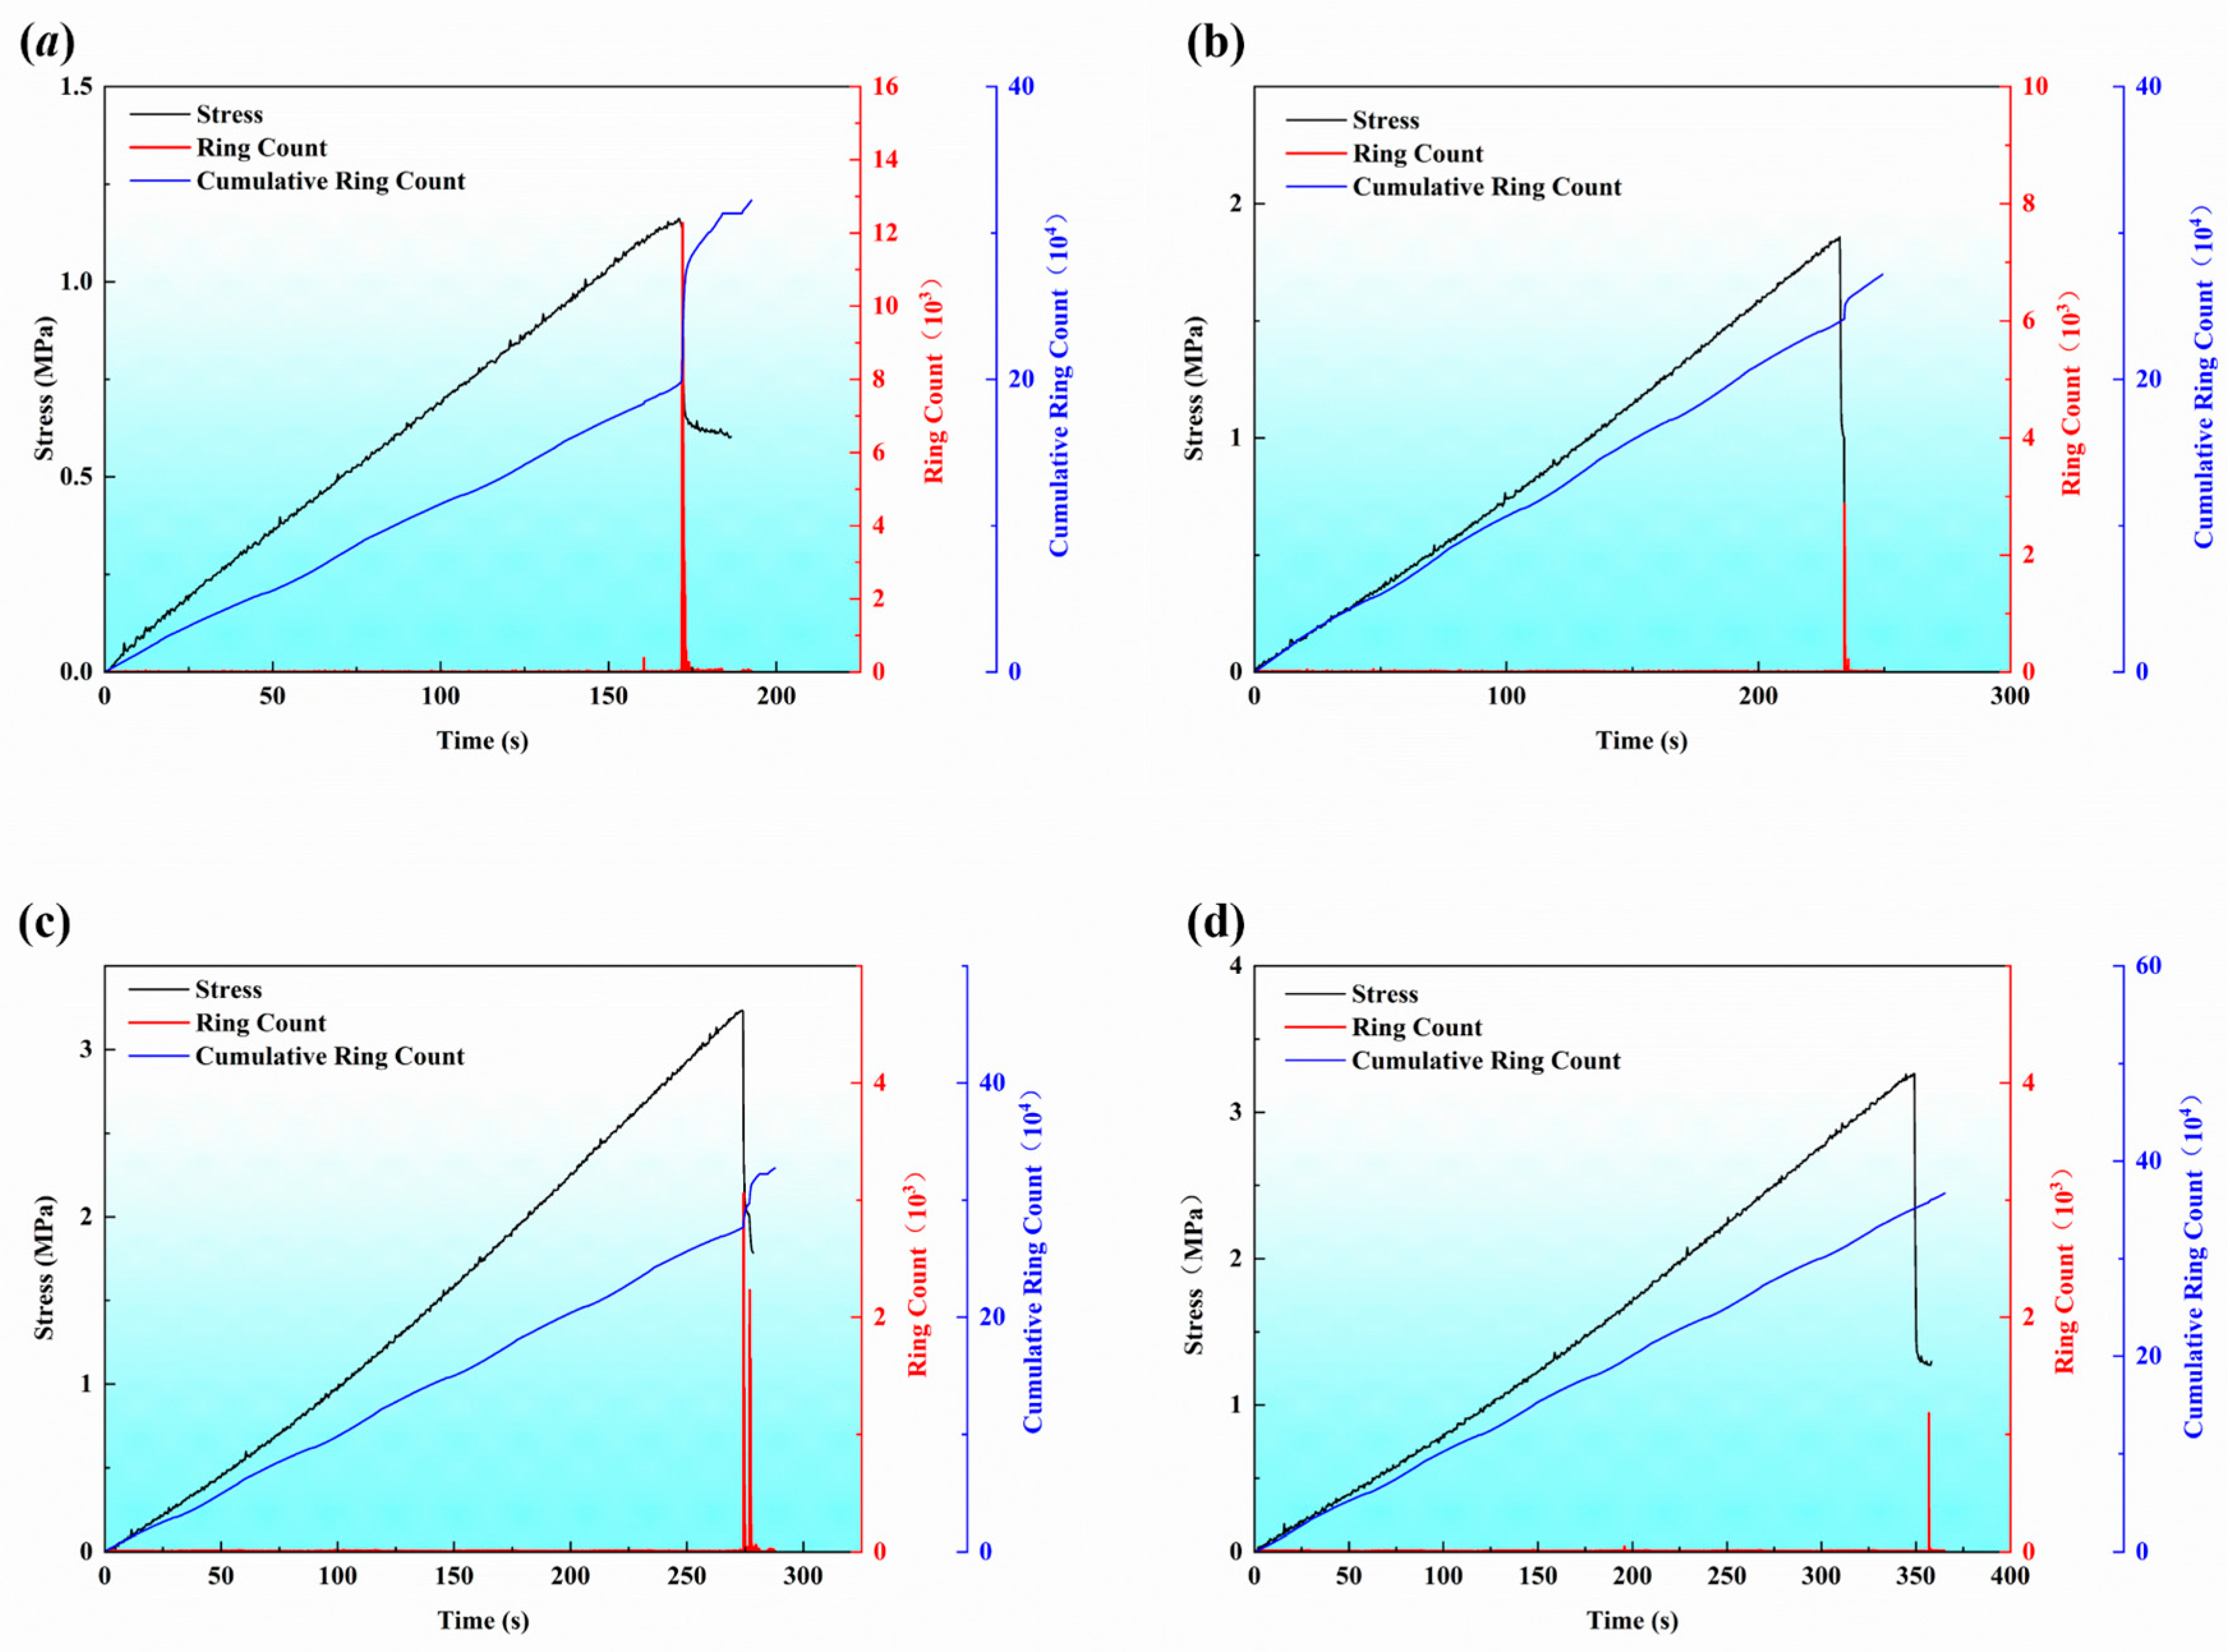
Figure 9 shows the evolution of stress, AE ring count, and cumulative ring count for specimens with different L/D ratios. For all specimens, the ring count remained relatively low during most of the loading process, whereas a dominant ring-count peak occurred near the peak stress or the subsequent stress drop. This indicates that a large number of microcracks rapidly propagated and coalesced during the final failure stage. For the sample with an L/D ratio of 1.0, the ring count was low in the initial stage, indicating microcrack closure and minimal energy release. As the stress increased, the cumulative ring count gradually rose, corresponding to the stable propagation of microcracks. The appearance of the first significant peak near the stress peak indicated that the cracks entered the unstable propagation stage. Before the sample failure, the cumulative ring count showed a steady approximately linear increase; when the sample failed, the ring count suddenly increased sharply, as did the cumulative ring count.
Figure 9.
Stress and acoustic emission (AE) ring count versus time evolution curves of rock samples with different L/D ratios: (a) rock sample with L/D ratio = 1.0, (b) rock sample with L/D ratio = 0.8, (c) rock sample with L/D ratio = 0.6, (d) rock sample with L/D ratio = 0.5.
For the sample with an L/D ratio of 0.8, the peak ring count was higher than that of the sample with an L/D ratio of 1.0, and the peak appeared earlier (before the stress peak). The growth slope of the cumulative ring count increased, showing an obvious accelerated growth phase before failure. This indicates that as the L/D ratio decreases, the sample is closer to a plane stress state, and the proportion of tensile stress increases. For the sample with an L/D ratio of 0.6, the peak ring count in the middle and late stages was significantly higher than those of the samples with L/D ratios of 1.0 and 0.8, and the peak duration was short. The cumulative ring count curve showed a steep growth before failure, indicating the coalescence of a large number of microcracks in a short time. For the specimen with L/D = 0.5, the ring count remained at a low level throughout most of the loading process, while the cumulative ring count reached its maximum value at the moment of failure, indicating minimal pre-propagation of microcracks. The cumulative ring count surged instantaneously before failure, reflecting the concentrated release of energy from the rapid coalescence of cracks. This suggests that when the rock sample height is too small, the loading process involves not only tensile failure but also potential shear failure, with more concentrated crack propagation paths, manifested as sudden failure.
Overall, the dominant increases in cumulative ring count for all specimens were concentrated near the final failure stage. With the L/D ratio decreased from 1.0 to 0.5, the peak cumulative AE ring count gradually decreased and occurred at a later time. This variation may be partly attributed to the change in stress distribution induced by the reduction in L/D ratio; specimens with lower L/D ratios required a longer total loading duration to reach failure.
3.4.2. Acoustic Emission Energy Characteristics
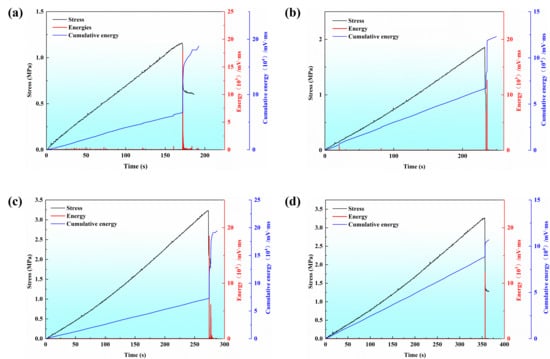
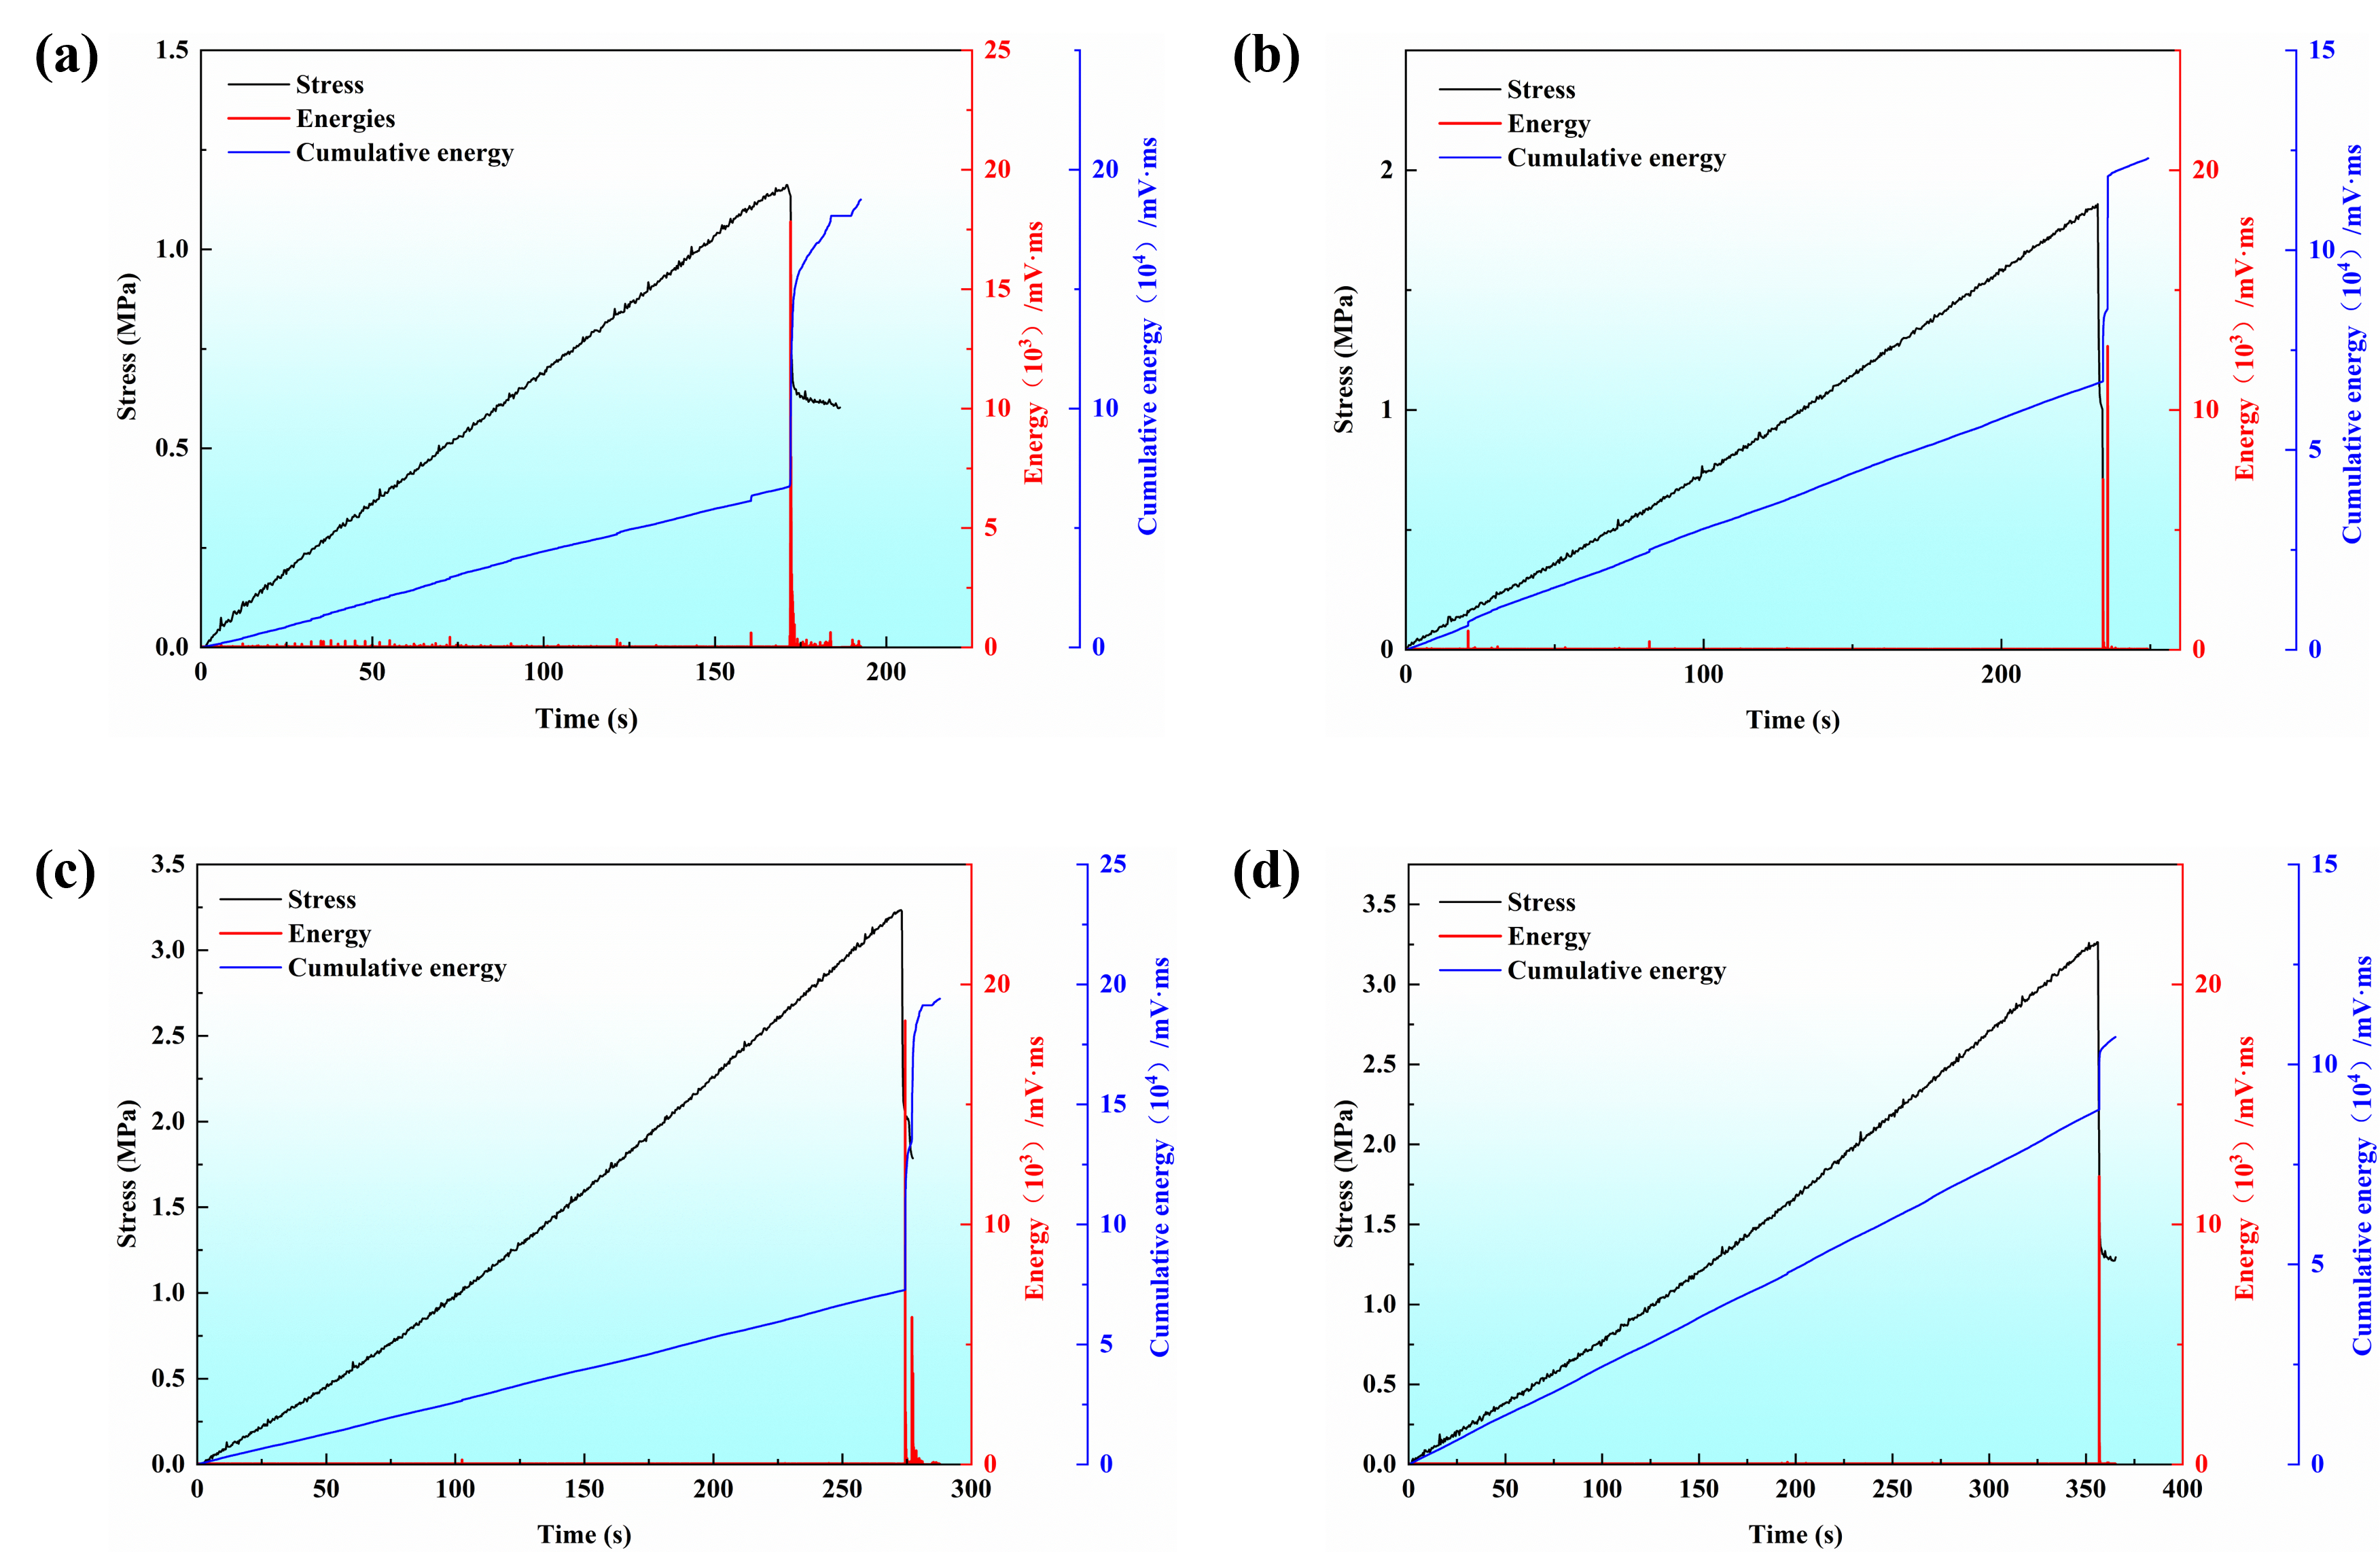
Acoustic emission (AE) energy refers to the total energy of elastic waves released during the initiation, propagation, and coalescence of internal cracks in rock under loading, which reflects the intensity of instantaneous crack activity. Higher AE energy indicates more intense crack propagation [22,23,26]. In the Brazilian splitting test, the L/D ratio of samples regulates the energy release characteristics of crack evolution by altering the internal stress distribution. The AE energy-stress versus time evolution curves of rock samples with different L/D ratios are shown in Figure 10.
Figure 10.
Stress and acoustic emission (AE) energy versus time evolution curves of rock samples with different L/D ratios: (a) rock sample with L/D ratio = 1.0, (b) rock sample with L/D ratio = 0.8, (c) rock sample with L/D ratio = 0.6, (d) rock sample with L/D ratio = 0.5.
As can be seen in Figure 10a, the instantaneous energy of the rock sample with an L/D ratio of 1.0 is close to 0 during the compaction stage (0~50 s), indicating no significant crack activity. From 50 to 150 s, low-amplitude fluctuations occur with increasing stress, suggesting the stable initiation of microcracks and scattered energy release. The cumulative energy shows a steady linear increase, reflecting uniform damage evolution. At this time, the crack propagation of the sample is restrained by axial constraints, dominated by tensile cracks, with scattered energy release. The peak instantaneous energy of the sample with an L/D ratio of 0.8 is significantly higher than that of the sample with an L/D ratio of 1.0, and the peak appears earlier (about 30 s earlier than the stress peak). The increased fluctuation amplitude in the middle stage indicates more active crack propagation. The growth slope of the cumulative energy curve is steeper than that of the sample with an L/D ratio of 1.0, and an inflection point appears before failure, reflecting the transition of damage from uniform dispersion to local concentration. When the L/D ratio is 0.8, the proportion of radial tensile stress increases, the axial restraint on crack propagation decreases, and energy release is more concentrated but still dominated by tensile failure. For the sample with an L/D ratio of 0.6, a sharp peak of instantaneous energy occurs before failure with a short duration, and the energy fluctuation amplitude is small before the peak. From 50 to 100 s, the slope of cumulative energy surges, showing a steep growth, indicating concentrated energy release from the coalescence of a large number of cracks in a short time. It can be seen that the significant reduction in rock sample height leads to the failure of lateral constraints. The internal radial tensile stress distribution is more uniform but the stress concentration factor increases, and cracks jump from stable propagation to unstable coalescence. The suddenness of energy release increases, and shear failure begins to accompany it. The instantaneous energy of the sample with an L/D ratio of 0.5 shows a spike-like peak at the moment of failure, and the energy is close to 0 before the peak, indicating almost no pre-propagated cracks. The cumulative energy surges instantaneously before failure, reflecting the concentrated energy release of cracks. When the L/D ratio is 0.5, the rock sample height is too small, and the end face friction constraint almost disappears. Under loading, there is not only radial tension but also significant shear, and crack propagation presents a tensile–shear composite mode. The stress concentration effect is the most significant, ultimately manifesting as sudden failure with instantaneous energy release.
The above results indicate that with the decrease in the L/D ratio, the peak value of instantaneous acoustic emission (AE) energy increases, and the growth mode of cumulative energy transitions from gradual to steep. When the L/D ratio ≥ 1.0, the failure is dominated by tensile failure, with scattered energy release and steady growth of cumulative energy; when the L/D ratio ≤ 0.6, shear failure begins to accompany, featuring concentrated energy release and a sudden surge in cumulative energy.
3.4.3. Evolution Law of Microcracks
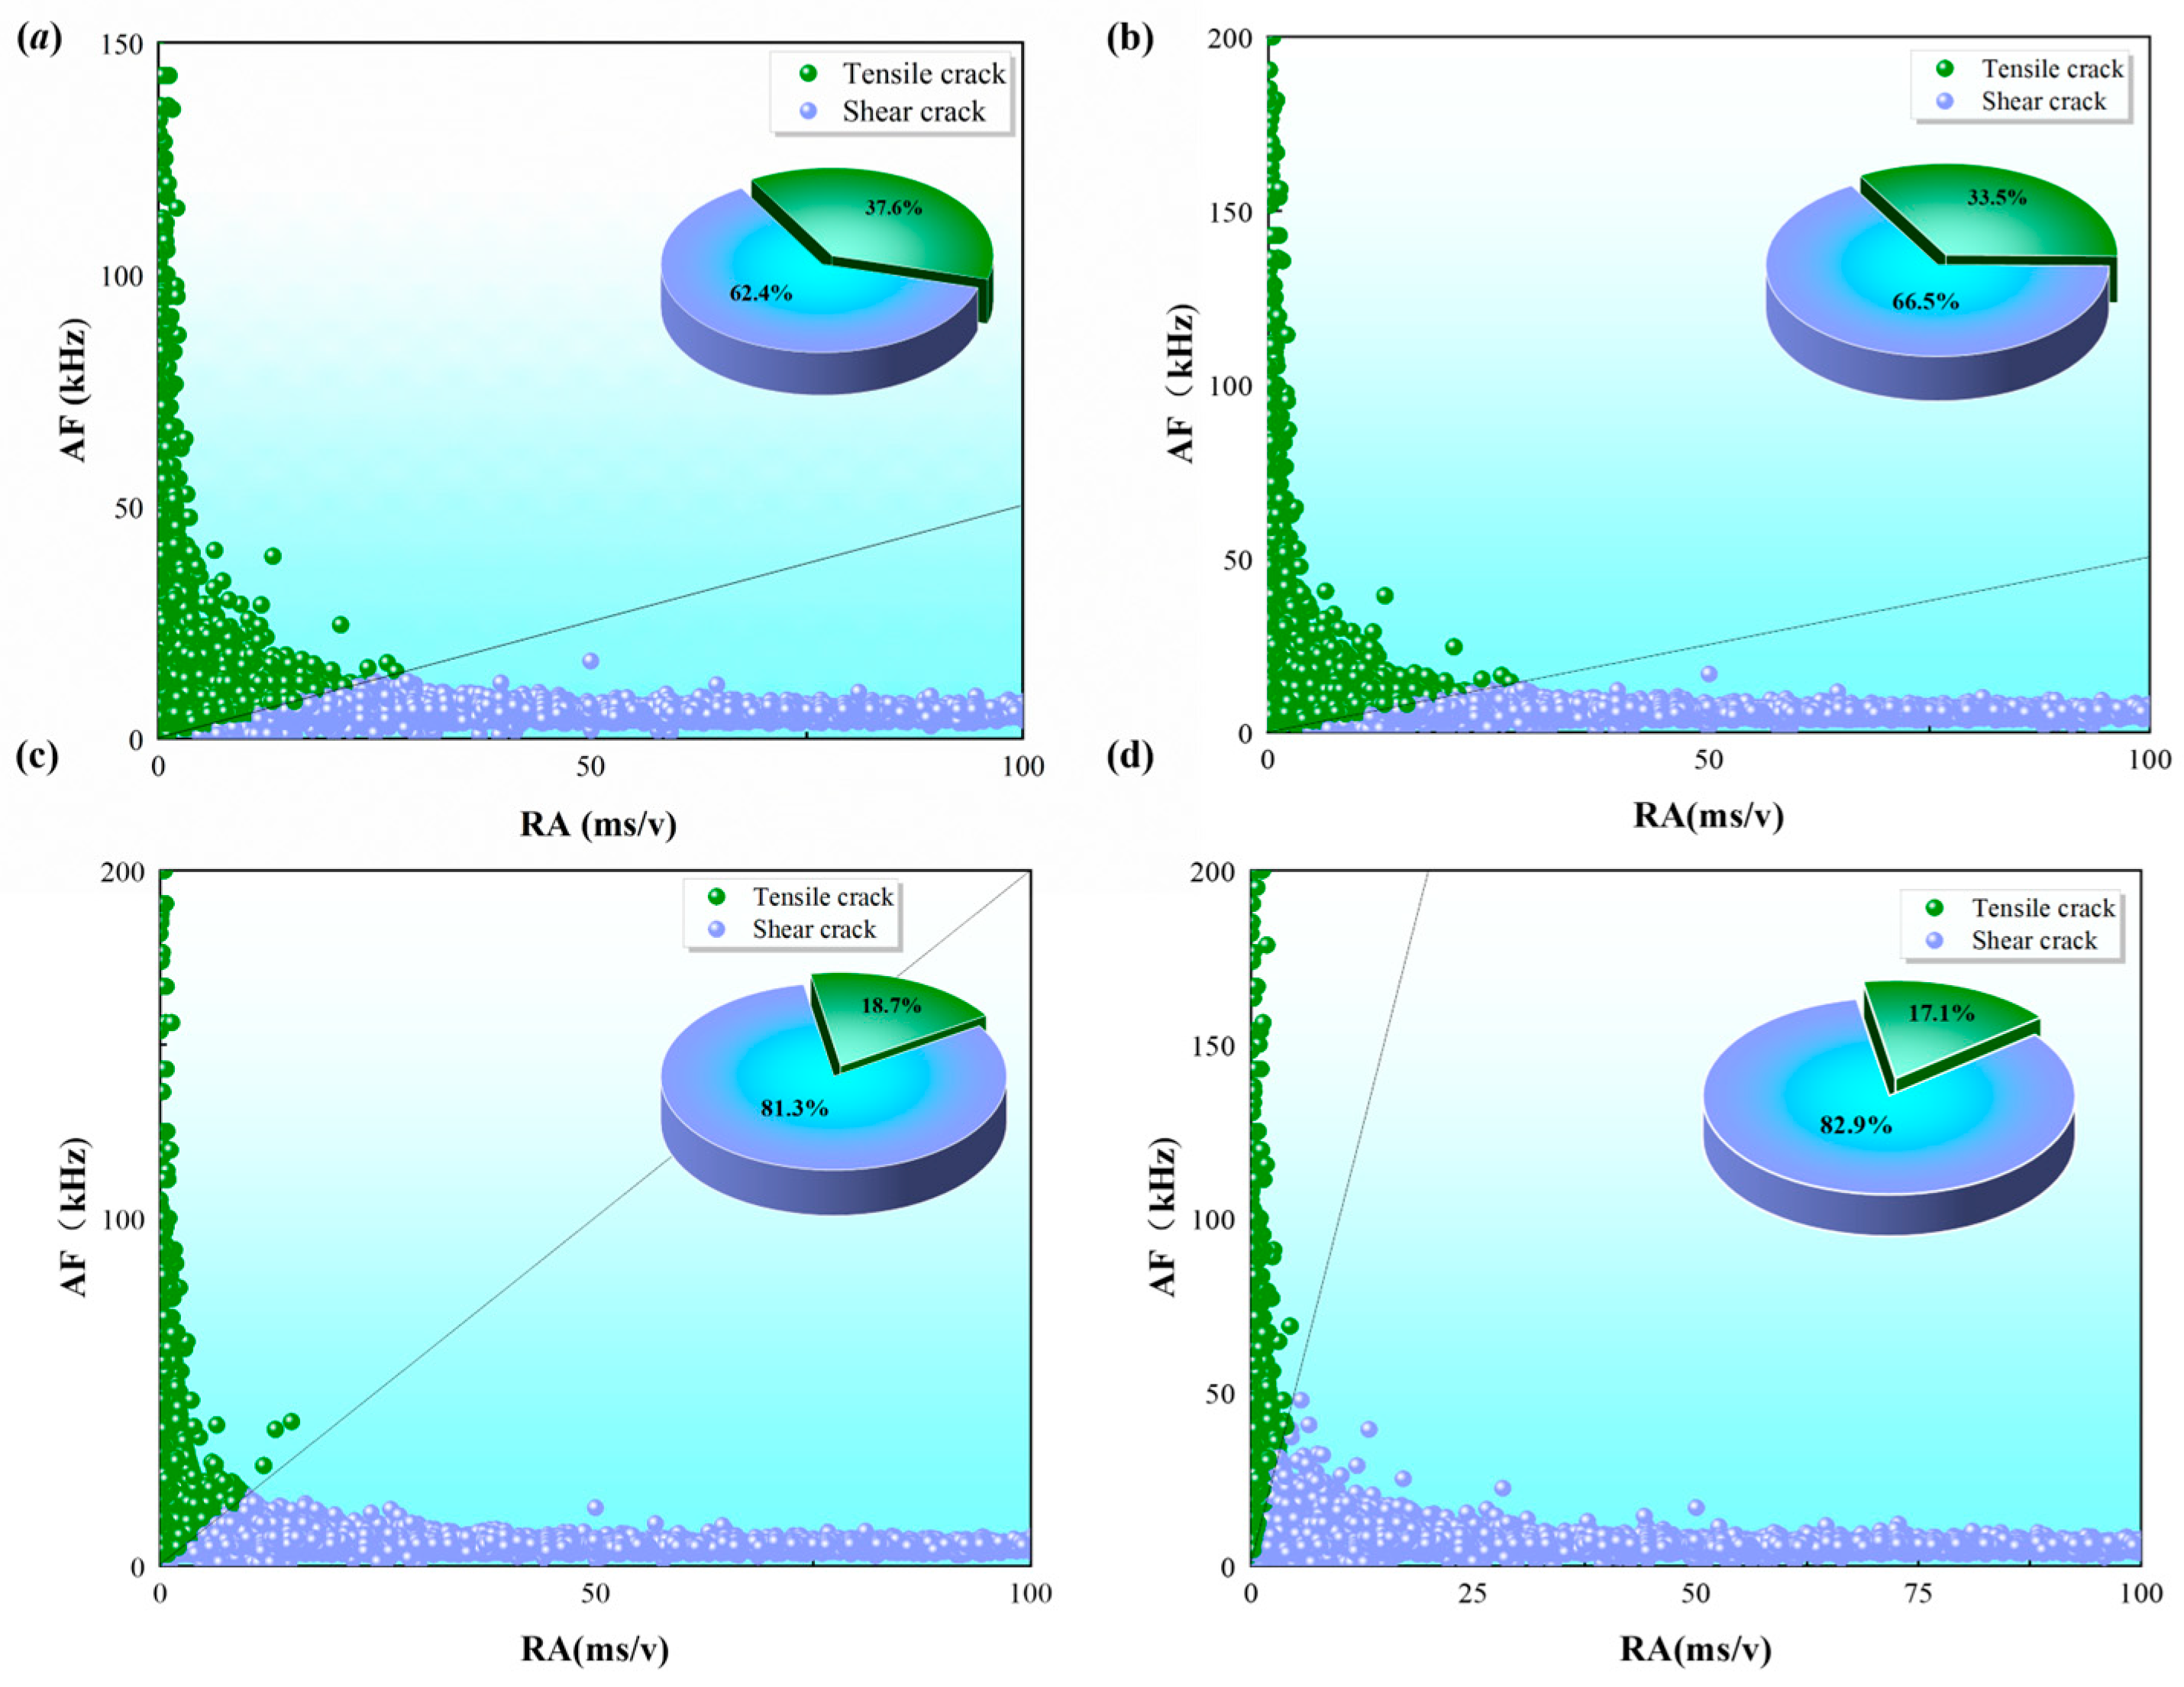
It is widely recognized that the generation of macroscopic cracks is formed by the gradual accumulation and continuous development of microcracks. To further distinguish the cracking modes, a transition boundary line defined by a specific empirical threshold slope (k = 100) was introduced into the RA–AF coordinate system [27,28]. Based on this criterion, AE signals positioning in the region of AF/RA > 100 are classified as tensile cracks, whereas signals falling within AF/RA < 100 are categorized as shear cracks. In other words, a low RA value combined with a high AF value corresponds to tensile cracks; conversely, a high RA value combined with a low AF value indicates shear cracks [29,30,31,32].
Since the RA–AF boundary is empirical and material-dependent, the present classification is used only to identify the relative evolution of tensile- and shear-type AE signals under different L/D ratios. It should not be interpreted as a direct determination of the macroscopic failure mode. Since the RA–AF boundary is empirical and material-dependent, the present classification is used only to identify the relative evolution of tensile- and shear-type AE signals under different L/D ratios. It should not be interpreted as a direct determination of the macroscopic failure mode. Therefore, to clarify the macroscopic failure mechanism of sandstone with various L/D ratios, parameters including duration, rise time, ring count and amplitude are adopted to characterize the microcrack evolution features throughout specimen deformation and failure. The average frequency (AF) of acoustic emission (AE) and the ratio of rise time to amplitude (RA) are obtained by calculating the relationships between these parameters [33,34]:
where AEC denotes the AE count, DT is the duration time, RT is the rise time, and AdB is the AE amplitude.
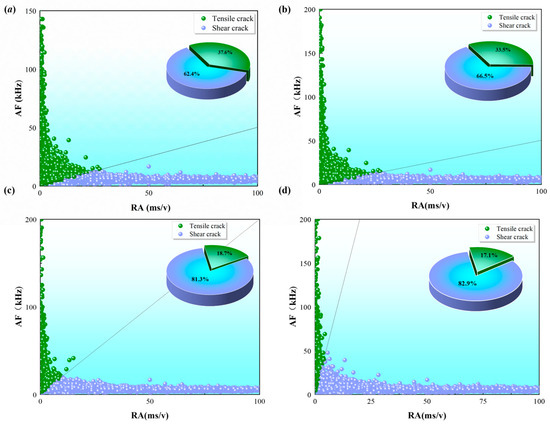
To reveal the evolution law of microcracks, statistical calculation methods were adopted in this study to establish the relationship between parameters RA and AF. Meanwhile, a program was compiled using built-in MATLAB 2025 functions to obtain the microcrack distribution characteristics of rock samples with different L/D ratios, and the relevant results are shown in Figure 11 and Table 4. It is evident from the figure that the evolution mechanisms of microcracks vary among Brazilian splitting disk samples with different L/D ratios. Specifically, as shown in Figure 11, the AE-based microcracking characteristics of the specimens vary significantly with the L/D ratio. For the specimen with an L/D ratio of 1.0 (Figure 11a), tensile-type AE events account for 37.6%, whereas shear-type AE events account for 62.4%. Although shear-type AE events are more frequent, the relatively high proportion of tensile-type events indicates that tensile splitting still plays an important role in the fracture process. When the L/D ratio decreases to 0.8 (Figure 11b), the proportion of tensile-type AE events decreases to 33.5%, while that of shear-type AE events increases to 66.5%, suggesting that shear-related microcracking becomes more active as the specimen thickness decreases. For the specimen with an L/D ratio of 0.6 (Figure 11c), the proportion of tensile-type AE events further decreases to 18.7%, whereas the proportion of shear-type AE events increases markedly to 81.3%. This indicates that reducing the L/D ratio promotes localized shear microcracking and weakens the relative contribution of tensile cracking. When the L/D ratio further decreases to 0.5 (Figure 11d), tensile-type AE events account for only 17.1%, while shear-type AE events reach 82.9%, indicating a pronounced shear-type microcracking characteristic. Overall, with decreasing L/D ratio, the proportion of tensile-type AE events decreases from 37.6% to 17.1%, whereas the proportion of shear-type AE events increases from 62.4% to 82.9%. Meanwhile, the critical boundary separating the two fracture modes exhibits an obvious downward-right shift, and AE events gradually migrate toward the region characterized by higher RA values and lower AF values in the RA–AF feature space. These results indicate that reducing the L/D ratio enhances localized shear-type microcracking activity during the fracture process. It should be noted that the RA–AF classification reflects the dominant characteristics of AE microcracking events rather than the macroscopic failure mode alone. Therefore, combined with the rock failure characteristics revealed by DIC analysis, the failure behavior of the specimens should be interpreted as a tensile–shear mixed failure process governed by diametral splitting, in which the contribution of shear-type microcracking becomes increasingly significant as the L/D ratio decreases.
Table 4.
Classification results of tensile and shear microcracking modes based on the RA–AF method for specimens with different L/D ratios.
Figure 11.
Microcrack distribution characteristics of rock samples with different L/D ratios: (a) rock sample with L/D ratio = 1.0, (b) rock sample with L/D ratio = 0.8, (c) rock sample with L/D ratio = 0.6, (d) rock sample with L/D ratio = 0.5.
3.4.4. Analysis of Acoustic Emission B-Value Characteristics for Rock Samples with Different L/D Ratios
The b-value is derived from the Gutenberg–Richter law. As a key statistical parameter, it is mainly used to describe the correlation between the magnitude of microfailure events and their occurrence frequency when rock undergoes failure under external loading. Its calculation formula is expressed as follows [35]:
wherein a and b are constants, and N is the cumulative number of acoustic emission events with magnitude greater than M. M is the magnitude of acoustic emission events, which is usually calculated by dividing the amplitude by 20, i.e., M = A/20, where the unit of A is dB, and A = 20lgAmax; Amax is the maximum value of acoustic emission amplitude [36]. The parameter b is used to describe the distribution ratio of source scales, which is defined as the b-value and is key information in earthquake precursor research. From a mechanical perspective, the failure of rock under stress is similar to the occurrence of an earthquake, as both processes undergo the initiation, propagation, and coalescence of internal cracks, eventually forming a macroscopic failure surface [37]. In relevant rock studies, acoustic emission (AE) technology is a common method for analyzing the rock failure process. Since the b-value characteristics of AE signals can reflect the scale changes in internal microcracks in rock, and the abrupt change in the b-value can be used as a signal of macroscopic rock failure, studying the characteristics of the b-value can allow us to better explore the rock failure law [38].
The magnitude of the b-value directly reveals the scale distribution of internal microcracks and the stress concentration state of rock, serving as a critical basis for evaluating rock stability and predicting rock failure. A larger b-value indicates that the internal damage of rock is dominated by small-scale events such as microcrack initiation, where the rock is in the initial stage of damage and its overall structure remains relatively stable. A smaller b-value implies that the internal damage of rock is mainly characterized by macroscopic crack coalescence or large-scale failure, at which point the rock damage is concentrated and the rock is close to the critical state of unstable failure. A continuous or significant decrease in the b-value indicates that the failure mode inside the rock is transitioning from a dispersed state to a concentrated state, the main failure surface is gradually forming, and macroscopic failure is imminent [39,40,41,42,43].
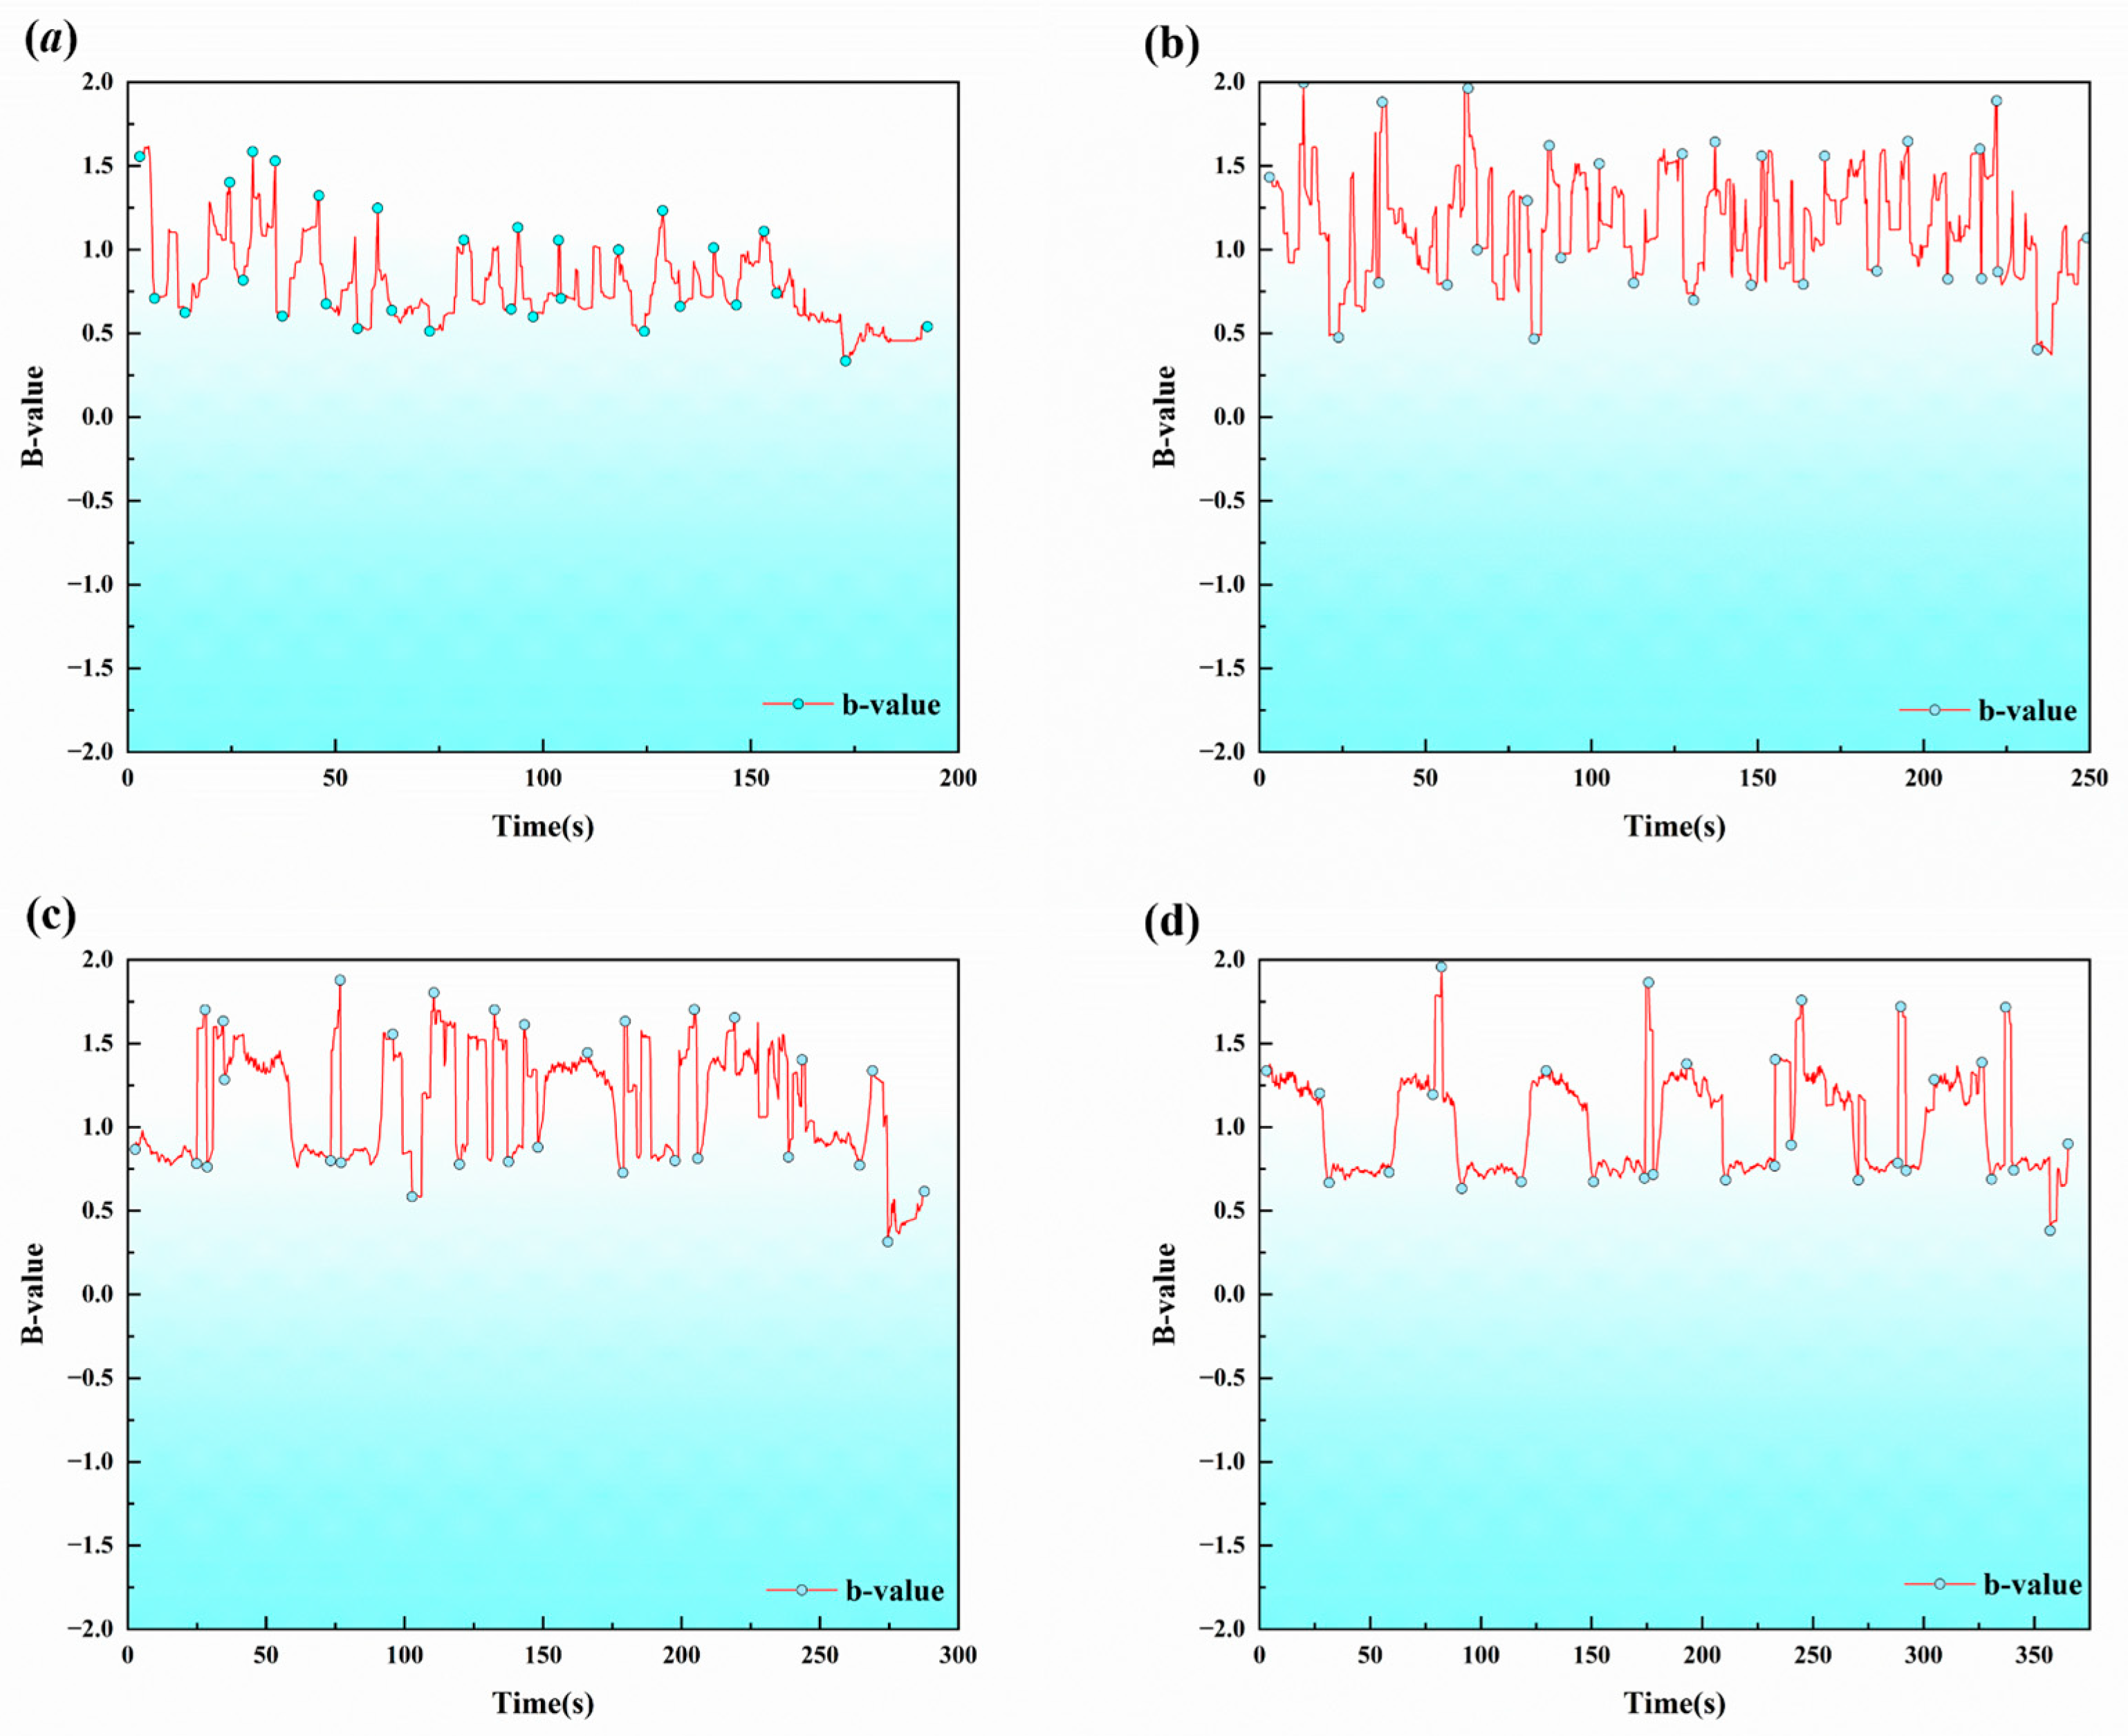
When calculating the b-value using the least-squares method, ΔM = 0.5 was selected for the calculation. To minimize the error in b-value calculation caused by an insufficient number of AE events within a certain magnitude range, 1000 AE data points were selected as one data group, and the b-value was calculated using a sliding window with an interval of 100 events. Figure 12 shows the variation curves of AE b-value versus time during the entire failure process of rock samples with different L/D ratios.
Figure 12.
Variation curves of AE b-value versus time during the entire failure process of rock samples with different L/D ratios: (a) rock sample with L/D ratio = 1.0, (b) rock sample with L/D ratio = 0.8, (c) rock sample with L/D ratio = 0.6, (d) rock sample with L/D ratio = 0.5.
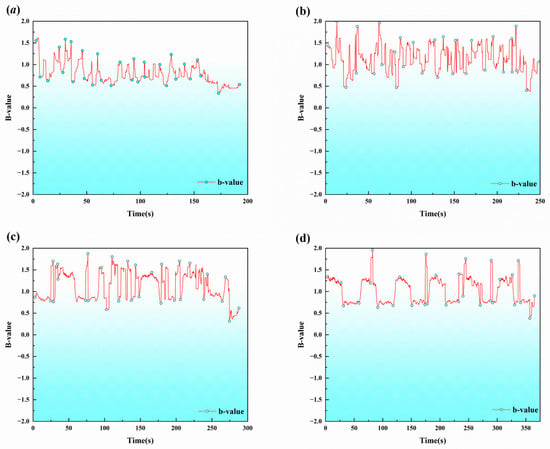
As shown in Figure 12, the AE b-value of specimens with different L/D ratios exhibits pronounced fluctuations throughout the loading and failure process, indicating the discontinuous and staged nature of microcrack initiation, propagation, and coalescence. In general, the b-value remains relatively high and fluctuates frequently during the early and middle loading stages, suggesting that the damage process is mainly controlled by the random initiation and stable propagation of small-scale microcracks. In contrast, a noticeable decrease in the b-value is observed before final failure, indicating the progressive dominance of large-scale crack growth, damage localization, and the formation of a macroscopic fracture surface.
For the sample with an L/D ratio of 1.0, the overall fluctuation of the b-value is relatively gentle, and the minimum value appears relatively early at approximately 170 s after the sharp drop, indicating that the rock sample undergoes macroscopic failure. For the sample with an L/D ratio of 0.8, the fluctuation frequency and amplitude of the b-value increase significantly, with the minimum value appearing at around 225 s after the sharp drop. For the sample with an L/D ratio of 0.6, the occurrence time of the minimum value after the sharp drop is further delayed to about 270 s; the overall fluctuation degree of the curve increases, and the b-value changes actively. For the rock sample with an L/D ratio of 0.5, the minimum value after the sharp drop appears the latest at approximately 350 s, making it the sample that undergoes macroscopic failure the most slowly.
Experimental analysis shows that with the decrease in the L/D ratio of the samples, the variation in the AE b-value becomes increasingly active. Meanwhile, the occurrence time of the minimum value after the sharp drop of the b-value is gradually delayed, from about 170 s to about 350 s. In other words, the smaller the L/D ratio, the longer the time required for the occurrence of macroscopic failure.
4. Discussion
4.1. Influence of L/D Ratio on Apparent Brazilian Splitting Strength and Failure Mode
Previous studies have confirmed that specimen geometry has a significant influence on the tensile strength obtained from Brazilian splitting tests. AlAwad et al. [13] indicated that the conventional Brazilian indirect tensile strength formula may lead to deviations and proposed a modified formula for rocks and rock-like geomaterials. Xu et al. [17] reported that the Brazilian splitting strength of different rocks exhibits an evident size effect, while Yin et al. [16] further demonstrated that specimen geometry affects the tensile stress distribution and crack initiation position. Su et al. [44] observed a clear size effect in the tensile strength of red sandstone after high-temperature treatment. More recently, Wei et al. [14] showed that size-dependent failure behavior under Brazilian tests can significantly influence acoustic and electromagnetic emission responses. These studies support the present finding that the L/D ratio affects not only the calculated peak stress but also the failure mode and damage evolution process.
The results demonstrate that the apparent Brazilian splitting strength of the red sandstone disk specimens increased markedly as the L/D ratio decreased from 1.0 to 0.5. This trend is generally consistent with previous observations of specimen-geometry effects in Brazilian splitting tests. Because all specimens were prepared from the same batch of sandstone and screened according to their P-wave velocities to minimize material heterogeneity, inter-specimen variability is unlikely to be the primary cause of the observed strength difference. A more plausible explanation is that changing the specimen geometry alters its mechanical response. As the L/D ratio decreases, the specimen thickness is reduced, thereby increasing the relative influence of the loading contact region and boundary conditions on the overall stress field. These changes further modify the three-dimensional stress distribution, the extent of stress concentration, and the crack propagation path within the specimen. Therefore, the higher apparent Brazilian splitting strength observed for the specimen with L/D = 0.5 should not be directly interpreted as an increase in the intrinsic tensile strength of red sandstone. Particularly at low L/D ratios, the internal stress state may be jointly governed by tensile stress, localized compressive stress, and shear stress, causing the failure process to deviate progressively from the idealized Brazilian splitting condition characterized by central crack initiation and pure tensile fracture. Accordingly, the strength values obtained for specimens with low L/D ratios are more appropriately interpreted as apparent Brazilian splitting strengths rather than the intrinsic tensile strength of red sandstone.
4.2. AE-DIC Evidence for Damage Evolution Under Different L/D Ratios
The AE and DIC results further demonstrate that the L/D ratio exerts a significant influence on damage evolution and crack propagation behavior during Brazilian splitting of red sandstone. Previous studies have shown that size effects influence not only the measured Brazilian splitting strength but also the associated AE response. Wei et al. conducted Brazilian splitting tests on granite and sandstone specimens of different sizes and found that specimen size affected both tensile failure behavior and AE characteristics. In particular, variations in specimen size altered AE activity near the peak load, the relative proportions of tensile- and shear-type events identified by the RA–AF method, and the characteristics of energy release. These findings indicate that the failure mechanism in a Brazilian splitting test cannot be determined solely from the final macroscopic fracture pattern. Consistent with these observations, the present results reveal pronounced differences in internal microcracking activity among specimens with different L/D ratios. For specimens with relatively large L/D ratios, the macroscopic failure pattern was mainly characterized by a dominant crack propagating along the loading diameter, while AE activity was comparatively dispersed and the fracture process more closely resembled conventional tensile splitting. As the L/D ratio decreased, however, the AE ring count and energy release became increasingly concentrated and abrupt, indicating rapid crack propagation and coalescence around the peak load. The RA–AF analysis further showed that shear-related microcracking became more active at low L/D ratios. Although shear-type AE events dominate the microscopic fracture classification, the macroscopic failure pattern is still characterized by tensile splitting cracks. This discrepancy is attributed to the different scales reflected by AE monitoring and macroscopic observation. AE signals capture localized microcrack nucleation, frictional sliding, and shear deformation during crack propagation, whereas macroscopic observations represent the final dominant fracture morphology. Therefore, shear-type AE events do not necessarily indicate a shear-dominated macroscopic failure mode.
The combined AE and DIC observations also have important implications for the interpretation of the apparent Brazilian splitting strength at different L/D ratios. The influence of L/D is not limited to specimen geometry itself, but extends to the three-dimensional stress state, damage evolution, strain localization, and failure mechanism. Within the investigated range, specimens with L/D ratios of 0.8–1.0 exhibited relatively stable diametral strain localization and a greater relative contribution of tensile-type AE events. Their failure behavior was therefore closer to the idealized tensile-splitting condition, although it should not be regarded as purely tensile. By contrast, specimens with L/D ratios of 0.6 and 0.5 developed strain-concentration zones more rapidly, exhibited stronger localization, and were more likely to experience crack deflection and secondary cracking. These features indicate that low-L/D specimens are more susceptible to localized stress concentration and rapid energy release near the peak load, accompanied by inclined secondary cracking and abrupt strain localization. Consequently, their failure behavior deviates more markedly from the ideal Brazilian assumption of centrally initiated tensile fracture. The higher calculated stress values obtained at low L/D ratios should therefore not be interpreted as an equivalent increase in the intrinsic tensile strength of red sandstone. Rather, they reflect the combined effects of specimen geometry, loading-contact conditions, three-dimensional stress redistribution, and tensile–shear mixed fracture.
4.3. Limitations and Prospects
In this study, the AE-parameter-based crack classification results show that the proportion of tensile-type cracking decreased as the specimen thickness decreased. However, due to experimental limitations, AE signals were not collected for the repeated tests, and a strict statistical significance test was not performed. Although this study provides useful insights into the influence of the length-to-diameter ratio on the tensile strength, fracture evolution, AE characteristics, and DIC-based deformation behavior of red sandstone under Brazilian splitting tests, several limitations should be acknowledged. First, all tests were conducted under quasi-static loading conditions. Therefore, the obtained results mainly reflect the fracture response of red sandstone under low loading rates, and may not be directly applicable to dynamic loading conditions such as blasting disturbance, impact loading, or seismic-induced tensile failure. Second, the experiments were performed at room temperature under dry conditions. In practical rock engineering, temperature variation, water saturation, and water–rock interaction may significantly affect the tensile strength, crack initiation, AE activity, and fracture propagation behavior of rocks. These environmental factors were not considered in the present study. Third, the present work is mainly based on laboratory experiments combined with AE monitoring and DIC analysis, while numerical validation using methods such as the finite element method (FEM) or discrete element method (DEM) was not carried out. As a result, the internal stress redistribution, crack initiation mechanism, and progressive damage evolution inferred from the experimental observations could not be further verified from a numerical perspective. Future studies may combine experimental testing with FEM or DEM simulations to better reveal the stress field evolution and microscopic fracture mechanisms of specimens with different L/D ratios.
It should be emphasized that the present study investigated only the range of L/D = 0.5–1.0, and the resulting conclusions should not be directly extrapolated to substantially thinner or thicker specimens. With a further decrease in specimen thickness, the relative influence of the loading-contact region and boundary conditions on the overall stress field may continue to increase, while localized compression, shear sliding, and contact-induced damage may become more pronounced. Under such conditions, crack initiation may no longer occur predominantly at the specimen center, and crack propagation may deviate further from the loading diameter, thereby violating the stress-distribution assumptions underlying the conventional Brazilian equation. Future studies should therefore include additional L/D ratios outside the range of 0.5–1.0 and combine observations of crack-initiation location, loading-contact damage, AE monitoring, and DIC analysis to determine the critical L/D threshold associated with the transition from tensile-dominated splitting to shear-dominated failure.
5. Conclusions
In this study, Brazilian splitting tests were carried out on four groups of red sandstone samples with different length–diameter ratios (L/D ratios) using an ISTRON universal testing machine, aiming to investigate the size effect of sandstone tensile strength. The main conclusions are as follows:
(1) As the L/D ratio decreases, the apparent Brazilian splitting strength of the specimens gradually increases.
(2) As the L/D ratio decreases from 1.0 to 0.5, the peak cumulative AE ring count gradually decreases and occurs at a later time. The dominant increases in cumulative ring count for all specimens are concentrated near the final failure stage.
(3) The RA–AF classification results indicate that shear-type AE events dominate in all specimens. As the L/D ratio decreases from 1.0 to 0.5, the proportion of tensile events decreases from 37.6% to 17.1%, whereas the proportion of shear events increases from 62.4% to 82.9%. This demonstrates that shear-type microcracking becomes increasingly significant in specimens with lower L/D ratios. Although shear-type events dominate in the microscopic AE classification, the macroscopic failure is primarily characterized by tensile splitting cracks, while shear mechanisms only serve as localized secondary fracture processes during crack evolution.
(4) As the L/D ratio decreases, the number of frames corresponding to the elastic deformation stage gradually increases. However, the specimens exhibit an extremely limited stable microcrack propagation stage, resulting in insufficient damage accumulation. Once the stress exceeds the stress threshold, catastrophic failure occurs suddenly. These characteristics indicate that a lower L/D ratio aggravates the brittleness of rock specimens and reduces their damage tolerance.
Author Contributions
Methodology, Y.L.; investigation, B.M.; writing—review and editing, Y.L.; visualization, B.M. All authors have read and agreed to the published version of the manuscript.
Funding
This research received no external funding.
Data Availability Statement
All data, models, and code generated or used during the study appear in the submitted article.
Conflicts of Interest
The authors declare no conflicts of interest.
References
- Perras, M.A.; Diederichs, M.S. A Review of the Tensile Strength of Rock: Concepts and Testing. Geotech. Geol. Eng. 2014, 32, 525–546. [Google Scholar] [CrossRef] [Scilit]
- Li, D.; Wong, L.N.Y. The Brazilian Disc Test for Rock Mechanics Applications: Review and New Insights. Rock Mech. Rock Eng. 2013, 46, 269–287. [Google Scholar] [CrossRef] [Scilit]
- Li, K.; Cheng, Y.; Yin, Z.-Y.; Han, D.; Meng, J. Size Effects in a Transversely Isotropic Rock Under Brazilian Tests: Laboratory Testing. Rock Mech. Rock Eng. 2020, 53, 2623–2642. [Google Scholar] [CrossRef] [Scilit]
- Suggested methods for determining the strength of rock materials in triaxial compression. Int. J. Rock Mech. Min. Sci. Geomech. Abstr. 1978, 15, 47–51. [CrossRef] [Scilit]
- González-Fernández, M.A.; Estévez-Ventosa, X.; Alejano, L.R.; Masoumi, H. Size-Dependent Behaviour of Hard Rock Under Triaxial Loading. Rock Mech. Rock Eng. 2023, 56, 6009–6025. [Google Scholar] [CrossRef] [Scilit]
- Luo, K.; Peng, K.; Ma, T.; Luo, S.; Liu, X.; Wu, T.; Zhou, J. Understanding the combined effect of dynamic impact and water saturation on dynamic tensile behavior of sandstone. Eng. Fract. Mech. 2026, 335, 111918. [Google Scholar] [CrossRef] [Scilit]
- Tuncay, E.; Hasancebi, N. The effect of length to diameter ratio of test specimens on the uniaxial compressive strength of rock. Bull. Eng. Geol. Environ. 2009, 68, 491–497. [Google Scholar] [CrossRef] [Scilit]
- Pan, P.Z.; Feng, X.T.; Hudson, J.A. Study of failure and scale effects in rocks under uniaxial compression using 3D cellular automata. Int. J. Rock Mech. Min. Sci. 2009, 46, 674–685. [Google Scholar] [CrossRef] [Scilit]
- Liu, B.C.; Zhang, J.S.; Du, Q.Z. Size effect of rock compressive strength. Chin. J. Rock Mech. Eng. 1998, 17, 4. [Google Scholar] [CrossRef] [Scilit] [PubMed]
- Li, Q.; Li, Q.; Wang, F.; Wu, J.; Wang, Y.; Jin, J. Effects of Geological and Fluid Characteristics on the Injection Filtration of Hydraulic Fracturing Fluid in the Wellbores of Shale Reservoirs: Numerical Analysis and Mechanism Determination. Processes 2025, 13, 1747. [Google Scholar] [CrossRef] [Scilit]
- Qi, Z.Z.; Zhong, Z.M.; Yan, Y.W.; Wei, W. Study on the size effect of silty sandstone samples under conventional triaxial compression. Chin. J. Rock Mech. Eng. 2019, 38, 8. [Google Scholar] [CrossRef]
- Simon, M.A.L. A multiaxial stress criterion for short- and long-term strength of isotropic rock media. Int. J. Rock Mech. Min. Sci. 2000, 37, 1169–1193. [Google Scholar] [CrossRef] [Scilit]
- AlAwad, M.N.J. Modification of the Brazilian indirect tensile strength formula for better estimation of the tensile strength of rocks and rock-like geomaterials. J. King Saud Univ. Eng. Sci. 2022, 34, 147–154. [Google Scholar] [CrossRef] [Scilit]
- Wei, M.; Song, D.; He, X.; Qiu, L.; Tong, Y.; Lu, J. Acoustic and electromagnetic emission laws of rocks affected by size-dependent failure behavior under Brazilian tests. Eng. Fail. Anal. 2025, 167, 109005. [Google Scholar] [CrossRef] [Scilit]
- Hai, J.S.; Hong, W.J.; Hong, H.Z.; Qian, Y. Study on tensile strength and size effect of red sandstone after high temperature treatment. Chin. J. Rock Mech. Eng. 2015, 000, 2879–2887. [Google Scholar]
- Qian, Y.; Honghui, Z.; Tianci, D.; Haijian, S.; Yushu, C. Experimental Study on the Influence of Geometry Size on Tensile Strength of Rock. Saf. Coal Mines 2014, 45, 17–20. [Google Scholar]
- Yan, F.X.; Fu, J.Z.; Guo, J.W.; Sheng, M.Z. Size effect of brazilian splitting strength of different rocks. Miner. Eng. Res. 2012, 27, 7–12. [Google Scholar]
- He, W.; Chen, K.; Zhang, B.; Dong, K. Improving measurement accuracy of Brazilian tensile strength of rock by digital image correlation. Rev. Sci. Instrum. 2018, 89, 115107. [Google Scholar] [CrossRef] [Scilit] [PubMed]
- Zhou, Y.X.; Xia, K.W.; Li, X.B.; Li, H.B.; Ma, G.W.; Zhao, J.; Zhou, Z.L.; Dai, F. Suggested methods for determining the dynamic strength parameters and mode-I fracture toughness of rock materials. Int. J. Rock Mech. Min. Sci. 2012, 49, 105–112. [Google Scholar] [CrossRef] [Scilit]
- Li, Q.C.; Li, Q.; Wu, J.J.; Wang, F.L. Wellhead Stability during Development Process of Hydrate Reservoir in the Northern South China Sea: Sensitivity Analysis. Processes 2025, 13, 1630. [Google Scholar] [CrossRef] [Scilit]
- Miao, S.; Pan, P.-Z.; Wu, Z.; Li, S.; Zhao, S. Fracture analysis of sandstone with a single filled flaw under uniaxial compression. Eng. Fract. Mech. 2018, 204, 319–343. [Google Scholar] [CrossRef] [Scilit]
- Meng, Q.; Zhang, M.; Han, L.; Pu, H.; Nie, T. Effects of Acoustic Emission and Energy Evolution of Rock Specimens Under the Uniaxial Cyclic Loading and Unloading Compression. Rock Mech. Rock Eng. 2016, 49, 3873–3886. [Google Scholar] [CrossRef] [Scilit]
- Moradian, Z.; Einstein, H.H.; Ballivy, G. Detection of Cracking Levels in Brittle Rocks by Parametric Analysis of the Acoustic Emission Signals. Rock Mech. Rock Eng. 2016, 49, 785–800. [Google Scholar] [CrossRef] [Scilit]
- Geng, J.; Sun, Q.; Zhang, Y.; Cao, L.; Zhang, W. Studying the dynamic damage failure of concrete based on acoustic emission. Constr. Build. Mater. 2017, 149, 9–16. [Google Scholar] [CrossRef] [Scilit]
- Dou, L.; Yang, K.; Chi, X. Fracture behavior and acoustic emission characteristics of sandstone samples with inclined precracks. Int. J. Coal Sci. Technol. 2021, 8, 77–87. [Google Scholar] [CrossRef] [Scilit]
- Hu, X.; Su, G.; Chen, G.; Mei, S.; Feng, X.; Mei, G.; Huang, X. Experiment on Rockburst Process of Borehole and Its Acoustic Emission Characteristics. Rock Mech. Rock Eng. 2019, 52, 783–802. [Google Scholar] [CrossRef] [Scilit]
- Paliwal, B.; Ramesh, K.T. An interacting micro-crack damage model for failure of brittle materials under compression. J. Mech. Phys. Solids 2008, 56, 896–923. [Google Scholar] [CrossRef] [Scilit]
- Zhang, X.-P.; Wong, L.N.Y. Cracking Processes in Rock-Like Material Containing a Single Flaw Under Uniaxial Compression: A Numerical Study Based on Parallel Bonded-Particle Model Approach. Rock Mech. Rock Eng. 2012, 45, 711–737. [Google Scholar] [CrossRef] [Scilit]
- Li, S.; Chen, B.; Chen, Z.L.; Gao, Z.H. Performance assessment of basalt fiber reinforced foamed concrete under freeze-thaw conditions using advanced acoustic emission parameters. Constr. Build. Mater. 2024, 440, 137444. [Google Scholar] [CrossRef] [Scilit]
- Liu, J.H.; Zhou, D.W.; Cheng, L.N.; An, S.H.; Guo, L.Z.; Xue, H.; Wu, R.D. Analysis of damage and fracture characteristics for concrete subjected to cryogenic freeze-thaw cycles: An acoustic emission and digital image correlation study. J. Build. Eng. 2024, 94, 109841. [Google Scholar] [CrossRef] [Scilit]
- Aldandooh, M.A.A.; Bunnori, N.M. Crack classification in reinforced concrete beams with varying thicknesses by mean of acoustic emission signal features. Constr. Build. Mater. 2013, 45, 282–288. [Google Scholar] [CrossRef] [Scilit]
- Lian, S.L.; Zheng, K.; Zhao, Y.; Bi, J.; Wang, C.L.; sen Huang, Y. Investigation the effect of freeze-thaw cycle on fracture mode classification in concrete based on acoustic emission parameter analysis. Constr. Build. Mater. 2023, 362, 129789. [Google Scholar] [CrossRef] [Scilit]
- Wang, H.J.; Liu, D.; Cui, Z.D.; Cheng, C.; Jian, Z. Investigation of the fracture modes of red sandstone using XFEM and acoustic emissions. Theor. Appl. Fract. Mech. 2016, 85, 283–293. [Google Scholar] [CrossRef] [Scilit]
- Li, S.J.; Yang, D.X.; Huang, Z.; Gu, Q.X.; Zhao, K. Acoustic emission characteristics and failure mode analysis of rock failure under stress state. Theor. Appl. Fract. Mech. 2022, 122, 103666. [Google Scholar] [CrossRef] [Scilit]
- Li, Q.; You, D.; Li, Q.; Wang, F.; Wang, Y.; Yang, Y. Analysis of Sedimentation Behavior and Influencing Factors of Solid Particles in CO2 Fracturing Fluid. Processes 2025, 3, 4049. [Google Scholar] [CrossRef] [Scilit]
- Carpinteri, A.; Lacidogna, G.; Puzzi, S. From criticality to final collapse: Evolution of the "b-value" from 1.5 to 1.0. Chaos Solitons Fractals 2009, 41, 843–853. [Google Scholar] [CrossRef] [Scilit]
- Wang, Y.; Zhang, B.; Gao, S.H.; Li, C.H. Investigation on the effect of freeze-thaw on fracture mode classification in marble subjected to multi-level cyclic loads. Theor. Appl. Fract. Mech. 2021, 111, 102847. [Google Scholar] [CrossRef] [Scilit]
- Carpinteri, A.; Lacidogna, G.; Accornero, F.; Mpalaskas, A.C.; Matikas, T.E.; Aggelis, D.G. Influence of damage in the acoustic emission parameters. Cem. Concr. Compos. 2013, 44, 9–16. [Google Scholar] [CrossRef] [Scilit]
- Zhang, Q.; Zhang, X.P. A numerical study on cracking processes in limestone by the b-value analysis of acoustic emissions. Comput. Geotech. 2017, 92, 1–10. [Google Scholar] [CrossRef] [Scilit]
- He, M.C.; Zhao, F.; Cai, M.; Du, S. A Novel Experimental Technique to Simulate Pillar Burst in Laboratory. Rock Mech. Rock Eng. 2015, 48, 1833–1848. [Google Scholar] [CrossRef] [Scilit]
- Liu, J.P.; Feng, X.T.; Li, Y.H.; Xu, S.D.; Sheng, Y. Studies on temporal and spatial variation of microseismic activities in a deep metal mine. Int. J. Rock Mech. Min. Sci. 2013, 60, 171–179. [Google Scholar] [CrossRef] [Scilit]
- Sun, B.; Yan, Y.; Wang, S.; Qi, C.; Yang, H.; Zeng, S. Self-organized criticality and value characteristics of acoustic emission of rocks under different stress paths. Rock Mech. Rock Eng. 2025, 58, 851–866. [Google Scholar] [CrossRef] [Scilit]
- Liu, C.; Zhao, G.; Xu, W.; Meng, X.; Liu, Z.; Cheng, X.; Lin, G. Experimental study on failure characteristics of single-sided unloading rock under different intermediate principal stress conditions. Int. J. Min. Sci. Technol. 2023, 33, 275–287. [Google Scholar] [CrossRef] [Scilit]
- Su, H.J.; Jing, H.W.; Zhao, H.H.; Yin, Q. Study on tensile strength and size effect of red sandstone after high-temperature treatment. Chin. J. Rock Mech. Eng. 2015, 34, 2879–2887. [Google Scholar] [CrossRef]

Disclaimer/Publisher’s Note: The statements, opinions and data contained in all publications are solely those of the individual author(s) and contributor(s) and not of MDPI and/or the editor(s). MDPI and/or the editor(s) disclaim responsibility for any injury to people or property resulting from any ideas, methods, instructions or products referred to in the content. |
© 2026 by the authors. Licensee MDPI, Basel, Switzerland. This article is an open access article distributed under the terms and conditions of the Creative Commons Attribution (CC BY) license.