


Abstract
To address the challenges in risk assessment of complex emergency systems, such as difficulties in closed-loop structure modeling, insufficient quantification of dynamic evolution, and poor adaptability to multiple scenarios, this study proposes a dynamic risk assessment method that integrates the System-Theoretic Accident Model and Processes (STAMP) and the Cascading Failure Propagation Model (CFPM). The novelty of this coupling lies in a bidirectional “qualitative diagnosis → quantitative prediction” logic: STAMP’s identification of Unsafe Control Actions (UCAs) provides a theory-grounded blueprint for configuring the CFPM network topology and propagation parameters, while CFPM’s dynamic simulation translates these qualitative control flaws into computable risk evolution trajectories. The proposed framework adopts a two-layer structure of “qualitative modeling–quantitative analysis”. STAMP is used to construct a hierarchical control structure, identify Unsafe Control Actions (UCAs), and analyze the nonlinear interaction mechanisms among “human–organization–technology” factors. For typical scenarios of “fault not processed” and “online fault processing”, CFPM is employed to abstract the system into a node network, quantify the time-step propagation process of node failure probability, calculate the system residual performance index, and generate real-time risk evolution curves. A case study of the Tianjin Port ‘8·12’ explosion accident demonstrates that this method effectively captures the closed-loop interaction characteristics and dynamic risk evolution patterns of emergency systems. Quantitative results reveal a distinct contrast between the two handling scenarios: in the absence of maintenance intervention, system residual performance deteriorates exponentially and rapidly approaches a critical threshold; in contrast, effective online maintenance significantly retards risk accumulation and facilitates gradual system recovery, thereby preventing further escalation of consequences. Compared to traditional methods like Bayesian Networks, it shows stronger applicability by explicitly modeling closed-loop feedback structures and enabling discrete time-step quantification of risk accumulation, and can accurately identify control flaws and quantify risk accumulation effects, thereby providing support for optimizing emergency strategies. Future research should focus on enhancing the method’s adaptability to data uncertainty and cybersecurity threats.
1. Introduction
As a complex socio-technical system for responding to various emergent events, the operational reliability of emergency systems directly determines whether losses can be effectively controlled and mitigated after disasters occur. A prominent characteristic of such systems lies in the collaborative participation of multiple entities, including relevant government functional departments, professional rescue teams, and involved enterprises [1]. Meanwhile, they cover multiple key links such as information transmission, decision-making, and resource allocation, with dynamic interaction relationships existing between each link and entity. Due to the close interdependence among system components, faults occurring in a certain link or entity are highly likely to trigger chain reactions, causing faults to propagate within the system in a cascading manner, thereby leading to continuous risk accumulation and ultimately exacerbating the scope and degree of disaster impacts [2]. The “8·12” explosion accident at Tianjin Port in 2015 is a typical case [3,4,5].
Conventional probabilistic models, particularly Bayesian Networks (BNs) and Dynamic Bayesian Networks (DBNs) [6], have been widely employed for risk assessment in such contexts. While effective in handling uncertainty, they exhibit critical limitations when applied to the dynamic, feedback-driven reality of emergency systems. Their inherent acyclic structure is fundamentally incompatible with the closed-loop “information feedback → decision adjustment” cycles that characterize adaptive socio-technical control [7]. Consequently, they fail to model the recursive causal chains where effects influence their own causes, a key feature of escalating accidents. Although DBNs introduce a temporal dimension, their output typically consists of macro-level, aggregate risk probabilities over time intervals [8]. This granularity is insufficient for emergency decision-support, which requires quantifying the discrete, time-step evolution of risk and system performance degradation under specific operational scenarios, such as a “fault not processed” due to negligence or “online fault processing” during ongoing response.
To address systemic causality, the System-Theoretic Accident Model and Processes (STAMP) was first proposed by Professor Leveson in the journal Safety Science in 2004, framing safety as a control problem to be maintained through constraints and hierarchical structures [9]. Globally, STAMP has been recognized as a paradigmatic shift from linear accident models to systemic causality analysis, with its applications spanning aviation, healthcare, and critical infrastructure sectors across North America, Europe, and Asia. Recent comparative studies have further confirmed that systemic methods like STAMP provide a more comprehensive perspective for analyzing accident causation in complex systems compared to traditional linear models [10]. Its application has expanded significantly, with methodological integrations enhancing its diagnostic power. For instance, Ebrahimi et al. combined STAMP with Fuzzy DEMATEL to quantify the influence of Unsafe Control Actions (UCAs) [11], while Ozan et al. fused it with FMEA and AHP for risk analysis in complex engineering systems [12]. Recently, studies have further attempted to integrate STAMP with Dynamic Bayesian Networks (DBNs) to assess the resilience of emergency response systems [13]. A similar integrative paradigm was adopted by Meng et al., who coupled STAMP with Bayesian Networks to quantitatively assess the safety of subsea blowout preventers, demonstrating that the qualitative outputs of STAMP (e.g., control structure, UCAs) can effectively guide the construction of probabilistic graphical models [14]. Applied across domains from oil and gas safety to petrochemical accidents and cross-departmental emergency coordination [15,16], STAMP has proven robust in qualitatively deconstructing control hierarchies and revealing the nonlinear interactions among human, organizational, and technical factors that precipitate control failures [17]. However, a persistent and critical shortcoming in dynamic risk assessment is STAMP’s inherent lack of quantitative, time-step simulation capability. It excellently diagnoses why and where control breaks down but cannot simulate how fast the resulting risk accumulates or how system performance degrades in real-time, which is essential for proactive emergency management [18].
Concurrently, research into Cascading Failure Propagation Models (CFPMs) has focused on quantifying the dynamic spread of disruptions. Progress in this domain has enhanced CFPM’s quantitative simulation fidelity. Khakzad et al. integrated CFPM with Dynamic Bayesian Networks to model probabilistic domino effects [8], while Zhang et al. developed sophisticated load-redistribution mechanisms for interdependent networks. Scenario-based approaches incorporating functional and geographical correlations have further advanced the simulation of secondary disaster chains [19]. These developments underscore CFPM’s strength in modeling the bottom-up, time-step progression of performance loss in networked systems. Yet a fundamental methodological gap remains in its application to socio-technical systems: CFPM requires a predefined network topology and propagation rules. It lacks the top-down, qualitative guidance to determine which specific control flaws, organizational deficiencies, or human errors—the very elements STAMP excels at identifying—should be modeled as the critical nodes and links within the network. In essence, CFPM can simulate how failures propagate given a structure, but it cannot derive that structure from an analysis of control logic.
This disconnect creates a significant bottleneck. At the international level, despite the proliferation of systemic safety models and dynamic propagation simulation techniques, there remains a notable absence of integrated frameworks that bridge the qualitative control-theoretic diagnosis of STAMP with the quantitative dynamic simulation of CFPM. The methodological isolation between these two research streams has been consistently identified as a key challenge in the international safety science community [11], yet few studies have proposed a systematic coupling mechanism that preserves the diagnostic rigor of STAMP while leveraging the computational power of CFPM. At the regional level, the urgency of this methodological integration is particularly pronounced in countries experiencing rapid industrialization, such as China, where the frequency and severity of major hazardous chemical accidents—exemplified by the Tianjin Port ‘8·12’ explosion—have exposed critical deficiencies in existing risk assessment practices. The lack of dynamic risk assessment tools that can capture the real-time evolution of such emergencies has become a pressing practical concern for both regulatory agencies and industrial operators. For emergency systems, where understanding both the root causes of vulnerability and their real-time consequences is paramount, this separation is particularly problematic. It impedes the development of holistic tools that can support decisions like when to escalate a response or prioritize maintenance on specific components. To date, no existing method adequately bridges this gap by providing both a theory-grounded diagnosis of control flaws and a discrete time-step quantification of their dynamic risk consequences within a unified framework. Thus, the present study responds to both the internationally recognized theoretical challenge of integrating qualitative and quantitative risk analysis methodologies and the regionally specific practical demand for dynamic emergency risk assessment in China’s high-risk industrial sector.
Therefore, this study proposes a deep integration of STAMP and CFPM to bridge this gap. The exact novelty of this coupling lies in a bidirectional ‘qualitative diagnosis → quantitative prediction’ logic: the qualitative outputs of STAMP—the hierarchical control structure, safety constraints, and UCAs—provide the essential, theory-grounded blueprint to configure a meaningful and context-specific CFPM network, while CFPM’s dynamic simulation translates these qualitative control flaws into computable risk evolution trajectories. This creates a closed-loop analytical framework: STAMP diagnoses the system’s ‘control pathologies,’ and CFPM dynamically simulates the risk consequences of those pathologies. This ‘qualitative modeling → quantitative analysis’ coupling directly addresses the limitations of traditional methods by explicitly incorporating control loops and enabling time-step quantification of risk evolution under varied scenarios. It offers a comprehensive pathway for dynamic risk assessment in complex, adaptive emergency systems.
2. Design of Dynamic Risk Assessment Method for Emergency Systems
2.1. Method Framework Design
This study proposes a two-layer integrated framework of “qualitative modeling–quantitative analysis”, which combines the system control structure of STAMP and the dynamic propagation mechanism of CFPM to realize the dynamic risk assessment of emergency systems. The overall process is shown in Figure 1.
Figure 1.
Flowchart of dynamic risk assessment for emergency systems integrating STAMP and CFPM.
The proposed framework operates through two sequential layers:
Layer 1: Qualitative System Modeling based on STAMP. This stage aims to deconstruct the system’s complexity. First, a hierarchical control structure of the emergency system is constructed, encompassing regulatory bodies, management, operational units, and software/hardware components, to clearly delineate the paths of control, feedback, and information flow within and outside the system. Subsequently, based on this structure, potential Unsafe Control Actions (UCAs) are systematically identified, and the nonlinear interaction mechanisms among “human–organization–technology” factors that lead to these UCAs are thoroughly analyzed. This process qualitatively reveals the inherent control flaws and risk sources within the system.
Layer 2: Quantitative Dynamic Analysis based on CFPM. This stage aims to simulate the dynamic evolution of risk. Key components identified in the qualitative stage are abstracted as network nodes, and a node network is constructed based on their interactive relationships. For typical scenarios such as “fault not processed” and “online fault processing”, the CFPM is employed to quantify the cascading failure propagation process of node failure probabilities across the network in a time-step manner. By calculating the system residual performance index, real-time and visual risk evolution curves for the overall system are ultimately generated, vividly portraying the entire process of risk accumulation, outbreak, and recession.
The core advantage of this framework lies in its integration of the two models into an organic whole, rather than a simple juxtaposition: the qualitative analysis results from STAMP provide solid model inputs and propagation logic for the quantitative simulation of CFPM. Conversely, the quantitative results from CFPM validate and concretize the control weaknesses revealed by STAMP, achieving a closed loop from “mechanism analysis” to “situation prediction”. This bidirectional coupling—where STAMP’s UCAs determine the CFPM network configuration and CFPM’s simulations quantify the dynamic consequences of those UCAs—constitutes the methodological novelty of this study.
2.2. STAMP Modeling
STAMP regards system safety as a control problem and emphasizes maintaining the system’s safe state through hierarchical control structures and safety constraints. Its core lies in identifying “UCAs” and analyzing the nonlinear interaction mechanisms among “human–organization–technology”. STAMP is suitable for qualitative analysis of complex systems, and is particularly good at revealing breaks and failure links in control loops.
- (1)
- Clarify system boundaries and safety constraints
Define the scope of entities and components covered by the emergency system, such as command centers, rescue teams, and information systems. Combined with regulations and experience, establish the basic safety constraints for system operation, such as “hazardous material information must be synchronized in real time” and “resource allocation must meet on-site needs”.
- (2)
- Construction of hierarchical control structure
Taking the Tianjin Port accident emergency system as an example, the emergency system control structure is usually divided into four levels:
- Management Level: Formulates policies and safety standards;
- Control Level: Converts policies into operational instructions;
- Execution Level: Implements specific rescue operations;
- Feedback Level: Collects and transmits system status data.
Each level forms a closed-loop circuit through control actions and information feedback.
- (3)
- Identify UCAs
According to the STAMP method, UCAs are divided into four categories: (1) failure to provide necessary control actions; (2) actions have safety hazards; (3) improper timing of control action implementation; (4) duration of control actions. These behaviors are the direct causes of control function failures in emergency systems and need to be accurately identified and analyzed in combination with specific scenarios.
2.3. Quantification of the Risk Accumulation Process
This study defines two typical fault handling scenarios: “fault not processed” and “online fault processing”. These two scenarios fundamentally determine the propagation scope of faults in the system and the rate of risk accumulation, and serve as key prerequisites for constructing a dynamic risk assessment model [2].
2.3.1. Two Scenarios of Fault Propagation in Emergency Systems
Fault not processed: This scenario refers to situations where faults occurring in the system are not detected in a timely manner or effectively intervened due to technical limitations (e.g., monitoring equipment failures) or human factors (e.g., operational negligence, lack of experience, judgment errors). This type of scenario includes intentional negligence (e.g., discovering a fault but failing to report it) and unintentional negligence (e.g., failing to detect a fault due to lack of on-duty monitoring). Faults not processed will propagate to downstream nodes along system dependencies, triggering functional chain decay and ultimately impeding the overall emergency response efficiency.
Online fault processing: This scenario refers to a strategy of intervening in faults without stopping core disposal tasks to ensure the continuity of emergency response. For example, activating a backup communication link while repairing information transmission equipment. At this time, faults still have propagability, and their propagation probability is regulated by maintenance efficiency: if a fault occurs at a node at time, it may still affect downstream nodes with a certain probability at time. Therefore, it is necessary to conduct a quantitative assessment of the risk accumulation process under this scenario in combination online fault processing effectiveness. The specific details of fault propagation and risk accumulation can be referred to in Figure 2.
Figure 2.
Fault propagation path and risk accumulation.
2.3.2. CFPM for Fault Not Processed
When faults in the emergency system are not addressed due to human negligence or technical limitations, faults will spread downstream along node dependency links, and nodes themselves will experience performance degradation over time, with risks accumulating in a stepwise manner [20]. In this scenario, a multi-dimensional formula system is required to quantify single-node propagation, multi-node coupling effects, and overall system performance. The specific formula system is as follows:
- (1)
- Single-node failure probability transmission:
Node failure has a time lag. The failure state of an upstream node i at time t will be transmitted to a downstream node j with a specific probability, and its impact will manifest at time . Combining the typical propagation laws in emergency systems—such as “information deficiency → decision deviation” and “equipment failure → operational error”—the formula for single-node failure probability transmission is defined as follows:
The failure state of an upstream node i at time t will be transmitted to a downstream node j with probability , and its direct impact probability will be reflected at time :
where represents the failure probability of node i at time t and represents the conditional probability that the failure of node i leads to the failure of node j.
- (2)
- Node self-degradation and multi-node impact:
The failure probability of node j at time needs to consider its own state degradation, and the formula is
represents the probability that node j fails at time when it is normal at time .
When node j is affected by multiple upstream nodes (logical “OR” gate), its failure probability is
where u represents the upstream nodes affecting node j and n represents the number of nodes affecting node j.
System remaining performance assessment: The overall system performance is measured by the remaining performance index :
represents the weight of node (calculated by node degree : ), and m is the number of nodes in the system.
2.3.3. CFPM for Online Fault Processing
When an emergency system adopts online fault processing (e.g., conducting rescue operations while repairing information equipment), a maintenance coefficient needs to be introduced to correct the propagation probability. The core formula is as follows:
Node failure probability considering maintenance:
Here, represents the failure probability of node j at time tx when it fails at time tx−1, and represents the failure probability of node j at time j when it is normal at time tx−1.
Multi-node impact and system performance: For calculating the failure probability of multi-node or gate relationships, corrections to the propagation probability based on maintenance must be introduced. The system remaining performance is still calculated using Formula (4).
3. Case Study
3.1. Case Description
The “8·12 Tianjin Binhai New Area Explosion Accident” was an extraordinarily serious safety accident that occurred in the Binhai New Area of Tianjin [21]. At 22:51:46 on 12 August 2015, a fire and explosion accident broke out in the hazardous material warehouse of Ruihai International Logistics Co., Ltd., located in Tianjin Port, Binhai New Area, Tianjin. The total explosive energy of this accident was approximately 450 tons of TNT equivalent. The direct cause was the spontaneous combustion of nitrocellulose due to long-term improper storage, which further detonated ammonium nitrate and other hazardous materials. This accident caused extremely heavy casualties and property losses: 165 people were killed and 798 people were injured. As of 10 December 2015, according to standards and regulations such as the Statistical Standards for Economic Losses from Enterprise Employee Casualty Accidents [22], the verified direct economic losses of the accident reached 6.866 billion yuan. The investigation team of the State Council confirmed that this accident was an extraordinarily serious work safety liability accident [5]. The description of these failures is based on factual accounts in the investigation report and is used here for engineering analysis of control deficiencies, not for legal attribution of responsibility.
The accident exposed multiple failures of the emergency system: Ruihai Company failed to truthfully declare the hazardous material storage information, violating the safety constraint that “enterprises must submit accurate hazardous material lists”; the fire-fighting team adopted an incorrect fire-fighting method (e.g., water cooling intensified the reaction of ammonium nitrate) because they did not obtain complete hazardous material data; and chaotic information transmission led to delayed command and decision-making [23], which reflected the typical scenario of “risk accumulation caused by fault not processed or improper online fault processing” [3].
This accident was selected as the single case study for three primary reasons. First, its critical-case value: the ‘8·12’ accident is recognized as one of the most severe industrial accidents in China’s recent history, exhibiting the full spectrum of control failures across all four levels of the emergency system—from regulatory supervisory gaps (Management Level) and command platform deficiencies (Control Level) to operational errors (Execution Level) and information distortion (Feedback Level). This comprehensive failure profile makes it particularly suitable for validating the STAMP-CFPM framework’s capability to capture multi-level, closed-loop failure chains. Second, data availability and completeness: the official Investigation Report of the State Council provides detailed, systematically documented evidence of causal relationships, responsibility allocation, and emergency response timelines, enabling rigorous parameterization of the CFPM network and cross-validation of simulation results against actual accident progression. Third, representativeness: the accident typifies the “human–organization–technology” interaction failures that are characteristic of complex socio-technical emergency systems, making the findings potentially transferable to similar high-risk industrial contexts despite being a single case.
3.2. STAMP Modeling of Tianjin Port Emergency System
3.2.1. Construction of Control Structure
To systematically depict the control logic and failure paths of the emergency system in a complex interactive environment, this study constructs a hierarchical control structure based on STAMP. This structure provides a structured foundation for subsequent UCA identification and risk propagation modeling, as shown as Figure 3. The specific construction process is as follows:
Figure 3.
Hierarchical control structure of the emergency management system.
- (1)
- Define System Boundaries
Combining the responsible entities and emergency disposal processes specified in the Investigation Report on the “8·12” Extraordinarily Serious Fire and Explosion Accident at Tianjin Port, the system boundary is defined as a complete emergency system covering the entire chain of “government supervision–enterprise execution–on-site rescue–information feedback”.
- (2)
- Four-Level Control Structure and Closed-Loop Failure Correlation
Based on STAMP’s hierarchical control concept and the responsibility determination in the accident investigation report, a four-level control structure (covering Management Level, Control Level, Execution Level, and Feedback Level) as shown in the figure is constructed. Through a two-way interaction mechanism of “control commands transmitted top-down and status information fed back bottom-up”, this structure forms a dynamic closed-loop control system of “Management Level → Control Level → Execution Level → Feedback Level → Control Level/Management Level”.
3.2.2. Identification of Safety Constraints and UCAs
Based on the four-level control structure (Management Level, Control Level, Execution Level, Feedback Level) of the emergency system for the Tianjin Port explosion accident, and combined with relevant laws and regulations, industry standards, and accident investigation results, the core safety constraints and corresponding UCAs at each level are identified as shown in Figure 4.
Figure 4.
Identification of safety constraints and UCAs for the Tianjin Port explosion accident.
3.2.3. Identification and Classification of Causal Factors
Based on the constructed STAMP control structure and safety constraints, this study systematically identifies UCAs at each level. To build a causal factor system suitable for CFPM quantitative analysis, these UCAs are further refined and categorized to form a structured list of causal factors. The selection of the 20 causal factors followed a three-step procedure: First, all UCAs identified in Section 3.2.2 were systematically reviewed and decomposed into specific causal events based on the causal chain analysis. Second, referring to the official Investigation Report on the ‘8·12’ Extraordinarily Serious Fire and Explosion Accident at Tianjin Port and supplementary emergency disposal review data, candidate causal factors were screened and consolidated from three core dimensions: ‘technical defects’ (e.g., equipment failure, sensor malfunction), ‘regulatory deficiencies’ (e.g., supervisory gaps, non-enforcement), and ‘enterprise violations’ (e.g., data falsification, illegal storage). It is worth noting that nodes X1–X5 (e.g., supervisory omissions by the Ministry of Transport and Tianjin’s planning department), X8 (lack of access to real-time enterprise data), and X10 (absence of a dynamic inventory system) primarily reflect inter-agency coordination gaps and administrative deficiencies rather than technical failures per se. This distinction is important when applying the framework to other regulatory contexts, as the nature of the underlying causal factors may influence the selection of remedial measures. Third, the candidate factors were cross-validated against the STAMP four-level control structure to ensure coverage of all four hierarchical levels—Management, Control, Execution, and Feedback—and were finalized through expert review involving three domain specialists in safety engineering and emergency management. The final set of 20 key causal factors (X1–X20) was determined based on two criteria: (i) the factor must be directly traceable to a specific UCA identified in the STAMP analysis; and (ii) the factor must have a well-defined causal relationship with at least one other factor in the network, enabling the construction of meaningful propagation links for CFPM simulation. It should be noted that the “causal factors” identified in this study are engineering abstractions used for system modeling and risk propagation analysis, rather than legal determinations of fault or liability. The weighting assigned to each factor reflects its structural position and connectivity within the network for propagation modeling purposes, and does not represent any judgment regarding the legal responsibility apportionment established in the official investigation report. As shown in Table 1, each causal factor specifies its affiliated Control Level, specific description, and associated UCA type (indicated by code).
Table 1.
Classification table of causal factors in the emergency system of Tianjin Port explosion accident.
3.3. Quantitative Risk Accumulation Based on CFPM
This section, based on the STAMP model, safety constraints, UCAs, and causal factor classification system of the Tianjin Port “8·12” explosion accident emergency system constructed above, maps 20 core causal factors (X1–X20) to network nodes. According to the CFPM methodological framework of “node network modeling–parameter setting–risk quantification”, an emergency system fault propagation network is constructed. Its core research path is shown in Figure 5.
Figure 5.
Derived network structure of the emergency system.
Node Definition: Based on the STAMP four-level control structure, the 20 causal factors (X1–X20) identified in Table 1 are directly defined as independent nodes in the CFPM network. To avoid subjectivity in link setting, referring to the responsibility determination in the Investigation Report on the “8·12” Extraordinarily Serious Fire and Explosion Accident at Tianjin Port, node associations are verified from below aspects:
Direct causal association: If the accident report clearly states that “the failure of node i is the direct cause of the failure of node j”, a strong association link is established.
Indirect influence association: If the failure of two nodes has an interaction of “defect superposition exacerbating risk” in the report, a weak association link is established with reference to the “logical or gate” relationship.
Core Parameter Setting of Nodes:
Node Degree () and Weight (): The node degree () is defined as the total number of upstream and downstream links (in-degree + out-degree) of the node, used to measure its local influence in the network. The calculation results of the degree and weight of each node are shown in Table 2.
Table 2.
Node degree () and weight () of causal factors in Tianjin Port Emergency System.
Fault propagation conditional probability : This parameter is the core of dynamic simulation, representing the conditional probability that the failure of upstream node i leads to the failure of downstream node j, with a value range of [0,1]. To reduce the subjectivity impact on parameter setting, this study proposes a multi-source data fusion setting method, with specific bases as follows:
Strong association links (): This is applicable to direct and necessary conditional relationships clearly indicated in the accident report. For example, the report states that “Ruihai’s failure to report data directly led to the command platform having no data available”, so (for the link from X18 to X8) is set.
Medium association links (): This is applicable to situations where the failure of node i provides an “important inducement” but is not the only condition for the failure of node j. For example, X17 is an important cause of X2, but regulatory deficiencies are also affected by X1, so is set.
Weak association links (): This is applicable to situations where there is only “indirect influence” or background correlation between nodes. For example, X3 indirectly led to X19, but was not a direct cause, so is set.
The assignment of specific probability values within each tier was further guided by three principles: (i) direct causal statements in the official investigation report were assigned values at the higher end of the corresponding tier (e.g., direct causal links received values between 0.8 and 0.95); (ii) factors described as “contributing” or “aggravating” in the report were assigned medium-tier values based on the strength of the descriptive language; and (iii) for links not explicitly mentioned in the report but logically inferred from the system control structure, values were assigned at the lower end of each tier and cross-validated by three domain experts in safety engineering. This systematic approach ensured that the conditional propagation matrix was traceable to documentary evidence, logically consistent with the STAMP control structure, and reasonably constrained to minimize subjectivity.
Due to the large number of nodes, the complete fault propagation conditional probability matrix is large. For ease of presentation, the conditional probabilities between some key nodes are selected as examples. The core part of the fault propagation conditional probability matrix of the Tianjin Port Emergency System is shown in Table 3.
Table 3.
Partial fault propagation conditional probability matrix of Tianjin Port Emergency System.
The iterative calculation of node failure probability and system residual performance was completed by Python 3.10 (Python Software Foundation, Wilmington, DE, USA).
3.3.1. CFPM for Fault Not Processed
The fault not processed scenario corresponds to the actual scene in the Tianjin Port “8·12” explosion accident where “faults were not disposed of in time due to human negligence or technical limitations”, such as the evolution process of causal factors like Ruihai Company concealing abnormal dangerous goods storage (X7) and on-site sensor damage going undetected (X19). Based on the aforementioned network topology and parameter system, this section refers to the calculation framework of Formulas (1)–(4), supplements general assumptions in combination with the characteristics of the emergency system, and restores the dynamic process of risk accumulation in this scenario through iterative calculation of node failure probability and system remaining performance analysis.
- (1)
- Scenario Assumptions and Initial Conditions
Initial Fault Node: Combining the accident investigation report, the initial fault is set as feedback layer node X18, which is the source causal factor of accident information distortion. The failure probability at initial time is (complete failure).
Time Step Setting: Dimensionless time intervals (, , …), are adopted, and each time step corresponds to a key decision or operation stage in the emergency response process to adapt to the high time sensitivity of emergency disposal.
Self-Degradation Probability: Referring to the aging law of emergency system equipment and personnel operation error statistics, the self-degradation probability of all nodes is set as (i.e., the probability of failure due to self-degradation at time when the node is normal at time is 30%), and the node remains failed once it fails().
- (2)
- Risk Accumulation Calculation and Results
Based on CFPM Formulas (1)–(4), the fault propagation process is quantified. Core nodes (X7, X8, X12, X18) are selected for key time step calculation, and the results of all nodes are shown in Table 4. Single-node failure probability transmission ():
Table 4.
Node failure probabilities and system remaining performance at each moment when faults are unprocessed.
Time Step: First Propagation of Initial Fault
At initial time , node X18 (data falsification) completely fails. According to Table 2, its downstream strong-correlation node is X8 (no access to real-time data, ), and the medium-correlation node is X7 (no report of storage abnormality, ).
Failure probability of node X8 (Formula (1)):
Failure probability of node X7 (Formula (1)):
Other nodes (e.g., X2, X6, X12) are not directly affected by the initial fault, so their failure probability at time is the self-degradation probability of 0.3.
Time Step: Multi-node Coupling Influence
At time , Execution-Level node X12 (wrong fire-fighting method) is affected by Control-Level nodes X7 (, ) and X8 (, ) via a logical “OR” gate, while considering the self-degradation probability.
Failure probability of node X12 (Formula (3)):
Failure probability of node X8 (Formula (2)): Since it has failed at time , .
Time Step: Cascading Failure of Feedback Level and Execution Level
At time , Feedback-Level node X19 is affected by X8 (, ) and Management-Level node X2 is affected by X17 (, ).
Failure probability of node X19 (Formula (3)):
System remaining performance (Formula (4)):
. Substituting the weights from Table 2 and node failure probabilities, is calculated.
Full-node Failure Probability and System Performance
Based on the above logic, the node failure probability at each time step is calculated iteratively, and the system remaining performance decreases with time steps, as shown in Table 4.
- (3)
- Result Analysis
System performance evolution law
In the scenario of fault not processed, the system remaining performance shows a typical exponential decay trend (Figure 6). At the initial moment, the system performance is intact with ; at , due to the rapid failure of key nodes (X7, X8) in the Control Level, the performance drops significantly to 0.72 for the first time; at , the failure of Execution-Level node X12 causes the performance to fall below the preset safety threshold (0.5), dropping to 0.45. The safety threshold of 0.5 is justified by two considerations: (i) from a reliability theory perspective, indicates that more than half of the weighted functional nodes have failed, rendering the system incapable of sustaining effective emergency response—a criterion commonly referred to as the “majority functional integrity” principle; and (ii) from a case-specific perspective, the cumulative weight of critical Control-Level and Execution-Level nodes (X6, X12, X18) accounts for approximately 50% of the total system weight, establishing 0.5 as a theoretically grounded demarcation point. This threshold is case-specific and should be recalibrated when applying the framework to different emergency systems.
Figure 6.
System performance over time when faults are not processed.
Sensitivity analysis of key nodes
By comparing node weights and the contribution of failure probability, three types of key nodes are identified:
Source node (X18): With a weight of 0.056, although not the node with the highest weight, its initial failure directly triggers the propagation of subsequent 80% of nodes, serving as the “trigger point” for risk accumulation;
Hub node (X8): With a weight of 0.044, it connects the Feedback Level and Execution Level. After failure, it causes four downstream nodes (X12, X15, X16, X19) to fail rapidly, acting as the “transfer station” for fault propagation;
Consequential node (X12): With a weight of 0.056, its failure directly exacerbates the accident consequences (wrong fire-fighting method triggers a secondary explosion), and its contribution to the system performance decline reaches 23% (higher than other nodes).
To further examine the sensitivity of these critical nodes to parameter variations, we conducted additional analyses by perturbing the weight and propagation probability of the three identified critical nodes within a ±20% range. The results reveal that: (i) variations in X18’s propagation probability have the most significant impact on early-stage system performance (within the first two time steps), with a 20% reduction delaying the threshold breach by one time step; (ii) changes in X12’s weight directly affect the magnitude of performance decline at , with a 20% increase in weight accelerating the decay rate by approximately 18%; and (iii) X8’s influence is most pronounced in the middle propagation phase ( to ), where its weight variation alters the failure probabilities of four downstream nodes simultaneously. These findings confirm that the three identified critical nodes are indeed the most sensitive to parameter variations, and their accurate parameterization is essential for reliable risk assessment results.
3.3.2. CFPM for Online Fault Processing
The online fault processing scenario corresponds to the actual scene in the Tianjin Port “8·12” explosion accident where “faults are repaired while being handled to avoid rescue interruption”, such as emergency operations like communication equipment repair and backup sensor activation in the later stage of the accident. In this scenario, fault propagation is not completely blocked, but maintenance measures reduce the failure probability by repairing key nodes (such as information transmission equipment, monitoring sensors), and the risk accumulation rate depends on maintenance efficiency. Based on the actual process of information linkage and technical equipment repair in the accident, combined with the previously constructed network topology and parameter system, this section refers to the calculation framework of Formula (5), supplements assumptions and parameters for the online maintenance scenario, and quantifies the dynamic risk evolution process in this scenario.
- (1)
- Assumptions and Maintenance Coefficient Setting
Combining the emergency disposal review data in the Investigation Report on the “8·12” Extraordinarily Serious Fire and Explosion Accident at Tianjin Port, the core assumptions and parameter settings for the online fault processing scenario are as follows:
Initial Fault Node and Propagation Basis: Consistent with the “fault not processed” scenario, the initial fault is still set as feedback layer node X18, and the failure probability at initial time is ; the fault propagation logic between nodes still follows the or gate rule, and the basic propagation probability matrix refers to Table 2 to ensure the consistency of comparison between the two scenarios.
Maintenance Start Timing and Scope: According to the actual rescue sequence of the accident, maintenance measures are set to start at time -at this time, control layer node X6 detects the fault through abnormal data from the feedback layer (such as X19) and immediately implements maintenance on two types of key nodes:
Information Transmission Nodes: Conduct data verification on the information system of Ruihai Company associated with X18, and simultaneously activate the government’s emergency backup communication link;
Technical Monitoring Nodes: Replace the damaged on-site monitoring equipment of X19 and supplement portable toxic gas detectors.
Maintenance Coefficient () Setting: The maintenance coefficient is used to quantify the correction effect of maintenance measures on the node failure probability (value range , the larger is, the higher the maintenance efficiency). Referring to the actual effects of “ function recovery after communication equipment repair” and “ data collection recovery after sensor replacement” in the accident, combined with expert evaluation of similar scenarios in the emergency management field, the comprehensive maintenance coefficient is set as ; that is, the node failure probability after maintenance is corrected to of the original probability. Among the nodes, information transmission nodes (X18, X20) have higher maintenance efficiency (), and technical monitoring nodes (X19, X15) have slightly lower maintenance efficiency due to complex on-site environments ().
Maintenance Continuity Assumption: Maintenance measures take effect continuously from time , and iterative maintenance is performed on nodes that are not completely repaired at each time step; if the node failure probability drops below 0.1, it is determined as “functional recovery”, and targeted maintenance is stopped and transferred to routine monitoring.
- (2)
- Risk Accumulation Calculation and Results
Based on CFPM Formula (5) for the online fault processing scenario, the maintenance coefficient needs to be introduced to correct the node failure probability. The core logic is as follows: the failure probability of node j at time after maintenance = failure probability without maintenance × (1 − maintenance coefficient) + self-degradation probability of the node × maintenance compensation coefficient. The following calculates key nodes by time steps, and the results of all nodes are summarized in Table 4.
Key Time Step Calculation Process:
Time Step (Before Maintenance Activation): The initial fault node X18 () affects downstream nodes according to the original propagation probability, consistent with the “fault not processed” scenario:
Control-Level node X8: Affected by X18, ;
Control-Level node X7: Affected by X18, ;
Other nodes (e.g., X2, X12, X19) have a failure probability of 0.3 (self-degradation probability, fault not processed impact).
System remaining performance : Calculated by Formula (4) as , the same as that in the “fault not processed” scenario (maintenance not yet effective).
Time Step (First Maintenance Effect):
Implement maintenance on information transmission nodes X18 and X20 and technical monitoring nodes X19 and X15 to correct the failure probability:
Feedback-Level node X18: Failure probability after maintenance:
Feedback-Level node X19: Affected by X8 (); after maintenance,
Execution-Level node X12: Affected by X7 (, ) and X8 (, ) via a logical or gate; after maintenance, calculated as
(: average maintenance coefficient for the Execution Level)
System remaining performance : Substituting the corrected node failure probabilities, , an increase of 28.9% compared to 0.45 in the “fault not processed” scenario, and the risk suppression effect of maintenance is initially evident.
Time Step (Iterative Deepening of Maintenance): Continue maintaining key nodes, and some nodes achieve functional recovery:
Feedback-Level node X20: Affected by X19 (); after maintenance,
(<0.1, determined as functional recovery);
Management-Level node X2: Affected by X17 (, ); after maintenance . System remaining performance , an increase of 103.2% compared to 0.31 in the “fault not processed” scenario, and the risk accumulation trend is significantly contained.
Full-Node Failure Probability and System Performance
Based on the above calculation logic, the failure probabilities of all nodes and the system remaining performance at each time step are obtained iteratively, as shown in Table 5.
Table 5.
Node failure probabilities and system remaining performance at each time step.
- (3)
- Result Analysis
Evolution Law of System Performance: Evolution Law of System Performance In the online fault processing scenario, the system remaining performance shows a trend of “first decreasing and then increasing” (in Figure 7), which is significantly different from the continuous decrease in the “fault not processed” scenario:
Figure 7.
Evolution curves of system remaining performance under two scenarios in Tianjin Port Emergency System.
Decreasing phase (): Before the maintenance measures are activated (), decreases to 0.72 consistently with the “fault not processed” scenario; from , as maintenance has not yet fully covered key nodes, continues to drop to 0.58 (still higher than 0.45 in the “fault not processed” scenario). This phase is a temporary decrease caused by the “maintenance lag effect”.
Recovering phase (): With the deepening of maintenance measures, key nodes such as X20 (communication equipment) and X19 (sensor) successively achieve functional recovery. continuously recovers from 0.58 to 0.78, increasing by 34.5% compared with the moment. This indicates that maintenance has effectively blocked the risk chain of “information distortion–decision deviation–improper operation”, which is consistent with the actual situation in the later stage of the Tianjin Port accident, such as “improved command efficiency after communication recovery” and “restored on-site monitoring after activation of backup sensors”.
Sensitivity Analysis of Maintenance Efficiency: By adjusting the value of the maintenance coefficient (0.2, 0.35, 0.5), the impact of different maintenance efficiencies on system performance is analyzed, and the results are as follows:
High-efficiency maintenance (): At time , , which is 7.9% higher than the baseline ; at time , , reaching the performance level of the baseline at time one time step in advance. This shows that improving maintenance efficiency (e.g., shortening emergency repair response time and increasing the number of backup equipment) can accelerate risk reduction.
Low-efficiency maintenance (): At time , , which is 12.7% lower than the baseline ; at time , , still lower than the baseline of 0.78. This indicates that when maintenance efficiency is insufficient, although risk accumulation is delayed, it is difficult to achieve effective recovery of system performance, and it is necessary to combine “partial shutdown for repair” to further control risks.
Identification of Key Maintenance Nodes.
Combining node weight and the magnitude of the decrease in failure probability after maintenance, two types of core maintenance nodes are identified:
Priority maintenance nodes (X18, X20): After maintenance, the failure probability of X18 (weight = 0.056) decreases from 1 to 0.42 (at ), contributing 21% to the improvement of system performance; after the functional recovery of X20 (weight = 0.044), it directly reduces the information gap risk between the Management Level and the Control Level. Such nodes need to be equipped with hot standby devices to ensure the maintenance response time is less than 30 min.
Secondary maintenance nodes (X19, X12): After maintenance, the failure probability of X19 (weight = 0.033) decreases from 0.3 to 0.09, solving the problem of missing on-site monitoring data; after maintenance, the failure probability of X12 (weight = 0.056) decreases from 0.91 (at , without maintenance) to 0.26 (at ), reducing secondary disasters caused by improper operations. Such nodes need to formulate standardized maintenance procedures (e.g., rapid sensor calibration guidelines, rescue operation correction plans, etc.).
3.4. Result Analysis
Comparative Analysis with Traditional Risk Assessment Methods
In the field of emergency system risk assessment, traditional tools such as Bayesian Networks and Dynamic Bayesian Networks are widely used [7]. However, their limitations in complex emergency systems have gradually become prominent. By comparing with the STAMP/CFPM integration method proposed in this study, the adaptability advantages of the integrated method can be clearly highlighted.
As a directed acyclic graph model, Bayesian Networks can handle some uncertainty issues, but they struggle to adapt to the closed-loop characteristics of emergency systems. The closed-loop control structure of “information feedback–decision adjustment” in emergency systems (such as the dynamic interaction between the command center and on-site rescue in the Tianjin Port accident) involves a large number of cyclic dependency relationships among “controllers–sensors–actuators”. However, the acyclic nature of BNs makes it impossible to model such nonlinear interactions, resulting in the failure to capture the cascading process of “faults spreading from the information layer to the decision-making layer and then reacting on the execution layer”. For example, in the Tianjin Port accident, the falsification of hazardous material storage data by Ruihai Company (a feedback layer fault) affected the decision-making of the command center (control layer), which in turn led to the fire-fighting team adopting an incorrect fire-extinguishing method (execution layer). Moreover, operational errors in the execution layer further exacerbated on-site risks, forming a closed-loop failure chain of “feedback–control–execution–feedback” a dynamic cyclic process that BNs cannot fully represent [24].
To provide a direct quantitative comparison, we constructed a benchmark BN model based on the same 20 nodes and conditional probability tables derived from the accident report, and a DBN model with two time slices using the same transition probabilities. The comparison focuses on two quantitative metrics: (i) the capability to capture closed-loop feedback effects, measured by whether the model can represent the recursive causal chain of “feedback failure → decision error → execution failure → aggravated feedback”; and (ii) the granularity of risk quantification, measured by the ability to output discrete time-step node failure probabilities.
For the closed-loop feedback chain “X18 (data falsification) → X8 (information deficit) → X12 (operational error) → X19 (monitoring failure) → X8 (further information deficit)”, BN fails to represent this cycle entirely due to its acyclic constraint, and DBN can only approximate it by duplicating nodes across time slices without capturing the causal dependency from X19 back to X8 within the same operational phase. In contrast, the STAMP-CFPM framework explicitly models this closed-loop interaction through the STAMP control structure and propagates it dynamically via CFPM’s time-step iteration. For risk quantification granularity, BN outputs a single aggregated probability (e.g., the joint failure probability of critical nodes is 0.32 for the entire scenario period), while DBN provides interval-averaged probabilities (e.g., averaged over the eight time steps is 0.42). Our method outputs discrete time-step values (e.g., ), enabling identification of the exact moment when system performance breaches the safety threshold. This discrete time-step capability is essential for emergency decision-making, as it supports time-critical actions such as “when to escalate response” or “when to initiate maintenance.” In summary, the comparative benchmark demonstrates that the proposed framework offers superior explanatory performance by explicitly modeling closed-loop causality and superior predictive performance by providing discrete time-step risk trajectories rather than aggregated or interval-averaged probabilities.
Dynamic Bayesian Networks extend BNs by introducing the time dimension and can handle time-series data, but they still have significant limitations. DBNs focus on the macro estimation of the overall system risk (e.g., the total probability of an accident occurring within a certain period), while the risk evolution of emergency systems has strong time-step dependence. For instance, in the Tianjin Port accident, a decision-making error at time in the control layer directly led to an operational error at time in the execution layer, and the risk accumulation amplitude at each time step is closely related to the fault propagation probability. DBNs cannot quantify such risk details at discrete time points, making it difficult to support refined decisions such as “when to initiate an upgraded response”. Taking the “communication interruption” fault in the accident as an example, DBNs can only estimate the overall risk probability during the communication interruption period, but cannot accurately calculate the impact of communication interruption on the transmission of command instructions at time , or the interference with the adjustment of rescue routes at time —details that are crucial for emergency decision-making.
In contrast, the STAMP/CFPM integrated method has achieved three breakthroughs: First, through the hierarchical control structure (such as the four-level control closed loop in the Tianjin Port accident), STAMP naturally adapts to the closed-loop interaction characteristics of emergency systems and can accurately identify the chain control failures of “information concealment–decision deviation–operational error”. Second, CFPM realizes the time-step iterative calculation of node failure probability (e.g., Formulas (1)–(5)), enabling the quantification of risk accumulation amplitude at each time point. For example, the accurate calculation of the system remaining performance at time in the Tianjin Port case provides a basis for judging whether the risk exceeds the threshold. Third, the two-layer framework of “qualitative modeling–quantitative analysis” not only retains STAMP’s in-depth analysis of “human–organization–technology” interactions but also converts abstract control defects into computable risk curves through CFPM, solving the contradiction that traditional methods “either cannot model closed loops or are difficult to quantify dynamics”. The conclusion that the proposed method “shows stronger applicability” is drawn not from statistical comparison across multiple accident cases but from the structural and methodological advantages demonstrated through this critical case: the framework captures causal relationships (e.g., closed-loop feedback) that BNs and DBNs fundamentally cannot represent, and it provides time-step granularity of risk evolution that interval-based probabilistic models cannot offer. These are inherent, logic-based advantages rather than empirical superiority requiring multi-case statistical validation. Nevertheless, we acknowledge the limitation of single-case generalizability in Section 4.3 and outline future work on multi-case validation.
4. Discussion
Based on the case study of the Tianjin Port ‘8·12’ explosion accident emergency system presented in Section 3, this section aims to provide an in-depth discussion of the theoretical contributions and practical value of the STAMP-CFPM integrated framework, while objectively examining its current limitations to guide future research and application.
4.1. Advantages and Theoretical Contributions of the Integrated Method
The core advantage of the proposed STAMP-CFPM coupling framework lies in bridging the methodological gap between “qualitative diagnosis” and “quantitative prediction” in system safety analysis, providing a systematic tool for dynamic risk assessment of complex emergency systems.
First, this framework inherently adapts to the closed-loop control logic of emergency systems, overcoming the structural limitations of traditional probabilistic graphical models (e.g., BNs, DBNs). As shown in Section 3.2, the four-level “Management–Control–Execution–Feedback” structure constructed by STAMP clearly delineates the closed-loop failure chain in the Tianjin Port accident: “enterprise data falsification (Feedback Level) → command platform information deficit (Control Level) → firefighting team erroneous action (Execution Level)”. This capability to model nonlinear, feedback-driven causal relationships is fundamentally unattainable for BNs and DBNs, which are inherently directed acyclic graphs. Our analysis demonstrates that the accident escalation was not a simple linear superposition of causes but a dynamic process involving successive violations of multiple safety constraints within control loops.
Second, the framework enables the dynamic quantification and visualization of risk at discrete time steps, surpassing the macro-level, aggregated risk representation of traditional methods. As shown in the results of Section 3.3, CFPM simulation allows for the precise calculation of the system remaining performance evolution at each decision or operational time step (Figure 6 and Figure 7). For instance, in the “fault not processed” scenario, fell below the safety threshold of 0.5 at time . This quantification provides a clear basis for decisions such as “when to initiate an escalated emergency response.” In contrast, while DBNs can provide overall risk probabilities over time intervals, they cannot offer such a granular, dynamic risk trajectory linked to specific operational scenarios (e.g., online maintenance).
Finally, the framework establishes an integrated analytical closed loop of “pathology diagnosis → consequence projection.” The Unsafe Control Actions (UCAs) and causal factors qualitatively identified by STAMP (e.g., Table 1) provide a theory-driven network topology and key node weights (e.g., Table 2) for CFPM. CFPM, in turn, translates these qualitative “flaws” into quantifiable risk accumulation curves and performance degradation paths through dynamic simulation. This coupling allows analysts to understand both why a system is vulnerable (STAMP’s contribution) and how fast that vulnerability might lead to system failure (CFPM’s contribution), thereby providing comprehensive support for proactive risk management.
4.2. Engineering and Managerial Implications
The quantitative findings from the case study and the analytical capabilities of the STAMP-CFPM framework yield specific implications for enhancing the resilience and decision-making of emergency management systems. These implications stem not only from the retrospective analysis of the Tianjin Port ‘8·12’ accident but are also formulated as general principles for systemic optimization.
- (1)
- Precise Identification and Targeted Remediation of Control Flaws
The Unsafe Control Actions (UCAs) identified by STAMP provide a precise profile of systemic vulnerabilities. Based on these, managers can implement targeted corrective measures for control flaws at different levels:
UCAs at the Feedback/Execution Level (e.g., “Providing Wrong Control Actions”): Targeting flaws such as “operators falsifying hazardous material storage data” (X18) and “firefighting teams adopting incorrect fire-extinguishing methods” (X12) from the Tianjin Port case, remediation should focus on ensuring information authenticity and standardizing operations. Illustrative measures include: mandating high-risk enterprises to connect to the emergency command information platform, potentially utilizing technologies such as blockchain for real-time, tamper-evident logging of hazardous material data to eliminate information concealment at the source; establishing a real-time synchronization mechanism between the “hazardous material database and rescue team terminals” to ensure field personnel can instantly query material properties on-site; and enhancing training for responders on handling procedures for different hazardous materials through simulation platforms.
UCAs at the Management/Control Level (e.g., “Failure to Provide Control Actions”): For flaws such as “the emergency command platform lacking access to real-time enterprise data” (X8) or “the absence of a dynamic inventory technical system for emergency supplies” (X10), remediation should prioritize institutional and systemic development. This involves refining regulations to mandate data interface standards and investing in the construction of an intelligent emergency command platform integrating monitoring, analysis, simulation, and decision-support.
- (2)
- Establishing a Decision-Support System Based on Dynamic Risk Curves
The system remaining performance evolution curve generated by CFPM provides a quantitative tool for shifting from “experience-driven” to “data-driven” decision-making.
Dynamic Prioritization of Maintenance: Node weights and their contribution to failure propagation (as analyzed in Table 4) inform resource allocation. Critical nodes with high weights and hub positions in the network (e.g., information transmission equipment (X20), core sensors (X19)) should be classified as high-priority maintenance objects, ideally equipped with hot-standby systems ensuring swift failover (e.g., in this case, a response time within 30 min was found to be effective). Nodes with lower weights can be designated as routine or lower-priority maintenance objects.
Phased Decision Threshold Setting: Multi-level response thresholds can be defined based on . For this case, illustrative thresholds are set as a warning threshold of and a safety threshold of . These values are derived from the node weight distribution and functional integrity principle described above, and serve as case-specific illustrations rather than universally applicable operational standards. When applied to other systems, these thresholds should be re-evaluated based on their specific network topologies and weight distributions.
For this case, illustrative thresholds are derived as a warning threshold of and a safety threshold of . These values are based on the node weight distribution and functional integrity principle described in Section 3.3.1, and serve as case-specific illustrations rather than universally applicable operational standards. When applied to other systems, these thresholds should be re-evaluated based on their specific network topologies and weight distributions.
Quantitative Evaluation and Optimization of Maintenance Strategies: Comparing risk curves between “fault not processed” and “online fault processing” scenarios (Figure 7) allows for the development of a “maintenance efficiency–risk reduction rate” evaluation model. Simulating system performance recovery under different maintenance coefficients () quantifies the expected effectiveness of investments such as reducing emergency repair response times or increasing spare parts inventory, thereby optimizing resource allocation and budgeting.
- (3)
- Providing a Scientific Basis for the Trade-off Between “Online Fault Processing” and “Shutdown for Repair”
Emergency responders often face the dilemma of whether to suspend operations for repair. This framework offers a scientific basis for this decision by quantifying risk evolution under both strategies.
Decision Rule: By comparing the trajectory in an “online fault processing” scenario against the safety threshold for a given maintenance efficiency (), a decision rule can be established. For example, if online maintenance can keep consistently above the safety threshold, it should be continued. If simulation shows online fault processing cannot prevent from breaching the threshold (e.g., under low-efficiency maintenance, ), a decision to suspend certain tasks for thorough repair should be made promptly.
Contingency Planning Preparation: Based on such analysis, emergency plans can pre-define recommended handling strategies for different fault types and resource availability levels, creating a decision-support library to improve the speed and soundness of on-scene commanders’ judgments.
In summary, the engineering value of the STAMP-CFPM framework lies in its quantitative linkage of “control flaws”, “dynamic risk”, and “system performance”. This advances traditional safety management, which often relies on qualitative experience, towards a new phase characterized by quantifiability, predictability, and optimizability.
4.3. Limitations and Future Research Directions
Despite its demonstrated advantages, the integrated framework has several limitations, which also point to valuable directions for future research.
First, the model parameters exhibit a degree of dependency on expert knowledge and specific case context. The core parameters in CFPM, such as the fault propagation conditional probability and the maintenance coefficient , were primarily set based on qualitative descriptions from the accident investigation report, limited historical data, and expert judgment in this case study. Although a multi-source data fusion approach and sensitivity analysis were employed to enhance their rationality, the subjectivity of parameters may still affect the absolute precision of quantitative results. Future research could enhance parameter objectivity through: statistical analysis of data from multiple similar accidents to obtain prior probability distributions, and calibrating and validating model parameters using training data generated from high-fidelity emergency simulation systems (e.g., digital twins).
Second, the current model assumes a static node-interconnection network for the emergency system. In real emergencies, collaborative relationships between organizations and information flow paths may dynamically adjust as the situation escalates (e.g., establishing an on-site joint command post alters the original command chain). The CFPM network in this study is a static topology constructed from post-accident retrospective analysis, unable to reflect such adaptive behaviors. Future model extensions could explore dynamic time-varying networks, modeling organizational adaptive strategies (e.g., activating backup command chains, introducing external experts) as network structure reconfigurations, thereby more realistically simulating the evolution of complex emergency responses.
Third, the breadth of case validation needs expansion. While the use of the Tianjin Port ‘8·12’ accident—a particularly major case—provides depth and typicality, the generalizability of the conclusions requires testing across different types (e.g., natural disasters, public health events), scales, and organizational cultures of emergency scenarios. Moreover, the regulatory and administrative context of the present case is specific to China’s governance system; the particular control-structure configurations and threshold values derived from this case may not be directly transferable to other jurisdictions without recalibration to their specific legal and institutional frameworks. Future work should focus on building a multi-case library and applying this framework for analysis. This would serve to validate the method’s broad applicability and, through comparative studies, distill common and specific factors influencing risk evolution patterns in different emergency systems.
Notwithstanding these limitations, the framework provides distinct practical value for multiple stakeholder groups. For government regulatory agencies, the STAMP-based identification of UCAs at the Management Level (e.g., X1–X5) offers a systematic diagnostic tool to pinpoint supervisory gaps and prioritize regulatory reforms, such as mandating real-time hazardous material data interfaces and establishing cross-departmental information-sharing platforms. For enterprise safety managers, the node weight and propagation contribution analyses (Section 3.3.1) enable evidence-based allocation of maintenance resources to critical infrastructure (e.g., information transmission equipment (X18) and monitoring sensors (X19)), thereby reducing operational risks. For on-site emergency commanders, the dynamic evolution curves provide a quantitative basis for real-time decision-making, supporting judgments on when to escalate response levels, whether to switch between “online fault processing” and “shutdown for repair” strategies, and how to prioritize the repair of failed components. Thus, the framework translates theoretical risk analysis into actionable, stakeholder-specific insights, facilitating a transition from experience-based to data-driven emergency management.
In conclusion, the STAMP-CFPM integrated framework provides a powerful theoretical tool and practical perspective for understanding and quantifying the dynamic risk of complex emergency systems. By acknowledging its current limitations and pursuing the research directions outlined above, dynamic risk assessment can be advanced from theoretical methodology towards more robust and intelligent engineering applications.
5. Conclusions
To address the core challenges in dynamic risk assessment of complex emergency systems—specifically, difficulties in modeling closed-loop structures, insufficient quantification of dynamic evolution, and poor adaptability to multiple scenarios—this study proposes a dynamic risk assessment method that integrates the STAMP with the CFPM. The effectiveness of this method was validated through an in-depth case study of the Tianjin Port ‘8·12’ explosion accident. The main conclusions are as follows:
An integrated “qualitative–quantitative” analytical framework adapted to the closed-loop characteristics of emergency systems was established. This framework employs STAMP to construct a four-level control structure (Management, Control, Execution, Feedback), precisely identify UCAs, and reveal the mechanisms through which nonlinear interactions among “human–organization–technology” factors lead to disasters from a systems-theoretic control perspective. Building upon this qualitative analysis, CFPM abstracts the system into a dynamic propagation network, enabling time-step quantitative simulation of node failure probability and system performance. This deep coupling of “mechanism diagnosis” and “dynamic prediction” compensates for the shortcomings of traditional methods like Bayesian Networks in modeling closed-loop feedback and fine-grained, time-step dynamic quantification.
Quantitative characterization and comparison of dynamic risk under multiple emergency scenarios were achieved. Focusing on two typical scenarios—“fault not processed” and “online fault processing”—the case study demonstrated that in the absence of maintenance intervention, the system remaining performance exhibits exponential decay, falling below the safety threshold (0.5) during a critical early phase () of the accident evolution. In contrast, effective online maintenance (), while unable to completely halt the initial performance decline, can facilitate a gradual recovery after , thereby significantly curbing risk escalation. This quantitative comparison clearly visualizes the divergent risk evolution paths associated with different handling strategies, providing a concrete basis for scientific decision-making.
Actionable insights for risk management with clear engineering guidance were derived. The proposed method not only identifies risks but also translates findings into practical engineering and managerial insights: analysis based on node weights and propagation contribution enables prioritization for the redundant design and hierarchical maintenance of critical infrastructure (e.g., information links, decision nodes). The evolution curve allows for the establishment of quantitative, dynamic emergency response thresholds (e.g., warning threshold of 0.55, safety threshold of 0.5), facilitating a shift from experience-based judgment to data-driven decision models. By comparing risk curves under different maintenance efficiencies, it provides quantitative support for the difficult trade-off between “online fault processing” and “shutdown for repair”.
Through theoretical formulation and case validation, this study demonstrates that the STAMP-CFPM integrated framework is an effective tool for dissecting and quantifying the dynamic risk of complex emergency systems. Future research can further advance this method towards broader and more robust engineering applications by focusing on multi-case validation, objective parameter calibration, and the modeling of dynamic adaptive networks.
Author Contributions
H.W.: Conceptualization, methodology, supervision, writing—review and editing. Y.M.: Investigation, methodology, formal analysis, visualization, writing—original draft. All authors have read and agreed to the published version of the manuscript.
Funding
This research received no external funding.
Data Availability Statement
The data analyzed in this study are derived from the publicly released official investigation report of the Tianjin Port “8·12” explosion accident. All model parameters, iterative calculation results and node network data generated during the simulation are included within the article and its tables. Further inquiries about the calculation process can be directed to the corresponding author.
Conflicts of Interest
The authors declare no conflicts of interest.
References
- Liu, Y.; Ni, S.J.; Weng, W.G. Development of public safety system and safety-guaranteed society. Eng. Sci. 2017, 19, 118–123. [Google Scholar] [CrossRef] [Scilit]
- Buldyrev, S.V.; Parshani, R.; Paul, G.; Stanley, H.E.; Havlin, S. Catastrophic cascade of failures in interdependent networks. Nature 2010, 464, 1025–1028. [Google Scholar] [CrossRef] [Scilit] [PubMed]
- Li, L.L.; Zhu, H.Q.; Ding, X.W.; Wang, H.S.; Niu, D.S. Study on improvement methods of emergency rescue capability for hazardous chemicals accidents: Lessons from the Tianjin port “8·12” accident. J. Saf. Sci. Technol. 2020, 16, 45–51. [Google Scholar]
- Ge, J.; Zhang, Y.; Xu, K.; Li, J.; Yao, X.; Wu, C.; Li, S.; Yan, F.; Zhang, J.; Xu, Q. A new accident causation theory based on systems thinking and its systemic accident analysis method of work systems. Process Saf. Environ. Prot. 2022, 158, 644–660. [Google Scholar] [CrossRef] [Scilit]
- Ma, X.L.; Chang, W.W. Analysis of tianjin port “8·12” fire and explosion accident based on accident causation chain. Safety 2022, 43, 56–61. [Google Scholar] [CrossRef]
- Fan, H.W.; Jia, H.Y.; He, X.Z.; Lyu, J. Navigating uncertainty: A dynamic Bayesian network-based risk assessment framework for maritime trade routes. Reliab. Eng. Syst. Saf. 2024, 250, 110311. [Google Scholar] [CrossRef] [Scilit]
- Ceylan, O.B.; Sezer, I.S.; Akyuz, E. An integrated system-theoretic accident model and process (STAMP)-bayesian network (BN) for safety analysis of water mist system on tanker ships. Appl. Ocean Res. 2025, 154, 104344. [Google Scholar] [CrossRef] [Scilit]
- Khakzad, N.; Khan, F.; Amyotte, P. Dynamic risk analysis using bow-tie approach. Reliab. Eng. Syst. Saf. 2012, 104, 36–44. [Google Scholar] [CrossRef] [Scilit]
- Leveson, N.G. A new accident model for engineering safer systems. Saf. Sci. 2004, 42, 237–270. [Google Scholar] [CrossRef] [Scilit]
- Herrera, I.A.; Woltjer, R. Comparing a multi-linear (STEP) and systemic (FRAM) method for accident analysis. Reliab. Eng. Syst. Saf. 2010, 95, 1269–1275. [Google Scholar] [CrossRef] [Scilit]
- Ebrahimi, H.; Zarei, E.; Ansari, M.; Nojoumi, A.; Yarahmadi, R. A system theory based accident analysis model: STAMP-fuzzy DEMATEL. Saf. Sci. 2024, 173, 106445. [Google Scholar] [CrossRef] [Scilit]
- Ceylan, B.O.; Karatuğ, Ç.; Akyuz, E.; Arslanoğlu, Y.; Boustras, G. A system theory (STAMP) based quantitative accident analysis model for complex engineering systems. Saf. Sci. 2023, 166, 106232. [Google Scholar] [CrossRef] [Scilit]
- Xu, A.; Yin, Z.M.; Tong, Q.; Fang, Y.P.; Yang, M.; Yang, Q.Q.; Meng, H.X. An integrated resilience assessment methodology for emergency response systems based on multi-stage STAMP and dynamic Bayesian networks. Reliab. Eng. Syst. Saf. 2023, 238, 109445. [Google Scholar] [CrossRef] [Scilit]
- Meng, X.; Chen, G.; Zhu, J.; Li, T. Application of integrated STAMP-BN in safety analysis of subsea blowout preventer. Ocean Eng. 2022, 258, 111740. [Google Scholar] [CrossRef] [Scilit]
- Yu, Z.Y. Application of system-theoretic accident model and process (STAMP) in safety management of oil depots. Oil Depots Gas. Stn. 2018, 27, 9–12. [Google Scholar]
- Zhang, D.Q. Analysis of hydrogen sulfide poisoning accident in petrochemical enterprises based on STAMP model. Saf. Health Environ. 2023, 23, 7–10. [Google Scholar]
- Zeng, M.R.; Qin, Y.Y.; Liu, X.H.; Zhao, W. Multi-organization accident analysis using STAMP-24Model. J. Saf. Environ. 2024, 24, 12646–12680. [Google Scholar] [CrossRef]
- Sun, H.; Wang, H.; Yang, M.; Reniers, G. Dynamic risk assessment of chemical process systems using the System-Theoretic accident model and process approach (STAMP) in combination with cascading failure propagation model (CFPM). Saf. Sci. 2024, 171, 106375. [Google Scholar] [CrossRef] [Scilit]
- Zhang, J.R.; Huang, J.; Gao, J.L. Cascading failure model of multi-level interdependent networks based on delay allocation under load target. J. Natl. Univ. Def. Technol. 2024, 46, 79–89. [Google Scholar]
- Zhang, J.; Wang, Y.J.; Zhang, J.Y.; Yang, L. Cascading failure model of inter-domain routing system based on optimal effective path. Netinfo Secur. 2021, 21, 90–99. [Google Scholar]
- Shi, P.F. Problems and Countermeasures of Public Crisis Management Caused by Tianjin Hazardous Chemicals Fire and Explosion Accident. Master’s Thesis, Soochow University, Suzhou, China, 2022. [Google Scholar] [CrossRef]
- GB/T 6721-1986; Statistical Standard of Economic Losses from Injury-Fatal Accidents of Enterprise Staff and Workers. State Bureau of Standards: Beijing, China, 1986.
- Hu, X.J.; Gu, W. Comparison of two explosion accidents: Tianjin port “8·12” and Jiangsu Xiangshui “3·21”. Occup. Health Emerg. Rescue 2021, 39, 590–593. [Google Scholar] [CrossRef]
- Du, P.F. Study on Accident Analysis Framework Based on Resilience Thinking. Ph.D. Thesis, Huazhong University of Science and Technology, Wuhan, China, 2017. [Google Scholar]
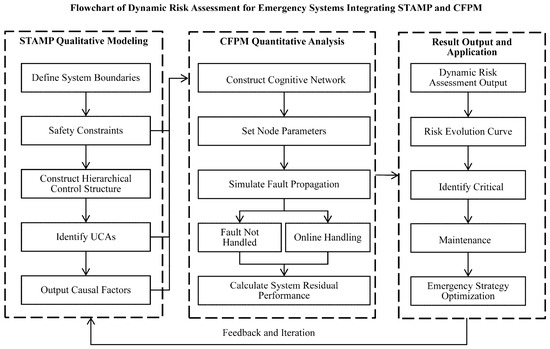
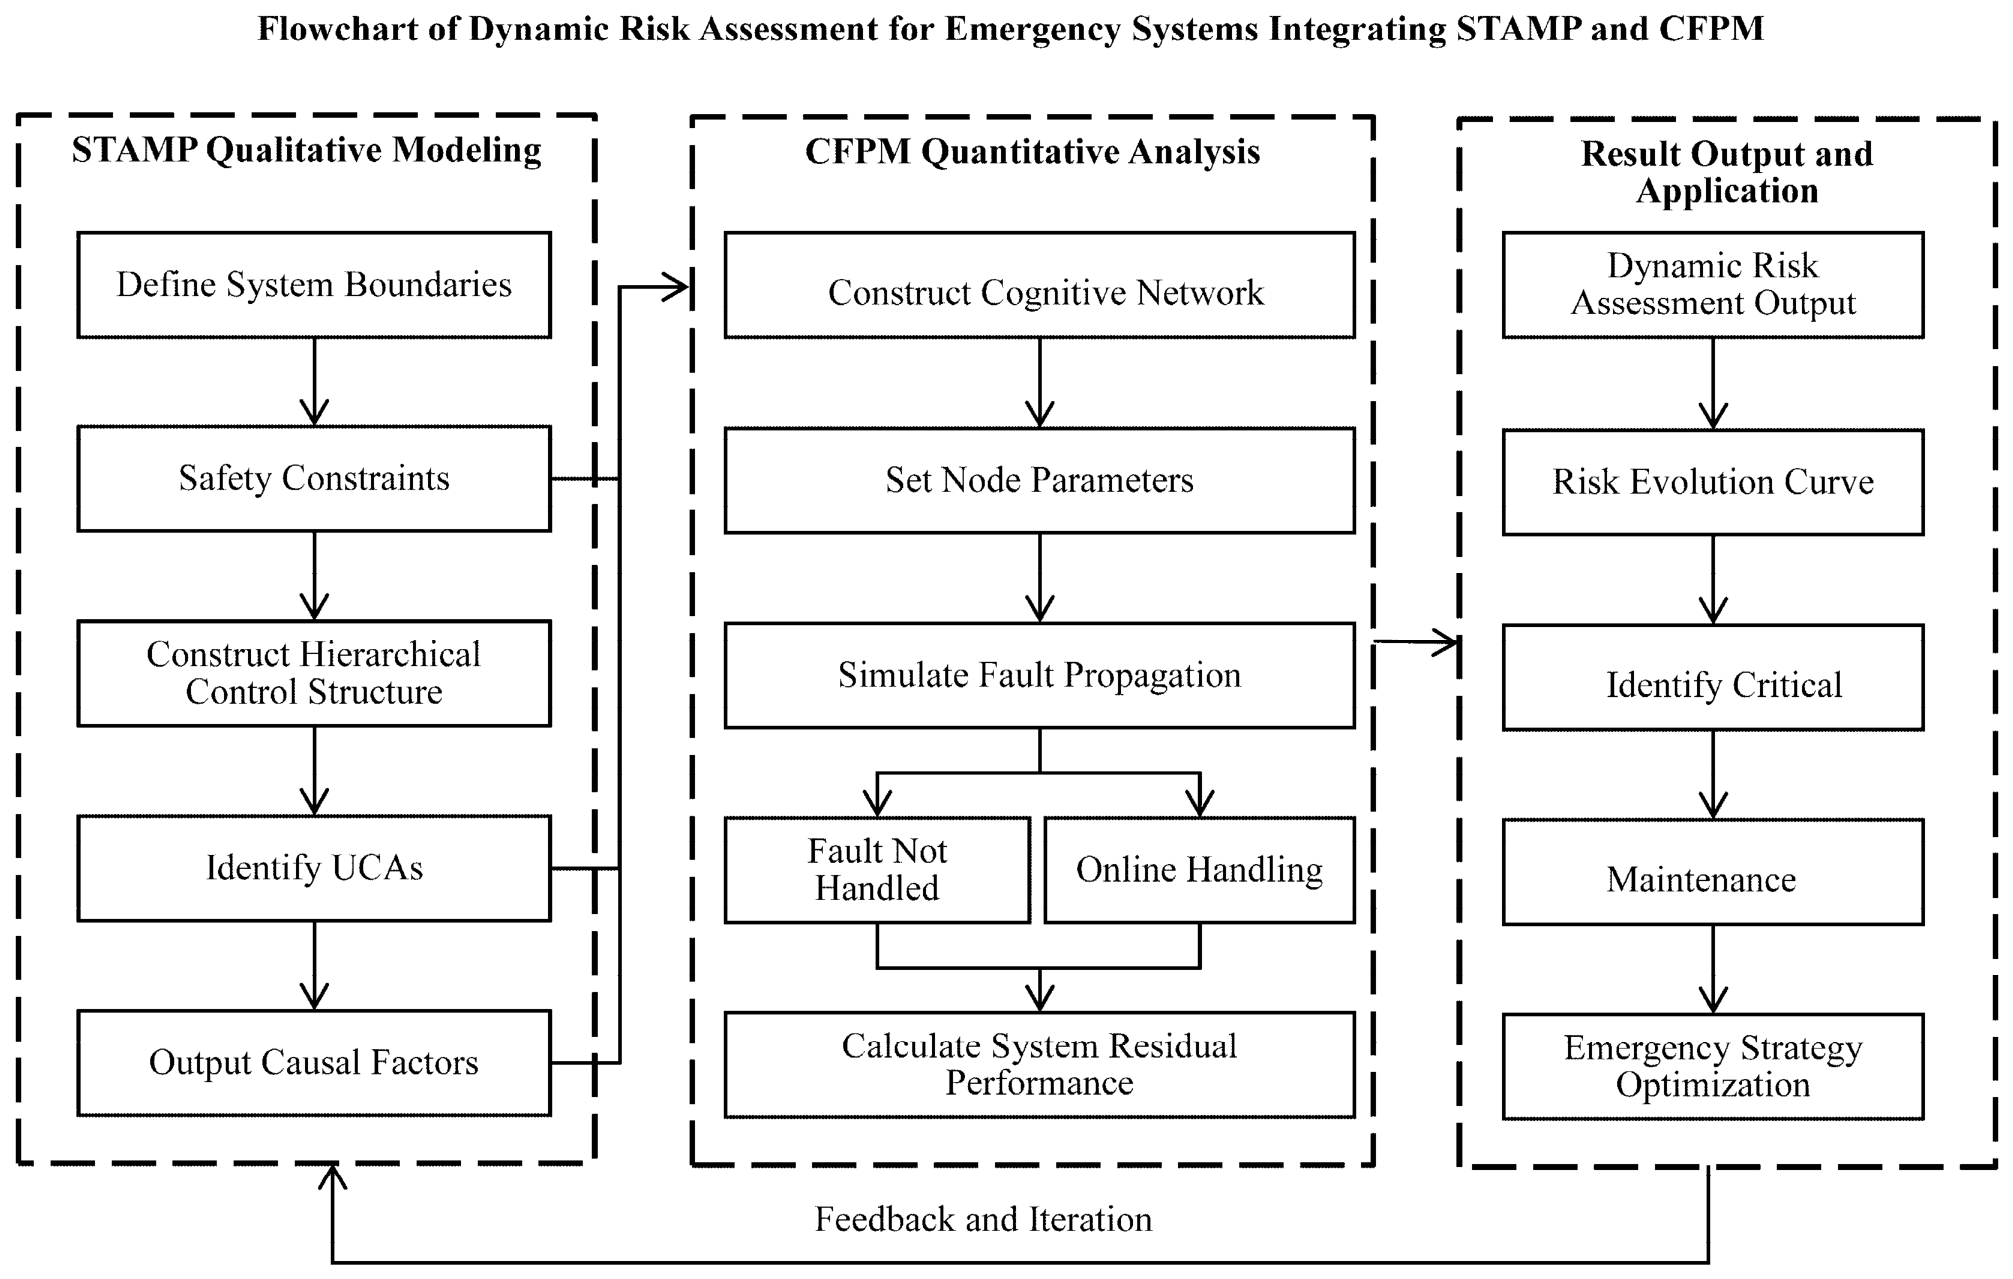
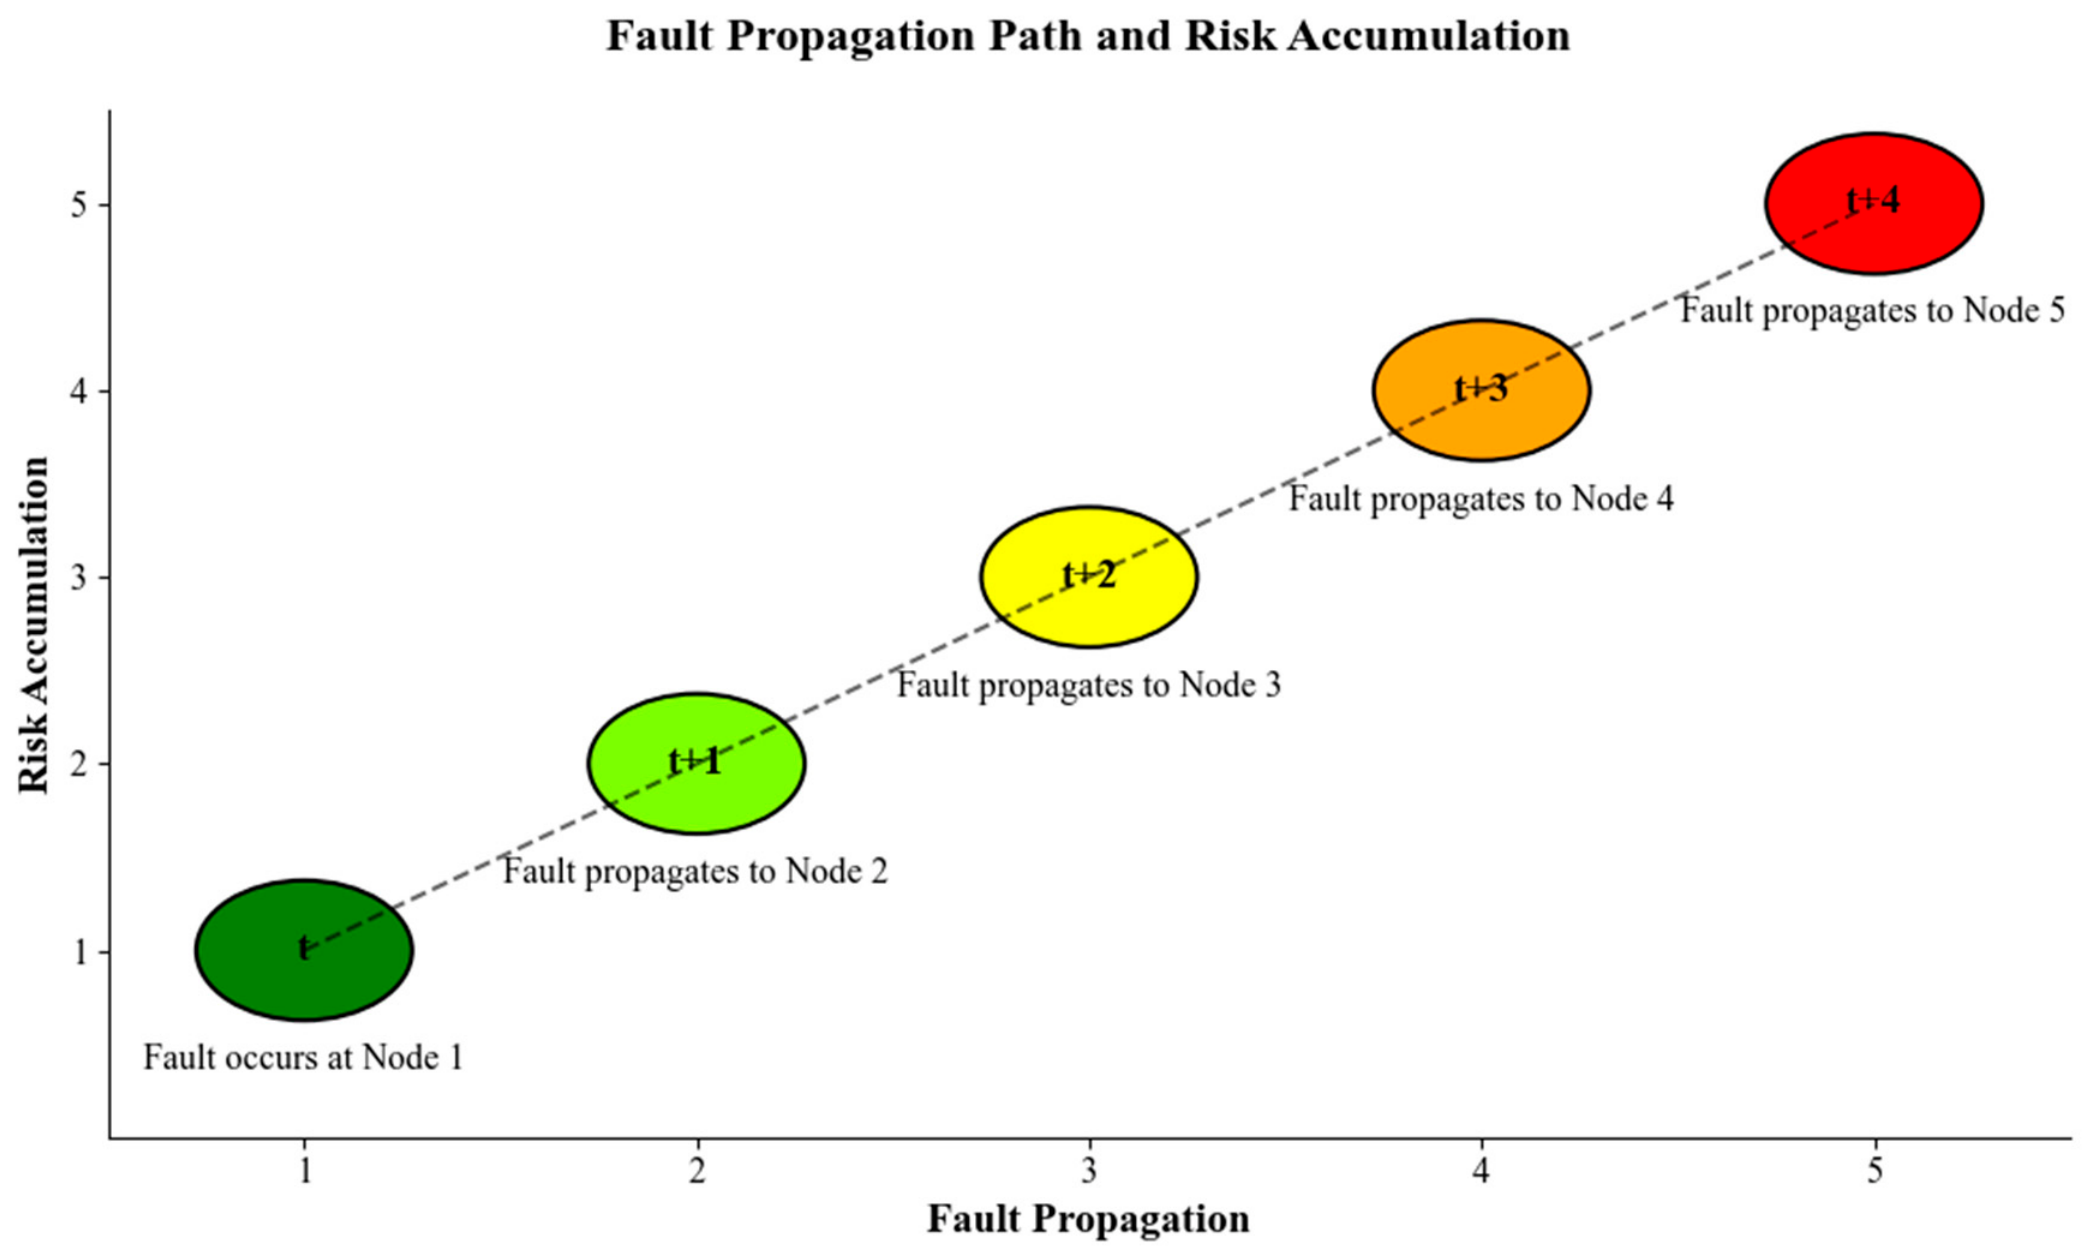
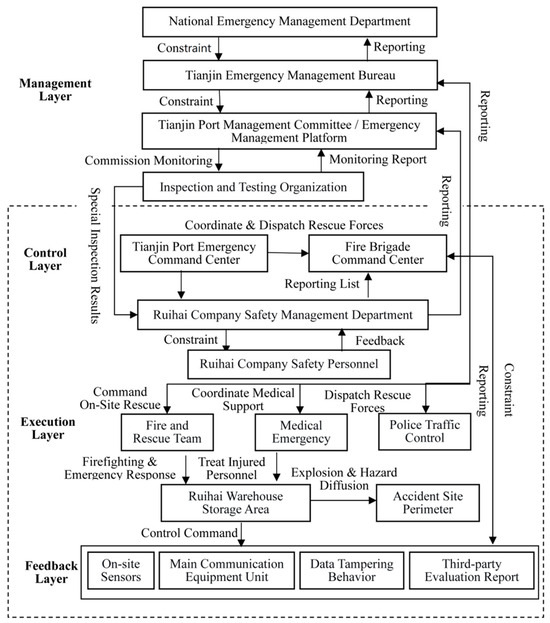
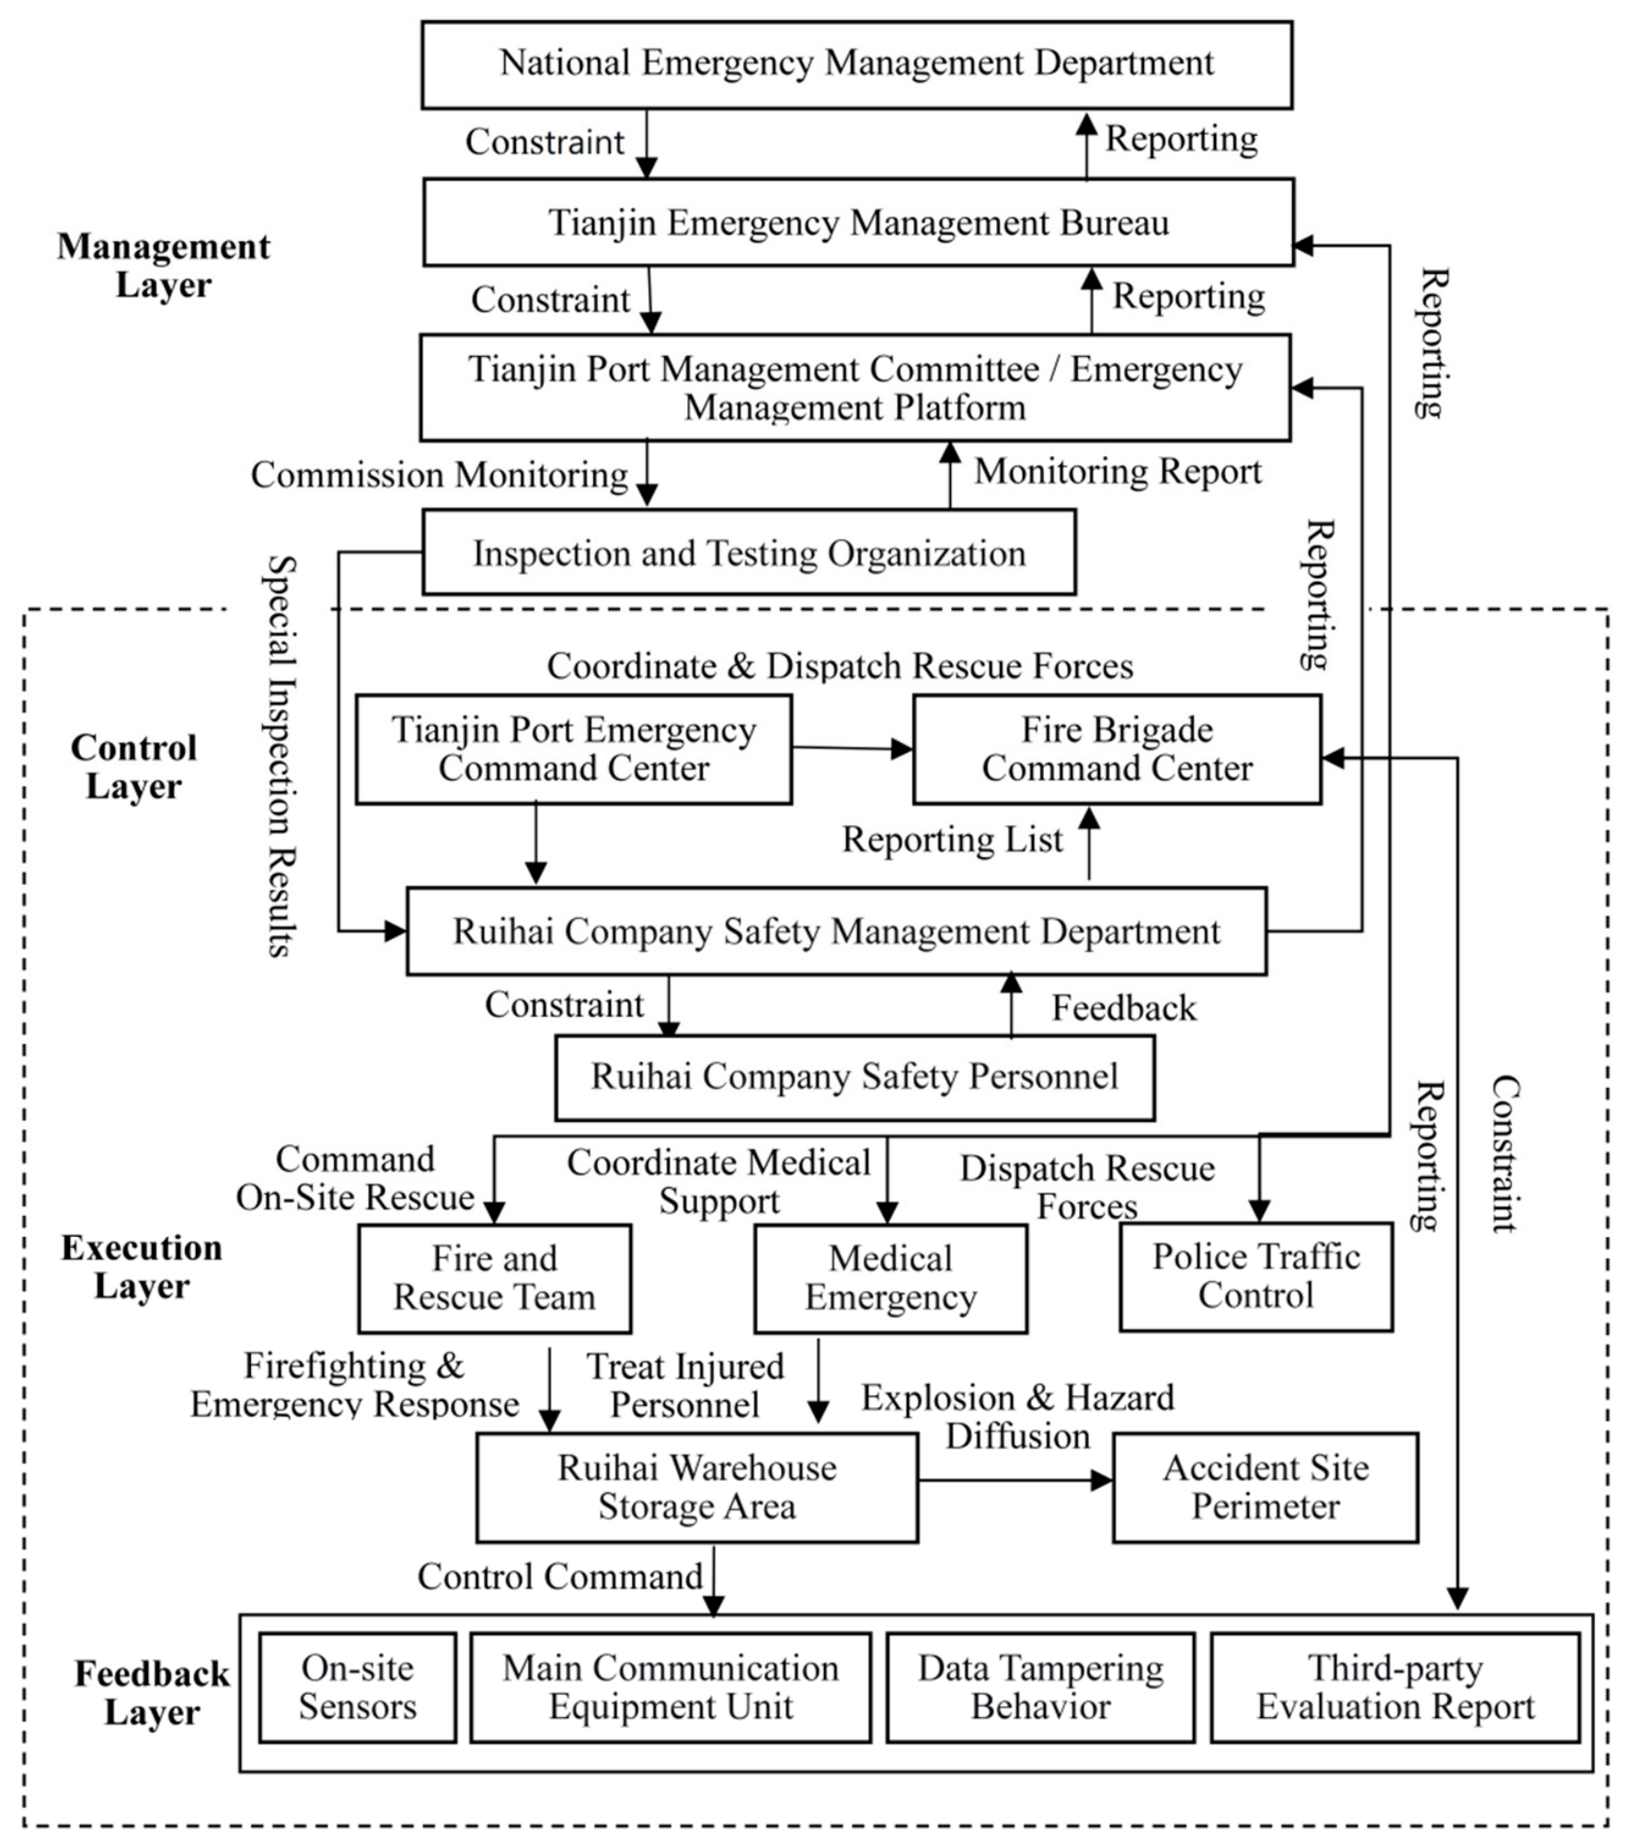
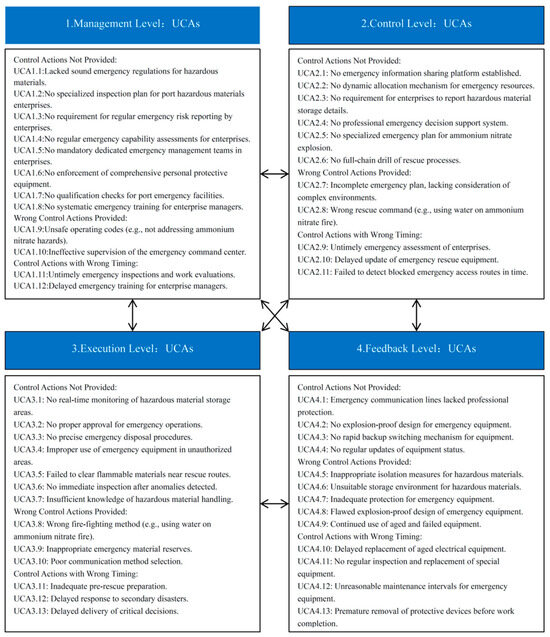
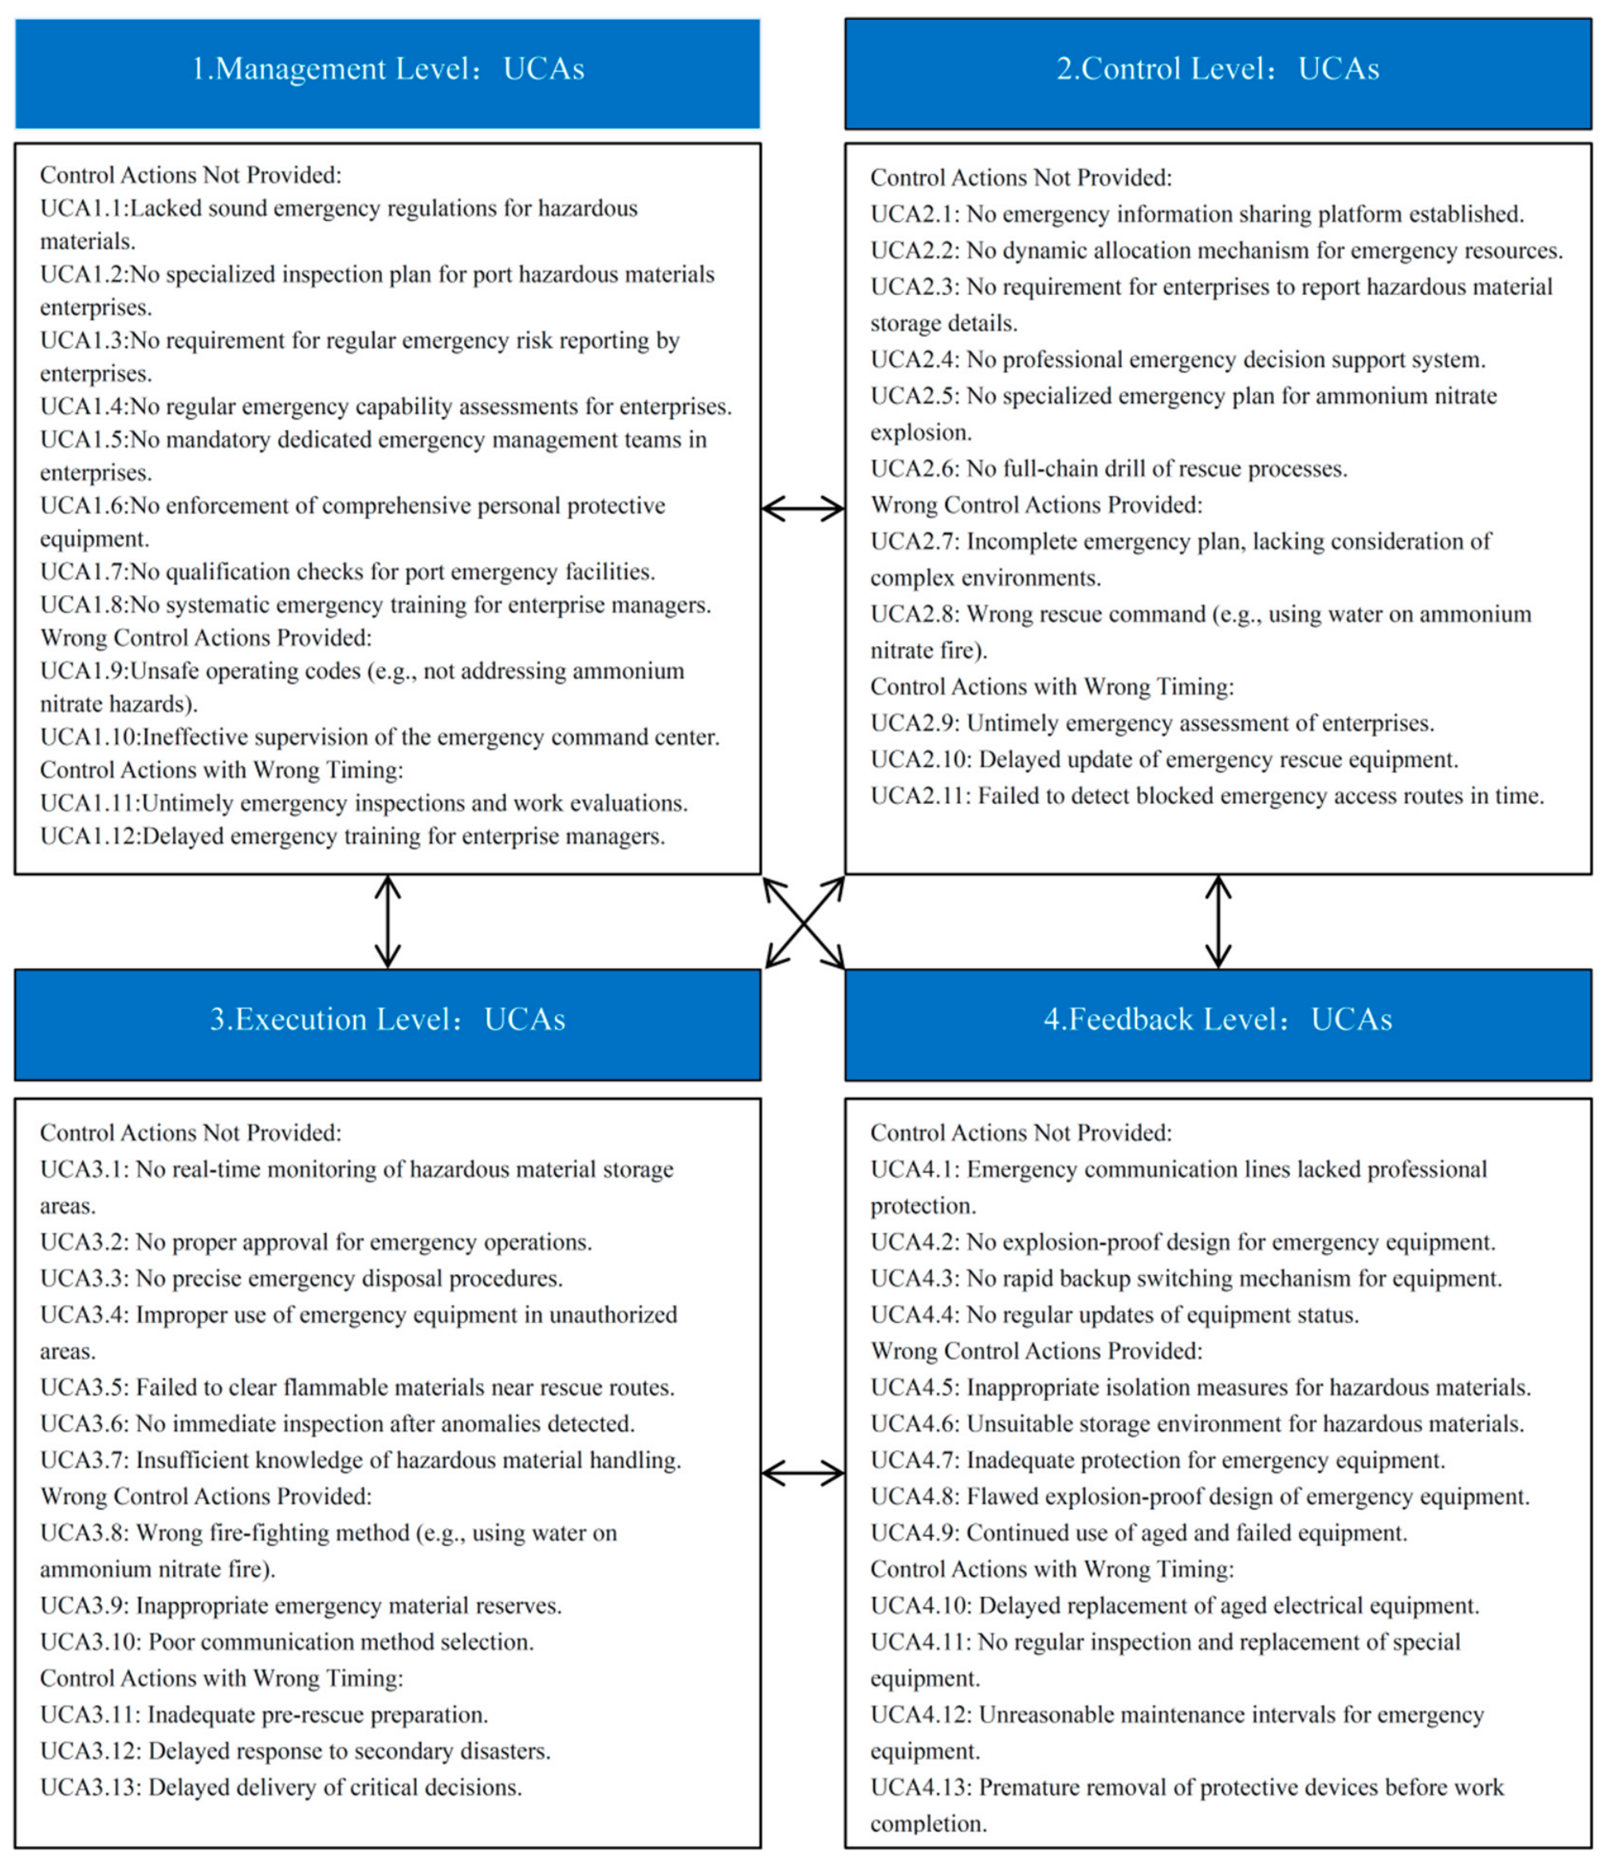
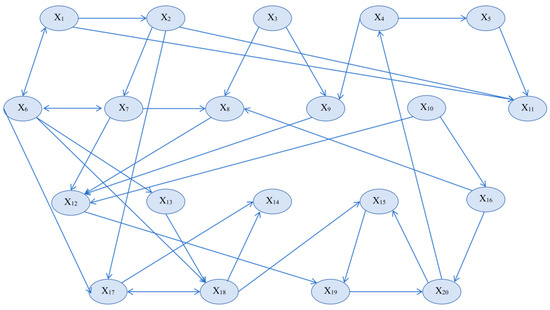
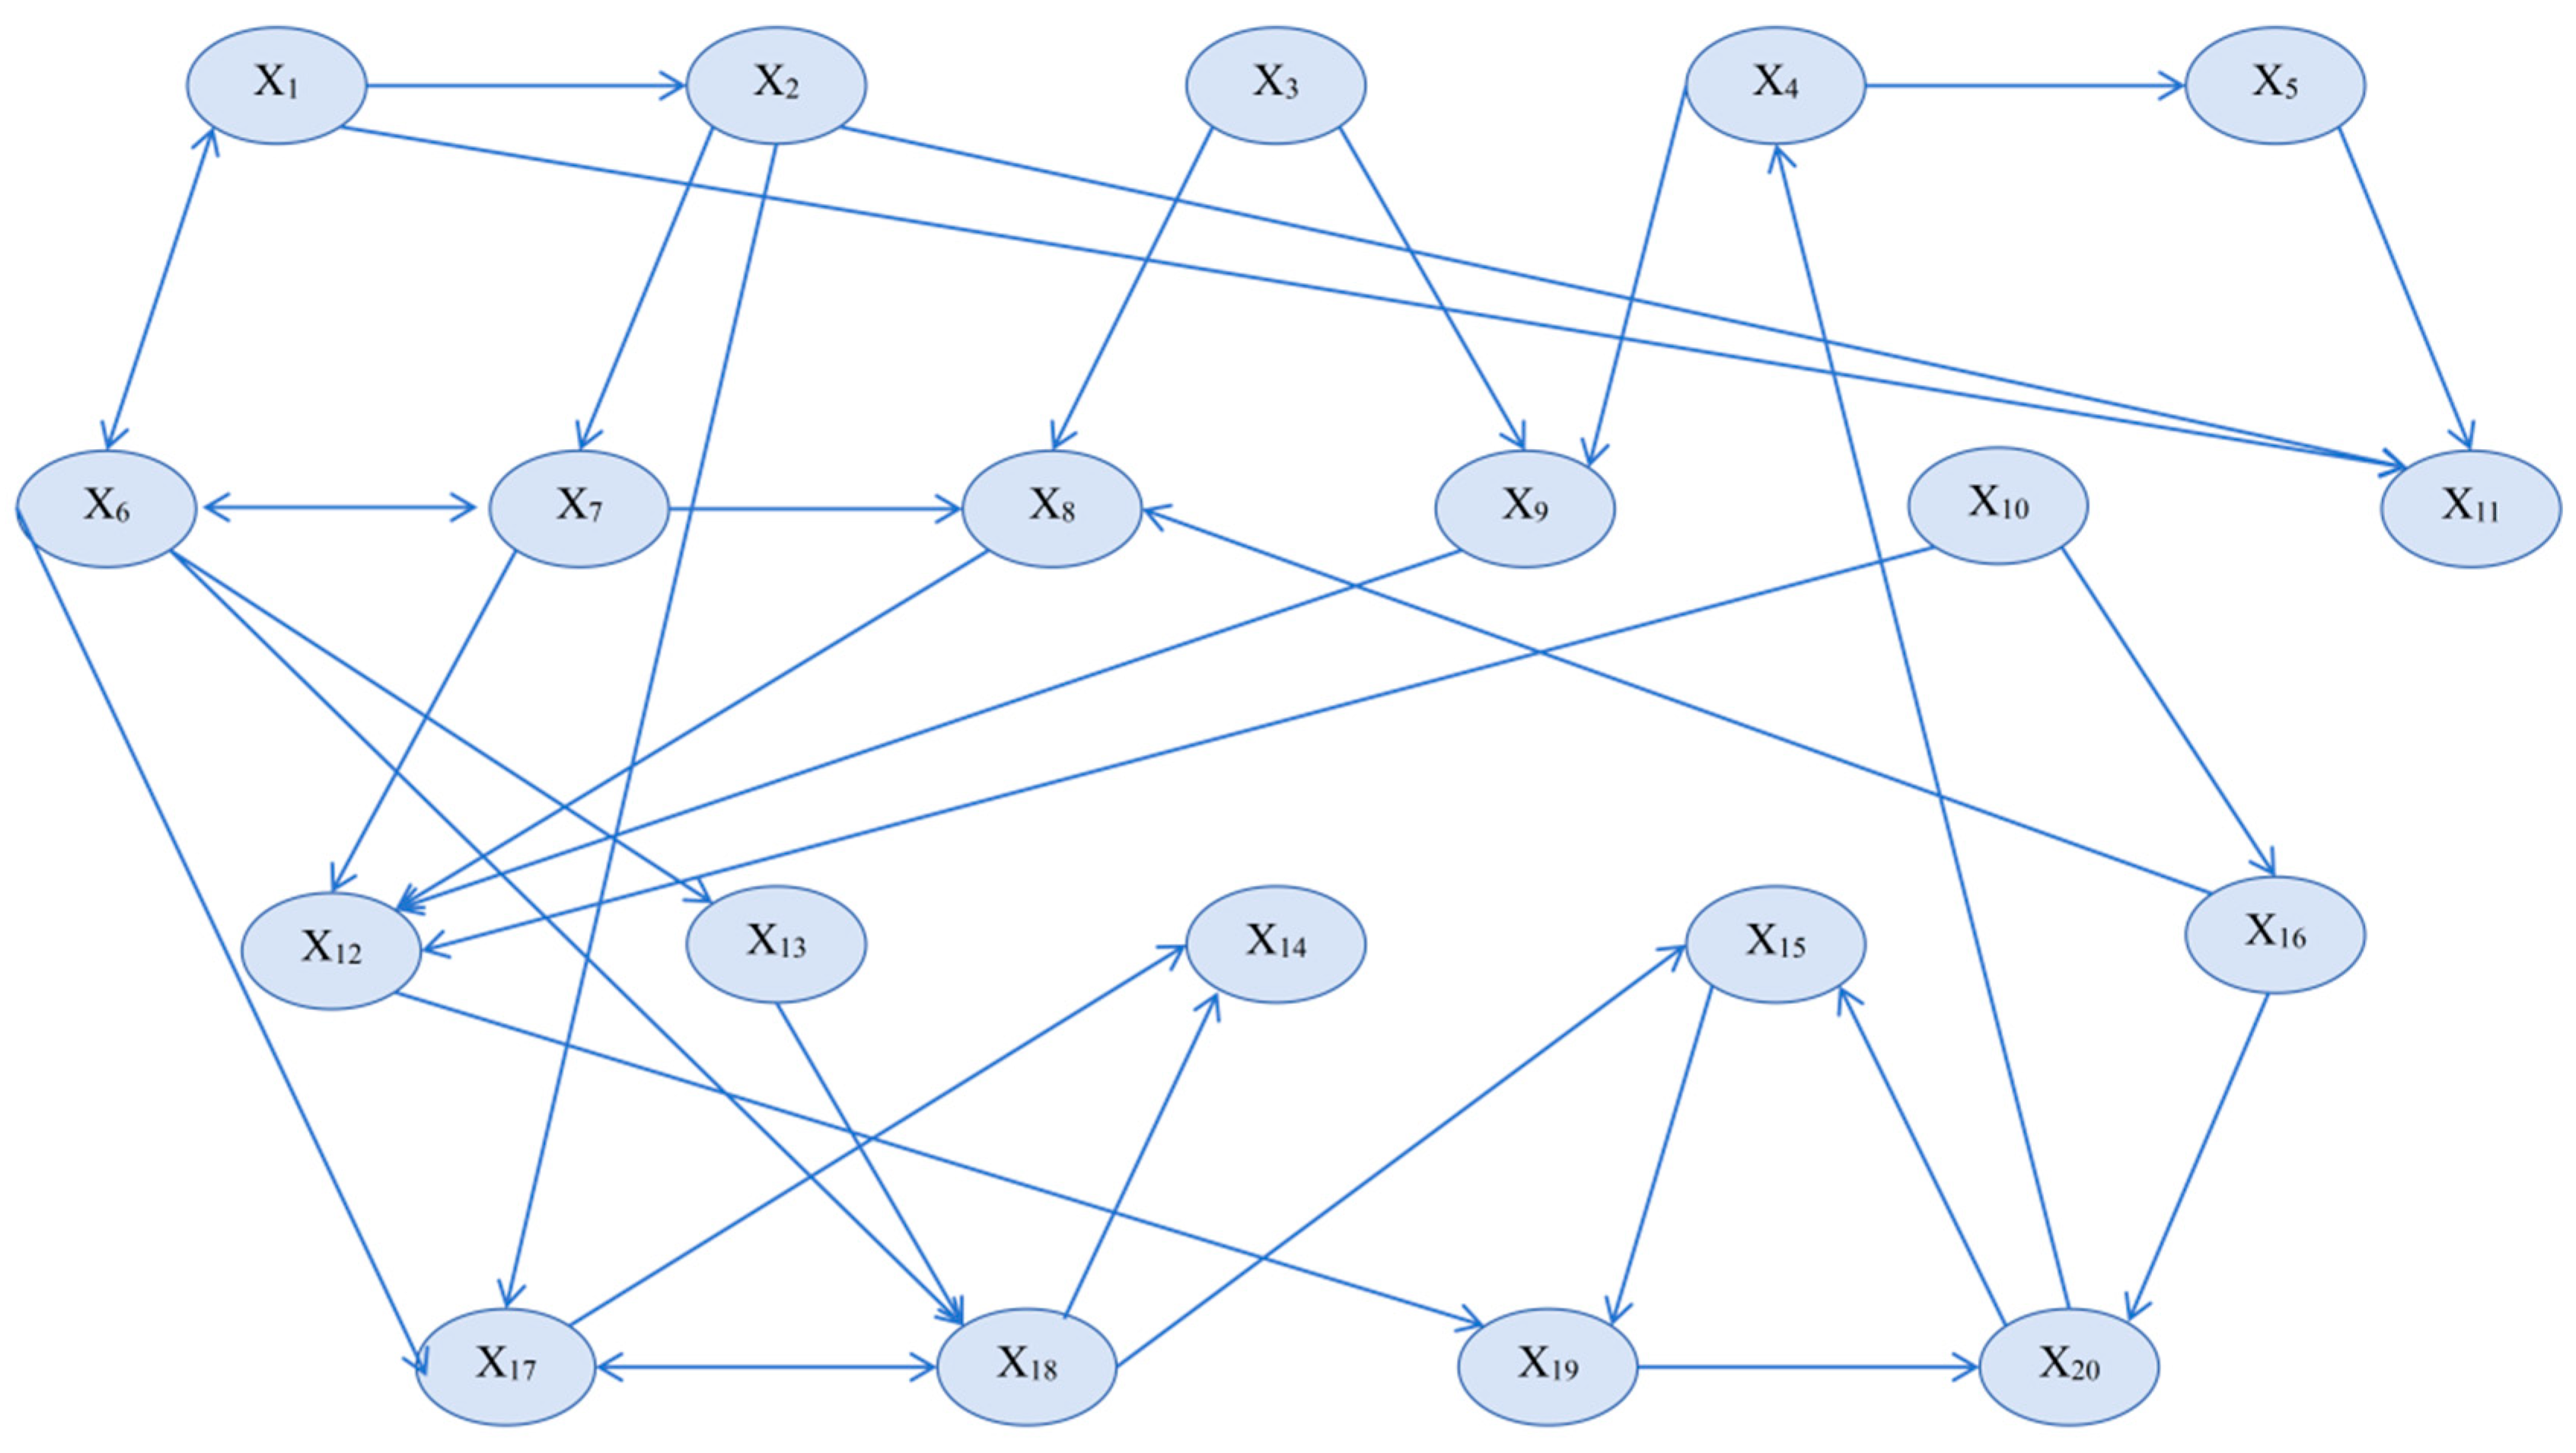
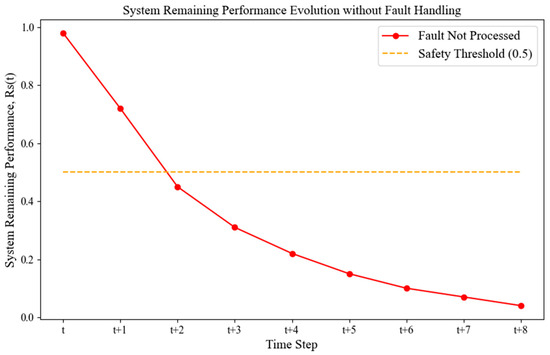
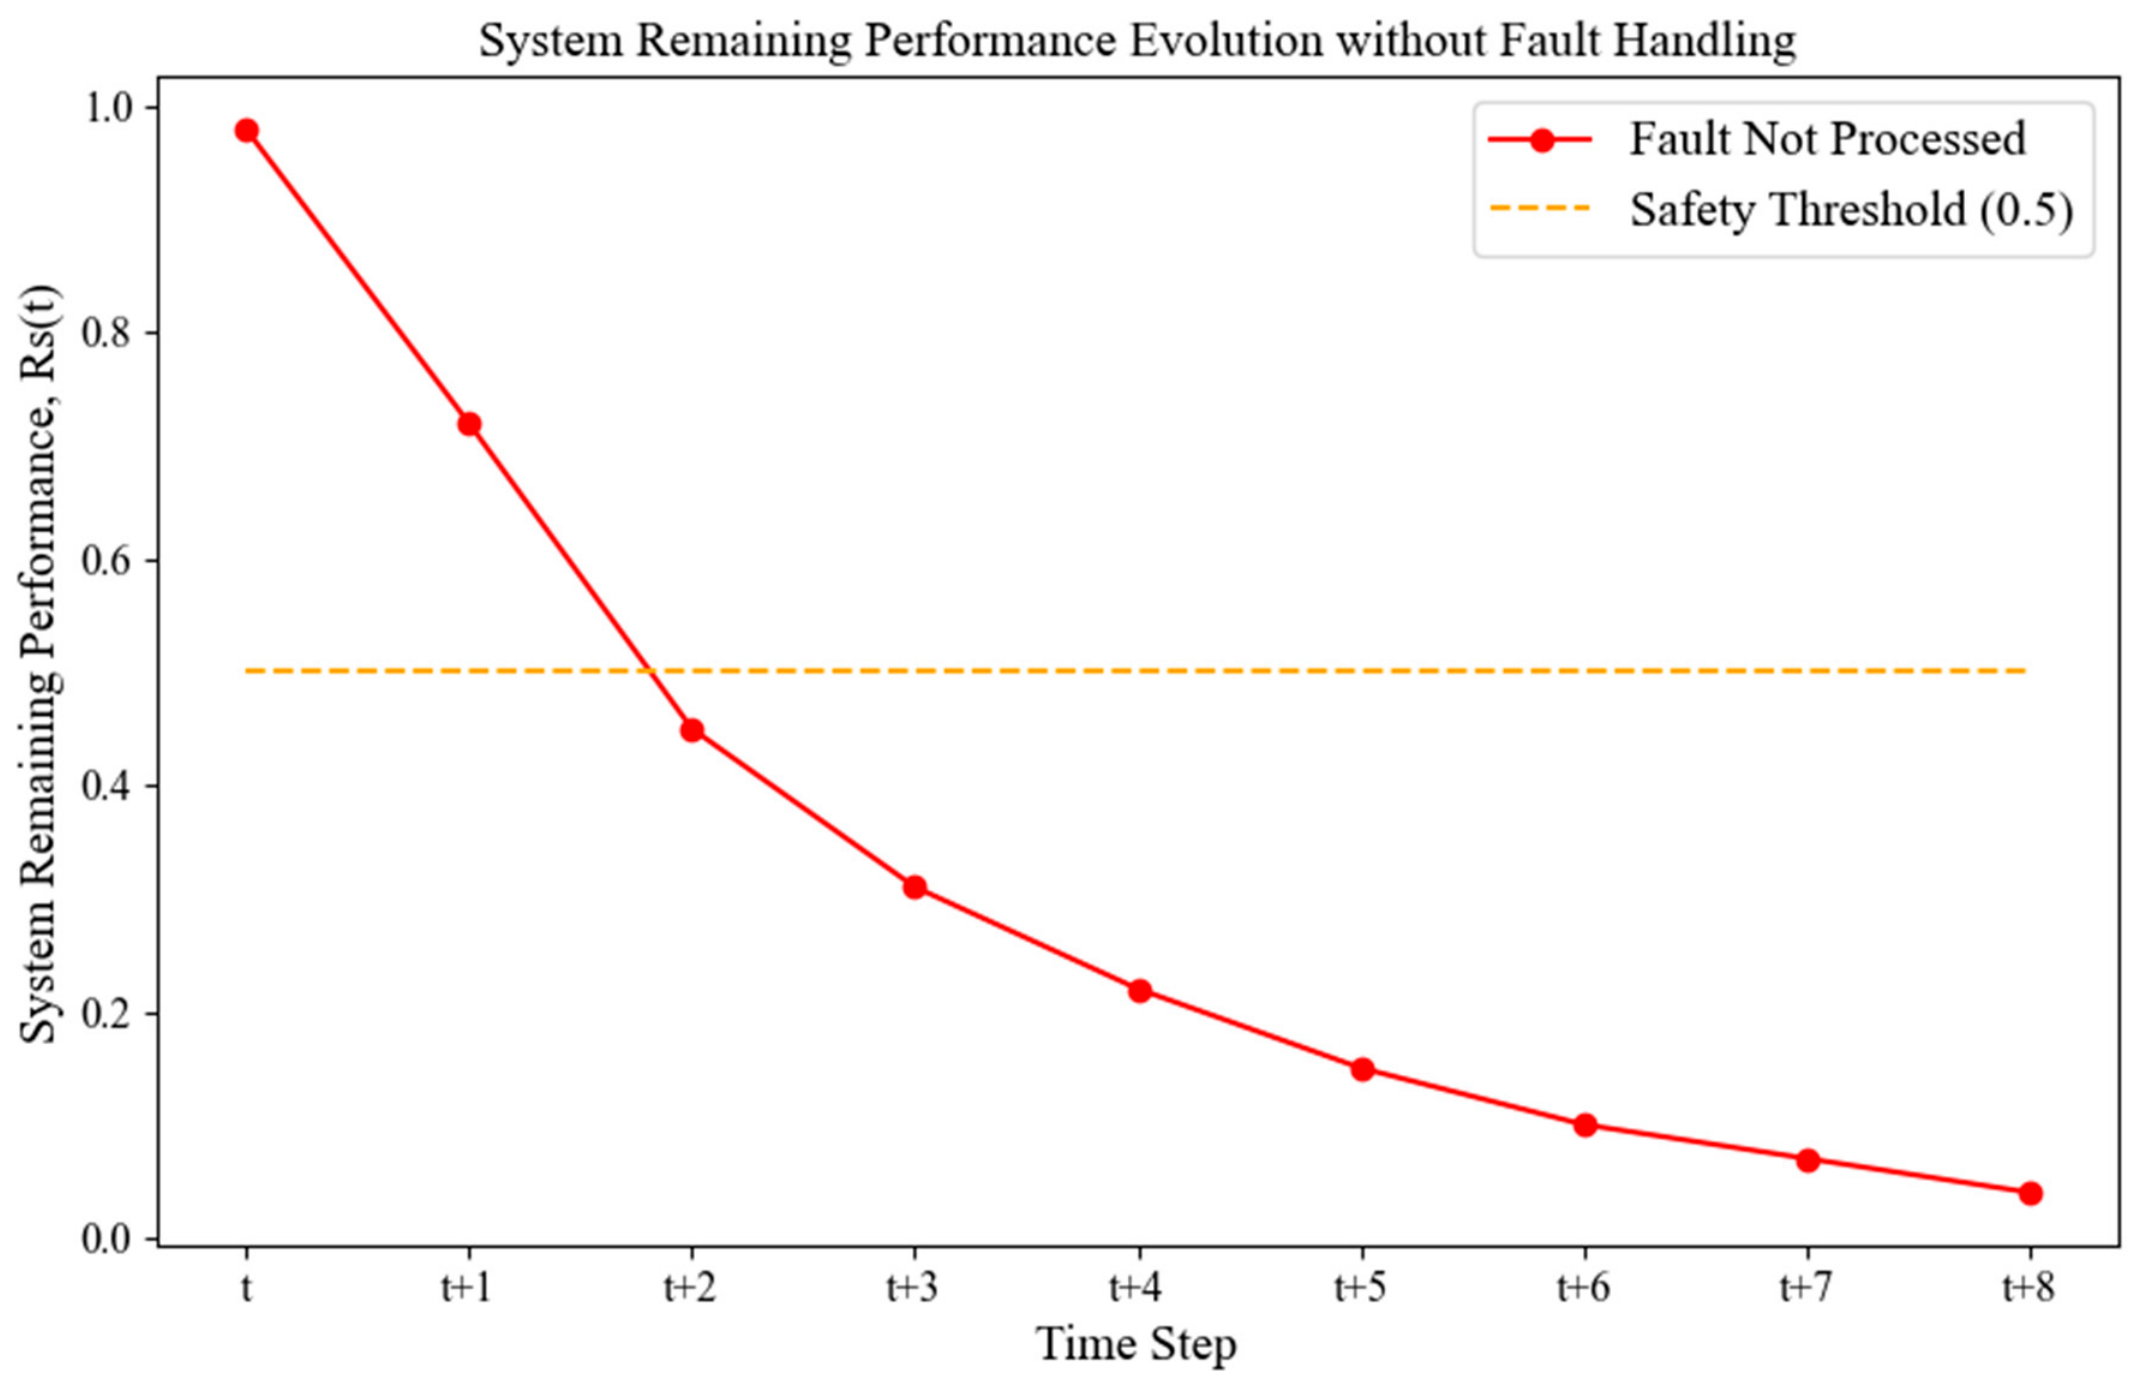
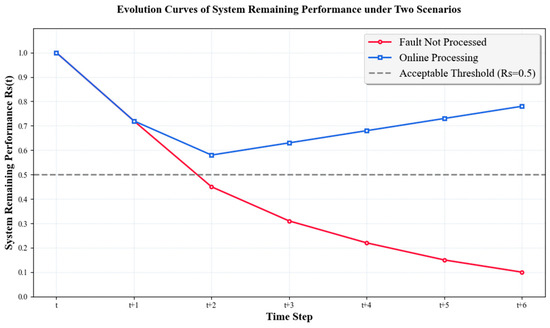
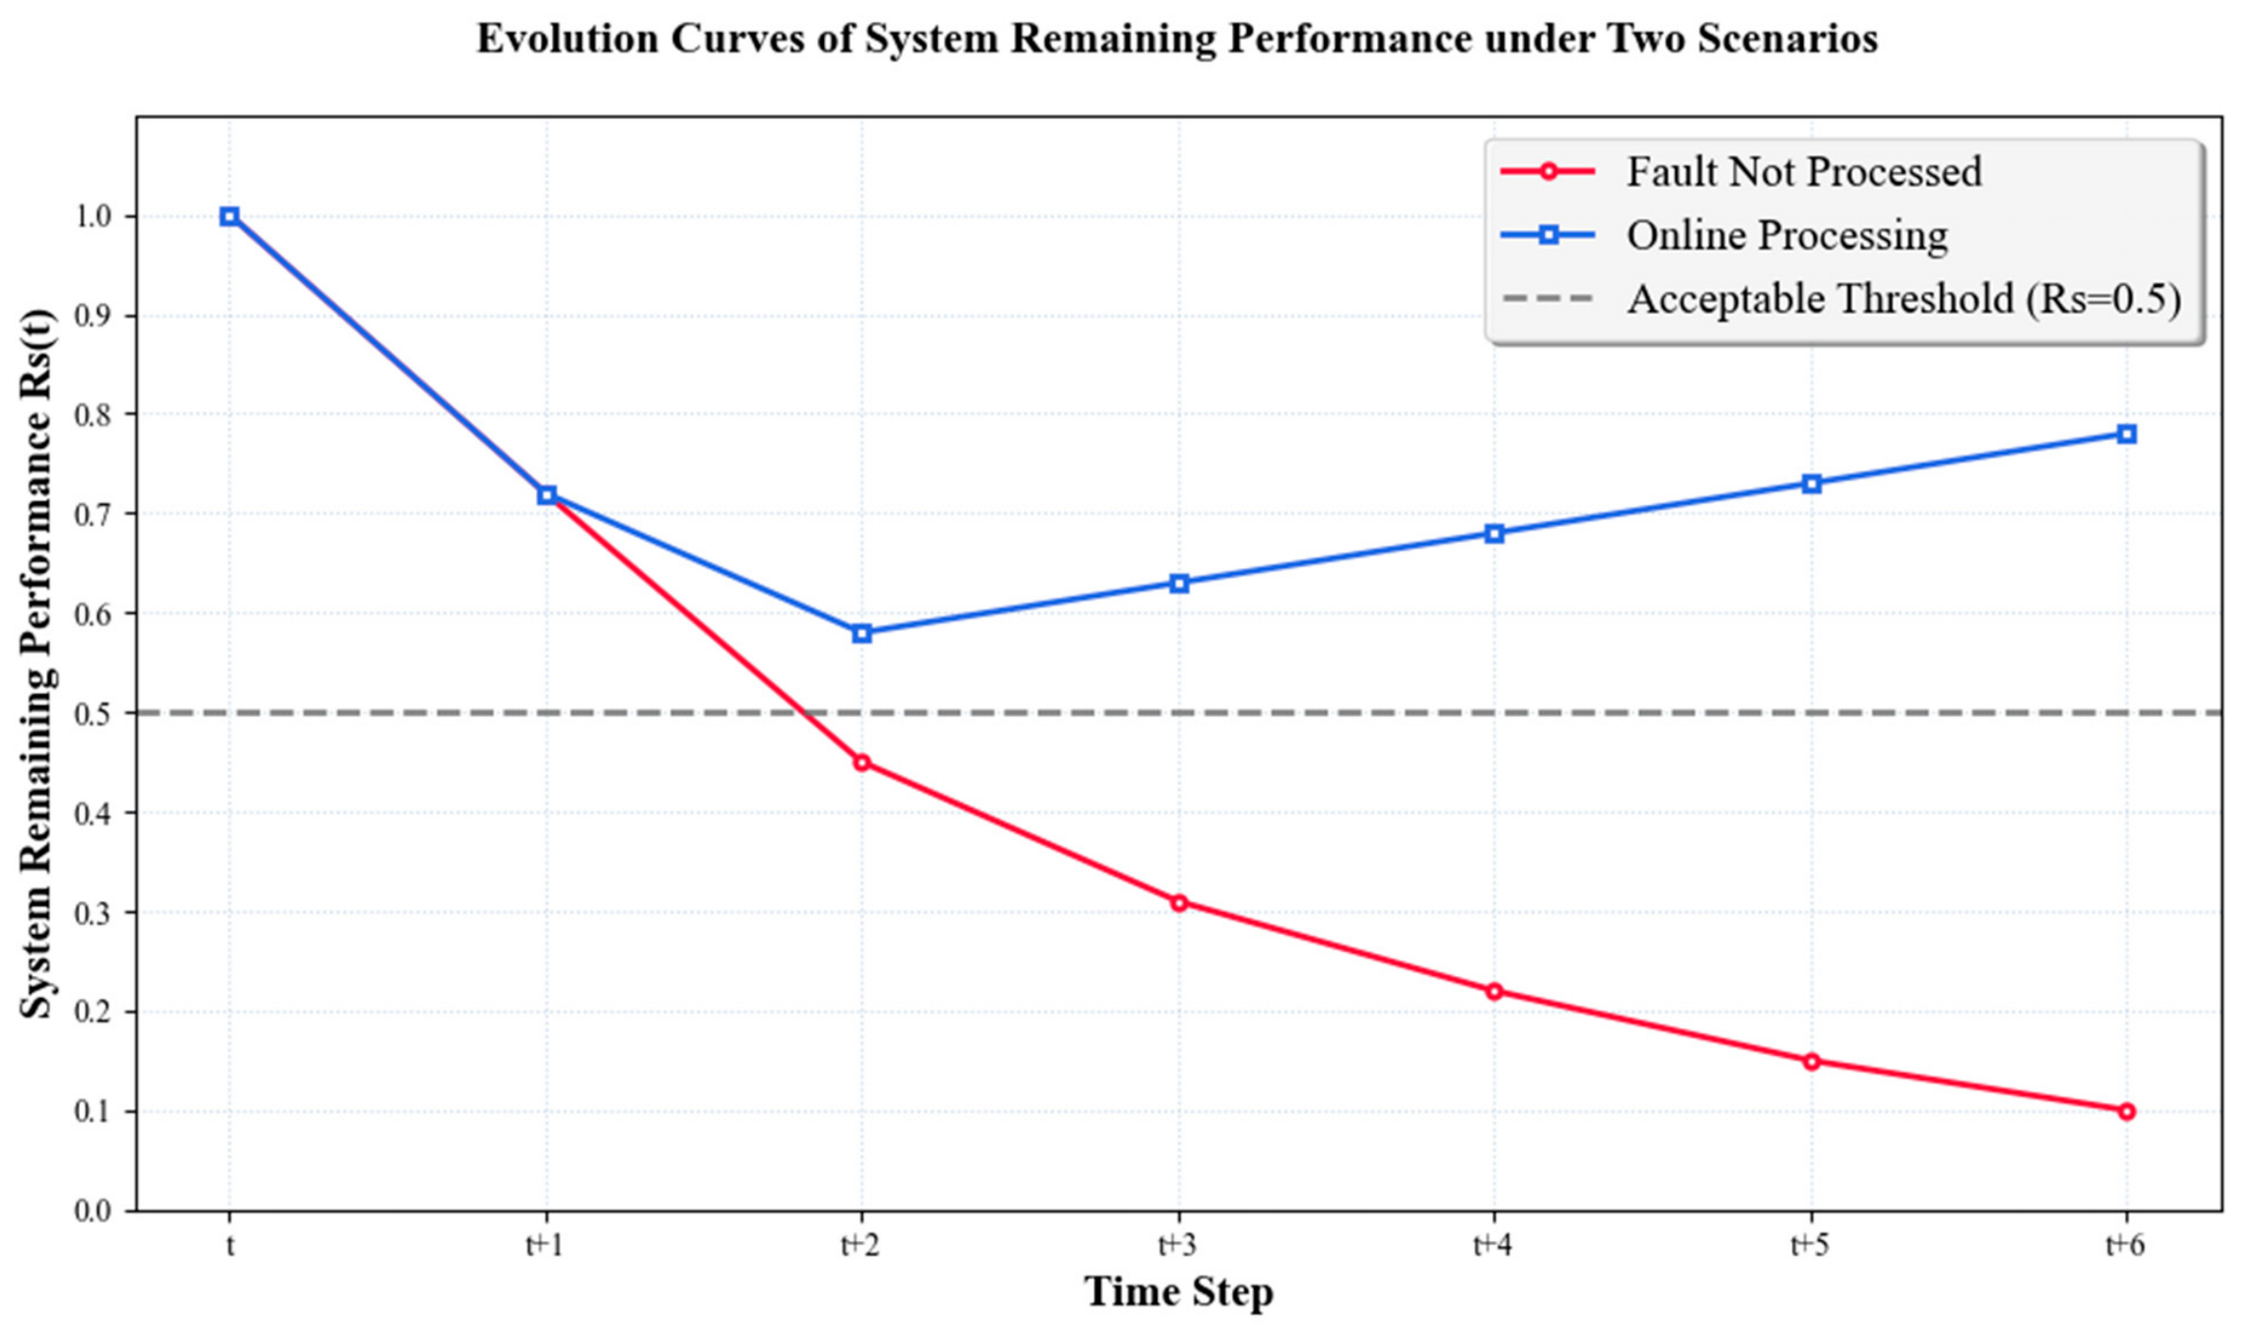

Disclaimer/Publisher’s Note: The statements, opinions and data contained in all publications are solely those of the individual author(s) and contributor(s) and not of MDPI and/or the editor(s). MDPI and/or the editor(s) disclaim responsibility for any injury to people or property resulting from any ideas, methods, instructions or products referred to in the content. |
© 2026 by the authors. Licensee MDPI, Basel, Switzerland. This article is an open access article distributed under the terms and conditions of the Creative Commons Attribution (CC BY) license.