


Abstract
Material discontinuities and defects can profoundly impact the structural integrity and overall product quality. In a multitude of industries, ranging from aerospace and automotive to the nuclear sector and manufacturing, even surface discontinuities can pose significant risks to component reliability. This paper presents a planar microwave sensor for non-destructive testing (NDT) to quantify the electromagnetic response to controlled crack-like discontinuities in polylactic acid (PLA) materials. The sensor comprises a host coplanar waveguide (CPW) positioned at the base of an RO3210 substrate and a multiple split-ring resonator (MSRR) on the surface, creating a compact device measuring 30 mm × 50 mm × 1.27 mm. When a discontinuity-free PLA sample-under-test (SUT) is placed above the sensor, the transmission coefficient exhibits a resonance at 1.780 GHz. As the width of the groove-based discontinuity increases, a systematic blue shift in the resonant frequency is observed. The relationship between resonant frequency shift and discontinuity width is established through empirical calibration for both surface and subsurface configurations. The results demonstrate the feasibility of the proposed sensor for calibrated detection and sensitivity-based discrimination of millimeter-scale crack-like discontinuities in PLA within the tested dimensional range.
1. Introduction
Polylactic acid (PLA) has emerged as an environmentally friendly and versatile thermoplastic, finding extensive applications in various industries, including 3D printing, packaging, and biomedical devices [1,2,3]. However, the susceptibility of PLA materials to crack formation due to mechanical stress and environmental factors poses a significant challenge. Timely detection of defects and discontinuities in PLA is therefore critical to ensure the structural integrity and reliability of PLA-based products.
Due to their non-invasive nature, non-destructive testing (NDT) techniques have become increasingly crucial in identifying damages or defects on the surface or interior of materials. Various popular NDT methods for crack detection include visual inspection [4], ultrasonic testing [5,6,7,8], radiographic testing [8,9], magnetic particle testing [10,11,12], induction thermographic testing [13], eddy current testing [14,15,16], acoustic shearography imaging [17], and infrared imaging [18]. However, each of these techniques comes with its own set of limitations. For instance, visual inspection and magnetic particle testing are limited to detecting surface-breaking cracks and may not be effective for subsurface cracks [19,20]. Ultrasonic and eddy current testing are constrained by crack size [21,22,23,24] and may not be suitable for measuring small defects. The eddy current testing method, for example, requires a crack size at least three times the surface roughness for detection, and its effectiveness depends on the surface properties and geometry of the part being tested [24]. Additionally, thermographic and acoustic testing lose sensitivity as conductivities decrease [19], and radiographic testing is restricted by material thickness, potentially being ineffective for thin materials [19]. Moreover, since radiographic testing employs X-rays or gamma rays, it may pose risks to human health.
Microwave sensors have emerged as effective tools in NDT, demonstrating their proficiency in detecting defects, discontinuities, and material anomalies in a variety of materials, including metals, ceramics, and polymers [25,26,27,28,29,30,31,32]. This is attributed partly to their high sensitivity, enabling them to detect surface defects and discontinuities in a variety of materials [31,32]. Microwave sensors are also easy to assemble, making them a cost-effective solution for defect and discontinuity detection, and they maintain stability over repeated use without sacrificing accuracy [31]. As far as the authors are aware, these sensors have not yet been applied to crack detection in PLA materials. In this study, we introduce a planar microwave sensor to investigate the response of a near-field resonant structure to controlled crack-like discontinuities in PLA materials. The sensor incorporates a multiple split-ring resonator (MSRR) on one side and a coplanar waveguide (CPW) transmission line on the other, with a layer of Rogers RO3210 substrate sandwiched in between. We conducted measurements using a nano vector network analyzer Zeenko nano-VNA (model SAA-2, serial number 22060725; manufactured by Zhejiang Zhike Technology Co., Ltd., Hangzhou, Zhejiang, China) to enhance the device’s portability. We will demonstrate that the proposed device exhibits a repeatable and monotonic electromagnetic response to the widths of both surface and subsurface discontinuities within the investigated range.
While the underlying sensing mechanism—near-field perturbation due to changes in effective permittivity—is broadly applicable to dielectric materials, its relevance to PLA is not trivial. PLA is a low-loss polymer with a relative permittivity typically in the range of 2.45 to 2.75 at microwave frequencies, making it weakly reflective and poorly contrasted under conventional inspection methods. Visual inspection is limited to surface-accessible features and is highly dependent on lighting, surface finish, and operator judgment, while ultrasonic testing in polymers is often constrained by strong attenuation, scattering at layer interfaces in additively manufactured parts, and reduced sensitivity to shallow or air-filled discontinuities. In contrast, near-field microwave resonators are inherently sensitive to localized changes in effective permittivity and air–polymer interfaces, making them particularly suited for detecting material removal or void-like discontinuities in low-loss polymers such as PLA. This motivates the use of a planar microwave resonant approach for systematic evaluation of crack-like discontinuities in PLA materials. Beyond simple measurement reporting, the objective of this study is to establish a physically interpretable sensing framework linking resonant frequency perturbation to controlled discontinuity dimensions in PLA materials.
Planar microwave sensors leverage well-established near-field resonator principles [25,26,27,28,29,30,31,32], which have been successfully applied to detect defects in metals, ceramics, and polymers. However, their application to the detection and dimensional characterization of crack-like discontinuities in PLA materials has not yet been systematically investigated. The present study extends these concepts to PLA, a low-loss polymer with weak dielectric contrast, where conventional NDT methods may fail to reliably detect subsurface discontinuities.
It should be emphasized that the present study does not attempt to replicate the complex micro-scale morphology of real fatigue or stress-induced cracks. Instead, controlled groove-based discontinuities are employed as surrogate cracks to enable systematic and repeatable evaluation of the sensor’s sensitivity to localized material removal in PLA. This approach provides a necessary first step toward more realistic crack investigations.
2. Design of the Microwave Discontinuity Sensor
In our pursuit of creating an effective microwave sensor for detecting crack-like discontinuities in PLA materials, we have incorporated a split-ring resonator (SRR) onto a coplanar waveguide (CPW) transmission line. A conventional SRR comprises a pair of concentric conducting rings with splits etched at opposite ends. This structure forms an LC resonant circuit due to the inductance (L) within the rings and the capacitance (C) associated with the splits and gaps between the rings. When resonating currents are induced in the rings, they generate an equivalent negative magnetic dipole moment. Consequently, the material exhibits an effective negative magnetic permeability within a narrow band above the resonant frequency [33]. Since signal propagation is impeded within this band, the SRR functions as a band-stop filter, creating a dip in the transmission coefficient.
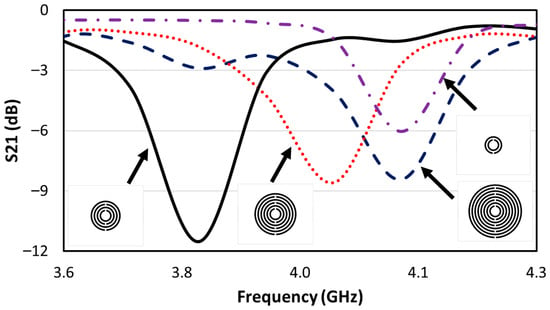
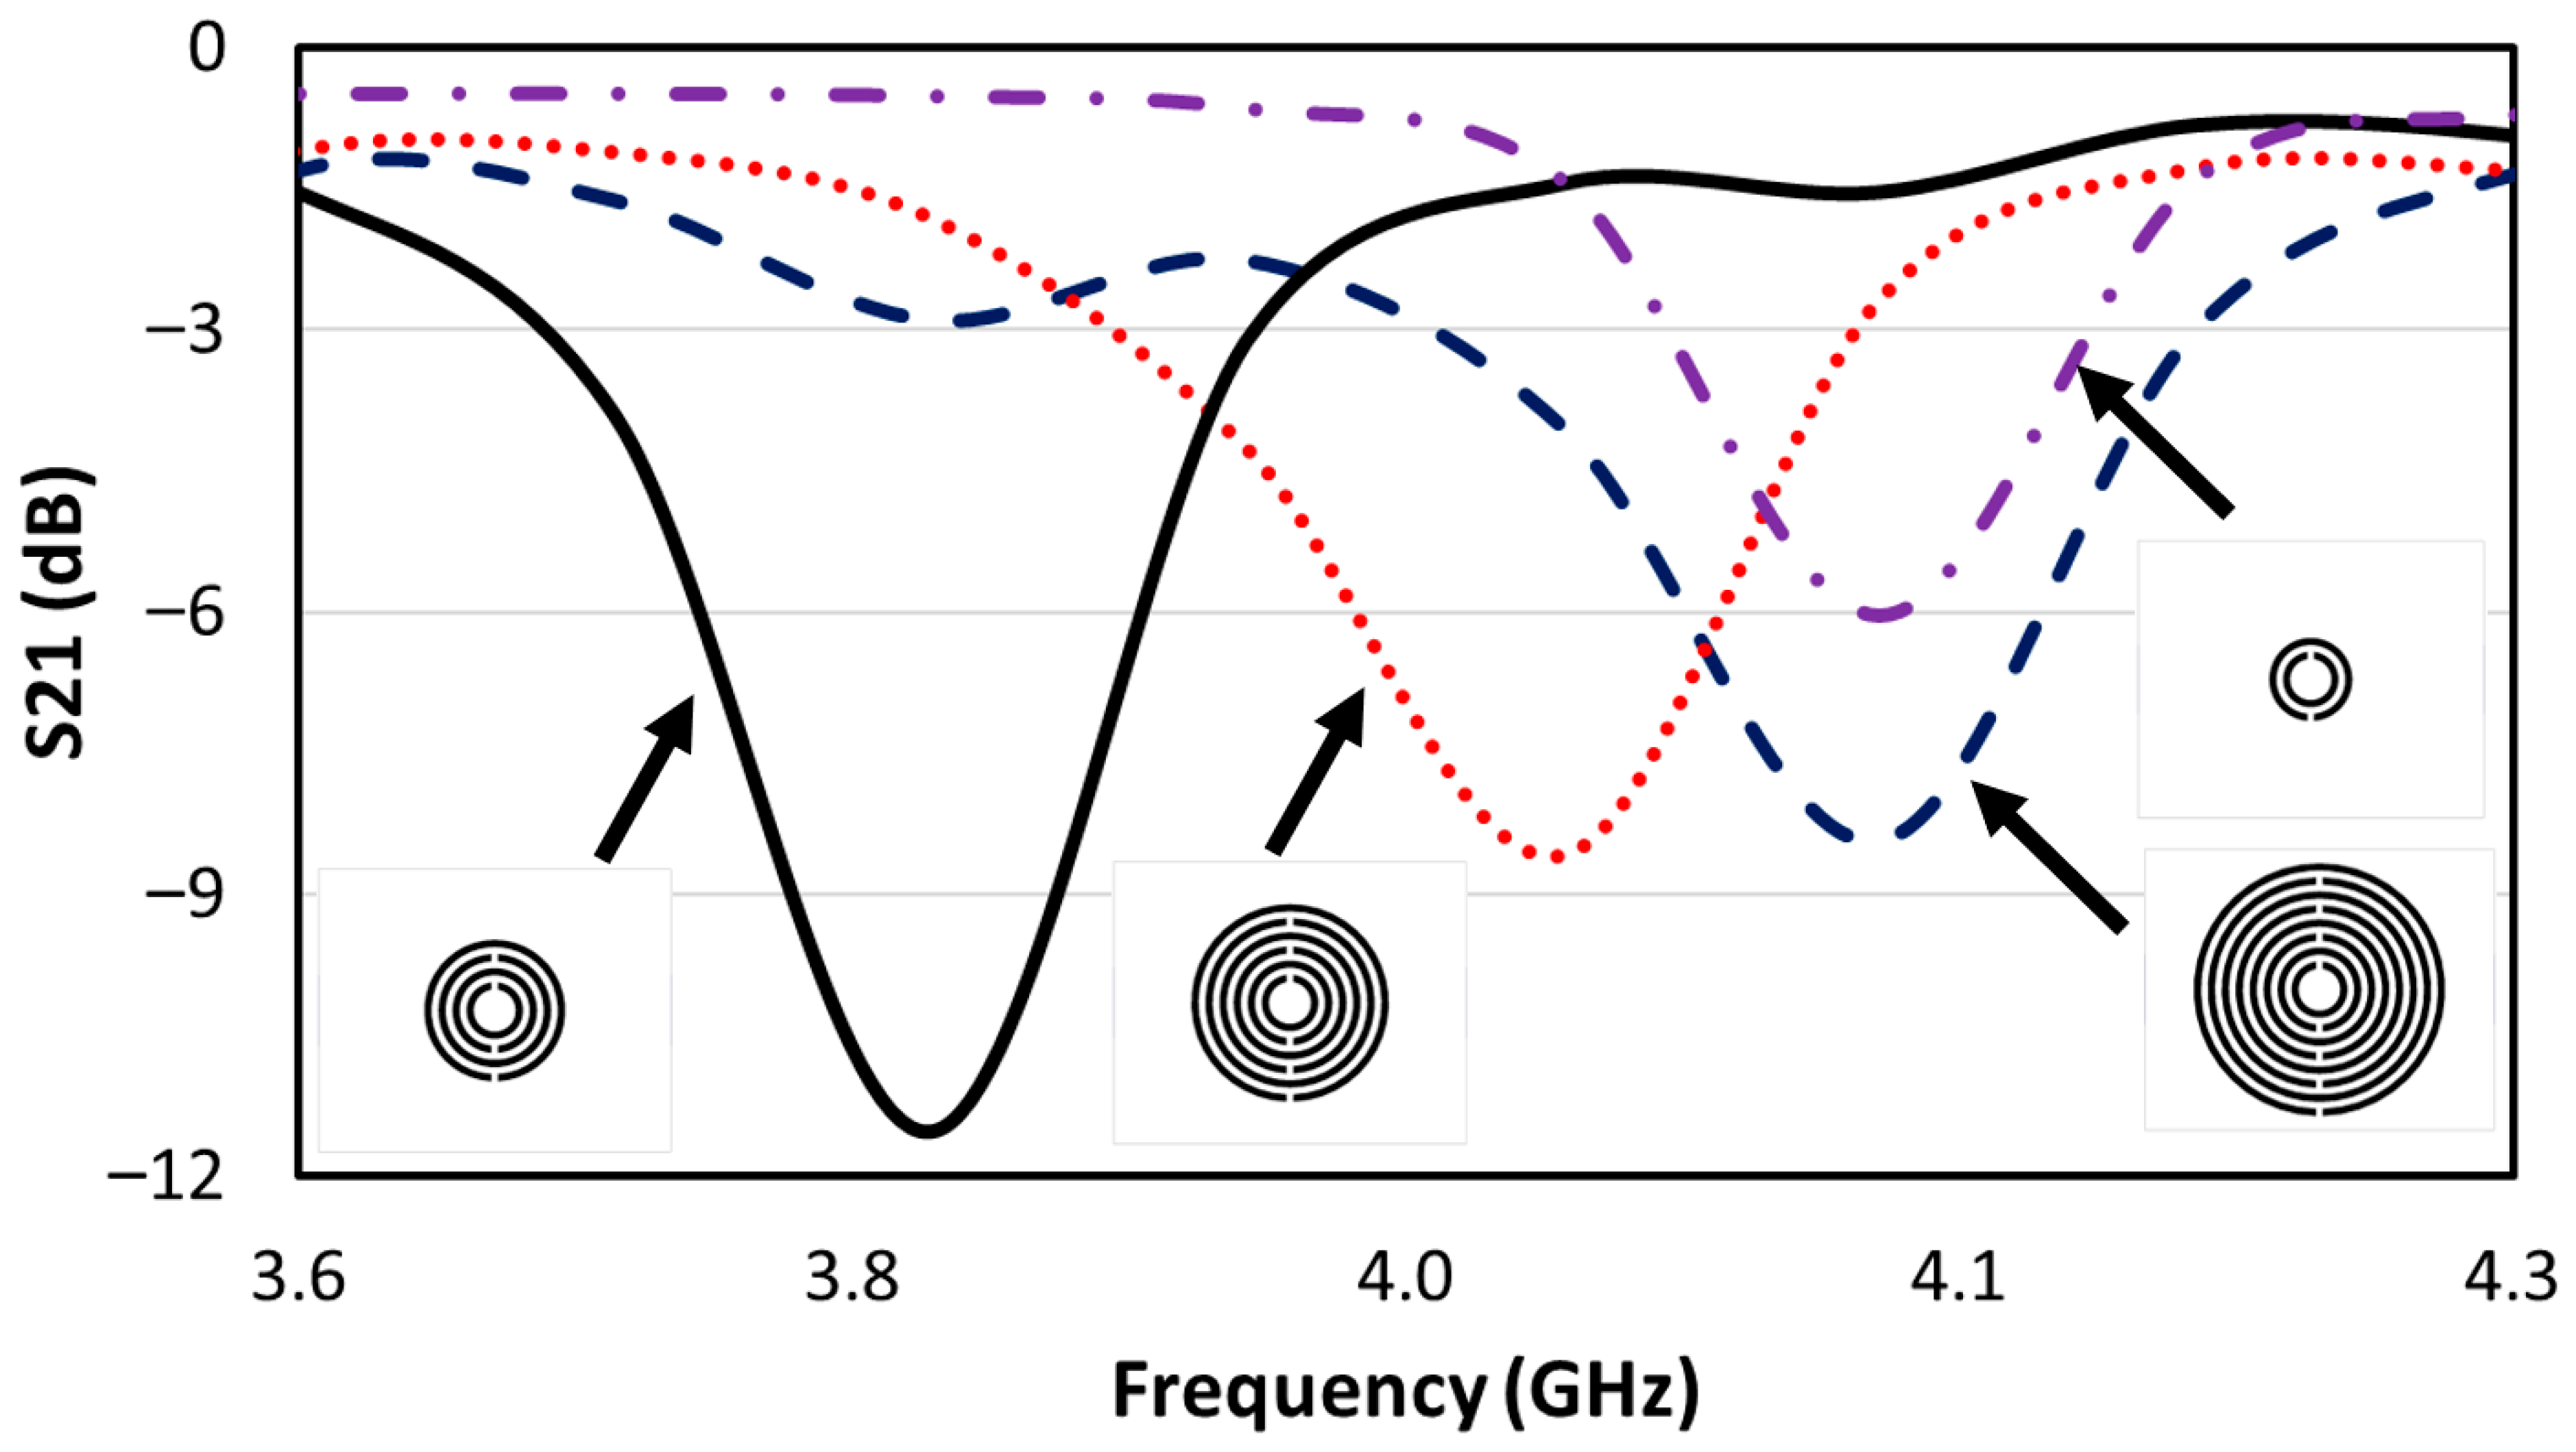
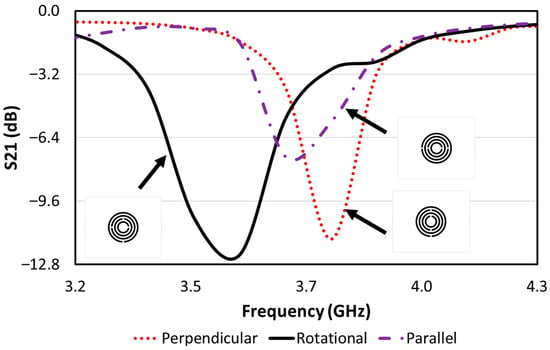
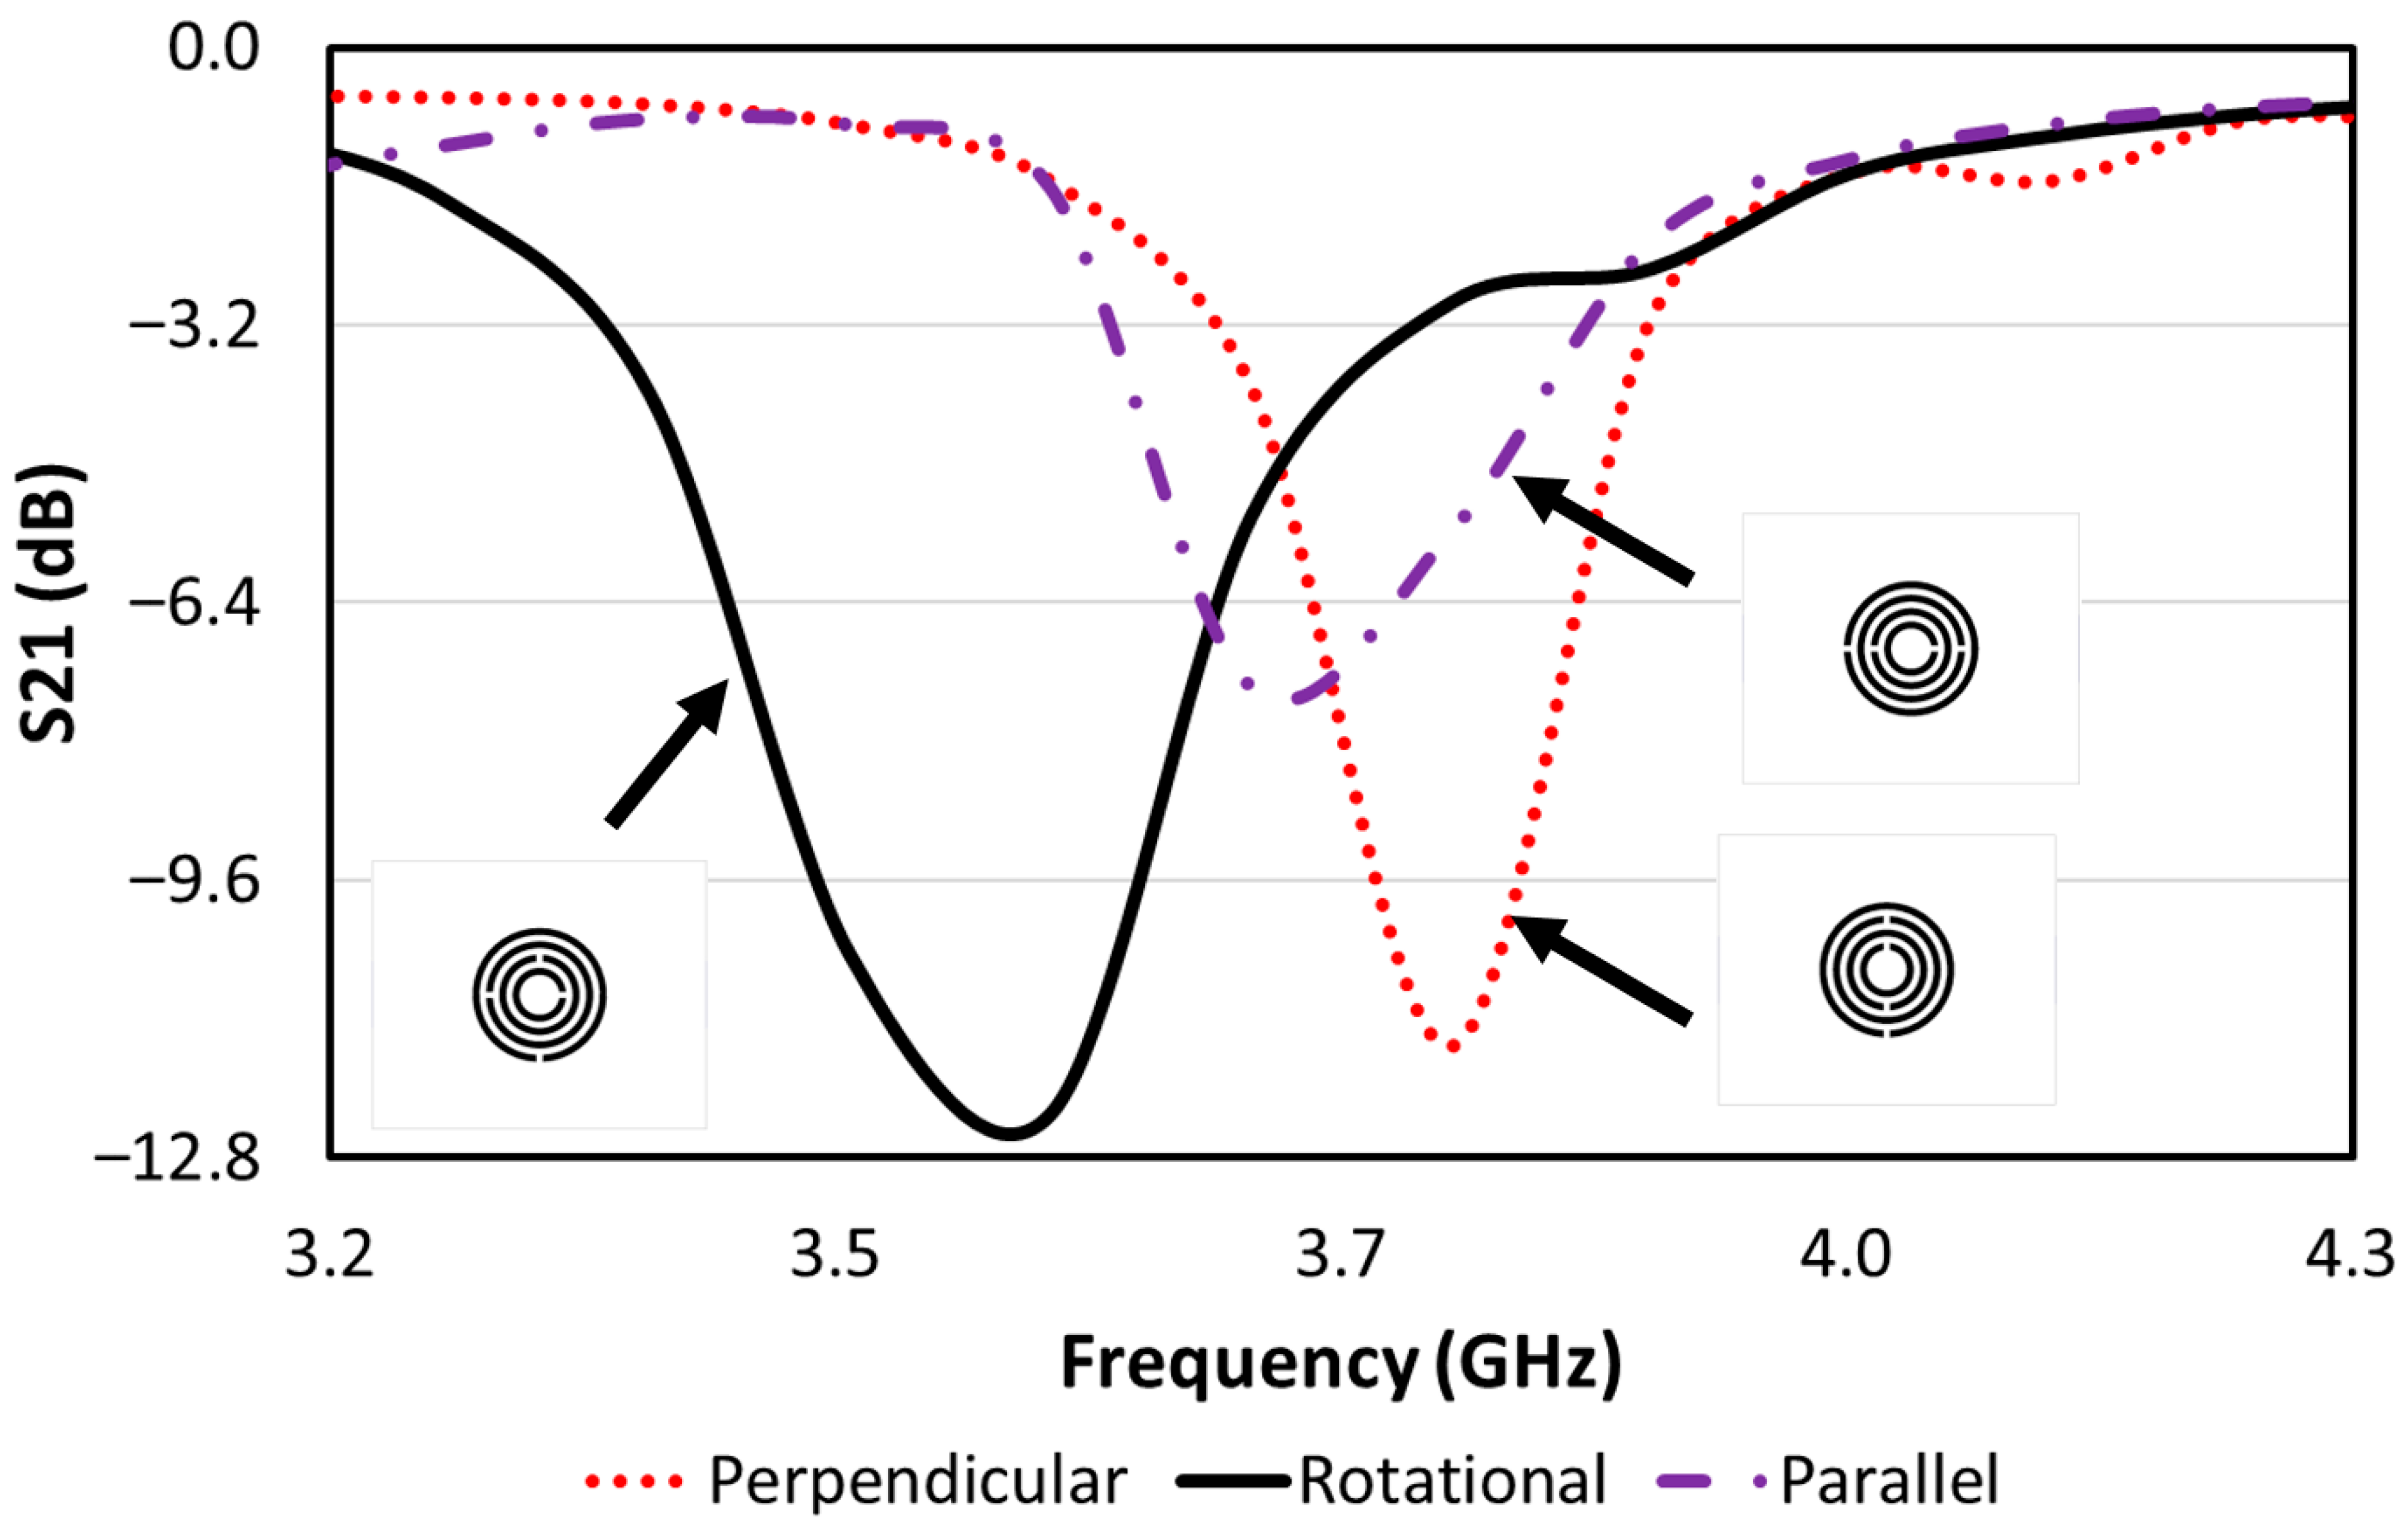
To enhance the resonator’s performance, we examined the transmission dips by varying the number of conducting rings (N). Figure 1 illustrates the transmission coefficients of the split-ring resonators generated using Ansoft High-Frequency Structure Simulator v.12.1 (HFSS) with N values of 2, 4, 6, and 8. Clearly, the four-ring multiple split-ring resonator (MSRR) exhibits the lowest transmission dip, indicating that this configuration offers the highest frequency selectivity and signal-to-noise ratio. To further improve the performance of the four-ring MSRR, we experimented with altering the positions of the splits. Figure 2 presents the simulated transmission coefficients of three different types of four-ring MSRRs: the first configuration features splits aligned in parallel with the transmission line (labelled as “parallel” in the figure); the second configuration has splits in a perpendicular orientation to the transmission line (labelled as “perpendicular” in the figure); and in the third configuration, the splits are oriented at 90 degrees in a counterclockwise direction (labelled as “rotational” in the figure). It is evident that the MSRR with splits oriented at every 90 degrees exhibits the lowest dip among the three configurations and was thus selected for the sensor design.
Figure 1.
The transmission coefficients of split-ring resonators with number of rings N = 2 (purple dashed–dotted line), 4 (black solid line), 6 (red dotted line), and 8 (blue dashed line).
Figure 2.
The transmission coefficients of N = 4 multiple split-ring resonator (MSRR) with the splits aligned in parallel (dashed–dotted line) and perpendicular (dotted line) with the transmission line and splits etched at every 90° at counterclockwise direction (solid line).
It is important to highlight that both Figure 1 and Figure 2 exhibit some degree of frequency detuning. This is anticipated, considering that the resonant frequency (fr) of an LC circuit can be mathematically defined as [34]:
Changes in fr are expected, as the number of rings and their orientations influence the value of the embedded lumped capacitance (C). The MSRR geometry is guided by established split-ring resonator theory, in which the resonant frequency is governed primarily by the distributed inductance of the rings and the lumped capacitance introduced by the splits and inter-ring coupling. While closed-form analytical expressions for multi-ring SRR geometries on dielectric substrates are generally not available, the design space is constrained by known LC scaling behavior. Full-wave electromagnetic simulations are therefore employed to refine the number of rings, split orientation, and coupling strength to maximize resonance depth and quality factor while maintaining compact size and impedance compatibility with a 50 Ω CPW feed.
The operating frequency of the proposed sensor is not selected arbitrarily, but emerges from a combination of physical, material, and practical constraints. The resonant frequency is governed primarily by the effective inductance and capacitance of the MSRR–CPW structure, which are in turn determined by the resonator geometry, substrate permittivity, and coupling to the sample under test, as described by (1). Given the targeted compact footprint (30 mm × 50 mm), the use of FR4 and RO3210 substrates, and a 50 Ω CPW feed, the achievable resonance naturally falls within the low-GHz range.
From a sensing perspective, operation in this frequency range provides an effective balance between near-field penetration depth and sensitivity to localized air–polymer permittivity contrast in low-loss PLA materials. Lower frequencies reduce sensitivity to localized discontinuities, while substantially higher frequencies increase dielectric and conductor losses and reduce measurement robustness when using compact, low-cost instrumentation such as a nanoVNA. As closed-form analytical expressions for multi-ring SRRs on dielectric substrates are generally unavailable, full-wave electromagnetic simulations are employed to refine the final resonant frequency and maximize resonance depth and quality factor. Such empirically guided optimization is standard practice in resonant microwave sensor design.
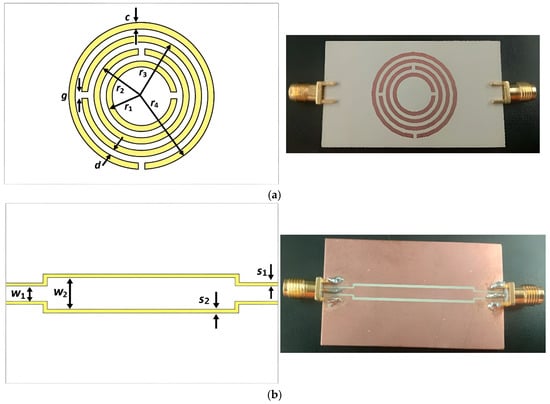
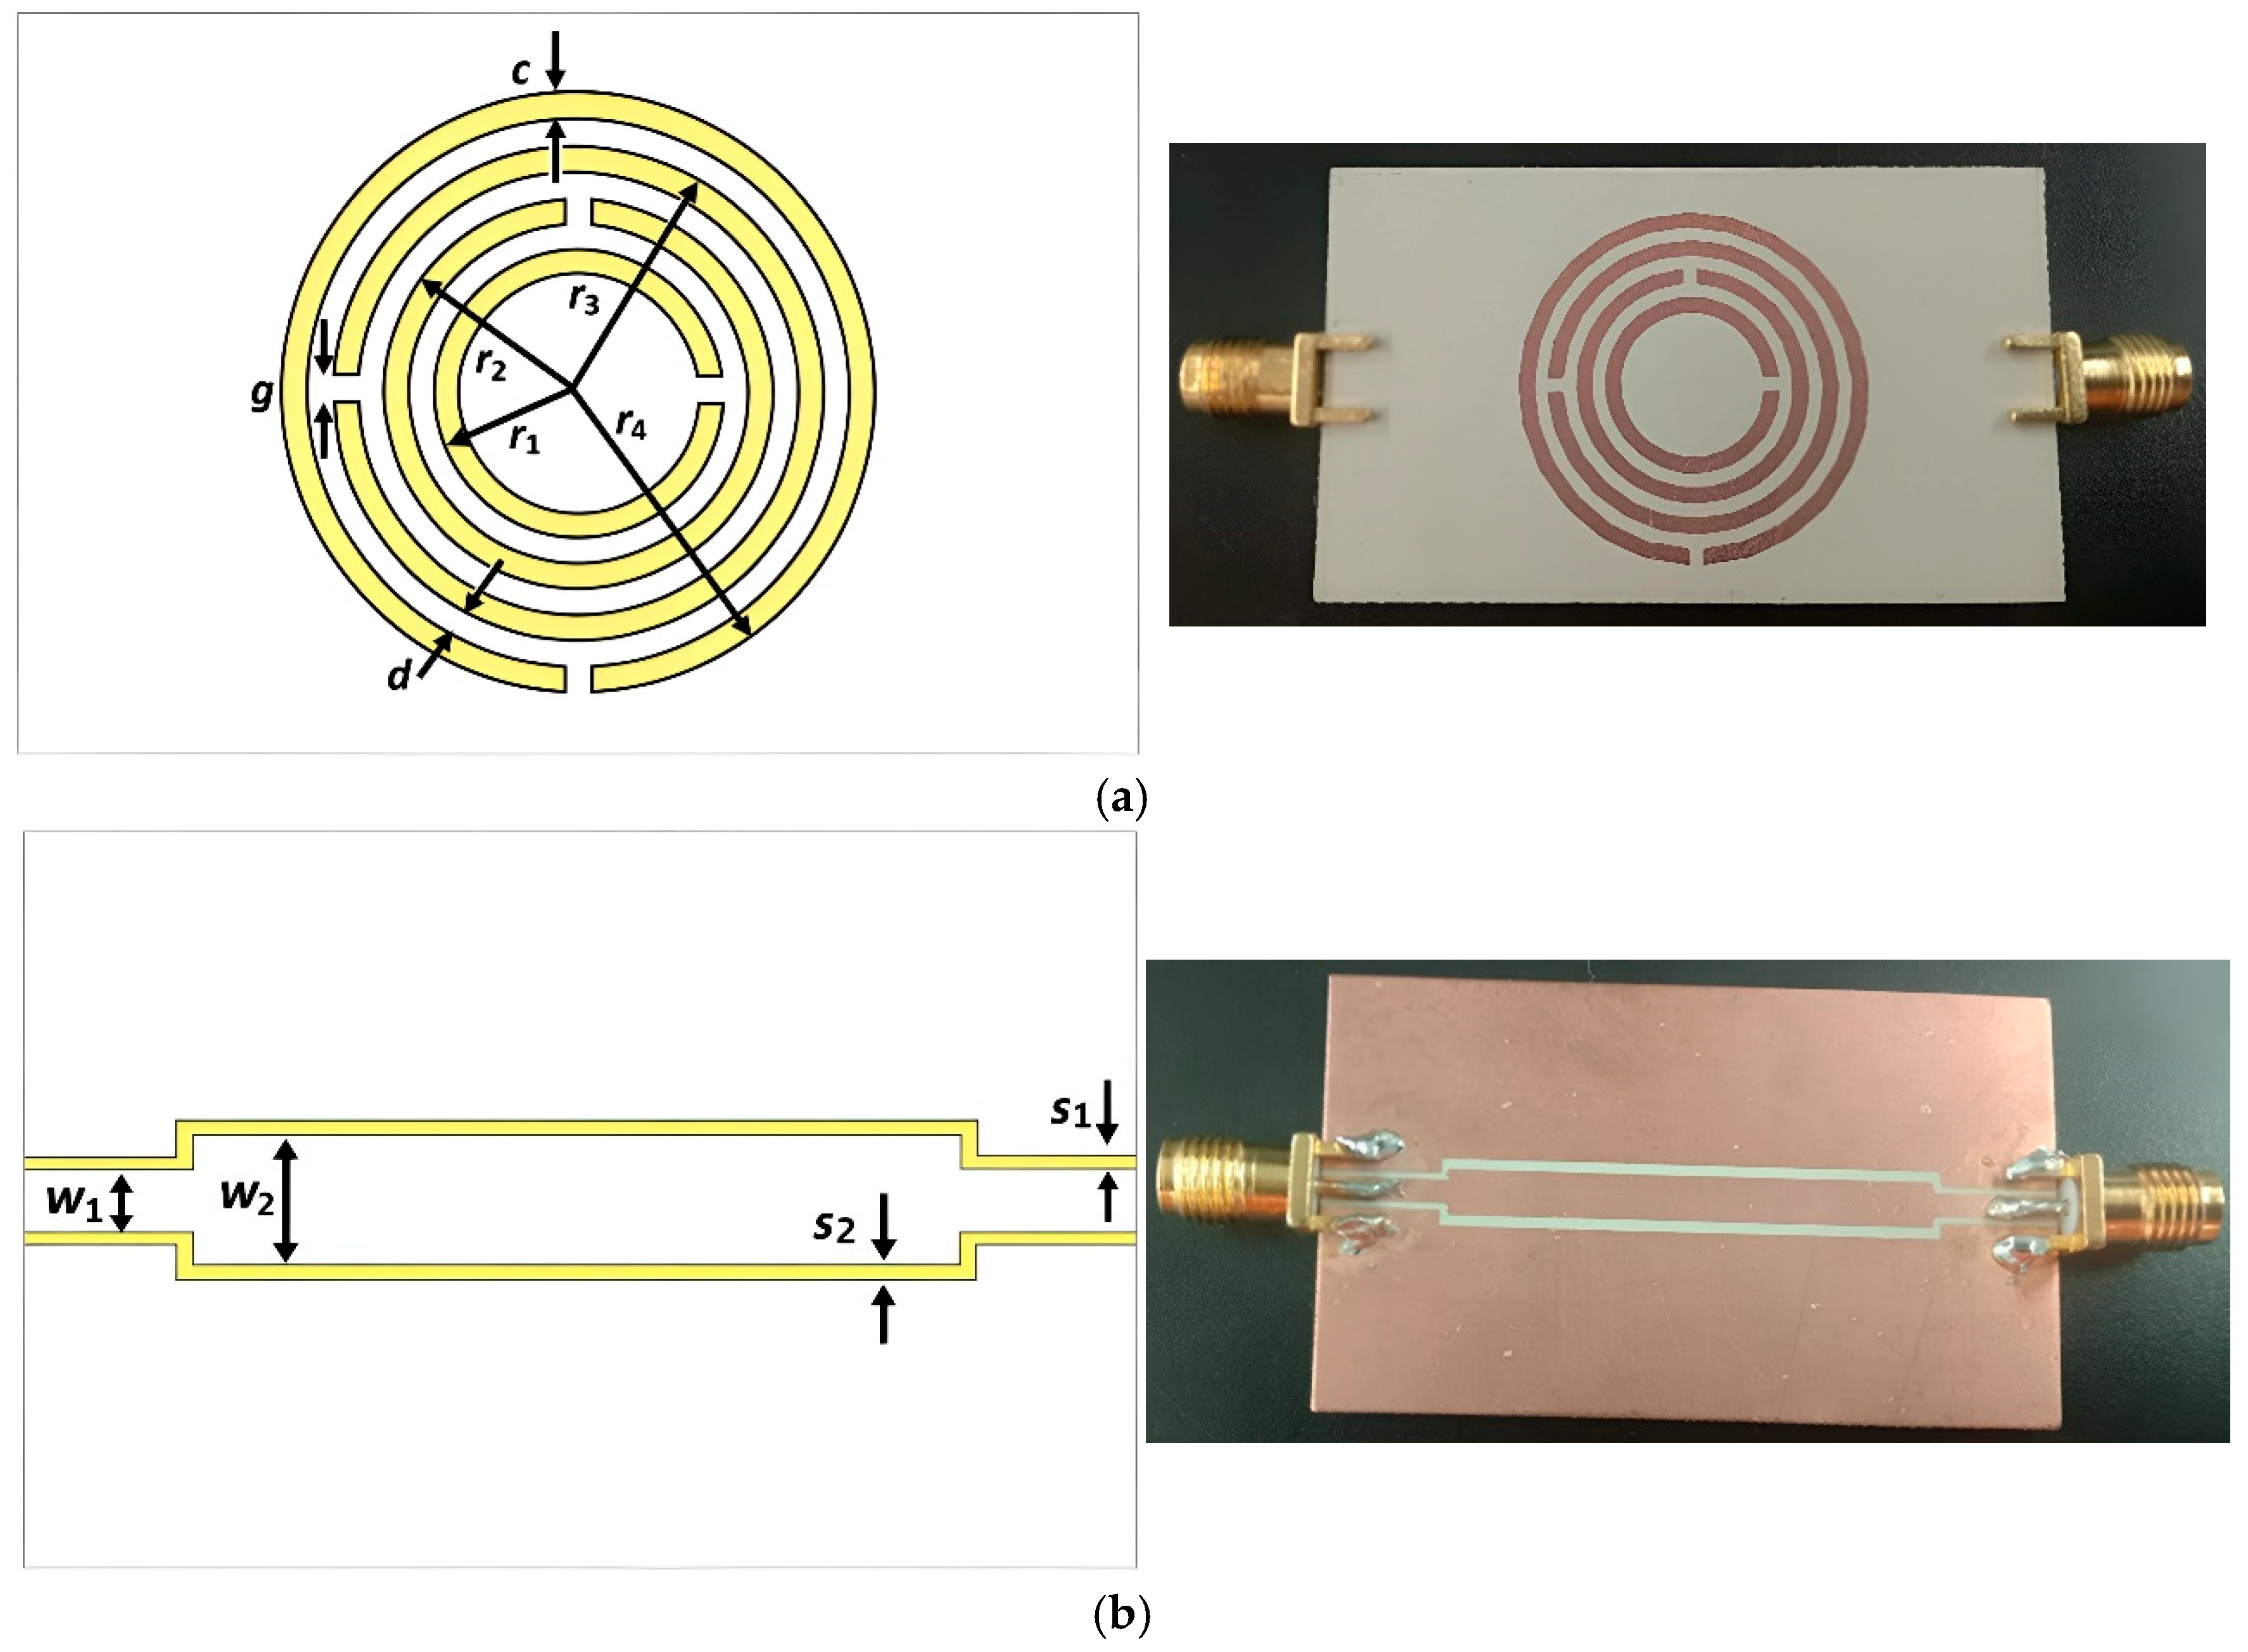
Figure 3 illustrates the final optimized structure of the planar microwave sensor. The dimensions of the coplanar waveguide (CPW) have been fine-tuned empirically to approach 50 Ω, aligning with the specifications of the SMA connectors. The proposed design occupies a physical footprint of 30 mm × 50 mm and was individually fabricated on two distinct substrates: one on a Flame Retardant FR4-epoxy substrate (with a dielectric constant εr = 4.4 and a loss tangent tan δ = 0.022), and the other on a Rogers RO3210 substrate (with εr = 10.2 and tan δ = 0.003). For clarity, the geometrical parameters of the structure are summarized in Table 1 and Table 2. To facilitate easy reference to these two sensor types, a nomenclature is adopted here. The sensor constructed on the FR4 substrate will be referred to as the “FR4 sensor,” while the one built on the RO3210 substrate will be termed the “RO3210 sensor” henceforth.
Figure 3.
The (a) top and (b) bottom views of the proposed planar sensor.
Table 1.
Dimensions of the MSRR.
Table 2.
Dimensions of the CPW when fabricated on an FR4 and an RO3210 substrate.
The inclusion of both FR4 and RO3210 substrates is intentional and serves a comparative purpose rather than an assertion of equivalent RF performance. FR4, despite its higher dielectric loss, remains widely used in low-cost and rapid-prototyping microwave sensors due to its affordability and ease of fabrication. In contrast, RO3210 represents a low-loss substrate optimized for improved resonator quality factor and sensing resolution. The side-by-side evaluation therefore illustrates how substrate dielectric loss influences resonant depth, frequency stability, and measurement resolution in near-field discontinuity sensing, providing practical design guidance under different cost–performance constraints.
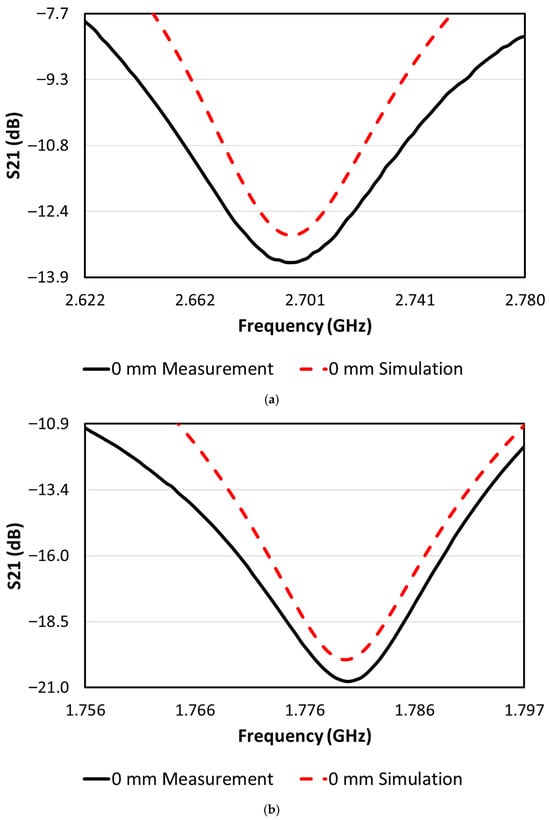
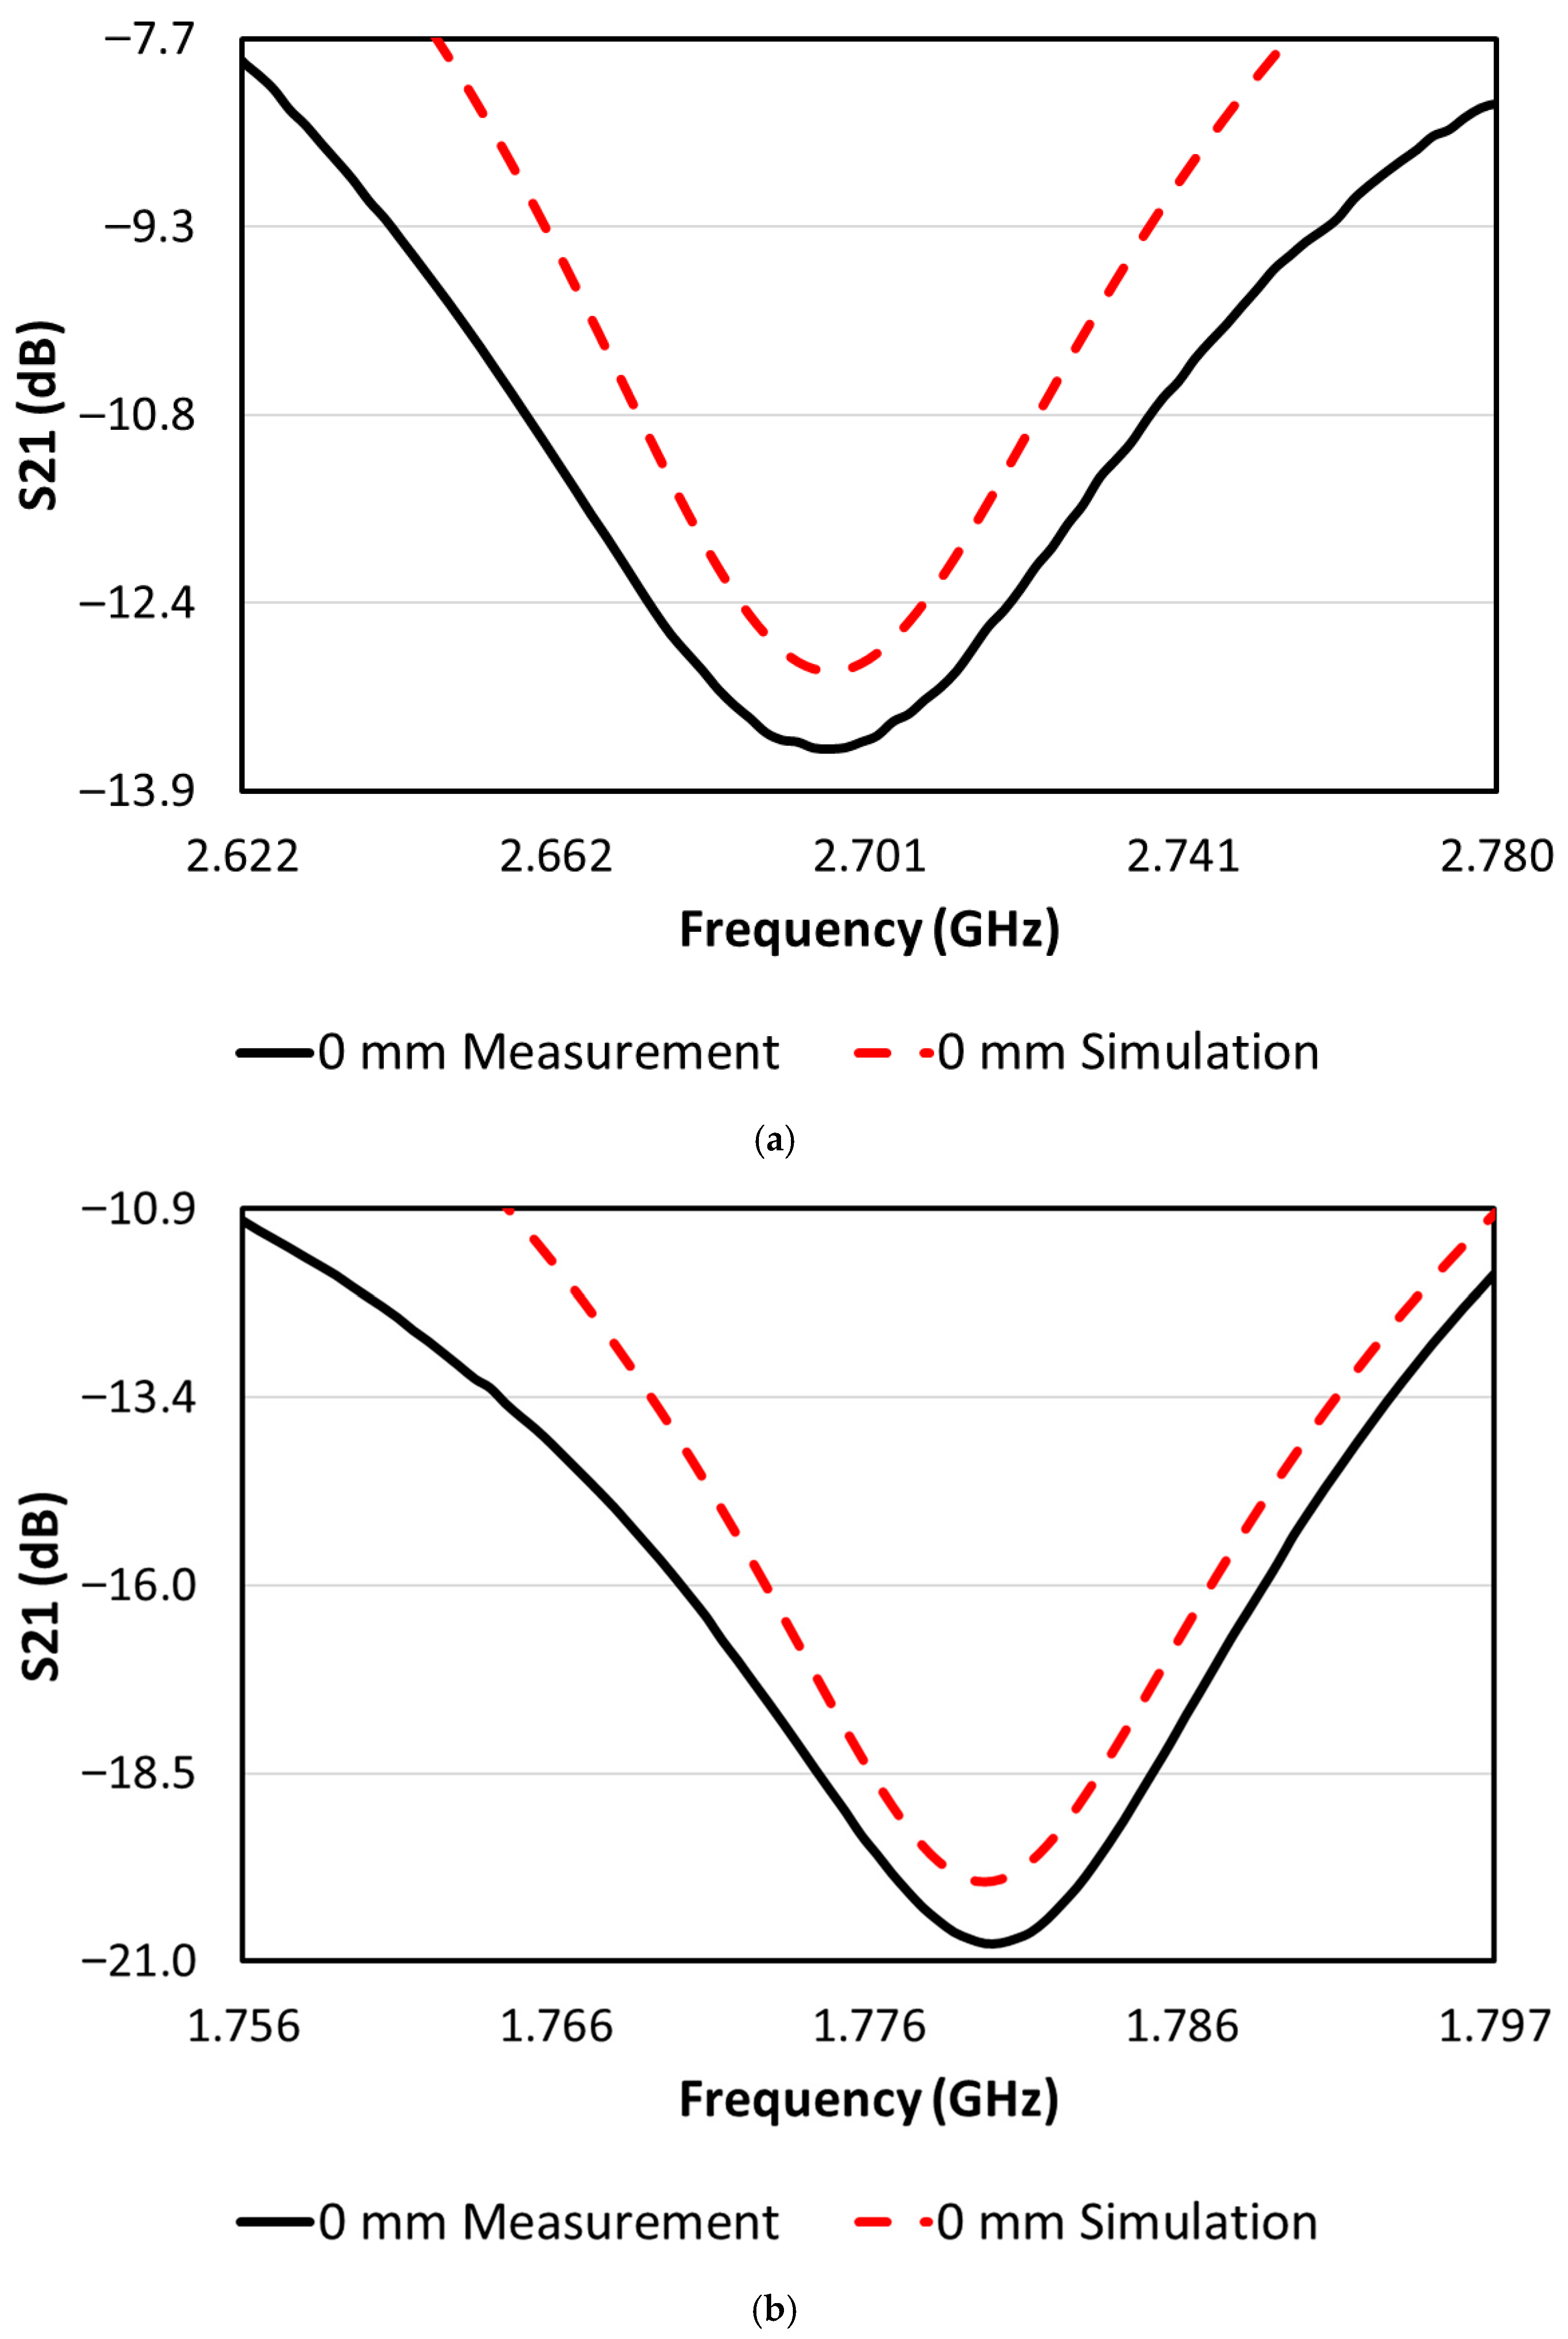
To verify the baseline performance of the proposed sensors prior to discontinuity measurements, a comparison between simulated and experimentally measured transmission responses was conducted under the reference condition where the Sample Under Test (SUT) contains no discontinuity. Figure 4 presents the simulated and measured S21 responses for both the FR4 and RO3210 sensors when a discontinuity-free PLA sample is placed on the sensing region. The simulated responses were obtained using Ansoft HFSS, while the experimental measurements were conducted using a nano vector network analyzer (nanoVNA).
Figure 4.
Comparison between simulated and measured transmission responses (S21) of the proposed sensors under the reference condition (0 mm discontinuity): (a) FR4 sensor and (b) RO3210 sensor.
Overall, good agreement is observed between the simulated and measured resonance characteristics, particularly in terms of the resonance location and general response profile. Minor discrepancies between the curves are expected and may arise from fabrication tolerances, uncertainties in substrate dielectric properties, connector losses, and measurement limitations associated with the nanoVNA. Nevertheless, the close correspondence between simulation and experiment confirms the correct realization of the MSRR–CPW resonator structure and validates the baseline electromagnetic behavior of the proposed sensors.
It should be noted that accurately modeling crack-like discontinuities in 3D-printed PLA through full-wave simulations is challenging because the electromagnetic response depends on factors such as printing tolerances, surface roughness, air–polymer interfaces, and slight dimensional variations in the fabricated samples. For this reason, simulations are primarily used to validate the intrinsic resonant behavior of the sensor under the reference condition, while the discontinuity sensing response is characterized experimentally through calibrated measurements.
Following this baseline characterization, the primary aim of this study is to investigate the relationship between resonant frequency and the size of controlled crack-like discontinuities in PLA materials. To establish a foundation for our experiments, we initially conducted tests using a crack-free material as the control. These initial tests involved placing the discontinuity-free material on the sensor to determine its initial resonant frequency. This baseline measurement serves as a reference point for subsequent experiments in which materials with varying discontinuity widths will be tested. It allows us to evaluate the impact of discontinuity size on resonant frequency.
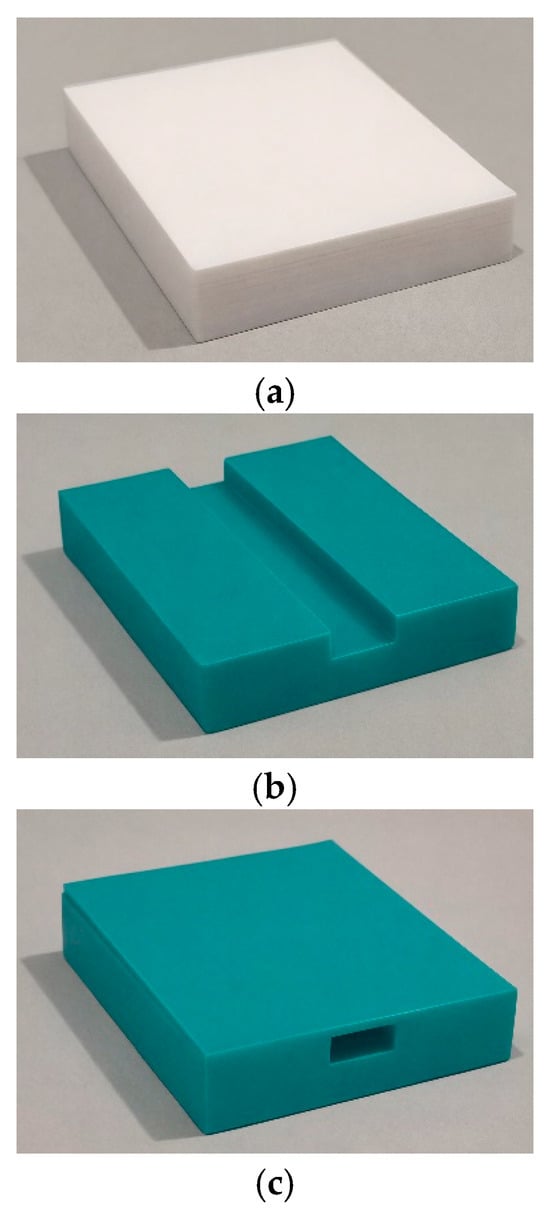
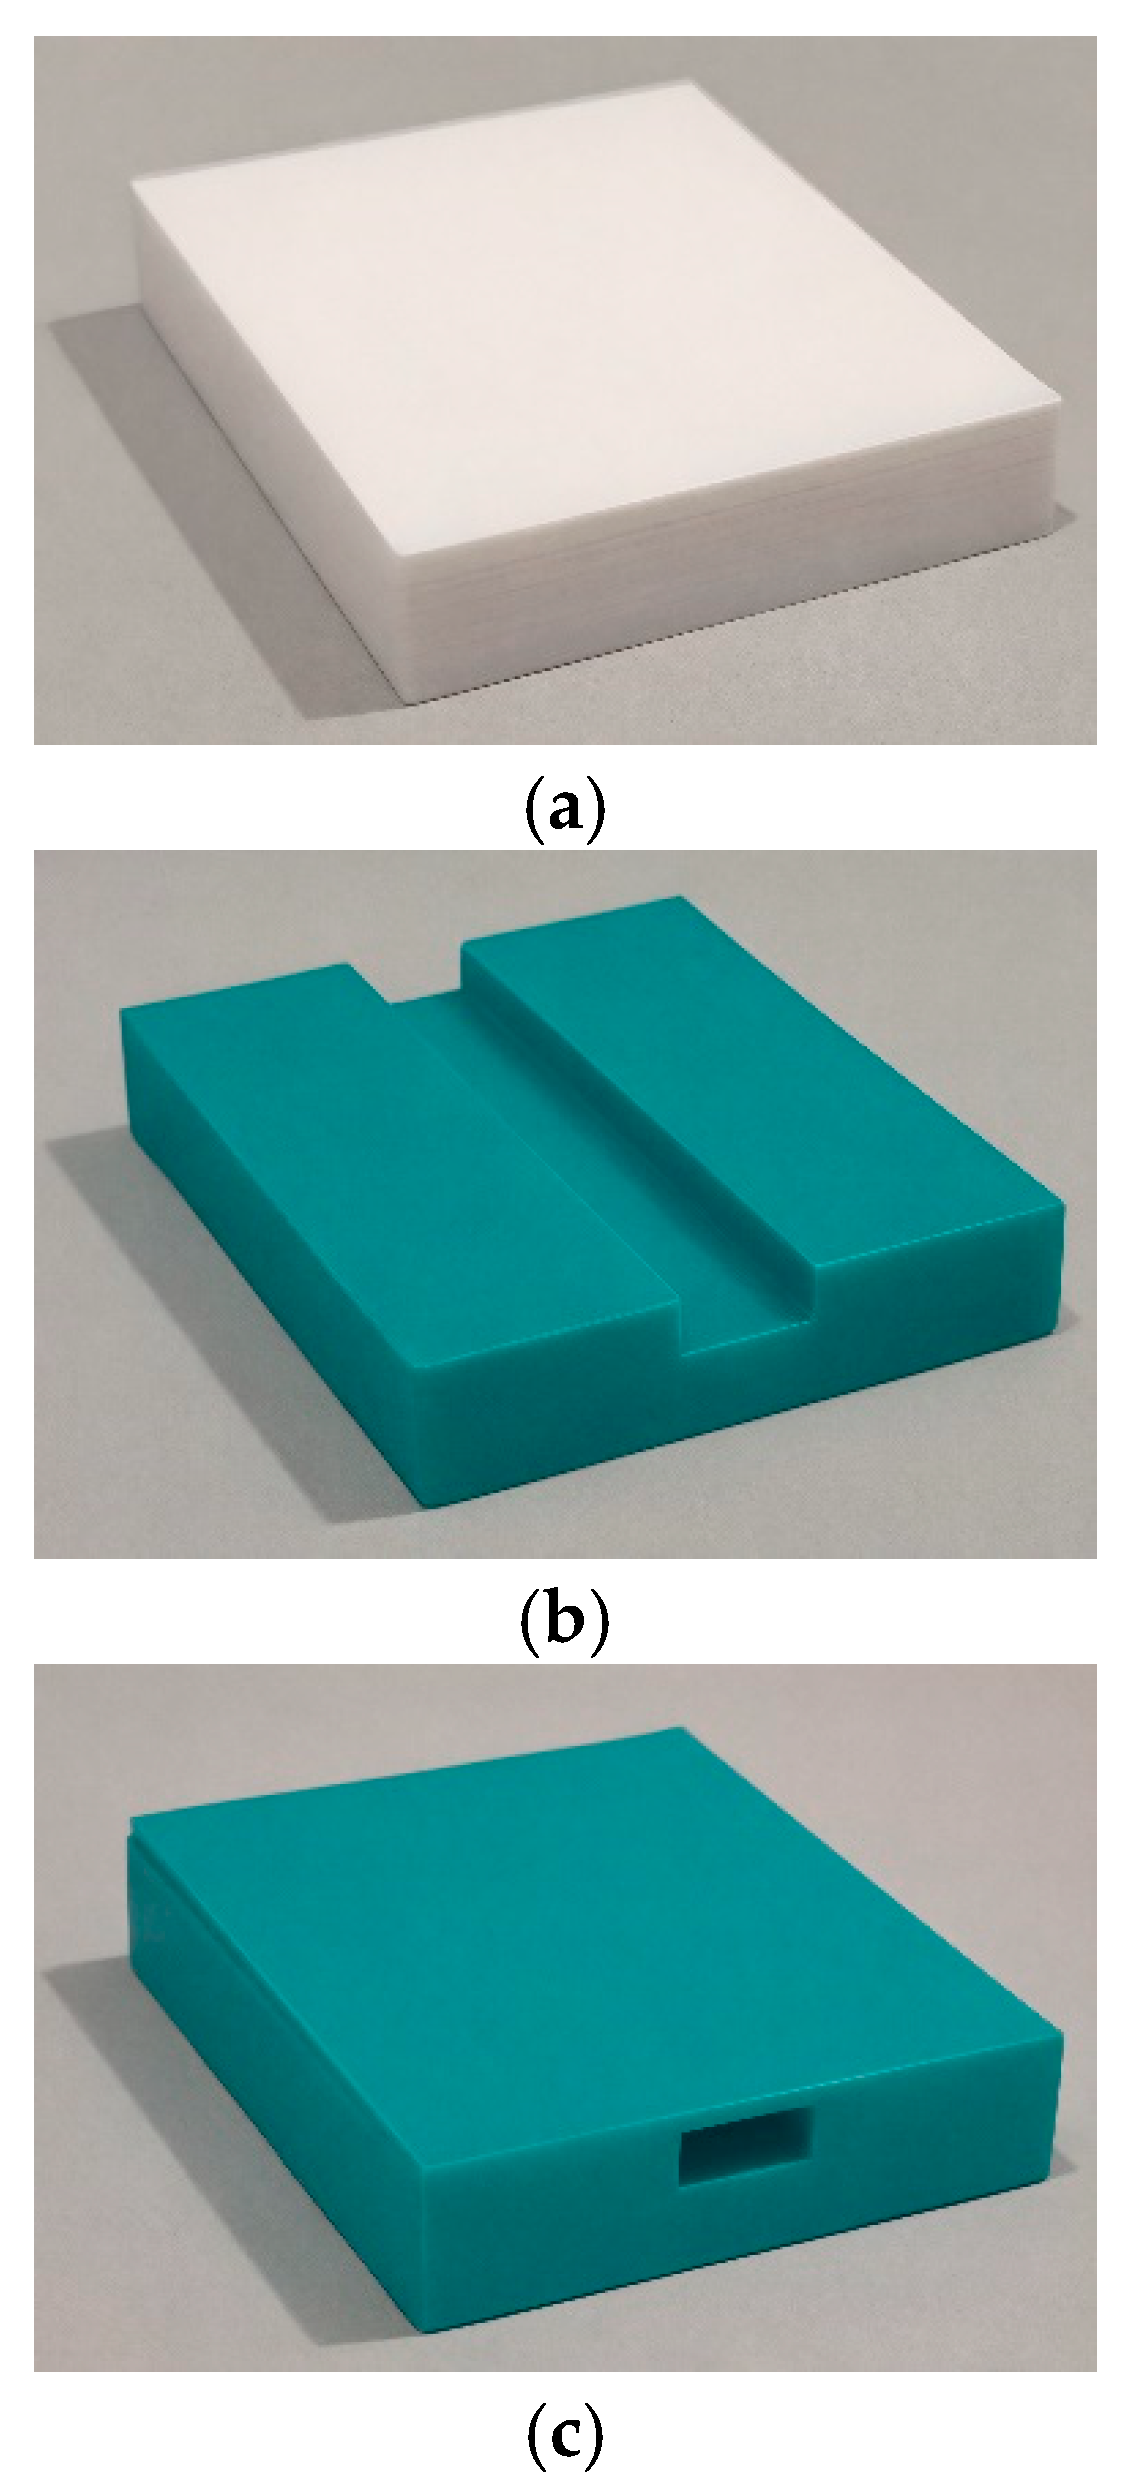
For our study, PLA materials with grooves of different sizes at the center were 3D-printed as samples under test (SUTs). The PLA material used for sample fabrication was Jamghe PLA+ filament (1.75 mm), manufactured by Shenzhen Yongchanghe Technology Co., Ltd., Shenzhen, China. These grooves serve as controlled surrogate cracks (hereafter referred to as crack-like discontinuities), enabling repeatable investigation of the sensor response to localized material removal. Although real cracks may involve tight interfaces, surface roughness, and negligible volume loss, the present groove-based discontinuities are intentionally designed to isolate and quantify the dominant electromagnetic effect of localized air–polymer permittivity contrast in the near field of the resonator. In many cases, cracks may be concealed within a material and may not be easily detected, let alone measured. Despite their challenging detection, identifying subsurface cracks is actually more critical than detecting surface-breaking cracks. To demonstrate the versatility of our proposed sensor, we will be testing both surface and subsurface discontinuities in this study. Figure 5 depicts the three types of SUTs utilized in the measurements. The SUT in Figure 5a is free of cracks and serves as the control. In contrast, the SUTs in Figure 5b,c are specifically designed for examining surface and subsurface crack-like discontinuities, respectively.
Figure 5.
Samples under test (SUTs): (a) discontinuity-free control sample, (b) surface discontinuity configuration, (c) subsurface discontinuity configuration.
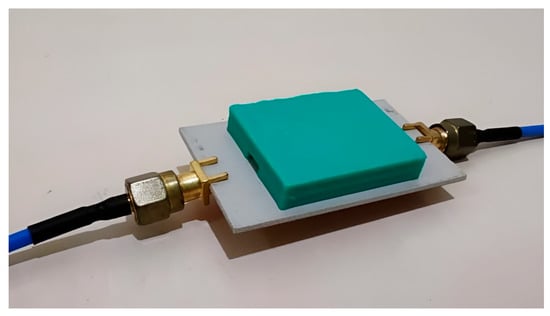
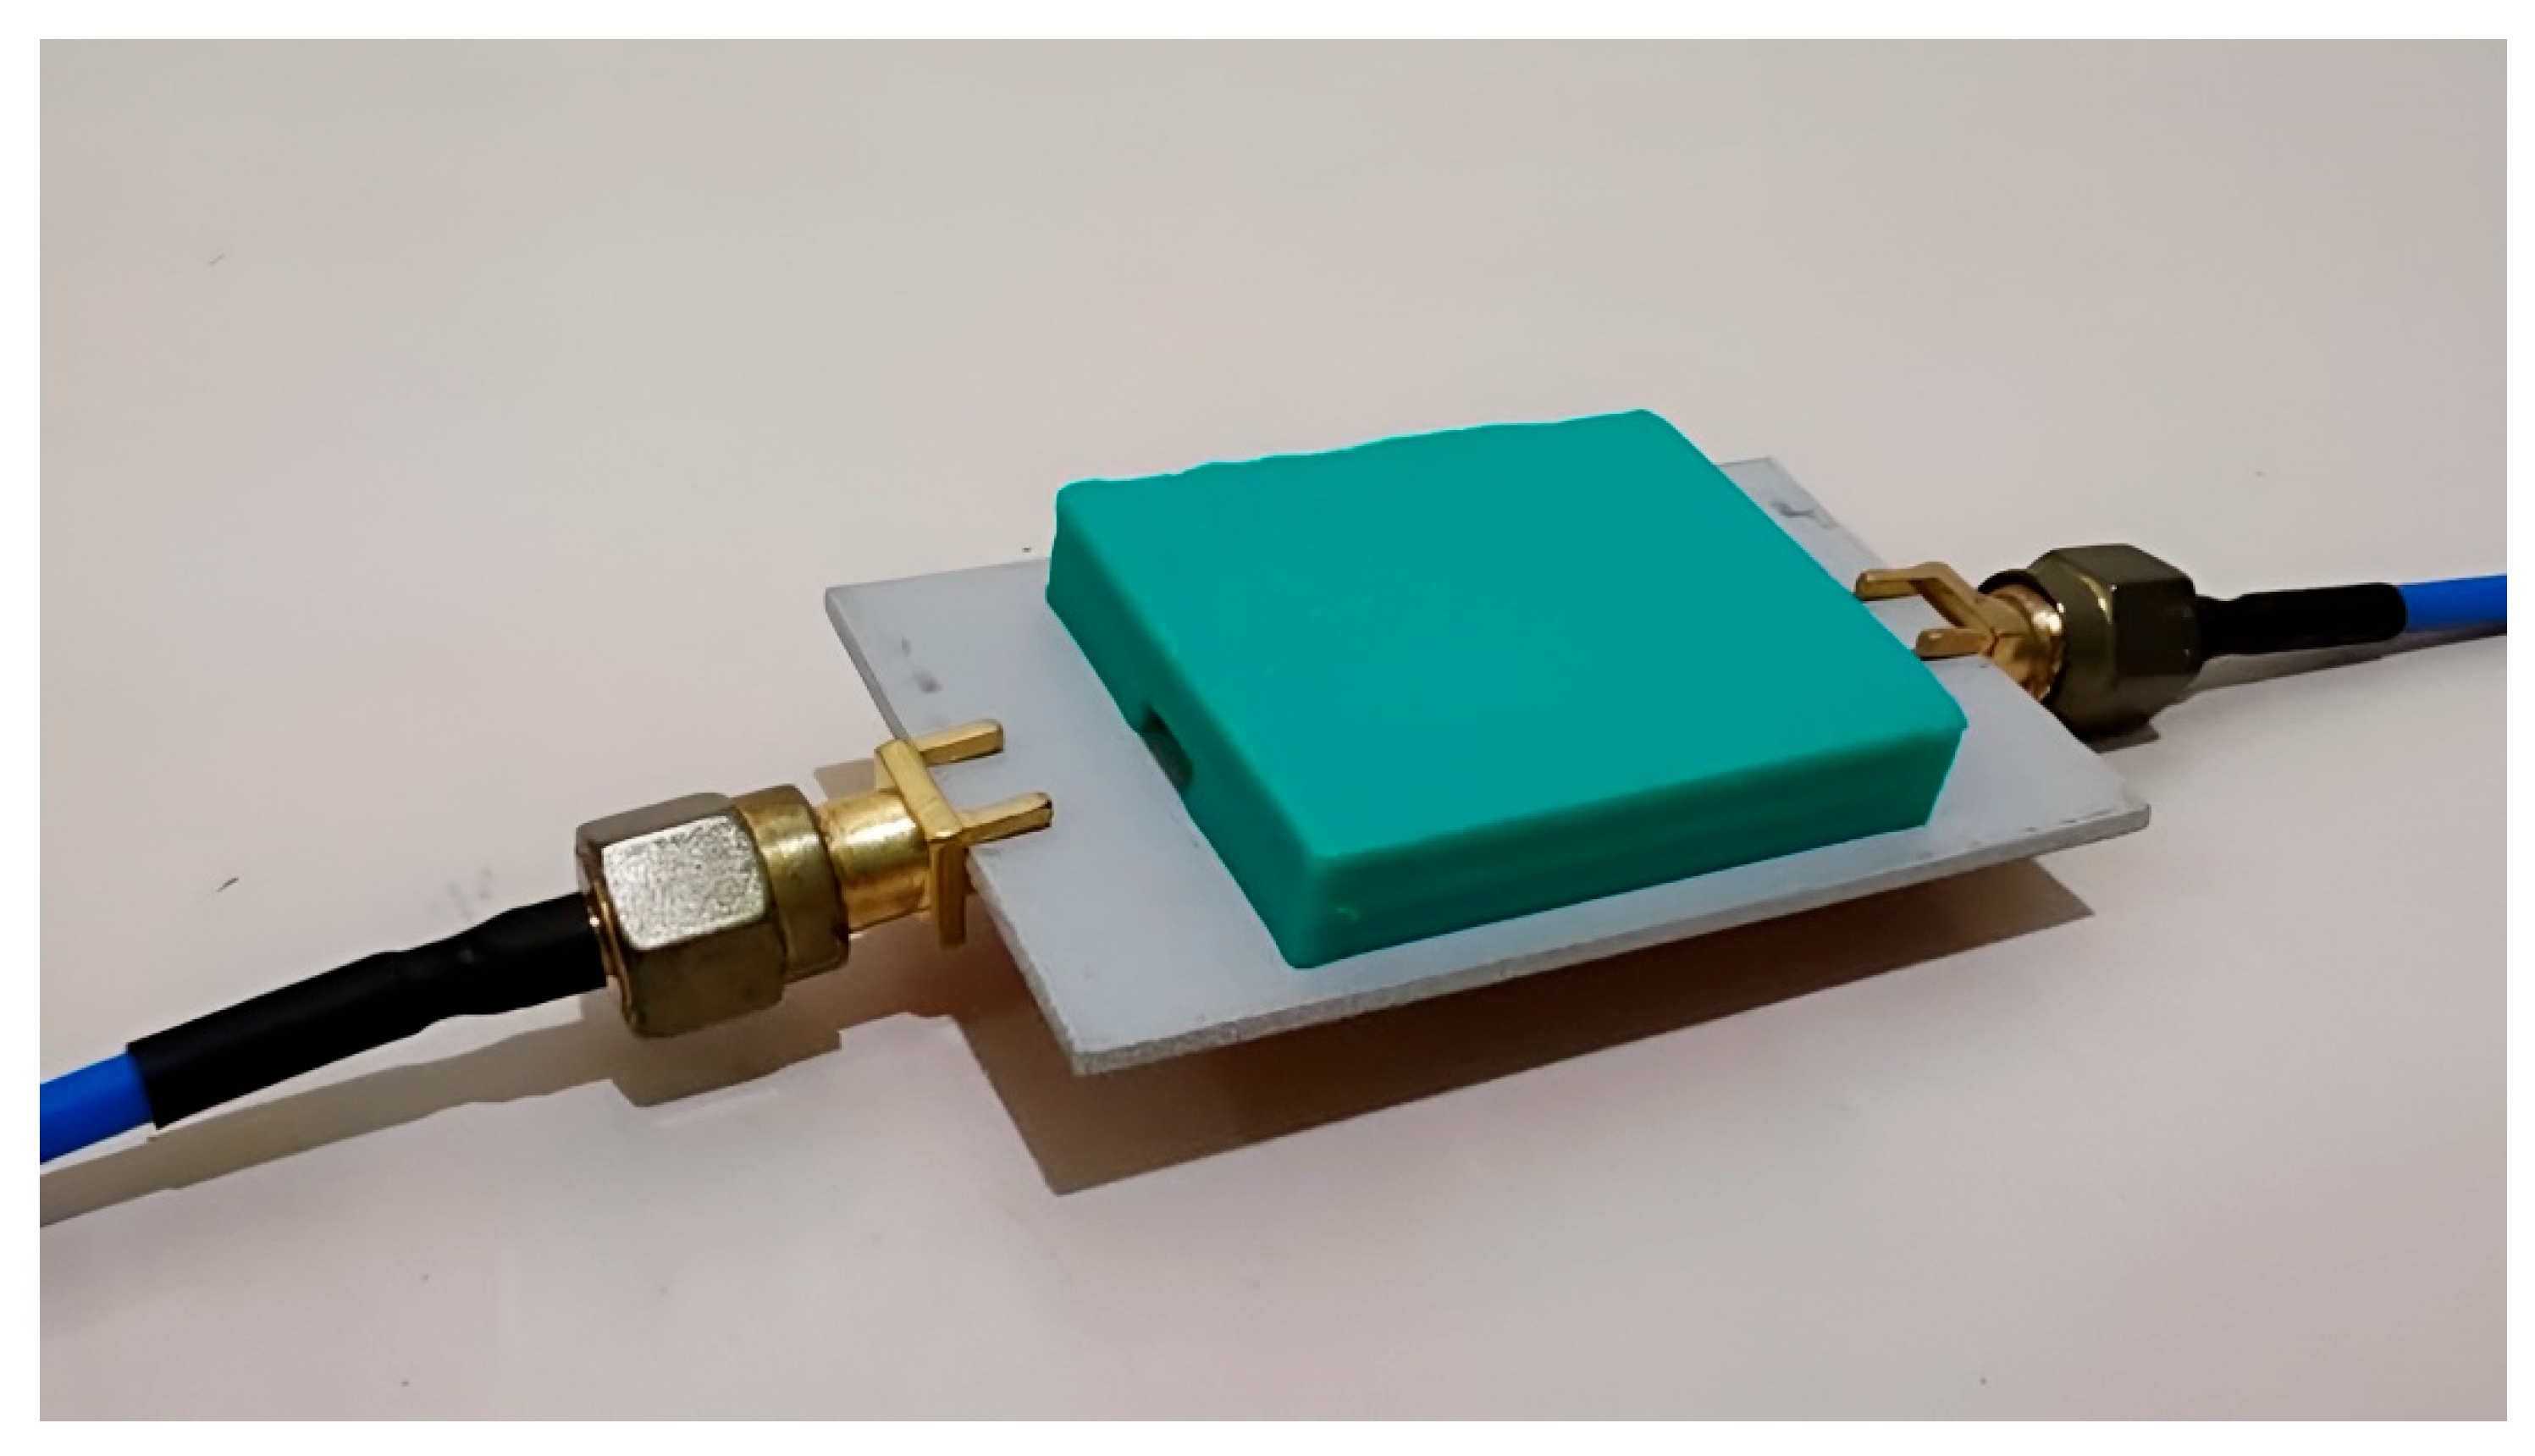
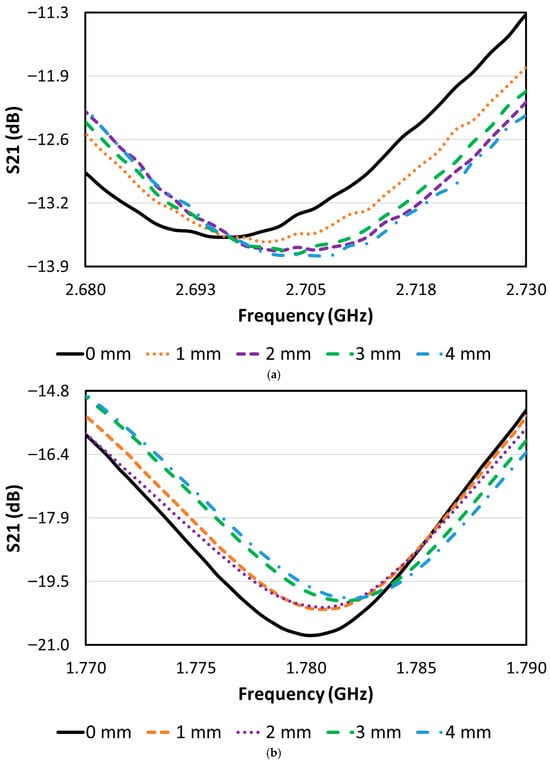
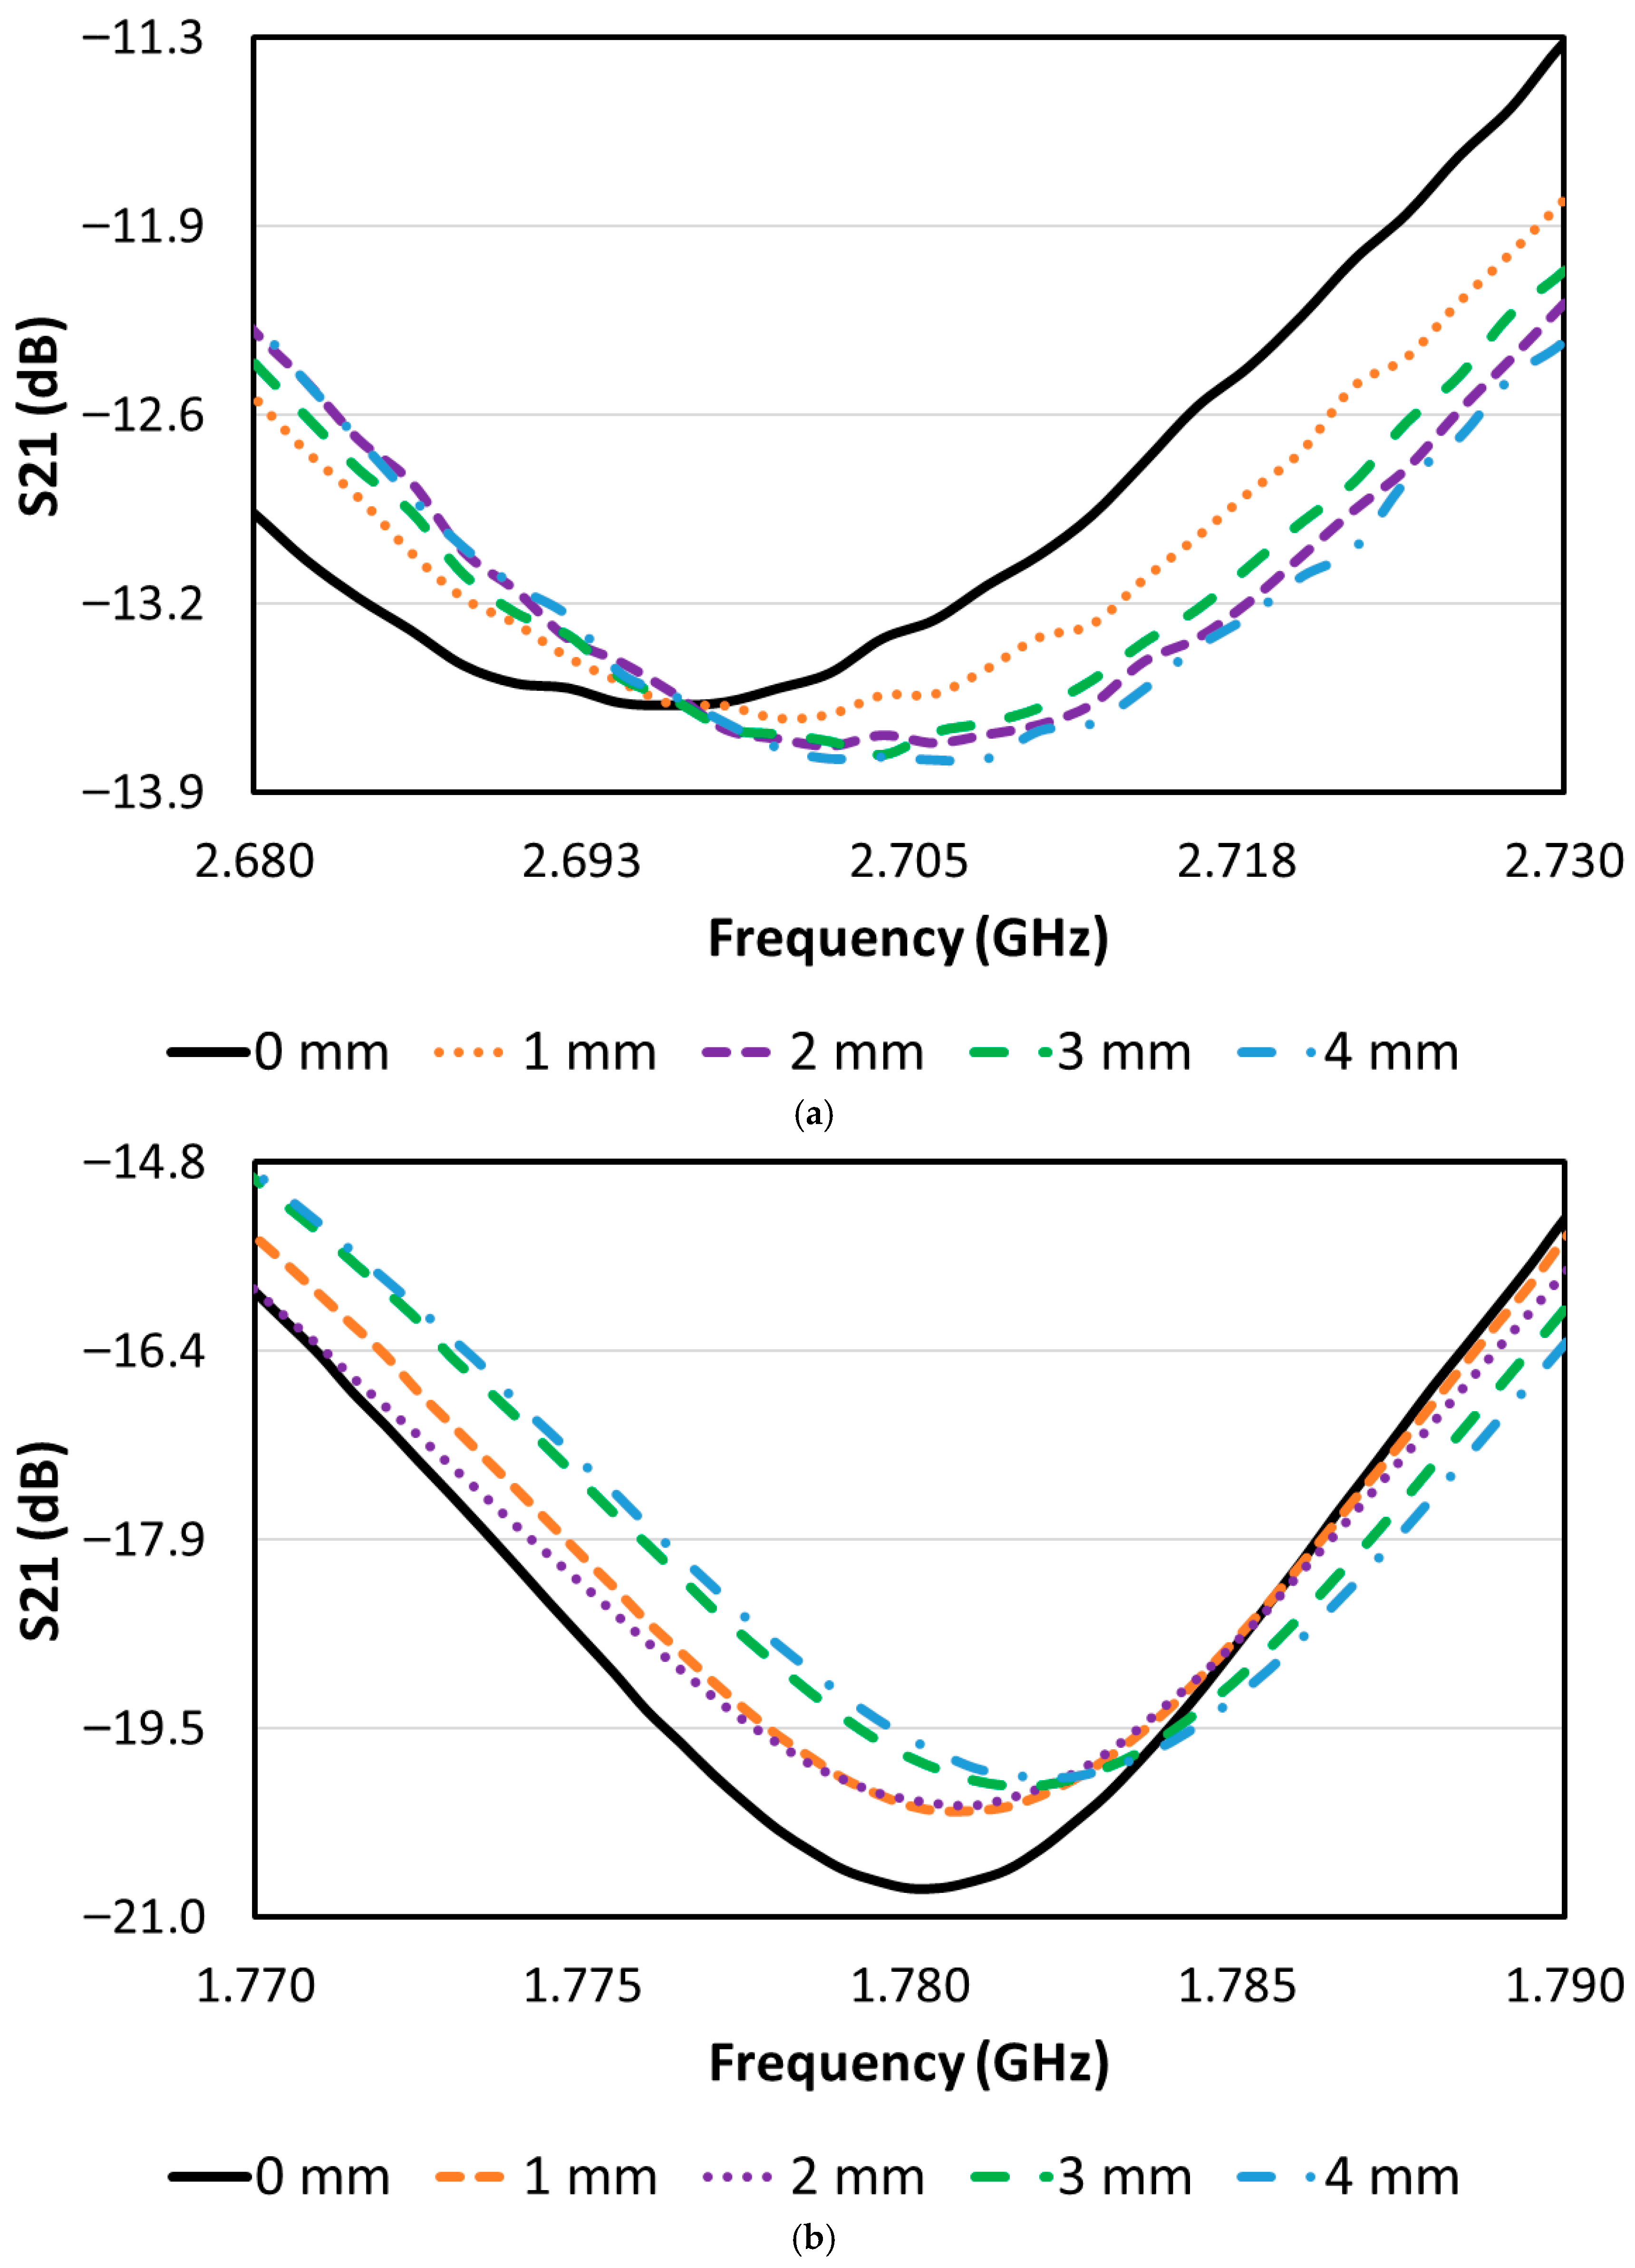
To measure the size of the discontinuity, the side of the Sample-Under-Test (SUT) with the groove is flipped over so that it faces the Multiple Split-Ring Resonator (MSRR). The experimental setup for the measurement is shown in Figure 6. The transmission coefficient of the device is then extracted by connecting both ends of the Coplanar Waveguide (CPW) transmission line to a nanoVNA. To evaluate measurement repeatability and address measurement uncertainty, each Sample Under Test (SUT) was measured six times under identical experimental conditions without repositioning the sensor setup. The mean resonant frequency and standard deviation were then calculated for each discontinuity width. The results show that the variation across repeated measurements is extremely small, with standard deviations on the order of 0.10 to 0.13 MHz for the FR4 sensor and 0.06 to 0.07 MHz for the RO3210 sensor, which are significantly smaller than the frequency shifts induced by changes in discontinuity width. The statistical summaries of these repeated measurements are presented in Table 3 and Table 4, confirming the excellent stability of the experimental setup and the nanoVNA measurement system. These results indicate that the observed resonant frequency shifts are dominated by discontinuity geometry rather than measurement uncertainty. We initially set the depth of the groove as a constant and then vary the width size, ranging from 1 mm to 4 mm, with an incremental step size of 1 mm. The transmission coefficient is measured and recorded for each change in the groove width. Figure 7 illustrates the shift in resonant bands for different groove widths when measured using the FR4 and RO3210 sensors, respectively. In the absence of a crack-like discontinuity in the SUT, the sensor’s transmission coefficient resonates at 2.696 GHz for the FR4 sensor and 1.780 GHz for the RO3210 sensor. It is evident from the figures that the resonant frequency (fr) shifts towards higher values as the groove-width increases. Although the direction of the frequency shift follows established electromagnetic theory, the significance of the result lies in the repeatable and resolvable nature of the shift using a compact, low-cost measurement platform, enabling calibrated discrimination of millimeter-scale discontinuities. These results align with findings from Nongpromma et al. (2023) [35], which indicate that the frequency magnitude is somewhat proportional to the discontinuity width. This observed phenomenon can be attributed to the reduction in the measured dielectric constant. According to [36,37,38], the dielectric constant of PLA materials typically falls within the range of 2.45 to 2.75. It is noted that the effective permittivity of PLA may vary with material grade, printing parameters, and moisture absorption; however, these factors primarily influence the baseline resonant frequency and do not alter the monotonic trend observed with increasing discontinuity width, which is the focus of the present calibrated study.
Figure 6.
Experimental setup for measuring discontinuities in PLA materials.
Table 3.
Repeatability analysis of resonant frequency measurements for the FR4 sensor when measuring surface discontinuities with a depth of 1 mm.
Table 4.
Repeatability analysis of resonant frequency measurements for the RO3210 sensor when measuring surface discontinuities with a depth of 1 mm.
Figure 7.
Transmission coefficient responses showing the resonant frequency shift for increasing groove width (0–4 mm) at a fixed groove depth of 1 mm: (a) FR4 sensor and (b) RO3210 sensor. The curves illustrate the progressive shift in the resonance as the discontinuity width increases, reflecting the perturbation of the effective permittivity in the resonator near field.
The calibration-based regression approach employed here is consistent with prior dielectric sensing studies [35,36,37,38], which similarly use measured resonant frequencies to quantify material discontinuities. This ensures that the RO3210 sensor response is physically interpretable, reproducible, and suitable for bounded detection of millimeter-scale surface and subsurface discontinuities in PLA.
However, as the discontinuity width expands, the exposed surface area of the MSRR to air (with a dielectric constant of 1) also increases. Consequently, the effective permittivity of the PLA material with controlled crack-like discontinuities gradually decreases, approaching 1. Given that the lumped capacitance (C) is directly proportional to the effective permittivity, and that fr is inversely proportional to the square root of C, as shown in (1), the resonant frequency (fr) undergoes a blue shift.
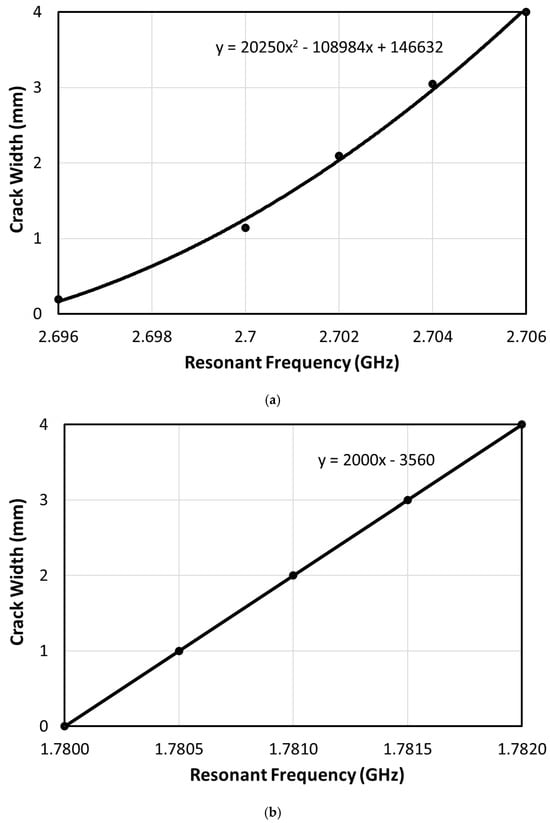
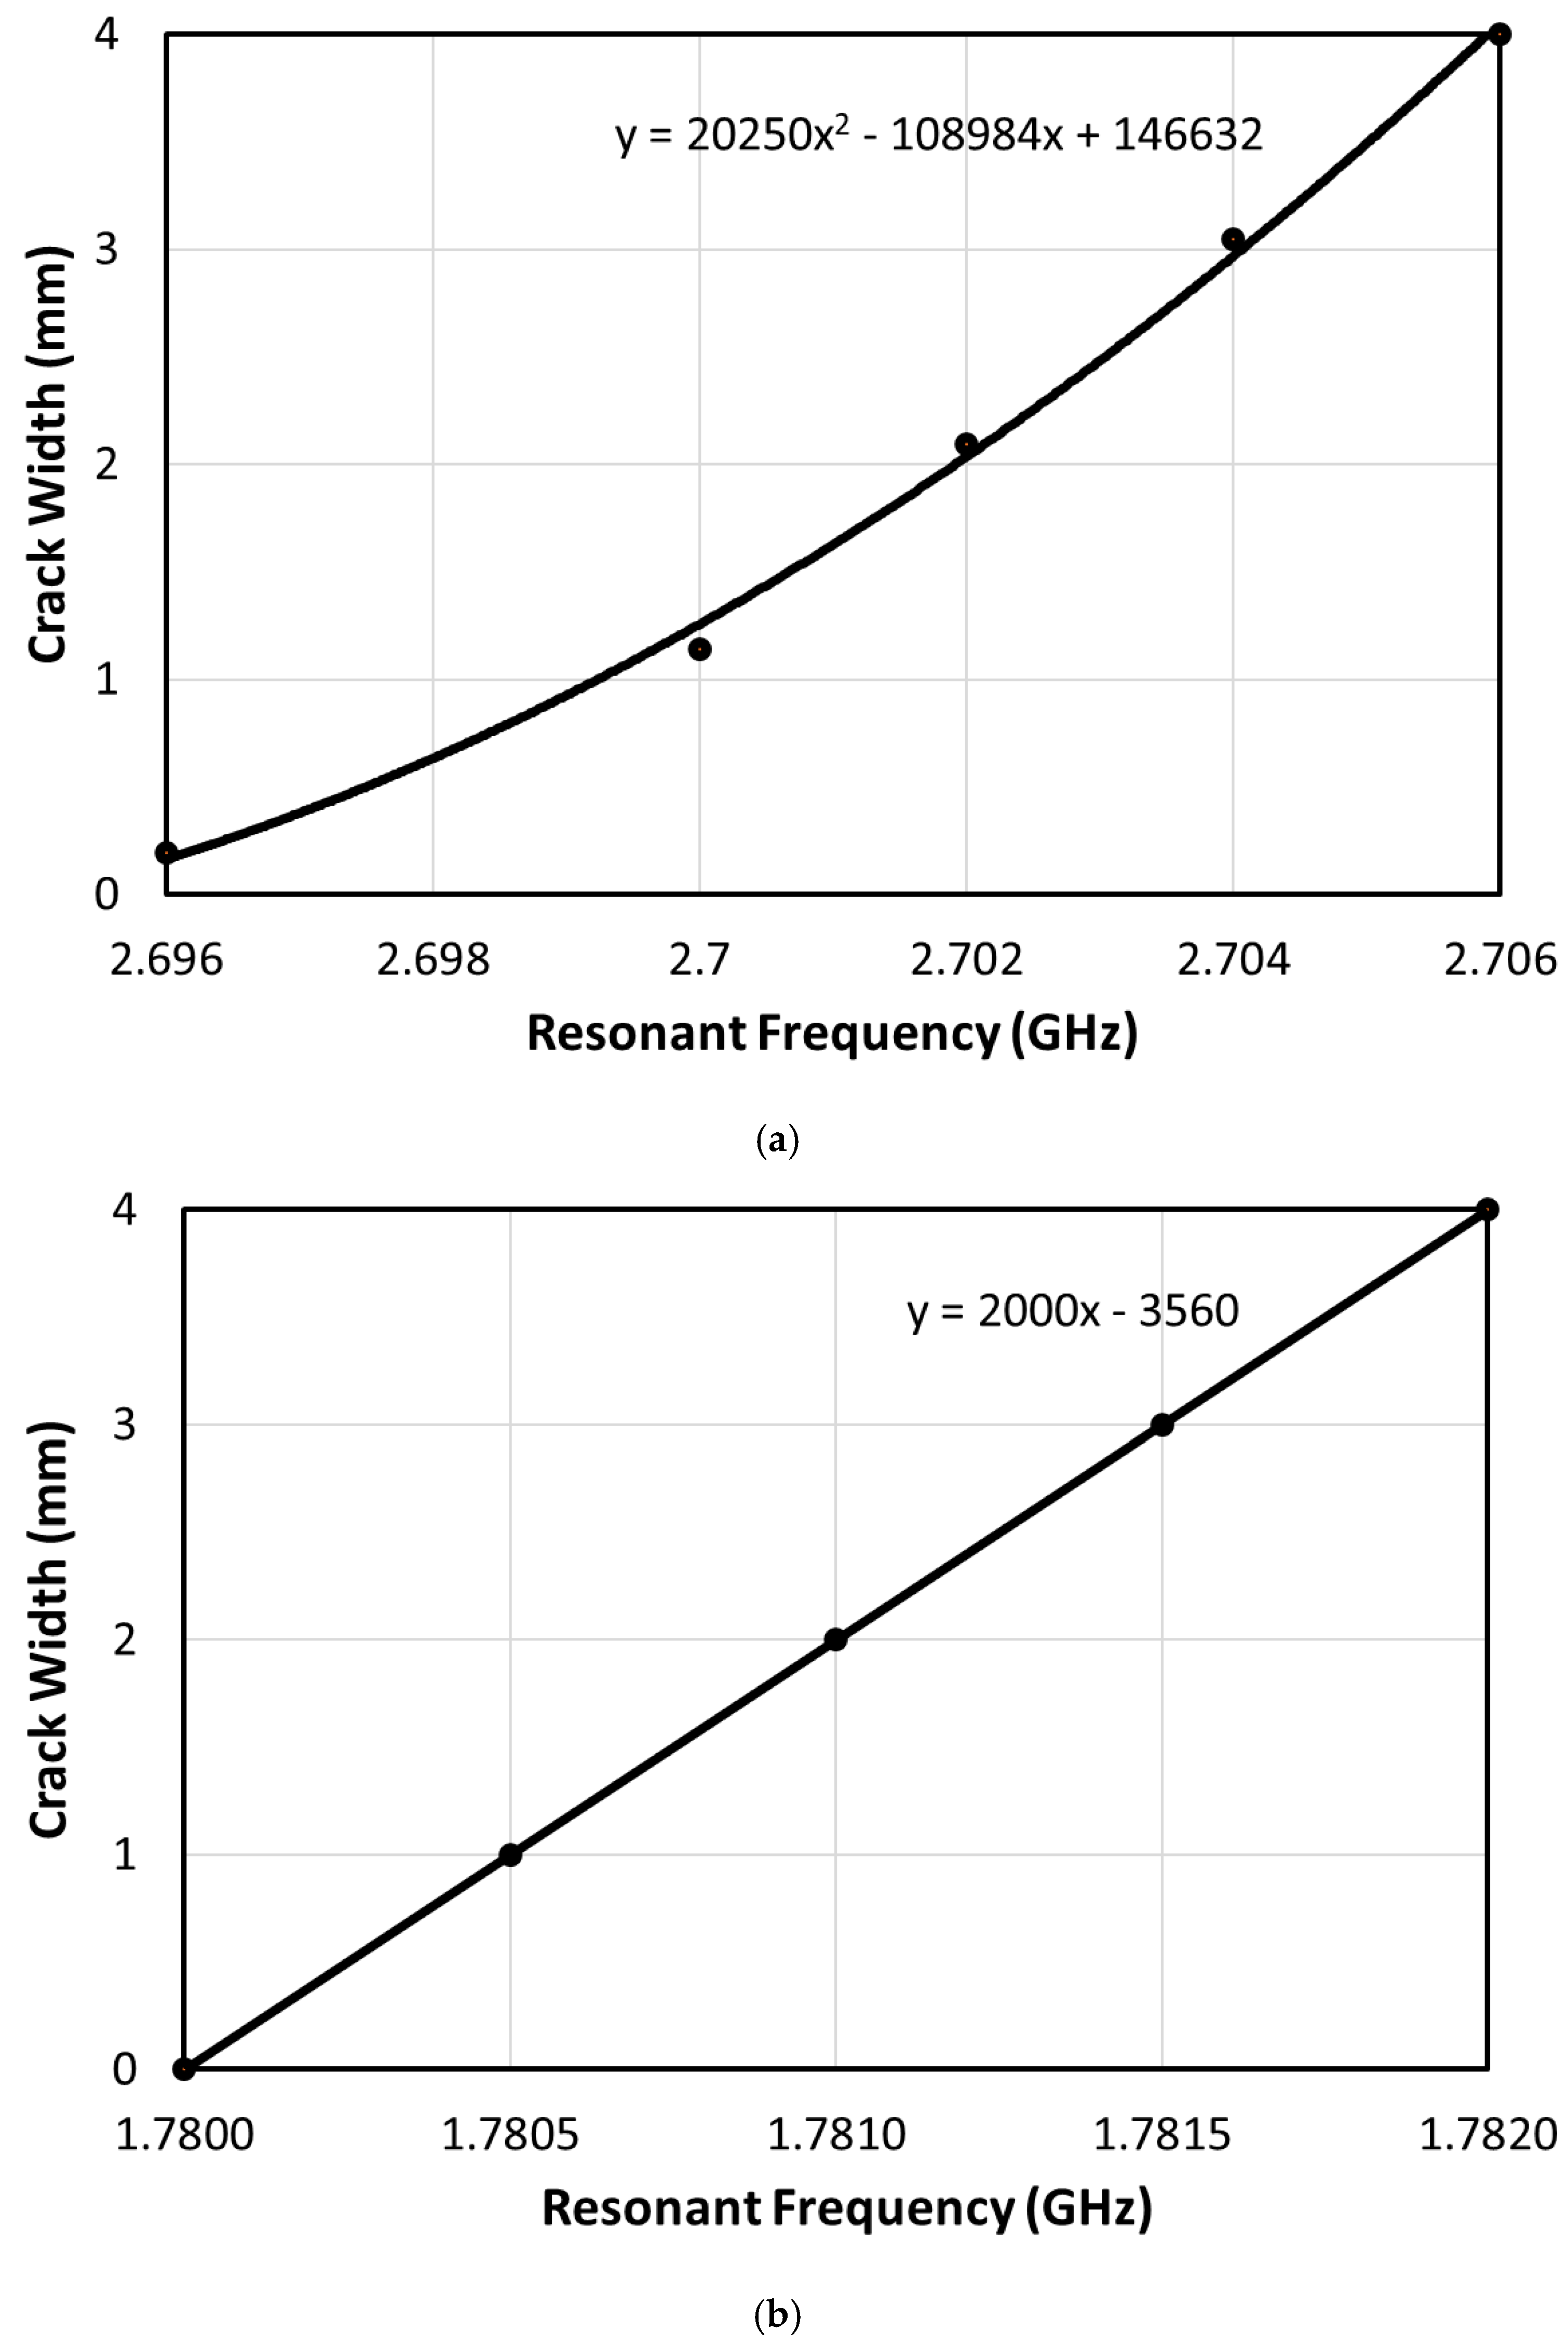
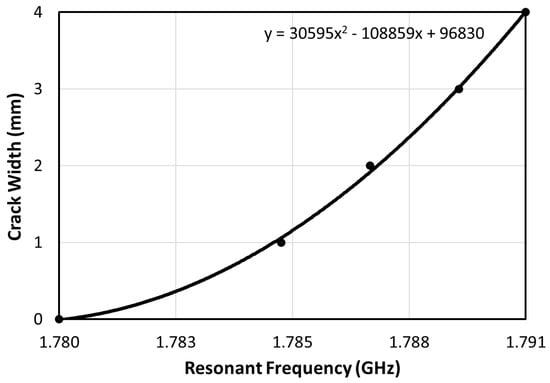
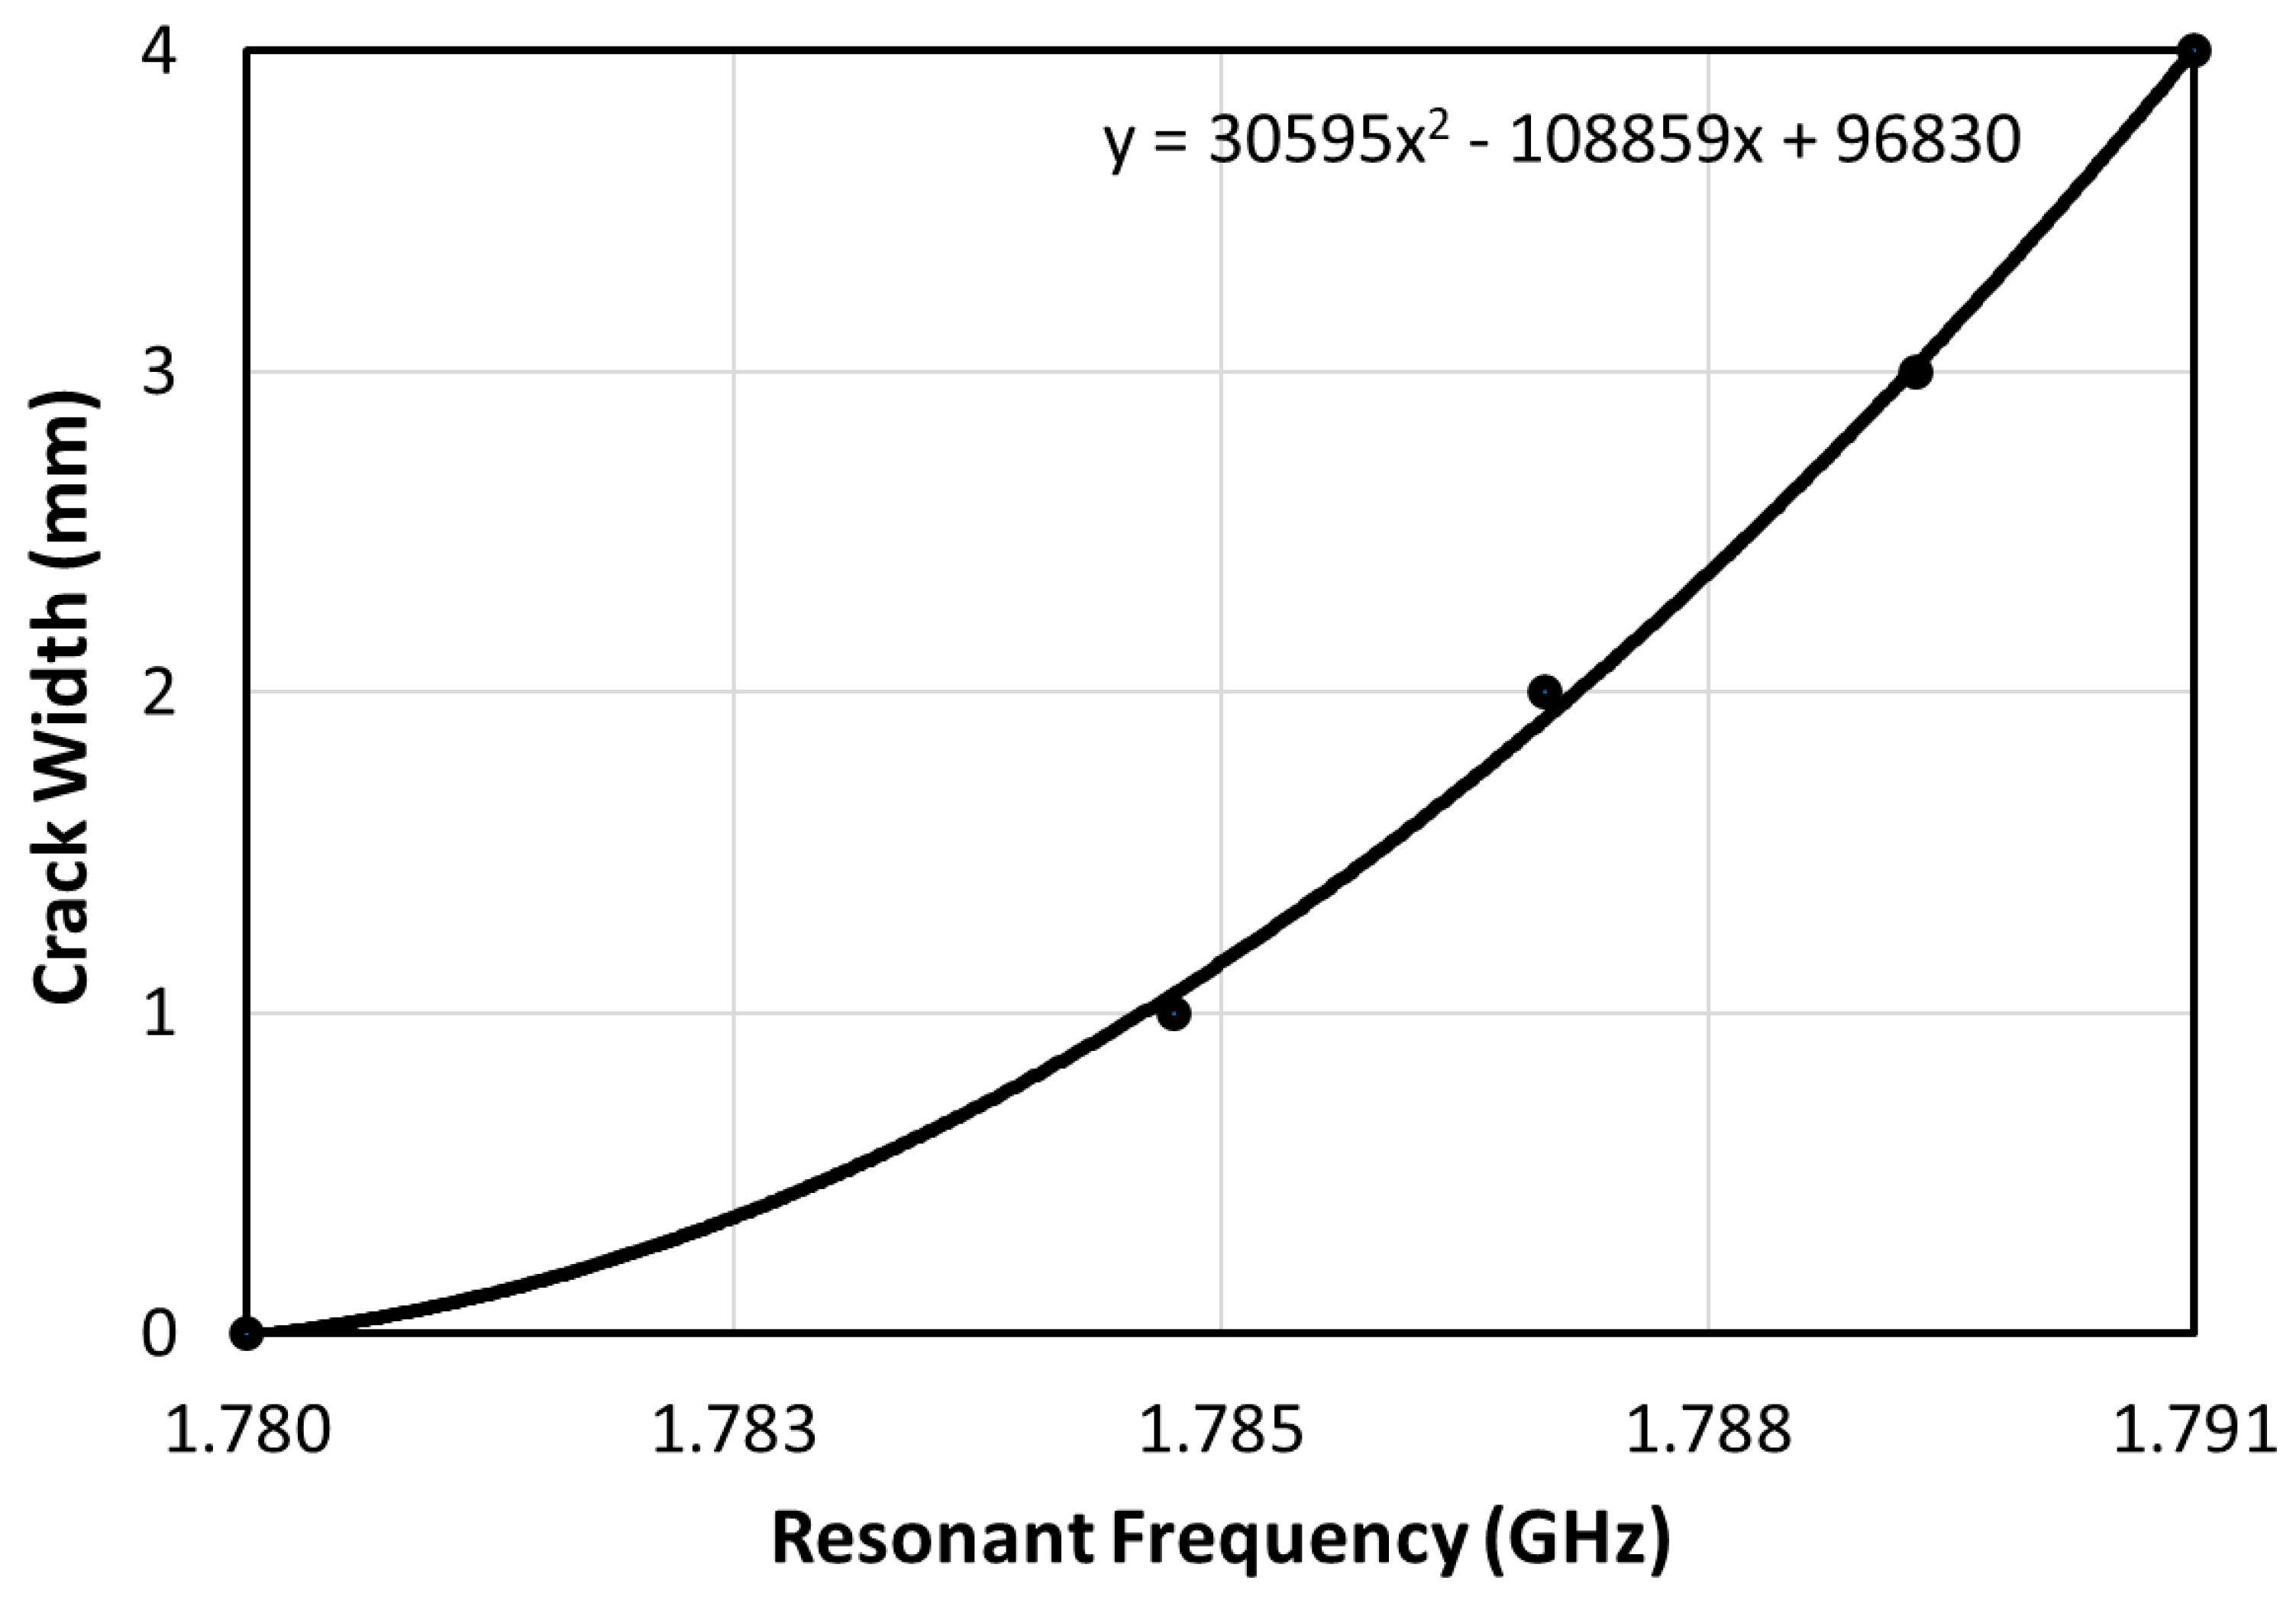
Plotting the discontinuity width (c) against the mean resonant frequency (fr) reveals a clear and monotonic relationship between them, as depicted in Figure 8. The extremely small standard deviations obtained from repeated measurements confirm that the observed frequency shifts are dominated by discontinuity geometry rather than measurement uncertainty. It is evident from these figures that the relationship derived from the FR4 and RO3210 sensors can be empirically approximated within the tested range using second-order and linear regression as summarized below:
Figure 8.
Relationship between the discontinuity width and the resonant frequency generated from the (a) FR4 and (b) RO3210 sensors when measuring a PLA discontinuity with 1 mm depth.
The statistical analysis further confirms that the measurement variability is negligible compared with the observed frequency shifts. The standard deviation across repeated measurements remains below 0.13 MHz, whereas the resonant frequency shift between successive discontinuity widths is several megahertz. This ensures that the sensor response remains clearly distinguishable and reproducible within the tested dimensional range. It should be emphasized that (2) and (3) are not intended as universal predictive models. They are calibration-based interpolation functions derived under fixed experimental conditions (material, depth, sensor geometry, and measurement setup) to enable inversion of resonant frequency to discontinuity width strictly within the discretely sampled range. Extrapolation beyond the tested widths is not implied.
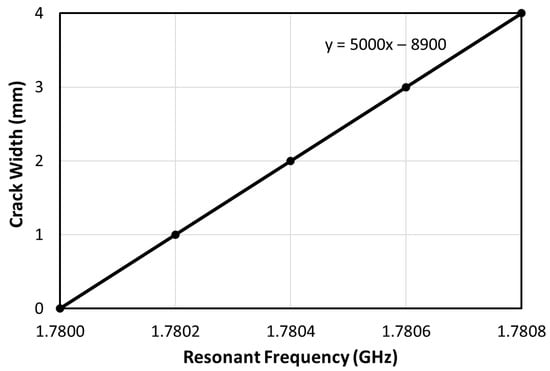
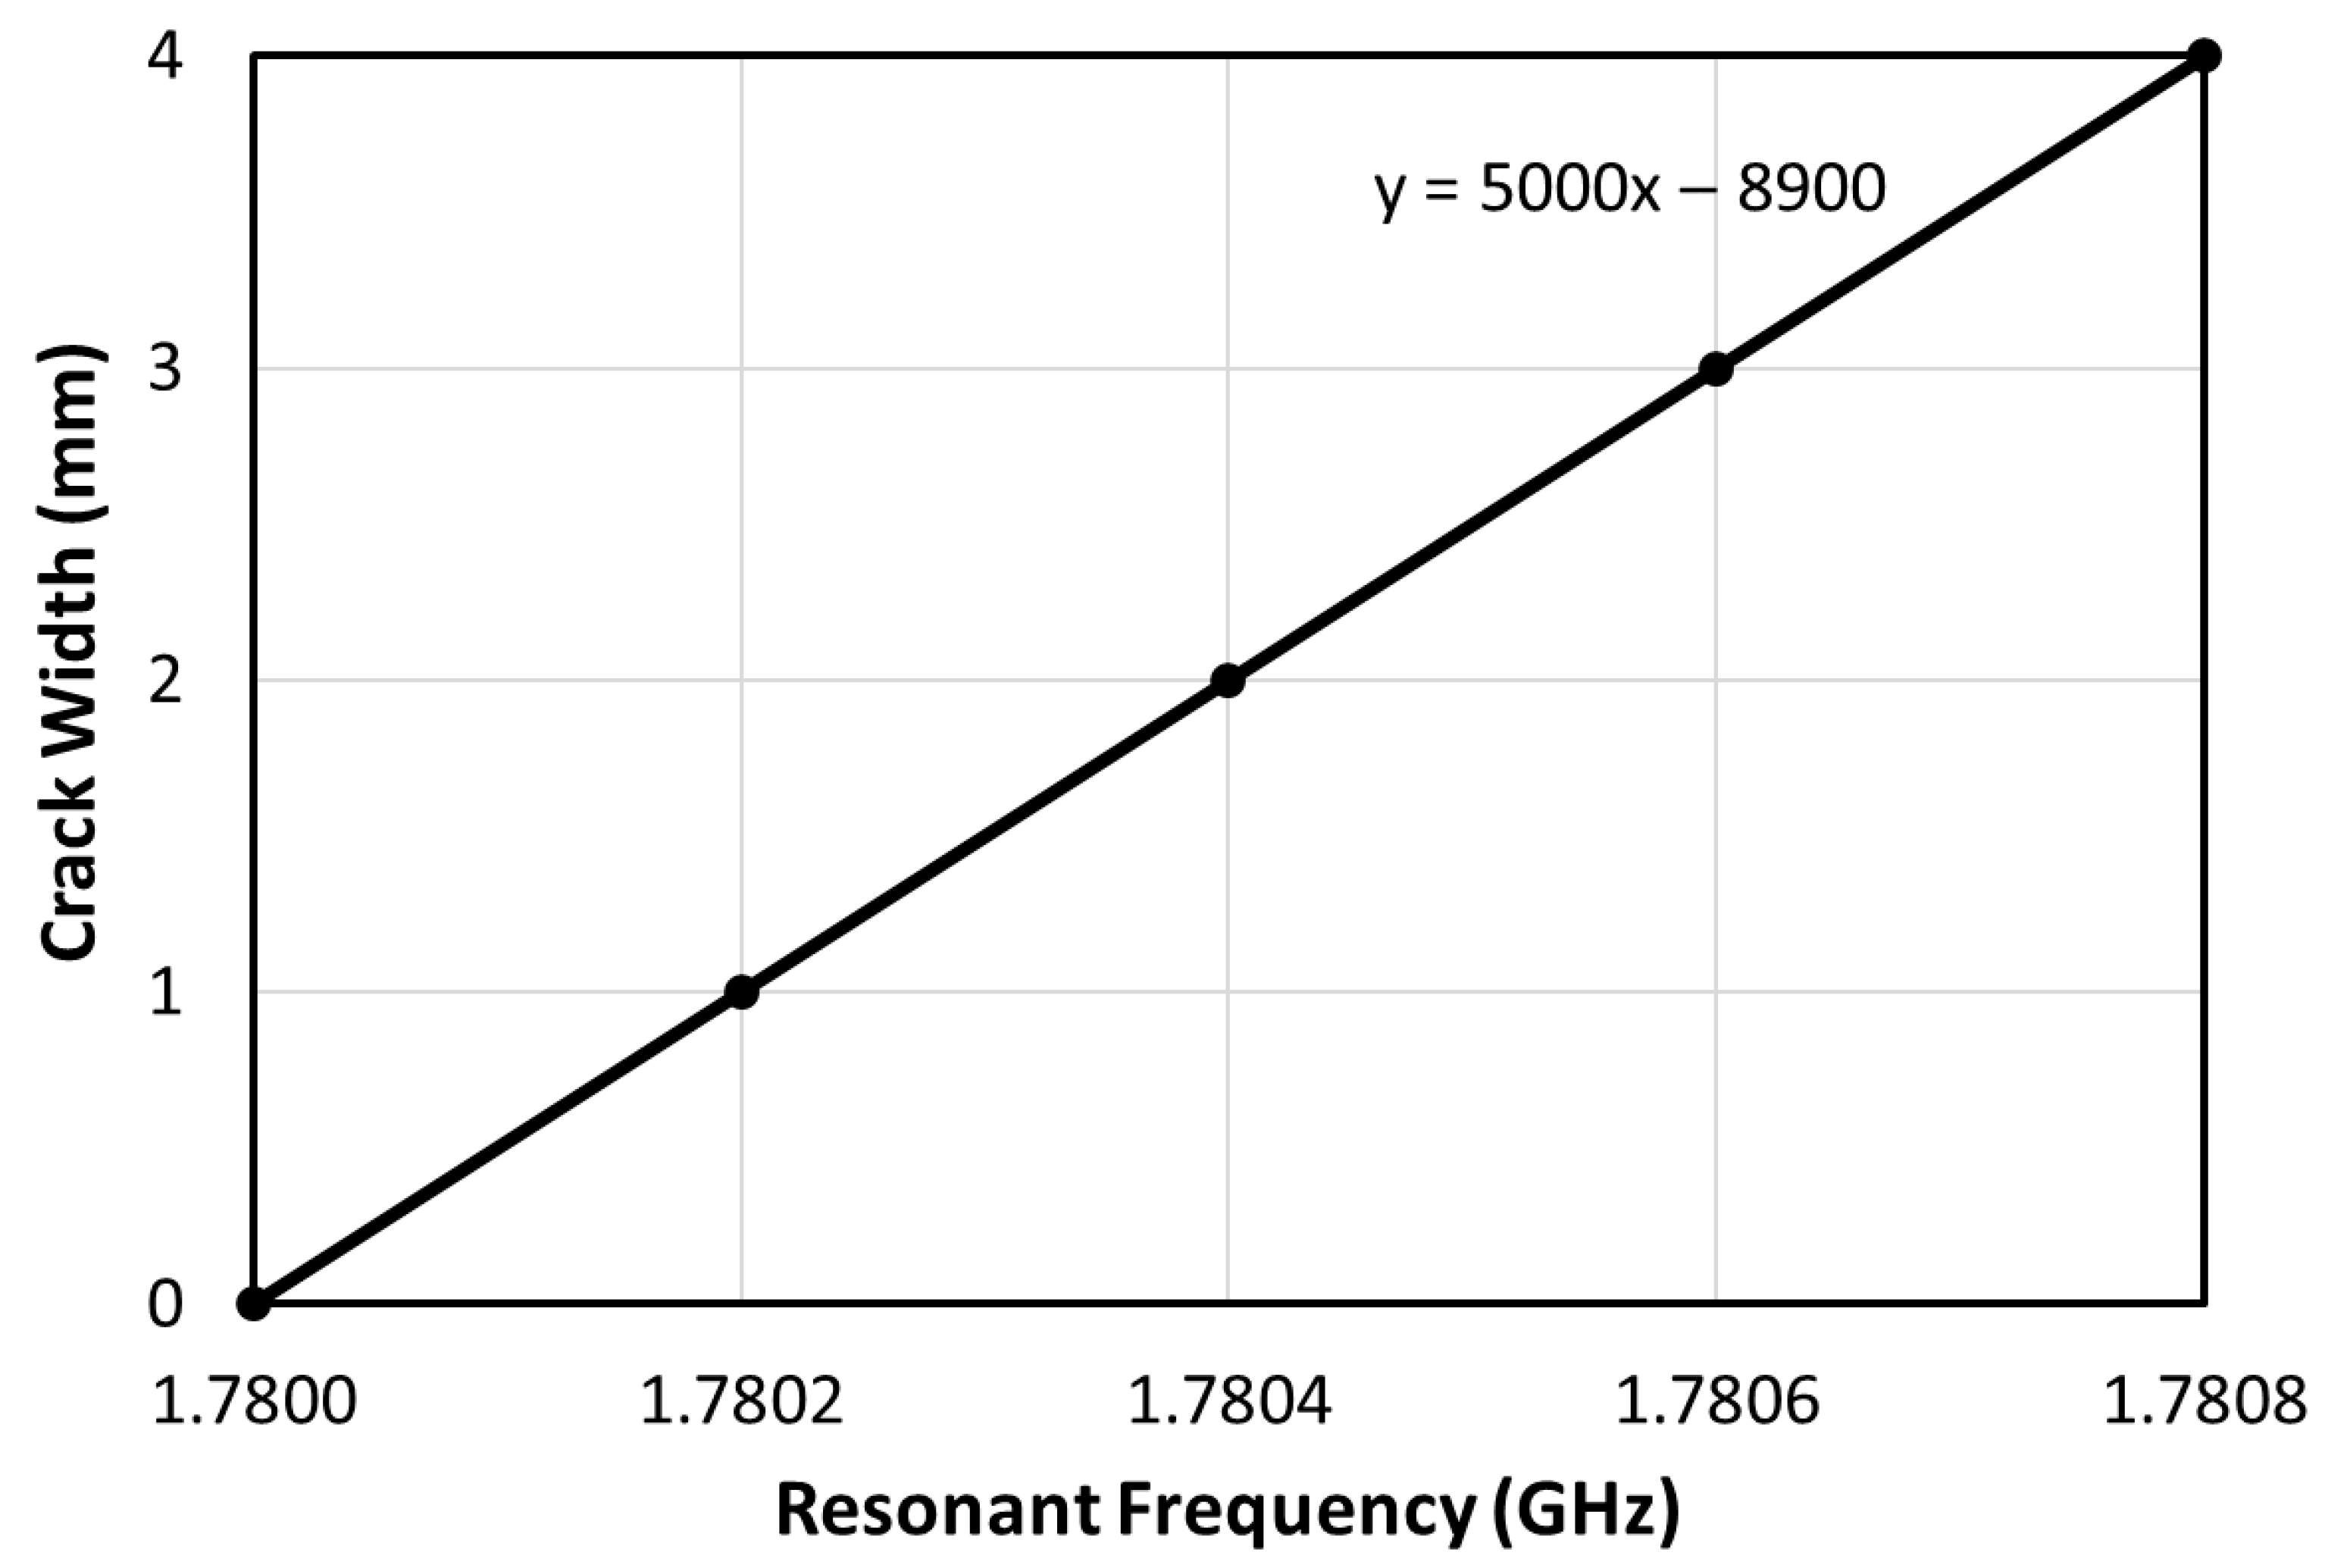
Considering the cost-effectiveness of developing a sensor resonating at a lower frequency, the RO3210 sensor emerges as the preferred choice and is therefore chosen for further analysis. Additionally, it is worth mentioning that predicting discontinuity widths using a linear regression model is relatively simpler and more straightforward. For these configurations, repeated measurements were also conducted for each discontinuity width, and the mean resonant frequencies were used to construct the regression curves. Figure 9 and Figure 10 illustrate the curves derived from the detection of surface discontinuities with a 4 mm depth and subsurface discontinuities with a 1 mm depth, respectively. It is important to note that the subsurface discontinuities are embedded within a 1 mm thick layer of PLA material. In contrast to the results in Figure 8b, the relationship between c and fr for the 4 mm deep surface discontinuity exhibits a second-order polynomial regression. On the other hand, the subsurface discontinuity at 1 mm depth maintains a linear correlation. The regression models for both cases can be mathematically expressed as follows:
Figure 9.
Relationship between the discontinuity width and the resonant frequency generated from the RO3210 sensor when measuring a PLA discontinuity with 4 mm depth.
Figure 10.
Relationship between the discontinuity width and the resonant frequency generated from the RO3210 sensor when measuring a PLA subsurface discontinuity with 1 mm depth (beneath a 1 mm thick layer).
As with (2) and (3), these expressions represent calibration-based interpolation within fixed depth configurations and are used to demonstrate repeatability and invertibility of the sensor response rather than statistical generality.
Upon examining (3) to (5), it becomes evident that the discontinuity width (c) may not always exhibit a linear correlation with the resonant frequency (fr). In certain cases, a higher-order polynomial regression may be necessary. Nevertheless, through careful calibration of their relationship at varying depths and under different conditions, such as surface or subsurface discontinuities and the depth at which subsurface discontinuities are situated, the proposed sensor demonstrates a repeatable and monotonic response to millimeter-scale crack-like discontinuities within the tested dimensional range. In resonant sensing applications, sensitivity is determined by the ability to reliably resolve frequency shifts above the system noise floor rather than by the absolute magnitude of the shift alone; in the present study, shifts on the order of a few megahertz are consistently resolved using a nanoVNA. Although the observed frequency shifts are physically predictable, their experimental quantification and calibration using a compact MSRR–CPW platform operating with a nanoVNA have not previously been reported for PLA materials. In addition to regression-based calibration, a sensitivity metric provides a physically intuitive measure of sensor performance that is independent of regression order. For the RO3210 sensor measuring a 1 mm deep surface discontinuity, the experimentally calibrated linear relationship in (3) yields an average sensitivity of ≈ 0.5 MHz/mm. This value is obtained directly from the slope of the calibrated frequency–width relationship and reflects the resolvable frequency shift per unit change in discontinuity width within the tested range. The consistent monotonic increase in resonant frequency with increasing discontinuity width confirms that this sensitivity is repeatable and sufficient for calibrated discrimination of millimeter-scale crack-like discontinuities using a nanoVNA-based measurement system.
3. Results and Discussion
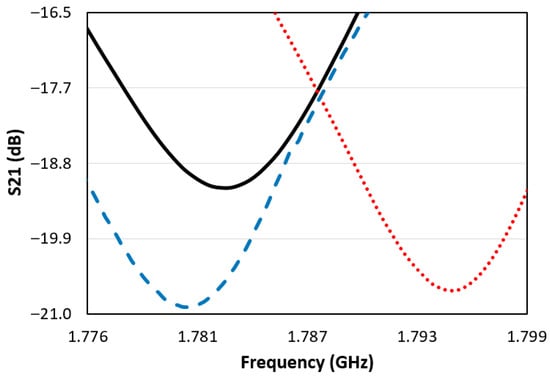
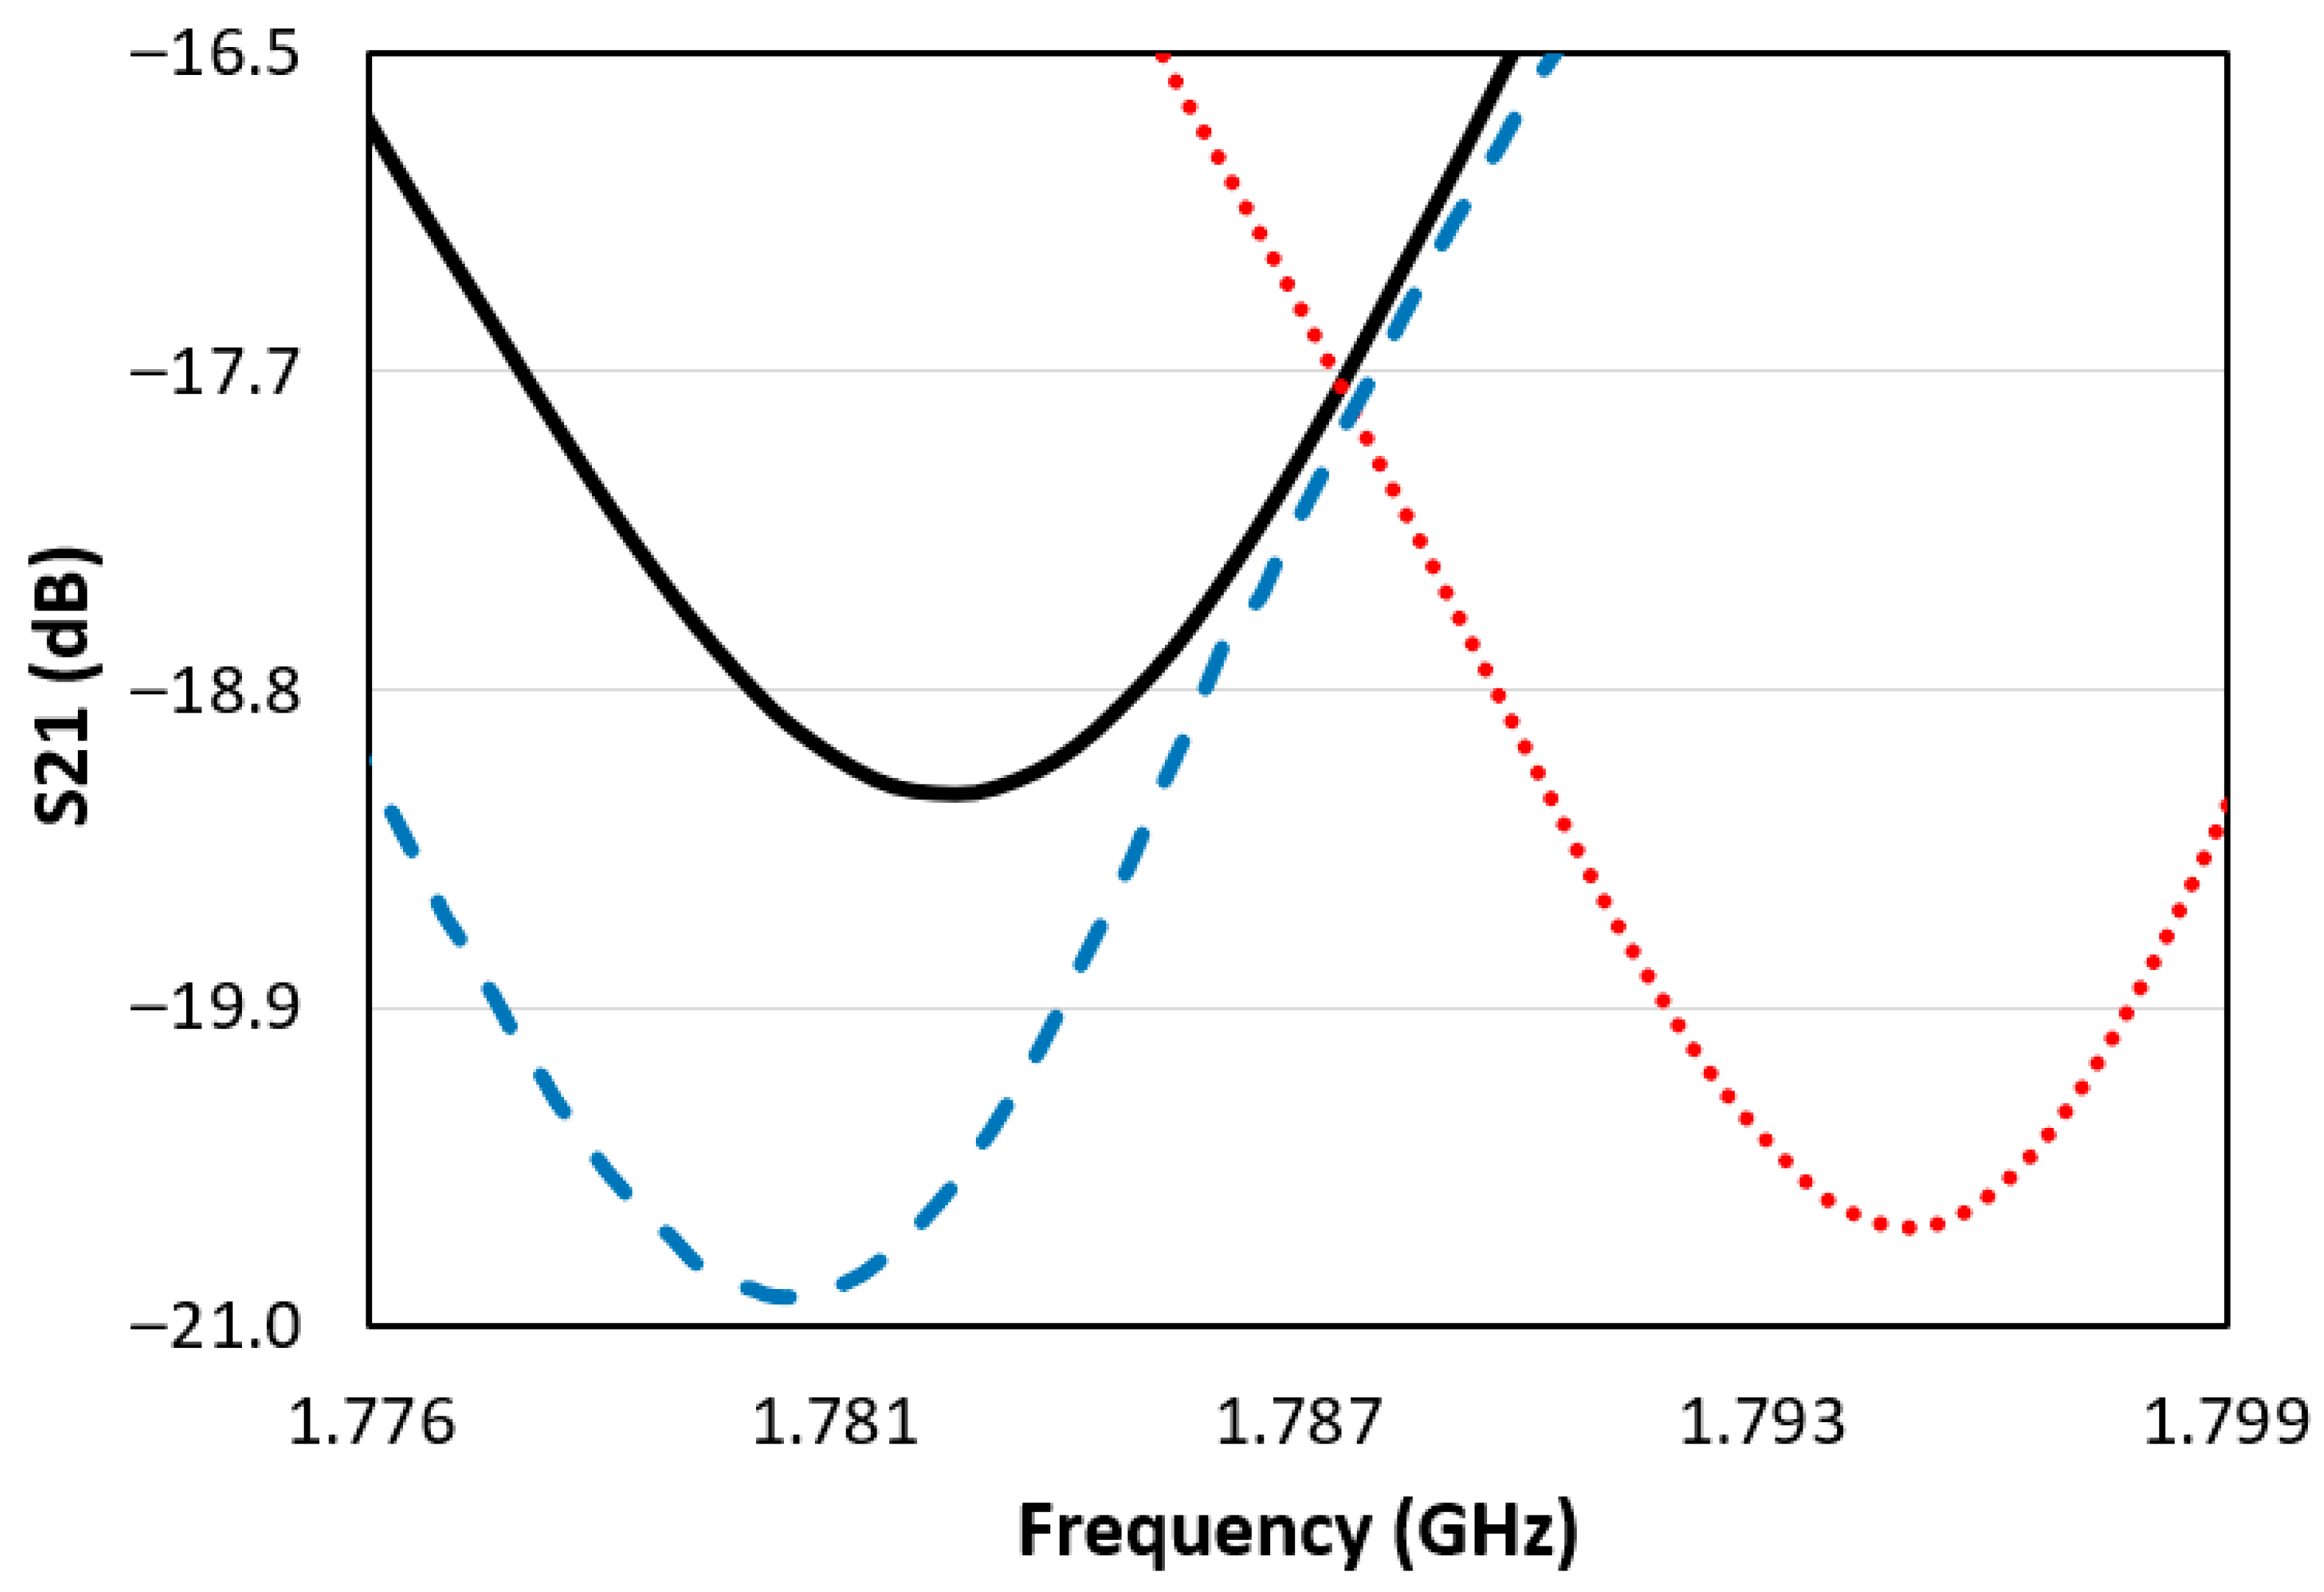
To validate the performance of the proposed RO3210 sensor, three types of Samples Under Test (SUTs) corresponding to (3) to (5) were selected. This entails two SUTs representing surface discontinuities with depths of 1 mm and 4 mm, and the third being a subsurface discontinuity with a depth of 1 mm. In all three cases, the discontinuity widths were set at 5 mm. Figure 11 displays the measured transmission coefficients for these three SUTs. The resonant frequencies obtained for the 1 mm and 4 mm deep surface discontinuities and the subsurface discontinuity are 1.7825 GHz, 1.7945 GHz, and 1.7810 GHz, respectively. By substituting these values into (3) to (5), it is apparent that the discontinuity width (c) is equivalent to 5 mm for all three scenarios. These values precisely align with the predetermined dimensions, thus confirming the consistency of the calibrated sensor response within the tested dimensional range. This validation should be interpreted as confirmation of internal consistency within the calibrated range rather than as evidence of universal crack-width predictability. The validation experiments were carefully designed to cover both surface and subsurface discontinuities with controlled widths and depths. The measured resonant frequencies were used in the calibrated regression models, demonstrating precise agreement with the actual discontinuity dimensions. These results confirm the repeatable, monotonic, and physically interpretable response of the RO3210 sensor within the tested dimensional range. The methodology therefore represents a fully implemented and experimentally validated approach for millimeter-scale discontinuity detection in PLA materials.
Figure 11.
Measured transmission coefficient (S21) responses of the RO3210-based sensor for PLA groove-based crack-like discontinuities with a fixed width of 5 mm under different configurations: surface groove with 1 mm depth (solid black line), surface groove with 4 mm depth (dotted red line), and subsurface groove with 1 mm depth located 1 mm below the surface (dashed blue line). The corresponding resonant transmission dips occur at approximately 1.7825 GHz, 1.7945 GHz, and 1.7810 GHz, respectively.
4. Conclusions
A cost-effective and portable planar microwave sensor has been demonstrated for detecting surface and subsurface discontinuities in PLA materials. After careful consideration, RO3210, chosen for its lower dielectric loss and associated lower resonant frequency and higher resonator quality factor, emerged as the optimal substrate material. The sensor is compact, measuring 30 mm × 50 mm × 1.27 mm. Through meticulous calibration and regression analysis, the sensor enables calibrated estimation of discontinuity widths at varying depths within the tested range. The calibrated response of the proposed sensor was substantiated through validation using three distinct Samples Under Test (SUTs) with 5 mm discontinuity widths. The reported regression expressions serve as calibration tools for bounded inversion, while sensitivity () provides a more general and physically interpretable indicator of sensor performance.
By applying near-field microwave sensing concepts to PLA materials, the proposed methodology provides a physically interpretable, reproducible, and bounded framework for millimeter-scale discontinuity detection, effectively extending prior work [25,26,27,28,29,30,31,32,33,34,35,36,37,38] to a new material system.
While surface-visible millimeter-scale discontinuities may be detectable by visual inspection, the ability to estimate the size of embedded discontinuities without destructive access remains a practical advantage of near-field microwave sensing in polymer components. The current study is limited to millimeter-scale discontinuities. Extension to micro-scale fatigue cracks would require higher-Q resonators, operation at higher frequencies, or alternative sensor geometries, and is identified as an important direction for future work.
Future work may extend the present framework toward the detection of smaller and more realistic crack morphologies approaching sub-millimeter scales. Improvements in sensitivity could also be achieved through the use of higher-Q resonators, lower-loss substrates, or multi-resonant sensor architectures. In addition, spatial localization of discontinuities may be explored through scanning configurations or resonator arrays that provide distributed sensing coverage. The methodology may further be generalized to other polymeric or composite materials commonly used in additive manufacturing. Finally, advanced data-driven inversion techniques, including machine learning models, could be investigated to improve defect characterization beyond simple regression-based calibration.
Author Contributions
Conceptualization, P.L.T.; Methodology, S.H.L.; Validation, H.K.L.; Formal analysis, K.W.T. and N.E.; Investigation, M.H.T. and F.W.L.; Data curation, Y.J.W. and F.W.L.; Writing—original draft, K.H.Y.; Writing—review & editing, N.F.A.R.; Supervision, K.W.T.; Project administration, K.H.Y. All authors have read and agreed to the published version of the manuscript.
Funding
This research received no external funding.
Data Availability Statement
The data presented in this study are available on request from the corresponding author.
Conflicts of Interest
The authors declare no conflicts of interest.
References
- Joseph, T.M.; Kallingal, A.; Suresh, A.M.; Mahapatra, D.K.; Hasanin, M.S.; Haponiuk, J.; Thomas, S. 3D printing of polylactic acid: Recent advances and opportunities. Int. J. Adv. Manuf. Technol. 2023, 125, 1015–1035. [Google Scholar] [CrossRef] [Scilit] [PubMed]
- DeStefano, V.; Khan, S.; Tabada, A. Applications of PLA in modern medicine. Eng. Regen. 2020, 1, 76–87. [Google Scholar] [CrossRef] [Scilit]
- Tümer, E.H.; Erbil, H.Y. Extrusion-based 3D printing applications of PLA composites: A review. Coatings 2021, 11, 390. [Google Scholar] [CrossRef] [Scilit]
- Zoidis, N.; Tatsis, E.; Vlachopoulos, C.; Clausen, J.S.; Matikas, T.E.; Aggelis, D.G.; Gkotzamanis, A. Visual inspection and evaluation using NDT testing methods of extensively cracked concrete floor. In Proceedings of the 5th International Conference on Emerging Technologies in Non-Destructive Testing, Ioannina, Greece, 19–21 September 2011; pp. 503–507. [Google Scholar]
- Shah, J.; El-Hawwat, S.; Wang, H. Guided wave ultrasonic testing for crack detection in polyethylene pipes: Laboratory experiments and numerical modeling. Sensors 2023, 23, 5131. [Google Scholar] [CrossRef] [Scilit]
- Zhou, Y.; Cao, Y.; Wang, N.; Wahab, M.A. Crack detection in L-shaped aluminum plate via electromagnetic ultrasonic measurements. Theor. Appl. Fract. Mech. 2022, 121, 103534. [Google Scholar] [CrossRef] [Scilit]
- Her, S.C.; Lin, S.T. Non-destructive evaluation of depth of surface cracks using ultrasonic frequency analysis. Sensors 2014, 14, 17146–17158. [Google Scholar] [CrossRef] [Scilit]
- Lopez, A.; Bacelar, R.; Pires, I.; Santos, T.G.; Sousa, J.P.; Quintino, L. Non-destructive testing application of radiography and ultrasound for wire and arc additive manufacturing. Addit. Manuf. 2018, 21, 298–306. [Google Scholar] [CrossRef] [Scilit]
- Ooka, N.; Takita, M.; Yokota, K. Application of digital radiographic testing techniques to thick material using high-energy X-ray. In Proceedings of the 15th Asia Pacific Conference for Non-Destructive Testing, Singapore, 13–17 November 2017. [Google Scholar]
- Li, L.; Yang, Y.; Cai, X.; Kang, Y. Investigation on the formation mechanism of crack indications and the influences of related parameters in magnetic particle inspection. Appl. Sci. 2020, 10, 6805. [Google Scholar] [CrossRef] [Scilit]
- Liu, J.; Yu, H.; Mei, L.; Han, B. Development of a new type of automatic magnetic particle inspection wall-climbing robot. Adv. Mech. Eng. 2021, 13, 16878140211047339. [Google Scholar] [CrossRef] [Scilit]
- Chen, Y.; Feng, B.; Kang, Y.; Liu, B.; Wang, S.; Duan, Z. A novel thermography-based dry magnetic particle testing method. IEEE Trans. Instrum. Meas. 2022, 71, 1–9. [Google Scholar] [CrossRef] [Scilit]
- Oswald-Tranta, B. Induction thermography for surface crack detection and depth determination. Appl. Sci. 2018, 8, 257. [Google Scholar] [CrossRef] [Scilit]
- Farag, H.E.; Toyserkani, E.; Khamesee, M.B. Non-destructive testing using eddy current sensors for defect detection in additively manufactured titanium and stainless-steel parts. Sensors 2022, 22, 5440. [Google Scholar] [CrossRef] [Scilit] [PubMed]
- Zenzinger, G.; Bamberg, J.; Satzger, W.; Carl, V. Thermographic crack detection by eddy current excitation. Nondestruct. Test. Eval. 2007, 22, 101–111. [Google Scholar] [CrossRef] [Scilit]
- García-Martín, J.; Gómez-Gil, J.; Vázquez-Sánchez, E. Non-destructive techniques based on eddy current testing. Sensors 2011, 11, 2525–2565. [Google Scholar] [CrossRef] [Scilit] [PubMed]
- Chow, P.; Tanaka, S.; Zhang, L.; Emoto, S. AI detection and classification of cracks with acoustic shearography imaging data. In Proceedings of the 12th International Symposium on NDT in Aerospace, Williamsburg, VA, USA, 6–8 October 2020; pp. 6–8. [Google Scholar]
- Wang, G.; Peter, W.T.; Yuan, M. Automatic internal crack detection from a sequence of infrared images with a triple-threshold Canny edge detector. Meas. Sci. Technol. 2018, 29, 025403. [Google Scholar] [CrossRef] [Scilit]
- Kong, Y.; Bennett, C.J.; Hyde, C.J. A review of non-destructive testing techniques for the in-situ investigation of fretting fatigue cracks. Mater. Des. 2020, 196, 109093. [Google Scholar] [CrossRef] [Scilit]
- Ivanchev, I.; Slavchev, V. About the possible limitations in the usage of the non-destructive ultrasonic pulse velocity method for assessment of cracks in reinforced concrete structures, subjected to direct environmental exposure. Buildings 2019, 9, 202. [Google Scholar] [CrossRef] [Scilit]
- Xie, R.; Chen, D.; Pan, M.; Tian, W.; Wu, X.; Zhou, W.; Tang, Y. Fatigue crack length sizing using a novel flexible eddy current sensor array. Sensors 2015, 15, 32138–32151. [Google Scholar] [CrossRef] [Scilit]
- Shaloo, M.; Schnall, M.; Klein, T.; Huber, N.; Reitinger, B. A review of non-destructive testing techniques for defect detection: Application to fusion welding and future wire arc additive manufacturing processes. Materials 2022, 15, 3697. [Google Scholar] [CrossRef] [Scilit]
- Mohseni, E.; Habibzadeh Boukani, H.; Ramos França, D.; Viens, M. A study of automated eddy current detection of cracks in steel plates. J. Nondestruct. Eval. 2020, 39, 6. [Google Scholar] [CrossRef] [Scilit]
- Anandika, R.; Lundberg, J. Limitations of eddy current inspection for characterization of near-surface cracks in railheads. Proc. Inst. Mech. Eng. Part F J. Rail Rapid Transit 2022, 236, 532–544. [Google Scholar] [CrossRef] [Scilit]
- Shrifan, N.H.M.M.; Jawad, G.N.; Isa, N.A.M.; Akbar, M.F. Microwave nondestructive testing for defect detection in composites based on K-means clustering algorithm. IEEE Access 2021, 9, 4820–4828. [Google Scholar] [CrossRef] [Scilit]
- Yang, L.; Kou, H.; Wang, X.; Zhang, X.; Shang, Z.; Shi, J.; Zhang, G.; Gui, Z. A microwave pressure sensor loaded with complementary split-ring resonator for high-temperature applications. Micromachines 2023, 14, 635. [Google Scholar] [CrossRef] [Scilit]
- Lin, X.; Long, Z.; Jiang, L.; Liu, Z.; Liu, C.; Chen, Z. 3D printed crack-free SiOC (Fe) structures with pyrolysis-induced carbon nanowires for enhanced wave absorption performance. Ceram. Int. 2023, 49, 33205–33213. [Google Scholar] [CrossRef] [Scilit]
- Yang, X.; Yin, Y.; Zhang, D.; Wu, S.; Huang, K.; Yuan, J.; Zhu, Z. Array waveguide probe loaded with split-ring resonators for sizing cracks on metal surfaces. IEEE Microw. Wirel. Compon. Lett. 2018, 28, 171–173. [Google Scholar] [CrossRef] [Scilit]
- Salim, A.; Naqvi, A.H.; Pham, A.D.; Lim, S. Complementary split-ring resonator-loaded sensor array to detect multiple cracks: Shapes, sizes, and positions on metallic surfaces. IEEE Access 2020, 8, 151804–151816. [Google Scholar] [CrossRef] [Scilit]
- Kim, Y.; Park, E.; Salim, A.; Kim, J.; Lim, S. Microwave dual-crack sensor with a high Q-factor using the TE20 resonance of a complementary split-ring resonator. Micromachines 2023, 14, 578. [Google Scholar] [CrossRef] [Scilit] [PubMed]
- Qian, B.; Mou, L.; Wu, L.; Xiao, Z.; Hu, T.; Jiang, J. A direction-sensitive microwave sensor for metal crack detection. Appl. Sci. 2022, 12, 9045. [Google Scholar] [CrossRef] [Scilit]
- Albishi, A.M.; Ramahi, O.M. Microwave-based high sensitivity sensors for crack detection in metallic materials. IEEE Trans. Microw. Theory Tech. 2017, 65, 1864–1872. [Google Scholar] [CrossRef] [Scilit]
- Yeap, K.H.; Gan, A.J.H.; Oh, Z.X.; Hirasawa, K.; Teh, P.C. Resonant characteristics of two closely arranged split-ring resonators. J. Fiz. Malays. 2024, 45, 10046–10061. [Google Scholar]
- Oh, Z.X.; Yeap, K.H.; Teh, P.C.; Dakulagi, V. Circular split-ring resonator-based sensor for dielectric constant measurement. Microw. Opt. Technol. Lett. 2023, 65, 513–518. [Google Scholar] [CrossRef] [Scilit]
- Nongpromma, S.; Janin, S.; Kaemarungsi, K.; Boonpoonga, A.; Torrungrueng, D.; Bannawat, L. Crack detection for non-metallic material using split-ring resonator-based chipless RFID sensor. In Proceedings of the 20th International Conference on Electrical Engineering/Electronics, Computer, Telecommunications and Information Technology, Nakhon Phanom, Thailand, 9–12 May 2023; pp. 1–4. [Google Scholar] [CrossRef] [Scilit]
- Proesmans, R.; Deprez, K.; Velghe, M.; Thielens, A. An on-body antenna for control of a wireless prosthesis in the 2.45 GHz industrial scientific and medical frequency band. IET Microw. Antennas Propag. 2022, 16, 919–932. [Google Scholar] [CrossRef] [Scilit]
- Colella, R.; Chietera, F.P.; Catarinucci, L. Analysis of FDM and DLP 3D-printing technologies to prototype electromagnetic devices for RFID applications. Sensors 2021, 21, 897. [Google Scholar] [CrossRef] [Scilit] [PubMed]
- Felício, J.M.; Fernandes, C.A.; Costa, J.R. Complex permittivity and anisotropy measurement of 3D-printed PLA at microwaves and millimeter waves. In Proceedings of the 22nd International Conference on Applied Electromagnetics and Communications, Dubrovnik, Croatia, 19–21 September 2016; pp. 1–6. [Google Scholar] [CrossRef] [Scilit]

Disclaimer/Publisher’s Note: The statements, opinions and data contained in all publications are solely those of the individual author(s) and contributor(s) and not of MDPI and/or the editor(s). MDPI and/or the editor(s) disclaim responsibility for any injury to people or property resulting from any ideas, methods, instructions or products referred to in the content. |
© 2026 by the authors. Licensee MDPI, Basel, Switzerland. This article is an open access article distributed under the terms and conditions of the Creative Commons Attribution (CC BY) license.