


Abstract
Polyethylene (PE) microplastics are increasingly recognized as a critical environmental and food-safety concern; however, routine monitoring remains limited by conventional methods that are labor-intensive, time-consuming, and difficult to translate into rapid, on-site screening. Here, we report a machine learning-guided electrochemical fingerprinting platform for rapid PE microplastic detection using a chitosan–PE interfacial film coupled with electrochemical impedance spectroscopy (EIS) and coulometry. The platform generated concentration-dependent electrical fingerprints in artificial ocean water, captured through Bode, Nyquist, and charge–time responses. Quantification was achieved across 1–256 ng/mL with strong linearity (R2 = 0.976) and an ultralow LoD of 0.1 ng/mL, demonstrating high analytical sensitivity. Practical applicability was validated through spike–recovery in ocean water (R2 = 0.967) and shrimp-derived matrices with matrix-matched normalization, yielding recoveries of 90–105% across low, mid, and high spike levels. Under the tested particle set, PE produced stronger responses than non-target polypropylene (PP) and polystyrene (PS), supporting empirical polymer discrimination. Machine learning classification using impedance-derived features achieved an AUC = 0.98, with 100% correct identification of Low and 95.24% correct identification of High samples. Overall, this electrochemical–ML framework enables rapid, sensitive, and matrix-tolerant PE microplastic screening in environmental water and seafood-related matrices, offering a promising pathway toward portable microplastic monitoring.
1. Introduction
Plastic debris has emerged as a pervasive pollutant, breaking down into microplastics (MPs) that contaminate nearly every corner of the planet [1,2]. These microscopic fragments are now detected in municipal wastewater effluents, remote marine habitats, food items, and drinking water, raising concerns about the impacts on the ecosystem and human health [3]. In marine environments, MPs are ingested by a wide range of organisms, from zooplankton to fish, often with severe consequences, including internal injury, impaired feeding, and reduced reproductive success [4]. The hydrophobic surfaces of microplastics can adsorb persistent organic pollutants and heavy metals, making them carriers of toxic compounds that can be transferred through the food web [5]. Evidence shows that MPs transfer along aquatic food chains and ultimately accumulate in humans via seafood consumption. Disturbingly, scientists have even identified microplastic particles in human placenta and urine, highlighting direct human exposure to this pollution. A landmark biomonitoring study quantified common plastics such as polyethylene (PE) and polystyrene (PS) in human blood [6], reinforcing microplastics as a potential concern for food safety and public health. Regulatory actions and industry initiatives aimed at curbing emissions and standardizing testing further underscore the need for reliable detection methods to inform policy and assess mitigation efforts.
Despite growing awareness, monitoring microplastics in environmental and food matrices remains a significant analytical challenge [7]. Current detection techniques primarily rely on laborious laboratory analyses, which are ill-suited for rapid or in situ monitoring. Standard protocols involve sampling large volumes of water or biota, isolating MPs by density separation or filtration, and then identifying particles via microscopy or spectroscopy [8]. Microscope-based visual inspection can distinguish between suspected plastics and natural debris [9], but it is error-prone and cannot confirm polymer type, especially for very small or translucent particles [10,11]. FTIR and Raman provide polymer fingerprints [12] yet struggle with size limits, fluorescence, long scan times, and complex sample backgrounds. Py-GC/MS is a particular but destructive method, expensive, and it loses particle size/count information. Overall, current methods are slow, labor-intensive, and inconsistent, creating a need for rapid, sensitive, and field-deployable detection of trace microplastics in real samples.
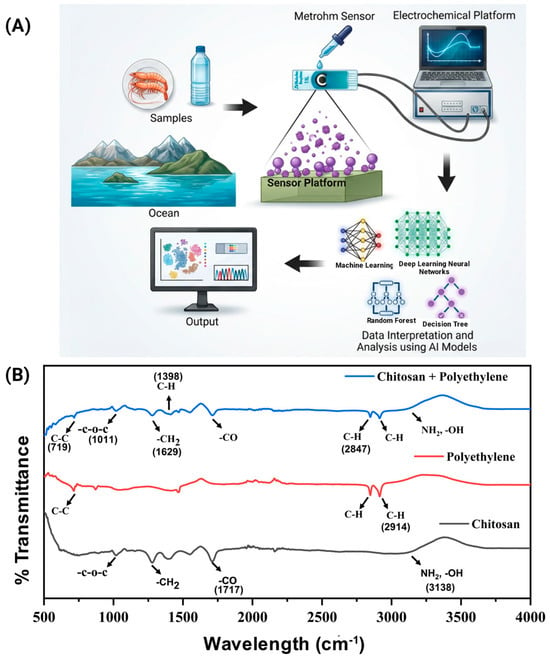
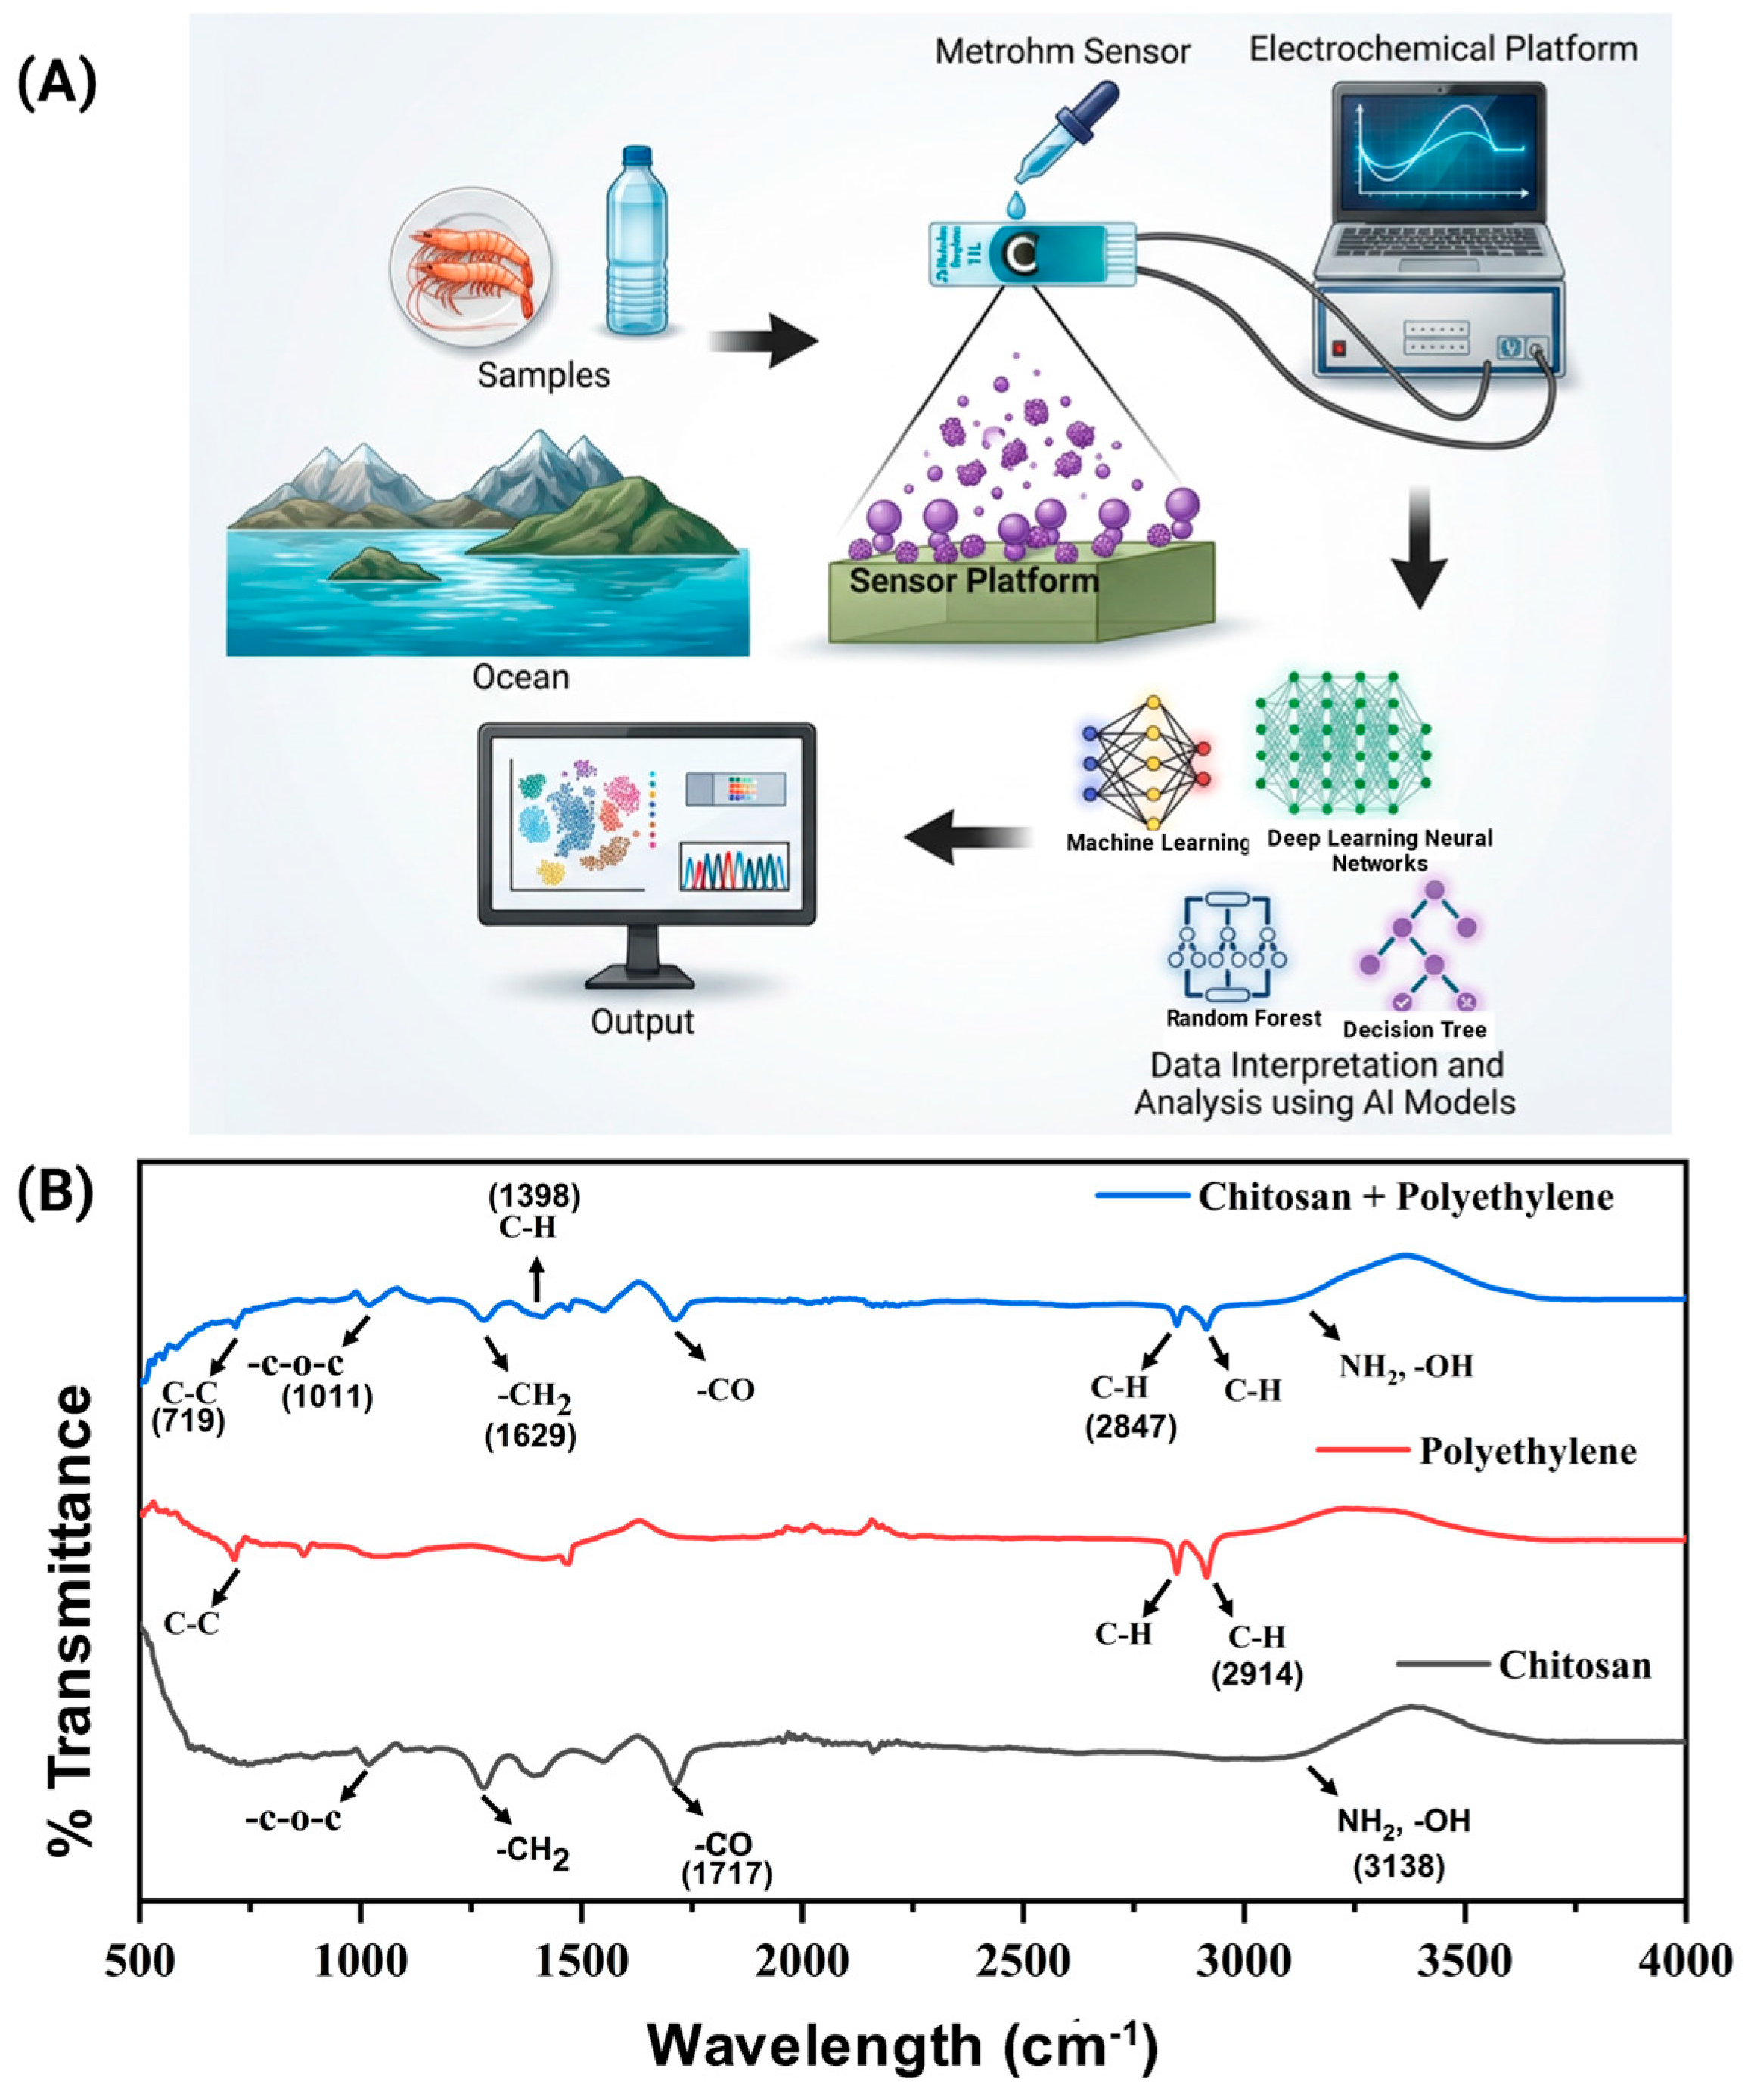
In recent years, electrochemical sensors have garnered attention as a promising solution for monitoring microplastics. Among these, electrochemical impedance spectroscopy (EIS) has emerged as a powerful label-free technique for detecting microparticles in situ. EIS measures the impedance of an electrode/electrolyte interface over a range of AC frequencies, providing information on interfacial processes and particle–surface interactions [13,14,15]. Unlike optical methods, impedance detection does not rely on the particle’s optical properties (color, refractive index), but instead on its electrical properties and surface chemistry, which can offer complementary sensitivity for non-pigmented polymers such as polyethylene [16]. EIS-based sensors can be miniaturized and integrated into portable devices or microfluidic “lab-on-chip” systems for on-site measurements [17,18]. Notably, recent studies have demonstrated that impedance spectroscopy can rapidly distinguish synthetic polymer particles from biological cells or inorganic debris in water [19]. Impedance/EIS sensing can detect microplastics without the need for visual counting, even in complex water samples [20,21]. In EIS-based microplastic screening, the detection principle relies on the ability of insulating polymer particles to perturb the electrode–electrolyte interface. When PE microplastics accumulate near the sensing surface, they partially block ionic transport pathways, reduce the effective electroactive area, and alter the electrical double layer. These changes appear as concentration-dependent shifts in impedance magnitude, phase behavior, and Nyquist response, particularly at low frequencies where interfacial polarization and charge-transfer limitations dominate [22]. Chitosan was used as the interfacial coating because it forms a stable, hydrated, film-forming polymer layer containing amine and hydroxyl groups. This layer helps stabilize the electrode interface, supports particle accumulation near the sensing surface, and enhances PE-associated dielectric perturbation through physical entrapment, hydrophobic association, and van der Waals/London dispersion interactions. Therefore, the chitosan-coated interface provides a reproducible electrochemical environment in which PE-induced changes can be captured through EIS and complementary coulometry. In addition to EIS, coulometry was incorporated as a complementary time-domain electrochemical readout to monitor charge accumulation during the applied potential step. While EIS captures frequency-dependent interfacial impedance changes, coulometry provides integrated charge information related to particle-induced changes in interfacial charge storage and transport [23]. The combined use of EIS and coulometry therefore enables a more complete electrochemical fingerprint of PE microplastic interaction with the sensing interface [22,24]. In the present study, the analytical goal is empirical PE discrimination using a chitosan–PE interfacial film and multi-frequency electrochemical fingerprints. The chitosan-based interface was selected because chitosan forms a hydrated, film-forming polymer layer containing amine and hydroxyl groups, which can stabilize the electrode surface, support particle accumulation near the interface, and enhance PE-associated dielectric perturbation. We use the term selectivity to denote a stronger PE response than polypropylene (PP) or polystyrene (PS) under identical assay conditions; however, FTIR alone confirms coating composition and does not by itself establish a fully resolved molecular recognition mechanism. Accordingly, the electrochemical results are interpreted as concentration-dependent interfacial blocking, electrical-double-layer perturbation, and dielectric modulation on a chemically confirmed surface. In addition to EIS, coulometry provides a complementary time-domain charge response, allowing the platform to capture both frequency-dependent impedance changes and charge-accumulation behavior associated with PE interaction at the sensing interface. We further combine calibration-based quantification with machine learning because screening decisions in complex matrices benefit from the full multivariate electrochemical fingerprint rather than a single-point response [16,17]. Here, machine learning was used to extract PE-relevant spectral and charge-based patterns from the EIS–coulometry dataset and convert them into rapid Low/High screening decisions. The platform demonstrates reliable performance through multi-electrode reproducibility, spike–recovery validation in both ocean water and shrimp matrices, and minimal cross-reactivity against non-target polymers (PP and PS). The overall workflow and device concept are summarized in the schematic shown in Figure 1A, highlighting its potential for rapid, field-oriented microplastic surveillance to support contamination tracking and mitigation assessment [25,26,27,28,29,30].
Figure 1.
(A) Schematic of the electrochemical detection of polyethylene microplastic in ocean water and shrimp sample. (B) FTIR spectra of chitosan, polyethylene (PE), and the blended chitosan + PE coating showing the labeled characteristic bands (–OH/–NH2, –CO, –CH2, –C–O–C, C–H, and C–C). The blend retains the signature peaks of both chitosan and PE, confirming successful incorporation of both components in the composite layer.
2. Experimental Section
2.1. Reagents, Materials, and Consumables
Polyethylene (PE) microplastic standards (CD Bioparticles (Shirley, NY, USA), CVCM-17, nominal particle size: 5 μm) was used to prepare calibration and spiked samples. Polypropylene (PP) and polystyrene (PS) standards used for cross-reactivity testing should be reported with the same metadata. Artificial ocean water (AOW) was prepared in the laboratory to simulate marine ionic strength. Tiger shrimp were purchased from a local supermarket (Dallas, TX, USA) and used as a representative seafood matrix. All chemicals used for preparing ocean water were of analytical grade. Deionized (DI) water (18.2 MΩ·cm) was used throughout. Disposable pipette tips and microcentrifuge tubes were employed to minimize cross-contamination.
2.2. Preparation of Artificial Ocean Water
Artificial ocean water (AOW) was prepared to mimic standard seawater ionic composition and salinity (~35 g/L) using an Standard Practice for the Preparation of Substitute Ocean Water (ASTM D1141) [31]-type formulation. Briefly, salts were dissolved in DI water (initially ~80 mL) under stirring in the following final concentrations (g/L): NaCl 24.53, MgCl2·6H2O 11.10, Na2SO4 4.09, CaCl2·2H2O 1.16, KCl 0.695, NaHCO3 0.201, KBr 0.101, H3BO3 0.027, SrCl2·6H2O 0.025, and NaF 0.003. For a 100 mL batch, the corresponding weighed masses were 2.453 g NaCl, 1.110 g MgCl2·6H2O, 0.409 g Na2SO4, 0.116 g CaCl2·2H2O, 0.0695 g KCl, 0.0201 g NaHCO3, 0.0101 g KBr, 0.0027 g H3BO3, 0.0025 g SrCl2·6H2O, and 0.0003 g (0.3 mg) NaF. After all components fully dissolved, the solution volume was brought to 100 mL with DI water, gently mixed, and equilibrated to room temperature before use; when required, pH was adjusted to ~8.0–8.2 using dilute NaOH or HCl, and the solution was stored in a sealed container to minimize contamination and evaporation.
2.3. Preparation of the Chitosan–PE Sensing Interface and Shrimp-Derived Matrix Samples
The working electrodes were modified with a chitosan coating prior to electrochemical measurements. Chitosan was dissolved in 1% acetic acid and drop-cast onto the working electrode surface to form a thin film, followed by drying before use. Polyethylene (PE) microplastics were prepared separately in artificial ocean water at different concentrations and used as the test samples during electrochemical sensing. For shrimp-matrix validation, shrimp tissue was used as a complex seafood background matrix. The tissue was rinsed, homogenized in artificial ocean water, spiked with PE microplastics at the target concentrations, and incubated for 10 min with gentle mixing. Matrix blanks were prepared in the same manner without PE addition and were used for matrix-matched baseline normalization.
2.4. Electrochemical Measurements
Electrochemical measurements were performed using the Metrohm multielectrode sensor platform to quantify polyethylene microplastics in artificial seawater and shrimp-matrix extracts. Electrochemical impedance spectroscopy (EIS) was conducted by applying a small-signal sinusoidal perturbation of 10 mV (AC amplitude) around the open-circuit potential, and impedance was recorded over the selected frequency range 1 Hz to 1 MHz to capture both interfacial and bulk contributions. The instrument output included Zreal (Ω), Zimag (Ω), Zmod (Ω), and phase (Zphz, degrees) as a function of frequency; Nyquist plots (Zreal vs. −Zimag) and Bode plots (|Z| vs. frequency, and phase vs. frequency when used) were generated for each dose. To minimize sensor-to-sensor variability, spectra were referenced to the 0 ng/mL blank measured on the same chip, yielding blank-normalized responses (ΔZ or Δlog10|Z| relative to the blank). In parallel, coulometry was performed under the programmed electrochemical step, and accumulated charge was calculated by numerical integration of the measured current over time, Q = ∫I(t)dt. Charge–time (Q vs. t) profiles were extracted for each dose and electrode, and dose-dependent shifts in total charge were used as complementary analytical signals alongside impedance features. All electrochemical experiments were conducted at room temperature using freshly prepared samples. The analytical LoD was calculated from the calibration response using LoD = 3σblank/m, where σ blank is the standard deviation of the blank-normalized response and m is the slope of the linear calibration line.
2.5. Data Processing, Feature Engineering, and Machine Learning Classification
Raw electrochemical data were consolidated into a single structured table containing metadata, including sensor ID, matrix type, concentration level, and file/run, along with measurement variables from EIS and coulometry. The EIS variables included frequency, Zreal, Zimag, Zmod, and phase, while the coulometry variables included current and charge versus time. The combined dataset included 16 independent chip-level datasets, consisting of 8 chips tested in artificial ocean water and 8 chips tested in shrimp-derived matrix. Each chip was evaluated across six PE concentration levels, D0–D5, generating 96 chip–dose observations for downstream analysis. Records with missing or nonphysical values were removed, and concentration labels were standardized before feature extraction.
For EIS processing, spectra were restricted to the frequency region showing the clearest concentration-dependent separation, with emphasis on low-frequency features. Duplicate frequency points within each sweep were averaged, and each impedance spectrum was interpolated onto fixed log-spaced frequency anchors to ensure uniform feature length across all samples. Zmod was log-transformed as log10|Z| to stabilize variance. Sensor-specific blank normalization was then performed using the corresponding D0 spectrum, yielding Δlog10|Z| and, when used, Δphase, to reduce sensor-to-sensor and matrix-dependent offsets while preserving concentration-driven changes. For coulometry, current traces were integrated to obtain charge (Q), and descriptors were extracted from Q–t profiles, including total charge, charge at selected time points, current response, peak current, area-under-curve features, and curve-shape/slope descriptors. Outliers were removed conservatively using IQR and/or robust Hampel/MAD screening to eliminate sporadic noise spikes while preserving true concentration-dependent trends. All engineered features were standardized where appropriate and organized into one feature vector per chip–dose measurement condition.
Machine learning models were trained to automatically classify PE microplastic contamination levels from the combined EIS–coulometry signatures. For binary screening, samples were grouped as Low (≤4 ng/mL) and High (>4 ng/mL). The 4 ng/mL cutoff was selected as a practical screening threshold because it separates blank/low-dose samples from clearly elevated contamination levels (16–256 ng/mL) while supporting decision-ready classification rather than exact quantification alone. The binary Low/High model contained 48 observations per class across the combined artificial ocean water and shrimp datasets. To evaluate generalization and minimize data leakage, grouped sensor-wise cross-validation was used. In each fold, all observations from one independent chip were held out together as the test set, while the remaining chips were used for training. Therefore, repeated measurements, concentration replicates, and matrix-specific observations from the same chip were not split between training and testing. Interpolation was performed only to align spectra to common frequency anchors and did not use class labels, while blank normalization was performed using the corresponding sensor-specific D0 response as part of the assay workflow. Multiple supervised classifiers were compared, including logistic regression, support vector machine with a radial basis function kernel, random forest, and extra trees. Model performance was quantified using accuracy, precision, recall, F1-score, area under the receiver operating characteristic curve (AUC), Matthews correlation coefficient (MCC), and confusion matrices based on out-of-fold predictions. The ML workflow was used as a complement to calibration-based quantification by leveraging the full multivariate EIS–coulometry fingerprint to make rapid Low/High screening decisions that are more tolerant to matrix-related spectral-shape changes and sensor-to-sensor offsets.
3. Results and Discussion
3.1. Physicochemical and Electrochemical Characterization of the Sensing Interface
To validate the composition and post-exposure physicochemical behavior of the chitosan–polyethylene (PE) sensing interface, Fourier transform infrared spectroscopy (FTIR), zeta potential, and hydrodynamic size analyses were performed. FTIR was first used to confirm that the blended coating preserves identifiable chemical signatures from both chitosan and PE. As shown in Figure 1B, chitosan exhibits a broad –OH/–NH2 stretching band in the high-wavenumber region, consistent with overlapping O–H and N–H vibrations from the polysaccharide backbone and amine groups. The labeled –CO band corresponds to carbonyl/amide-associated vibrations typically observed in chitosan materials [32], while the –CH2 feature reflects aliphatic C–H contributions. The –C–O–C band is assigned to glycosidic/ether vibrations characteristic of the chitosan saccharide structure [33]. In contrast, polyethylene is dominated by C–H absorptions associated with methylene vibrations, along with C–C skeletal contributions typical of hydrocarbon polymer chains. Notably, the chitosan + PE blend retains the labeled features from both components, including C–C, –C–O–C, –CH2, –CO, C–H, and –OH/–NH2, confirming successful incorporation of PE-associated hydrocarbon signatures within the chitosan-based interfacial film. To further support PE-associated interfacial organization, zeta potential and hydrodynamic size measurements were performed across the tested PE concentration range. As shown in Supplementary Figure S1A, the zeta potential remained relatively stable and positive across concentrations, with values clustered around approximately 37–41 mV, indicating that the chitosan-based sensing environment maintained a stable electrostatic state after PE exposure. This suggests that the electrochemical response was not primarily caused by uncontrolled charge destabilization of the suspension/interface. In contrast, the hydrodynamic size increased concentration-dependently with PE loading (Supplementary Figure S1B), rising from the sub-micrometer/low-micrometer range at blank or low concentration to larger particle-associated structures at higher PE concentrations. This size increase supports concentration-dependent PE accumulation, particle association, and reorganization within or near the chitosan-based sensing interface. Together, FTIR confirms the chemical composition of the sensing layer, while the zeta potential and size data provide post-exposure physicochemical evidence that PE alters the interfacial/colloidal organization in a concentration-dependent manner. This compositional and physicochemical verification is important because the impedance and charge signatures discussed next are interpreted as PE-driven changes occurring on a chemically confirmed and PE-responsive chitosan-based interface.
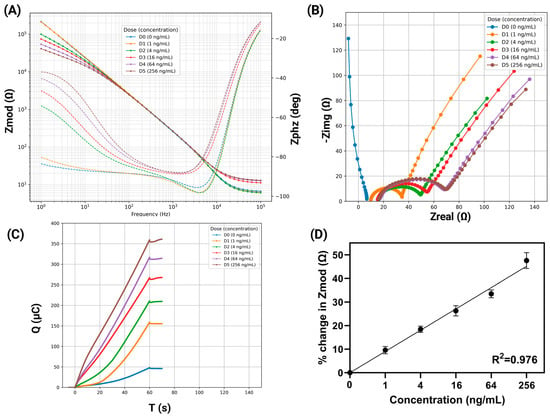
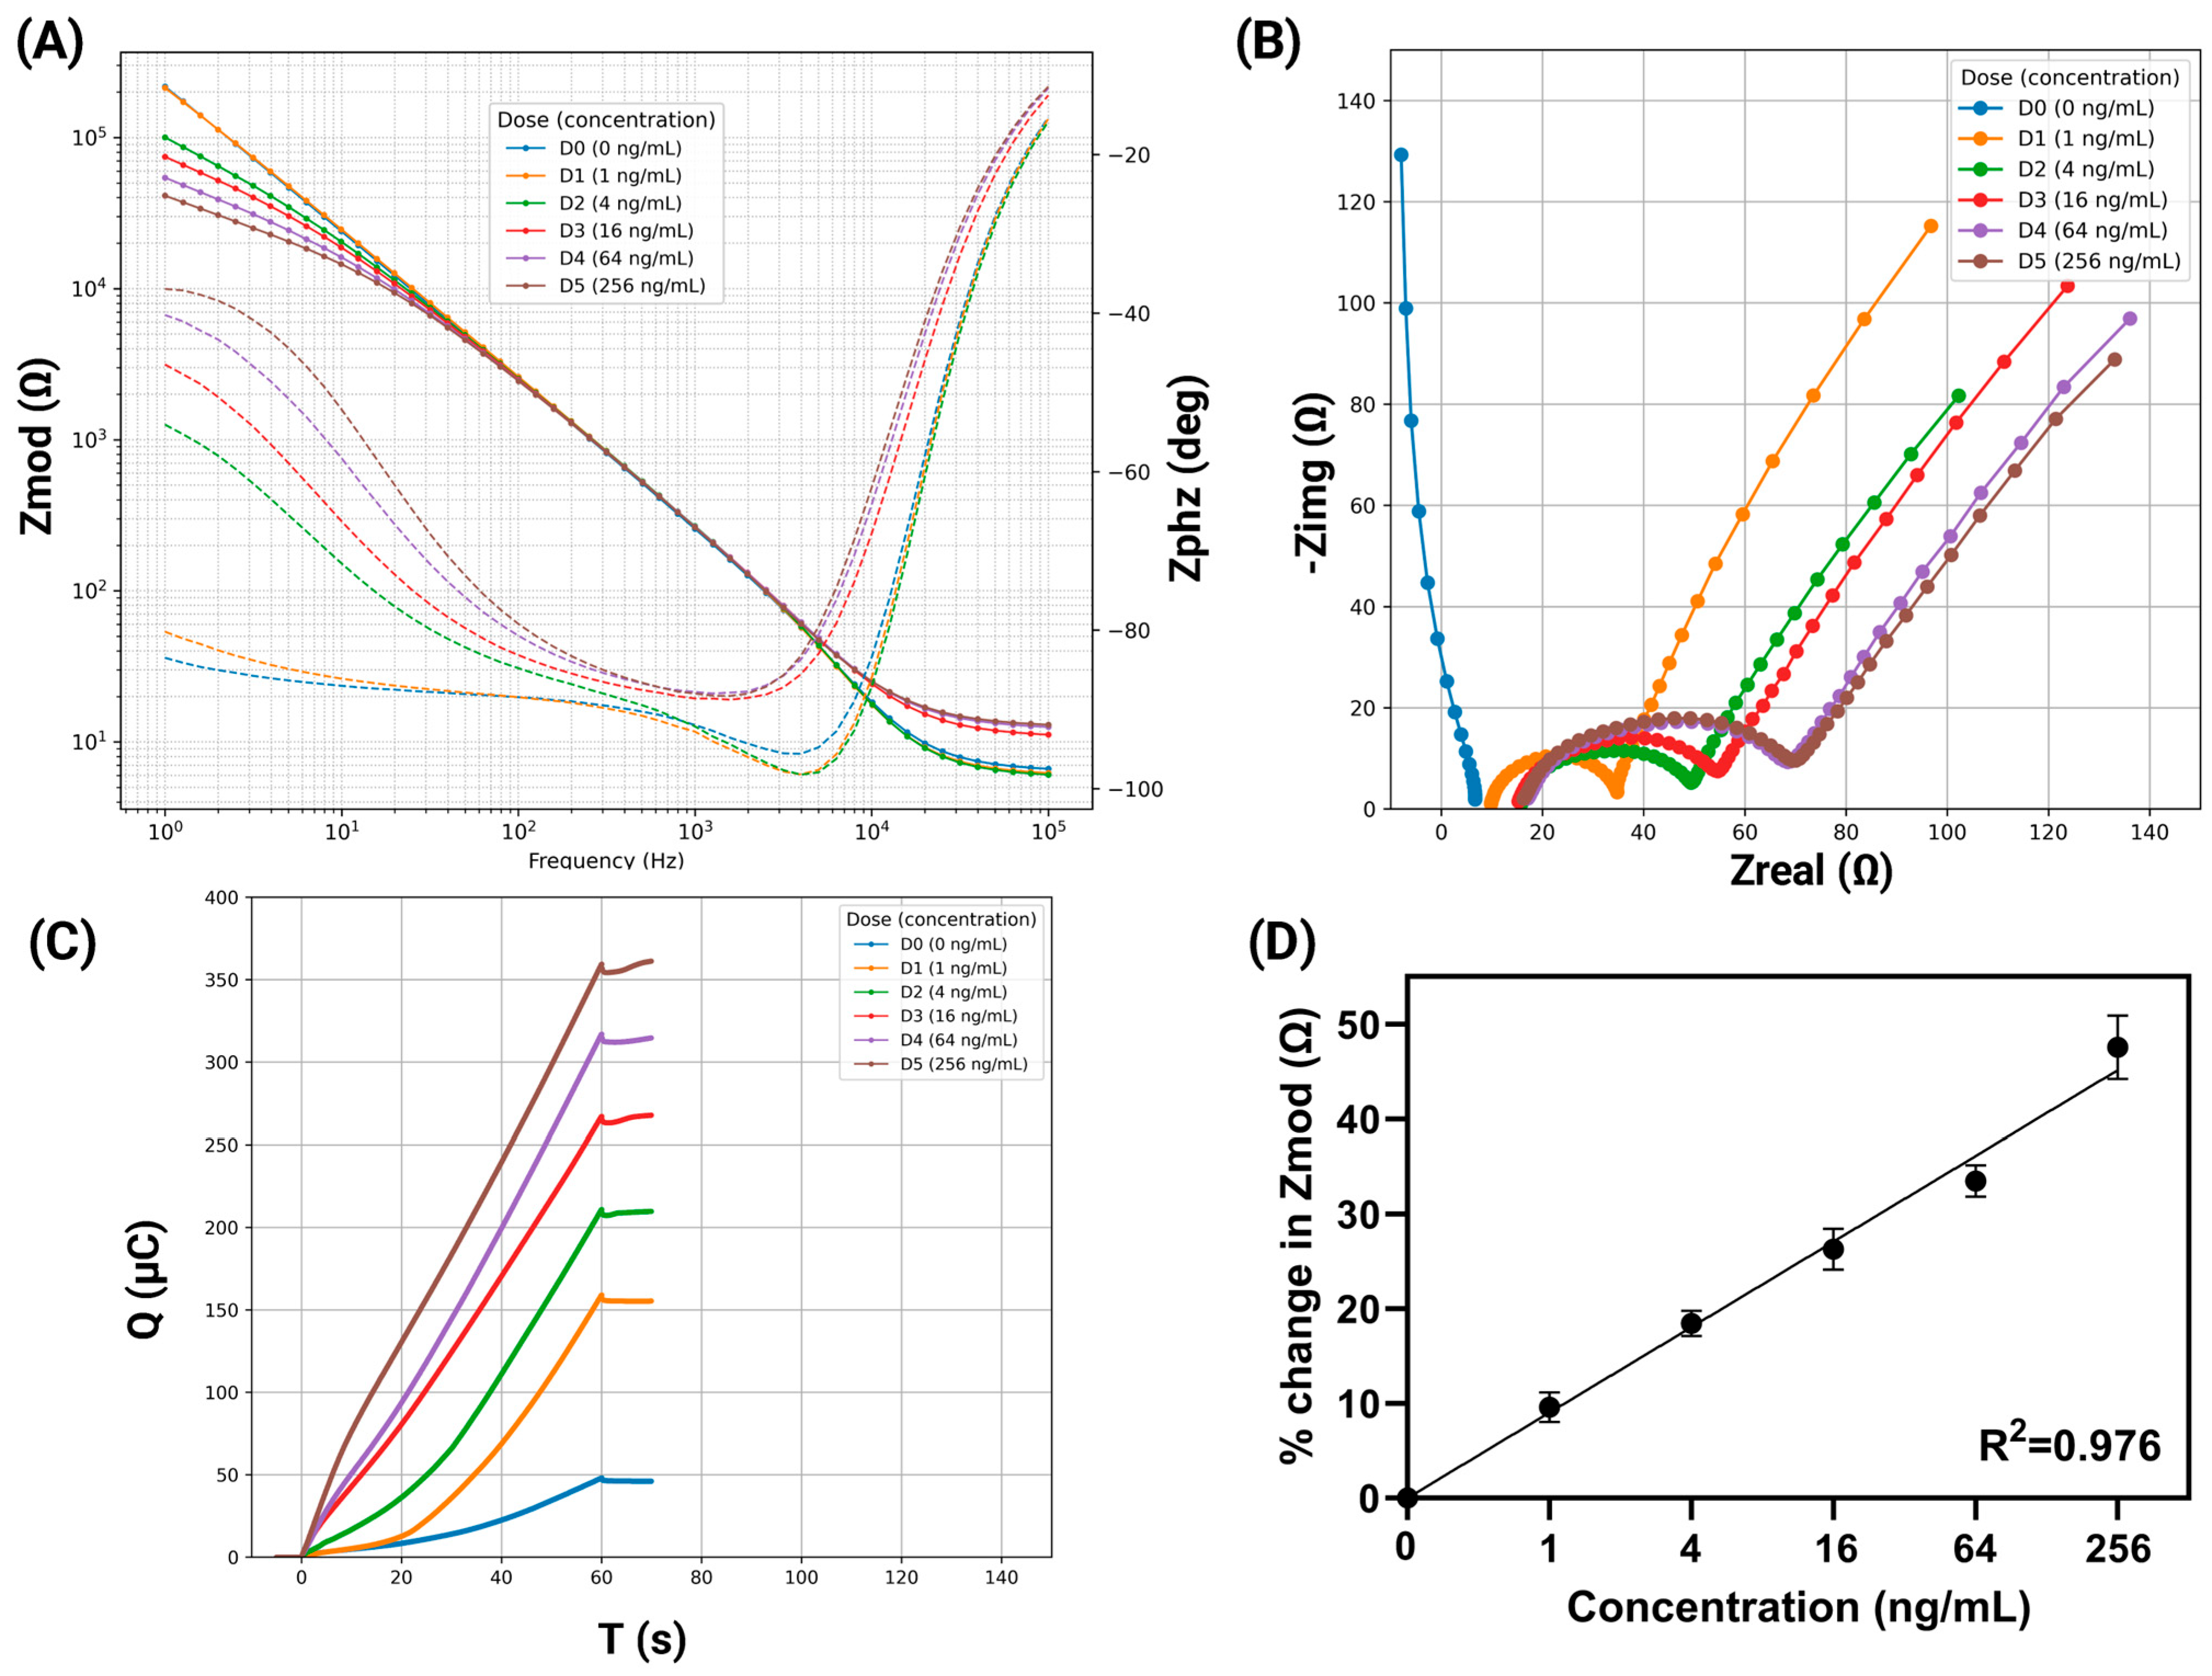
After confirming the coating chemistry, the sensor response was characterized in ocean water across increasing concentrations using EIS and coulometry. EIS trends are captured through both frequency-domain and complex-plane representations. In the Bode magnitude and phase plots (Figure 2A), the impedance magnitude (Zmod, |Z|) increases systematically with microplastic concentration, with the strongest separation occurring at low frequencies where interfacial polarization, surface blocking, and charge-transfer limitations dominate the response [34,35,36]. At higher frequencies, the curves are dominated by solution resistance and fast capacitive elements rather than particle-induced interfacial effects. The phase response also reflects changes in the resistive–capacitive balance of the interface as insulating PE particles alter the effective double layer and charge-transfer behavior, resulting in dose-dependent shifts. In the Nyquist plots (Figure 2B), the spectra exhibit a semicircular feature typically associated with charge-transfer-controlled interfacial processes, where the semicircle diameter is related to charge-transfer resistance (Rct), and the high-frequency intercept is dominated by solution resistance. As PE concentration increases, the semicircle expands, indicating an increase in interfacial resistance. To further support this interpretation, equivalent-circuit fitting was performed using a modified Randles-type circuit containing solution resistance (Rs), charge-transfer resistance (Rct), a constant phase element (CPE), and Warburg impedance (Zw), as shown in Supplementary Figure S3A. The extracted Rct values increased with PE concentration (Supplementary Figure S3B), confirming that PE accumulation at the chitosan-modified interface increases interfacial resistance and contributes strongly to the low-frequency impedance response. This behavior is consistent with insulating PE particles adsorbing/accumulating at the sensing interface, reducing effective electroactive area and impeding interfacial electron/ion transport pathways [1,5]. Together, the Bode, Nyquist, and equivalent-circuit fitting results support a coherent mechanistic picture: increasing microplastic loading produces elevated low-frequency impedance and increased charge-transfer/interfacial resistance.
Figure 2.
(A) Bode plots showing impedance magnitude (Zmod, |Z|) and phase angle versus frequency for increasing PE microplastic concentrations. (B) Nyquist plots (−Zimag vs. Zreal) measured in ocean water for increasing PE microplastic concentrations, showing concentration-dependent changes in the interfacial impedance response. (C) Coulometry (Q vs. time) profiles in ocean water for increasing PE microplastic concentrations, demonstrating dose-dependent variation in accumulated charge. (D) Calibration dose–response (CDR) based on percent change in Zmod relative to the zero-dose control (D0) as a function of PE concentration (ng/mL); error bars represent standard deviation, and the linear fit is reported with R2.
To provide an orthogonal electrochemical readout of dose dependence, coulometry (Figure 2C) was used to track time-dependent charge accumulation during the applied electrochemical step. Coulometry was performed using a programmed potential step of 0.60 V over a 70 s measurement window, and the accumulated charge was calculated by numerical integration of the measured current–time response using the trapezoidal method, . The charge response (Q, µC) increased monotonically with PE concentration, and higher doses exhibited steeper Q–t trajectories and larger terminal charge values [37,38]. This behavior indicates concentration-dependent modification of interfacial charge storage and transport during the electrochemical protocol. As PE microplastic loading increases, particle accumulation near the chitosan-coated interface can partially block ionic/electroactive pathways and alter the local interfacial environment, which is reflected not only in the EIS response but also in the integrated charge response captured by coulometry. Thus, coulometry serves as a complementary time-domain signal that supports the frequency-domain impedance trends and strengthens the overall electrochemical fingerprint for PE detection.
For quantitative calibration, a calibration dose response (CDR) was constructed using the percent change in Zmod relative to the baseline (Figure 2D), i.e.,
where is the PE dose. The CDR increases monotonically across the range of 1–256 ng/mL and exhibits a strong linear relationship (R2 = 0.976), demonstrating that impedance changes remain structured and concentration-dependent within the ocean-water matrix. Baseline referencing is particularly important in ocean water because it reduces variability from background ionic strength and matrix-dependent offsets, improving comparability across runs and enabling reliable extraction of concentration-driven impedance shifts [39]. To relate the mass-based calibration output to particle-number reporting used in environmental monitoring, the conversion calculation from ng/mL to estimated particles/mL is provided in the Supplementary Information.
3.2. Matrix Validation in Shrimp Samples
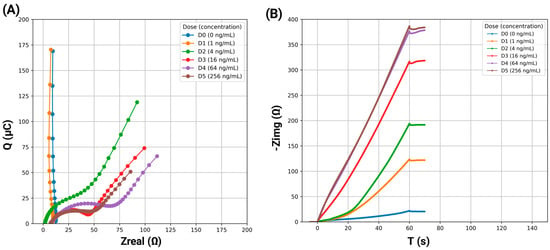
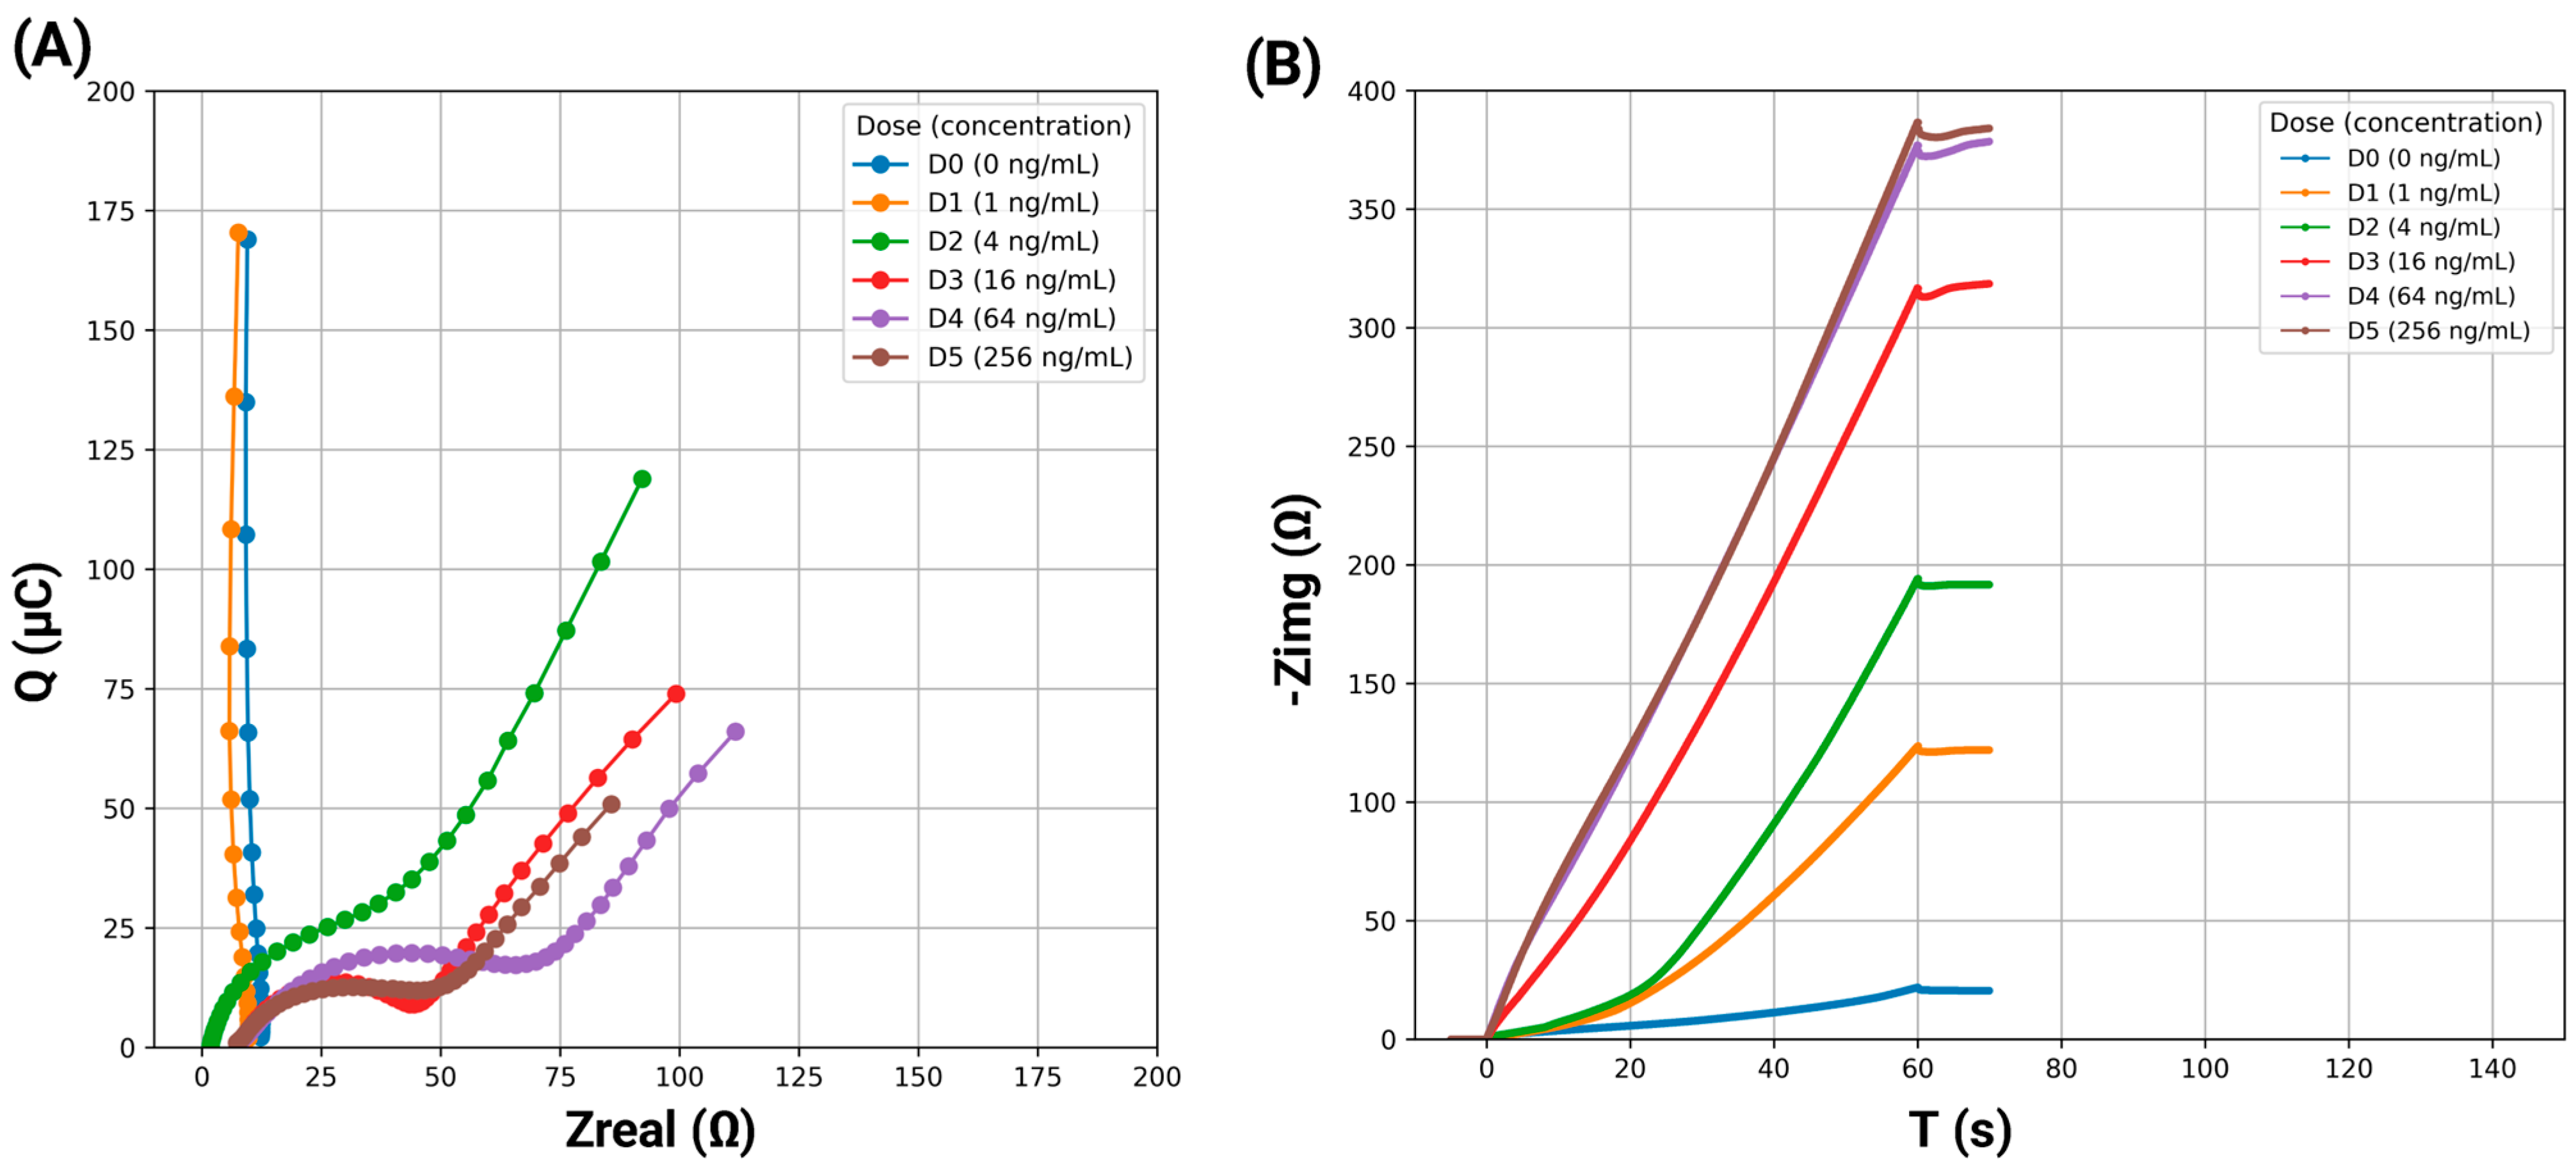
Following characterization in ocean water, the sensor was evaluated in a shrimp-derived sample matrix to assess performance under a complex biological background (proteins, lipids, salts, and other organics) that can alter baseline conductivity and interfacial behavior. Shrimp samples were tested across the same PE microplastic dose concentrations [40], and the electrochemical response was examined using Nyquist EIS and coulometry to verify that the dose-dependent electrical signature is retained in a realistic food matrix. In the Nyquist response (Figure 3A), the impedance spectra preserve a concentration-dependent shift in the complex-plane profile as PE dose increases. Relative to the matrix blank, higher microplastic concentrations produce a clear expansion and rightward shift in the arc, consistent with an increase in the interfacial impedance, most notably charge-transfer resistance (Rct), as insulating PE particles accumulate near the sensing interface and reduce the effective electroactive area. Importantly, observing a monotonic impedance increase across the concentrations in the shrimp matrix indicates that the sensor response is not dominated by the matrix background alone, but remains sensitive to PE-driven interfacial blocking effects [38].
Figure 3.
(A) Nyquist plots (−Zimag vs. Zreal) measured in shrimp samples spiked with increasing PE microplastic concentrations (D0–D5), showing concentration-dependent shifts in the interfacial impedance response. (B) Coulometry (Q vs. time) profiles in the same shrimp matrix across PE doses (D0–D5), demonstrating dose-dependent changes in accumulated charge under the applied electrochemical protocol.
The coulometric profiles (Figure 3B) provide an orthogonal confirmation of dose dependence by tracking the time evolution of accumulated charge (Q, µC) during the applied electrochemical protocol. The matrix blank shows the lowest charge accumulation, while increasing PE concentration produces progressively larger Q–t responses, with higher doses exhibiting steeper charge growth and higher terminal charge values. This dose-dependent charge behavior is consistent with a microplastic-modified interface in which particle coverage perturbs charge transfer/charge storage pathways, complementing the impedance trends observed in the Nyquist measurements. Overall, the shrimp-matrix results demonstrate that both Nyquist EIS and coulometry retain strong concentration sensitivity in a complex biological sample environment, supporting the feasibility of PE microplastic detection beyond clean aqueous testing conditions.
3.3. Analytical Validation in Ocean Water and Shrimp Matrix: Spike–Recovery, Selectivity, and Reproducibility
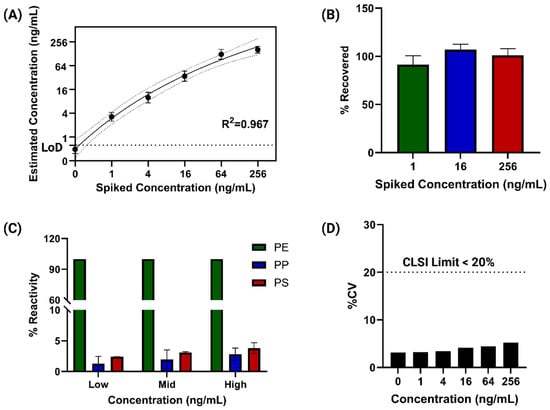
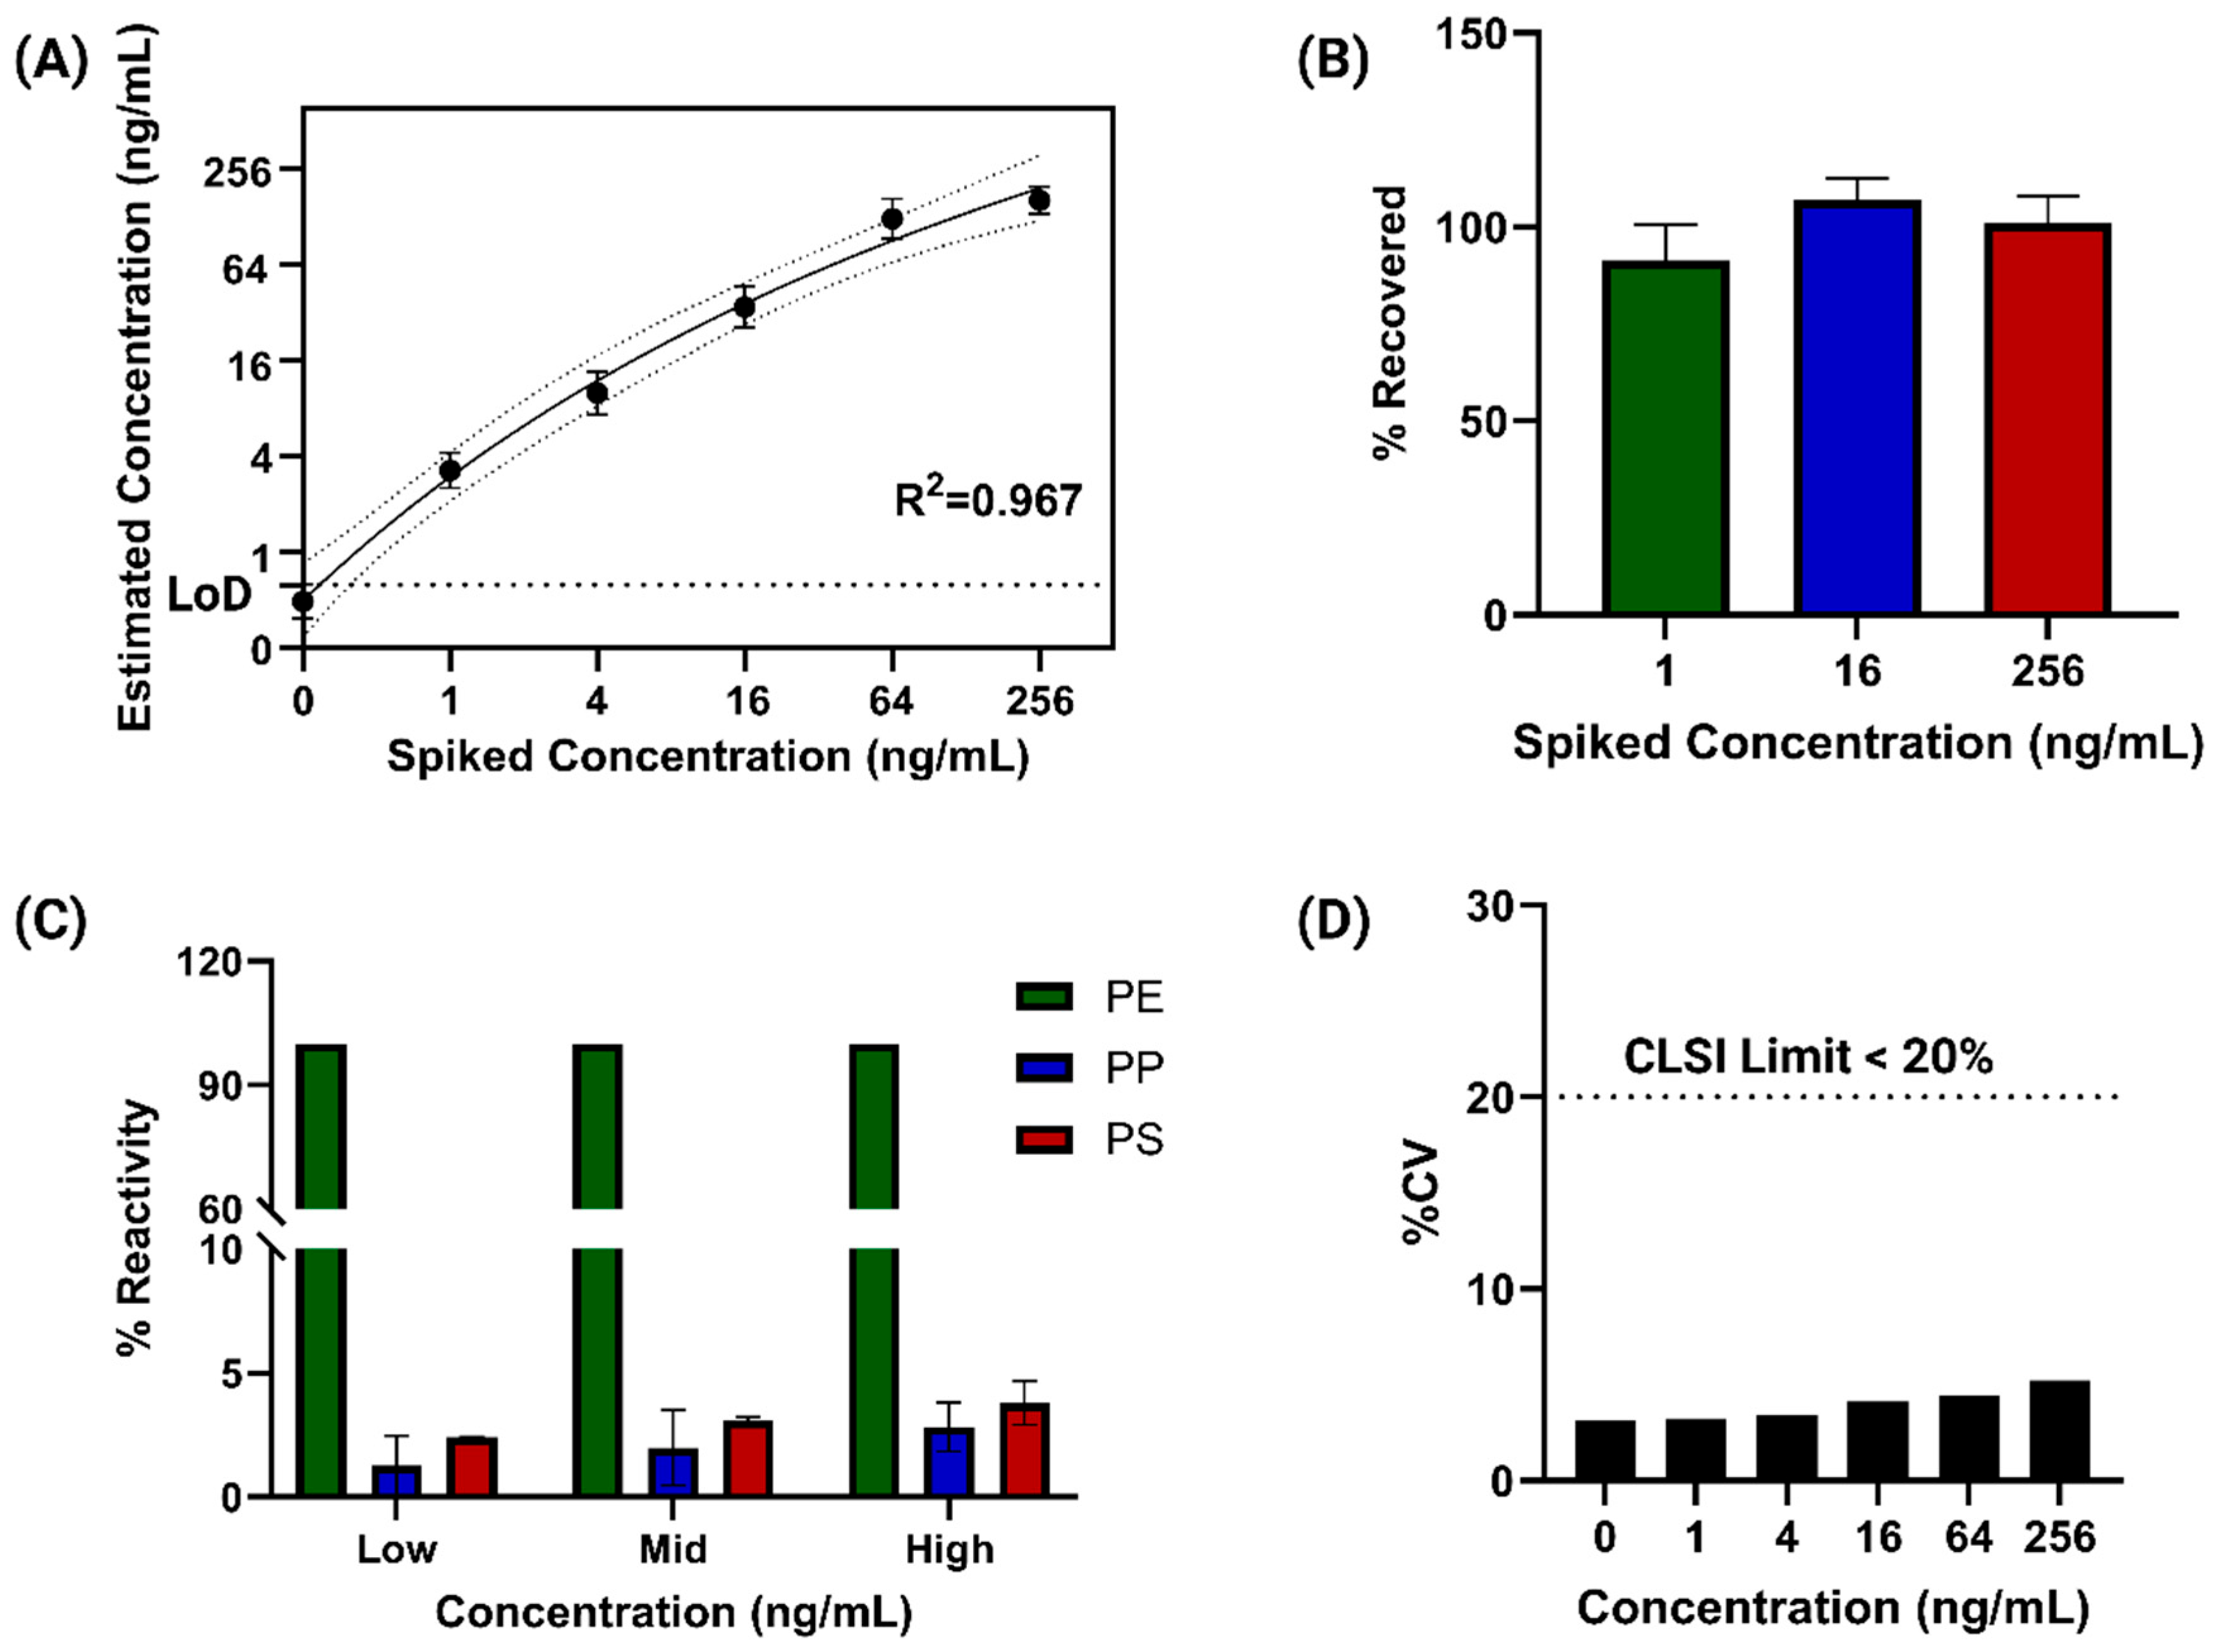
To evaluate real-sample applicability and confirm analytical reliability, the sensor was validated using spike–recovery experiments in both ocean water and shrimp-derived samples, followed by cross-reactivity (selectivity) and reproducibility testing. In ocean water, known PE microplastic doses were spiked, and the sensor-estimated concentrations were compared against the actual spiked values. As shown in Figure 4A, the estimated concentration increases proportionally with the spiked concentration over the tested range, with strong agreement (R2 = 0.967). The plot also indicates the method sensitivity through the LoD region, supporting quantification at 0.1 ng/mL levels even in a high-ionic-strength saline matrix. The LoD was calculated using the 3σ/m criterion, with blank variability obtained from zero-dose control measurements across N = 8 independent sensor chips.
Figure 4.
(A) Spike–recovery calibration in ocean water comparing sensor-estimated concentration versus spiked concentration, showing strong agreement (R2 = 0.967) and indicating the LoD region. (B) Percent recovery of PE microplastics from shrimp samples at representative low, mid, and high spike levels; error bars represent standard deviation. (C) Cross-reactivity assessment (selectivity) showing the relative response to PE compared with non-target polymers PP and PS at low, medium, and high concentrations. (D) Reproducibility across the concentration range expressed as %CV, benchmarked against the CLSI precision criterion (<20%).
A complementary spike–recovery study was then performed in a complex biological background using homogenized shrimp samples. Shrimp tissues were crushed and incubated in a spiked concentration of microplastic particles before to electrochemical measurement [10]. Recovery was evaluated at representative low, mid, and high (1, 16, 256 ng/mL) spike levels, and the results show near-quantitative recovery, approximately ~90–105% across levels, as shown in Figure 4B [41]. The consistency of recovery across the concentration range indicates that matrix effects were effectively mitigated and that the sensor’s calibration remains valid after sample processing [21,37,42]. Importantly, the shrimp matrix is compositionally distinct from artificial ocean water because it contains proteins, lipids, salts, and biological residues; therefore, the retained dose-dependent response supports the matrix tolerance of the platform. In addition, matrix-matched baseline normalization and machine learning analysis of the full impedance fingerprint were used to reduce matrix-dependent offsets and extract PE-relevant spectral information. The frequency-importance analysis further supports this interpretation, showing that PE discrimination is dominated by low-frequency interfacial features rather than bulk matrix background.
Selectivity was assessed by challenging the platform with non-target polymers to determine whether the observed signal originated from preferential PE response rather than a generic particle-presence effect. As shown in Figure 4C, polyethylene (PE) produced a dominant response across low, mid, and high concentrations, whereas polypropylene (PP) and polystyrene (PS) generated only minimal cross-reactive signals relative to PE, supporting polymer-level discrimination under the tested conditions. To further examine this polymer-dependent behavior, frequency-importance analysis was performed using the corresponding polymer datasets, where PP, PS, and PE responses were compared based on baseline-normalized Zmod features. As shown in Supplementary Figure S2, PE exhibited its strongest feature-importance peak in the low-frequency interfacial region at 3.95 Hz, whereas PP and PS showed dominant peaks at 31.67 Hz and 25,171.88 Hz, respectively. This frequency shift indicates that PE discrimination is primarily governed by low-frequency interfacial impedance modulation, consistent with stronger perturbation of the chitosan-modified electrical double layer. In contrast, the PP and PS responses were weaker and/or shifted toward higher-frequency regions, suggesting a lower contribution from interfacial accumulation and polarization under the tested conditions. Therefore, the observed PE-dominant response is attributed to preferential interfacial accumulation, hydrophobic association, van der Waals/London dispersion interactions, physical entrapment within the chitosan-based film, and the dielectric blocking effect of insulating PE particles. However, this selectivity should be interpreted as empirical polymer discrimination under the tested particle size, concentration, and matrix conditions rather than definitive receptor-like molecular recognition. Finally, measurement precision was quantified using the coefficient of variation (%CV) across the concentrations. The %CV values remain well below the CLSI acceptability criterion of <20% (Figure 4D), confirming strong repeatability across doses and demonstrating that the platform maintains stable performance from low- to high-concentration measurements.
3.4. Classification Performance of Machine Learning Models
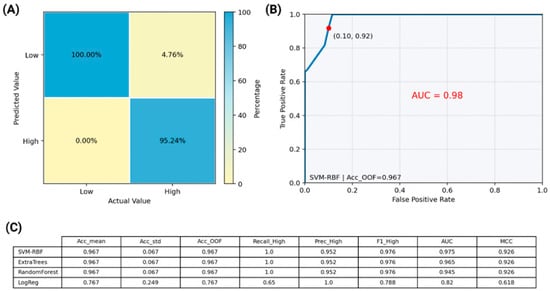
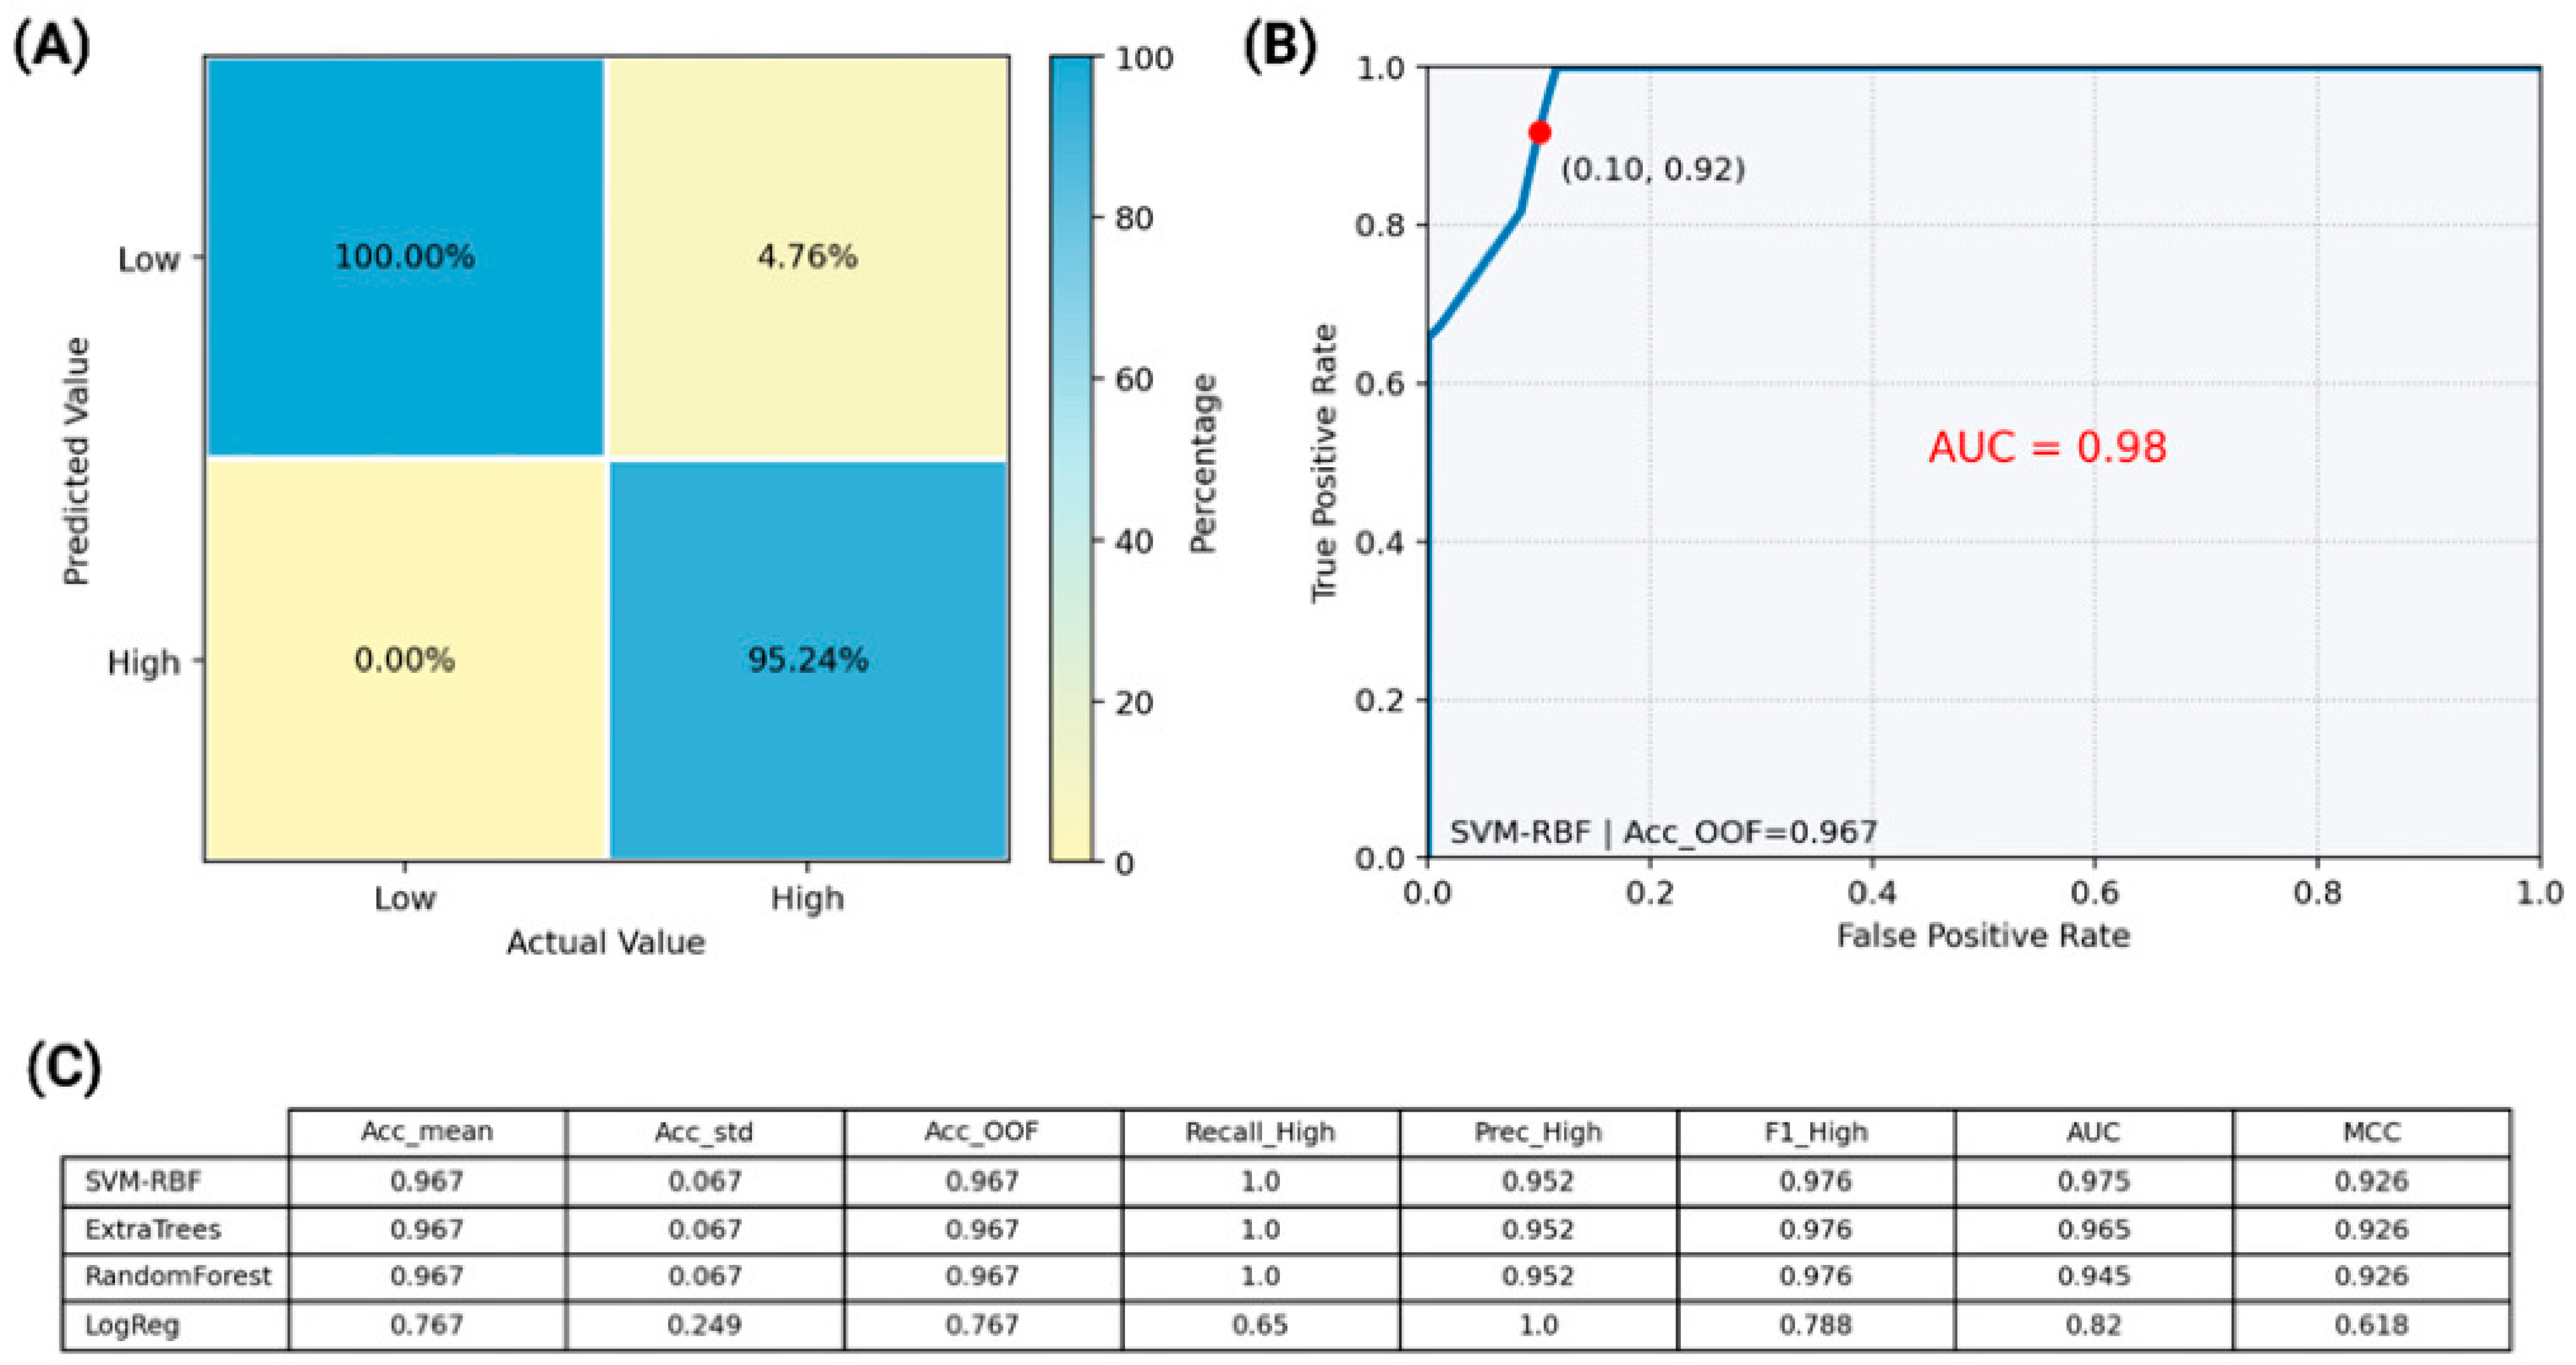
Beyond estimating concentration, we used machine learning (ML) to enable fast, decision-ready classification of contamination level directly from the impedance fingerprints [16,43,44]. Multi-frequency impedance features (e.g., magnitude/phase information across the frequency sweep) were used as inputs to supervised classifiers to separate samples into “Low (≤4 ng/mL)” versus “High (>4 ng/mL)” contamination classes. The 4 ng/mL cutoff was selected as a practical screening threshold because it represents the upper boundary of the near-background/low-contamination regime in this study and separates it from clearly elevated levels (16–256 ng/mL) that would warrant confirmatory analysis. This binary grouping also provides an operational advantage over quantification alone: calibration curves remain useful for estimating concentration, whereas ML exploits the full spectral shape and is therefore better suited for rapid triage when matrix effects or sensor offsets make one-dimensional quantification less robust. The classification results show strong separability between the two classes. As shown in Figure 5A, the confusion matrix indicates near-perfect identification of the Low class (100% correctly classified as Low), while the High class is correctly identified in most cases (95.24% predicted as High). Only a small fraction of High samples are misclassified as Low (4.76%), which is the more critical error type because it would under-call contamination. Model discrimination is further supported by ROC analysis [45]. In Figure 5B, the ROC curve for the SVM with an RBF kernel (SVM-RBF) yields an AUC = 0.98, indicating excellent class separability across thresholds. The highlighted operating point (0.10, 0.92) corresponds to a false-positive rate of 0.10 and a true-positive rate of 0.92, indicating that high sensitivity can be achieved while keeping false positives relatively low. A broader model comparison is summarized in Figure 5C. SVM-RBF, ExtraTrees, and RandomForest all achieve similarly strong performance (Acc_OOF ≈ 0.967 and MCC ≈ 0.926 for the top models), whereas Logistic Regression performs substantially worse (Acc_OOF = 0.767; AUC = 0.82), suggesting that nonlinear learners better capture the complex impedance–contamination relationship.
Figure 5.
(A) Confusion matrix for binary classification (Low vs. High) showing the percentage of samples correctly and incorrectly classified. (B) Receiver operating characteristic (ROC) curve for the best-performing classifier (SVM-RBF) with AUC = 0.98; the highlighted point indicates an example operating threshold (FPR = 0.10, TPR = 0.92). (C) Comparative performance summary of evaluated ML models (SVM-RBF, ExtraTrees, RandomForest, and Logistic Regression) reported using cross-validation metrics, including mean accuracy, out-of-fold accuracy, recall/precision/F1 for the High class, AUC, and MCC.
4. Conclusions
This study presents an electrochemical–machine learning framework for screening polyethylene (PE) microplastics in ocean water and shrimp samples. FTIR verified that the chitosan–PE coating retains characteristic signatures from both components, supporting a reproducible sensing interface. In ocean water, which increases interfacial impedance and charge-transfer resistance, a percent change in impedance magnitude (Zmod) enabled linear quantification across the range of 1–256 ng/mL (R2 = 0.976). In contrast, coulometry provided an independent, dose-dependent charge readout. Spike–recovery confirmed accuracy in ocean water (estimated vs. spiked, R2 = 0.967) and near-quantitative recovery in shrimp (~90–105%) at low, mid, and high levels after enzymatic digestion/filtration and matrix-matched baseline normalization. Selectivity testing showed a dominant response to PE with minimal cross-reactivity to PP and PS, and precision met CLSI expectations with %CV < 20% across concentrations. Machine learning classifiers trained on impedance features delivered rapid Low/High decisions with excellent separability (AUC = 0.98) and strong generalization (Acc_OOF ≈ 0.967; MCC ≈ 0.926). Reproducibility remained stable across doses, supporting the use of routine measurements in high-salinity matrices. These results support practical screening and motivate extension to mixed polymers and field-collected matrices.
Supplementary Materials
The following supporting information can be downloaded at https://www.mdpi.com/article/10.3390/pr14111690/s1, Figure S1: (A) Zeta potential as a function of PE concentration, showing relatively stable positive surface potential across the tested concentration range. (B) Hydrodynamic size as a function of PE concentration, showing a concentration-dependent increase in apparent particle/aggregate size. The increase in hydrodynamic size supports PE accumulation, particle association, and reorganization within or near the chitosan-based sensing interface. Error bars represent standard deviation; Figure S2: Frequency-importance comparison for PE, PP, and PS using baseline-normalized Zmod features. PE showed a dominant low-frequency feature-importance peak at 3.95 Hz, whereas PP and PS exhibited their strongest peaks at 31.67 Hz and 25,171.88 Hz, respectively. The low-frequency dominance of PE supports an interfacial impedance-based response associated with electrical double-layer perturbation and particle accumulation at the chitosan-modified sensing interface; Figure S3: (A) Modified Randles-type equivalent circuit used to fit the impedance spectra, consisting of solution resistance (Rs), charge-transfer resistance (Rct), constant phase element (CPE) representing non-ideal interfacial capacitance, and Warburg impedance (Zw) representing diffusion-related behavior. (B) Extracted Rct values as a function of PE microplastic concentration. The concentration-dependent increase in Rct supports the interpretation that PE accumulation at the chitosan-modified sensing interface increases interfacial resistance and partially blocks charge/ion transport pathways. Error bars represent standard deviation.
Author Contributions
Conceptualization, K.K.M. and S.P.; Methodology, K.K.M. and A.K.; Software, K.K.M., A.K. and A.K.S.; Validation, K.K.M.; Formal analysis, K.K.M., A.K. and A.K.S.; Investigation, S.M. and S.P.; Data curation, K.K.M., A.K. and A.K.S.; Writing—original draft, K.K.M., A.K. and A.K.S.; Writing—review and editing, K.K.M. and S.P.; Supervision, S.M. and S.P.; Project administration, K.K.M., S.M. and S.P.; Funding acquisition, S.M. and S.P. All authors have read and agreed to the published version of the manuscript.
Funding
This research received no external funding.
Data Availability Statement
The data that support the findings of this study are available on request from the corresponding author. The data are not publicly available due to privacy or ethical restrictions.
Acknowledgments
During the preparation of this manuscript, the authors used Microsoft Copilot 148.0.3967.70 (version as of September 2025) for the purposes of grammar correction, sentence restructuring, clarity enhancement, and overall linguistic refinement. The authors have reviewed and edited the output and take full responsibility for the content of this publication.
Conflicts of Interest
The authors declare the following financial interests/personal relationships which may be considered as potential competing interests: Drs. Shalini Prasad and Sriram Muthukumar have a significant interest in Enlisense LLC, a company that may have a commercial interest in the results of this research and technology. The potential individual conflict of interest has been reviewed and managed by The University of Texas at Dallas, and played no role in the study design; in the collection, analysis, and interpretation of data; in the writing of the report, or in the decision to submit the report for publication. Portable device and technology platform is a proprietary of EnLiSense LLC.
References
- Gomes, D.; Magalhães, S.; Rasteiro, M.G.; Faia, P. Measuring Microplastic Concentrations in Water by Electrical Impedance Spectroscopy. Water 2024, 16, 3228. [Google Scholar] [CrossRef] [Scilit]
- Dey, T.K.; Uddin, M.E.; Jamal, M. Detection and removal of microplastics in wastewater: Evolution and impact. Environ. Sci. Pollut. Res. 2021, 28, 16925–16947. [Google Scholar] [CrossRef] [Scilit]
- Amato-Lourenço, L.F.; dos Santos Galvão, L.; de Weger, L.A.; Hiemstra, P.S.; Vijver, M.G.; Mauad, T. An emerging class of air pollutants: Potential effects of microplastics to respiratory human health? Sci. Total Environ. 2020, 749, 141676. [Google Scholar] [CrossRef] [Scilit]
- Singh, B.; Kumar, A. Advances in microplastics detection: A comprehensive review of methodologies and their effectiveness. TrAC-Trends Anal. Chem. 2024, 170, 117440. [Google Scholar] [CrossRef] [Scilit]
- Du, H.; Chen, G.; Wang, J. Highly selective electrochemical impedance spectroscopy-based graphene electrode for rapid detection of microplastics. Sci. Total Environ. 2023, 862, 160873. [Google Scholar] [CrossRef] [Scilit] [PubMed]
- Leslie, H.A.; van Velzen, M.J.M.; Brandsma, S.H.; Vethaak, A.D.; Garcia-Vallejo, J.J.; Lamoree, M.H. Discovery and quantification of plastic particle pollution in human blood. Environ. Int. 2022, 163, 107199. [Google Scholar] [CrossRef] [Scilit] [PubMed]
- Abimbola, I.; McAfee, M.; Creedon, L.; Gharbia, S. In-situ detection of microplastics in the aquatic environment: A systematic literature review. Sci. Total Environ. 2024, 934, 173111. [Google Scholar] [CrossRef] [Scilit]
- Lascari, D.; Cataldo, S.; Muratore, N.; Prestopino, G.; Pignataro, B.; Lazzara, G.; Arrabito, G.; Pettignano, A. Label-free impedimetric analysis of microplastics dispersed in aqueous media polluted by Pb2+ ions. Anal. Methods 2024, 16, 7654–7666. [Google Scholar] [CrossRef] [Scilit]
- Bianco, V.; Memmolo, P.; Carcagnì, P.; Merola, F.; Paturzo, M.; Distante, C.; Ferraro, P. Microplastic Identification via Holographic Imaging and Machine Learning. Adv. Intell. Syst. 2020, 2, 1900153. [Google Scholar] [CrossRef] [Scilit]
- Adhikari, S.; Kelkar, V.; Kumar, R.; Halden, R.U. Methods and challenges in the detection of microplastics and nanoplastics: A mini-review. Polym. Int. 2022, 71, 543–551. [Google Scholar] [CrossRef] [Scilit]
- Akdogan, Z.; Guven, B. Microplastics in the environment: A critical review of current understanding and identification of future research needs. Environ. Pollut. 2019, 254, 113011. [Google Scholar] [CrossRef] [Scilit]
- Beichert, L.; Binhammer, Y.; Andrade, J.R.C.; Mevert, R.; Kniggendorf, A.-K.; Roth, B.; Morgner, U. Real-time stimulated Raman spectroscopy with a non-collinear optical parametric oscillator. Opt. Express 2021, 29, 31499–31507. [Google Scholar] [CrossRef] [Scilit] [PubMed]
- Kumar Mishra, K.; Narayanan Dhamu, V.; Muthukumar, S.; Prasad, S. Quick and Sensitive Two-Plex Electrochemical Platform for Pathogen Detection in Water. Nano Sel. 2025, 6, e70017. [Google Scholar] [CrossRef] [Scilit]
- Mishra, K.K.; Dhamu, V.N.; Jophy, C.; Muthukumar, S.; Prasad, S. Electroanalytical Platform for Rapid E. coli O157:H7 Detection in Water Samples. Biosensors 2024, 14, 298. [Google Scholar] [CrossRef] [Scilit] [PubMed]
- Mishra, K.K.; Dhamu, V.N.; Poudyal, D.C.; Muthukumar, S.; Prasad, S. PathoSense: A rapid electroanalytical device platform for screening Salmonella in water samples. Microchim. Acta 2024, 191, 146. [Google Scholar] [CrossRef] [Scilit] [PubMed]
- Sarmiento, J.; Anaya, M.; Tibaduiza, D. Microplastic Identification Using Impedance Spectroscopy and Machine Learning Algorithms. Int. J. Distrib. Sens. Netw. 2024, 2024, 5298635. [Google Scholar] [CrossRef] [Scilit]
- Makmuang, S.; Aït-Kaddour, A. Assessment of microplastic contamination in shrimp utilizing multispectral imaging, fluorescence, and infrared spectroscopy. J. Food Compos. Anal. 2025, 146, 107864. [Google Scholar] [CrossRef] [Scilit]
- Morris, S.; Sarlin, P.J.; Morris, S.; Joseph, P. Microplastic ingestion and retention in penaeid shrimp from the Arabian Sea. Discov. Environ. 2025, 3, 28. [Google Scholar] [CrossRef] [Scilit]
- Seggio, M.; Arcadio, F.; Radicchi, E.; Cennamo, N.; Zeni, L.; Bossi, A.M. Toward Nano- and Microplastic Sensors: Identification of Nano- and Microplastic Particles via Artificial Intelligence Combined with a Plasmonic Probe Functionalized with an Estrogen Receptor. ACS Omega 2024, 9, 18984–18994. [Google Scholar] [CrossRef] [Scilit]
- Poudyal, D.C.; Mohammed, S.; Evertse, L.L.; Nguyen, M.T.; Tanchez, C.N.; Patel, A.; Dhamu, V.N.; Mishra, K.; Muthukumar, S.; Prasad, S. TRACE-QUAD: A Multiplexed Electrochemical Platform for Ultrasensitive Detection of Diquat, Paraquat, Glyphosate, and Chlorpyrifos in Drinking Water. J. Agric. Food Chem. 2026, 74, 11969–11979. [Google Scholar] [CrossRef] [Scilit]
- Karmakar, S.; Poudyal, D.; Mishra, K.K.; Dhamu, V.N.; Muthukumar, S.; Prasad, S. Label-free electrochemical biosensor for real-time detection of live Salmonella typhimurium in salad samples using non-Faradaic EIS. Biosens. Bioelectron. 2025, 290, 117961. [Google Scholar] [CrossRef] [Scilit] [PubMed]
- Curulli, A. Electrochemical biosensors in food safety: Challenges and perspectives. Molecules 2021, 26, 2940. [Google Scholar] [CrossRef] [Scilit]
- Kamel, A.H.; Hefnawy, A.; Hazeem, L.J.; Rashdan, S.A.; Abd-Rabboh, H.S.M. Current perspectives, challenges, and future directions in the electrochemical detection of microplastics. RSC Adv. 2024, 14, 2134–2158. [Google Scholar] [CrossRef] [Scilit]
- Oranzie, M.; January, J.L.; Sanga, N.A.; Leve, Z.D.; Mini, S.; Cupido, C.; Douman, S.F.; Iwuoha, E.I. Aptamer-Driven Biosensor Technology for the Quantitative Analysis of C-Reactive Protein. ChemElectroChem 2025, 12, e202400667. [Google Scholar] [CrossRef] [Scilit]
- Shan, S.; Liu, D.; Guo, Q.; Wu, S.; Chen, R.; Luo, K.; Hu, L.; Xiong, Y.; Lai, W. Sensitive detection of Escherichia coli O157: H7 based on cascade signal amplification in ELISA. J. Dairy Sci. 2016, 99, 7025–7032. [Google Scholar] [CrossRef] [Scilit]
- Abdulmawjood, A.; Bülte, M.; Cook, N.; Roth, S.; Schönenbrücher, H.; Hoorfar, J. Toward an international standard for PCR-based detection of Escherichia coli O157: Part 1. Assay development and multi-center validation. J. Microbiol. Methods 2003, 55, 775–786. [Google Scholar] [CrossRef] [Scilit]
- Gilgen, M.; Hübner, P.; Höfelein, C.; Lüthy, J.; Candrian, U. PCR-based detection of verotoxin-producing Escherichia coli (VTEC) in ground beef. Res. Microbiol. 1998, 149, 145–154. [Google Scholar] [CrossRef] [Scilit]
- Mukhopadhyay, A.; Mukhopadhyay, U.K. Novel multiplex PCR approaches for the simultaneous detection of human pathogens: Escherichia coli 0157: H7 and Listeria monocytogenes. J. Microbiol. Methods 2007, 68, 193–200. [Google Scholar] [CrossRef] [Scilit] [PubMed]
- Wang, H.; Gill, C.O.; Yang, X. Development of a real-time PCR procedure for quantification of viable Escherichia coli in populations of E. coli exposed to lactic acid, and the acid tolerance of verotoxigenic E. coli (VTEC) from cattle hides. Food Control 2014, 43, 104–109. [Google Scholar] [CrossRef] [Scilit]
- Jacangelo, J.G.; Askenaizer, D.J.; Schwab, K. Research needs in drinking water: A basis in regulations in the United States. J. Water Health 2006, 4, 1–9. [Google Scholar] [CrossRef] [Scilit]
- D1141-98; Standard practice for the preparation of substitute ocean water. ASTM Standard; ASTM International: West Conshohocken, PA, USA, 2013.
- Dziedzic, I.; Kertmen, A. Methods of Chitosan Identification: History and Trends. Lett. Appl. NanoBioScience 2023, 12, 94. [Google Scholar] [CrossRef] [Scilit]
- Kumirska, J.; Czerwicka, M.; Kaczyński, Z.; Bychowska, A.; Brzozowski, K.; Thöming, J.; Stepnowski, P. Application of spectroscopic methods for structural analysis of chitin and chitosan. Mar. Drugs 2010, 8, 1567–1636. [Google Scholar] [CrossRef] [Scilit] [PubMed]
- Poudyal, D.C.; Dhamu, V.N.; Paul, A.; Samson, M.; Muthukumar, S.; Prasad, S. A novel single step method to rapidly screen for metal contaminants in beverages, a case study with aluminum. Environ. Technol. Innov. 2022, 28, 102691. [Google Scholar] [CrossRef] [Scilit]
- Wilkowska, A.; Biziuk, M. Determination of pesticide residues in food matrices using the QuEChERS methodology. Food Chem. 2011, 125, 803–812. [Google Scholar] [CrossRef] [Scilit]
- Spiro, J.C.K.; Mishra, K.K.; Dhamu, V.N.; Bhatia, A.; Muthukumar, S.; Prasad, S. Development of a portable electrochemical sensing platform for impedance spectroscopy-based biosensing using an ARM-based microcontroller. Sens. Diagn. 2024, 3, 1835–1842. [Google Scholar] [CrossRef] [Scilit]
- Noby, M.; Das, P.K.; Asad, M.A.; Almy, W.; Shamsi, M.H. Charge Modulation at Nucleic Acid/MoS2 Interfaces: Insights from Chronocoulometry for 2D Material-Based Biosensing. ACS Omega 2025, 10, 52060–52066. [Google Scholar] [CrossRef] [Scilit]
- Shi, X.; Han, H.; Ma, Z.; Yang, H. Chronocoulometry signal amplification using in-situ Prussian Blue conductive hydrogel for advanced electrochemical antifouling sensing. Chem. Eng. J. 2025, 516, 163997. [Google Scholar] [CrossRef] [Scilit]
- Motalebizadeh, A.; Fardindoost, S.; Hoorfar, M. Selective on-site detection and quantification of polystyrene microplastics in water using fluorescence-tagged peptides and electrochemical impedance spectroscopy. J. Hazard. Mater. 2024, 480, 136004. [Google Scholar] [CrossRef] [Scilit] [PubMed]
- Li, J.Y.Q.; Nankervis, L.; Dawson, A.L. Digesting the Indigestible: Microplastic Extraction from Prawn Digestive Tracts. Front. Environ. Chem. 2022, 3, 903314. [Google Scholar] [CrossRef] [Scilit]
- Poudyal, D.C.; Dhamu, V.N.; Samson, M.; Muthukumar, S.; Prasad, S. Pesticide analytical screening system (PASS): A novel electrochemical system for multiplex screening of glyphosate and chlorpyrifos in high-fat and low-fat food matrices. Food Chem. 2023, 400, 134075. [Google Scholar] [CrossRef] [Scilit]
- Mishra, K.K.; Thakkar, K.M.; Dhamu, V.N.; Muthukumar, S.; Prasad, S. Electrochemical Sensor Platform for Rapid Detection of Foodborne Toxins. Biosensors 2025, 15, 361. [Google Scholar] [CrossRef] [Scilit] [PubMed]
- Colson, B.C.; Michel, A.P.M. Flow-Through Quantification of Microplastics Using Impedance Spectroscopy. ACS Sens. 2021, 6, 238–244. [Google Scholar] [CrossRef] [Scilit] [PubMed]
- Grossi, M.; Omaña, M. Data Analysis of Electrical Impedance Spectroscopy-Based Biosensors Using Artificial Neural Networks for Resource Constrained Devices. J. Low Power Electron. Appl. 2025, 15, 56. [Google Scholar] [CrossRef] [Scilit]
- Mishra, K.K.; Dhamu, V.N.; Kokala, A.; Muthukumar, S.; Prasad, S. Advancing food Safety: Two-plex electrochemical biosensor for mycotoxin detection in food matrices. Biosens. Bioelectron. X 2025, 25, 100626. [Google Scholar] [CrossRef] [Scilit]
Disclaimer/Publisher’s Note: The statements, opinions and data contained in all publications are solely those of the individual author(s) and contributor(s) and not of MDPI and/or the editor(s). MDPI and/or the editor(s) disclaim responsibility for any injury to people or property resulting from any ideas, methods, instructions or products referred to in the content. |
© 2026 by the authors. Licensee MDPI, Basel, Switzerland. This article is an open access article distributed under the terms and conditions of the Creative Commons Attribution (CC BY) license.