


Abstract
Functionalized carbon-based materials have recently attracted attention for the efficient removal of complex pollutants, including dyes. In this study, agave bagasse, an abundant by-product of the Mexican tequila industry, was used as biomass to produce H2SO4-modified hydrochar (HC) for the removal of Reactive Orange 84 (RO84). FTIR-ATR analysis revealed characteristic signals of –SO3H groups in the functionalized HC. BET characterization showed a broad range of surface areas and pore volumes, with pore radio indicating nano-, micro-, and mesoporous structures, depending on the acid concentration used during synthesis. TGA and XRD analyses indicated that higher acid concentration promoted the depolymerization of biomass components. Adsorption assays demonstrated that increasing H2SO4 concentrations enhanced dye removal. Post-adsorption FTIR-ATR analysis revealed signal shifts consistent with interactions between sulfonated groups and dye RO84. Statistical and mathematical analyses showed that optimal results were achieved by combining high acid concentrations during HC synthesis with high HC dosages during adsorption.
1. Introduction
Every year, the tequila industry in Mexico generates thousands of tons of agave bagasse as a by-product [1]. The waste, rich in fiber and lignocellulosic compounds, tends to accumulate in large quantities, creating environmental and management challenges for producers [2]. Consequently, developing strategies to reuse this biomass has become essential, not only to minimize its environmental impact but also to promote an integrated utilization model.
Among the various options for recovering value from this material, the hydrothermal carbonization (HTC) process is considered one of the most effective methods for managing solid waste with high moisture content [3]. It has advantages such as economic flexibility, lower energy consumption than other thermal treatments (e.g., pyrolysis), and higher product yield than other thermochemical techniques [4]. The HTC converts biomass into a carbonaceous material, so-called hydrochar, whose advantages include high stability, a porous structure, and the fact that it can be modified to improve chemical and physical properties (e.g., adsorption capacity) [5,6,7,8,9]. Of the different functionalization methods, acid modification stands out because it improves surface properties by increasing the number of oxygenated and sulfonated groups, thereby enhancing its ability to remove organic contaminants by adsorption [10]. For example, sulfuric acid functionalization introduces −SO3H groups, thereby increasing the adsorption capacity of dyes and the density of active sites [11].
Wastewater treatment using adsorption by carbon-based porous materials is a complex process that requires the control of multiple parameters to improve contaminant removal. Therefore, optimization methods have been used to simplify the process by reducing the number of experiments, increasing the initial concentration of the target contaminant, and decreasing the use of adsorbents and pH modifiers, thereby reducing operating costs [12,13]. One of the most common optimization methods is the use of experimental design, such as the application of a general polynomial equation, which can be used to identify the factors with the most significant influence on the contaminant’s adsorption capacity [14]. However, they have the disadvantage of being based on empirical polynomial fits that are only valid within the experimental domain. Furthermore, they can mask mechanistic relationships, may overfit or misrepresent behavior when interactions are complex or when responses are non-polynomial, and require careful selection of factor ranges and sufficient trial numbers, else results can be biased or non-reproducible [15].
Recent studies have demonstrated that artificial intelligence (AI) models are reliable in terms of optimizing different water treatments compared with conventional models, such as adsorption processes using hydrochar. For example, artificial neural network (ANN) and multiple regression analyses (including linear, decision tree, support vector, and random forest) were used to predict the performance of an adsorption process for the removal of organic contaminants from a water matrix [12,16]. Nevertheless, these models have some limitations, such as the risk of getting stuck at a local minimum [17]. Also, since the model’s accuracy improves as more real experimental datasets are used for training, they are limited by the large amount of resources required [18]. Finally, because ANNs are considered black-box models, they cannot identify the complex nonlinear interactions that drive higher removal efficiency. Therefore, it is necessary to use an optimization tool that reduces the range of possible interactions to be tested in order to achieve the maximum removal efficiency of the target contaminant in an adsorption process [19]. For instance, studies have used genetic algorithms (GAs) based on Darwin’s theory of evolution, which apply selection criteria to create a population of individuals (experimental conditions of the adsorption process) then randomly select parents to reproduce and generate new individuals [20].
The objective of this work is to synthesize and characterize the hydrochar functionalized with H2SO4 from agave bagasse, evaluate its performance for the adsorption of Reactive Orange 84, and develop an ANN-GA model to predict and optimize the operating conditions for maximum dye removal. The novelty of this study lies in combining sulfonated hydrocarbon from agave bagasse with a data-driven ANN-GA optimization framework, trained on a large experimental dataset, to accurately model and optimize the removal of anionic dyes.
2. Materials and Methods
2.1. Materials
Agave bagasse (Tequila, Jalisco, Mexico), Sulfuric acid (Karal, Leon, Guanajuato, Mexico, 98%), and Reactive Orange 84 (Quimica-Mexifibras brand, Leon, Guanajuato, Mexico) were used in this study.
2.2. Production of Hydrochar
Hydrochar from agave bagasse (HCBA) was produced via hydrothermal carbonization. The agave bagasse (BA) was first dried at 80 °C for approximately 3 h, until completely dry, then crushed and sieved to a particle size of 1 mm. The methodology was based on that developed by our research group [21,22]. PTFE liners were filled to 49.5% of their volume, with 1.07 g of BA and 8.91 mL of sulfuric acid (H2SO4) solutions of 0.025, 0.05, 0.1, 0.125, 0.2, 0.25, and 0.5 M. A neutral control was prepared using distilled water instead of acid. The liners were placed in stainless steel YVZOTCK reactors (Industrial KEM, Leon, Guanajuato, Mexico) and heated in a muffle furnace (Paragon Industries, L.P., Mesquite, TX, USA) at 200 °C for 24 h, reaching an internal pressure of ca. 2 MPa. After the reaction, the reactors were allowed to cool to room temperature, and the resulting HC was filtered through Whatman No. 1 filter paper (Sigma-Aldrich’s, St Louis, MO, USA) for 24 h.
2.3. Characterization
Thermogravimetric analysis (TGA) was performed using approximately 17 ± 0.5 mg of HC in an alumina pan. The samples were heated from room temperature to 700 °C at 10 °C min−1 using an SDT Q600 instrument (TA Instruments, New Castle, DE, USA). Fourier-transform infrared spectroscopy sampling with Attenuated Total Reflectance (FTIR-ATR) was performed to identify surface functional groups using a Thermo Scientific Smart iTR (Nicolet iS10, Thermo Fisher Scientific, Waltham, MA, USA) spectrometer equipped with a diamond ATR over the wavenumber range of 500–4000 cm−1. X-ray diffraction (XRD) analysis was performed using a Phillips X’Pert MPD diffractometer (Malvern Panalytical, Almelo, The Netherlands) equipped with a curved graphite monochromator and Cu Kα radiation (λ = 1.54056 Å). The Brunauer–Emmet–Teller (BET) Method-specific surface area and pore size distribution were determined by employing the Quantachrome NOVA 4200e (SpectraLab Scientific Inc., Markham, ON, Canada). The gas adsorption system uses nitrogen as the adsorbent. Experiments for adsorption isotherms were performed at 77.35 K with a P/P0 relative pressure ratio of 0.050/0.100 (adsorption/desorption).
2.4. Dye Removal Experiments
Reactive Orange 84 (RO84) was used as the model pollutant in a synthetic solution at an initial concentration of 0.1 g L−1. The dye solution was mixed in beakers with HCBA at different dosages (10, 8, 6, 4, and 2 g L−1) and agitated in a shaker at 160 rpm for 24 h. All experiments were performed in triplicate. After agitation, samples were filtered through a Whatman No. 1 paper filter and allowed to dry for 24 h. Aliquots of 5 mL were taken and analyzed using UV-Visible spectroscopy at 492 nm to determine dye concentration (Figure S1). Adsorption data were fitted to the Freundlich and Langmuir isotherm models.
2.5. Data Analysis
2.5.1. Statistical Analysis
A statistical approach combining descriptive and inferential analysis was applied. Descriptive statistics included measures of central tendency, dispersion, and shape, specifically mean, standard deviation, coefficient of variation, skewness, and kurtosis. Box-and-whisker plots were used to identify outliers and visualize treatment distributions. Normality assumptions were assessed using the Shapiro–Wilk, D’Agostino K2 [14], and Anderson–Darling tests [23,24,25]. Equality of variances was evaluated using Levene and Bartlett tests.
Non-parametric methods were employed where appropriate. The Kruskal–Wallis test identified overall differences among treatments [26,27], followed by Dunn’s post hoc test with Bonferroni correction [28] to determine which pairs of H2SO4 concentrations and HC dosages showed significant differences. Spearman’s correlation was used to quantify the strength and direction of associations among H2SO4 concentration, HC dosage, absorbance, residual dye concentration, and removal efficiency [29]. Finally, a multiple linear regression model was fitted to predict removal efficiency as a function of experimental factors [30].
2.5.2. Artificial Neural Network: GA Model
For the performance of the ANN, real experimental data collection is required. A total of 432 experiments with four variables was used to control and evaluate the behavior of removal efficiency under the controlled parameters. The next step involved designing the ANN architecture, testing several configurations with inputs such as H2SO4 molar concentration, hydrochar ratio per liter of solution, and initial dye concentration. Finally, one output was used: removal efficiency. Since there is no established methodology for determining the number of hidden layers, the number of neurons in the hidden layer, or the transfer functions, this step was performed through trial and error. The modeling was carried out using MATLAB software (R2014a). The ANN was trained using a multilayer perceptron with the Levenberg–Marquardt Backpropagation (LMBP) algorithm. Of the 432 experimental datasets collected, 70% were used for training the ANN, 20% for testing, and the remaining 10% for validation, based on the root mean squared error (RMSE, Equation (1)) and the mean absolute percentage error (MAPE, Equation (2)).
To optimize the adsorption process, the GA evaluates the universe of operational condition combinations (individuals), seeking the best one through crossover probability (85%) and mutation (10%) to avoid getting stuck in local minima. The initial population consisted of 50 individuals, with an elite count of 4 individuals. The upper and lower bounds for the input variables were determined from the experimental data, as shown in Table S1. As with ANN modeling, no specific methodology has been established for determining the initial GA parameters [31]. Therefore, the parameter values for initial population size, mutation rate, individual selection, and crossover type were determined by trial and error.
3. Results and Discussion
3.1. FTIR-ATR
Figure S2 shows the FTIR spectra of the agave bagasse raw material. The broad band around 3300 cm−1 is attributed to O-H stretching, due to the presence of polysaccharides and water [32]. The signals observed at ~2920 and 2850 cm−1 correspond to C-H stretching vibrations associated with aliphatic chains of cellulose, hemicellulose, and lignin [2]. The presence of a band around 1730 cm−1 is associated with the C=O stretching of carbonyl groups, characteristic of acetyl and ester groups in hemicellulose [33], while the bands located between 1600 and 1500 cm−1 are assigned to the vibrations of the aromatic ring of lignin [34]. In the region of 1450–1370 cm−1, C-H deformations characteristic of cellulose are identified [35], and the signals between 1260 and 1230 cm−1 are related to C-O and C-O-C vibrations of ether bonds present in hemicellulose and lignin [36]. Finally, between 1160 and 900 cm−1, polysaccharide vibrations are identified, highlighting the intense band around 1030 cm−1 associated with C-O stretching [37] and the signal near 896 cm−1 attributed to the β-(1→4)-glucosidic bond [38].
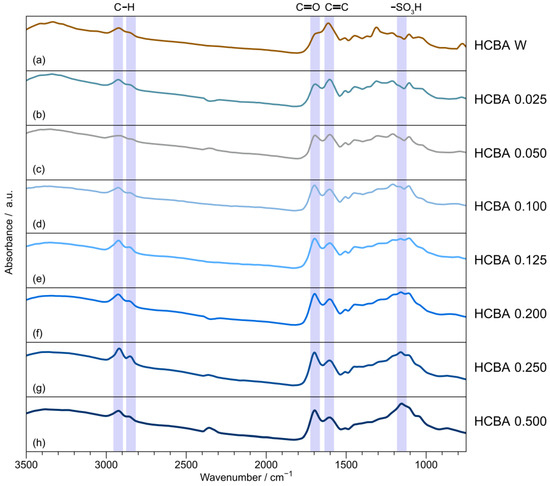
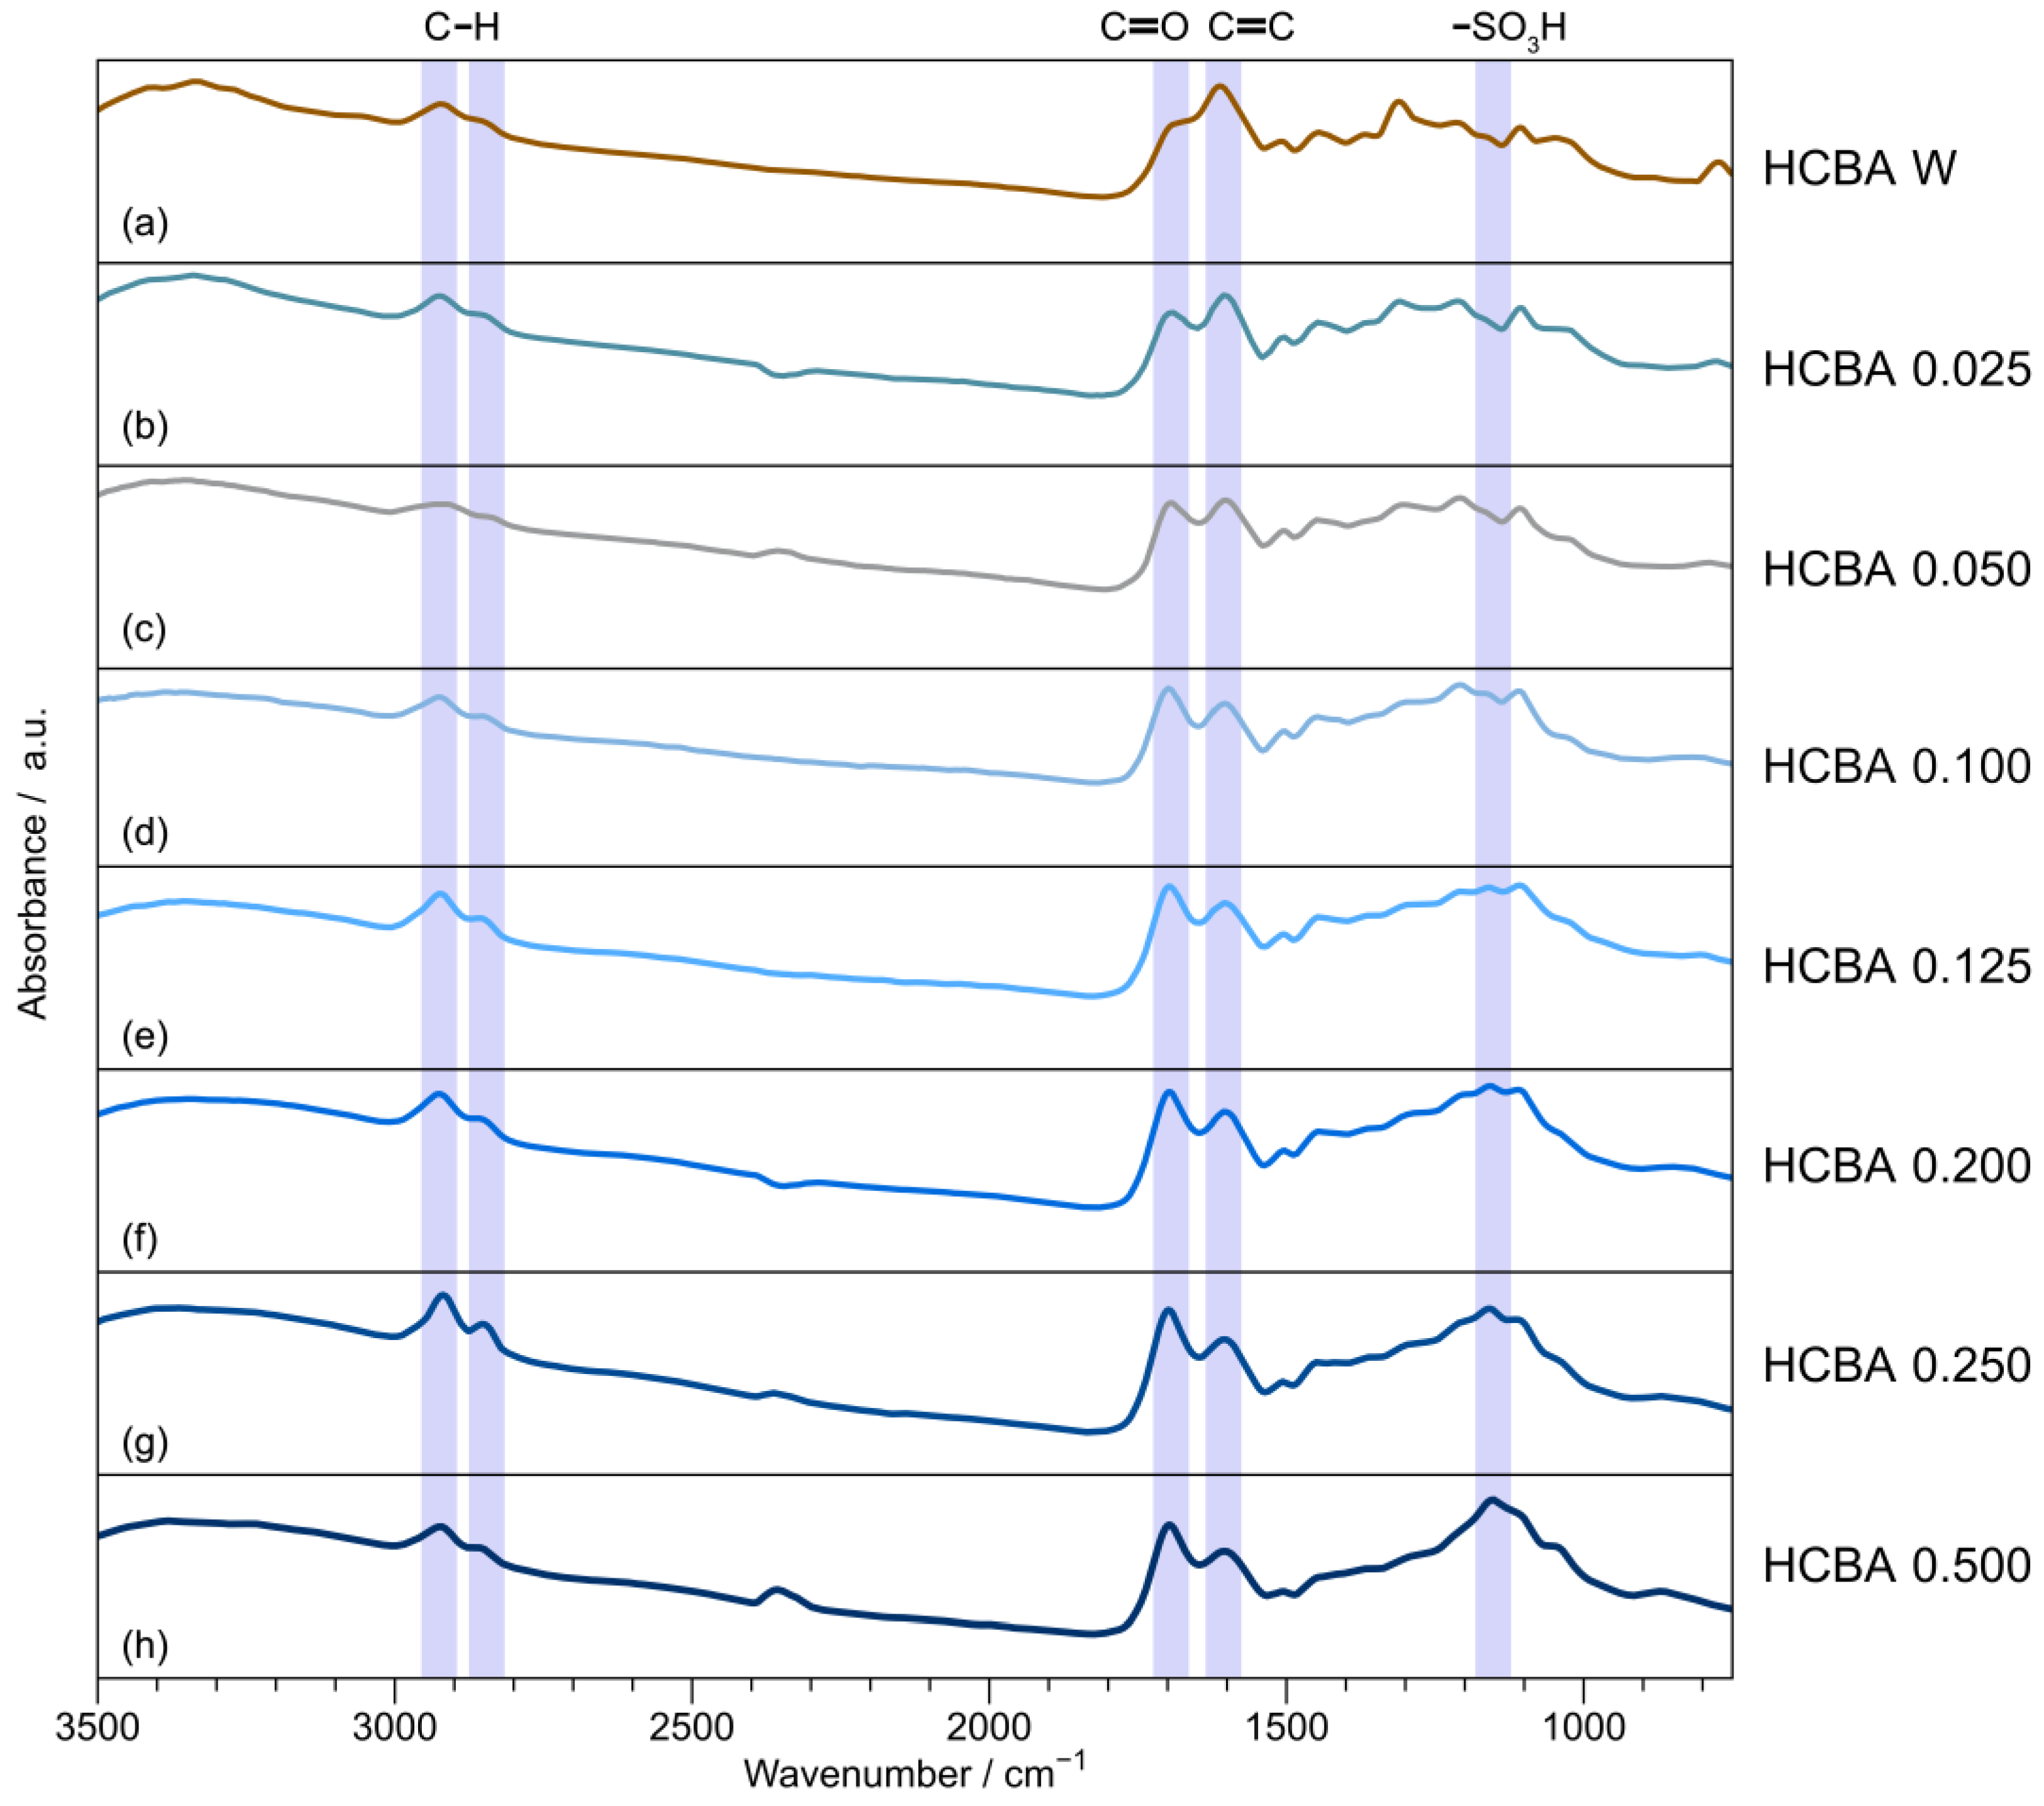
On the other hand, Figure 1 shows the FTIR spectra of HCBA W, which was performed in distilled water without adding the sulfuric acid solution. It can be observed that the bands corresponding to hemicellulose, lignin, and cellulose are still present, although a decrease in their intensity is observed, indicating a partial degradation of these components [39].
Figure 1.
FTIR-ATR spectroscopy of (a) HCBA W; (b) HCBA 0.025; (c) HCBA 0.05; (d) HCBA 0.1; (e) HCBA 0.125; (f) HCBA 0.2; (g) HCBA 0.25; and (h) HCBA 0.5.
Figure 1 shows the FTIR spectra of the materials produced. The signals at 2920 and 2848 cm−1 correspond to C–H stretching vibrations, which can be attributed to aliphatic –CH, –CH2, and –CH3 groups derived from lignocellulosic compounds abundantly present in the biomass [40]. The bands at 1695 and 1600 cm−1 are associated with the stretching vibrations of C=C and C=O bonds, characteristic of aromatic compounds in agave bagasse [9,41]. Furthermore, additional peaks between 1161 and 1152 cm−1 indicate the presence of –SO3H groups, while the signal at 1043 cm−1 corresponds to symmetric O–S–O stretching [42]. These features confirm the successful sulfonation of the hydrochar (HC) surface. The results suggest that hydrolysis in the acidic medium altered the structure of the hydrochar, introducing sulfonic functional groups that enhance its adsorption potential.
3.2. TGA
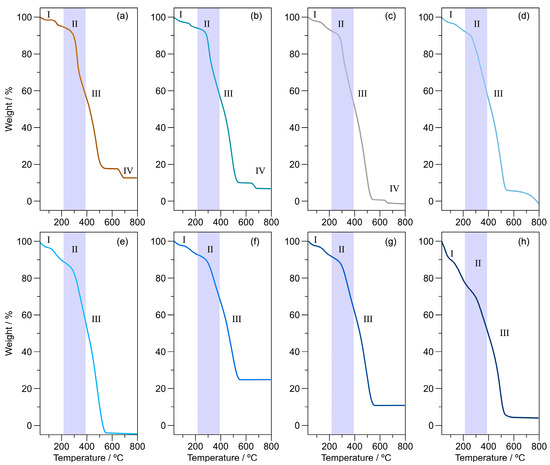
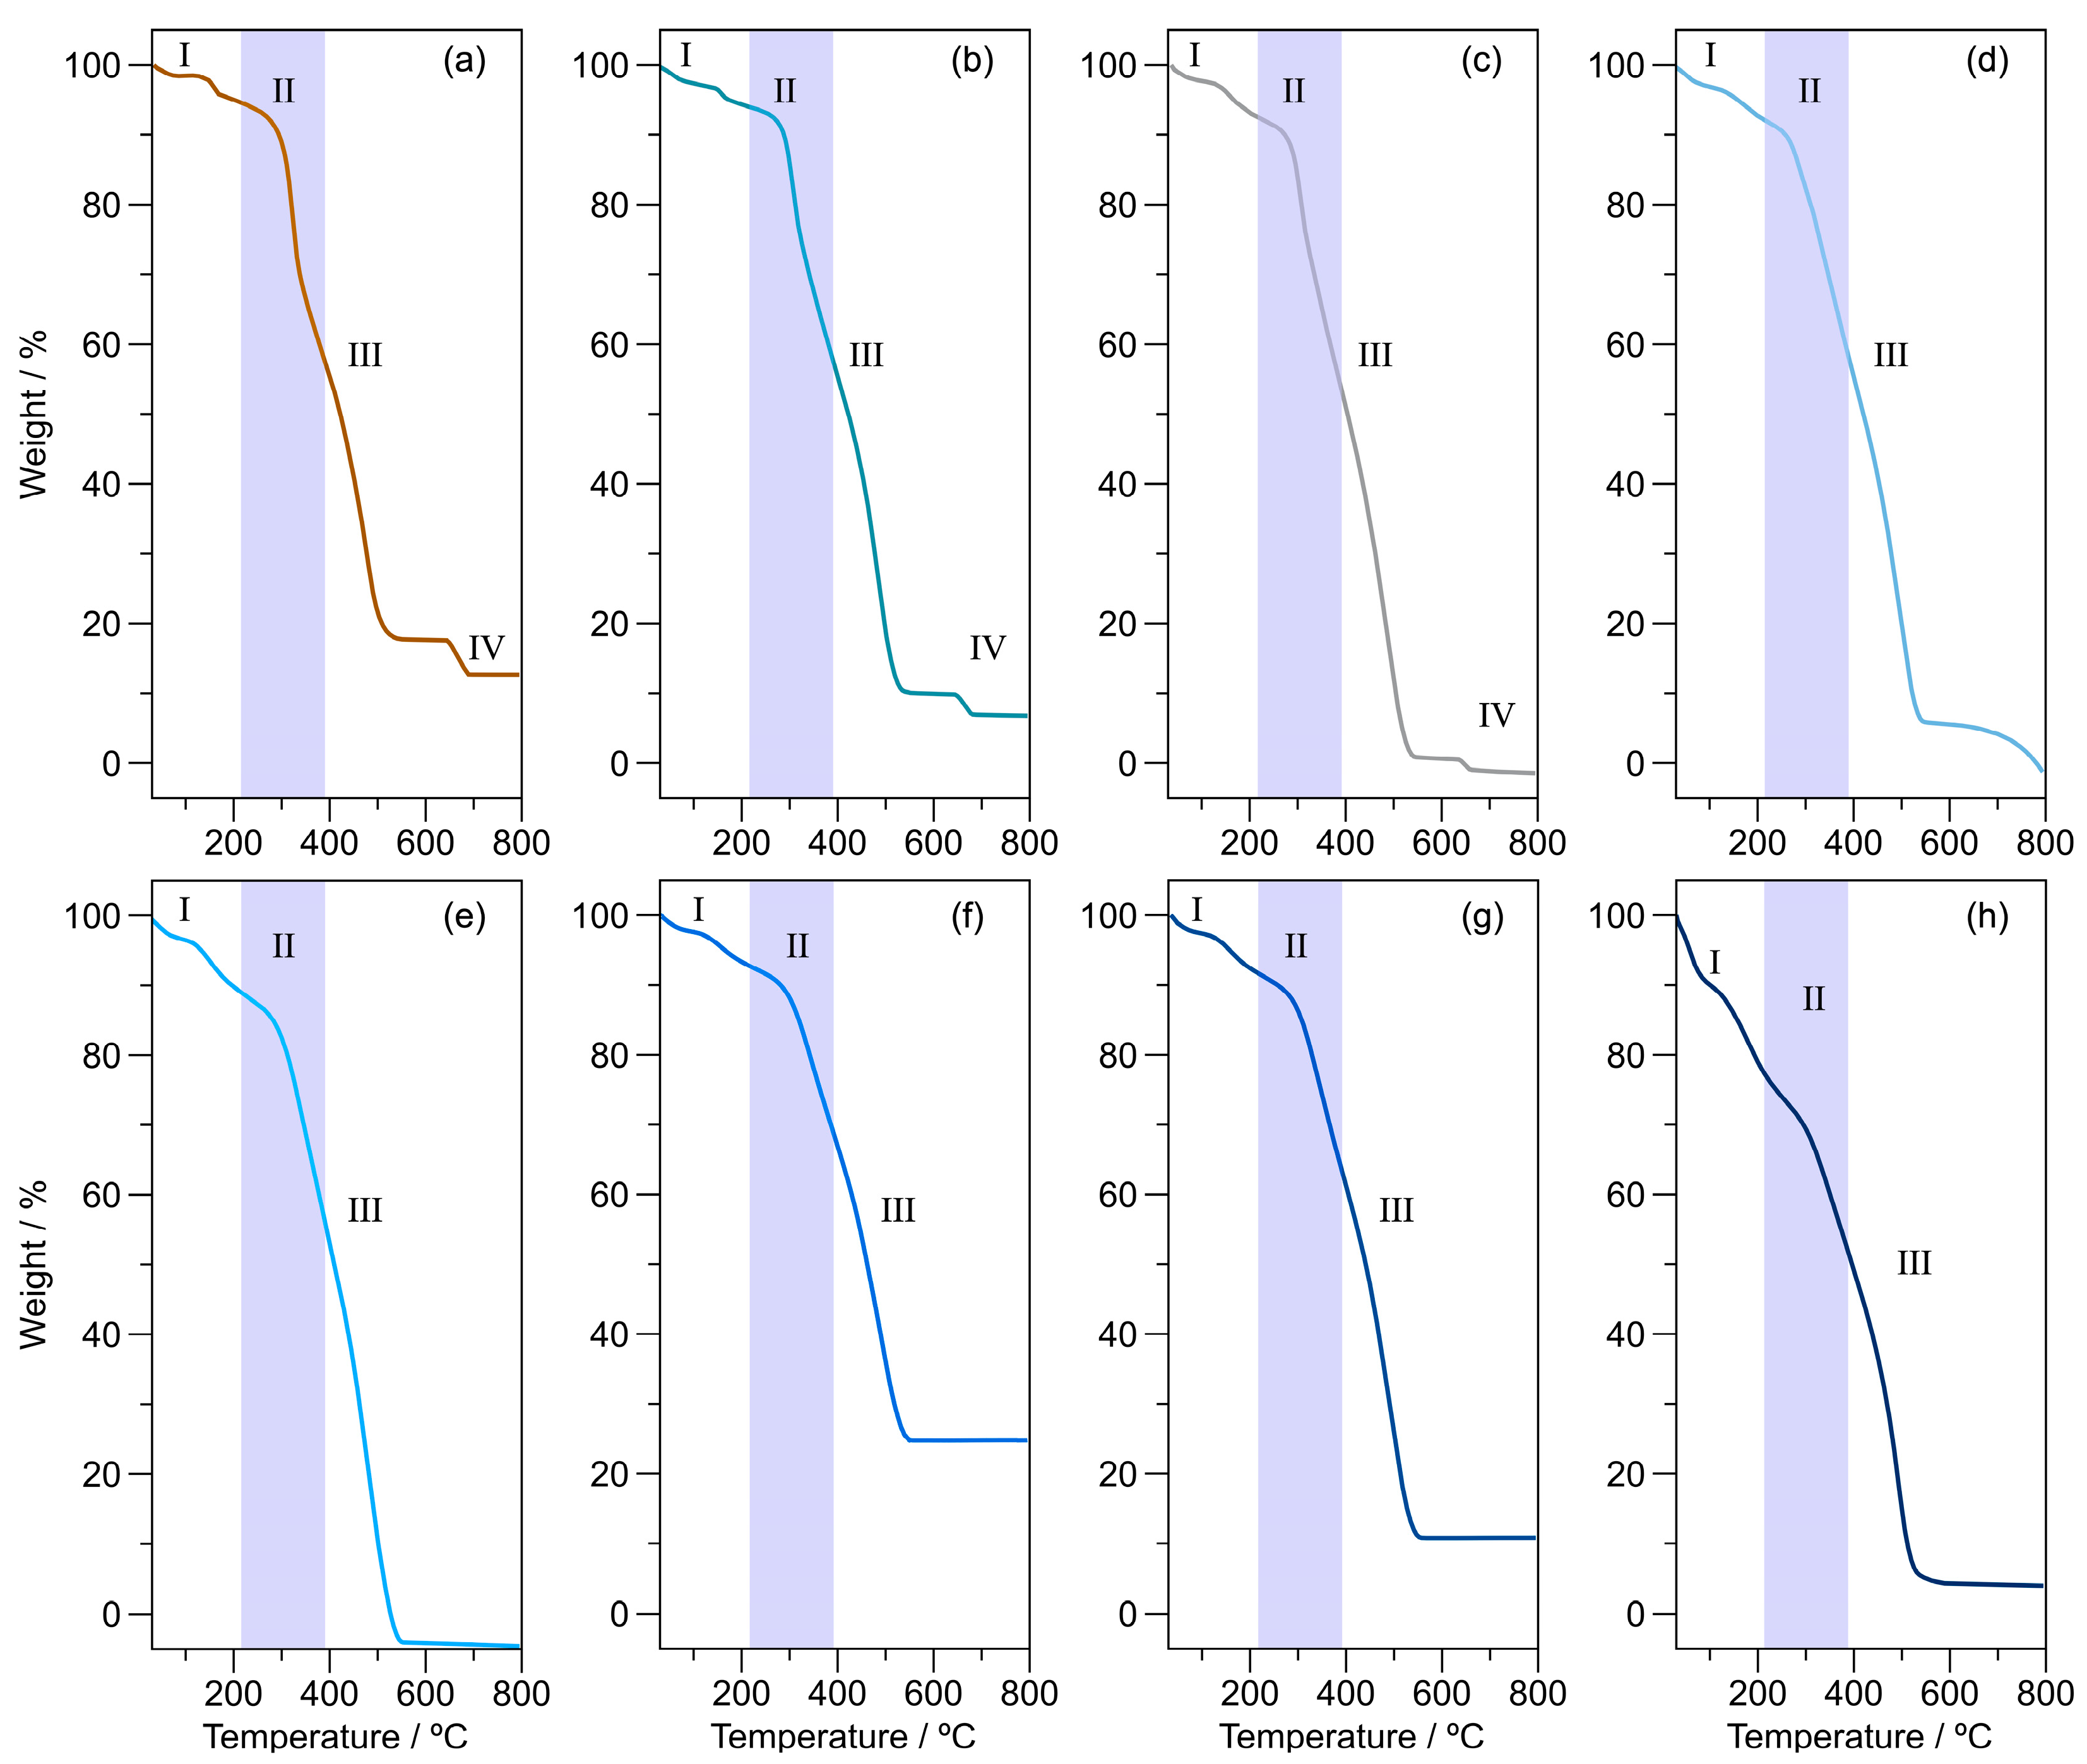
Figure 2 displays the TGA curves of the synthesized samples, all showing three to four major weight-loss stages (I–IV). The first weight loss (~30–200 °C, I) corresponds to the evaporation of water and light volatile compounds. The second stage (228–390 °C, II blue color) is attributed to the depolymerization of cellulose and hemicellulose, while losses above 400 °C (III) are associated with lignin degradation or char oxidation [43]. As shown in Figure 2a–c an additional weight loss beyond 600 °C (IV) was observed, which has been reported as the complete burnout of solid carbonaceous material [44]. A noticeable trend is that increasing the acid concentration during synthesis reduces the percentage of cellulose and hemicellulose depolymerization, indicating that the reaction temperature may be insufficient for complete degradation of these components [45]. Nevertheless, higher sulfuric acid concentrations (Figure 2d–h) appear to promote hydrolysis, facilitating structural modification of the biomass.
Figure 2.
TGA thermograms of (a) HCBA W; (b) HCBA 0.025; (c) HCBA 0.05; (d) HCBA 0.1; (e) HCBA 0.125; (f) HCBA 0.2; (g) HCBA 0.25; and (h) HCBA 0.5. The depolymerization of cellulose and hemicellulose is referred to as stage II, marked in blue.
3.3. XRD
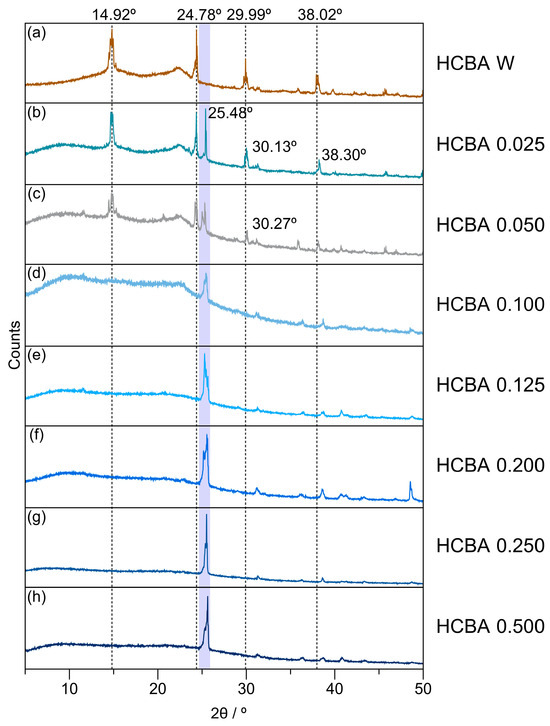
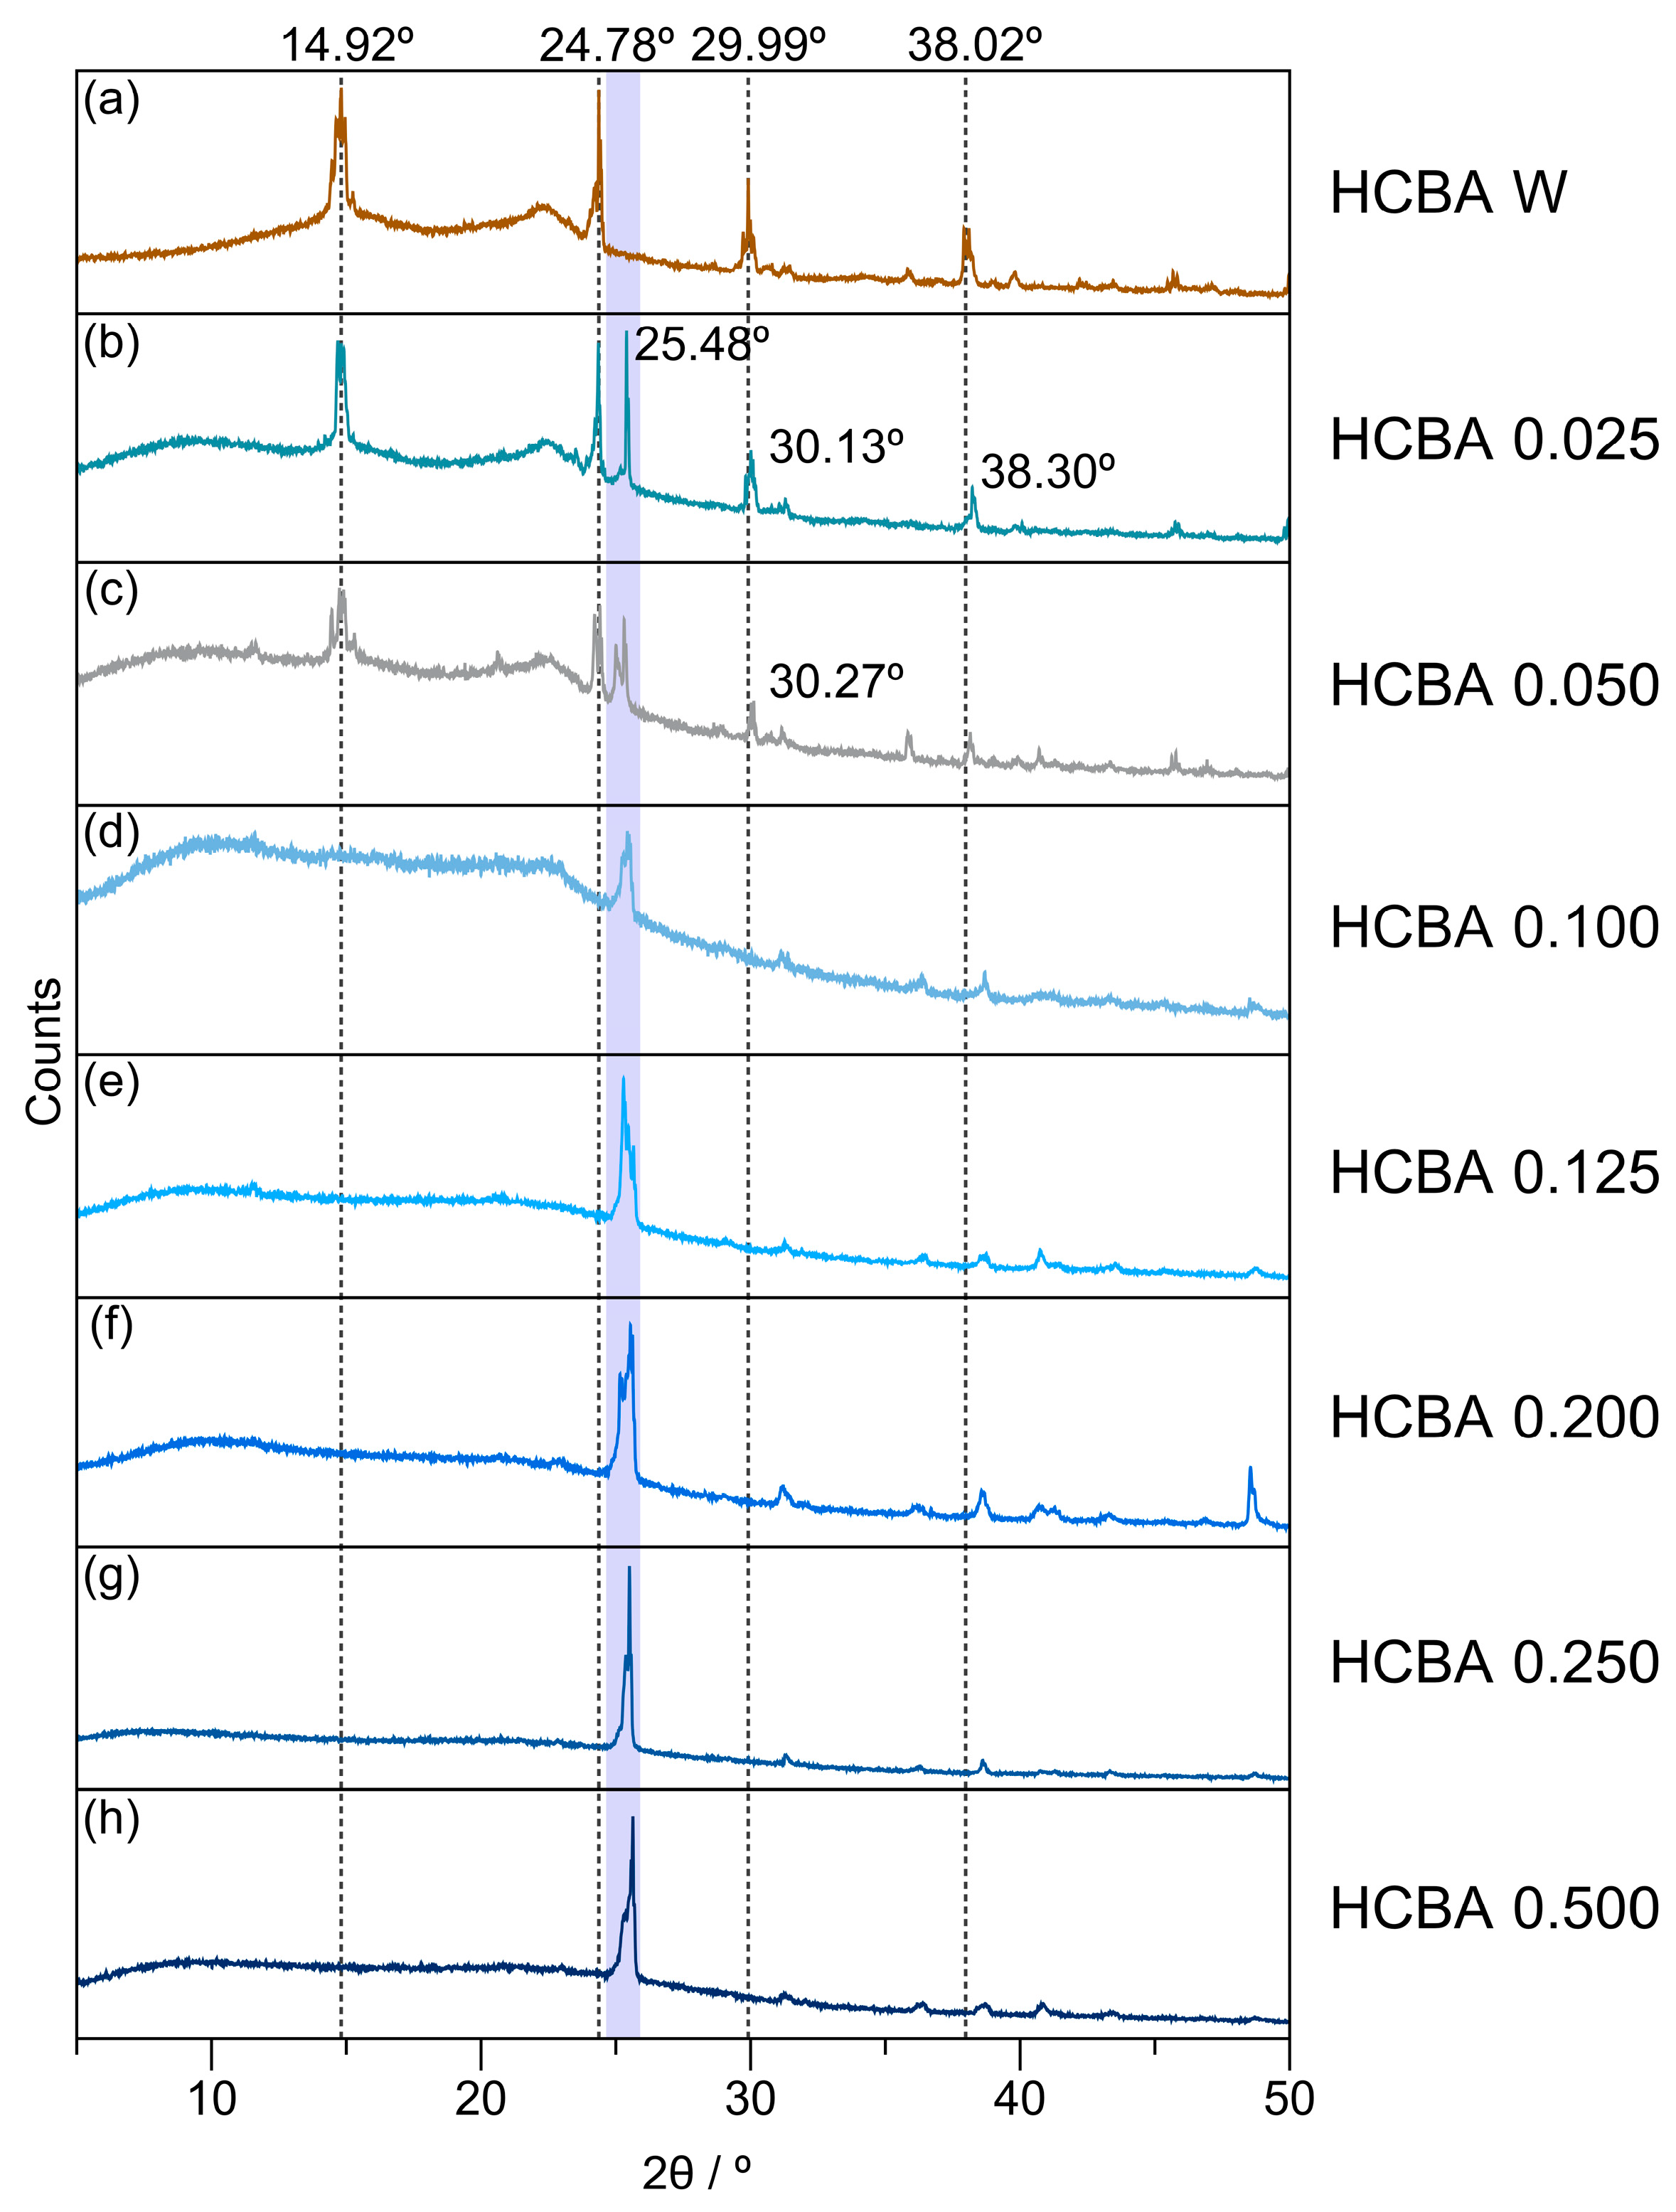
Figure 3 presents the XRD diffractograms of the modified HC samples. The untreated biomass (Figure 3a, HCBA W) exhibited peaks at 14.92°, 24.78°, 29.99°, and 38.02°. In contrast, HCBA 0.025 (Figure 3b) displayed peaks at 14.78°, 24.35°, 25.48°, 30.13°, and 38.30°, and HCBA 0.05 (Figure 3c) showed peaks at 15.06°, 24.49°, 25.48°, and 30.27°. Samples prepared with higher acid concentrations (HCBA 0.1 to HCBA 0.5) showed a single peak near 25°, indicating a progressive loss of crystallinity, Figure 3d–h.
Figure 3.
XRD diffractograms of the samples: (a) HCBA W; (b) HCBA 0.025; (c) HCBA 0.05; (d) HCBA 0.1; (e) HCBA 0.125; (f) HCBA 0.2; (g) HCBA 0.25; and (h) HCBA 0.5. Blue zone indicates amorphous carbon microcrystallites formation during hydrothermal treatment.
Samples exhibiting multiple peaks correspond to the amorphous carbon structure and residual cellulose from agave bagasse, suggesting incomplete carbonization [46]. As the H2SO4 concentration increased, these peaks diminished and eventually disappeared, indicating hydrolysis of lignocellulosic components. This result aligns with the TGA data, where higher acid concentrations led to less mass loss, consistent with enhanced hydrolysis. In addition, the disappearance of characteristic cellulose peaks around 25° suggests the formation of amorphous carbon microcrystallites during hydrothermal treatment, similar to reports describing cellulose structure destruction upon acid addition [47,48].
3.4. BET
Table S2 summarizes the BET surface area and pore structure data of the synthesized HCs. Based on pore radius, most samples were nanoporous, except for HCBA 0.05 (macroporous) and HCBA 0.1 (mesoporous). In general, pore volume decreased from 0.21 to approximately 0.10–0.15 cm3 g−1, except for HCBA 0.05 and HCBA 0.1, which exhibited increased values of 0.51 and 0.63 cm3 g−1, respectively. Surface areas ranged from 21.90 to 39.15 m2 g−1. These findings are consistent with those reported by Al-Labadi et al. [41], who observed a surface area of 26.4 m2 g−1 in sulfuric acid-treated coal. The variations in pore structure and surface area can be attributed to the degree of acid activation and hydrolysis of organic components during synthesis. Similarly, the isotherms from the analysis are shown in Figure S3, which can be attributed to type III due to their shape. In this case, the formation of a monolayer is not identified; the interactions between the adsorbent and the adsorbate are now relatively weak, and the adsorbed molecules cluster around the most favorable sites on the surface of a non-porous or macroporous solid [49].
3.5. Dye Removal
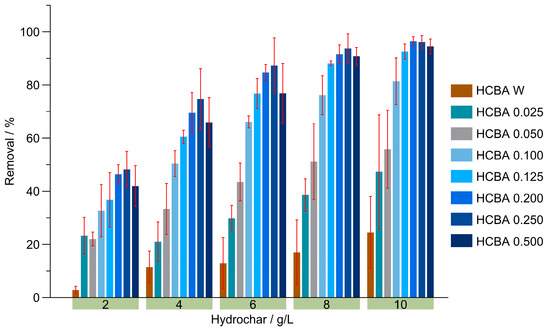
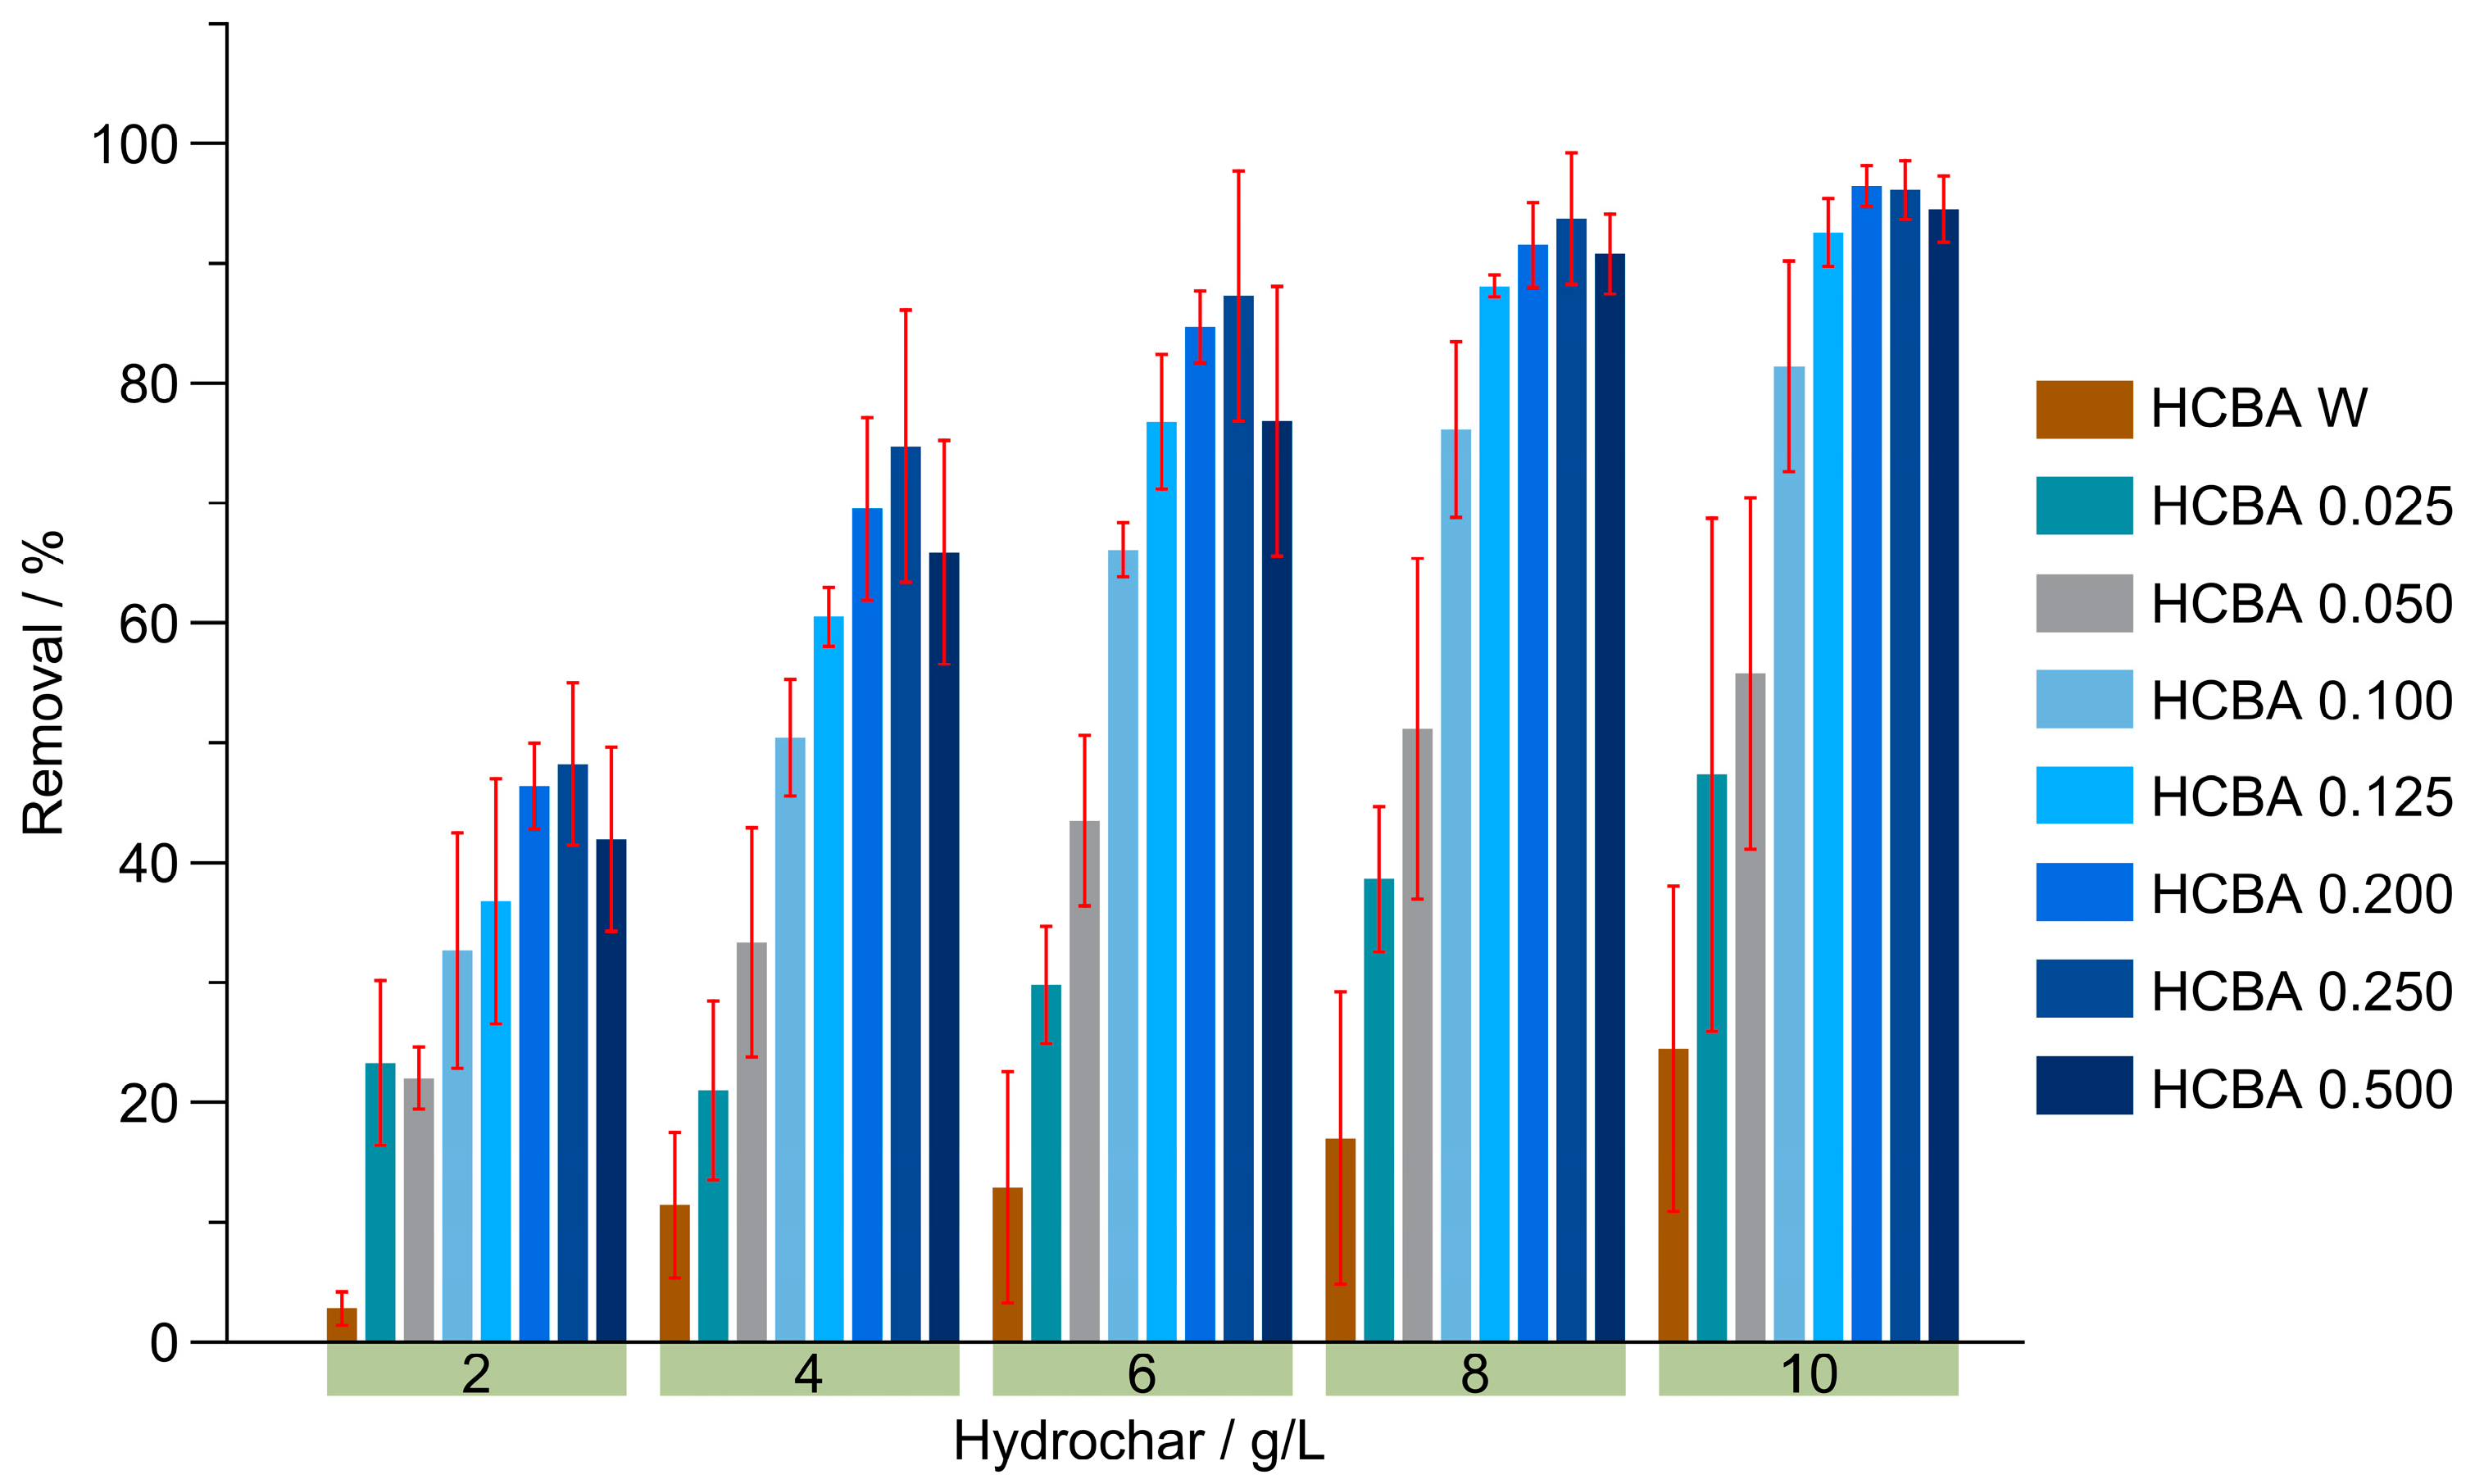
Figure 4 shows the adsorption results of RO84 using HCs synthesized at different acid concentrations and dosages (2–10 g L−1). Dye removal efficiency increased with increasing HC dosage, likely due to a larger available adsorption surface area. However, synthesis conditions also influenced performance: samples synthesized with water or low acid concentrations removed less dye than those synthesized with higher acid levels. The dataset’s distributional properties fully support the choice of non-parametric methods. All variables associated with removal (Absorbance, RO84_remain, and Removal_percent) failed the Shapiro–Wilk, D’Agostino K2, and Anderson–Darling normality tests, and both Levene’s and Bartlett’s tests rejected homogeneity of variances. These results confirm that the assumptions required for parametric ANOVA were violated, validating the exclusive use of Kruskal–Wallis and Dunn-Bonferroni analyses.
Figure 4.
Removal of Reactive Orange 84 (RO84) using hydrochars synthesized at different H2SO4 concentrations and dosages (2–10 g L−1). Error bars represent the standard error (n = 3). Statistical differences among treatments were evaluated using the Kruskal–Wallis test followed by Dunn’s post hoc comparisons with Bonferroni correction, as the normality and homoscedasticity assumptions were not met (Section 2.5.1). Different letters indicate statistically significant differences (p < 0.05).
Although an ANOVA and Tukey’s test were initially considered, the normality and homogeneity of variance assumptions were not met, as indicated by Shapiro–Wilk, D’Agostino K2, Anderson–Darling, Levene, and Bartlett tests. Therefore, all statistical comparisons reported in Figure 4 were performed exclusively using the Kruskal–Wallis test followed by Dunn’s post hoc procedure with Bonferroni correction, ensuring complete methodological consistency.
The best performance was achieved with HCBA 0.25, although its difference from HCBA 0.2 and HCBA 0.5 was not statistically significant. These results agree with Caglar et al. [50], who reported that sulfuric acid functionalization enhances the adsorption of anionic dyes on biochar surfaces. The results also show that the highest dye removal was achieved with sample HCBA 0.25; however, this difference is not statistically significant compared to samples HCBA 0.2 and HCBA 0.5. This study shows higher removal percentages (the highest being 96%) than other studies that have reported the use of H2SO4 functionalized hydrochar for the removal of cationic dyes, showing removal percentages of approximately 85.3% [51] and ~76% [52].
Post-adsorption FTIR spectra (Figure S4) are consistent with the participation of –SO3H groups in dye removal, suggesting that these groups were directly involved in interaction with RO84; however, further analysis (e.g., XPS) is required to validate this interaction [53]. Table S3 also presents the isotherm-fitting results. Experimental data showed a better fit to the Freundlich isotherm (R2 ≥ 0.99), indicating that dye adsorption occurred on a heterogeneous surface with multilayer formation [54]. In accordance with recent studies on hydrochars and functionalized carbons derived from lignocellulosic biomass, it has been reported that sulfonation introduces –SO3H, –OH, and –COOH groups with different adsorption energies, favoring electrostatic interactions and explaining the predominance of the Freundlich model over Langmuir in dye removal using modified hydrochars [55].
3.6. Data Analysis
3.6.1. Statistical Analysis
Descriptive Statistical Analysis of Adsorption with Agave Bagasse
A descriptive statistical analysis was conducted on data obtained from adsorption tests using agave bagasse under varying concentrations of sulfuric acid (H2SO4). Table 1 presents summary statistics for each variable, including measures of central tendency, variability, and distribution shape. The variables analyzed were absorbance, residual RO84 dye concentration (mg L−1), and percent removal (%). The goal was to identify general trends and the variability associated with each acid concentration.
Table 1.
Descriptive statistics by H2SO4 concentration.
The results show that absorbance varied with acid concentration, reflecting changes in dye retention. The mean residual [RO84] decreased as H2SO4 concentration increased, suggesting a stronger adsorption effect at higher acid levels. Consequently, the percentage removal rose with increasing concentration, indicating improved efficiency. Low standard deviations indicated high measurement consistency and repeatability among tests.
A total of 432 observations was analyzed for each variable (H2SO4 concentration, HC dosage, absorbance, RO84 residual concentration, and percent removal), providing a robust basis for statistical evaluation and enhancing the reliability of the results.
The mean H2SO4 concentration was 0.156 M, showing that most experiments were performed at low acid levels (maximum = 0.5 M). The average HC dosage was 5 g L−1, an intermediate level within the tested range. Mean absorbance was 0.827, with an average residual RO84 concentration of 57.6 mg L−1, indicating that a significant amount of dye remained in the solution. On average, removal efficiency was 46.95%, meaning that approximately half of the contaminant was removed under standard conditions.
High coefficients of variation (CVs) across variables indicated substantial variability. H2SO4 concentration had a CV of 97.68%, confirming a wide experimental range. HC dosage showed a CV of 68.39%. Both absorbance (CV = 63.55%) and residual RO84 (CV = 63.70%) showed considerable dispersion, while the removal percentage (CV = 72.11%) indicated non-uniform adsorption efficiency across trials.
Minimum values (0 M H2SO4, 0 g L−1 HC) corresponded to control conditions. The lowest absorbance (0.0178) and the residual RO84 (1.11 mg L−1) corresponded to the maximum removal efficiency. Negative removal values (−6.97%) were occasionally observed, likely due to experimental error or interference. Conversely, a maximum removal of 98.98% confirmed that the system can achieve high efficiency under optimal conditions. The broad overall range (up to 105.94%) reflected the diversity of the tested conditions.
H2SO4 concentration exhibited strong positive skewness (10.23), indicating that most tests were conducted at low concentrations. Other variables (absorbance, RO84, and removal) showed near-zero skewness, suggesting relatively symmetrical distributions. Kurtosis values ranged from −5.38 to 5.72, indicating platykurtic (flatter-than-normal) distributions with more evenly dispersed data.
Overall, the descriptive statistics indicate that adsorption with agave bagasse shows high variability in removal efficiency—from nearly complete to negligible or negative removal. The data dispersion and asymmetry highlight the significant influence of both H2SO4 concentration and HC dosage on adsorption performance.
The dispersion matrix (Figure S5) provides a global visualization of variable relationships. Diagonal panels show individual distributions, while scatter plots reveal pairwise relationships. Absorbance and residual RO84 exhibited a nearly perfect positive correlation, confirming that absorbance effectively indicates dye concentration. A strong negative correlation was observed between RO84_remain and Removal_percent, consistent with higher removal at lower residual concentrations. Meanwhile, H2SO4 concentration and HC dosage showed more scattered relationships, implying complex, interacting effects on adsorption.
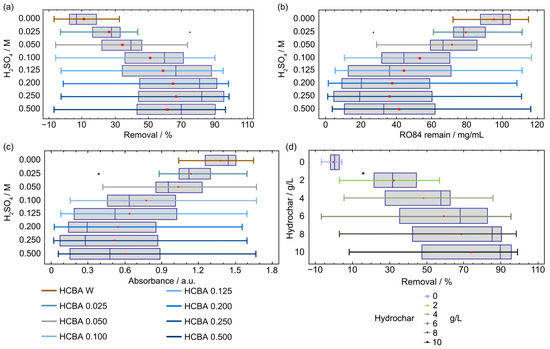
The box-and-whisker plots presented in Figure 5 summarize the distributions of the main experimental parameters and illustrate the effects of both sulfuric acid concentration and biomass dosage on adsorption performance. Also, the average values (red dots) and atypical values (blue dots) were added in the analysis. In Figure 5a, the percentage of dye removal increases progressively with increasing H2SO4 concentration, with median values exceeding 70% at concentrations between 0.25 and 0.5 M. However, greater variability is observed at higher concentrations, indicating a certain degree of experimental sensitivity under more intense conditions.
Figure 5.
Box-and-whisker plots of (a) percent removal (%) as a function of H2SO4 concentration; (b) residual RO84 concentration (mg L−1) as a function of H2SO4 concentration; (c) absorbance as a function of H2SO4 concentration, and (d) percent removal as a function of agave bagasse dose (g L−1).
Figure 5b shows that the residual concentration of RO84 decreases as acid concentration increases, dropping from median values above 80 mg L−1 in acid-free conditions to approximately 20–30 mg L−1 at 0.25–0.5 M, confirming that acid addition enhances contaminant removal. Similarly, Figure 5c shows that absorbance declines from above 1.4 in the absence of acid to around 0.5 at higher concentrations, demonstrating an inverse relationship between absorbance and adsorption efficiency.
Finally, Figure 5d shows that removal efficiency increases steadily with the HC dosage, reaching median values close to 90% at 10 g L−1, highlighting the critical role of biomass in maximizing adsorption. Overall, both H2SO4 concentration and HC dosage proved decisive in determining adsorption efficiency: higher acid and biomass levels consistently improved removal performance, albeit with increased variability, indicating that the system is sensitive to experimental conditions. The combined analysis confirms the inverse relationship between residual dye and removal efficiency and underscores the synergistic influence of acid concentration and biomass dosage on the adsorption process.
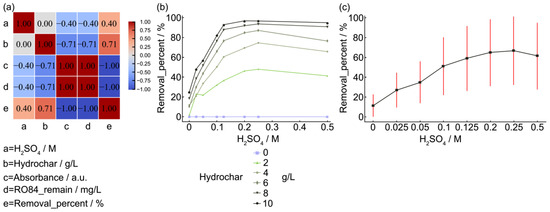
The correlation heat map presented in Figure 6a confirms the relationships among the main experimental variables. A perfect negative correlation (r = −1.00) is observed between RO84_remain and Removal_percent, indicating that lower residual dye concentrations correspond to higher removal efficiencies. Absorbance shows a perfect positive correlation with RO84_remain (r = 1.00) and a perfect negative correlation with Removal_percent (r = −1.00), confirming its reliability as an indicator of residual dye content. The process variables also exhibit notable associations: H2SO4 concentration shows moderate correlations, being positively correlated with removal (r = 0.40) and negatively correlated with RO84_remain (r = −0.40), while HC dosage displays stronger correlations, positive with removal (r = 0.71) and negative with RO84_remain (r = −0.71). These results indicate that system efficiency is primarily governed by the reduction in dye concentration, a process enhanced by increases in both acid and biomass levels.
Figure 6.
(a) Heat map of correlations between experimental variables; (b) Interaction graph regarding H2SO4 concentration and HC dose on removal (%); and (c) Mean removal (%) by H2SO4 concentration with error bars (±DE).
The high Spearman correlations observed among Absorbance, RO84_remain, and Removal_percent (ρ = 1.000, ρ = −0.9989, and ρ = −0.9989, respectively) are expected mathematical consequences of their definitions rather than evidence of new or independent physical relationships. Absorbance directly determines the residual dye concentration through the calibration curve (RO84_remain), and Removal_percent is calculated from that same value; therefore, these variables are deterministically linked. As such, the observed perfect or near-perfect monotonic correlations do not provide additional mechanistic information but instead reflect the internal consistency of the analytical procedure.
The interaction plot (Figure 6b) further demonstrates that H2SO4 concentration and HC dosage jointly influence removal efficiency. At low acid concentrations (≤0.05 M), differences between HC doses are minimal, whereas at intermediate and higher acid levels (≥0.1 M), the separation between curves becomes more pronounced, revealing a synergistic effect between the two factors. The trend plot (Figure 6c) supports this observation, showing a steady increase in removal efficiency as acid concentration rises to 0.25 M, followed by a slight decline at 0.5 M. This behavior suggests that excessively high acid concentrations may not lead to continuous improvement in adsorption. The wider error bars (red lines) at intermediate and higher concentrations further reflect increased variability, indicating that although removal efficiency generally improves with acid concentration, the system becomes more sensitive under stronger experimental conditions.
Inferential Statistical Analysis of Adsorption with Agave Bagasse
To determine whether the experimental variables met the assumptions required for parametric analyses such as ANOVA or linear regression, several normality tests were performed. Descriptive statistics had already revealed high dispersion (coefficients of variation > 60%) and skewness and kurtosis values inconsistent with a normal distribution, suggesting that the data did not follow a regular pattern. Normality was formally assessed using the Shapiro–Wilk test (sensitive for small to medium samples), the D’Agostino K2 test (which jointly evaluates skewness and kurtosis), and the Anderson–Darling test (which emphasizes deviations in the tails).
As summarized in Table 2, all three tests for the variables Removal_percent, RO84_remain_mgL, and Absorbance yielded p-values < 0.05, confirming non-normality. Consequently, the data do not satisfy the assumptions required for classical parametric models. Under these conditions, data transformation (e.g., logarithmic or Box–Cox) or non-parametric alternatives are recommended. In this study, non-parametric tests were selected to ensure valid inference.
Table 2.
Statistical tests of normality applied.
Before selecting the appropriate inferential method, the homogeneity of variances across groups (defined by H2SO4 concentration and HC dosage) was tested using Levene’s test, which is robust to non-normal data, and Bartlett’s test, which is more sensitive but helpful for comparison. Both tests yielded p-values < 0.05 (Levene’s: stat = 7.4301, p = 0.0000; Bartlett’s: stat = 90.0105, p = 0.0000), rejecting the null hypothesis of equal variances. Combined with the previous normality results, this confirmed that parametric ANOVA could not be applied.
Accordingly, the Kruskal–Wallis test was used to compare removal distributions across the different acid concentrations. The analysis yielded H = 134.1124 and p = 0.0000, indicating significant differences in removal efficiency across concentrations. To identify which specific levels differed, a Dunn’s post hoc test with Bonferroni correction was applied (Table S4). Most pairwise comparisons were significant, although closely spaced concentrations (e.g., 0.025 M vs. 0.05 M) did not differ after correction. These findings suggest that acid concentration strongly influences removal efficiency, with measurable sensitivity even at small concentration changes.
A similar approach was used to assess the effect of HC dosage. The Kruskal–Wallis test showed highly significant differences among doses (H = 240.4156, p = 0.0000), confirming that biomass quantity affects removal performance. Dunn-Bonferroni comparisons revealed significant differences between most dose pairs, particularly at the extremes (0 vs. 2–10 g L−1, p < 0.001), whereas very similar doses (e.g., 8 vs. 10 g L−1) did not differ significantly. Overall, increasing HC dosage enhanced removal efficiency, though marginal gains diminished at higher doses.
Together, these univariate analyses demonstrated that both H2SO4 concentration and HC dosage significantly affect adsorption efficiency. However, to determine whether the effect of one factor depends on the other, the interaction between the two was also examined.
Because the data did not meet the assumptions of normality or homogeneity of variance, a two-way ANOVA was not appropriate. Instead, the interaction was explored using non-parametric stratified Kruskal–Wallis tests and graphical inspection. Within each HC level, the effect of acid concentration was analyzed—and vice versa. Results showed no significant acid effect at 0 g L−1 HC (H = 2.0841, p = 0.9550), but highly significant differences (p = 0.0000) from 2 g L−1 onward, indicating that the impact of H2SO4 depends on the presence of biomass. Similarly, HC differences were significant across all acid concentrations (p < 0.001). These results confirm a synergistic interaction in which acid and biomass mutually enhance removal efficiency.
To complement the group-based analyses, Spearman’s correlation was used to quantify monotonic associations among continuous variables. As shown in Table S5, H2SO4 concentration correlated moderately with removal (ρ = 0.5208, p < 0.001), while HC dosage showed a stronger correlation (ρ = 0.7146, p < 0.001). Conversely, both Absorbance and RO84_remain_mgL were almost perfectly negatively correlated with removal (ρ = −0.9989, p < 0.001), consistent with the expectation that lower residual dye levels correspond to higher removal efficiency. These findings reinforce the consistency of previous analyses and highlight the system’s synergistic behavior.
Finally, to build a predictive model, a multiple linear regression was performed using H2SO4 concentration (H2SO4_M) and HC dosage (HC_gL) as predictors of Removal_percent. Although the experimental data did not meet the assumptions of normality or homoscedasticity required for parametric tests, the use of multiple linear regression is justified given the large sample size (n = 432), which confers robustness to ordinary least squares estimators under the central limit theorem. In addition, residual diagnostics supported the adequacy of the model: the mean residual was close to zero (0.004), and the residual standard deviation remained stable (17.9%). The residuals-versus-fitted plot showed no funnel shape or systematic pattern, and the Q-Q plot displayed only mild deviations at the extremes. A Shapiro–Wilk test applied to the model residuals yielded W = 0.987 (p = 0.078), indicating no substantial evidence against normality at the residual level, and the Breusch-Pagan test showed no severe heteroscedasticity (BP = 5.21, p = 0.073). Therefore, the regression analysis presented here should be interpreted as a predictive and exploratory tool rather than a strict parametric inference, complementing the non-parametric results reported in the previous sections.
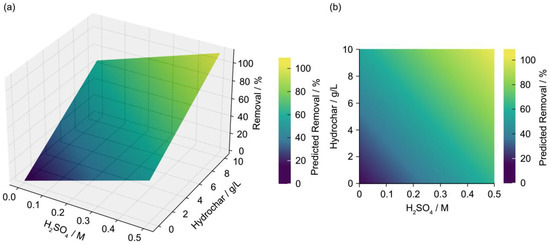
The resulting model (Equation (3)) was highly significant (F = 418.1, p < 0.001) and explained 66.1% of the variance (R2 = 0.661).
Removal_percent = −1.96 + 89.05 H2SO4_M + 7.00 HC_gL
The regression results were thus used to quantify the average contribution of H2SO4 concentration and hydrochar dosage to dye removal, acknowledging that linear models are generally robust to moderate departures from normality when sample sizes are large. In the fitted model (R2 = 0.661), both predictors were statistically significant, with H2SO4 concentration showing the most substantial effect (β = 89.05, t = 18.21, p < 0.001; 95% CI: 79.3–98.7) and hydrochar dosage also contributing positively (β = 7.00, t = 12.46, p < 0.001; 95% CI: 5.8–8.2). Moreover, both variables exhibited clear monotonic relationships with the response, consistent with their Spearman correlations (ρ = 0.5208 for H2SO4 and ρ = 0.7146 for hydrochar), supporting the suitability of a linear approximation for modeling trends within the studied experimental domain.
Both coefficients were positive and significant (p < 0.001), indicating that removal efficiency increases with higher acid concentration and biomass dose. On average, each 1 M increase in H2SO4 raised removal by 89%, while each 1 g L−1 increase in HC increased removal by 7%.
The model’s predictions are visualized in Figure 7a (3D surface plot) and Figure 7b (2D heat map). Both figures clearly show the cumulative, synergistic effect of acid and biomass on removal efficiency. The steepest gradient corresponds to HC dosage, reflecting its slightly stronger contribution (coefficient = 7.00) compared with acid concentration (coefficient = 89.05). The darker regions in the heat map highlight conditions yielding the highest efficiencies, providing a practical reference for process optimization.
Figure 7.
(a) Predicted removal surface (%) as a function of H2SO4 and HC; and (b) Heat map of predicted removal (%) as a function of H2SO4 and HC.
Overall, the combination of non-parametric analyses, correlation assessment, and regression modeling confirms that both H2SO4 concentration and HC dosage exert significant, synergistic effects on dye removal efficiency. The regression model provides a predictive tool for estimating performance under different experimental conditions, while graphical representations offer clear visual evidence of the joint dynamics between acid concentration and biomass dosage. Further model validation and exploration of nonlinear alternatives are recommended to enhance predictive accuracy and process optimization.
3.6.2. Neuronal Networks
During data collection, all parameters were randomly varied across 432 experiments. As mentioned above, applying an ANN-based model involves five steps: data collection, training, architecture selection, testing, and validation. After gathering 70% of the dataset, the remaining 30% was used for training the model and selecting the appropriate ANN architecture. During this process, different numbers of hidden layers and neurons per layer were tested, and the prediction accuracy of each ANN was evaluated until the ANN with the lowest MAPE and RMSE was identified. Table 3 presents the input values used for training and the ANN architecture selection.
Table 3.
Mean, minimum, and maximum values of the collected experimental data for the training of the ANN model.
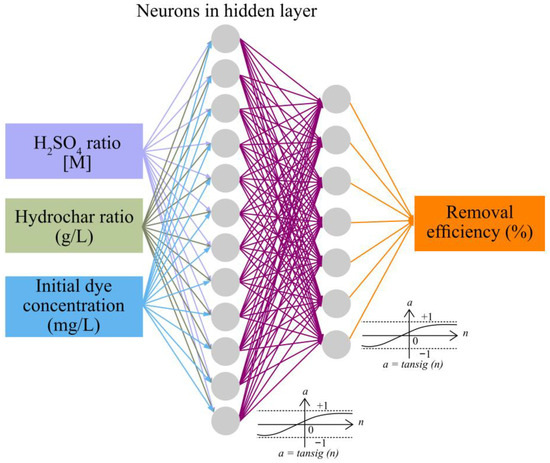
The ANN was used to identify a nonlinear relationship between input and output variables. Several topologies were tested to achieve the lowest MAPE and RMSE, resulting in an ANN with the selected inputs: two hidden layers containing 12 and 7 neurons, respectively, and tangential-sigmoidal transfer functions for each layer (Figure 8). This architecture achieved an MAPE of 1.42 and an RMSE of 0.6%. According to previous studies, machine learning can learn and predict process behavior; however, selecting the appropriate input and output variables is essential. As noted by Akinnawo et al. [56], several factors can influence the removal efficiency of synthetic dyes from aqueous solutions. These variables include pH, initial pollutant concentration, contact time, and temperature. In some cases, the type of adsorbent used and the agitation velocity are also considered.
Figure 8.
ANN architecture.
In all cases, the removal efficiency was analyzed. In this study, the selected inputs align with this focus, with initial dye concentration and adsorbent dosage chosen as the input variables. However, instead of using pH values, the molar concentration of H2SO4 was selected. Some studies have used machine learning models to predict the removal of synthetic dyes by carbon-based adsorbents, including white green [57], Congo red [12], and methylene blue [58]. These models accurately predicted process behavior, but achieving the highest removal efficiencies or minimizing reactant use required an optimization method. This study utilized a genetic algorithm for this purpose.
Optimization of the Adsorption of a Synthetic Dye with GA
The aim of using an ANN-GA model was to identify operational conditions that maximize removal efficiency while requiring relatively low resources. Previous studies have successfully optimized the adsorption of synthetic dyes by designing experiments [29,31], where the use of surface response methodology was suitable for determining optimal operational conditions and removing the highest synthetic dye concentration by identifying the variable with the greatest impact on the response variable. These studies achieved complete removal of the synthetic dye at concentrations below 40 mg L−1. However, a limitation of these studies is that only a few modifications can be made to each variable, typically resulting in the study of only 3 to 5 combinations. Conversely, some authors have reported that modifying the initial dye concentration, pH, contact time, or temperature can increase the process’ maximum removal efficiency [59,60]. Such studies demand significant time, effort, and resources because variables are examined independently, with only a limited number of combinations tested at a time. In this research, a GA model was employed, capable of evaluating all possible combinations and interactions simultaneously, as it comprehensively explores the entire range of potential options [17].
When a GA is applied, the ANN functions as a fitness tool that can virtually simulate all the experimental data not collected during the data collection phase due to time and resource constraints. Consequently, the model becomes crucial for simulating and testing all possible combinations of experimental conditions, thus saving valuable resources [61]. A combined ANN and GA AI model was needed to simulate the complex nonlinear processes involved in the adsorption of the synthetic dye using hydrochar. Although only three variables were used, they had the greatest influence on the synthetic dye’s removal efficiency, as determined by adsorption optimization studies [58].
The GA model was developed using a population of individuals, each containing a genetic code based on the molar concentration of H2SO4, the adsorbent dose, the initial dye concentration, and the resulting removal efficiency. After selecting crossover probabilities and a mutation rate for an initial population based on potential experimental conditions that maximize removal efficiency while minimizing requirements, the GA generates a population of individuals that procreate new children representing a completely new combination of experimental conditions. The process continues until the optimal solution to the problem is identified as a combination of experimental conditions that yields the highest removal efficiency at the lowest requirements (Table 4).
Table 4.
Possible operational conditions for the HCBA investigation process.
Table 4 provides a clear example of a global solution to an optimization problem, where the GA recommends an H2SO4 molar concentration of 0.45, a low hydrochar dosage, and a high synthetic dye concentration. Even though controlling initial pollutant concentration is challenging in real wastewater treatment facilities, this value offers valuable insights into the process performance at these parameters, according to the ANN-GA model. In conclusion, this study provides reliable insights into how AI can enhance pollutant removal in adsorption processes. Finally, Table 5 shows the results after testing the conditions recommended by the AI model. As observed, nearly 100% removal was achieved, confirming the model’s reliability.
Table 5.
Experimental validation of the ANN-GA model.
4. Conclusions
The study demonstrated that functionalized HC obtained through hydrothermal treatment of agave bagasse in the presence of H2SO4 effectively enhances dye removal performance.
Characterization analyses (BET, FTIR-ATR, TGA, and XRD) confirmed that acid-assisted hydrothermal synthesis produces a material with a wide range of pore sizes and sulfonated functional groups. Increasing the acid concentration in the synthesis medium promotes the hydrolysis of lignocellulosic components, improving the surface reactivity of the resulting HC.
Adsorption experiments and post-adsorption FTIR analyses indicated that the sulfonated (–SO3) groups of the HC actively interact with the RO84, likely through ionic bonding or ion-exchange mechanisms, thereby enhancing removal efficiency. The disappearance of the –SO3 band after adsorption further supports the participation of these groups in the removal process.
Statistical analyses confirmed that both H2SO4 concentration and HC dosage exert significant and synergistic effects on dye removal. These findings were consistently supported by non-parametric tests, correlation analyses, and predictive modeling, which together provide a robust basis for process optimization. The regression model developed allows reliable prediction of removal efficiency under varying experimental conditions.
Optimal removal was achieved with HC synthesized at acid concentrations of 0.20–0.25 M and an adsorbent dosage of 10 g L−1, providing the best balance between material performance and process stability.
FTIR analysis revealed the appearance of the –SO3 group in the functionalized material. However, the disappearance of this band after the removal process indicates that these groups actively interact with the dye, possibly through ionic bonds or exchange reactions, suggesting that the acid not only modifies the adsorbent surface but also directly intervenes in the removal mechanism.
The ANN model was able to simulate the adsorption process, and after applying the GA, an optimal combination of operational conditions was determined. Testing these values, the model demonstrated its reliability, achieving high removal efficiency with minimal resource consumption. This validates the usefulness of this AI model for optimization problems with complex nonlinear interactions.
Supplementary Materials
The following supporting information can be downloaded at: https://www.mdpi.com/article/10.3390/pr14010010/s1, Figure S1: UV-Visible Spectroscopy of Reactive Orange 84 Dye; Figure S2: Spectroscopy FT-IR ATR of agave bagasse raw material; Figure S3: BET analysis isotherms (a) HCBA W, (b) HCBA 0.025, (c) HCBA 0.05, (d) HCBA 0.1, (e) HCBA 0.125, (f) HCBA 0.2, (g) HCBA 0.25, (h) HCBA 0.5; Figure S4: Spectroscopy FT-IR ATR of (a) HCBA 0.5, (b) HCBA 0.25, (c) HCBA 0.2, (d) HCBA 0.125, (e) HCBA 0.1 and sediments after dye RO84 removal at concentrations of 10, 8, 6, 4 and 2 gL−1; Figure S5: Global dispersion matrix of the experimental variables (H2SO4, Hydrochar, Absorbance, RO84 and Removal); Table S1: Lower and upper bounds of the collected data for the optimization problem; Table S2: Surface area, pore volume and pore radius of all the synthesized samples; Table S3: Freundlich and Langmuir isotherms results; Table S4: Post-hoc multiple comparisons; Table S5: Calculation of Spearman’s coefficients.
Author Contributions
Conceptualization, O.M.R.-N. and E.B.; methodology, O.M.R.-N., A.V.-R., R.A.-N. and A.R.P.-B.; software, A.Q.-C. and A.R.P.-B.; validation, O.M.R.-N., A.V.-R. and E.B.; formal analysis, N.V.-E., L.F.M.-G. and F.G.M.-L.; investigation, O.M.R.-N., N.V.-E., L.F.M.-G. and R.E.M.-G.; resources, O.M.R.-N. and A.V.-R.; data curation, A.Q.-C., A.R.P.-B. and F.G.M.-L.; writing—original draft preparation, N.V.-E. and L.F.M.-G.; writing—review and editing, O.M.R.-N., A.V.-R. and E.B.; supervision, O.M.R.-N. and A.V.-R. All authors have read and agreed to the published version of the manuscript.
Funding
This research received no external funding.
Data Availability Statement
The original contributions presented in this study are included in the article and Supplementary Materials. Further inquiries can be directed to the corresponding author.
Acknowledgments
O. M. Rodríguez-Narvaez, Alberto Quevedo-Castro, Alain R. Picos-Benítez, Neali Valencia-Espinoza, Alejandro Vega-Rios, and Luisa F. Medina-Ganem would like to thank SECIHTI for the fellowship that enabled them to undertake this research study. Additionally, the authors would like to thank the Laboratorio Nacional de Nanotecnología (Nanotech), particularly Raúl Ochoa for the TEM micrographs and Mónica Mendoza Duarte for technical support.
Conflicts of Interest
Author Erick Bandala was employed by the company DASCO Inc. The remaining authors declare that the research was conducted in the absence of any commercial or financial relationships that could be construed as a potential conflict of interest.
Abbreviations
The following abbreviations are used in this manuscript:
| HC | Hydrochar |
| HCBA | Hydrochar from agave bagasse |
| ANN | Artificial neural network |
| LMBP | Levenberg–Marquardt Backpropagation |
| RMSE | Root mean squared error |
| MAPE | Mean absolute percentage error |
| GA | Genetic algorithm |
| CV | Coefficient of variation |
| BET | Brunauer–Emmet–Teller |
| TGA | Thermogravimetric analysis |
| FTIR | Fourier-transform infrared spectroscopy |
| ATR | Attenuated Total Reflectance |
| XRD | X-ray diffraction |
| RO84 | Reactive Orange 84 |
| AI | Artificial intelligence |
| BA | Agave bagasse |
| HTC | Hydrothermal carbonization |
References
- Medina-Esparza, W.N.; Aguilar-Juárez, O.; Gómez-Salazar, S.; Morán-Salazar, R.; López-Covarrubias, M.; Leal-Quezada, L.O.; Del Real-Olvera, J.; Reyes-Gómez, V.M. Efficiency of a New Biochar Made from Agave Bagasse to Remove Conventional Pollutants in Samples from Laguna de Bustillos, Chihuahua, Mexico, and Pharmaceutical Derivatives in Synthetic Water. Processes 2025, 13, 1861. [Google Scholar] [CrossRef] [Scilit]
- Ruiz-Velducea, H.A.; de Moreno-Vásquez, M.J.; Guzmán, H.; Esquer, J.; Rodríguez-Félix, F.; Graciano-Verdugo, A.Z.; Santos-Sauceda, I.; Quintero-Reyes, I.E.; Barreras-Urbina, C.G.; Vásquez-López, C.; et al. Valorization of Agave Angustifolia Bagasse Biomass from the Bacanora Industry in Sonora, Mexico as a Biochar Material: Preparation, Characterization, and Potential Application in Ibuprofen Removal. Sustain. Chem. 2024, 5, 196–214. [Google Scholar] [CrossRef] [Scilit]
- Hamad, N.; Galhoum, A.A.; Saad, A.; Wageh, S. Efficient Adsorption of Cationic and Anionic Dyes Using Hydrochar Nanoparticles Prepared from Orange Peel. J. Mol. Liq. 2024, 409, 125349. [Google Scholar] [CrossRef] [Scilit]
- Cavali, M.; Libardi Junior, N.; de Sena, J.D.; Woiciechowski, A.L.; Soccol, C.R.; Belli Filho, P.; Bayard, R.; Benbelkacem, H.; de Castilhos Junior, A.B. A Review on Hydrothermal Carbonization of Potential Biomass Wastes, Characterization and Environmental Applications of Hydrochar, and Biorefinery Perspectives of the Process. Sci. Total Environ. 2023, 857, 159627. [Google Scholar] [CrossRef] [Scilit]
- Giraldo, L.; Bernal Fernandez, V.; Moreno-Piraján, J.C. Thermodynamic Data of Phenol Adsorption on Chemically Modified Activated Carbons. Data Brief. 2020, 29, 105240. [Google Scholar] [CrossRef] [Scilit]
- Ramirez, A.; Ocampo, R.; Giraldo, S.; Padilla, E.; Flórez, E.; Acelas, N. Removal of Cr (VI) from an Aqueous Solution Using an Activated Carbon Obtained from Teakwood Sawdust: Kinetics, Equilibrium, and Density Functional Theory Calculations. J. Environ. Chem. Eng. 2020, 8, 103702. [Google Scholar] [CrossRef] [Scilit]
- Grisales-Cifuentes, C.M.; Serna Galvis, E.A.; Porras, J.; Flórez, E.; Torres-Palma, R.A.; Acelas, N. Kinetics, Isotherms, Effect of Structure, and Computational Analysis during the Removal of Three Representative Pharmaceuticals from Water by Adsorption Using a Biochar Obtained from Oil Palm Fiber. Bioresour. Technol. 2021, 326, 124753. [Google Scholar] [CrossRef] [Scilit]
- Dhanda, A.; Thulluru, L.P.; Chakraborty, D.; Chowdhury, S.; Dubey, B.K.; Ghangrekar, M.M. Sulfonated Algal Hydrochar-Modified PVA Membranes for Microbial Fuel Cell Applications and Valorization of Hydrothermal by-Products. Mater. Chem. Phys. 2025, 346, 131329. [Google Scholar] [CrossRef] [Scilit]
- Boral, P.; Varma, A.K.; Maity, S. Nitration of Jharia Basin Coals, India: A Study of Structural Modifications by XRD and FTIR Techniques. Int. J. Coal Sci. Technol. 2021, 8, 1034–1053. [Google Scholar] [CrossRef] [Scilit]
- Xu, X.; Zhu, D.; Jian, Q.; Wang, X.; Zheng, X.; Xue, G.; Liu, Y.; Li, X.; Hassan, G.K. Treatment of Industrial Ferric Sludge through a Facile Acid-Assisted Hydrothermal Reaction: Focusing on Dry Mass Reduction and Hydrochar Recyclability Performance. Sci. Total Environ. 2023, 869, 161879. [Google Scholar] [CrossRef] [Scilit]
- Alhammadi, A.A.; Nasser, R.; Shaban, M.S.; Othman, S.I.; Khim, J.S.; Ajarem, J.S.; Allam, A.A.; Abukhadra, M.R. Insight into the Effect of Sulfonation Techniques on the Adsorption Properties of -SO3H Surface-Functionalized Coal as Adsorbent for Malachite Green Dye: Steric and Energetic Investigation. ACS Omega 2022, 7, 36697–36711. [Google Scholar] [CrossRef] [Scilit]
- Muteeb, G.; Alshoaibi, A.; Ansari, K. Experimental Optimization and Machine Learning Modeling for Sustainable Congo Red Dye Removal from Wastewater Using Activated Goat Bone Biochar. J. Sci. Adv. Mater. Devices 2025, 10, 100947. [Google Scholar] [CrossRef] [Scilit]
- Alvez-Tovar, B.; Scalize, P.S.; Angiolillo-Rodríguez, G.; Albuquerque, A.; Ebang, M.N.; de Oliveira, T.F. Agro-Industrial Waste Upcycling into Activated Carbons: A Sustainable Approach for Dye Removal and Wastewater Treatment. Sustainability 2025, 17, 2036. [Google Scholar] [CrossRef] [Scilit]
- Zhao, W.; Hao, C.; Guo, Y.; Shao, W.; Tian, Y.; Zhao, P. Optimization of Adsorption Conditions Using Response Surface Methodology for Tetracycline Removal by MnFe2O4/Multi-Wall Carbon Nanotubes. Water 2023, 15, 2392. [Google Scholar] [CrossRef] [Scilit]
- Brooke, R.; Fan, L.; Khayet, M.; Wang, X. A Complementary Approach of Response Surface Methodology and an Artificial Neural Network for the Optimization and Prediction of Low Salinity Reverse Osmosis Performance. Heliyon 2022, 8, e10692. [Google Scholar] [CrossRef] [Scilit]
- Kohzadi, S.; Marzban, N.; Libra, J.A.; Bundschuh, M.; Maleki, A. Removal of RhB from Water by Fe-Modified Hydrochar and Biochar—An Experimental Evaluation Supported by Genetic Programming. J. Mol. Liq. 2023, 369, 120971. [Google Scholar] [CrossRef] [Scilit]
- Velásco-Mejía, A.; Vallejo-Becerra, V.; Chávez-Ramírez, A.U.; Torres-González, J.; Reyes-Vidal, Y.; Castañeda-Zaldivar, F. Modeling and Optimization of a Pharmaceutical Crystallization Process by Using Neural Networks and Genetic Algorithms. Powder Technol. 2016, 292, 122–128. [Google Scholar] [CrossRef] [Scilit]
- Liu, Y.; Cao, J.; Liu, C.; Ding, K.; Jin, L. Datasets for Large Language Models: A Comprehensive Survey. Artif. Intell. Rev. 2024, 58, 403. [Google Scholar] [CrossRef] [Scilit]
- Li, C.; Zhang, C.; Zhong, S.; Duan, J.; Li, M.; Shi, Y. The Removal of Pollutants from Wastewater Using Magnetic Biochar: A Scientometric and Visualization Analysis. Molecules 2023, 28, 5840. [Google Scholar] [CrossRef] [Scilit]
- Karimi, H.; Ghaedi, M. Application of Artificial Neural Network and Genetic Algorithm to Modeling and Optimization of Removal of Methylene Blue Using Activated Carbon. J. Ind. Eng. Chem. 2014, 20, 2471–2476. [Google Scholar] [CrossRef] [Scilit]
- Nadarajah, K.; Bandala, E.R.; Zhang, Z.; Mundree, S.; Goonetilleke, A. Removal of Heavy Metals from Water Using Engineered Hydrochar: Kinetics and Mechanistic Approach. J. Water Process Eng. 2021, 40, 101929. [Google Scholar] [CrossRef] [Scilit]
- Nadarajah, K.; Rodriguez-Narvaez, O.M.; Ramirez, J.; Bandala, E.R.; Goonetilleke, A. Lab-Scale Engineered Hydrochar Production and Techno-Economic Scaling-up Analysis. Waste Manag. 2024, 174, 568–574. [Google Scholar] [CrossRef] [Scilit] [PubMed]
- D’Agostino, R.B.; Belanger, A.; D’Agostino, R.B. A Suggestion for Using Powerful and Informative Tests of Normality. Am. Stat. 1990, 44, 316–321. [Google Scholar] [CrossRef] [Scilit]
- Razali, N.M.; Wah, Y.B. Power Comparisons of Shapiro-Wilk, Kolmogorov-Smirnov, Lilliefors and Anderson-Darling Tests. J. Stat. Model. Anal. 2011, 2, 21–33. [Google Scholar]
- Shapiro, S.S.; Wilk, M.B. An Analysis of Variance Test for Normality (Complete Samples). Biometrika 1965, 52, 591–611. [Google Scholar] [CrossRef] [Scilit]
- Wobbrock, J.O.; Findlater, L.; Gergle, D.; Higgins, J.J. The Aligned Rank Transform for Nonparametric Factorial Analyses Using Only ANOVA Procedures. In Proceedings of the SIGCHI Conference on Human Factors in Computing Systems, Vancouver, BC, Canada, 7–12 May 2021; pp. 143–146. [Google Scholar] [CrossRef] [Scilit]
- Kruskal, W.H.; Wallis, W.A. Use of Ranks in One-Criterion Variance Analysis. J. Am. Stat. Assoc. 1952, 47, 583–621. [Google Scholar] [CrossRef]
- Dinno, A. Nonparametric Pairwise Multiple Comparisons in Independent Groups Using Dunn’s Test. Stata J. 2015, 15, 292–300. [Google Scholar] [CrossRef] [Scilit]
- Hauke, J.; Kossowski, T. Comparison of Values of Pearson’s and Spearman’s Correlation Coefficients on the Same Sets of Data. Quaest. Geogr. 2011, 30, 87–93. [Google Scholar] [CrossRef] [Scilit]
- Senter, H.F. Applied Linear Statistical Models. J. Am. Stat. Assoc. 2008, 103, 880. [Google Scholar] [CrossRef] [Scilit]
- Chen, S.H.; Jakeman, A.J.; Norton, J.P. Artificial Intelligence Techniques: An Introduction to Their Use for Modelling Environmental Systems. Math. Comput. Simul. 2008, 78, 379–400. [Google Scholar] [CrossRef] [Scilit]
- Parihar, A.; Vongsvivut, J.; Bhattacharya, S. Synchrotron-Based Infra-Red Spectroscopic Insights on Thermo-Catalytic Conversion of Cellulosic Feedstock to Levoglucosenone and Furans. ACS Omega 2019, 4, 8747–8757. [Google Scholar] [CrossRef] [Scilit]
- Kostryukov, S.G.; Matyakubov, H.B.; Masterova, Y.Y.; Kozlov, A.S.; Pryanichnikova, M.K.; Pynenkov, A.A.; Khluchina, N.A. Determination of Lignin, Cellulose, and Hemicellulose in Plant Materials by FTIR Spectroscopy. J. Anal. Chem. 2023, 78, 718–727. [Google Scholar] [CrossRef] [Scilit]
- Hernández, J.; Romero, V.; Escalante, A.; Toríz, G.; Rojas, O.J.; Sulbarán, B. Agave Bagasse; CNC: Paris, Fance, 2018; Volume 13. [Google Scholar]
- Javier-Astete, R.; Jimenez-Davalos, J.; Zolla, G. Determination of Hemicellulose, Cellulose, Holocellulose and Lignin Content Using FTIR in Calycophyllum Spruceanum (Benth.) K. Schum. And Guazuma Crinita Lam. PLoS ONE 2021, 16, e0256559. [Google Scholar] [CrossRef] [Scilit] [PubMed]
- Poletto, M.; Ornaghi Júnior, H.L.; Zattera, A.J. Native Cellulose: Structure, Characterization and Thermal Properties. Materials 2014, 7, 6105–6119. [Google Scholar] [CrossRef] [Scilit] [PubMed]
- Yang, H.; Yan, R.; Chen, H.; Lee, D.H.; Zheng, C. Characteristics of Hemicellulose, Cellulose and Lignin Pyrolysis. Fuel 2007, 86, 1781–1788. [Google Scholar] [CrossRef] [Scilit]
- Md Salim, R.; Asik, J.; Sarjadi, M.S. Chemical Functional Groups of Extractives, Cellulose and Lignin Extracted from Native Leucaena Leucocephala Bark. Wood Sci. Technol. 2021, 55, 295–313. [Google Scholar] [CrossRef] [Scilit]
- Munguía-Aguilar, D.; Ruiz, H.A.; Razo-Flores, E.; Nieto-Delgado, C.; Cadena-Chamorro, E.; Alatriste-Mondragón, F. Effective Hydrothermal-Enzymatic Sequential Process of Agave Bagasse Enhances Saccharification and Methane Production. J. Environ. Chem. Eng. 2023, 11, 110644. [Google Scholar] [CrossRef] [Scilit]
- Hayoun, B.; Escudero-Curiel, S.; Bourouina, M.; Bourouina-Bacha, S.; Sanromán, M.A.; Pazos, M. Preparation and Characterization of High Performance Hydrochar for Efficient Adsorption of Drugs Mixture. J. Mol. Liq. 2022, 353, 118797. [Google Scholar] [CrossRef] [Scilit]
- Al-Labadi, I.G.; Shemy, M.H.; Ghidan, A.Y.; Allam, A.A.; Kálmán, H.M.; Ajarem, J.S.; Luo, J.; Wang, C.; Abukhadra, M.R. Insight into the Effects of H2SO4 and HNO3 Acidification Processes on the Properties of Coal as an Enhanced Adsorbent for Ciprofloxacin Residuals: Steric and Energetic Studies. Front. Chem. 2023, 11, 1130682. [Google Scholar] [CrossRef] [Scilit]
- Fonseca, J.M.; Spessato, L.; Cazetta, A.L.; Bedin, K.C.; Melo, S.A.R.; Souza, F.L.; Almeida, V.C. Optimization of Sulfonation Process for the Development of Carbon-Based Catalyst from Crambe Meal via Response Surface Methodology. Energy Convers. Manag. 2020, 217, 112975. [Google Scholar] [CrossRef] [Scilit]
- Magdziarz, A.; Wilk, M.; Wądrzyk, M. Pyrolysis of Hydrochar Derived from Biomass–Experimental Investigation. Fuel 2020, 267, 117246. [Google Scholar] [CrossRef] [Scilit]
- Poomsawat, S.; Poomsawat, W. Analysis of Hydrochar Fuel Characterization and Combustion Behavior Derived from Aquatic Biomass via Hydrothermal Carbonization Process. Case Stud. Therm. Eng. 2021, 27, 101255. [Google Scholar] [CrossRef] [Scilit]
- Petrović, J.; Ercegović, M.; Simić, M.; Koprivica, M.; Dimitrijević, J.; Jovanović, A.; Pantić, J.J. Hydrothermal Carbonization of Waste Biomass: A Review of Hydrochar Preparation and Environmental Application. Processes 2024, 12, 207. [Google Scholar] [CrossRef] [Scilit]
- Li, F.; Zimmerman, A.R.; Hu, X.; Yu, Z.; Huang, J.; Gao, B. One-Pot Synthesis and Characterization of Engineered Hydrochar by Hydrothermal Carbonization of Biomass with ZnCl2. Chemosphere 2020, 254, 126866. [Google Scholar] [CrossRef] [Scilit]
- Zhang, X.; Zhang, Y.; Ngo, H.H.; Guo, W.; Wen, H.; Zhang, D.; Li, C.; Qi, L. Characterization and Sulfonamide Antibiotics Adsorption Capacity of Spent Coffee Grounds Based Biochar and Hydrochar. Sci. Total Environ. 2020, 716, 137015. [Google Scholar] [CrossRef] [Scilit]
- Genel, Y.; Genel, İ.; Saka, C. Facile Preparation of Sulfonated Carbon Particles with Pomegranate Peels as Adsorbent for Enhanced Methylene Blue Adsorption from Aqueous Solutions. Biomass Convers. Biorefinery 2024, 14, 30693–30705. [Google Scholar] [CrossRef] [Scilit]
- Thommes, M.; Kaneko, K.; Neimark, A.V.; Olivier, J.P.; Rodriguez-Reinoso, F.; Rouquerol, J.; Sing, K.S.W. Physisorption of Gases, with Special Reference to the Evaluation of Surface Area and Pore Size Distribution (IUPAC Technical Report). Pure Appl. Chem. 2015, 87, 1051–1069. [Google Scholar] [CrossRef] [Scilit]
- çaglar, E.; Donar, Y.O.; Sinag, A.; Biro Gul, I.; Bilge, S.; Aydincak, K.; Pliekhov, O. Adsorption of Anionic and Cationic Dyes on Biochars, Produced by Hydrothermalcarbonization of Waste Biomass: Effect of Surface Functionalization and Ionicstrength. Turk. J. Chem. 2018, 42, 86–99. [Google Scholar] [CrossRef] [Scilit]
- Chenxi, Y.; Haiou, Z.; Jian, W.; Yingguo, W. Facile Fabrication of Sulfonated Porous Yeast Carbon Microspheres through a Hydrothermal Method and Their Application for the Removal of Cationic Dye. Sci. Rep. 2024, 14, 11326. [Google Scholar] [CrossRef] [Scilit]
- Shoaib, A.G.M.; Van, H.T.; Tran, D.T.; El Sikaily, A.; Hassaan, M.A.; El Nemr, A. Green Algae Ulva Lactuca-Derived Biochar-Sulfur Improves the Adsorption of Methylene Blue from Water. Sci. Rep. 2024, 14, 11583. [Google Scholar] [CrossRef] [Scilit]
- Yang, J.M.; Liu, B.W.; Zhang, W. Superior Adsorptive Removal of Anionic Azo Dyes from Aqueous Solutions Using Sulfonic Acid Group-Modified MIL-101@Graphene Oxide Composite. Langmuir 2024, 40, 6962–6970. [Google Scholar] [CrossRef] [Scilit]
- Clurman, A.M.; Rodríguez-Narvaez, O.M.; Jayarathne, A.; De Silva, G.; Ranasinghe, M.I.; Goonetilleke, A.; Bandala, E.R. Influence of Surface Hydrophobicity/Hydrophilicity of Biochar on the Removal of Emerging Contaminants. Chem. Eng. J. 2020, 402, 126277. [Google Scholar] [CrossRef] [Scilit]
- Elkatory, M.R.; Yılmaz, M.; Hassaan, M.A.; El Nemr, A. Fabrication of Date Palm Kernel Biochar-Sulfur (DPKB-S) for Super Adsorption of Methylene Blue Dye from Water. Sci. Rep. 2024, 14, 6830. [Google Scholar] [CrossRef] [Scilit] [PubMed]
- Adegoke, K.A.; Akinnawo, S.O.; Adebusuyi, T.A.; Ajala, O.A.; Adegoke, R.O.; Maxakato, N.W.; Bello, O.S. Modified Biomass Adsorbents for Removal of Organic Pollutants: A Review of Batch and Optimization Studies. Int. J. Environ. Sci. Technol. 2023, 20, 11615–11644. [Google Scholar] [CrossRef] [Scilit]
- Salehi, K.; Bahmani, A.; Shahmoradi, B.; Pordel, M.A.; Kohzadi, S.; Gong, Y.; Guo, H.; Shivaraju, H.P.; Rezaee, R.; Pawar, R.R.; et al. Response Surface Methodology (RSM) Optimization Approach for Degradation of Direct Blue 71 Dye Using CuO–ZnO Nanocomposite. Int. J. Environ. Sci. Technol. 2017, 14, 2067–2076. [Google Scholar] [CrossRef] [Scilit]
- Liu, C.; Balasubramanian, P.; Nguyen, X.C.; An, J.; Praneeth, S.; Zhang, P.; Huang, H. Enhanced Machine Learning Prediction of Biochar Adsorption for Dyes: Parameter Optimization and Experimental Validation. Carbon Res. 2025, 4, 46. [Google Scholar] [CrossRef] [Scilit]
- Mahalaxmi, S.; Chitra, P.S.K.B.; Rangasamy, G. Environmental Remediation of Malachite Green Dye from Water Using Hydrothermally Carbonized Agro-Waste Biomass: Mechanisms and Optimization. Int. J. Environ. Sci. Technol. 2025, 22, 10515–10532. [Google Scholar] [CrossRef] [Scilit]
- Mohadesi, S.N.M. Optimization of Synthesized Hydrochar from Acorn to Adsorb Malachite Green. Int. J. Environ. Sci. Technol. 2025, 22, 10145–10157. [Google Scholar] [CrossRef] [Scilit]
- Picos-Benítez, A.R.; Martínez-Vargas, B.L.; Duron-Torres, S.M.; Brillas, E.; Peralta-Hernández, J.M. The Use of Artificial Intelligence Models in the Prediction of Optimum Operational Conditions for the Treatment of Dye Wastewaters with Similar Structural Characteristics. Process Saf. Environ. Prot. 2020, 143, 36–44. [Google Scholar] [CrossRef] [Scilit]

Disclaimer/Publisher’s Note: The statements, opinions and data contained in all publications are solely those of the individual author(s) and contributor(s) and not of MDPI and/or the editor(s). MDPI and/or the editor(s) disclaim responsibility for any injury to people or property resulting from any ideas, methods, instructions or products referred to in the content. |
© 2025 by the authors. Licensee MDPI, Basel, Switzerland. This article is an open access article distributed under the terms and conditions of the Creative Commons Attribution (CC BY) license.