


Abstract
The conversion of CO2 into valuable chemicals such as formic acid offers a promising approach to reducing CO2 emissions. This study presents a techno-economic assessment of two continuous catalytic processes for formic acid production via carbon dioxide (CO2) hydrogenation. The processes differ in the type of nitrogenous base used, operating under either homogeneous or heterogeneous catalytic conditions. Process simulations and techno-economic evaluations were performed in SuperPro DesignerTM for a medium-scale facility with an annual CO2 processing capacity of around 14 kMT. The homogeneous catalysis pathway demonstrated superior plant performance, producing 13.03 kMT of formic acid per year at 99.78% purity. In contrast, the heterogeneous pathway required higher capital investment and exhibited lower overall efficiency. The techno-economic analysis confirmed the economic viability of the homogeneous process, with a production cost of $1.18/kg and favorable investment indicators, whereas the heterogeneous route proved economically unattractive under the evaluated assumptions. Sensitivity analysis identified the selling price of formic acid as the most critical profitability parameter, with the homogeneous process remaining robust across varying conditions. Overall, homogeneous catalytic CO2 hydrogenation demonstrates a technically efficient and economically promising process for the chemical transformation of CO2, contributing to carbon management.
1. Introduction
1.1. General Information
Climate imbalance has become one of the defining challenges of the 21st century, driven primarily by greenhouse gas emissions from human activities. Among these gases, carbon dioxide (CO2) is the dominant contributor, accounting for a significant portion of total emissions [1]. It is estimated that approximately 3.9% of the annually released CO2 accumulates in the atmosphere, contributing directly to the greenhouse effect [1]. This issue has been extensively discussed in the scientific community for decades, with recent years highlighting the urgent need to develop sustainable technologies for mitigation [2,3].
A complementary approach to Carbon Capture and Storage (CCS) is Carbon Capture and Utilization (CCU), which has gained increasing attention. While CCS focuses solely on sequestration, CCU aims to not only capture CO2 but also convert it into valuable products such as fuels, chemical feedstocks, polymers, and construction materials [4]. These products can be obtained through thermal, chemical, biochemical, photochemical, and electrochemical processes, while also supporting the development of new energy storage technologies and enhancing the overall stability of the energy system [5]. Recent research has therefore concentrated on converting CO2 into small organic molecules with high energy density, such as methanol, formic acid, and propylene. Among these, formic acid has received particular technological interest due to its dual role as a chemical feedstock and an energy carrier [5]. In recent years, its production and utilization have been pursued more intensively, as it can be applied not only in traditional sectors but also in innovative and sustainable processes. Regarding its role in energy storage, formic acid is considered one of the most promising liquid organic hydrogen carriers (LOHCs), owing to its high hydrogen content (4.4 wt%), low toxicity, ease of storage and transport, and favorable recyclability. Intensive research is being conducted on its use in fuel cells for the electrochemical production of hydrogen, as well as in other reversible processes, offering circular and promising solutions for energy management [6].
1.2. Market Analysis
The global formic acid market is experiencing steady expansion, supported by its diverse applications in agriculture, food preservation, leather processing, and emerging sustainable technologies. In 2024, its global demand was estimated at 0.995 million tonnes and is projected to reach 1.54 million tonnes by 2035 [7]. In value terms, the market is expected to grow from USD 2.43 billion in 2025 to USD 3.78 billion by 2034, corresponding to a compound annual growth rate (CAGR) of approximately 5% [8]. Price trends are largely determined by global supply–demand balances, production costs, and regional economic conditions. The Asia–Pacific region dominates the market with a share of about 51% and is projected to expand further at a CAGR of 5.1% through 2035. China and India drive this growth due to strong demand for animal feed, food preservation, and the rapid development of the chemical industry. In Europe, market growth is supported by the agricultural sector, strict food and hygiene regulations, and the increasing adoption of sustainable leather and fashion processing methods. North America also contributes significantly, with large-scale producers such as BASF and Geismar consolidating the region’s position [7].
Overall, the market remains highly competitive, with leading companies focusing on innovation, sustainability, and portfolio diversification. Advances in catalytic technologies and continued investment in research and development are expected to reduce production costs and expand application areas [7].
1.3. Production Pathways
1.3.1. Conventional Production Technologies
A wide range of methods for synthesizing formic acid and its corresponding salts have been reported in the literature. One of the most established industrial-scale technologies is the production of formic acid via the synthesis and hydrolysis of methyl formate (BASF technology), which proceeds in two main steps. In the first step, carbon monoxide reacts with methanol in the presence of a strong base to form methyl formate [9,10]. The reaction takes place under high pressure (≈4 MPa) and elevated temperature (80 °CK), as shown in Equation (1):
In the second step, hydrolysis of methyl formate takes place to produce formic acid and methanol according to:
This process is a well-established and reliable industrial technology, offering high selectivity and efficient recycling of key intermediates. However, it involves complex stages, high energy consumption, and the use of corrosive bases and toxic carbon monoxide, making it particularly demanding [11,12].
1.3.2. Hydrogenation of CO2
The hydrogenation of CO2 to formic acid has been extensively investigated as a strategy for hydrogen storage and release, with formic acid serving as a liquid organic hydrogen carrier (LOHC) [13,14]. The most common approaches utilize noble metal catalysts (e.g., Ru, Ir, Rh) under either homogeneous or heterogeneous conditions [15,16,17]; this work considers both alternatives. Typically, the reaction is carried out in the presence of organic or inorganic bases, which stabilize the product as a formate salt. Additional separation steps are required to obtain pure formic acid [18]. Recent advances in catalyst development, together with improved separation and recycling techniques, have made this route increasingly attractive for commercial applications [19,20,21]. For instance, incorporating molecular catalysts into porous supports has delivered promising results: ruthenium supported on a bpyTN-30-CTF framework achieved a CO2 conversion of 64.8% and high stability (TON > 524,000 over 30 days) [16].
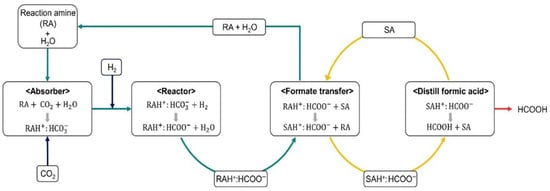
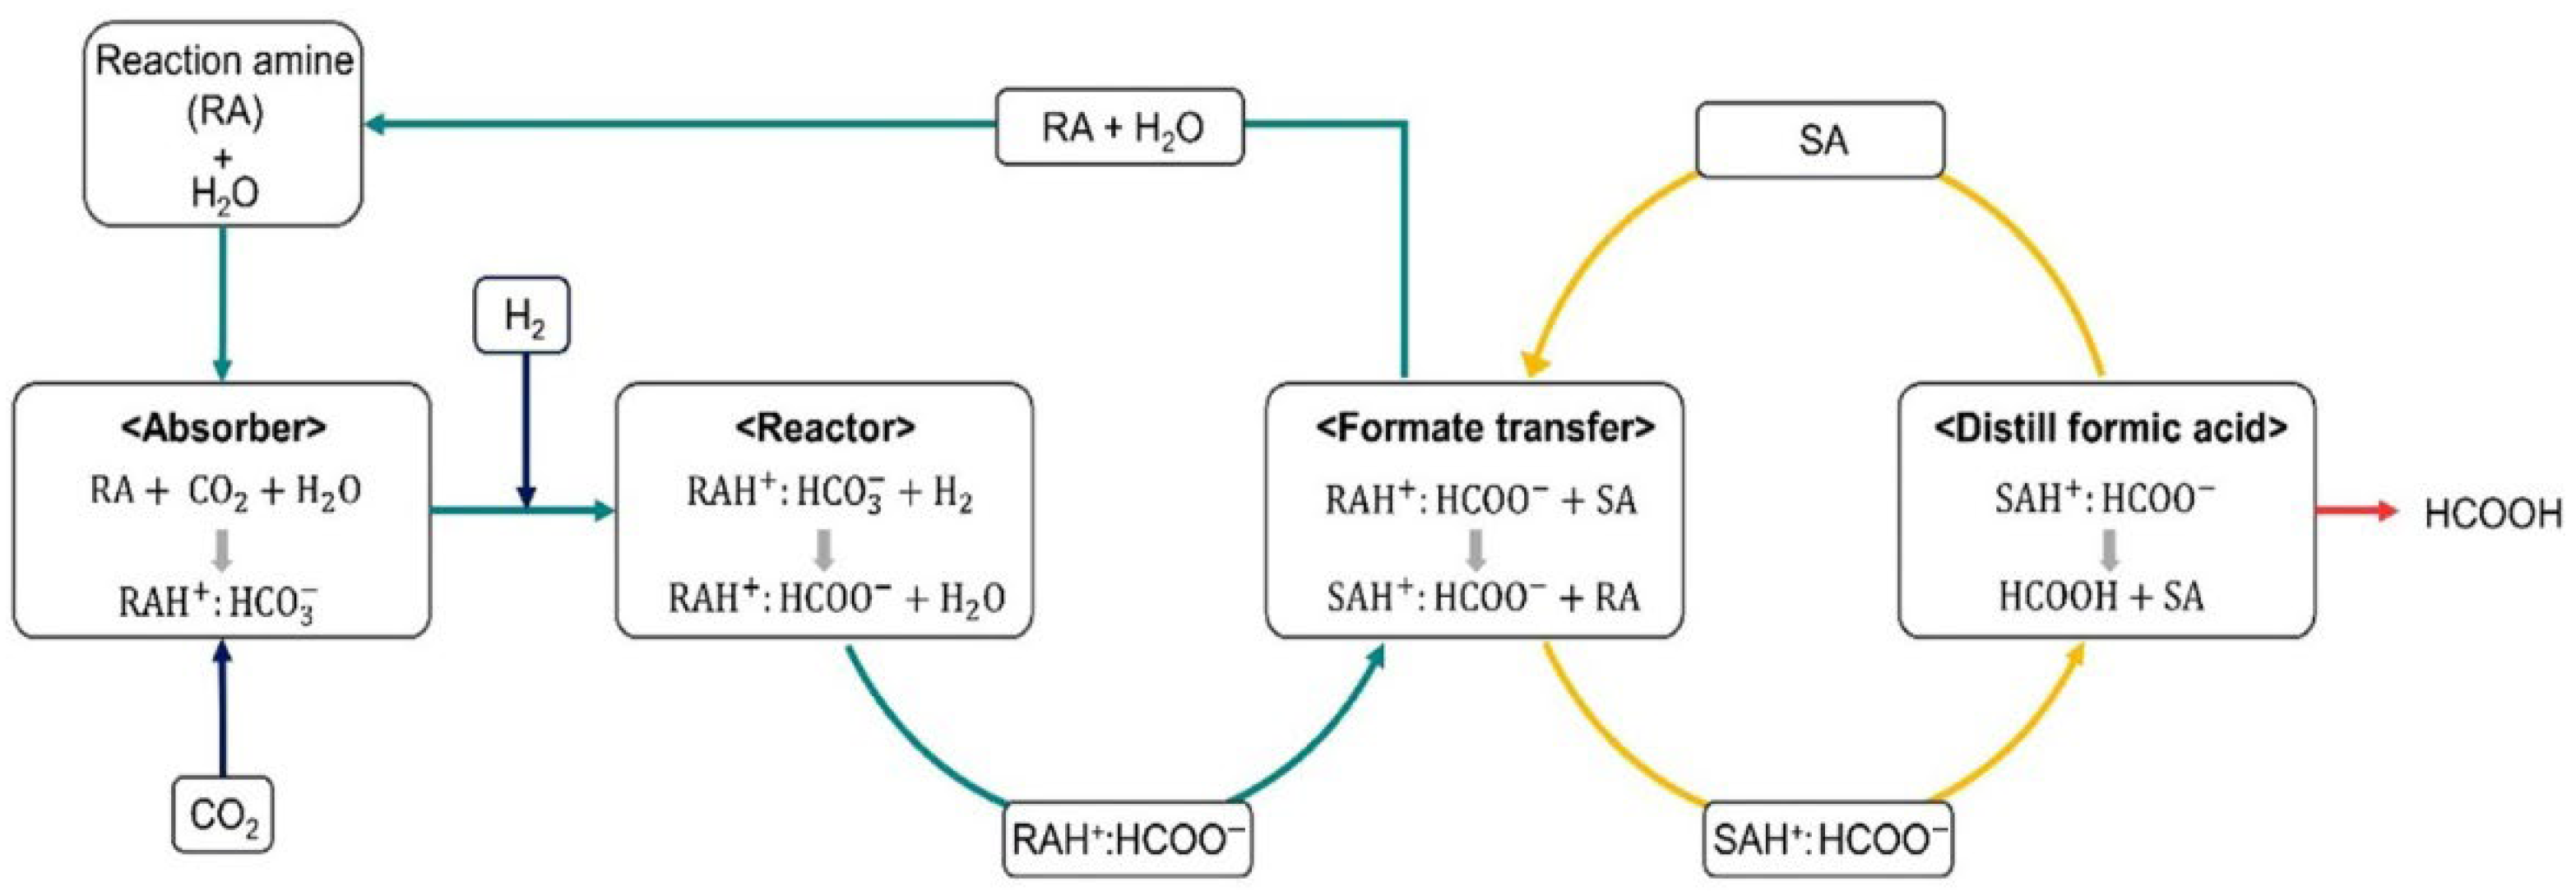
A technologically advanced method is described in a US Patent 4855496 [11], where CO2 reacts with hydrogen in the presence of a nitrogen-containing base and a Group VII metal catalyst, such as ruthenium. Since the equilibrium is thermodynamically unfavorable, tertiary amines are employed to shift the balance toward product formation. The process involves sequential steps leading to the formation of a formate salt, followed by thermal decomposition to recover formic acid and regenerate the amine. Additional modifications, such as base exchange, can further facilitate acid separation. The overall scheme is illustrated in Figure 1 [20].
Figure 1.
Process Flow Diagram for Formic Acid Synthesis from Carbon Dioxide [20].
The influence of operating parameters such as temperature, pressure, and gas feed ratio on equilibrium and CO2 conversion is summarized in Supplementary Materials (Figures S1 and S2) [20]. Representative examples of homogeneous catalysts used for CO2 hydrogenation to formic acid are listed in Table 1 [16]. Catalyst performance is generally reported in terms of TON (Turnover Number) and TOF (Turnover Frequency), which describe catalyst lifetime and activity, respectively. Comparative analysis highlights the decisive role of the metal, solvent, and additives in determining overall efficiency, underlining the need for optimization to achieve a sustainable and effective process.
Table 1.
Performance of Representative Homogeneous Catalysts [16].
This work focuses on the synthesis, design and comparative evaluation of two alternative plants for producing formic acid using carbon dioxide as the main feedstock. In this context, formic acid production is not treated as an isolated operation but as part of an integrated facility that also includes the CO2 capture. Such integration aligns the process with the broader goals of carbon valorization and greenhouse gas emission’s reduction. Although the two production routes differ in the chemical agents employed, their technological basis is comparable, allowing for a direct assessment of their performance with an emphasis on energy requirements and overall plant efficiency.
2. Materials and Methods
2.1. Raw Materials
Carbon dioxide is the primary feedstock considered in this work and can be supplied from concentrated industrial emission streams, including energy, cement, and steel plants, or fermentation-based processes [22]. For its utilization in industrial plants, CO2 must have purity specifications, requiring pretreatment to eliminate contaminants that reduce catalytic activity [23]. In the present study, the CO2 stream is assumed to be already purified, as the process operates within a larger facility where CO2 is captured and conditioned to the required specifications before entering the hydrogenation unit.
Hydrogen, the second essential input, is commonly derived from natural gas reforming, a route that produces the so-called “grey” hydrogen. For industrial use it is stored under high pressure and transported in dedicated vessels that comply with safety standards [24,25].
The choice of solvent and amine further influences the performance of the hydrogenation process. Polar solvents provide the medium for stabilizing the CO2–amine–formic acid complex, while their suitability depends on catalyst solubility, chemical inertness, and separation properties. Methanol is often employed, along with DMSO, ethers, or amides, while solvent–water mixtures have shown advantages for phase separation and product recovery [22].
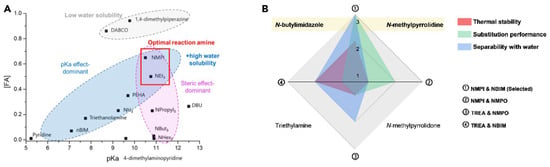
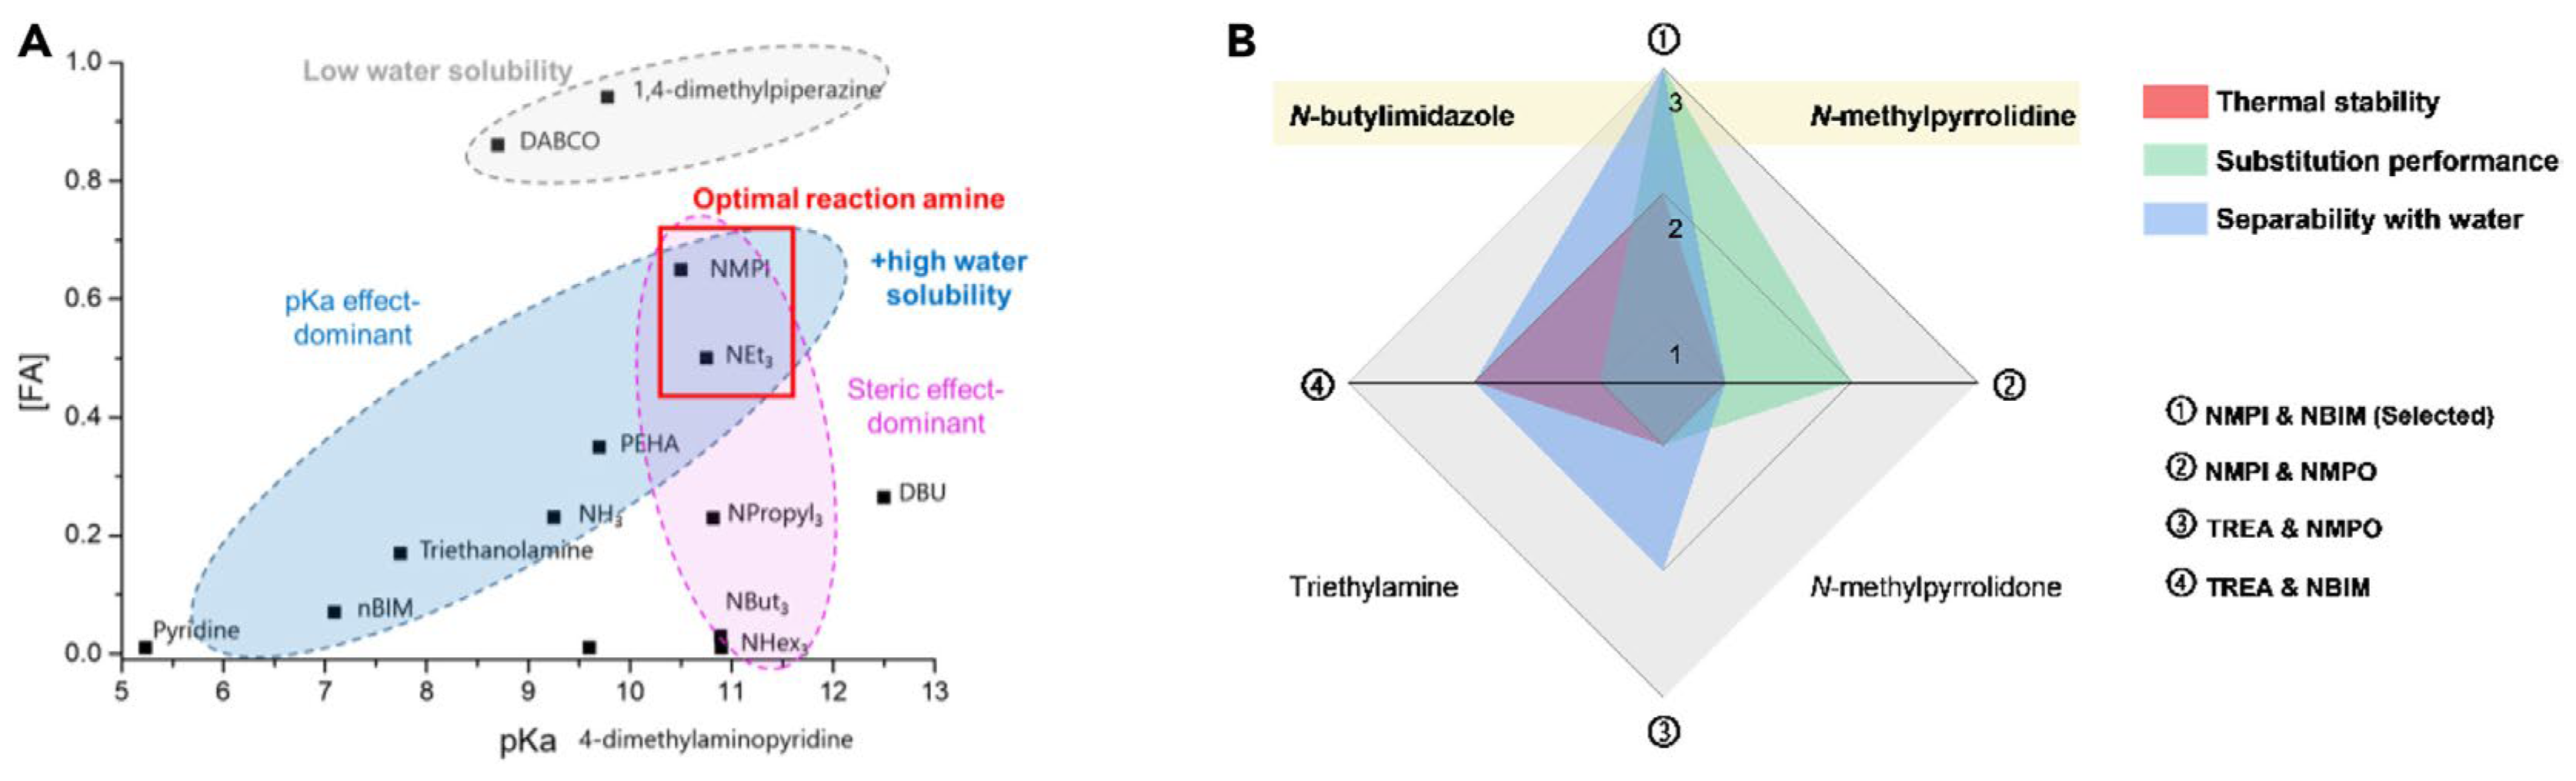
In summary, the selection of the amine is of paramount importance, as it governs the overall efficiency of the integrated CO2 capture and conversion process. Performance is influenced by key properties including basicity (pKa), ease of recyclability, and steric hindrance. Smaller or cyclic amines typically exhibit higher activity and more favorable catalyst interactions, leading to improved performance [19,26,27,28]. The specific amine candidates evaluated in this study are shown in Figure 2.
Figure 2.
Comparative Evaluation of Reaction and Separation Amines Based on Thermodynamic and Operational Criteria [20]. (A) Evaluation of candidate amines regarding their effectiveness in mediating CO2 hydrogenation and their relative solubility in water. (B) Examination of four reaction–separation amine pairs in terms of substitution performance, thermal stability, and ease of separation from water.
2.2. Formic Acid Plant Modeling
Two alternative process flowsheets for the production of formic acid from CO2 have been developed in SuperPro DesignerTM v14, based on established techniques, literature protocols, and relevant patent concepts. While direct validation was not feasible for Case Study A due to the absence of pilot- and industrial-scale data, Case Study B was based on pilot-scale operation results. These results were used to scale the process up to 14,112 t CO2 year−1, corresponding to a realistic medium-scale facility, ensuring consistent conversion efficiency and thermal behavior with the pilot system. The two configurations represent homogeneous and heterogeneous catalytic hydrogenation pathways, providing a comparative basis for process synthesis and economic evaluation. Process modeling relied on thermophysical property estimation, mass and energy balances, equipment design, and economic assessment, all performed using the built-in capabilities of SuperPro DesignerTM, providing a reliable basis for techno-economic evaluation [29]. To enhance industrial relevance, standard practices such as solvent recycling and separation steps were integrated into the flowsheets. A sensitivity study was also carried out to identify the most critical design variables, enabling a comparative evaluation of the technological performance and economic viability of CO2 hydrogenation to formic acid.
2.2.1. Flowsheet/Case Study A: Homogeneous Catalytic Hydrogenation of CO2 with Trihexylamine
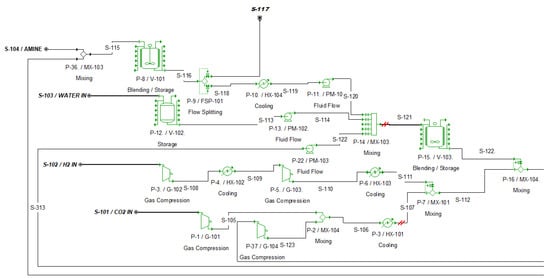
The first flowsheet represents the homogeneous catalytic hydrogenation of carbon dioxide with hydrogen, which employs trihexylamine as the nitrogen-containing base. The process is organized into distinct sections, each color-coded in the flowsheet for clarity:
- Section 100: Reactant Preparation (see Figure 3)
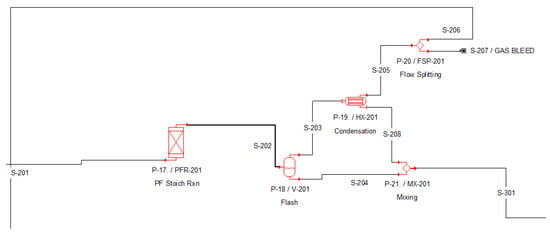
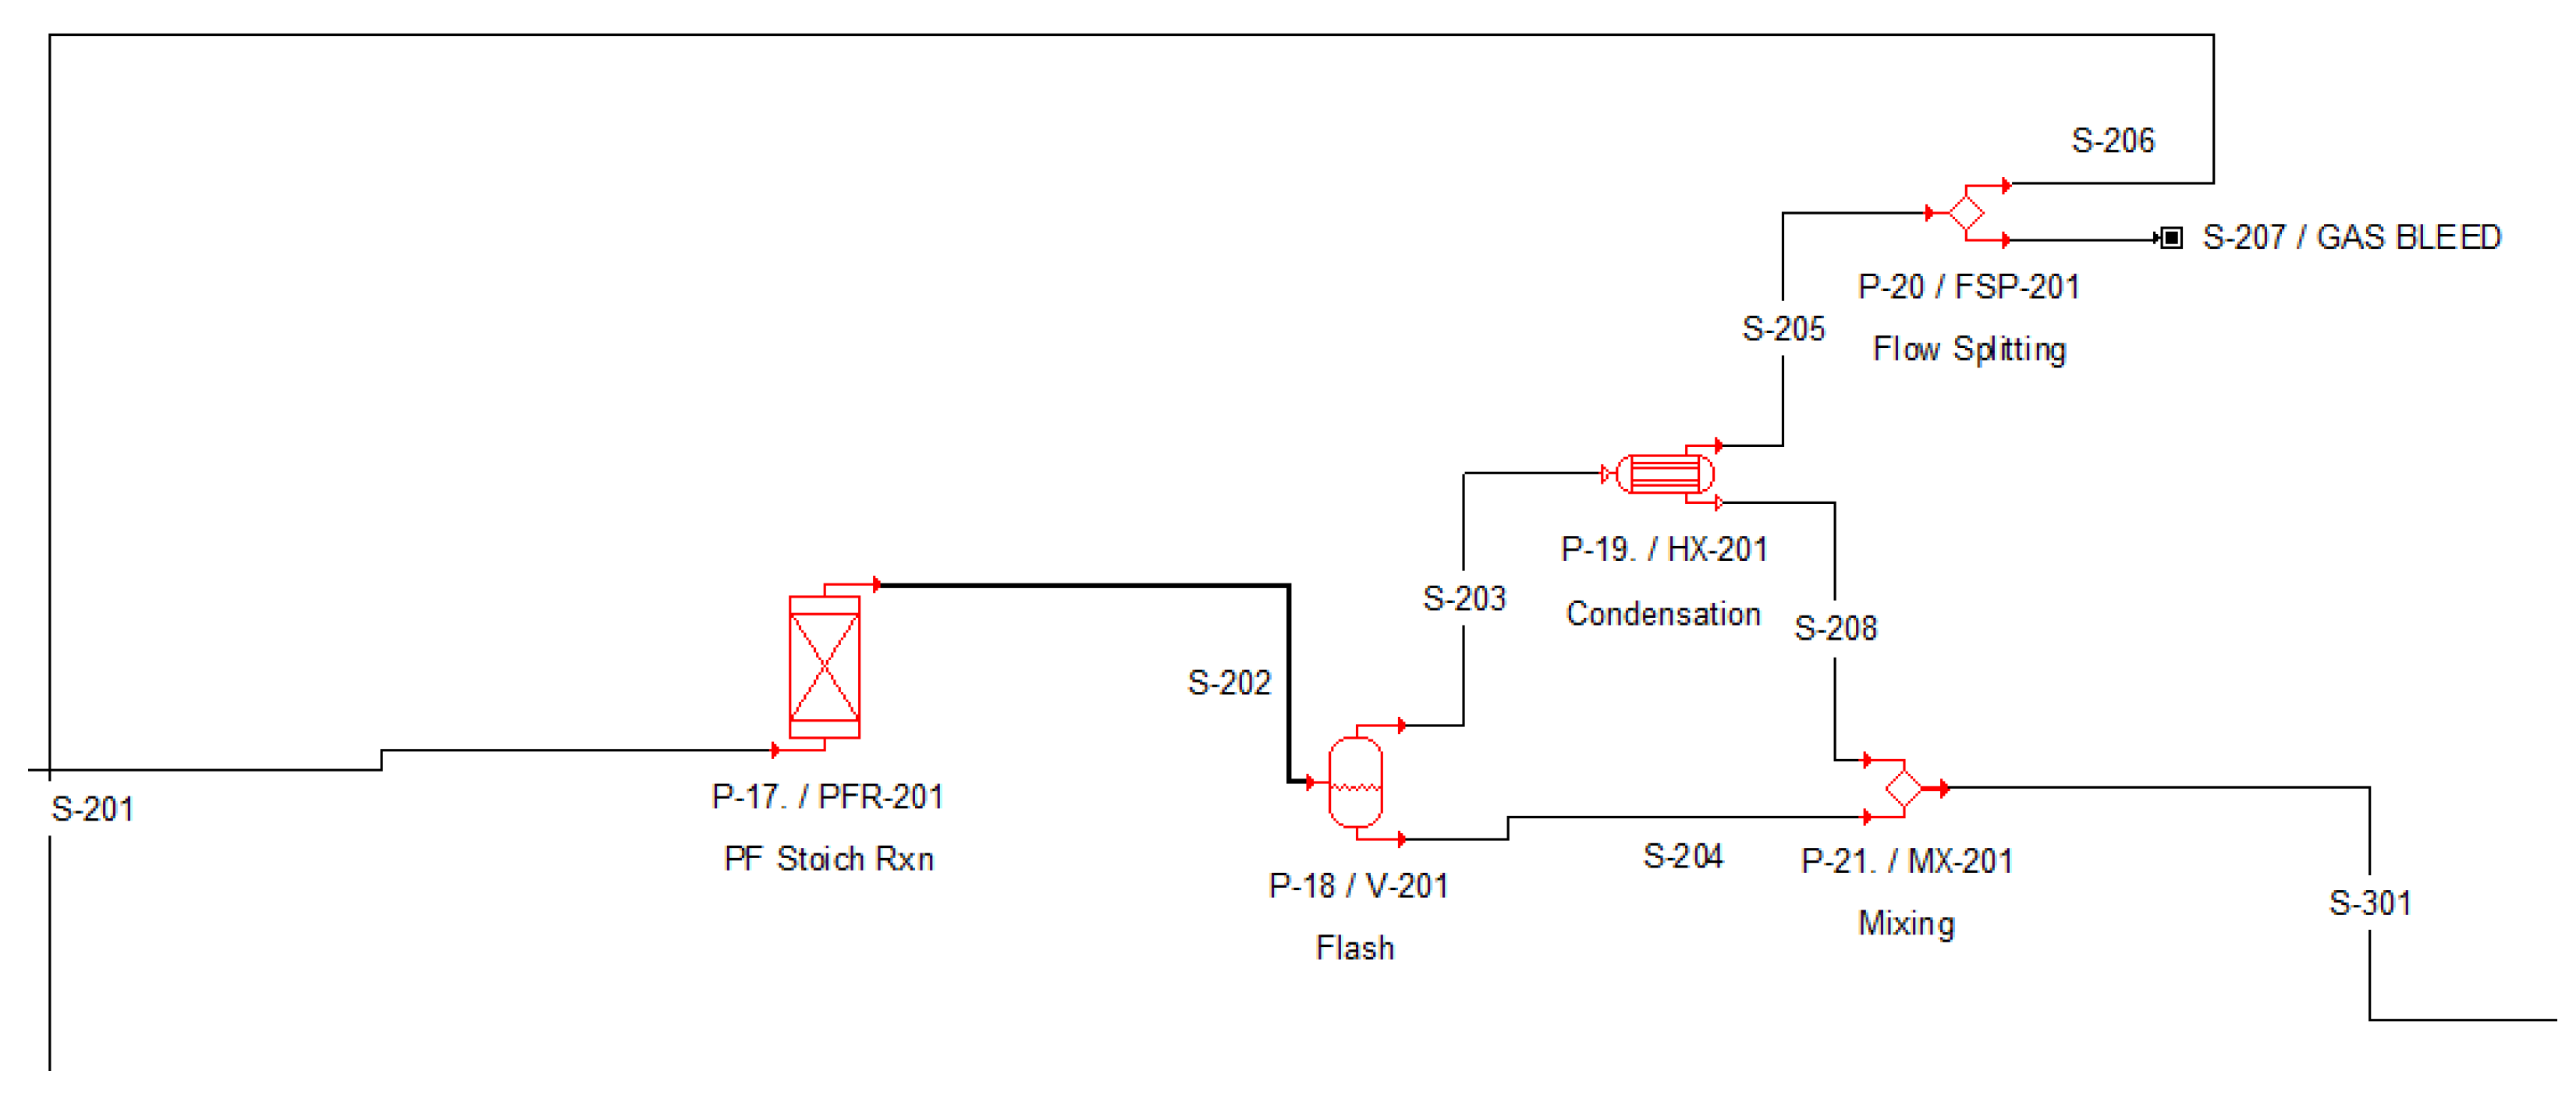
- Section 200: Catalytic Hydrogenation of Carbon Dioxide (see Figure 4)
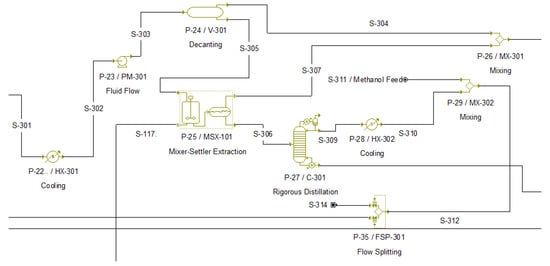
- Section 300: Isolation of the Trihexylamine–Formic Acid Complex (see Figure 5)
- Section 400: Thermal Decomposition of the Amine–Formic Acid Complex (see Figure 6)
Figure 3.
Process Flow Diagram of Section 100 (Case Study A) in SuperPro DesignerTM.
Figure 4.
Process Flow Diagram of Section 200 (Case Study A) in SuperPro DesignerTM.
Figure 5.
Process Flow Diagram of Section 300 (Case Study A) in SuperPro DesignerTM.
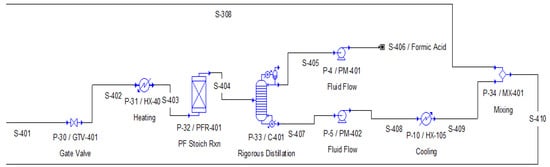
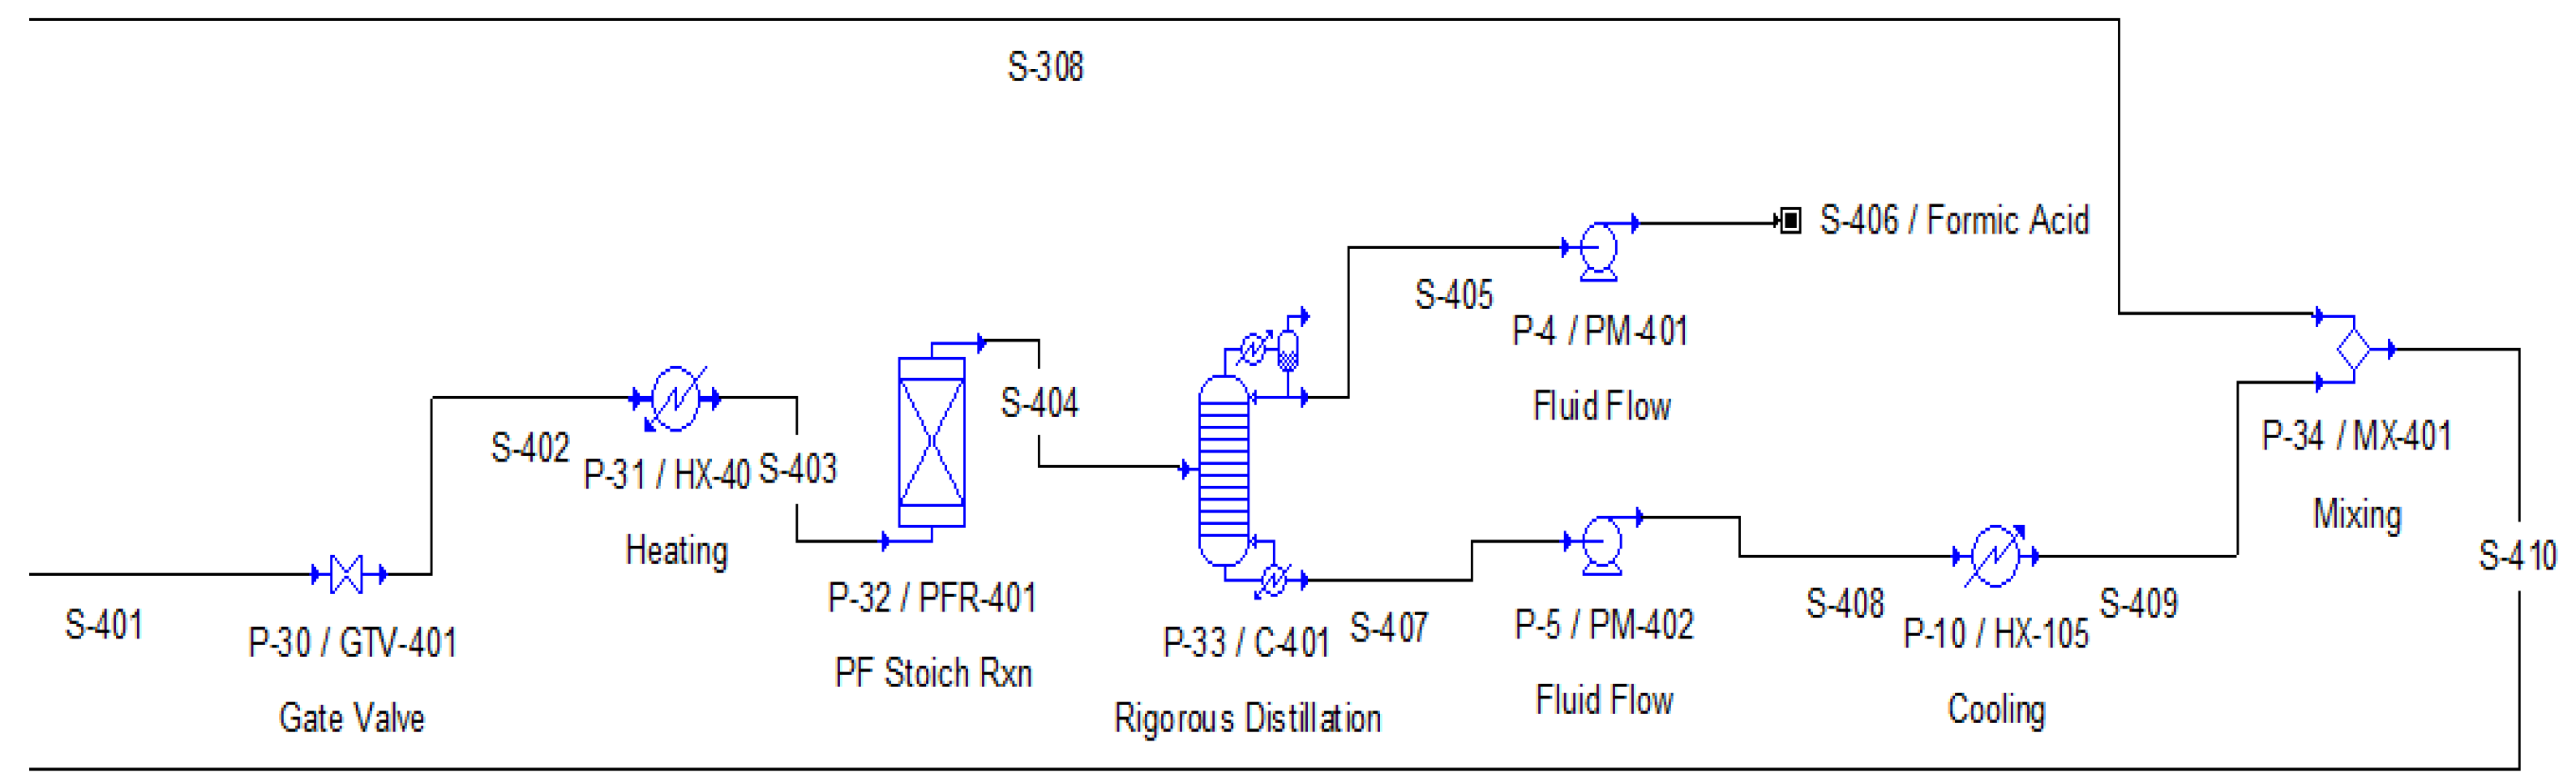
Figure 6.
Process Flow Diagram of Section 400 (Case Study A) in SuperPro DesignerTM.
The following analysis describes each section of the plant in detail. The main operations are outlined, critical technical considerations are noted, and the mass flows of the principal components in each stream are summarized in Tables S1–S7 of the Supplementary Material.
Reactant Preparation (Section 100)
The homogeneous hydrogenation process utilizes carbon dioxide (CO2), hydrogen (H2), trihexylamine, and a methanol–water solvent system as its primary feedstocks. The CO2 feedstock is stored as specified in Table 2. Then it is processed through a compression stage (P-1/G-101), followed by cooling (P-38/HX-102). The compressed stream is fed to the plug-flow reactor (P-17/PFR-101) at 105 bar and 25 °C [30].
Hydrogen is conditioned through a two-stage compression process, utilizing compressors P-3/G-102 and P-5/G-103 with interstage cooling (P-4/HX-102) to control temperature. The compressed H2 stream is then blended with the prepared CO2 in mixer P-7/MX-101 at a molar ratio of 1.5 (H2/CO2), a stoichiometric value reported in the literature as optimal for this reaction [31].
Table 2.
Storage Conditions for CO2 and H2 [22,32].
The liquid phase is prepared from trihexylamine, water, and methanol. The homogeneous catalyst is dissolved in trihexylamine at a concentration of 250 ppm [33]. A recycle stream (S-410), containing unconverted trihexylamine and amine–formic acid complexes, is combined with additional trihexylamine feed in mixer P-36/MX-102. The flow is then regulated through a splitter (P-9/FSP-101) to achieve the target composition for the reactor feed. Proper adjustment of this recycle-to-fresh ratio is crucial for minimizing waste generation in downstream separation. The prepared amine solution is compressed to the reactor pressure of 105 bar and merged with compressed water (S-114) and methanol (S-122) in mixer P-14/MX-103. The overall feed composition, based on a CO2 throughput of 1.611 t/h, is provided in Table 3 [11]. Methanol demand is partially supplied by internal recycling, with the balance provided as fresh make-up at P-29/MX-302 [19]. The final mixture is homogenized in vessel P-15/V-103. It is subsequently fed, together with the gaseous reactants, to mixer P-16/MX-104 upstream of the reactor.
Table 3.
Final composition of amine solution.
A simplified flow diagram of Section 100, outlining the main process units and streams, is provided in Figure 3, while stream properties are detailed in Tables S1–S3 of the Supplementary Material.
Catalytic Hydrogenation of Carbon Dioxide (Section 200)
This section comprises the catalytic reaction stage and the subsequent process for removing the gas phase from the solution. After appropriate preparation in Section 100, the feed stream is directed to reactor P-17/PFR-201. This exothermic reaction has an enthalpy of −77 kJ/mol [31]. The reversible reaction is described by the following chemical equation:
C18H39N + CO2 + H2 ⇌ C18H39N·HCOOH, ΔH = −77 kJ/mol
The reactor is operated at 93 °C, using 25 °C cooling water to control the exothermic heat release. A plug flow reactor (PFR) was selected, as suggested in the literature [15], since this configuration accurately represents concentration and temperature profiles, efficiently removes heat and promotes the gradual conversion of reactants, thereby enhancing the thermodynamic driving force for formic acid formation.
The reactor performance was modeled assuming a fixed CO2 conversion of 0.82, in agreement with thermodynamic estimations and experimental data reported in the literature [31]. Calculations of the equilibrium constant indicate that the reaction is strongly shifted toward formic acid formation and can be considered practically irreversible under the selected operating conditions.
As presented in the Supplementary Information, Figure S3 shows the effect of temperature and pressure on the equilibrium constant and the corresponding CO2 conversion, confirming that at the selected conditions the equilibrium conversion is approximately 82%. Figure S4 illustrates the variation in the equilibrium constant (K) with temperature, using the following thermodynamic relationship [31]:
These results confirm that, within the investigated range, the forward reaction predominates, consistent with the process conditions reported by Schaub et al. [34]. The literature also indicates that residence time of 1 h at 90–100 °C and 105 bar is sufficient to achieve conversions above 80%. However, shorter residence times (less than 45 min) result in significant performance losses due to limited gas dissolution and the instability of catalytic intermediates [26].
The reactor effluent consists of a liquid phase containing the formic acid–trihexylamine complex 70.82 wt%) and a gas phase composed of unreacted CO2, H2 and methanol. This mixture is directed at the high-pressure separator P-18/V-201, which is operated at 80 bar to ensure efficient vapor-liquid phase separation. The flashed vapors are then cooled in the P-19/HX-201 condenser at 35 °C, where water and methanol are condensed, along with a small amount of formic-trihexylamine, which flashed in P-18. The remaining uncondensed vapors, which mainly consist of CO2 and H2 are recycled back to the reactor after an assumed 5% purge in P-20/FSP-201, which prevents inert accumulation. The recycled vapors are compressed in P-37/G-104 and mixed with fresh feed in P-2/MX-105. It is considered essential to maintain elevated pressure throughout the separation stage to prevent CO2 release and the associated recompression penalty. Atmospheric separation, as proposed in some studies, would result in significant CO2 degassing and increased energy demand for recompression [30]. Finally, the liquid streams from the separator and condenser, containing the formic acid-trihexylamine complex are combined and forwarded to Section 300 for further processing. Figure 4 shows the corresponding section of the flow diagram, while Table S4 lists the quantitative parameters of the streams involved.
Isolation of the Trihexylamine-Formic Acid Complex (Section 300)
The stream from Section 200 is fed to Section 300 for further purification of the mixture and recovery of the target product. Undesired components are removed at this stage through successive distillation steps that exploit differences in volatility and boiling points.
The liquid product stream (S-301) consists of two liquid phases, which, after cooling to 40 °C (P-22/HX-301) and compression to 140 bar (P-23/PM-301), are directed to the decanter (P-24/V-301), where phase separation occurs in accordance with the patented process [34]. The light phase, containing amine and methanol, is recycled to the initial stage of the process. The heavy phase (S-305) is forwarded to the mixer–settler extraction unit (P-25/MSX-101), where catalyst removal is carried out using a stream of pure amine supplied from the recycle line (S-117). The extracted stream (S-306), free of catalyst, is sent to the distillation column (P-27/C-301) for solvent recovery. The methanol–water mixture is withdrawn from the top of the column, cooled to 25 °C in heat exchanger P-28/HX-302, and combined with fresh methanol feed in mixer P-29/MX-302 before being recycled to the reactor feed preparation section. The bottom stream (S-312), containing the amine–formic acid complex, is subsequently directed to the thermal decomposition section
The thermodynamic properties required for the design of the column were estimated using Antoine correlations [20,35] and the Wilson activity coefficient model, which accounts for the non-ideal behavior of the mixtures. The corresponding Wilson coefficients were either obtained directly from the literature [36,37,38,39,40,41,42,43] or calculated from vapor–liquid equilibrium (VLE) data [20,30], as illustrated in Figures S5–S7 of the Supplementary Information. These values were manually entered into SuperPro DesignerTM to ensure simulation accuracy. Operating the columns under vacuum enables separation at temperatures below the decomposition limit of the formic acid–amine complex, thereby preserving its stability during processing.
The corresponding process flow diagram is illustrated in Figure 5, while detailed operating conditions and stream compositions are summarized in Tables S5 and S6.
Thermal Decomposition of the Amine–Formic Acid Complex (Section 400)
The final step of the process involves the thermal decomposition of the amine–formic acid complex in order to obtain pure formic acid. Although the complex is stable under mild conditions, it breaks down when heat and low pressure are applied, releasing its two components (see Equation (5)):
C18H39N·HCOOH ⇌ C18H39N + HCOOH
This reaction occurs in a continuous plug flow reactor (PFR) at 80 °C and 0.25 bar, with a residence time of one hour [25,30]. These operating conditions allow for complete decomposition while keeping energy consumption low.
After leaving the reactor, the stream enters the distillation column (P-33/C-401). In this column, formic acid is collected as the distillate, while trihexylamine remains in the bottom. The amine is then pumped to 104 bar (P-35/PM-402), cooled to 25 °C (P-36/HX1052) and recycled to earlier stages of the process. This setup ensures efficient separation, safe operation and sustainable use of materials since the amine is fully recovered and reused.
2.2.2. Process Flow Diagram for Case Study B: Amine Exchange
This process approach is based on a protocol that has been successfully implemented on a pilot scale, incorporating strategies for process improvement [19]. These strategies aim to optimize the pairing of amines for CO2 capture and conversion within an innovative process design that ensures unit stability and efficiency.
The pilot unit demonstrated a production capacity of 10 kg of formic acid per day, achieving a purity level of over 92% by weight and a CO2 conversion rate of 82%. This success enabled the use of a validated simulation model, which can be utilized to scale the process to industrial levels with appropriate modifications.
Selecting the correct amine pair is crucial for converting carbon dioxide into formic acid. In this process, N-methylpyrrolidine (NMPI) was selected as the reaction amine due to its high pKa value of approximately 11 (see Figure S5), enabling effective CO2 capture and conversion. N-butylimidazole (NBI), with a pKa of 7 (see Figure S5), was selected as the decomposition base due to its suitability for complete thermal decomposition of the complex. Using the NMPI–NBI pair in the model aims to ensure process stability and energy efficiency at every stage.
The process flow diagram for this approach comprises three main sections:
- Section 100: Reactant Preparation (see Figure 7)
- Section 200: Catalytic Hydrogenation of CO2 and Recycle of Gaseous Reactants (see Figure 8)
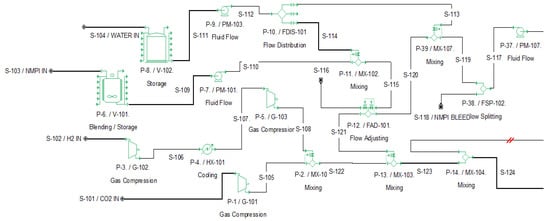
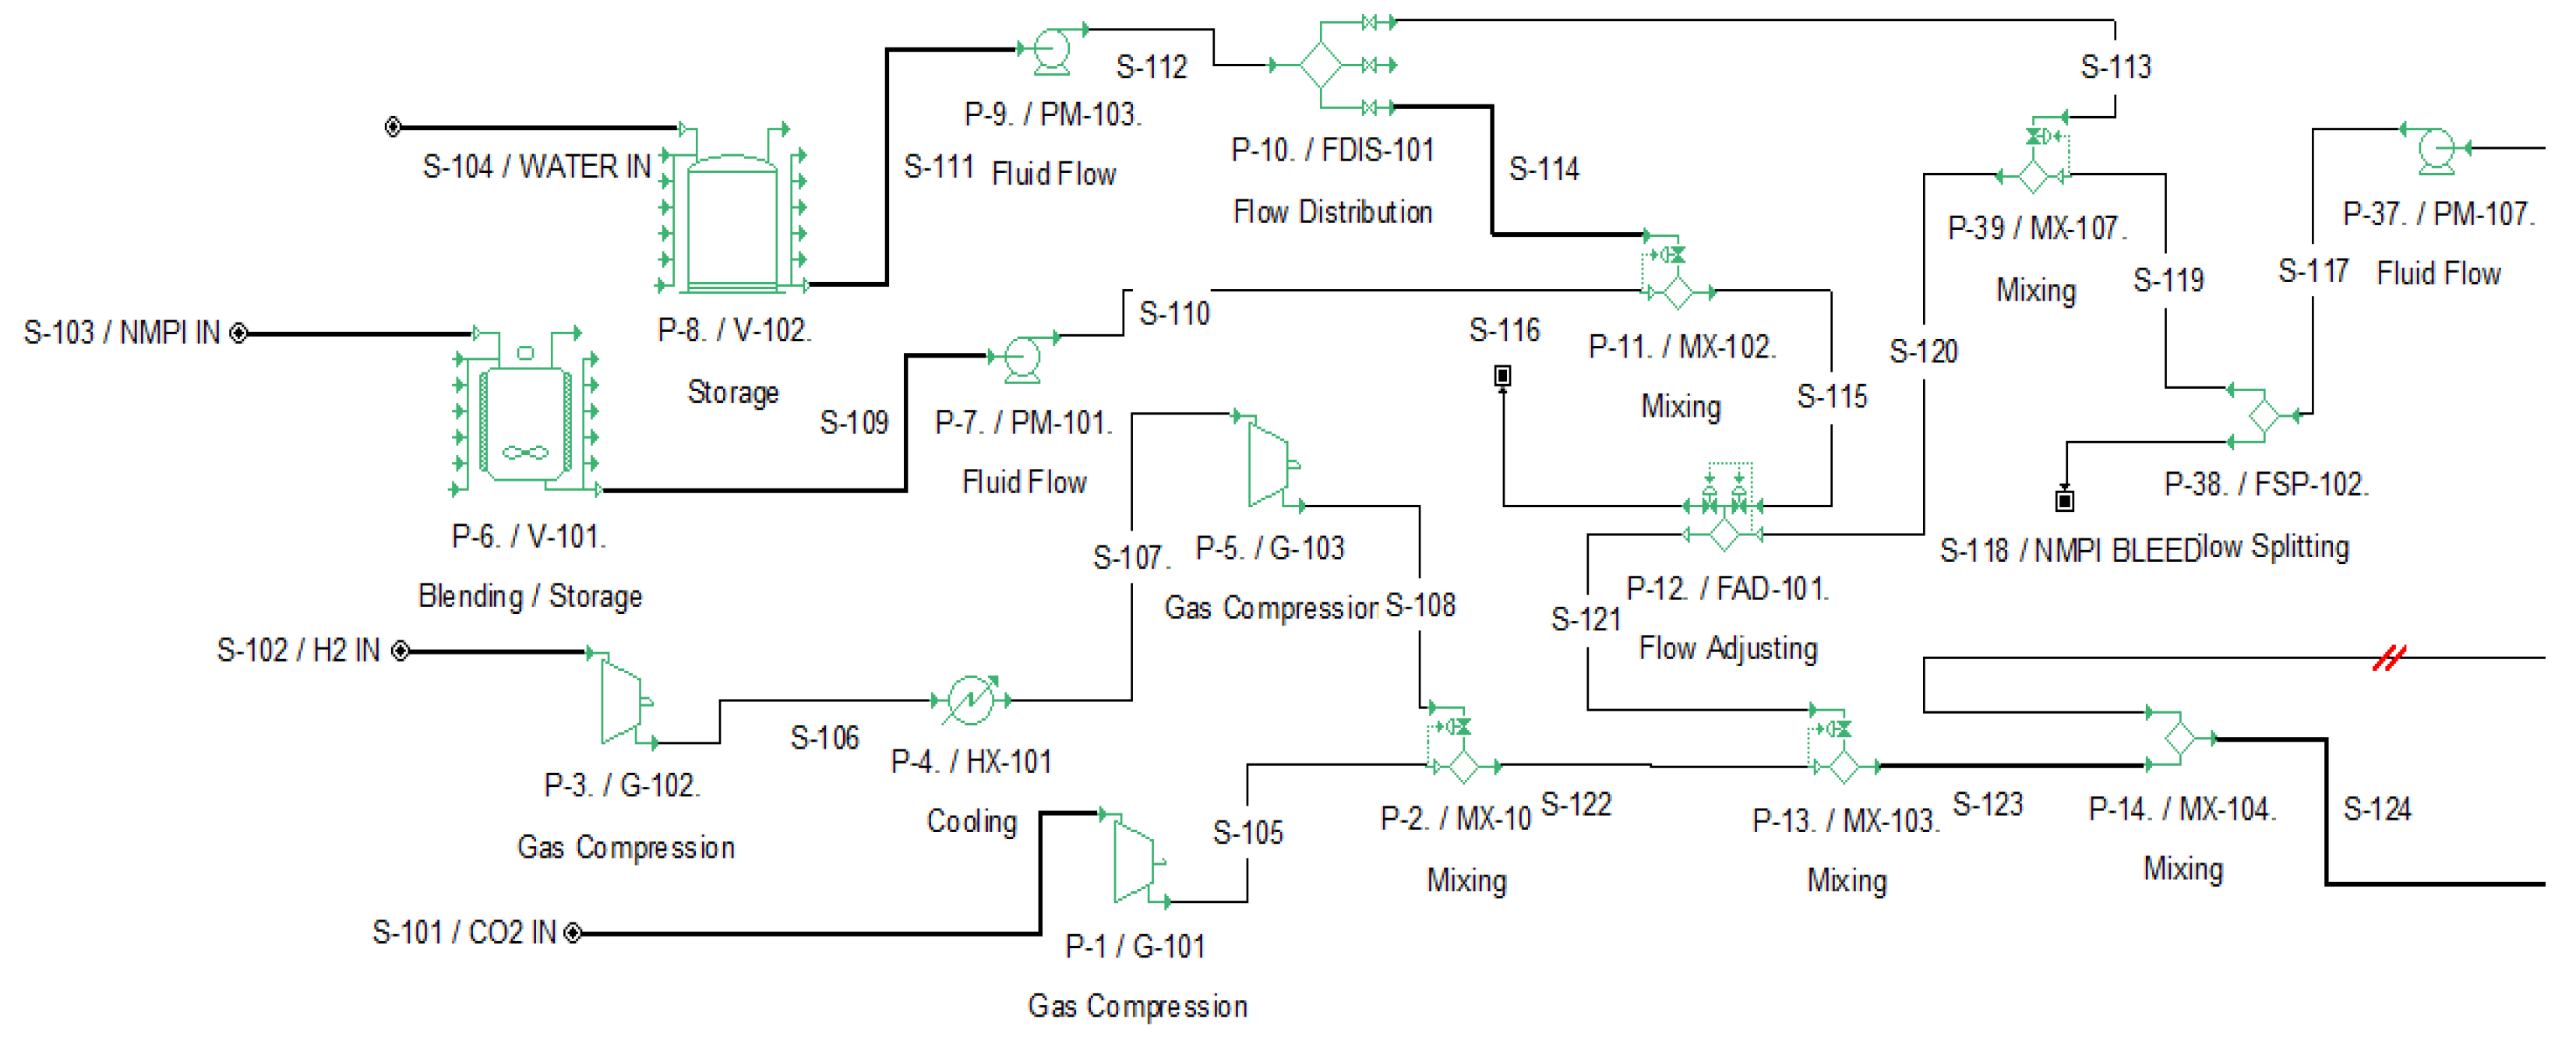
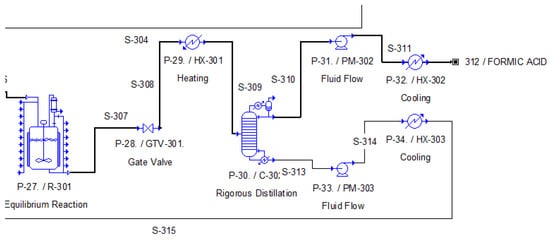
Figure 7.
Process Flow Diagram of Section 100 (Case Study B) in SuperPro DesignerTM.
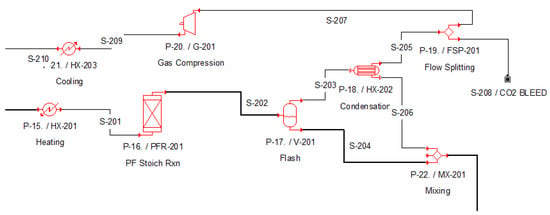
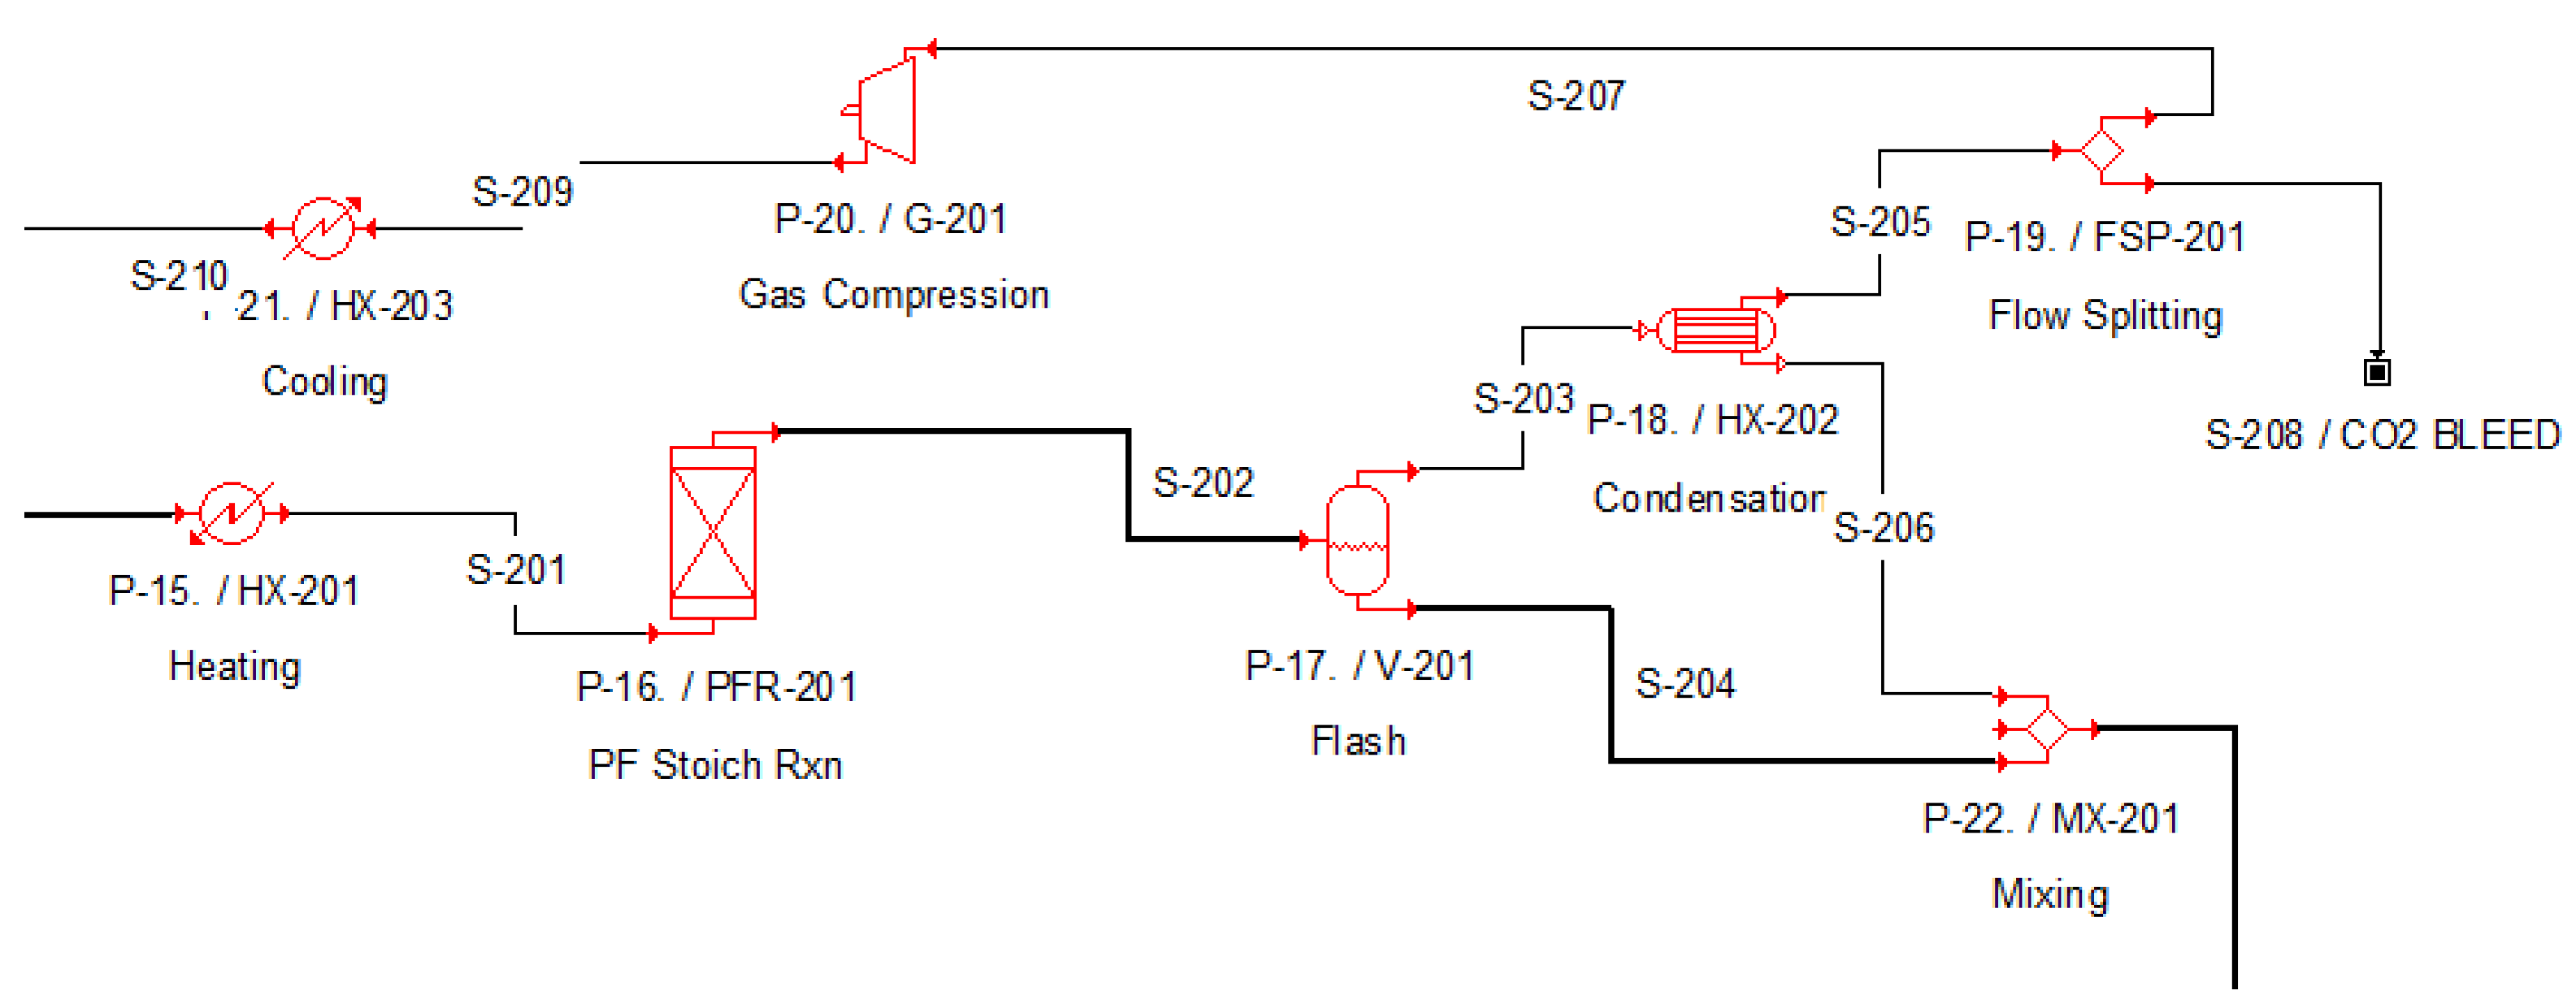
Figure 8.
Process Flow Diagram of Section 200 (Case Study B) in SuperPro DesignerTM.
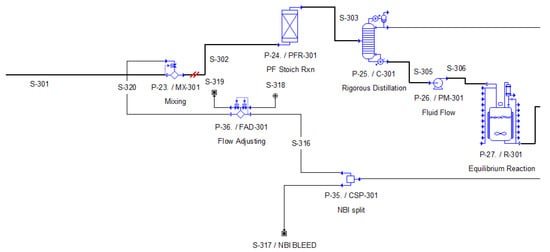
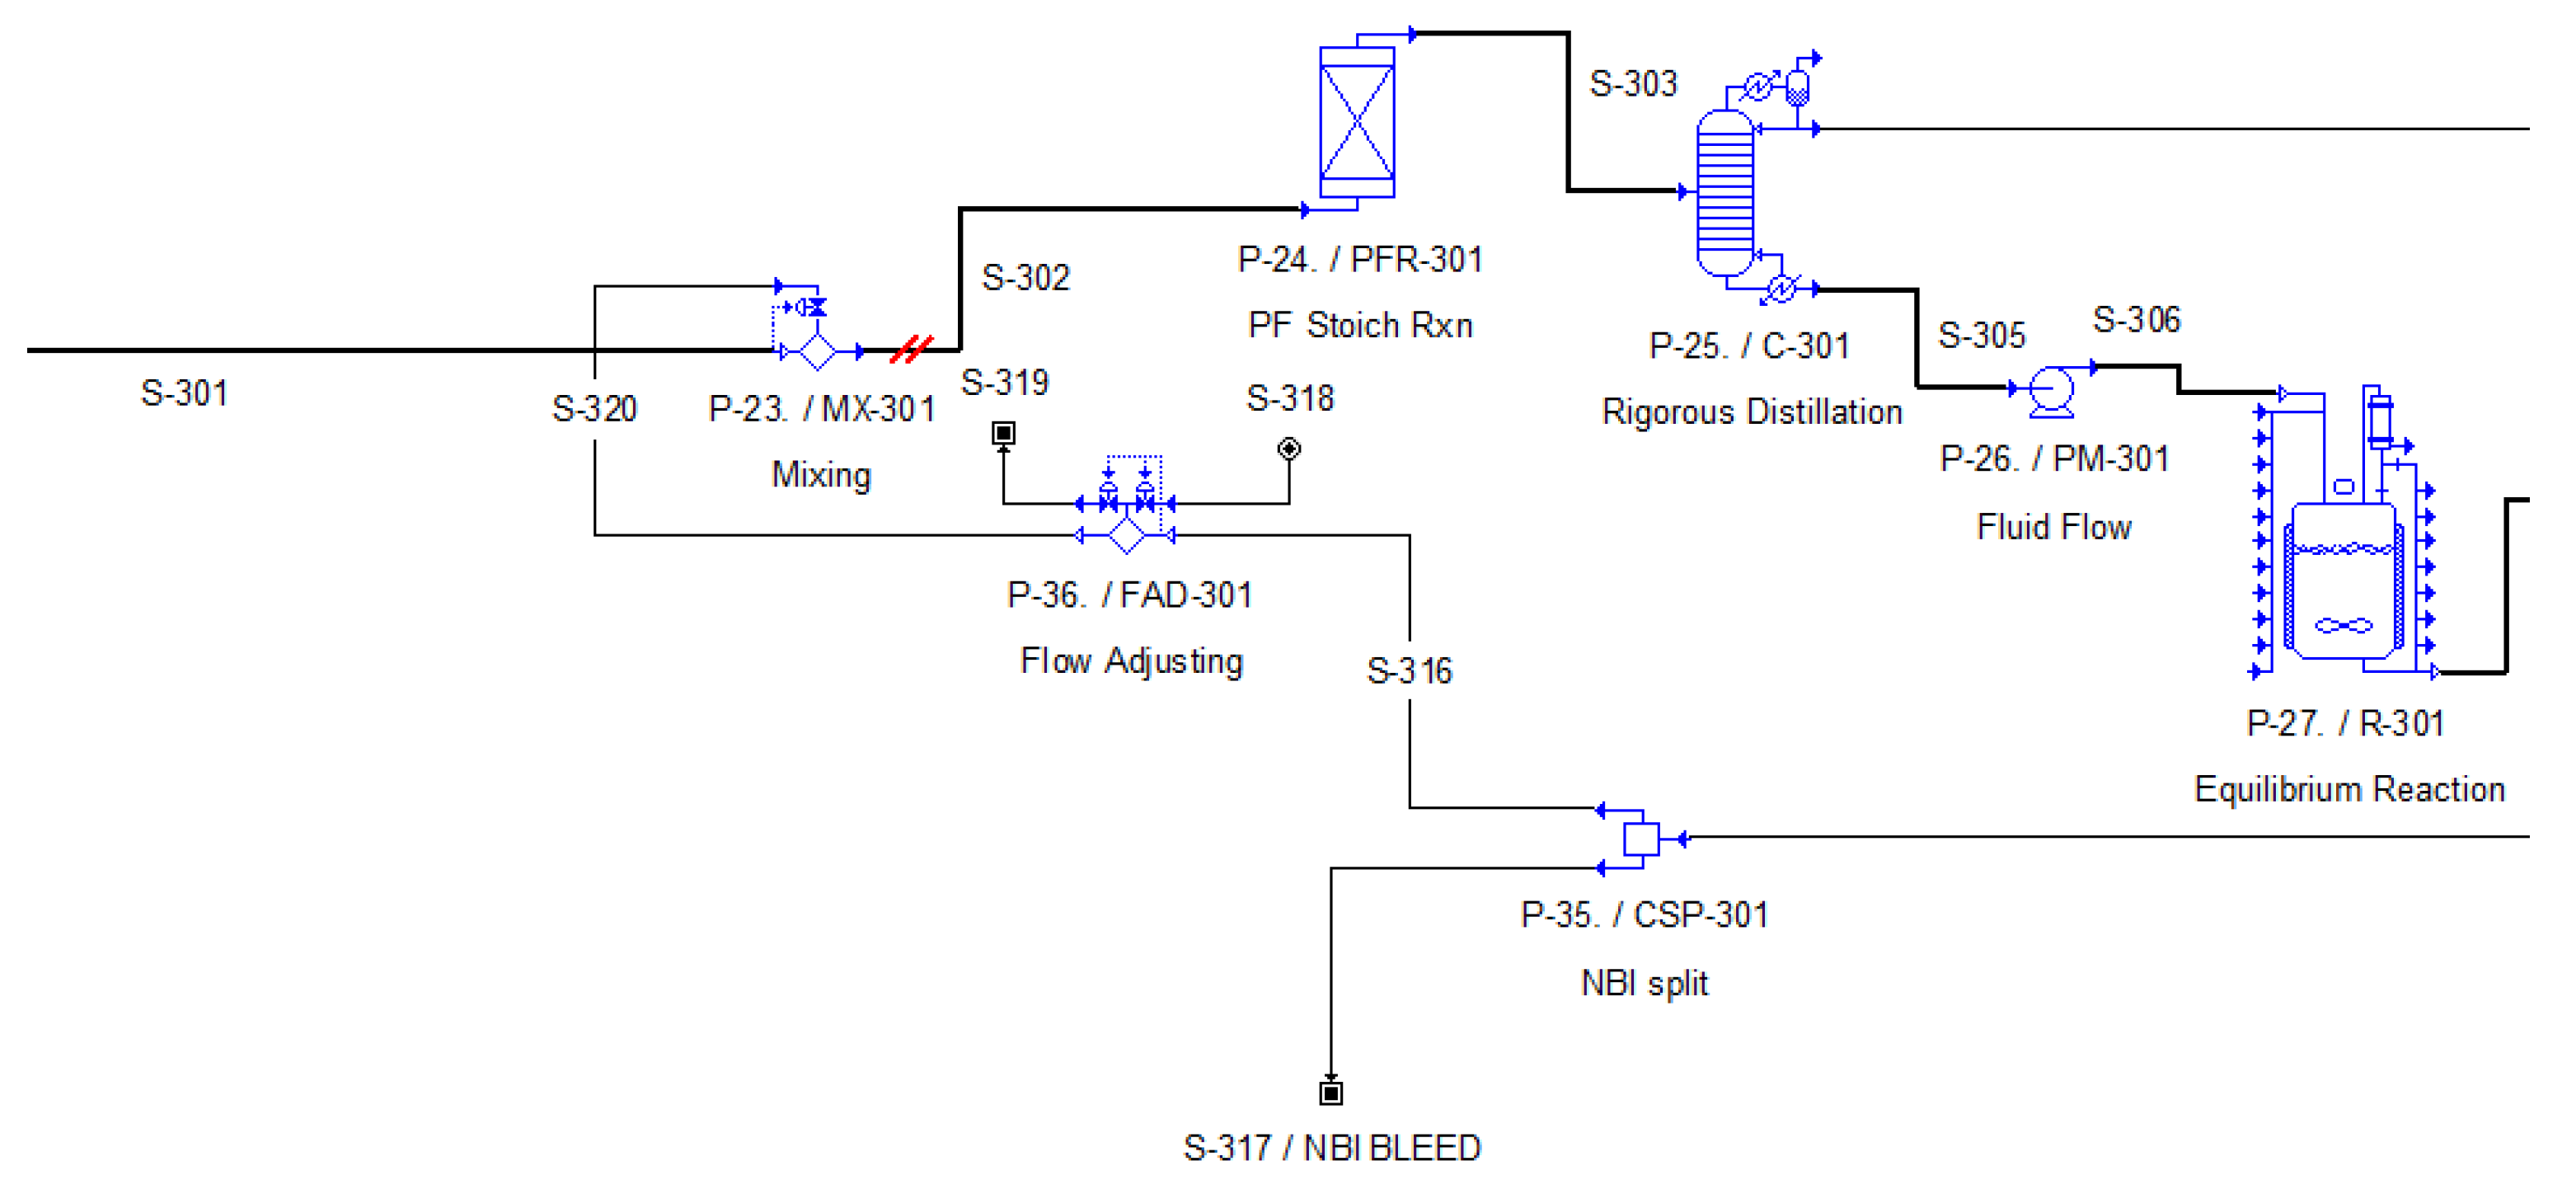
Figure 9.
Process Flow Diagram of Section 300 (Case Study B) in SuperPro DesignerTM.
Figure 10.
Process Flow Diagram of Section 300 (Case Study B) in SuperPro DesignerTM.
A detailed analysis of these process sections, similar to that performed in Section 2.2.1, will follow.
Reactant Preparation (Section 100)
Reactant preparation involves two main stages. First, carbon dioxide and hydrogen gases are mixed and compressed to 120 bar using compressors, then maintained at approximately 70 °C. The two gases are blended using the custom mixer (P-2/MX-101) to achieve a target hydrogen content of 4.5% by weight. The initial quantity of carbon dioxide is considered constant at 1.611 t/h.
Concurrently, the aqueous amine solution is prepared. This process enables a significant proportion of the amine solution to be recycled, substantially reducing the need for fresh feedstock. The two solution components are transferred from storage tanks P-6/V-101 (NMPI amine) and P-8/V-102 (water) to the mixing area using pumps P-7/PM-101 and P-9/PM-103. The composition is presented in Table 4 and was determined based on data from the pilot unit operation [23]. Note that the reactor feed also includes the recycled amine stream, which contains a significant quantity of the complex.
Table 4.
Composition of Polar Amine Solution.
Simulating the amine recycling process involves three key stages to obtain acceptable results, similar to the trihexylamine case. First, the amine is transferred via pump P-37/PM-107 to mixer P-39/MIX-109, where a quantity of pure amine from storage tank P-6/V-101 is added to achieve the target solution composition. After verifying the correct water content, the excess amine is removed in the flow splitter (P-38/FSP-102). The stream then passes through a flow adjustment unit (P-12/FAD-101), which regulates the flow of the output stream to ensure that the correct amount of solution is added.
Finally, the two phases are mixed using a custom mixer (P-13/MX-103) before passing through mixer P-14/MX-104, where the recycled gas stream is introduced. The above section consists of suitable connections and a set of mixers, splitters, custom mixers and flow adjustment units, used for flowsheeting purposes. Τhese units and connections are mainly used for flowsheeting purposes and ensure that the correct flows and compositions of reactants are added in the reactor, in a fully automated flowsheet. The combined stream is then directed to Section 200 for catalytic hydrogenation of carbon dioxide.
The process flow diagram for Section 100 is shown in Figure 7, while Tables S8–S10 provide detailed information on the total quantity of all components contained in each stream of the section, as well as the prevailing operating conditions.
Catalytic Hydrogenation of CO2 and Recycle of Gaseous Reactants (Section 200)
This section delineates the reaction that is utilized to produce the NMPI–formic acid complex, in addition to the separation of residual gases from the reactor effluent. In the pilot plant, a trickle-bed reactor with an axial Ru/bpyTNCTF catalyst bed was employed. In this study, the reactor was modeled as a plug flow reactor (P-16/PFR-201) with a residence time of 1 h. The experimental results demonstrated that catalyst performance was enhanced by increasing temperature and pressure [44,45]. However, based on the available catalyst stability data, the optimal reaction conditions were determined to be 120 °C and 12 MPa. Despite the reversibility of the reaction, the absence of precise kinetic data resulted in the assumption of a one-way reaction with a fixed CO2 conversion of 82% [19].
In order to enhance the precision of the simulation, the process was modeled in two stages with known reaction enthalpies [22].
CO2 + H2 ⇌ HCOOH, ΔH = −32 kJ/mol
HCOOH + C5H11N ⇌ C5H11N·HCOOH, ΔH = −22.5 kJ/mol
The reactor effluent, comprising substantial quantities of water (which does not directly participate in the reaction) and unreacted feed, constitutes a two-phase vapor-liquid mixture. The stream is sent in a flash separator (P-17/V-201) that operates at 75 °C and atmospheric pressure with the objective of removing CO2 and H2 vapors for the purpose of recycling. The selection of these conditions was driven by the objective of minimizing the amount of NMPI–formic acid complex, which is volatile and it inevitably partially carried into the gas phase. In order to recover the vapors of NMPI–formic acid complex, the vapor stream is condensed in P-18/HX-202 at 35 °C, thereby limiting the NMPI–formic acid complex losses to approximately 9%. Subsequently, the gas passes through a flow splitter (P-19/FSP-201), where a 5% purge stream is removed to prevent inert gas accumulation. The remaining fraction of the vapor is compressed (P-20/G-201), cooled (P-21/HX-203) to reactor inlet conditions, and mixed with fresh feed.
The liquid streams from the vapor-liquid separator and the condenser are combined in mixer P-22/MX-201 and sent to subsequent process stages.
The above process concept is based on the fact that, although CO2 is initially dissolved in the NMPI and water liquid phase at the elevated pressures of the preparation mixers and the reactor, it is flashed under atmospheric pressure. The presence of hydrogen vapors facilitates further the recovery of the CO2 in the vapor phase. This enables its removal from the liquid phase without the need for a stripper unit. The process flowsheet for this section is illustrated in Figure 8, and the corresponding stream properties and compositions are quantified in Table S11 in Supplementary Information.
Amine Exchange and Final Product Isolation (Section 300)
The final stage of the process involves an amine exchange reaction to form a new complex, followed by its thermal decomposition. The NMPI amine provides great conversion and performance to the CO2 to FA reactor. However, both the NMPI amine and the NMPI-FA complex form azeotropes together with formic acid. This means that the separation of the produced FA would be capital and energy intensive. NBI is another amine, which does not form azeotropes with FA, and its corresponding NBI amine-FA complex also does not form azeotrope with FA. As such, it is meaningful to include in the design an amine exchange step to convert the NMPI-FA to NBI-FA and then design a less complicated downstream separation; both NMPI and NBI amines can be recycled and reused.
Whilst the conventional approach to this process involves the use of a reactive distillation column, since the conversion of the amine exchange reaction is 100%, it was modeled as a plug flow reactor (P-24/PFR-301) in combination with a distillation column (P-25/C-301). The PFR operates at a pressure of 0.2 bar and temperature of 59 °C [20] enabling the exchange reaction depicted in Equation (8):
C5H11N·HCOOH (NMPI-FA) + C7H12N (NBI) ⇌ C7H12N·HCOOH (NBI-FA) + C5H11N (NMPI)
(8)
The NBI amine input is sourced from the recycle stream that is generated after the separation of the second complex in distillation column P-30/C-302. This stream is then combined with a small amount of make-up NBI in mixer P-23/MX-301 to ensure a complete reaction of the first complex.
The distillation column P-25/C-301 operates at a pressure of 0.07 bar [19]. The design of the process ensures the collection of the NMPI amine as an aqueous distillate [19], while the newly formed NBI–FA complex remains in the bottoms for subsequent processing. This configuration facilitates the efficient recovery and concentration of the NBI-formic acid complex, while in parallel it recovers the first NMPI amine allowing its recycling back to the previous section.
The bottoms stream is then pumped (P-26/PM-301) to an equilibrium reactor (P-27/R-301), where thermal decomposition of the complex occurs (Equation (9)):
C7H12N·HCOOH (NBI-FA) ⇌ HCOOH + C7H12N (NBI)
(9)
The adiabatic reactor functions at a temperature of 100 °C and ambient pressure, with the equilibrium constant fixed at 500 [46].
The resulting mixture is then directed to a vacuum distillation column P-30/C-302 for final separation. The collection of formic acid as the distillate is achieved at a purity level of 99.63%, while the NBI amine is recovered from the bottoms and subsequently recycled for reuse in the amine exchange reaction.
All physicochemical and thermodynamic properties of the amines and complexes were incorporated into the SuperPro DesignerTM simulation using literature data [23,35].
The corresponding process flow diagram is illustrated in Figure 9 and Figure 10 while detailed operating conditions and stream compositions are summarized in Tables S12–S14.
2.3. Technoeconomic and Break-Even Analysis
Following the development of the process flow diagrams for the two alternative formic acid production pathways, an economic evaluation was conducted to assess their relative viabilities and enable direct comparison. The evaluation process necessitated dimensional sizing of the primary equipment, which was conducted utilizing the integrated engineering tools in SuperPro DesignerTM [29]. For the sake of presentation, detailed information regarding the sizing of equipment and the individual costs is provided in Table S15 in the Supporting Information.
The total capital and operating cost estimates were generated using the software’s built-in cost models, which have been updated to reflect current economic conditions. In instances where specific data were unavailable, such as the purchase cost of certain raw materials, values were sourced from the recent literature and entered manually. It was determined that the raw material cost was a substantial contributing factor in the operating expenses. Tables S16–S18 present a summary of baseline values for all key raw materials and utilities.
A range of key economic indicators were calculated in order to evaluate economic performance and investment viability. These indicators included Net Present Value (NPV), Internal Rate of Return (IRR), and Payback Time (PBT). The analysis was based on a consistent set of technical and economic assumptions, the details of which are summarized in Table S19. These include a project lifetime of 15 years, defined construction and start-up periods, an annual inflation rate of 4%, and other critical financial parameters.
Moreover, a break-even analysis was conducted in order to achieve the minimum formic acid selling price required at which the Net Present Value equals to zero. It is imperative to distinguish between this price and the unit production cost. The former incorporates the full capital investment and financing costs over the project’s lifetime, whereas the latter refers exclusively to the ongoing manufacturing expenses. The resulting break-even price is a useful benchmark for assessing market sensitivity and investment risk.
The ensuing sections will present a detailed economic assessment for each production pathway. This will be followed by a comparative discussion of their economic performance.
2.4. Sensitivity Analysis
Sensitivity analysis is a fundamental tool in techno-economic assessment, enabling systematic evaluation of selected parameters’ affection to the financial performance of an investment. It is possible to identify the factors with the greatest influence on the Net Present Value (NPV) and Return on Investment (ROI) by varying certain key parameters. Such parameters may include, but are not limited to, product selling price, raw material costs, and energy and utility expenses.
The tornado diagram method was employed for graphical representation. This standardized approach, which is employed in numerous feasibility studies, utilizes a horizontal layout that facilitates immediate identification of parameters with the most significant positive or negative impact on economic performance. In this study, the diagrams were generated in Microsoft Excel by applying a variation range of ±30% to each variable while holding all others constant. This methodology provides a robust basis for assessing investment risk under different scenarios and supports informed decision-making in environments of uncertainty or elevated risk.
3. Results and Discussion
3.1. Techno-Economic Analysis Results-Case Study A
A comprehensive economic assessment was conducted to evaluate the financial viability of the two formic acid production routes. The analysis included estimating both capital investments and annual operating costs for each alternative.
The total fixed capital investment was calculated at $21.34 million and $49.96 million for Process A and Process B, respectively. A detailed breakdown of these figures is provided in the Supplemetary Information Tables S20 and S21. The annual operating costs, including the cost of raw materials and utilities, are outlined in Tables S22 and S23.
A significant difference is observed in the distribution of annual operating costs between the two processes. In Process A, costs are shared more evenly: facility-related costs represent 22%, labor costs 15%, utilities 25%, and raw materials 36%. Process B, on the other hand, depends much more on facility-related costs, which make up almost half of the total (48%). While utilities remain similar to Process A at 22%, labor and raw materials account for 13% and 12%, respectively.
These structural differences indicate that Process B requires larger infrastructure investments, while Process A is more sensitive to labor and material costs.
Clearly, the cost calculations have provided a solid foundation for determining key economic indicators. These include unit production costs and profitability metrics, which have been calculated for both processes. The results of the comparative analysis are summarized in Table 5 and form the basis of the final investment recommendation.
Table 5.
Techno-economic analysis executive summary for case studies.
In terms of capital requirements, Case Study A demands $26.74 million, considerably less than the $49.99 million needed for Case Study B, reducing investment risk. Case Study A also has the advantage of lower annual operating costs ($15.39 million compared to $18.51 million for Case Study B) and lower unit production costs ($1.18/kg compared to $1.35/kg for Case Study B). These advantages translate into a gross margin of 15.66% for Case Study A, which is significantly higher than the modest 4.88% achieved by Case Study B.
The superiority of Case Study A is also evident in the investment performance indicators. It delivers a return on investment (ROI) of 16.75%1, has a payback period of 5.97 years and has a positive Net Present Value (NPV) of $3.79 million, with an internal rate of return (IRR) of 9.16%. These results confirm that the project can achieve profitability while ensuring long-term financial resilience.
By contrast, Case Study B underperforms in all key metrics. It results in a negative NPV of −$14.77 million, a low IRR of 1.77%, an extended payback period of 9.22 years and a low return on investment of 10.32%. These outcomes highlight the economic weaknesses of this pathway and its inability to meet accepted investment benchmarks.
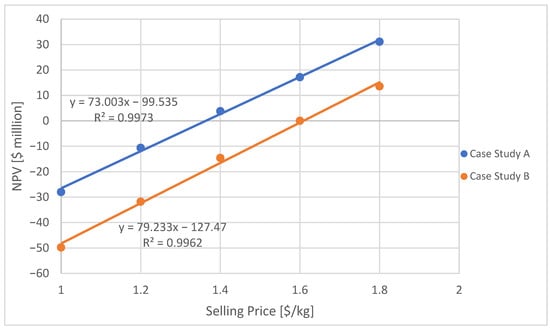
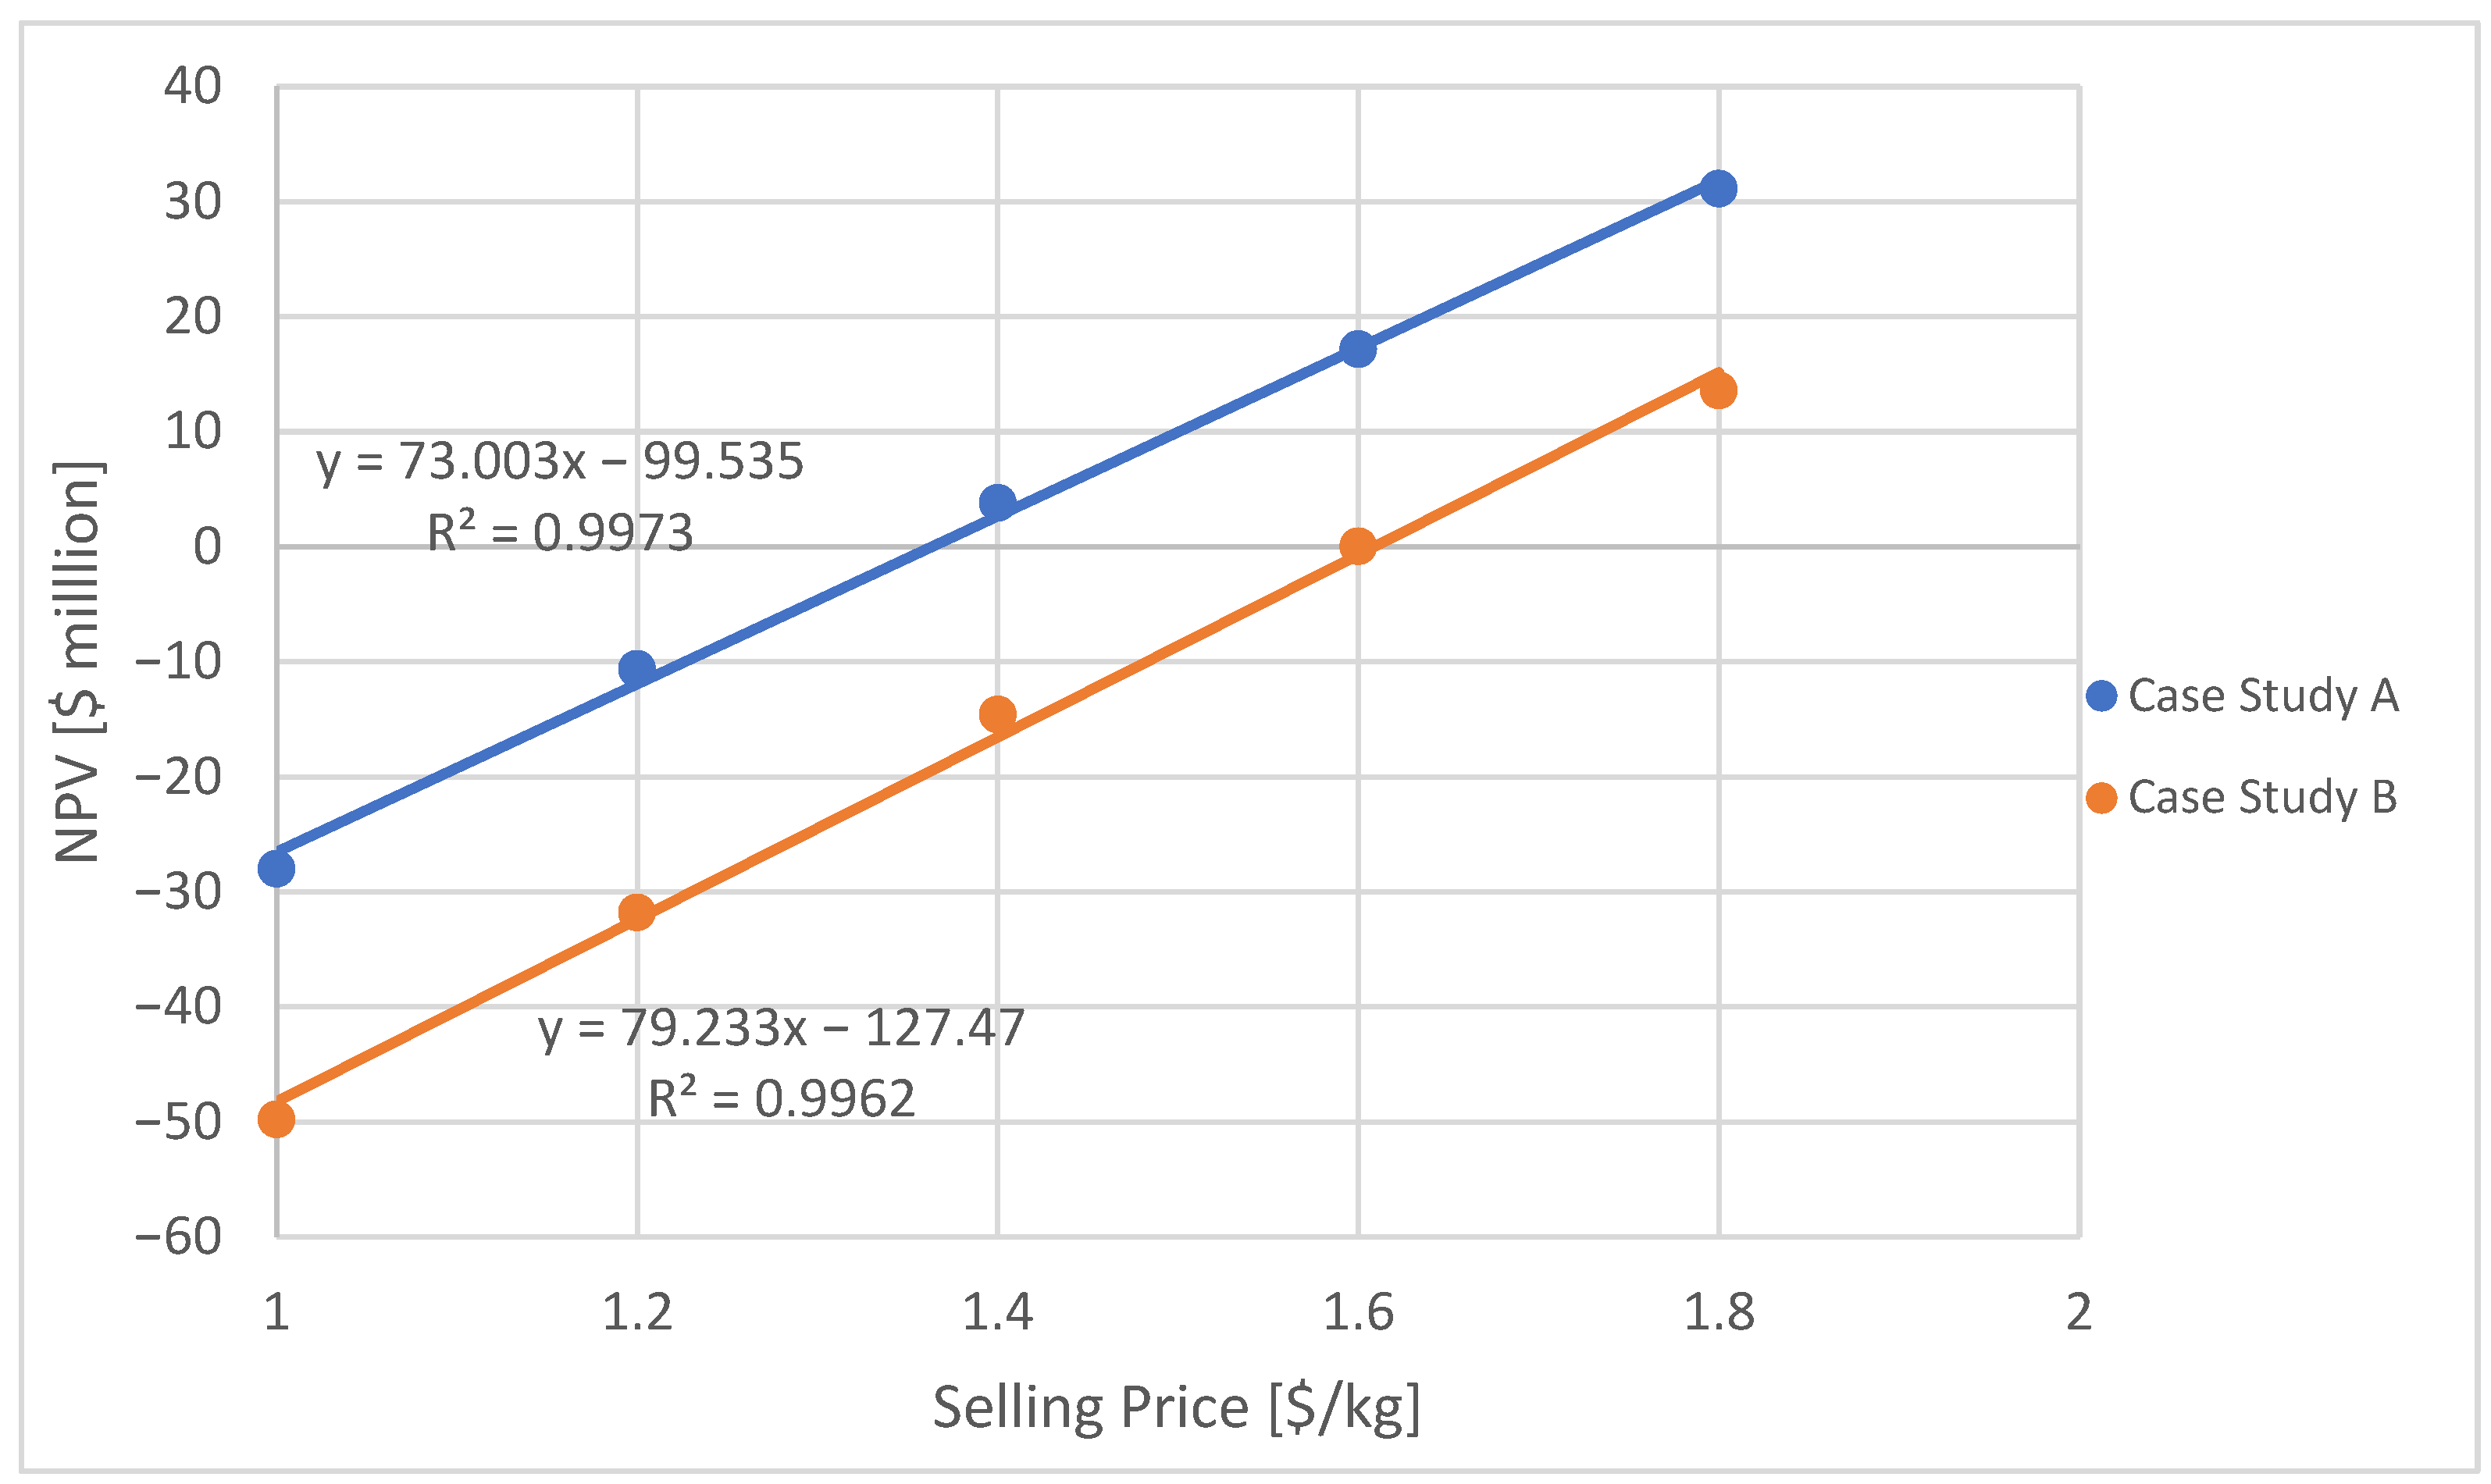
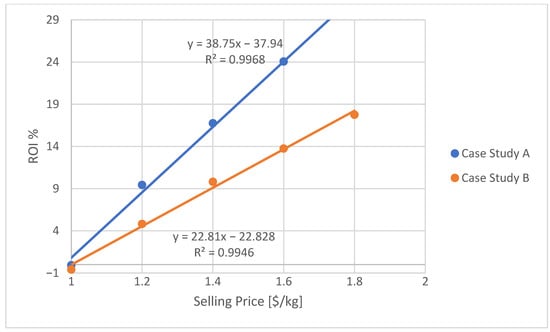
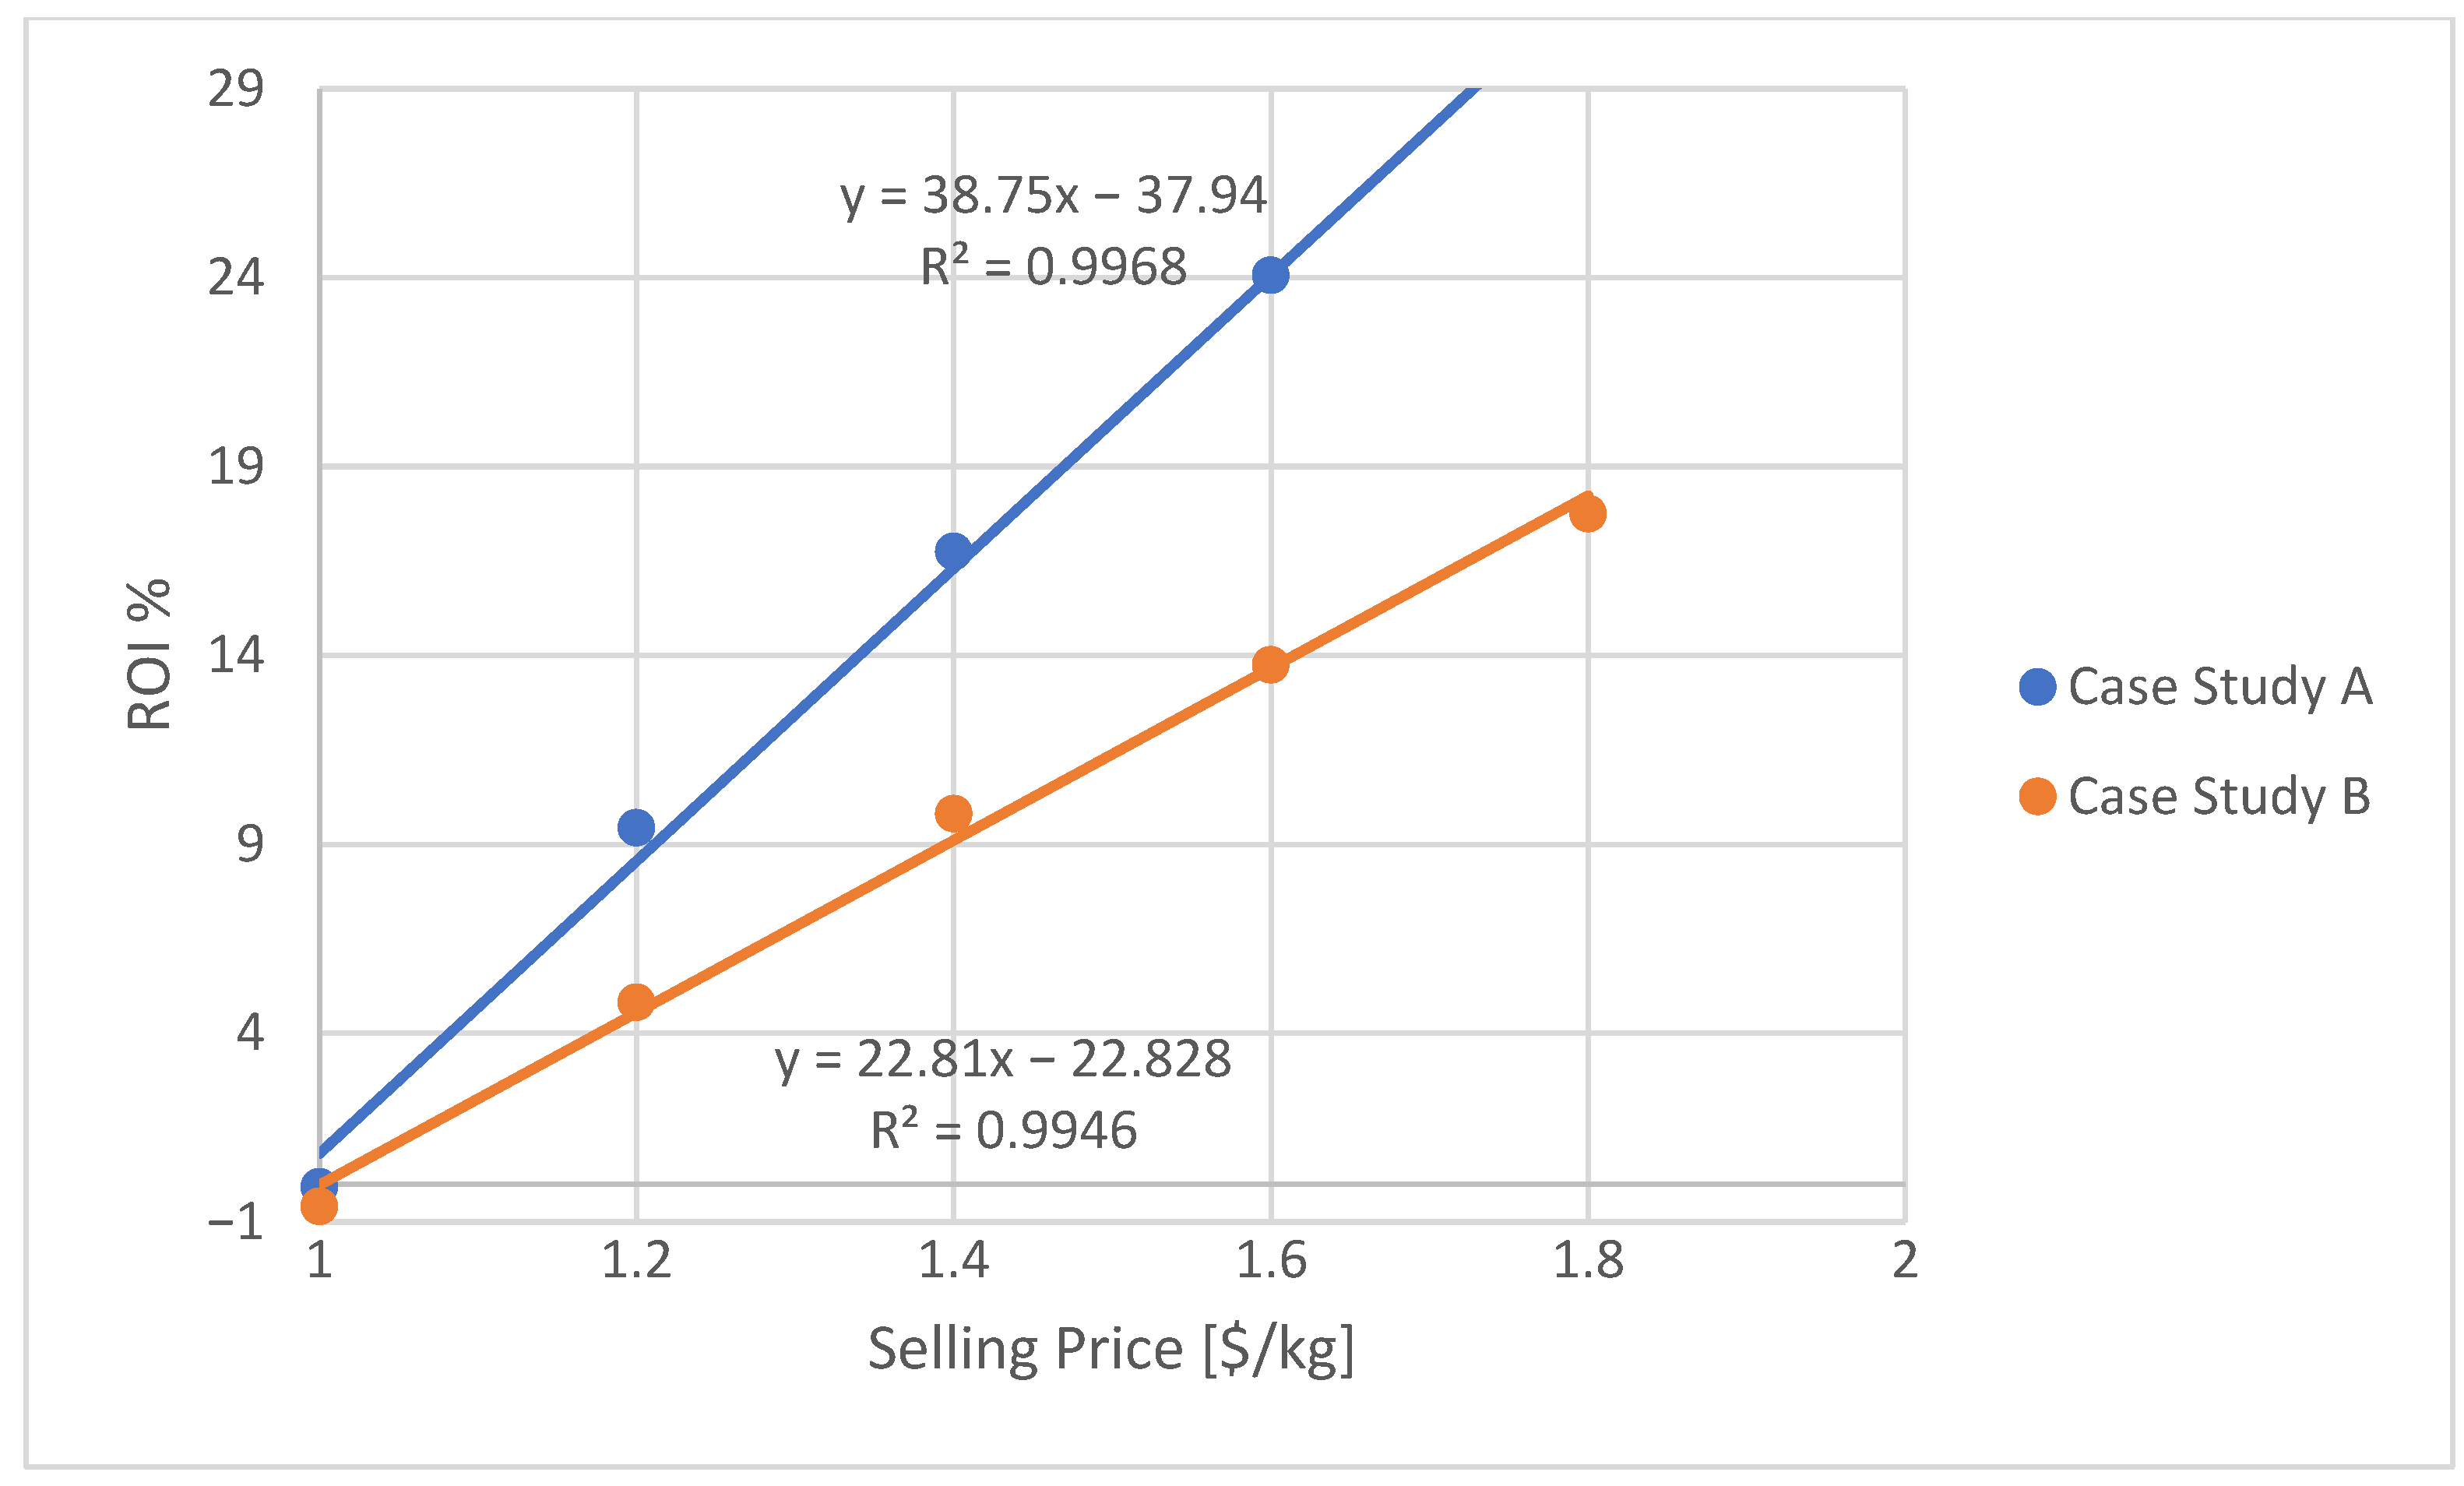
A break-even analysis was additionally conducted, utilizing the Net Present Value (NPV) method to ascertain the minimum selling price required for each production scenario to achieve financial viability (see Figure 11). This analysis provides critical insight into the price sensitivity and economic resilience of both projects. Case Study A demonstrates stronger economic fundamentals, reaching its Net Present Value (NPV) break-even point at a selling price of $1.36 per kilogram, which indicates project’s capacity to remain profitable even in the face of moderate market price pressures. As demonstrated in Case Study B, a substantially higher selling price of $1.61 per kilogram is required in order to achieve financial viability. This 15% higher break-even point indicates the sensitivity of the project to market conditions and a considerably reduced safety margin. The $0.25 per kilogram differential between the two projects underscores the superior capacity of Case Study A to withstand market volatility. This advantage is primarily due to lower capital requirements and a more favorable operating cost structure. The findings reported here are consistent with the strong performance across a range of other financial metrics, including return on investment (ROI) (see Figure 12). In conclusion, the break-even analysis provides a critical risk assessment metric, confirming that Case Study A is more resilient and economically sustainable investment than Case Study B.
Figure 11.
Net Present Value (NPV) as a Function of Formic Acid Selling Price—Break-Even Point Determination.
Figure 12.
Return on Investment (ROI) as a Function of Formic Acid Selling Price.
Table 6.
Net Present Value (NPV) Break-Even Analysis Summary.
3.2. Sensitivity Analysis Results
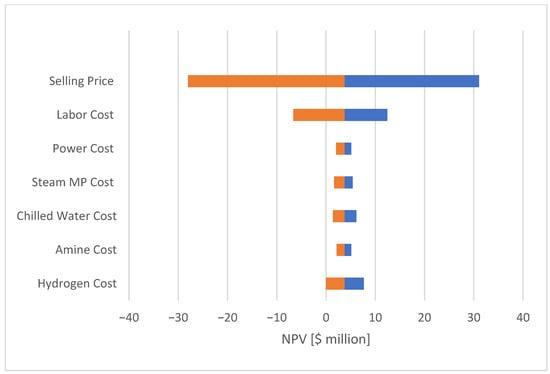
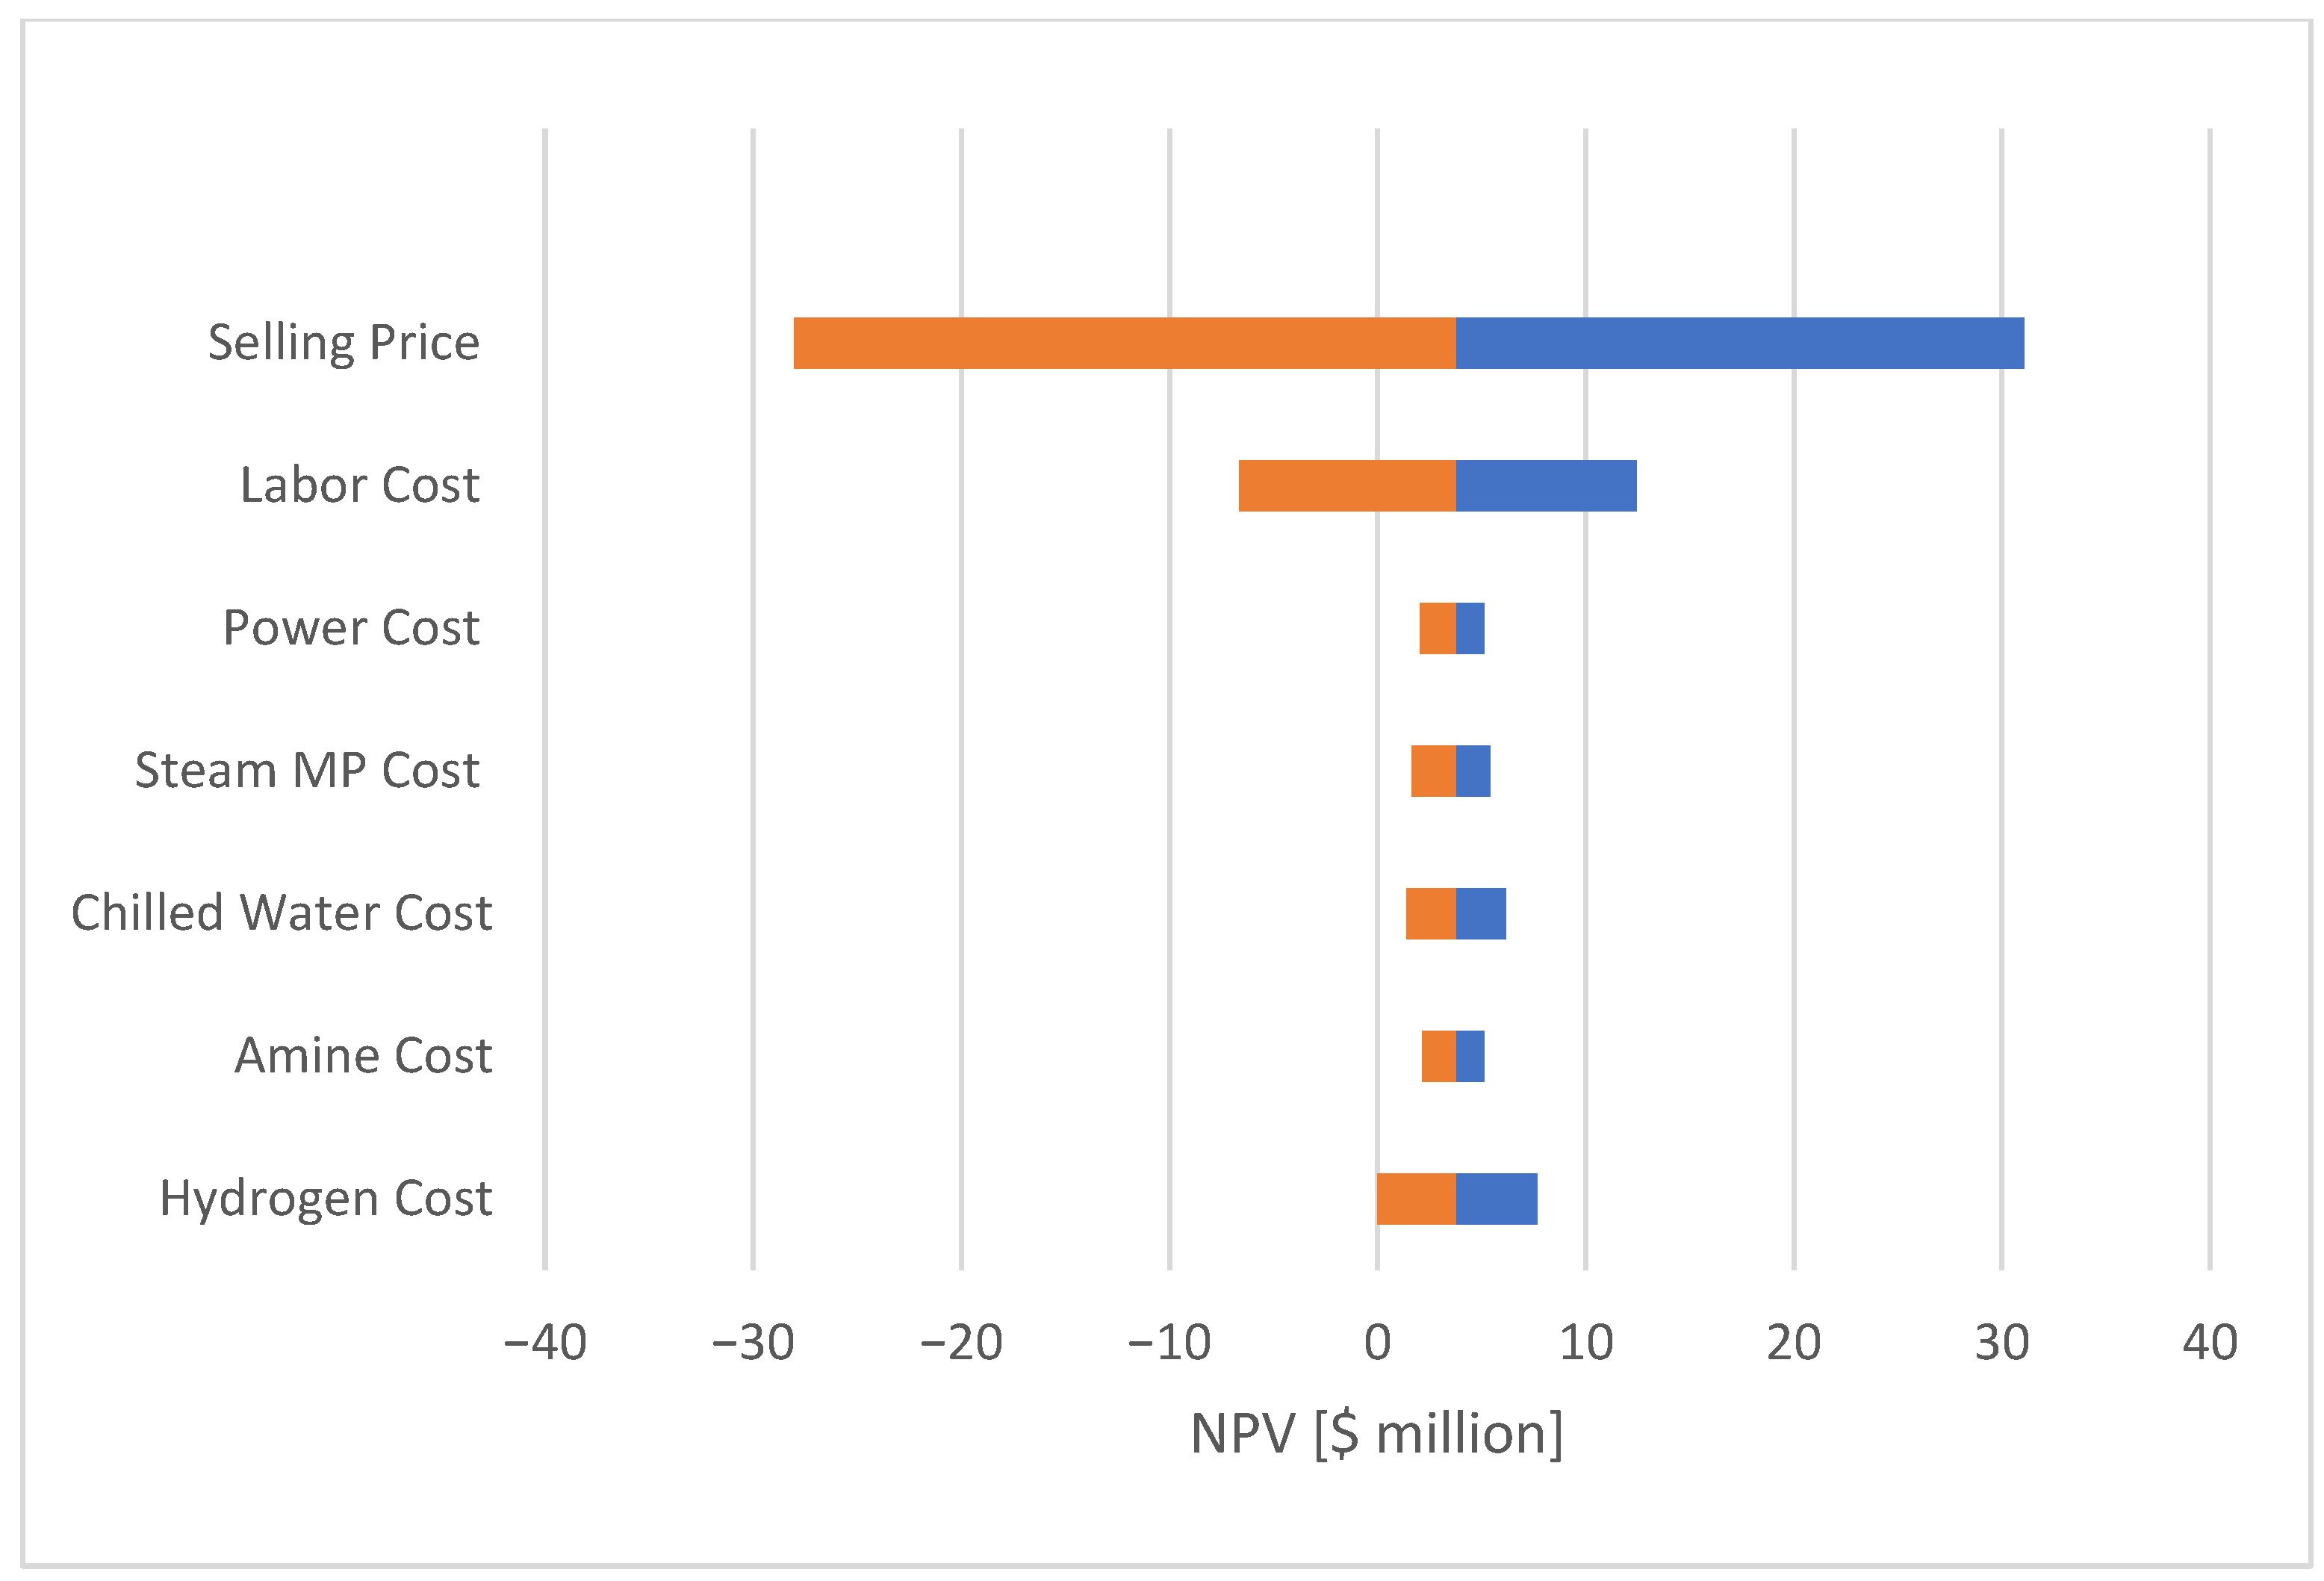
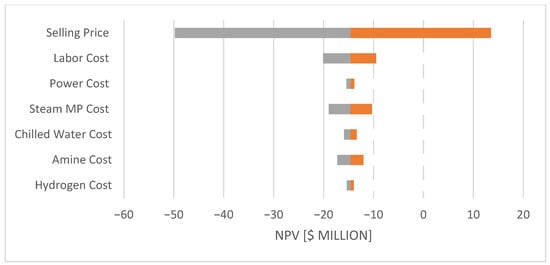
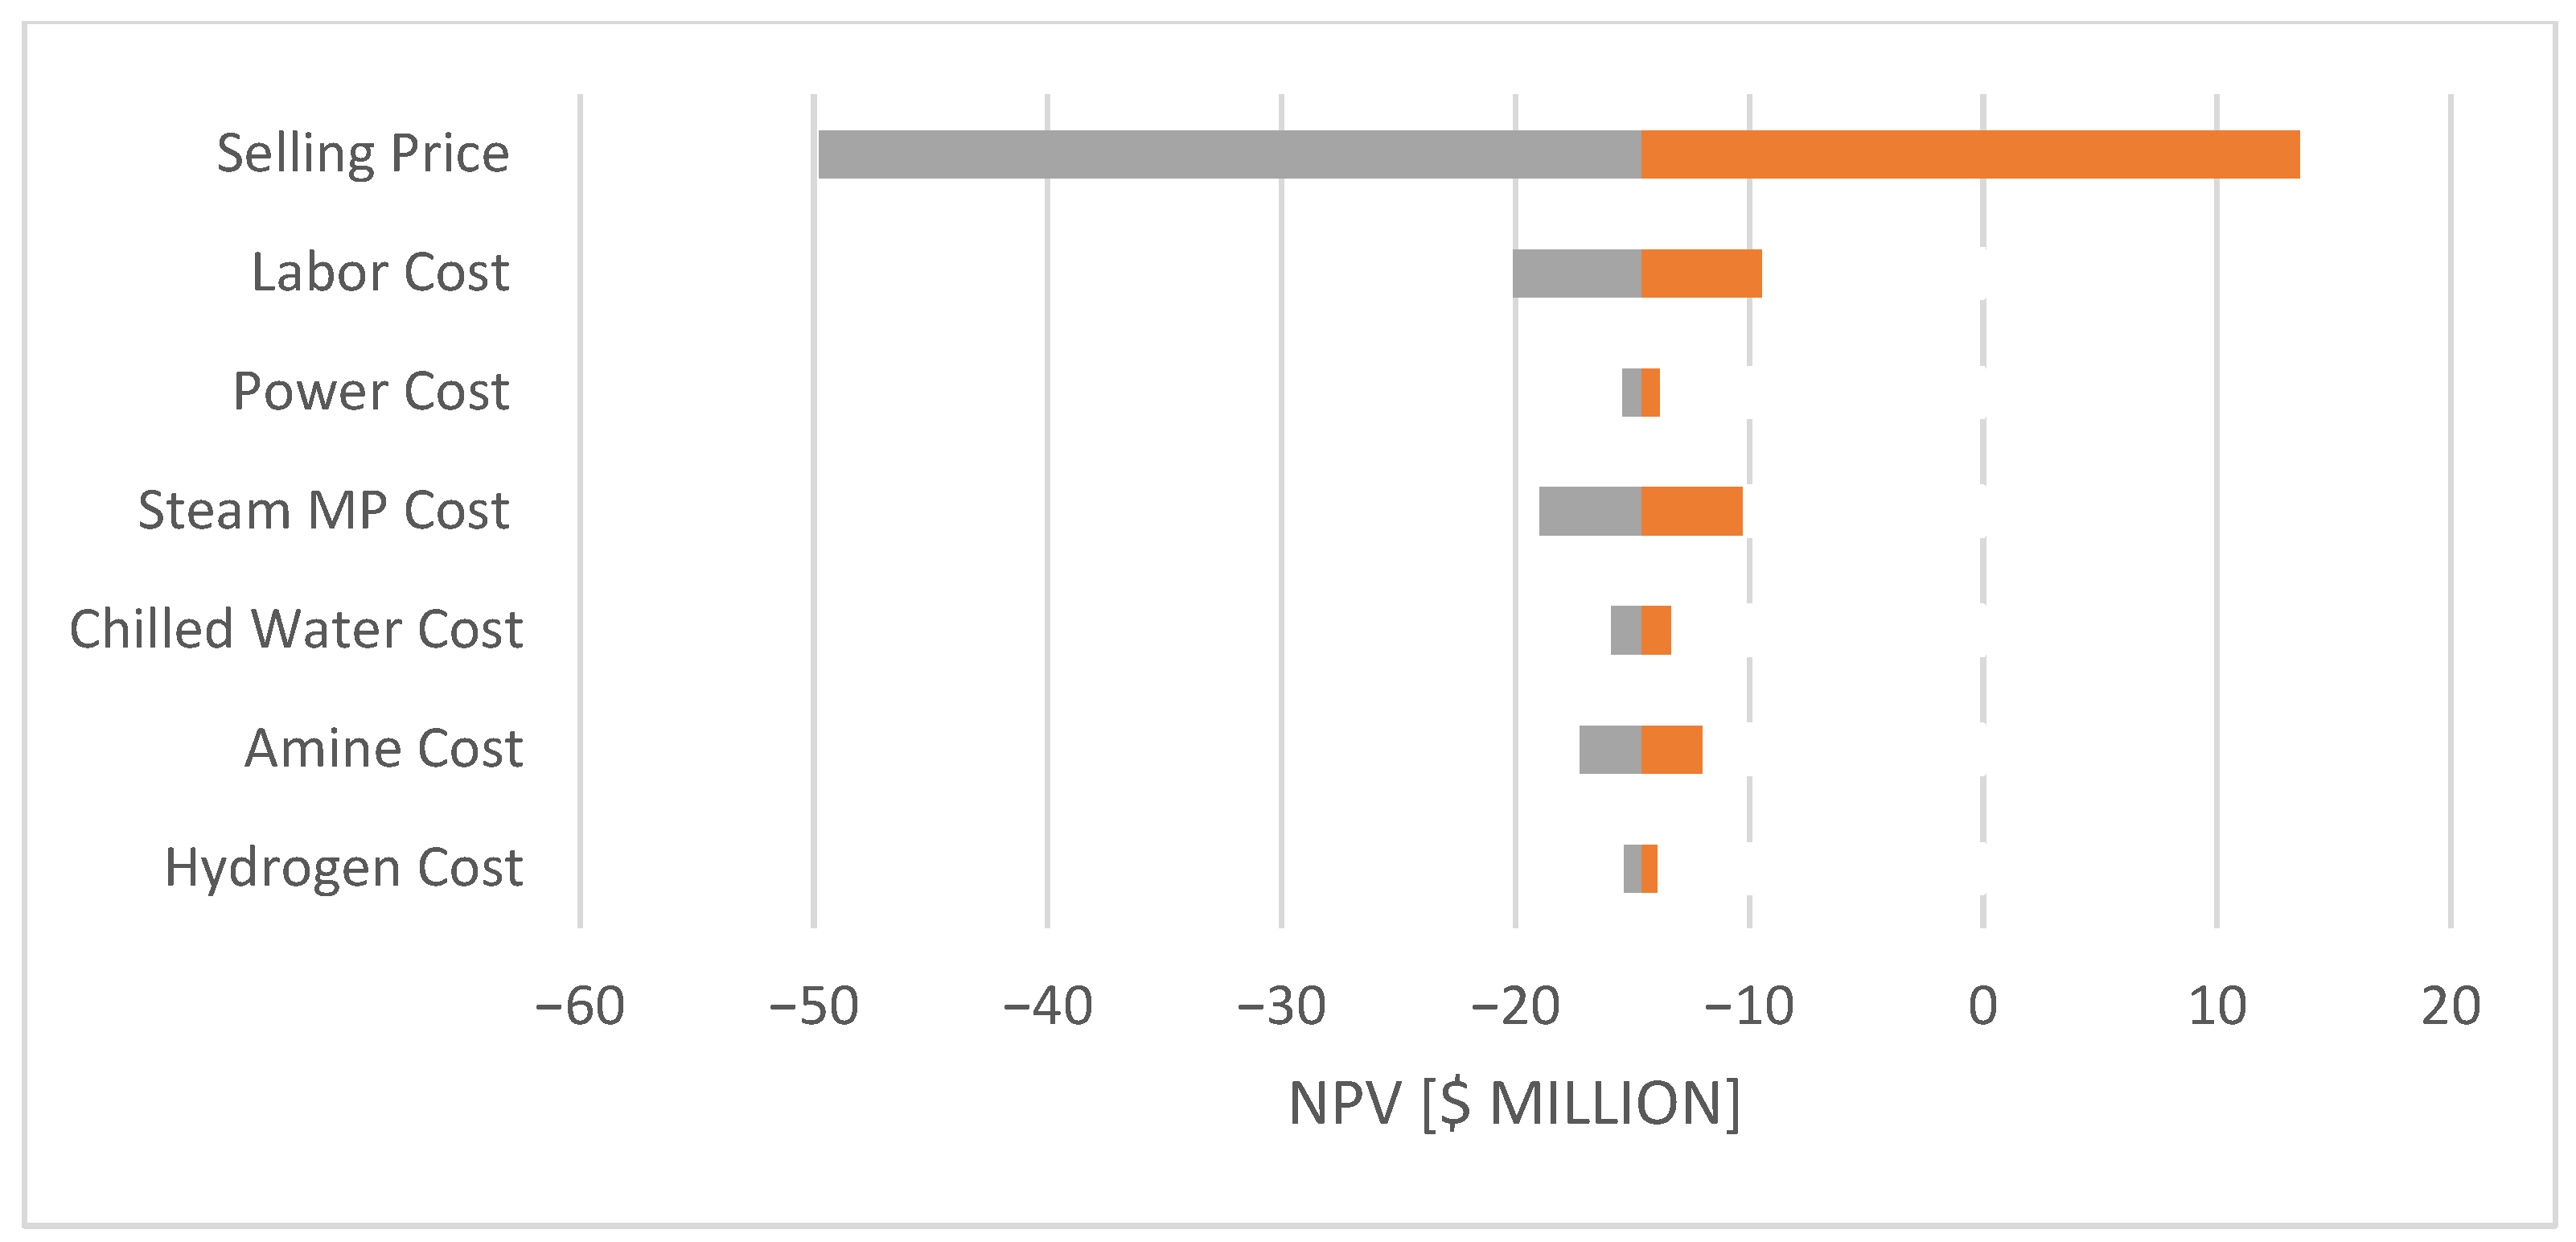
A sensitivity analysis was conducted using Tornado diagrams (Figure 13 and Figure 14 to identify the parameters with the greatest impact on the Net Present Value (NPV). The results of the two case studies highlight the main economic drivers and risks.
Figure 13.
Tornado Diagram of NPV Sensitivity to Economic and Operational Parameters. Case Study A.
Figure 14.
Tornado Diagram of NPV Sensitivity to Economic and Operational Parameters. Case Study B.
The analysis reveals that the product’s selling price is by far the most important factor. The wide range shown in the diagrams indicates that even small changes in the price can cause significant positive or negative shifts in the NPV. Therefore, the project’s financial success depends heavily on market conditions and securing favorable long-term sales agreements.
Τhe sensitivity analysis for Case Study A (Figure 13) demonstrates that the selling price of formic acid exerts the most significant influence on the net present value (NPV), confirming its dominant role in determining process profitability. Among the operating parameters, labor cost represents the next most critical factor, followed by hydrogen cost, reflecting its importance as a primary feedstock. In contrast, variations in power, medium-pressure steam, chilled water, and amine costs produce comparatively minor effects. Overall, the results highlight that the economic performance of the process is primarily governed by market conditions and major operating costs, whereas secondary utilities exert a limited impact on profitability.
The sensitivity analysis for Case Study B (Figure 14) confirms that the selling price remains the most influential factor on the net present value (NPV), followed by labor cost, while the effects of power, steam, chilled water, amine, and hydrogen costs are comparatively minor. These results confirm that the process profitability is mainly dictated by product market value and major operating expenses.
In conclusion, the sensitivity analysis provides a clear and practical framework for guiding both risk management and operational strategy. It shows where management should focus its efforts and resources to have the greatest financial impact, ensuring that decisions are based on the most important factors for the project’s long-term success.
4. Conclusions
This study presented a comparative techno-economic assessment of two alternative processes for the production of formic acid from carbon dioxide. The key differentiation lies in the choice of amine, which directly influences both the primary reaction and the downstream separation stages. The overall flowsheet-based analysis was performed using SuperPro DesignerTM, enabling the development of detailed mass and energy balances as well as the estimation of operating and capital expenditures.
The proposed methodology included flowsheet design and optimization, parametric evaluation of critical variables, and the calculation of major financial indicators (NPV, IRR, ROI). Complementary sensitivity and break-even analyses were conducted to assess the resilience of each process under fluctuations in feedstock, energy, and product prices.
The results demonstrate that Case Study A achieves high product purity with reduced energy demand. From the economic point of view, it requires a total capital investment of $26.74 million and delivers a unit production cost of $1.18/kg, with a positive Net Present Value (NPV) of $3.79 million, an Internal Rate of Return (IRR) of 9.16%, and a Return on Investment (ROI) of 16.75%. Importantly, the sensitivity analysis shows that the results are consistent overall, though not fully robust under adverse conditions.
Conversely, Case Study B incorporates an amine-exchange stage, which increases process complexity, energy requirements, and the number of operational units. This leads to a significantly higher capital cost of $49.99 million and an unfavorable economic profile, with a negative NPV of –$14.77 million, an IRR of only 1.77%, and an ROI of 10.32%. The break-even analysis further showed that product prices above $1.61/kg would be required for economic viability, undermining competitiveness under current market conditions.
Overall, the comparative evaluation study indicates the clear technical and economic superiority of Case Study A, mainly attributed to its lower energy consumption. In contrast, Case Study B can only become viable under strict conditions, such as the implementation of cost-optimization strategies and significant improvements in energy consumption efficiency.
Future research should focus on strengthening technical credibility and industrial relevance of the proposed approach. Priority should also be given to experimental or pilot-scale validation of the simulation results, allowing for a more accurate comparison between model predictions and real operating data.
Supplementary Materials
The following supporting information can be downloaded at: https://www.mdpi.com/article/10.3390/pr13113626/s1.
Author Contributions
Conceptualization, N.M.; Methodology, V.T., V.P. and M.C.G.; Software, N.M. and D.P.; Validation, V.T., V.P., D.P. and M.C.G.; Formal analysis, V.T., N.M. and M.C.G.; Investigation, V.T.; Writing—review & editing, N.M., D.P. and M.C.G. All authors have read and agreed to the published version of the manuscript.
Funding
This research received no external funding.
Data Availability Statement
The original contributions presented in this study are included in the article/Supplementary Material. Further inquiries can be directed to the corresponding authors.
Conflicts of Interest
Author Nikiforos Misailidis, Vassilis Parisis and Demetri Petrides were employed by the company Intelligen Inc. The remaining authors declare that the research was conducted in the absence of any commercial or financial relationships that could be construed as a potential conflict of interest.
References
- Alok, A.; Shrestha, R.; Ban, S.; Devkota, S.; Uprety, B.; Joshi, R. Technological advances in the transformative utilization of CO2 to value-added products. J. Environ. Chem. Eng. 2022, 10, 106922. [Google Scholar] [CrossRef] [Scilit]
- Rafiee, A.; Khalilpour, K.R.; Milani, D.; Panahi, M. Trends in CO2 conversion and utilization: A review from process systems perspective. J. Environ. Chem. Eng. 2018, 6, 5771–5794. [Google Scholar] [CrossRef] [Scilit]
- Thiedemann, T.M.; Wark, M. A Compact Review of Current Technologies for Carbon Capture as Well as Storing and Utilizing the Captured CO2. Processes 2025, 13, 283. [Google Scholar] [CrossRef] [Scilit]
- Zhu, Q. Developments on CO2-utilization technologies. Clean. Energy 2019, 3, 85–100. [Google Scholar] [CrossRef] [Scilit]
- Bazzanella, A.; Kromer, D. (Eds.) Technologies for Sustainability and Climate Protection—Chemical Processes and Use of CO2; DECHEMA Gesellschaft fόr Chemische Technik und Biotechnologie e.V.: Frankfurt/Main, Germany, 2017; p. 4. ISBN 978-3-89746-200-7. [Google Scholar]
- Vitillo, J.G.; Eisaman, M.D.; Aradσttir, E.S.P.; Passarini, F.; Wang, T.; Sheehan, S.W. The role of carbon capture, utilization, and storage for economic pathways that limit global warming to below 1.5 °C. iScience 2022, 25, 104237. [Google Scholar] [CrossRef] [Scilit] [PubMed] [PubMed Central]
- Formic Acid Market Size, Growth|Industry Reports To 2035. ChemAnalyst. Available online: https://www.chemanalyst.com/industry-report/formic-acid-market-688 (accessed on 19 June 2025).
- Formic Acid Market Size, Share, Trends 2024 to 2032. Precedence Research. Available online: https://www.zionmarketresearch.com/report/formic-acid-market (accessed on 19 June 2025).
- Bulushev, D.A.; Ross, J.R.H. Towards Sustainable Production of Formic Acid. ChemSusChem 2018, 11, 821–836. [Google Scholar] [CrossRef] [Scilit]
- Leonzio, G. Optimization through Response Surface Methodology of a Reactor Producing Methanol by the Hydrogenation of Carbon Dioxide. Processes 2017, 5, 62. [Google Scholar] [CrossRef] [Scilit]
- Song, C.; Shangguan, M. Method for Producing Methanol and Dimethyl Ether from Carbon Dioxide. U.S. Patent 8,791,297, 29, 8 August 1989. [Google Scholar]
- Saravanan, A.; Kumar, P.S.; Vo, D.-V.N.; Jeevanantham, S.; Bhuvaneswari, V.; Narayanan, V.A.; Yaashikaa, P.; Swetha, S.; Reshma, B. A comprehensive review on different approaches for CO2 utilization and conversion pathways. Chem. Eng. Sci. 2021, 236, 116515. [Google Scholar] [CrossRef] [Scilit]
- Zhang, N.; Li, Z.; Zheng, X.; Liu, P. How Would Structural Change in Electricity and Hydrogen End Use Impact Low-Carbon Transition of an Energy System? A Case Study of China. Processes 2024, 12, 437. [Google Scholar] [CrossRef] [Scilit]
- Kushwaha, S.; Parthiban, J.; Singh, S.K. Recent Developments in Reversible CO2 Hydrogenation and Formic Acid Dehydrogenation over Molecular Catalysts. ACS Omega 2023, 8, 38773–38793. [Google Scholar] [CrossRef] [Scilit]
- D’Ambra, F.; Gebel, G. Literature review: State-of-the Art of the Hydrogen storage tech-nologies and Liquid Organic Hydrogen Carrier (LOHC) development. Sci. Technol. Energy Transit. 2023, 78, 1–60. [Google Scholar] [CrossRef] [Scilit]
- Sordakis, A.; Tang, C.; Vogt, L.K.; Junge, H.; Dyson, P.J.; Beller, M.; Laurenczy, G. Homogeneous catalysis for sustainable hydrogen storage in formic acid and alcohols. Chem. Soc. Rev. 2018, 47, 744–762. [Google Scholar] [CrossRef] [Scilit]
- Gorbunov, D.N.; Nenasheva, M.V.; Terenina, M.V.; Kardasheva, Y.S.; Kardashev, S.V.; Naranov, E.R.; Bugaev, A.L.; Soldatov, A.V.; Maximov, A.L.; Karakhanov, E.A. Transformations of Carbon Dioxide under Homogeneous Catalysis Conditions (A Review). Pet. Chem. 2022, 62, 1–39. [Google Scholar] [CrossRef] [Scilit]
- Song, C. CO2 Conversion and Utilization: An Overview. In CO2 Conversion and Utilization; 809, ACS Symposium Series; ACS Publications: Washington, DC, USA, 2002; pp. 2–30. [Google Scholar] [CrossRef] [Scilit]
- Bae, J.; Park, K.; Usosky, D.; Jung, K.-D.; Lee, U.; Kim, C. Protocol to operate a large-scale CO2 hydrogenation process for formic acid production. STAR Protoc. 2024, 5, 103093. [Google Scholar] [CrossRef] [Scilit]
- Kim, C.; Park, K.; Lee, H.; Im, J.; Usosky, D.; Tak, K.; Park, D.; Chung, W.; Han, D.; Yoon, J.; et al. Accelerating the net-zero economy with CO2-hydrogenated formic acid production: Process development and pilot plant demonstration. Joule 2024, 8, 693–713. [Google Scholar] [CrossRef] [Scilit]
- Moret, S.; Dyson, P.J.; Laurenczy, G. Direct synthesis of formic acid from carbon dioxide by hydrogenation in acidic media. Nat. Commun. 2014, 5, 4017. [Google Scholar] [CrossRef] [Scilit]
- Solakidou, M.; Gemenetzi, A.; Koutsikou, G.; Theodorakopoulos, M.; Deligiannakis, Y.; Louloudi, M. Cost Efficiency Analysis of H2 Production from Formic Acid by Molecular Catalysts. Energies 2023, 16, 1723. [Google Scholar] [CrossRef] [Scilit]
- Dutta, I.; Chatterjee, S.; Cheng, H.; Parsapur, R.K.; Liu, Z.; Li, Z.; Ye, E.; Kawanami, H.; Low, J.S.C.; Lai, Z.; et al. Formic Acid to Power towards Low-Carbon Economy. Adv. Energy Mater. 2022, 12, 2103799. [Google Scholar] [CrossRef] [Scilit]
- Kim, D.; Han, J. Comprehensive analysis of two catalytic processes to produce formic acid from carbon dioxide. Appl. Energy 2020, 264, 114711. [Google Scholar] [CrossRef] [Scilit]
- Linde GmbH. Safety Advice 01—Carbon Dioxide. Linde Gas. 2017. Available online: https://www.linde-gas.com (accessed on 22 June 2025).
- Zhang, C.; Jun, K.-W.; Gao, R.; Lee, Y.-J.; Kang, S.C. Efficient utilization of carbon dioxide in gas-to-liquids process: Process simulation and techno-economic analysis. Fuel 2015, 157, 285–291. [Google Scholar] [CrossRef] [Scilit]
- Vogels, L.A.A. Optimization of the CO2 Hydrogenation Process Towards Formic Acid. Master’s Thesis, Eindhoven University of Technology, Eindhoven, The Netherlands, 2022. [Google Scholar]
- De Leeuw den Bouter, A.W.; Meijer, L.M.P.; Brito, L.; Miquelot, A.; Olivier, P.J. Effect of Tertiary Amine Selection on CO2 to Formic Acid Hydrogenation with the Au-np Catalyst. Ind. Eng. Chem. Res. 2025, 64, 8109–8118. [Google Scholar] [CrossRef] [Scilit]
- Aranda-Barradas, J.S.; Guerrero-Barajas, C.; Ordaz, A. Addressing Challenges in Large-Scale Bioprocess Simulations: A Circular Economy Approach Using SuperPro Designer. Processes 2025, 13, 2259. [Google Scholar] [CrossRef] [Scilit]
- Pérez-Fortes, M.; Schöneberger, J.C.; Boulamanti, A.; Harrison, G.; Tzimas, E. Formic acid synthesis using CO2 as raw material: Techno-economic and environmental evaluation and market potential. Int. J. Hydrogen Energy 2016, 41, 16444–16462. [Google Scholar] [CrossRef] [Scilit]
- Alcantara, M.L.; Pacheco, K.A.; Bresciani, A.E.; Alves, R.M.B. Thermodynamic Analysis of Carbon Dioxide Conversion Reactions. Case Studies: Formic Acid and Acetic Acid Synthesis. Ind. Eng. Chem. Res. 2021, 60, 9246–9258. [Google Scholar] [CrossRef] [Scilit]
- Zhang, Y.; Jia, Z.; Yuan, Z.; Yang, T.; Qi, Y.; Zhao, D. Development and Application of Hydrogen Storage. J. Iron Steel Res. Int. 2015, 22, 757–770. [Google Scholar] [CrossRef] [Scilit]
- Bacquart, T.; Morris, A.S.O.; Hookham, M.; Ward, M.K.M.; Underwood, R.; Hristova, Y.; Perkins, M.; Ferracci, V.; Murugan, A. Formic Acid in Hydrogen: Is It Stable in a Gas Container? Processes 2023, 11, 1748. [Google Scholar] [CrossRef] [Scilit]
- Schaub, T.; Pazicky, M.; Fries, D.M.; Paciello, R.; Meier, A. Process for Preparing Formic Acid by Reaction of Carbon Dioxide with Hydrogen. U.S. Patent 8,946,462 B2, 29 July 2014. [Google Scholar]
- Yaws, C.L. The Yaws Handbook of Vapor Pressure: Antoine Coefficients, 2nd ed.; Gulf Professional Publishing: Kidlington, Oxford, UK, 2015. [Google Scholar]
- Tischmeyer, M.; Arlt, W. Determination of binary vapor–liquid equilibria (VLE) of three fast reacting esterification systems. Chem. Eng. Process. Process Intensif. 2004, 43, 357–367. [Google Scholar] [CrossRef] [Scilit]
- Echemi.com. 2022. Available online: https://www.echemi.com/productsInformation/pd20150901218-formic-acid.html (accessed on 23 June 2025).
- Andrushkevich, T.V.; Popova, G.Y.; Danilevich, E.V.; Zolotarskii, I.A.; Nakrokhin, V.B.; Nikoro, T.A.; Stompel, S.I.; Parmon, V.N. A new gas-phase method for formic acid production: Tests on a pilot plant. Catal. Ind. 2014, 6, 17–24. [Google Scholar] [CrossRef] [Scilit]
- Usosky, D.; Aharkov, V.; Lee, K.R.; Jung, K.-D.; Lee, U. Vapor-liquid equilibria in the 1-methylpyrrolidine + 1-butylimidazole binary system: Experimental measurements and theoretical modelling. J. Ind. Eng. Chem. 2023, 126, 418–431. [Google Scholar] [CrossRef] [Scilit]
- Chun, K.W.; Drummond, J.C.; Davison, R.R. Vapor-liquid equilibrium of methyl-n-butylamine–water. J. Chem. Eng. Data 1973, 18, 169–173. [Google Scholar] [CrossRef] [Scilit]
- Schaub, T.; Paciello, R. A Process for the Synthesis of Formic Acid by CO2 Hydrogenation: Thermodynamic Aspects and the Role of CO. Angew. Chem. Int. Ed. 2011, 50, 7278–7282. [Google Scholar] [CrossRef] [Scilit]
- Marczak, W.; Varfolomeev, M.A.; Rakipov, I.T.; Lodowski, P.; Kowalska-Szojda, K.; Łężniak, M.; Almásy, L.; Len, A. Molecular Aggregation in Binary Mixtures of Pyrrolidine, N-Methylpyrrolidine, Piperidine, and N-Methylpiperidine with Water: Thermodynamic, SANS, and Theoretical Studies. J. Phys. Chem. B 2017, 121, 3070–3086. [Google Scholar] [CrossRef] [Scilit]
- Jogunola, O.; Salmi, T.; Leveneur, S.; Mikkola, J.-P. Complexation equilibria studies of alkyl formate hydrolysis in the presence of 1-butylimidazole. Thermochim. Acta 2017, 652, 62–68. [Google Scholar] [CrossRef] [Scilit]
- Park, K.; Gunasekar, G.H.; Kim, S.-H.; Park, H.; Kim, S.; Park, K.; Jung, K.-D.; Yoon, S. CO2 hydrogenation to formic acid over heterogenized ruthenium catalysts using a fixed bed reactor with separation units. Green Chem. 2020, 22, 1639–1649. [Google Scholar] [CrossRef] [Scilit]
- Park, K.; Park, H.; Yoon, H.; Lee, K.R.; Ahn, S.; Kim, C.; Lee, U.; Jung, K.-D.; Yoon, S. Recent progress in heterogeneous CO2 hydrogenation to formic acid towards practical application. Catal. Sci. Technol. 2024, 14, 5811–5832. [Google Scholar] [CrossRef] [Scilit]
- Liu, H.; Li, M.; Idem, R.; Tontiwachwuthikul, P.P.; Liang, Z. Analysis of solubility, absorption heat and kinetics of CO2 absorption into 1-(2-hydroxyethyl)pyrrolidine solvent. Chem. Eng. Sci. 2017, 162, 120–130. [Google Scholar] [CrossRef] [Scilit]




Disclaimer/Publisher’s Note: The statements, opinions and data contained in all publications are solely those of the individual author(s) and contributor(s) and not of MDPI and/or the editor(s). MDPI and/or the editor(s) disclaim responsibility for any injury to people or property resulting from any ideas, methods, instructions or products referred to in the content. |
© 2025 by the authors. Licensee MDPI, Basel, Switzerland. This article is an open access article distributed under the terms and conditions of the Creative Commons Attribution (CC BY) license (https://creativecommons.org/licenses/by/4.0/).