


Abstract
The performance of AI solutions in mammography is largely determined by data quality, preprocessing methods, and augmentation strategies. However, systematic evaluation of these factors for models trained on aggregated multicenter datasets remains underexplored. This article presents a comparative assessment of the effects of different stages of the training pipeline on the final diagnostic accuracy. Using a pooled dataset (VinDr-Mammo, INBreast, CMMD, CBIS-DDSM), we evaluated each pipeline step—from filtering to architecture selection (EfficientNet-B3, CLIP). External testing was conducted on the MosMed database. Among the tested preprocessing steps, filtering the darkest 5% of images proved most effective. For EfficientNet-B3, optimal geometric and photometric augmentations increased test AUROC on the prepared MosMed test set from 0.844 to 0.900. Domain-specific pretraining and high resolution yielded the best performance: Mammo-CLIP achieved an AUROC of 0.949 ± 0.012, and EfficientNet-B3 reached 0.934 ± 0.013. Overall, this study developed a standardized pipeline that includes sequential data filtering and harmonization, augmentation optimization, and architecture selection. This approach ensures reliable and reproducible results for automated mammogram classification.
1. Introduction
The implementation of artificial intelligence (AI) in medicine represents a qualitative shift in healthcare. Using machine learning and deep learning methods, AI systems can analyze large and complex datasets with speed and accuracy that often exceed human capabilities [1,2,3]. Medical imaging, and mammography in particular, is one of the fields in which AI has demonstrated substantial potential [1,2]. Early detection of breast cancer through mammographic screening substantially reduces mortality; however, the sensitivity and specificity of the method remain limited, especially in women with high breast tissue density, leading both to missed malignancies and to unnecessary patient recalls [4,5].
Deep learning models, particularly convolutional neural networks (CNNs), have demonstrated the ability to identify latent patterns indicative of malignancy, sometimes matching or even surpassing radiologists in performance [3,6,7]. When used in collaboration with radiologists, AI can further improve diagnostic accuracy, prioritize high-risk cases, objectively assess breast tissue density [3,8], and reduce workload, thereby improving clinical efficiency and patient outcomes [9].
Despite these achievements, several challenges remain. Model performance depends not only on architecture, but also on preprocessing and data augmentation strategies, including artifact removal, contrast normalization, and metadata harmonization [3,10,11,12,13,14,15]. Existing studies often rely on single datasets or inconsistent processing pipelines, which reduces reproducibility and model generalizability [16,17]. Moreover, systematic evaluation of modern architectures, including both CNNs and foundation vision-language models, in combination with carefully designed preprocessing and augmentation strategies on heterogeneous datasets remains underexplored. Robust performance across different data sources is especially important for real-world deployment.
Research questions (RQ):
RQ1.
How do different preprocessing and augmentation strategies affect mammogram classification performance when heterogeneous datasets are used?
RQ2.
To what extent do specialized, domain-specific pretrained models improve accuracy compared with general-purpose models, and how does input resolution influence this improvement?
RQ3.
Is it possible to create a unified reproducible pipeline that reliably integrates multiple open mammography datasets and supports scalable model evaluation?
In this work, we systematically evaluated mammography-specific augmentation strategies, including geometric and photometric transformations, to determine their effect on model performance. In parallel, we conducted a comparative analysis of modern CNN architectures and foundation vision-language models, assessing how pretraining (specialized versus general-purpose) and input resolution influence classification results. By integrating these stages into a unified pipeline, our approach enables controlled evaluation of preprocessing, augmentation, and architecture choices, demonstrating robustness both across heterogeneous datasets and in single-dataset settings.
The main contributions of our work can be summarized as follows:
- Development of a unified reproducible pipeline for mammogram classification;
- Systematic evaluation of the effects of preprocessing, augmentation, and model architecture on performance;
- Demonstration of the advantages of combining general-purpose models with specialized, domain-specific pretrained models;
- Establishing a practical foundation for building scalable and transparent clinical decision-support systems.
2. Related Work
Deep learning has substantially advanced the analysis of mammographic images by improving lesion detection, breast density assessment, and malignancy classification [3,4,18]. However, existing studies often differ in their preprocessing, augmentation, and validation protocols, making it difficult to reproduce or compare results.
2.1. Data Quality and Preprocessing
Data quality has a strong influence on model robustness. Mammography data are highly heterogeneous with respect to image quality, tissue density, artifacts, and annotation completeness. Unlike several other medical imaging tasks, such as chest CT, brain MRI, or digital pathology, where scanning formats and protocols are more standardized, mammography requires particularly careful filtering and preprocessing [19,20].
In practice, data are collected from multiple sources, including open datasets created for different purposes and using different annotation standards. Such datasets may contain dataset construction defects or image artifacts. If these issues are not addressed before training, convergence may deteriorate and model generalizability may decrease. Previous studies also emphasize the need for contrast normalization to reduce domain shift between imaging centers [21,22]. Thus, primary data cleaning and quality control are critical steps: removing duplicates and anomalous images, resolving metadata inconsistencies, and balancing key characteristics such as projection type, tissue density, and BI-RADS category.
Domain harmonization has been shown to yield noticeable improvements in generalizability, but it often depends on non-reproducible private datasets [17,23]. As a result, most medical-image preprocessing pipelines remain specific to particular datasets or research tasks and are insufficiently standardized.
2.2. Augmentation and Synthetic Data
In medicine, collecting a large, high-quality dataset is extremely difficult because of strict patient-privacy requirements and the high cost of expert annotation. Data augmentation is therefore an essential step that helps prevent neural networks from overfitting on small samples. Studies show that even basic transformations, such as rotations, flips, contrast shifts, and the addition of artificial noise, provide a stable improvement in accuracy [10]. More advanced methods, including attention-guided erasing and region-of-interest augmentation, further improve lesion localization and density assessment [24]. In parallel, synthetic data are playing an increasingly important role: generative models, such as GANs or diffusion networks, make it possible to create images with rare lesion types and thereby address the severe class-imbalance problem typical of medicine [25].
A major limitation of existing studies is the lack of standardization in preprocessing and augmentation pipelines. Despite the abundance of proposed methods, different approaches are rarely compared with one another on the same open data. Most studies use unique transformation sets, making their results practically irreproducible for other tasks or datasets. The literature shows a clear lack of systematic benchmarks with a unified preprocessing pipeline. Consequently, the choice of an optimal augmentation strategy in practice is often reduced to trial and error or the engineer’s intuition rather than being based on rigorous comparative metrics.
2.3. Model Architectures and Pretraining
Recent systematic reviews confirm that convolutional neural networks (CNNs) consistently outperform traditional machine learning approaches in mammography analysis, achieving detection accuracies between 89% and 99.31% on benchmark datasets such as MIAS, DDSM, and INbreast. This consistent performance advantage across 33 peer-reviewed studies from 2015 to 2025 has established CNN-based methodologies as the de facto industry standard for automated mammogram analysis [26,27]. In contemporary literature, architectures from the ResNet, DenseNet, and EfficientNet families dominate, adapted to the specific characteristics of high-resolution radiological data. EfficientNet-family architectures offer a balance between accuracy and efficiency, but they demonstrate high sensitivity to image preprocessing and resolution [28,29,30].
At the same time, modern advances in deep learning make it possible to expand the analyzed feature space by enriching visual information with semantic context. This direction is especially relevant in medical imaging and cancer diagnostics, including breast cancer, because accompanying data, such as clinical metadata and specialist reports, can substantially complement the objective picture of the examination. Domain-specific pretraining has demonstrated the potential to outperform ImageNet initialization, especially for small or heterogeneous datasets [30]. Foundation neural network architectures capable of supplementing visual images with textual context develop the idea of targeted model fine-tuning. Such a solution may involve attention mechanisms and multimodal paradigms, such as CLIP, which can generate more robust embeddings by aligning image and text representations to improve classifier generalizability [31]. These models are trained on large paired datasets and require substantial computational resources. At the same time, the additional contribution of this approach to expanding the analyzed context requires further study.
2.4. Gaps in Existing Research
Despite steady progress in the use of modern neural network architectures for mammographic image classification and segmentation, several research gaps remain:
- Most studies rely on single datasets, reducing the external validity of their results.
- Preprocessing, metadata standardization, and augmentation are tested in isolation, without controlled comparison across multiple datasets.
- There is no systematic benchmarking of different neural network architectures, including vision-language and foundation models as well as CNNs, under harmonized conditions.
Our study addresses these gaps by developing a unified, transparent pipeline that integrates multiple open mammography datasets, standardizes preprocessing, and systematically evaluates geometric and photometric augmentation strategies. At the final step of the pipeline, we compare conventional CNNs used in mammography with vision-language foundation models, both general-purpose and domain-specific, assessing their predictive ability on the prepared pooled dataset. This pipeline design enables a reproducible assessment of how data quality, augmentation, and pretraining jointly influence model performance, providing practical insights for the creation of scalable and clinically relevant AI systems in mammography.
3. Materials and Methods
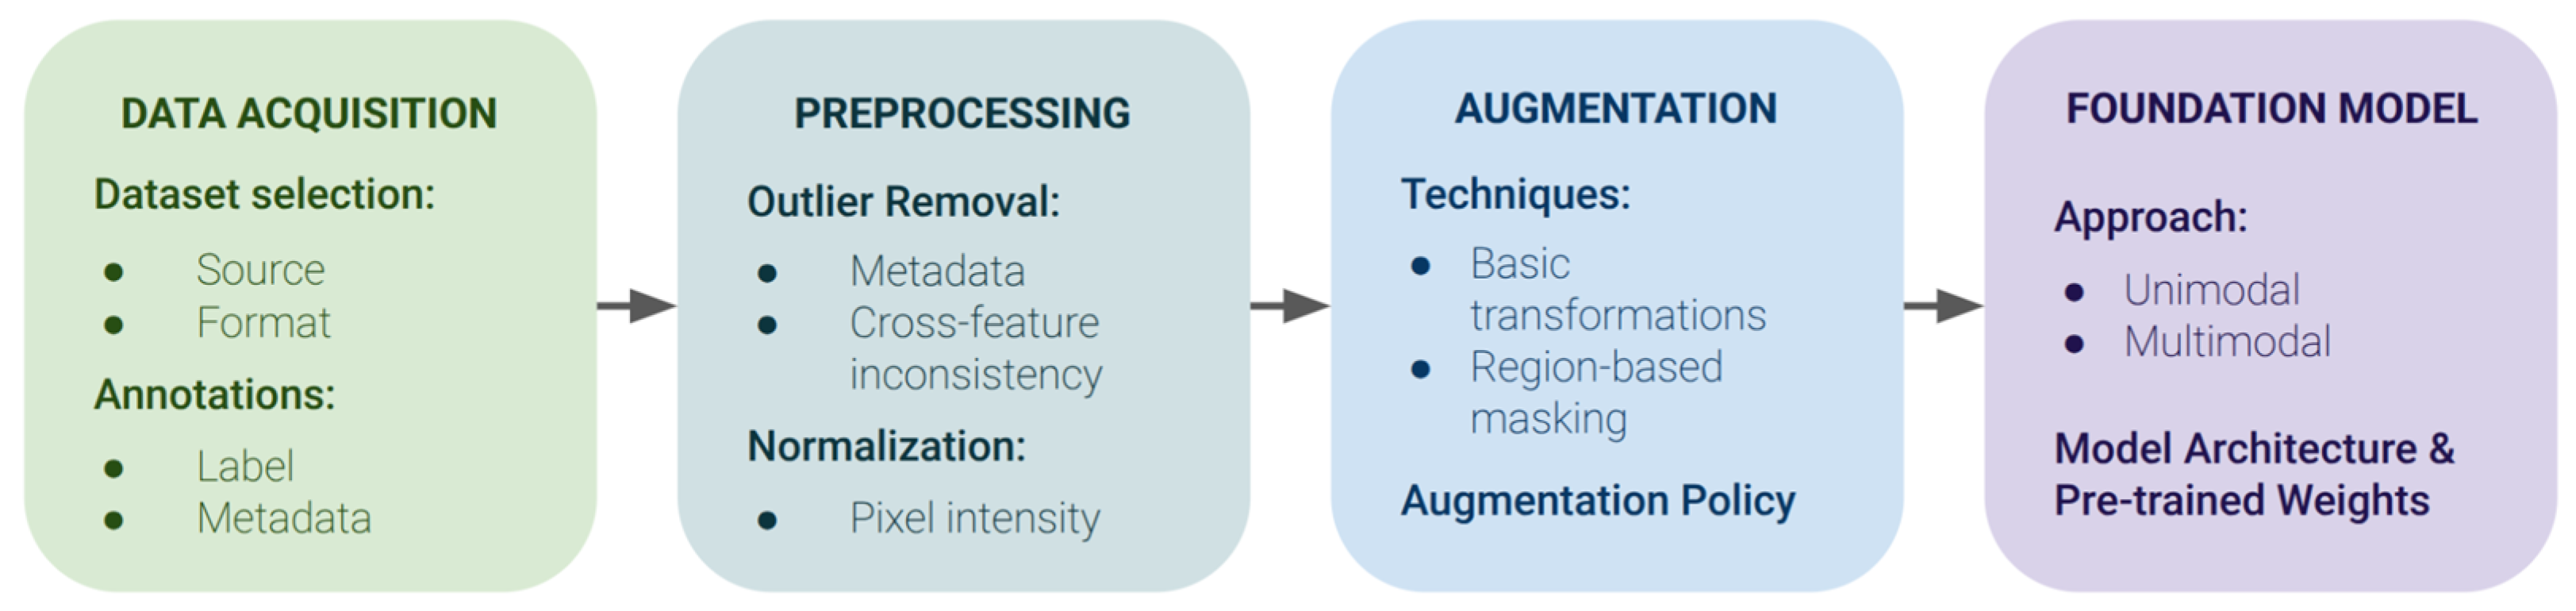
The main result of our work is a standardized and reproducible pipeline for developing an ML prediction model for mammography data; its schematic representation is shown in Figure 1. The pipeline integrates several publicly available mammography datasets and performs sequential filtering and metadata harmonization to ensure consistency across datasets. Throughout the rest of the paper, we sequentially guide the reader through all pipeline stages across the methodology, results, and discussion sections.
Figure 1.
Stages of the standardized pipeline for creating a reliable and reproducible mammogram image classifier. The steps include data creation and acquisition, sequential filtering and harmonization of selected datasets, investigation and selection of the optimal augmentation strategy, and definition of the baseline model architecture.
3.1. Description of Data Used for Pipeline Training and Testing
We used four widely adopted open datasets, VinDr-Mammo [32], INBreast [33], CMMD [34], and CBIS-DDSM [35], to create a unified training set (VICC). For external evaluation of the developed models, we used the MosMed dataset [36,37], which made it possible to avoid data leakage between the training and test samples. Each dataset provides DICOM mammographic images for each patient with class labels, either according to the BI-RADS classification or by direct indication of histologically verified cancer, and metadata such as side and view of the mammogram, tissue density, and patient age. For detailed dataset analysis, we extracted technical file parameters, including image size and equipment manufacturer. Analysis of the DICOM Manufacturer and Manufacturer’s Model Name tags showed that the pooled training set was acquired on several distinct platforms. VinDr-Mammo is multi-vendor, comprising Siemens (Mammomat Inspiration), Planmed (Nuance), and IMS/Giotto systems, whereas CMMD was acquired on GE Senographe systems. For INBreast and CBIS-DDSM the manufacturer field is not populated; CBIS-DDSM in particular consists of digitized film-screen mammograms whose headers do not identify a full-field digital detector. The external MosMed test set was acquired on Fujifilm equipment. Notably, none of the pooled datasets contain images acquired on Hologic systems, despite Hologic being one of the most widely deployed mammography platforms in clinical practice.
The binary target variable was the presence or absence of malignant lesions. Where BI-RADS labels were available, BI-RADS categories 1–2 were assigned to the “no cancer” class, whereas BI-RADS categories 5–6 were assigned to the “malignant lesions (cancer)” class; BI-RADS categories 3–4 were excluded because of high label uncertainty. If benign/malignant labels were provided explicitly, we used them directly. A brief summary of the datasets and their respective class-mapping schemes is presented in Table 1. Short descriptions of the datasets and class-mapping schemes are provided below:
Table 1.
Comparative characteristics of the datasets used in the study. The table reflects variability in size, cancer prevalence, BI-RADS distribution, and breast density. “Pathology-based labels” indicates the presence of biopsy-confirmed malignancy labels where available. The table shows the numerical dominance of the VinDr dataset and the small size of INBreast. The MosMed dataset contains 779 images, which is sufficient for high-quality testing of the developed models.
- VinDr-Mammo is one of the largest and most recent datasets and was one of the key sources in this work. Class mapping in this dataset was based on the BI-RADS category.
- INBreast is a high-quality dataset. Class mapping in this dataset was based on the BI-RADS category.
- CMMD (Chinese Mammography Database), published in 2021, provides DICOM data and includes biopsy-confirmed binary cancer labels.
- CBIS-DDSM is a revised version of the classic DDSM dataset (Digital Database for Screening Mammography, 1999). The following class mapping was used: benign cases were mapped from NO_OBJECT, BENIGN_WITHOUT_CALLBACK, and BENIGN, and malignant cases were mapped from MALIGNANT.
- MosMed contains mammograms collected from 2018 to 2020. This dataset originally included a patient-level binary division into benign and malignant cases. During testing on MosMed, image-level predictions were aggregated to the patient level using max pooling across view and side.
The final sample sizes after filtering, together with the exact distribution of images across the training, validation, and test sets, are reported in Section 4.2, where the anomaly-filtering stage is described.
3.2. Preprocessing and Cleaning of Anomalous Data
An important mandatory preprocessing stage was the analysis of image pixel intensities in the datasets and the exclusion of anomalous DICOM files based on parameters from the textual descriptions of the datasets and file metadata. To identify possible anomalies, we analyzed pixel-intensity distributions for images in each dataset, dataset and metadata parameters (sample size, finding and BI-RADS categories, and density according to the American College of Radiology (ACR) [38]), and the correspondence between the reported metadata and parameters extracted from DICOM files, which was assessed using contingency tables.
Preprocessing of mammographic images included bringing the Photometric Interpretation metadata to the unified MONOCHROME2 standard. This entails programmatically inverting pixels, converting black to white, for images in MONOCHROME1 format, thereby ensuring visual consistency across the entire dataset: the background always remains zero (black), while dense radiopaque tissues appear bright.
Metadata-based anomaly filtering excluded images with inconsistencies between the original label and BI-RADS category, invalid tissue-density values, or an indeterminate BI-RADS = 0 category. Such anomalies were found only in the CBIS-DDSM dataset; the per-category breakdown and resulting dataset sizes are reported in Section 4.2.
After photometric correction, a standard feature-preparation pipeline for deep learning was applied: conversion of image arrays into tensor format (ToTensor) followed by mathematical intensity normalization. Normalization parameters were calculated for the pooled training group consisting of the four selected datasets.
To determine the effect of different preprocessing and anomaly-detection approaches, we used the baseline EfficientNet-B3 model (described in Section 3.4), fine-tuned on the prepared pooled VICC training set and validated on the VICC test set. Testing on the MosMed test set was not performed at this stage, which helped avoid excessive data leakage and tuning of preprocessing to the test data.
3.3. Selection of the Optimal Augmentation Set
To improve model robustness and compensate for the limited volume of training data, we systematically evaluated augmentation methods applicable to mammography. Augmentations were implemented using the Albumentations library (version 2.0.8) [39,40]. The tested transformations were divided into four functional groups:
Spatial and geometric transformations: Random flips (Horizontal/Vertical Flip), rotations by right angles (Random Rotate 90), affine transformations with independent axes (Affine Independent Axes), and nonlinear distortions (Optical Distortion, Grid Distortion).
Pixel distortions and photometric correction: Contrast-limited adaptive histogram equalization (CLAHE), random changes in brightness, contrast, and gamma (Random Brightness Contrast, Random Gamma), modification of tone curves (Random Tone Curve), and shifts in color space (Hue Saturation Value).
Filtering and noise: Additive white noise (Gauss Noise), sharpening algorithms (Sharpen), and advanced blurring (Advanced Blur).
Spatial regularization methods (occlusion): Various strategies for masking and information removal, including dropout of individual pixels (Pixel Dropout), large rectangular regions (Coarse Dropout), grid masking (Grid Dropout), and arbitrary mask overlay (Mask).
The effectiveness of each method was assessed against a control sample without distortions (Baseline), both separately and in various combinations that included transformations compatible with mammography and that did not distort key diagnostic features. Reproducibility was assessed through several independent runs under identical conditions: the baseline EfficientNet-B3 model (Section 3.4) was fine-tuned for 30 epochs with constant hyperparameters on the prepared pooled VICC dataset. Validation was performed on the pooled validation sample, and the best epoch was selected according to AUROC (area under the receiver operating characteristic curve). Testing was performed on the independent MosMed dataset.
3.4. Investigated Vision-Language Models
One goal of our study was to determine the effect of domain-specific fine-tuning compared with initialization from baseline weights, as well as to expand classifier generalizability using vision-language model (VLM) architectures; for example, CLIP (Contrastive Language-Image Pre-Training) models. As a standard efficient CNN solution, we selected the convolutional neural network EfficientNet-B3 [41], pretrained on ImageNet. EfficientNet-B3 served as the baseline for determining the benefits of using semantic information during neural network training. The following models were selected for benchmarking CLIP-based solutions:
- OpenAI CLIP [42] is an initial vision-language model trained on 400 million image–text pairs. It is not specialized for any particular domain and is widely used across fields. Its visual encoder used the Vision Transformer architecture ViT-L/14. The input image resolution was limited to 336 × 336 px.
- Microsoft BiomedCLIP [43] is an adapted CLIP version with an enlarged Vision Transformer compared with the baseline version. It was trained on more than 4 million biomedical images and accompanying texts extracted from the PubMed Central Open Access Subset. ViT-B/16 [44] was used as the image encoder. The input image resolution was limited to 224 × 224 px.
- Mammo-CLIP [31] is a specialized CLIP version. Mammo-CLIP uses EfficientNet(EN)-B5 with ImageNet-pretrained weights as the image encoder. The Mammo-CLIP model was trained on more than 25,000 screening mammography images with textual descriptions of domain parameters, including BI-RADS annotations and imaging patterns. The input image resolution was 1520 × 912 px.
- MedCLIP [45] is an adapted CLIP version for medical data, trained on 20K unpaired images and texts from various medical domains. A Swin Transformer with ImageNet-pretrained weights was used as the backbone vision encoder [46]. The input image resolution was limited to 512 × 512 px.
The architecture of CLIP-family models is based on the joint use of visual and text encoders whose weights are optimized during contrastive pretraining to align multimodal representations in a shared latent space. To solve our mammogram classification task, we applied a transfer-adaptation approach (domain adaptation): the visual encoder of each model was used as the base feature extractor. A specialized classification layer, a fully connected head implemented as a three-layer multilayer perceptron (MLP), was integrated on top of the resulting embeddings.
Both the CNN baseline (EfficientNet) and the CLIP-based models were trained with the AdamW optimizer (β1 = 0.9, β2 = 0.999) and a focal loss (α = 0.5, γ = 2.0), with a weight decay of 0.01 and a StepLR schedule (γ = 0.5), with class imbalance addressed by a WeightedRandomSampler performing oversampling stratified jointly by dataset and class label. The best checkpoint was selected by validation AUROC on the pooled VICC set. The two model families differed in the remaining settings: the EfficientNet baseline used a learning rate of 1 × 10⁻⁴, a batch size of 14, and up to 100 training epochs. The CLIP-based models were fully fine-tuned (visual encoder unfrozen) with a learning rate of 5 × 10⁻⁵, a batch size of 20, 336 × 336 inputs, and 30 training epochs. This choice of unfreezing the visual encoder with a small learning rate was motivated by the high specificity of our domain: models trained on the broad ImageNet dataset, or even on large-scale medical imaging data, did not achieve sufficient accuracy in a domain as specific as grayscale mammographic images.
Final fine-tuning of all investigated architectures was performed on the dataset comprising four independent datasets. Fine-tuning was performed only after the developed preprocessing pipeline, anomaly filtering (outlier removal), and the optimal augmentation strategy described above had been applied.
3.5. Software and Statistical Processing Methods
Medical images in DICOM format were processed using the Python 3.10.12 programming language. Reading, loading, and parsing of study metadata were performed with the pydicom software library (v3.0.2). Pixel intensities were normalized to the [0, 1] range, after which the data were converted to a unified tensor format using the PyTorch (v2.13.0) library.
The primary quality metric for evaluating results was AUROC. The ROC curve shows the true positive rate (TPR) as a function of the false positive rate (FPR) when the classification threshold changes.
AUROC is defined as the area under this curve:
This value represents the probability that the classifier assigns a higher score to a randomly selected positive sample than to a randomly selected negative sample.
To assess the statistical significance and reliability of the obtained quality metrics, four independent training runs were performed for each model. To ensure experimental reproducibility and fair benchmarking, we used a fixed stratified split into training, validation, and test sets, identical for all models. In doing so, images belonging to the same patient but differing in view or side were assigned to a single group, which prevented scans from the same patient from appearing simultaneously in the training and test sets. Across the four runs, all hyperparameters, model architectures, and data splits were kept identical; the only source of variation was the random seed, which controlled weight initialization, data shuffling order, and augmentation stochasticity. This design isolates training variance from split variance, so that the reported mean ± standard error of mean reflects the run-to-run variability of the training process under otherwise identical conditions. Final metrics were calculated as the mean and standard error of the mean for the AUROC achieved at the best epoch. AUROC values for all models are reported to three decimal places, which is determined by the size of the test set and the maximum statistical significance attainable at this sample size.
4. Results
4.1. Pooled Dataset
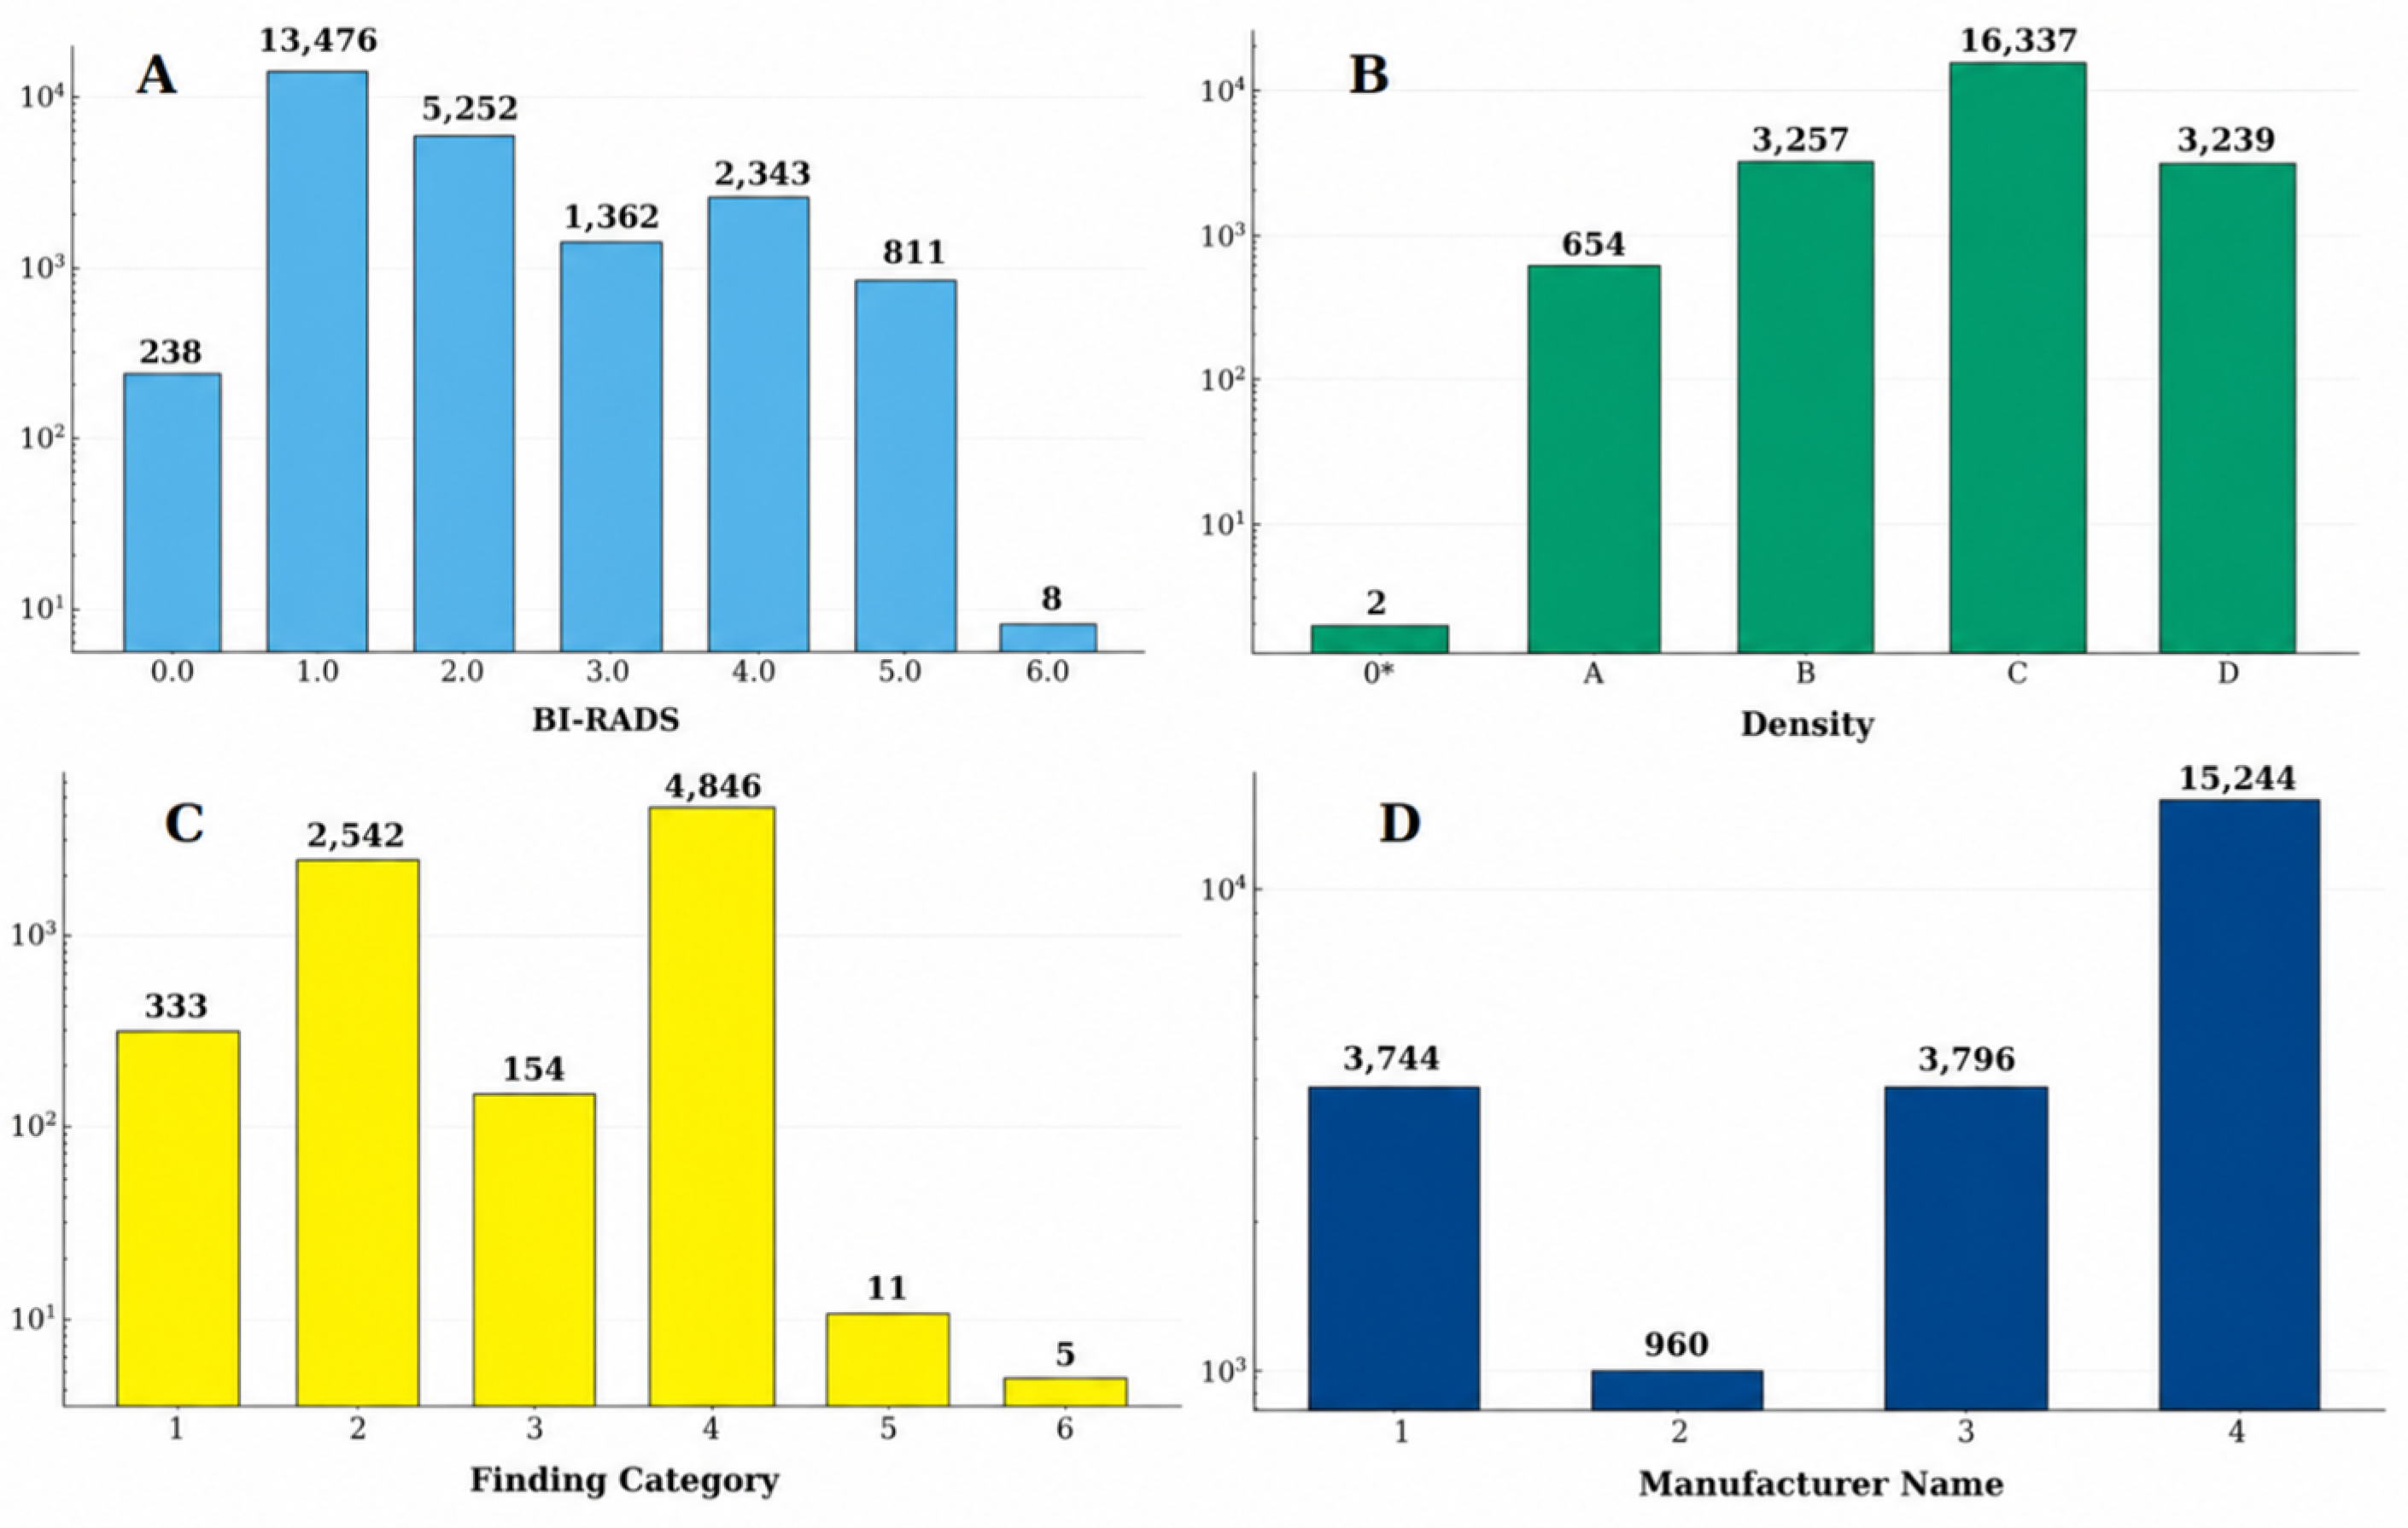
The results of the exploratory analysis of the pooled dataset (VICC) are summarized in Table 1 and Figure 2. The INBreast dataset is substantially smaller, but it provides high-quality and precise annotations; its inclusion may therefore increase the robustness of the developed models. Among detected findings, calcifications predominate, followed by combined findings, asymmetries, and retractions. The distributions are imbalanced, with some categories occurring rarely. The distribution of BI-RADS categories is also uneven, and categories 0 and 6 are present but are excluded from the analysis as outliers. Regarding ACR density, category 3 is the most common, followed by categories 2 and 4; density 0 is considered an outlier and is therefore removed, as it rarely appears in the sources.
Figure 2.
Visualization of the pooled VICC dataset before preprocessing, demonstrating differences between datasets in finding categories, BI-RADS category distribution, breast density, and equipment used, as well as identifying imbalances and rare categories that may affect model training. (A) BI-RADS category distribution. (B) Breast density distribution, where category 0* comprises anomalous images for which density is labeled as 0.0. (C) Finding category distribution, where categories are encoded as follows: 1—asymmetry, 2—calcification, 3—calcification + mass, 4—mass, 5—nipple retraction, 6—skin retraction. (D) Distribution by mammography device manufacturer, where manufacturers are encoded as follows: 1—GE, 2—GIOTTO, 3—PLANMED, 4—SIEMENS. The manufacturer field is populated only for VinDr-Mammo and CMMD; INBreast and CBIS-DDSM lack this metadata and are therefore not represented in this panel. In each plot, the Y-axis represents frequency (log scale).
To identify possible anomalies, dataset parameters and metadata were analyzed for each dataset, including finding and BI-RADS categories and density according to the American College of Radiology (ACR) [38], as well as the correspondence between the specified metadata and extracted parameters. Analysis of the joint distribution of density across datasets revealed dataset-specific structural differences and imbalances. These differences justify the need for normalization and careful subset selection when pooling data: VinDr, for instance, dominates in volume but exhibits limited density variability, whereas INBreast offers greater density diversity despite its smaller sample size. In addition, analysis of contingency tables for the whole dataset and separately for each dataset revealed anomalous combinations and rare classes. For example, the assigned category could correspond to cancer in a patient while the BI-RADS category remained 0 or 1. Such data were removed from the dataset, which improved the final accuracy and robustness of the developed model. The analysis of model-quality changes after outlier removal is presented in Section 4.2.
4.2. DICOM Intensity Analysis
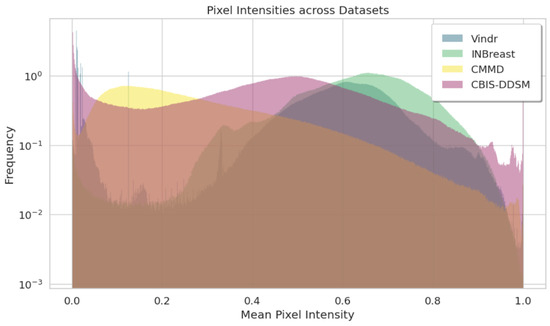
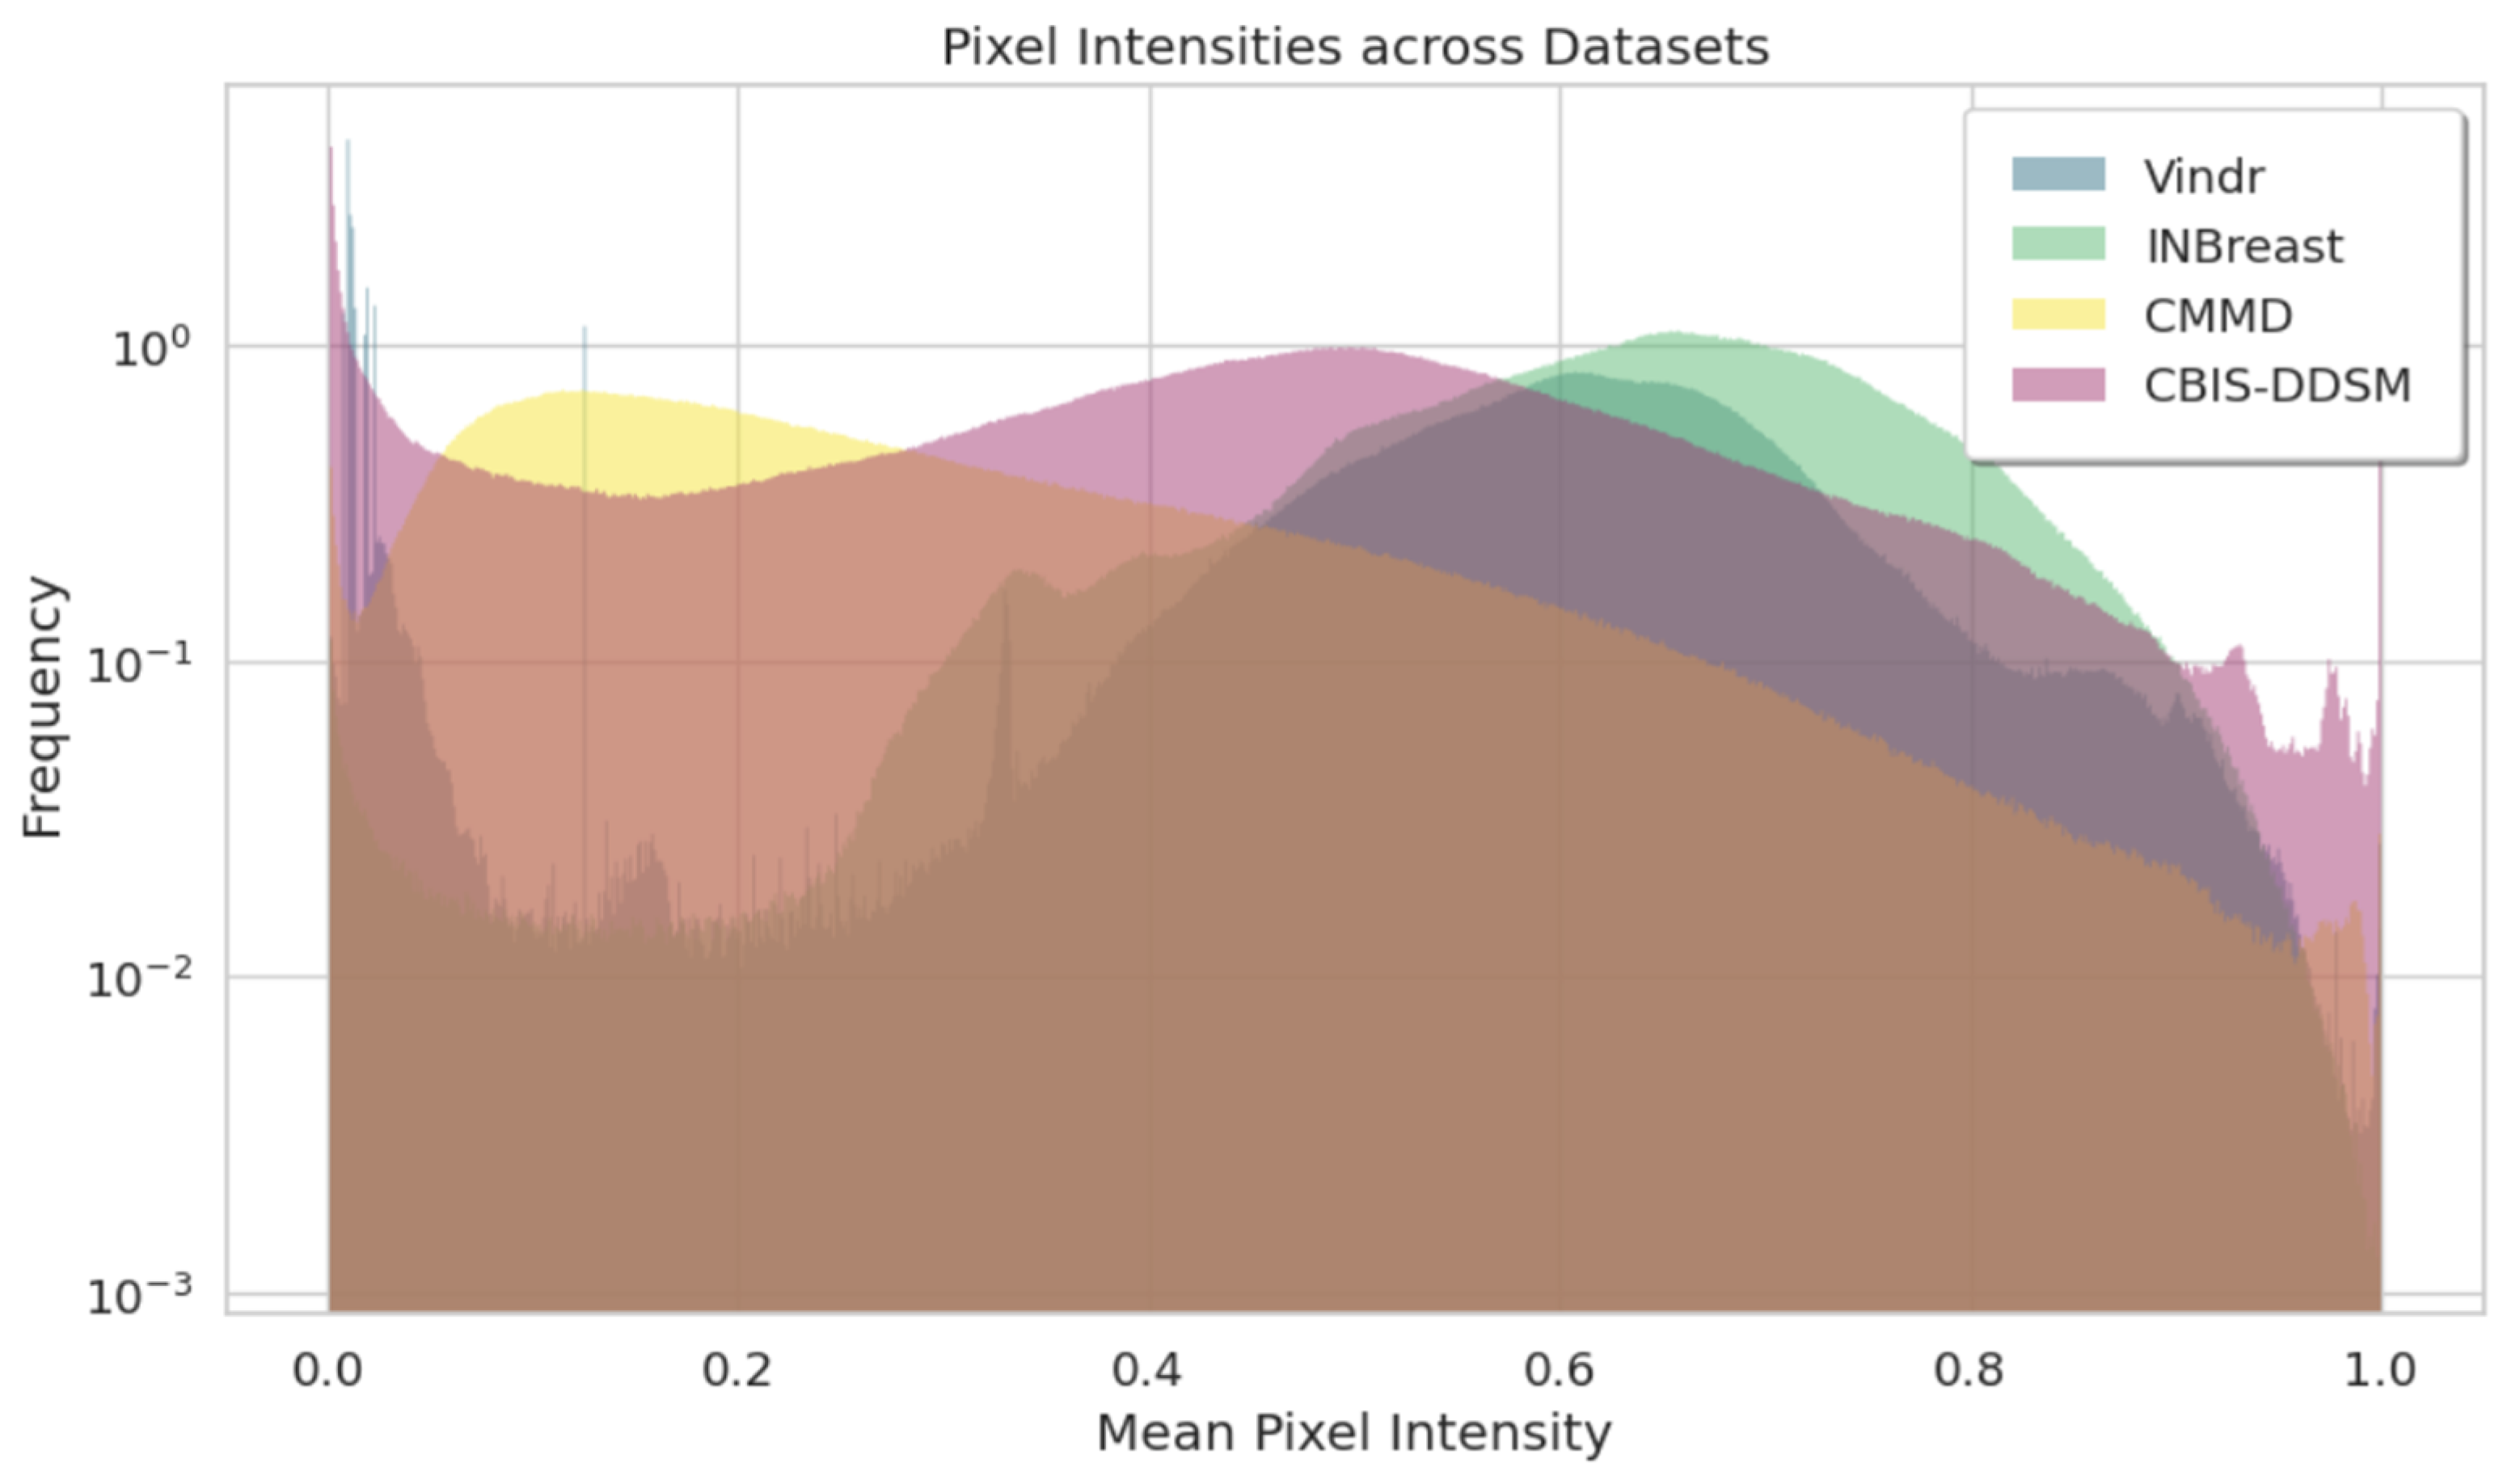
Analysis of histograms of mean pixel-intensity values on a logarithmic scale for 100 randomly selected images from each of the four datasets showed structural similarities as well as meaningful differences between sources, as shown in Figure 3. Visual analysis indicates that INBreast and VinDr have the most similar distributions, the CMMD distribution is noticeably shifted to the left, and CBIS-DDSM is characterized by wide dispersion, containing both dark and bright images.
Figure 3.
Histograms of mean pixel intensity on a logarithmic scale for 100 random images from each VICC dataset before preprocessing, demonstrating substantial differences in brightness distributions between datasets. When plotting the pooled histograms, the first bin was excluded to avoid a dominant peak caused by zero-valued pixels. Extreme black and white distribution tails (upper and lower 5%) were identified as outliers, providing the basis for subsequent image filtering to improve model robustness.
The quantitative analysis demonstrates a pronounced shift between datasets. Under such nonlinear intensity shifts, neural-network architectures tend to overfit to photometric features of a particular dataset, ignoring morphological signs of pathology. Therefore, without normalization of the pixel space, the training pipeline cannot compensate for this domain gap. At the data-preparation stage, we therefore normalized the intensity of each DICOM image using the mean and standard deviation calculated on the pooled training sample. To prevent data leakage, these global statistics were computed strictly before augmentation and isolated from the validation and test sets. Standardizing the pixel space to a standard normal distribution (Z-score normalization) solved the key task of independently centering features while mitigating the previously identified domain gap between datasets.
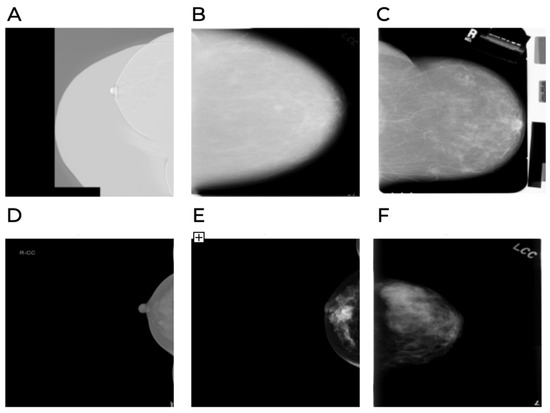
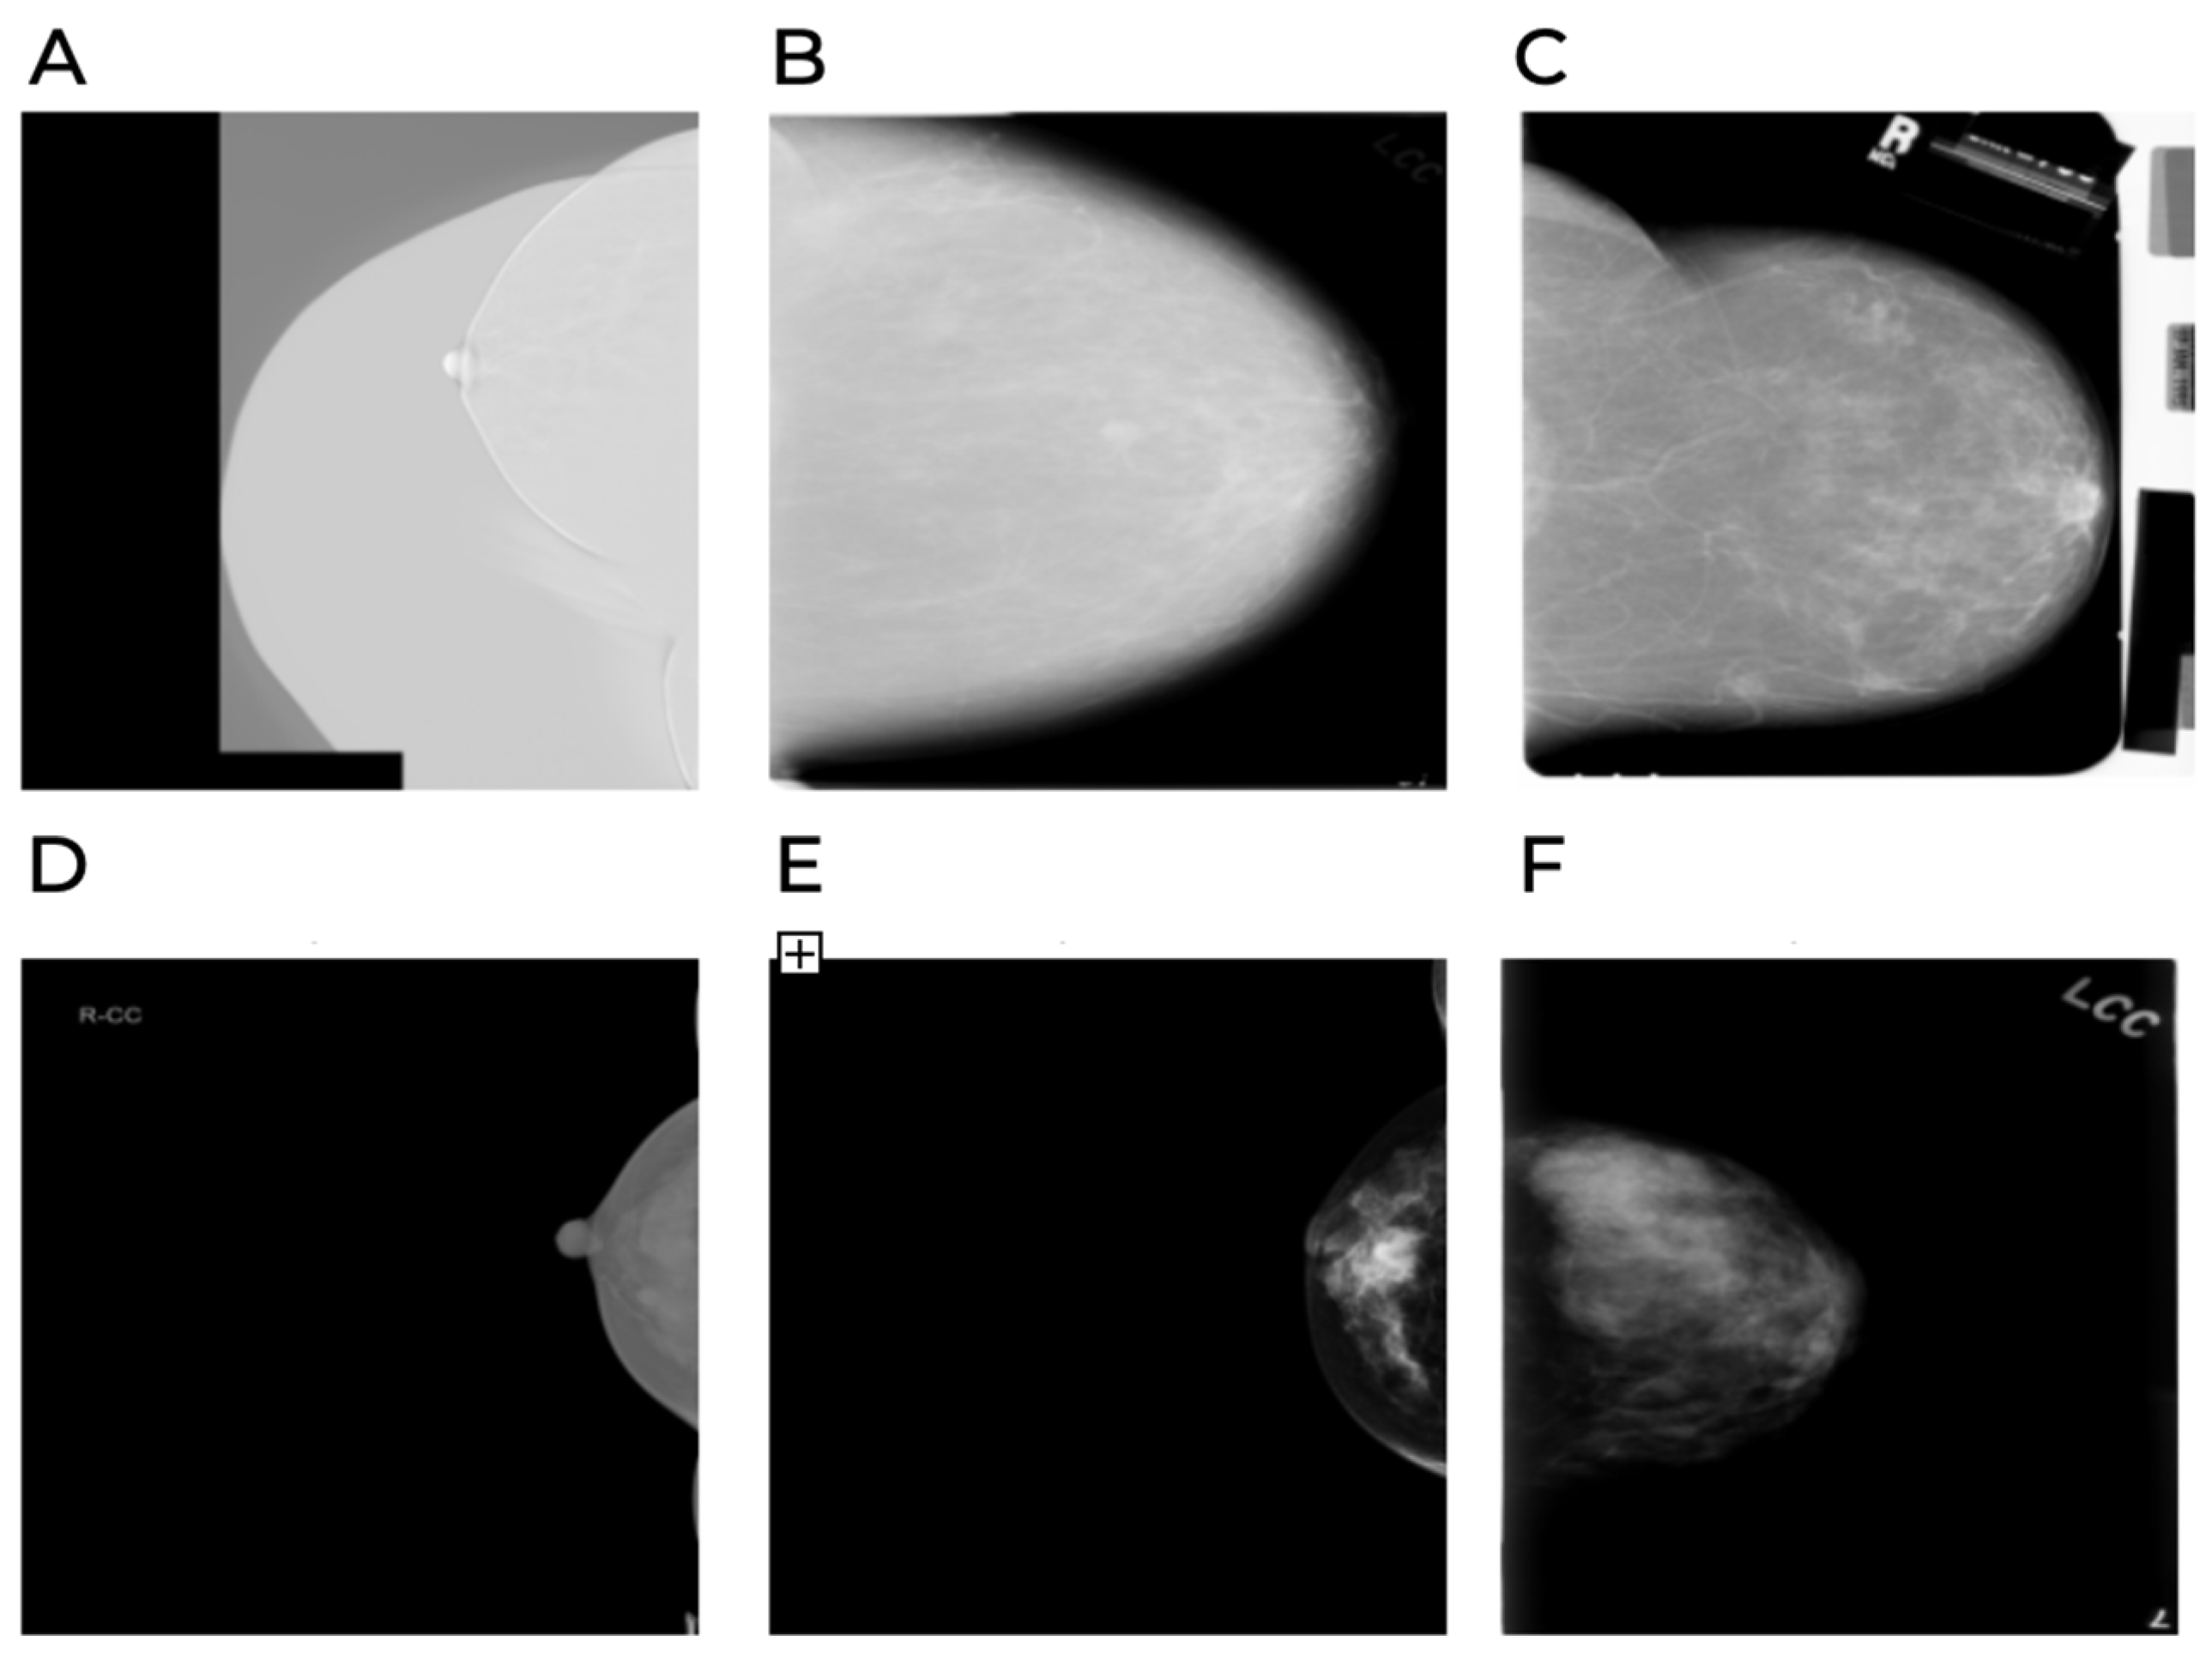
In addition to intensity normalization, we investigated the effect of excluding the darkest and brightest 1% and 5% of images, based on mean pixel intensity, from each dataset on final model-quality metrics. The study showed that removing the darkest 5% of images provided the largest increase in AUROC and F1; removing the brightest 5% also had a positive effect, but it was less stable. Figure 4 shows representative examples of black and white images.
Figure 4.
Examples of images included in the 5% filtered by mean pixel value. (A–C) are white anomalies; (D–F) are black anomalies.
At this pipeline step, anomaly filtering based on image metadata was also performed, and several filtering categories were considered: metadata errors (ACR density, irrelevant BI-RADS values, and inconsistencies between lesion-class labels and other parameters) and anomalies in image-intensity distributions that manifest as bright or dark images. Experiments excluding different categories of anomalies from the training sample made it possible to determine the optimal strategy for cleaning the original dataset. The effect of different filtering strategies when tested on the independent MosMed test set is summarized in Table 2. Removal of metadata anomalies, together with removal of the darkest 5% of images, produced the largest metric increase on the test set. Excluding bright anomalies also had a meaningful effect. As a result, for subsequent testing of augmentation strategies and baseline model architectures, we decided to filter anomalies by metadata values and exclude the darkest and brightest 5% of images by intensity from each dataset.
Table 2.
Effect of different dataset filtering strategies on the performance of EfficientNet-B3 (AUROC and F1) on the VICC validation set. Filtering strategies that improve classification quality are highlighted in the original manuscript.
Applying the selected filtering strategy allowed us to quantify the amount of excluded data per dataset. Metadata anomalies (inconsistencies between labels and BI-RADS categories, invalid density values, or BI-RADS = 0) were found only in CBIS-DDSM (272 images). Pixel-intensity filtering (lower and upper 5%) was applied separately to each dataset. The resulting exclusions and the final training, validation, and test set sizes are reported in Table 3.
Table 3.
Final per-dataset image counts after anomaly filtering. The “Metadata anomalies” column reports the number of images excluded due to inconsistency between the original label and the BI-RADS category, invalid tissue-density values, or an indeterminate BI-RADS = 0 category; such anomalies were found only in the CBIS-DDSM dataset. The “Black anomalies” and “White anomalies” columns report the number of images excluded on the basis of extreme (lower/upper 5%) mean pixel-intensity values, reported separately for each dataset. The “Total filtered” column equals the sum of all excluded images per dataset. The “Train”, “Validation”, and “Test” columns report the exact number of remaining images in the corresponding sets used for training and evaluating the final models.
4.3. Selection of an Effective Augmentation Set
Given the generally small size of medical datasets, augmentation is widely used to expand the training sample and mitigate class imbalance [10,24]. In our study, we systematically tested the effects of different augmentations, both individually and in combination, on the prediction quality of fine-tuned classification models. The effect of individual augmentations on the two test sets is presented in Table 4. The baseline prediction accuracy of the EfficientNet-B3 model was 0.815 on the VICC test set and 0.844 on the MosMed test set.
Table 4.
Effect of data augmentation on EfficientNet-B3 AUROC when tested on the VICC validation set and the independent MosMed test set. The table shows the effects of individual augmentations. Baseline denotes the model quality metrics obtained without data augmentation.
The optimal set was selected in two stages. In the first stage, each augmentation was tested in isolation. For each augmentation, a classification model based on pretrained EfficientNet-B3 was trained on a fixed training sample formed from the four datasets after data preprocessing and compared with an analogous baseline model fine-tuned without augmentations. This isolated evaluation made it possible to avoid the confounding influence of interactions between methods.
In the second stage, we analyzed augmentation combinations that included different transformation directions aimed at increasing the accuracy of predictions made by the fine-tuned model. Table A1 presents the tested augmentation combinations with hyperparameter tuning. Strategies were compared on the VICC validation set using cross-validation to determine the statistical significance of the obtained results. Three sets were ultimately formed: Best (only individually beneficial transformations), Extended (an empirically strong combination mixing geometric and photometric changes), and All (every tested transformation). The composition of each selected set is shown in Table 5. The selected sets were tested on the VICC validation set and on the independent MosMed test set using the baseline EfficientNet-B3 model. Although some operations showed low effectiveness in isolation, such as CLAHE and Random Gamma, the Extended set achieved the highest AUROC (0.900), indicating a synergistic effect and better clinical realism, including exposure, contrast, and noise variations typical of the image acquisition process. The Best and All sets showed slightly lower results (AUROC 0.889 and 0.898, respectively), suggesting that an oversaturated set can add noise, whereas an overly conservative set may not sufficiently cover plausible variability. Therefore, for subsequent training and testing of different deep learning model architectures, we selected the Extended set.
Table 5.
Effect of data augmentation on EfficientNet-B3 AUROC when tested on the VICC validation set and the independent MosMed test set. The table shows the effects of the selected sets of diverse augmentations: Best, Extended, and All. The Extended set achieved the highest AUROC, demonstrating a synergistic effect and clinically realistic variability.
4.4. Performance of Baseline Models
Selection of the optimal pretrained model for subsequent fine-tuning is the final stage of the pipeline for developing a robust classifier. In our study, we tested the hypothesis that introducing a multimodal approach during training can substantially improve classification-quality metrics in mammographic image analysis. To test this hypothesis, domain adaptation of the selected CLIP models was performed on the prepared VICC dataset, followed by comparison with the CNN-based baseline solution. The dataset for all experiments passed through the developed standardized sequential preparation pipeline: anomalous values and outliers based on pixel-intensity distributions were removed, DICOM images were normalized, and the optimal augmentation set was applied. The results of comparative testing of the baseline models are presented in Table 6.
Table 6.
Quality metrics of fine-tuned baseline pretrained models on the MosMed test set. High input resolution (1520 × 912) benefits both convolutional and vision-language models; the best overall performance was achieved by Mammo-CLIP.
Among the models investigated (EfficientNet-B3, Mammo-CLIP, MedCLIP, BiomedCLIP, and OpenAI CLIP), the domain-specific Mammo-CLIP model achieved the highest AUROC (0.949), outperforming both general-purpose models and other medical multimodal models. The baseline CNN model EfficientNet-B3 also showed high predictive ability (AUROC 0.934). The confidence intervals overlap, indicating that the observed differences are not statistically significant. By contrast, alternative solutions demonstrated lower performance: OpenAI CLIP (0.646) and BiomedCLIP (0.594) fell substantially behind, whereas MedCLIP (0.856) outperformed both and approached the values obtained for EfficientNet.
It is important to note that the initial image resolution provided to the models was substantially higher for the solutions that demonstrated strong performance. EfficientNet and Mammo-CLIP used a resolution of 1520 × 912, which made it possible to preserve fine details such as microcalcifications and probably played a decisive role in the accuracy of malignancy detection. Transformer-type models with lower fixed resolutions (MedCLIP 512 × 512; BiomedCLIP 224 × 224; OpenAI CLIP 336 × 336) lost critical details, reducing diagnostic accuracy.
The results were obtained using the equipment of the Shared Research Facility «Shared Research Center of the Ivannikov Institute for System Programming of the Russian Academy of Sciences (SRC ISP RAS)».
5. Discussion
Our experiments show that mammogram classification is sensitive to the preprocessing of both images and metadata. In particular, filtering technically unsuitable scans, such as extremely dark or bright images, led to a measurable improvement in AUROC on external test sets.
Working with different datasets leads to parameter variation associated with differences in data sources, patient metadata, equipment used, and other factors, which can substantially affect the quality of the developed models. In the presence of label imbalance, the model systematically shifts toward more frequently occurring classes: rare observations contribute too little to the gradient and therefore barely update the model parameters. This results in degraded performance.
One possible way to account for such variation is sample balancing by different parameters [24,47]. In this approach, sample selection is controlled at each training step so that rare classes occur more often, equalizing their contribution to training. A second possible way to account for class imbalance across different parameters is to use a modified loss function that increases the penalty for errors in rare classes. Both balancing approaches have certain disadvantages: first, a risk of overfitting when the balancing strategy is too aggressive; second, a possible discrepancy between the training and validation samples by parameters, which can lead to inaccurate metric estimation; and third, severe class imbalance cannot be fully eliminated by such tuning [48]. Consequently, when developing a model, it is important to choose a strategy for accounting for class ratios across different data parameters to determine the best training strategy. In this study, the main source of class imbalance may be the affiliation of data with different source datasets, but detailed investigation of different balancing approaches was outside the scope of our work.
The augmentation strategies showed that combining geometric and photometric transformations generally outperforms the use of individual operations. Moderate combinations provided the most robust improvement, reflecting the need to capture clinical variability, including differences in acquisition systems, exposure levels, and patient positioning. In contrast, overly aggressive transformations, such as large rotations or strong cropping, sometimes reduced performance, indicating that synthetic data should balance diversity with biomedical realism. For this reason, the Hue Saturation Value transformation was removed from the “gold standard” augmentation set, although it produced a substantial individual improvement: a strong hue shift creates substantial semantic distortion of the image and disrupts high-quality training on grayscale mammograms.
5.1. Key Factors in Model Accuracy: Resolution and Domain Adaptation
In this study, we performed a comparative analysis of different neural network architectures for the mammogram classification task. The main conclusion of our work is that high input image resolution and model domain adaptation are critical for successful diagnosis. Although integration of semantic information into the training context of baseline models enriches their representations, it is not an absolute advantage by itself. The specifics of mammography require detection of very small details, such as microcalcifications and subtle changes in tissue patterns. Therefore, the largest contribution to the accuracy and robustness of solutions comes from the high native image resolution, which allows the algorithm to extract domain-specific visual information without distortion.
5.2. Limitations of Transformers and Advantages of Convolutional Networks
Analysis of visual encoders in modern multimodal models (CLIP) revealed substantial limitations of transformer-based architectures (ViT or Swin Transformer) for this task. Their application makes efficient analysis of images at their original high resolution difficult because of computational complexity, which inevitably leads to the loss of key diagnostic details when images are compressed. In contrast, convolutional neural networks (CNNs), traditionally used as baseline solutions, demonstrate strong competitiveness when processing large-scale images.
It is noteworthy that, in existing studies testing CLIP models on general and several medical benchmarks, variants with CNN encoders, especially ResNet-50 [42,45], often underperform transformer-based analogues. However, on the mammogram dataset, we observed the opposite pattern. This discrepancy emphasizes the critical importance of rigorous empirical evaluation and validation of architectures for a specific clinical task.
5.3. Confirmation of the Hypothesis on the Effectiveness of VLMs
Despite the strong performance of classical convolutional networks, foundation models pretrained on medical data can outperform standard baseline approaches. This is clearly confirmed by the testing results of Mammo-CLIP, in which a CNN architecture (EfficientNet-B5) capable of processing high resolution is used as the visual encoder. In our study, this model demonstrated more accurate classification on the test dataset than the baseline EfficientNet-B3 model. On our data, the observed advantage did not reach statistical significance, and a larger test set would be required to determine whether the difference is reliable. This result confirms our hypothesis: expanding the generalizability of the algorithm through a multimodal architecture (vision-language models) improves accuracy metrics, provided that the visual representations are aligned with the mammography domain. It is important to note, however, that the advantage of the domain-adapted model was not large. Further experiments would be required to determine which factor played the key role—the multimodal architecture or the larger backbone (B3 vs. B5).
Certain limitations of our study should be considered. The exclusive use of open datasets, although beneficial for reproducibility, may introduce biases related to patient demographics, imaging equipment, and regional practices. Furthermore, the vendor composition of the open datasets does not reflect the global market distribution of mammography systems. In particular, the pooled data contain no Hologic-acquired images, even though Hologic detectors are among the most widely used in clinical practice. Because detector-specific image characteristics vary across vendors, this vendor imbalance both contributes to the inter-dataset domain shift observed in our intensity analysis (Figure 3) and may limit external validity. Validation on Hologic-acquired data is therefore an important direction for the planned clinical and federated-learning extensions of this work. Some BI-RADS categories were underrepresented, limiting generalizability for multiclass tasks. In addition, although our pipeline provides a systematic framework for evaluating preprocessing and augmentation strategies, its application to a specific clinical dataset requires consideration of the unique characteristics of that dataset. Nevertheless, the pipeline offers a rapid and reliable starting point for optimizing data preparation and model training.
Further research should expand the experimental design to include comparisons of models of equal size that are capable of operating at higher resolutions and are based on a transformer architecture. This would allow a more accurate assessment of the contribution of individual factors to achieving high classification accuracy. It should be noted that such experiments may require a substantial increase in computational resources needed to train models on large volumes of data at high resolution.
Overall, our results provide empirical recommendations for developing preprocessing strategies, augmentation strategies, and model-selection approaches in AI for mammography. The unified pipeline can serve as a foundation for scalable and reproducible decision-support systems. The results open new directions for future work. Of particular interest is the investigation of methods for adapting transformer architectures to work efficiently with ultra-high-resolution medical images, as well as further fine-tuning of foundation vision-language models on expanded mammography datasets to improve diagnostic quality.
6. Conclusions
In this study, we systematically analyzed how the choice of data preprocessing and augmentation methods affects deep learning performance in mammography. We demonstrated that removal of unsuitable scans and correction of metadata inconsistencies lead to measurable improvements in accuracy, and that combining geometric and photometric augmentations makes it possible to create more robust models than using individual transformations alone. The analysis comparing convolutional and vision-language architectures shows that high spatial resolution provides the best classification metrics, making Mammo-CLIP and EfficientNet the most promising basis for fine-tuning and clinical application. By presenting a unified reproducible pipeline that harmonizes open datasets and evaluates preprocessing effects under controlled conditions, this work addresses a key gap in mammography research. The proposed framework provides practical recommendations for developing scalable and transparent decision-support systems. Future efforts will focus on federated learning and the integration of real clinical data to improve the external validity of the results.
Author Contributions
Conceptualization, E.U. and S.S.; methodology, E.U. and S.S.; software, A.L.; validation, E.U., S.Z. and S.S.; formal analysis, S.S.; investigation, E.U.; resources, E.K.; data curation, E.U.; writing—original draft preparation, S.Z. and S.S.; writing—review and editing, E.U., S.Z., K.L., T.G.G. and E.K.; visualization, S.Z. and S.S.; supervision, E.U.; project administration, E.K.; funding acquisition, E.K. All authors have read and agreed to the published version of the manuscript.
Funding
This research was funded by a grant provided by the Ministry of Economic Development of the Russian Federation (agreement dated 20 June 2025 No. 139-15-2025-011, identifier 000000C313925P4G0002).
Data Availability Statement
The source code implementing the data processing, training, and evaluation pipeline developed in this study is publicly available on GitHub at https://github.com/Sofya-Z/AI_Mammography_Pipeline (accessed on 7 July 2026). The datasets used in this study are publicly available: VinDr-Mammo, INBreast, CMMD, and CBIS-DDSM were used for training and internal validation, and the MosMed database was used for external testing; the corresponding access details are provided in the cited references.
Acknowledgments
During the preparation of this manuscript, the authors used Claude Opus 4.8 (Anthropic) for language editing (grammar, phrasing, and readability). The authors have reviewed and edited the output and take full responsibility for the content of this publication.
Conflicts of Interest
The authors declare no conflicts of interest.
Abbreviations
The following abbreviations are used in this manuscript:
| AUROC | Area Under the Receiver Operating Characteristic curve |
| BI-RADS | Breast Imaging Reporting and Data System |
| ACR | American College of Radiology |
| VICC | Four open datasets: VinDr-Mammo, INBreast, CMMD, and CBIS-DDSM |
| CNN | Convolutional neural networks |
Appendix A
Appendix A presents the results of a systematic evaluation of various augmentation strategies combining geometric, photometric, and more advanced approaches.
Table A1.
Evaluation of the effect of different augmentation combinations on model performance. Quality evaluation was performed using the EfficientNet-B3 model, trained for 30 epochs and validated on the VICC dataset.
References
- McKinney, S.M.; Sieniek, M.; Godbole, V.; Godwin, J.; Antropova, N.; Ashrafian, H.; Back, T.; Chesus, M.; Corrado, G.S.; Darzi, A.; et al. International evaluation of an AI system for breast cancer screening. Nature 2020, 577, 89–94. [Google Scholar] [CrossRef] [Scilit] [PubMed]
- Lehman, C.D.; Yala, A.; Schuster, T.; Dontchos, B.; Bahl, M.; Swanson, K.; Barzilay, R. Mammographic breast density assessment using deep learning: Clinical implementation. Radiology 2019, 290, 52–58. [Google Scholar] [CrossRef] [Scilit] [PubMed]
- Ibragimov, A.; Senotrusova, S.; Markova, K.; Karpulevich, E.; Ivanov, A.; Tyshchuk, E.; Grebenkina, P.; Stepanova, O.; Sirotskaya, A.; Kovaleva, A.; et al. Deep semantic segmentation of angiogenesis images. Int. J. Mol. Sci. 2023, 24, 1102. [Google Scholar] [CrossRef] [Scilit] [PubMed]
- Wang, L. Mammography with deep learning for breast cancer detection. Front. Oncol. 2024, 14, 1281922. [Google Scholar] [CrossRef] [Scilit] [PubMed]
- Rodriguez-Ruiz, A.; Lång, K.; Gubern-Merida, A.; Broeders, M.; Gennaro, G.; Clauser, P.; Helbich, T.H.; Chevalier, M.; Tan, T.; Mertelmeier, T.; et al. Stand-alone artificial intelligence for breast cancer detection in mammography: Comparison with 101 radiologists. JNCI J. Natl. Cancer Inst. 2019, 111, 916–922. [Google Scholar] [CrossRef] [Scilit] [PubMed]
- Amin, A.; U, D.A.; Koteshwara, P.; P C, S.; Mathew, S. A systematic literature review on mammography: Deep learning techniques for breast cancer detection with global and Asian perspectives. BMC Cancer 2025, 25, 1627. [Google Scholar] [CrossRef] [Scilit] [PubMed]
- Hunde, B.R.; Woldeyohannes, A.D. Future prospects of computer-aided design (CAD)—A review from the perspective of artificial intelligence (AI), extended reality, and 3D printing. Results Eng. 2022, 14, 100478. [Google Scholar] [CrossRef] [Scilit]
- Larsen, M.; Aglen, C.F.; Lee, C.I.; Hoff, S.R.; Lund-Johansen, M.; Hofvind, S. AI performance by mammographic density in a retrospective cohort study of 99,489 participants in BreastScreen Norway. Eur. Radiol. 2024, 10, 6298–6308. [Google Scholar] [CrossRef] [Scilit] [PubMed]
- Kretz, T.; Muller, K.R.; Schaeffter, T.; Elster, C. Mammography image quality assurance using deep learning. IEEE Trans. Biomed. Eng. 2020, 67, 3317–3326. [Google Scholar] [CrossRef] [Scilit] [PubMed]
- Oza, P.; Sharma, P.; Patel, S.; Adedoyin, F.; Bruno, A. Image augmentation techniques for mammogram analysis. J. Imaging 2022, 8, 141. [Google Scholar] [CrossRef] [Scilit] [PubMed]
- Ibragimov, A.; Senotrusova, S.; Litvinov, A.; Ushakov, E.; Karpulevich, E.; Markin, Y. MamT4: Multi-View Attention Networks for Mammography Cancer Classification. In Proceedings of the IEEE 48th Annual Computers, Software, and Applications Conference (COMPSAC), Osaka, Japan, 2–4 July 2024; pp. 1965–1970. [Google Scholar] [CrossRef] [Scilit]
- Kebaili, A.; Lapuyade-Lahorgue, J.; Ruan, S. Deep learning approaches for data augmentation in medical imaging: A review. J. Imaging 2023, 9, 81. [Google Scholar] [CrossRef] [Scilit] [PubMed]
- Ushakov, E.; Naumov, A.; Fomberg, V.; Vishnyakova, P.; Asaturova, A.; Badlaeva, A.; Tregubova, A.; Karpulevich, E.; Sukhikh, G.; Fatkhudinov, T. EndoNet: A Model for the Automatic Calculation of H-Score on Histological Slides. Informatics 2023, 10, 90. [Google Scholar] [CrossRef] [Scilit]
- Makarchuk, A.; Asaturova, A.; Ushakov, E.; Tregubova, A.; Badlaeva, A.; Tabeeva, G.; Karpulevich, E.; Markin, Y. Artificial Intelligence (AI) Solution for Plasma Cells Detection. Program. Comput. Softw. 2023, 49, 873–880. [Google Scholar] [CrossRef] [Scilit]
- Al-Mnayyis, A.M.; Gharaibeh, H.; Amin, M.; Anakreh, D.; Akhdar, H.F.; Alshdaifat, E.H.; Nahar, K.M.O.; Nasayreh, A.; Gharaibeh, M.; Alsalman, N.; et al. (KAUH-BCMD) dataset: Advancing mammographic breast cancer classification with multi-fusion preprocessing and residual depth-wise network. Front. Big Data 2025, 8, 1529848. [Google Scholar] [CrossRef] [Scilit] [PubMed]
- Hsu, Y. Beyond double reading: Multiple deep learning models enhancing radiologist-led breast screening. Radiol. Artif. Intell. 2025, 7, e250125. [Google Scholar] [CrossRef] [Scilit] [PubMed]
- Branco, P.E.S.C.; Franco, A.H.S.; Oliveira, A.P.; Carneiro, I.M.C.; Carvalho, L.M.C.; Souza, J.I.N.; Leandro, D.R. Artificial intelligence in mammography: A systematic review of external validation. Rev. Bras. Ginecol. Obstet. 2024, 46, E-rbgo71. [Google Scholar] [CrossRef] [Scilit] [PubMed]
- Gao, S.; Liu, J.; Li, L.; Yang, D.; Miao, Y.; Zhang, X.; Han, Q.; Shi, Y.; Wu, J.; Zhang, K. Application of deep learning technology in breast cancer: A systematic review of segmentation, detection, and classification approaches. Biomed. Eng. Online 2026, 25, 19. [Google Scholar] [CrossRef] [Scilit] [PubMed]
- Bhalla, A.S.; Das, A.; Naranje, P.; Irodi, A.; Raj, V.; Goyal, A. Imaging protocols for CT chest: A recommendation. Indian J. Radiol. Imaging 2019, 29, 236–246. [Google Scholar] [CrossRef] [Scilit] [PubMed]
- Gao, Y.E.; Lin, J.; Zhou, Y.; Lin, R. The application of traditional machine learning and deep learning techniques in mammography: A review. Front. Oncol. 2023, 13, 1213045. [Google Scholar] [CrossRef] [Scilit] [PubMed]
- Mehrabi, M.; Salek, N. Enhancing diagnostic accuracy in breast cancer: Integrating novel machine learning approaches with enhanced image preprocessing for improved mammography analysis. Pol. J. Radiol. 2024, 89, E573. [Google Scholar] [CrossRef] [Scilit] [PubMed]
- Avci, H.; Karakaya, J. A novel medical image enhancement algorithm for breast cancer detection on mammography images using machine learning. Diagnostics 2023, 13, 348. [Google Scholar] [CrossRef] [Scilit] [PubMed]
- Garrucho, L.; Kushibar, K.; Jouide, S.; Diaz, O.; Igual, L.; Lekadir, K. Domain generalization in deep learning based mass detection in mammography: A large-scale multi-center study. Artif. Intell. Med. 2022, 132, 102386. [Google Scholar] [CrossRef] [Scilit] [PubMed]
- Panambur, A.B.; Yu, H.; Bhat, S.; Madhu, P.; Bayer, S.; Maier, A. Attention-guided erasing: Novel augmentation method for enhancing downstream breast density classification. In BVM Workshop; Springer Fachmedien Wiesbaden: Wiesbaden, Germany, 2024; pp. 13–18. [Google Scholar] [CrossRef] [Scilit]
- Montoya-del-Angel, R.; Sam-Millan, K.; Vilanova, J.C.; Marti, R. MAM-E: Mammographic Synthetic Image Generation with Diffusion Models. Sensors 2024, 24, 2076. [Google Scholar] [CrossRef] [Scilit] [PubMed]
- Dhaliwal, B.K. Automated Breast Cancer Detection Systems: A Systematic Review of Machine Learning and Deep Learning Techniques (2015–2025). In Proceedings of the 2025 2nd International Conference on Artificial Intelligence for Innovations in Healthcare Industries (ICAIIHI), Raipur, India, 4–5 December 2025; pp. 1–6. [Google Scholar] [CrossRef] [Scilit]
- Rajpurkar, P.; Chen, E.; Banerjee, O.; Topol, E.J. AI in health and medicine. Nat. Med. 2022, 28, 31–38. [Google Scholar] [CrossRef] [Scilit] [PubMed]
- Ameen, M. Explainable Mammogram Analysis with EfficientNetV2 and Grad-CAM++ for Robust Cancer Diagnosis. Diagnostics 2025, 16, 105. [Google Scholar] [CrossRef] [Scilit] [PubMed]
- Hasan, M. Deep Learning for Breast Cancer Detection: Comparative Analysis of ConvNeXT and EfficientNet. In 2024 27th International Conference on Computer and Information Technology (ICCIT); IEEE: Piscataway, NJ, USA, 2024; pp. 1387–1391. [Google Scholar]
- Clancy, K.; Aboutalib, S.; Mohamed, A.; Sumkin, J.; Wu, S. Deep learning pre-training strategy for mammogram image classification: An evaluation study. J. Digit. Imaging 2020, 33, 1257–1265. [Google Scholar] [CrossRef] [Scilit] [PubMed]
- Ghosh, S.; Poynton, C.B.; Visweswaran, S.; Batmanghelich, K. Mammo-CLIP: A vision language foundation model to enhance data efficiency and robustness in mammography. In International Conference on Medical Image Computing and Computer-Assisted Intervention; Springer Nature Switzerland: Cham, Switzerland, 2024; pp. 632–642. [Google Scholar]
- Nguyen, H.T.; Nguyen, H.Q.; Pham, H.H.; Lam, K.; Le, L.T.; Dao, M.; Vu, V. VinDr-Mammo: A large-scale benchmark dataset for computer-aided diagnosis in full-field digital mammography. Sci. Data 2023, 10, 277. [Google Scholar] [CrossRef] [Scilit] [PubMed]
- Ines, C.M.; Igor, A.; Ines, D.; Antonio, C.; Maria, J.C.; Jaime, S.C. INbreast: Toward a full-field digital mammographic database. Acad. Radiol. 2012, 19, 236–248. [Google Scholar] [CrossRef] [Scilit] [PubMed]
- Cai, H.; Wang, J.; Dan, T.; Li, J.; Fan, Z.; Yi, W.; Cui, C.; Jiang, X.; Li, L. An Online Mammography Database with Biopsy Confirmed Types. Sci. Data 2023, 10, 123. [Google Scholar] [CrossRef] [Scilit] [PubMed]
- Lee, R.S.; Gimenez, F.; Hoogi, A.; Miyake, K.K.; Gorovoy, M.; Rubin, D.L. A curated mammography data set for use in computer-aided detection and diagnosis research. Sci. Data 2017, 4, 170177. [Google Scholar] [CrossRef] [Scilit] [PubMed]
- MosMedData. Available online: https://mosmed.ai/datasets/datasets/mosmeddata-mmg-s-nalichiem-i-otsutstviem-priznakov-zlokachestvennih-novoobrazovanii-molochnoi-zhelezi-obogaschennii-klinicheskoi-informatsiei-v1/ (accessed on 25 August 2025).
- MosMedData. Available online: https://mosmed.ai/datasets/datasets/mosmeddata-mmg-s-nalichiem-i-otsutstviem-priznakov-zlokachestvennih-novoobrazovanii-molochnoi-zhelezi-obogaschennii-klinicheskoi-informatsiei-v2/ (accessed on 25 August 2025).
- Magny, S.J.; Shikhman, R.; Keppke, A.L. Breast Imaging Reporting and Data System. In StatPearls [Internet]; StatPearls Publishing: Treasure Island, FL, USA, 2023. [Google Scholar] [PubMed]
- Buslaev, A.; Iglovikov, V.I.; Khvedchenya, E.; Parinov, A.; Druzhinin, M.; Kalinin, A.A. Albumentations: Fast and flexible image augmentations. Information 2020, 11, 125. [Google Scholar] [CrossRef] [Scilit]
- Albumentations Development Team. Albumentations (Version 2.0.8) [Python Package]. PyPI. 2025. Available online: https://pypi.org/project/albumentations/2.0.8/ (accessed on 7 July 2026).
- Tan, M.; Le, Q. EfficientNet: Rethinking model scaling for convolutional neural networks. In International Conference on Machine Learning; PMLR: Los Angeles, CA, USA, 2019; pp. 6105–6114. [Google Scholar] [CrossRef] [Scilit]
- Radford, A.; Kim, J.W.; Hallacy, C.; Ramesh, A.; Goh, G.; Agarwal, S.; Sastry, G.; Askell, A.; Mishkin, P.; Clark, J.; et al. Learning transferable visual models from natural language supervision. In International Conference on Machine Learning; PMLR: Honolulu, HI, USA, 2021; pp. 8748–8763. [Google Scholar] [CrossRef] [Scilit]
- Zhang, S.; Xu, Y.; Usuyama, N.; Xu, H.; Bagga, J.; Tinn, R.; Preston, S.; Rao, R.; Wei, M.; Valluri, N.; et al. Biomedclip: A multimodal biomedical foundation model pretrained from fifteen million scientific image-text pairs. arXiv 2023, arXiv:2303.00915. [Google Scholar] [CrossRef] [Scilit]
- Dosovitskiy, A.; Beyer, L.; Kolesnikov, A.; Weissenborn, D.; Zhai, X.; Unterthiner, T.; Dehghani, M.; Minderer, M.; Heigold, G.; Gelly, S.; et al. An image is worth 16x16 words: Transformers for image recognition at scale. arXiv 2020, arXiv:2010.11929. [Google Scholar] [CrossRef] [Scilit]
- Wang, Z.; Wu, Z.; Agarwal, D.; Sun, J. Medclip: Contrastive learning from unpaired medical images and text. In Proceedings of the 2022 Conference on Empirical Methods in Natural Language Processing, Abu Dhabi, United Arab Emirates, 7–11 December 2022; pp. 3876–3887. [Google Scholar] [CrossRef] [Scilit] [PubMed]
- Liu, Z.; Lin, Y.; Cao, Y.; Hu, H.; Wei, Y.; Zhang, Z.; Lin, S.; Guo, B. Swin transformer: Hierarchical vision transformer using shifted windows. In Proceedings of the IEEE/CVF International Conference on Computer Vision, Online, 11–17 October 2021; pp. 10012–10022. [Google Scholar] [CrossRef] [Scilit]
- Zech, J.R.; Badgeley, M.A.; Liu, M.; Costa, A.B.; Titano, J.J.; Oermann, E.K. Variable generalization performance of a deep learning model to detect pneumonia in chest radiographs: A cross-sectional study. PLoS Med. 2018, 15, e1002683. [Google Scholar] [CrossRef] [Scilit] [PubMed]
- Litvinov, A.; Ushakov, E.; Senotrusova, S.; Lukianov, K.; Markin, Y.; Mikhailova, L.; Karpulevich, E. Clinically Aware Learning: Ordinal Loss Improves Medical Image Classifiers. J. Clin. Med. 2026, 15, 365. [Google Scholar] [CrossRef] [Scilit] [PubMed]

Disclaimer/Publisher’s Note: The statements, opinions and data contained in all publications are solely those of the individual author(s) and contributor(s) and not of MDPI and/or the editor(s). MDPI and/or the editor(s) disclaim responsibility for any injury to people or property resulting from any ideas, methods, instructions or products referred to in the content. |
© 2026 by the authors. Licensee MDPI, Basel, Switzerland. This article is an open access article distributed under the terms and conditions of the Creative Commons Attribution (CC BY) license.