


Abstract
The recruitment headhunting process is time-intensive due to manual candidate searches across multiple job platforms, creating inefficiencies in identifying suitable candidates. Current AI-driven recruitment platforms frequently prioritize accuracy over explainability, limiting transparency for non-technical users such as recruiters. This study streamlines recruitment headhunting by (1) consolidating publicly available candidate data from multiple job portals using a professional data aggregation Application Programming Interface (API), and (2) implementing explainable machine learning for transparent candidate–job matching. We utilized the Coresignal API (v1) to aggregate and standardize candidate profiles (N = 587) sourced from LinkedIn and Indeed, including skills, experience, certifications, and education. Using Term Frequency–Inverse Document Frequency (TF-IDF) feature vectors and regression models (Ridge, Gradient Boosting, Random Forest), we matched and ranked candidates against a standardized Data Scientist job description. Shapash was incorporated to provide interpretable feature importance explanations accessible to non-technical users. Model performance was evaluated using stratified 5-fold cross-validation with statistical significance testing. Ridge Regression achieved superior performance (cross-validated R2 = 0.935, bootstrap R2 = 0.954, 95% confidence interval [0.939, 0.965], RMSE = 0.025) compared with Gradient Boosting (R2 = 0.840) and Random Forest (R2 = 0.733). Paired t-tests confirmed significant differences between all model pairs (all ps ≤ 0.001, Bonferroni corrected) with large effect sizes (Cohen’s d ≥ 1.992). Shapash analysis revealed that top-contributing features, such as “engineering”, “data science”, “machine learning”, and “python”, aligned precisely with job description requirements, validating the model’s feature-learning capability. This approach reduces repetitive manual searches across job portals while providing interpretable insights into candidate–job rankings. The methodology’s originality lies in combining professional data aggregation APIs that access publicly available profile data with interpretable models enhanced by user-friendly visualization tools, creating a practical, potentially transferable solution for transparent AI-driven recruitment.
1. Introduction
Recruitment and selection, as high-stakes decisions that profoundly impact individuals’ career trajectories and organizations’ human capital, have become a focal domain for AI implementation [1]. However, two fundamental challenges impede the effective use of AI in recruitment: the fragmentation of candidate information across multiple job portals and the opacity of algorithmic decision-making, often characterized as the “black box” problem. Together, these challenges hinder both human judgment and the practical implementation of fair, transparent hiring systems [2].
Headhunting, also known as executive search, is a recruitment method focused on proactively identifying and attracting key or rare personnel, particularly for critical, specialized, or leadership positions, where traditional methods are ineffective [3]. By contrast, traditional recruitment methods rely on attracting candidates to apply for open positions through internal or external sources such as advertisements and employment exchanges [3]. This emphasis on passive candidates distinguishes headhunting from conventional hiring and makes efficient data access particularly critical.
However, recruiter candidate sourcing is a complex, iterative process that involves multiple search queries and progressive refinement of search parameters such as job titles, location, skills, and education across multiple job portals such as LinkedIn, Glassdoor, and Indeed [4]. This iterative approach has shortcomings such as (i) time consumption: recruiters spend considerable time navigating different platforms, conducting similar searches, and manually consolidating data, (ii) error proneness: manual data entry and consolidation increase the risk of errors, potentially leading to the loss of qualified candidates, (iii) delayed identification: the slow process delays candidate identification, impacting time-to-hire, and (iv) increased costs: recruiters often need separate subscriptions for each portal, raising overall recruitment expenditure.
These limitations underscore the necessity for consolidated candidate data access. While Bogers and Kaya [4] explored recruiter information-seeking behavior across job portals, their work did not propose solutions for data consolidation. Similarly, Peicheva [5] examined Applicant Tracking Systems (ATS) for managing incoming applications, but these systems are not designed for consolidating candidate profiles during proactive headhunting. Tambe et al. [6] highlight that AI-based HR tools face challenges related to small datasets, accountability, and fairness, yet no prior work addresses the foundational challenge of multi-platform candidate data aggregation for headhunting. Current literature thus reveals a clear gap: limited research has demonstrated practical, reproducible solutions for aggregating candidate data from multiple job portals specifically for headhunting purposes.
Beyond data fragmentation, Machine Learning (ML) has emerged as a transformative tool in recruitment, offering capabilities to automate and enhance candidate sourcing, matching, and ranking against job descriptions with increased accuracy and effectiveness [7,8]. However, despite achieving high accuracy levels, ML models often function as “black boxes,” rendering their decision-making processes opaque and difficult for non-technical stakeholders to understand [9]. This opacity is particularly problematic because it can obscure potential discrimination and make it difficult for recruiters to explain or justify specific decisions, raising concerns about fairness and accountability [10]. Beretta et al. [11] emphasize that ML algorithms used in recruitment must be both accurate and explainable, since transparency is essential for building trust and ensuring fairness in AI-based hiring decisions. Hofeditz et al. [12] further demonstrate, through a controlled experiment with 194 participants, that XAI-augmented candidate recommendation systems can moderate human hiring decisions, underscoring the practical importance of accessible explanations for non-technical users.
Considering these gaps, this study makes three primary contributions to the recruitment technology literature:
- We demonstrate how the Coresignal API consolidates candidate data from LinkedIn, Indeed, and other platforms into a unified interface, eliminating redundant multi-platform searches;
- We compare three regression approaches, Ridge, Gradient Boosting, and Random Forest, for TF-IDF-based candidate–job matching with rigorous statistical validation, showing that regularized linear models achieve superior performance while maintaining interpretability;
- We implement Shapash-based explanations that translate model outputs into intuitive visualizations, making feature importance accessible to users without technical backgrounds.
The remainder of this paper is organized as follows: Section 2 reviews related literature on recruitment technology, explainable AI, and data aggregation. Section 3 describes our methodology for data collection, model development, and evaluation. Section 4 presents performance results and feature importance analysis. Section 5 discusses theoretical implications, comparisons with prior work, and study limitations. Section 6 presents the conclusions of the study.
2. Literature Review
2.1. Data Aggregation in Candidate Sourcing
As outlined in Section 1, data fragmentation across professional platforms remains a persistent barrier to efficient candidate sourcing. Several commercial and academic solutions have attempted to address this challenge.
Platforms such as SeekOut and Hiretual aggregate data from LinkedIn, GitHub, and Indeed to create unified candidate profiles. However, standardization remains a challenge, as data formats vary across sources, leading to inconsistencies in fields such as education levels and certifications. Recruiter perception studies confirm that LinkedIn is the most dominant and widely used platform for IT talent sourcing. Nevertheless, practitioners rely on multiple candidate job boards and frequently report issues with high subscription costs and incomplete candidate profiles, which hinder effective use of these platforms [13]. Data aggregation APIs address this by providing structured, normalized data from public web sources. Coresignal, for instance, provides access to public professional candidate profiles including experience history, skills, education, and certifications from major job portals worldwide, boasting more than 20 employee data sources compared with Proxycurl’s (now known as Enrich Layer) four, and operates within major legal frameworks adhering to data privacy regulations such as the GDPR (General Data Protection Regulation), CCPA (California Consumer Privacy Act), and POPIA (South Africa’s Protection of Personal Information Act).
Web scraping, one of the common methods used to collect data, is an automatic technique for extracting data from web pages across multiple sources. While it is technically possible, there are many legal, technical, and ethical issues associated with web scraping. Mydyti and Ware [14] emphasize the ethical concerns associated with web scraping, noting that scraped data can be inconsistent and incomplete due to frequent website updates and that such methods may breach data privacy regulations. Professional APIs access only publicly available information that individuals have chosen to share on their profiles. This approach respects user privacy while enabling more efficient recruitment processes. However, literature examining the integration of such APIs into ML-based recruitment systems remains limited, representing a significant research gap that the present study directly addresses.
Prior research confirms the prevalence of manual, fragmented candidate sourcing workflows. Bogers and Kaya [4] examined how recruiters manually find candidate data across various job portals for headhunting, focusing on their information-seeking behavior. However, their study does not propose any solutions for consolidating candidate data across multiple job portals. Kumar et al. [15] combined web scraping and crawling methods to collect job data and developed a hybrid recommendation system combining content-based and collaborative filtering to recommend jobs to candidates. However, their system does not aggregate candidate data for headhunting purposes. Moreover, the web scraping methodology they employed raises the legal, technical, and ethical concerns discussed earlier. More recently, Frazzetto et al. [16] proposed a pipeline combining Large Language Models and graph neural networks to extract and represent candidate attributes from CV text as multimodal embeddings for job matching. While this approach advances the sophistication of candidate profile processing, it similarly relies on single-source CV inputs rather than aggregating candidate data across multiple job portals, leaving the multi-platform consolidation challenge unaddressed. Smelyakov et al. [17] employed ML to predict hire or no-hire outcomes but did not address multi-portal data consolidation. The broader AI recruitment literature highlights persistent operational challenges, including data fragmentation across job portals. Mori et al. [18], in their systematic literature review, further emphasize that the integration of AI in recruiting and selection is fundamentally a matter of ethics, requiring careful attention to fairness, justice, and rights-based concerns alongside any efficiency improvements. Similarly, Mashayekhi et al. [19], in their comprehensive challenge-based survey of e-recruitment recommendation systems, confirm that data quality and multi-source integration remain among the most persistent challenges in the field. These studies collectively confirm that data aggregation for proactive headhunting remains an underexplored problem in the academic literature.
2.2. Machine Learning in Recruitment
Although consolidated candidate data addresses the issue of fragmentation, effective candidate–job matching still requires advanced machine learning (ML) techniques. ML applications in recruitment have expanded significantly over the past decade. Early systems focused primarily on résumé parsing and simple keyword matching, whereas modern approaches leverage natural language processing (NLP) and embedding techniques to capture semantic similarities between candidate profiles and job descriptions [8]. Applications include résumé screening, candidate matching, and predictive analytics for hire success. A systematic review of 120 articles found that AI-enabled recruitment enhances efficiency, reduces transactional work, and improves candidate–job matching accuracy [18]. Tambe et al. [6] note that while AI holds considerable promise in HR contexts, significant challenges remain around data quality, accountability, and fairness, motivating the need for transparent and interpretable approaches. Campion and Campion [20] further argue that machine learning is poised to reshape personnel selection as profoundly as equal employment opportunity laws did decades ago. They stress the importance of thoroughly understanding both the capabilities and limitations of these tools for responsible and effective adoption.
TF-IDF (Term Frequency–Inverse Document Frequency) remains a widely used technique for text representation in recruitment contexts because it effectively captures important terms while downweighting common words that provide little discriminative value. Several studies have demonstrated TF-IDF’s effectiveness for candidate–job matching. Ajjam and Al-Raweshidy [21] applied TF-IDF vectorization with cosine similarity for job–candidate matching in a real-time recruitment application and reported improved alignment over keyword-based methods, but their approach did not incorporate regression models to predict similarity scores or provide explanations for the rankings produced. Datto et al. [22] similarly applied TF-IDF with cosine similarity for résumé-job matching in Industry 4.0 recruitment systems, demonstrating effectiveness for text-based candidate assessment, but likewise did not address explainability or multi-platform data sourcing. Deshmukh and Raut [23] applied BERT-based (Bidirectional Encoder Representations from Transformers) NLP for automated résumé screening and candidate ranking, demonstrating strong performance on semantic similarity tasks, though this deep learning approach introduces opacity challenges that limit practitioner accessibility. Pessach et al. [24] demonstrated that ML approaches using interpretable models can predict successful job placements at pre-hire stages while maintaining transparency for HR practitioners, supporting the value of interpretability-first model design.
Regression models offer advantages over simple similarity scores by learning weighted relationships between features and match quality. Ridge regression, which applies L2 regularization to linear regression, is particularly effective for high-dimensional data such as TF-IDF feature vectors, preventing overfitting by penalizing large coefficient values [25]. Ensemble methods such as Gradient Boosting [26] and Random Forest [27] have also demonstrated strong performance in various prediction tasks, though their comparative performance for TF-IDF-based candidate matching with rigorous statistical validation remains underexplored in the existing literature. However, algorithmic bias remains a significant concern. A comprehensive review identified that ML hiring systems can perpetuate discrimination based on gender, race, and other protected characteristics when trained on biased historical data [28]. The well-documented case of an abandoned recruiting tool that systematically penalized candidates for technical roles based on gender illustrates these risks [29], further motivating the use of explainable and auditable ML approaches.
2.3. Explainable AI in Recruitment
For clarity, explainable ML refers to understanding how a specific ML model reaches its predictions, while Explainable AI (XAI) is the broader, more formal approach concerned with why any AI system made a particular decision in human-understandable terms. As noted in Section 1, opacity in ML decision-making is particularly problematic in high-stakes recruitment, where trust, fairness, and regulatory compliance are paramount. The EU AI Act classifies recruitment AI systems as “high-risk”, mandating transparency and human oversight [30], reinforcing the need for accessible XAI approaches for non-technical practitioners.
XAI methods generate explanations by quantifying feature contributions to a model’s output, either globally (across all predictions) or locally (for individual predictions), decomposing predictions into feature-level attributions so that stakeholders can trace decisions back to specific inputs. Research on human explanation preferences indicates that people favor contrastive explanations (“why this rather than that?”) and seek causes that are actionable and relevant to their goals [31], suggesting that effective recruitment explanations should highlight differentiating features between candidates and connect attributions to job-relevant criteria. Common XAI approaches include:
- Perturbation-based methods (e.g., LIME): These approximate a complex model locally by training a simpler, interpretable surrogate model on perturbed inputs around a specific prediction [32]. Formally, LIME solves the following optimization problem [32,33]:
- Game-theoretic methods (e.g., SHAP): These use Shapley values from cooperative game theory to fairly allocate feature contributions, ensuring mathematically consistent explanations [34]. Formally, the Shapley value for feature is defined as [34,35]:
Despite their theoretical strengths, both methods present usability challenges: LIME’s local approximations can be unstable, and Kaur et al. [36] found that even data scientists frequently misuse SHAP outputs, exhibiting an “illusion of explanatory depth.” Miller [37] argues that effective explanations must align with natural causal reasoning, underscoring the need for more accessible tools.
The Python library Shapash (v2.0.0) [38] functions as a visualization and accessibility wrapper built on top of SHAP and LIME as its computational backends, rather than constituting an independent XAI method. It generates interactive dashboards that translate complex feature attributions into intuitive rankings and contribution scores, addressing the usability limitations above. Research confirms that interactive visual analytics significantly improve comprehension over static alternatives [39,40]. Compared with raw SHAP or LIME outputs, Shapash offers key advantages for non-technical recruitment practitioners: enhanced accessibility through web-based dashboards and simplified reports; comprehensive contribution plots and feature importance graphs; scalability for large candidate pools via batch processing; mathematically consistent attributions inherited from SHAP’s Shapley values; and exportable HTML reports and APIs for integration into recruitment workflows.
In recruitment XAI research, Magham [41] acknowledged interpretability challenges for non-technical users when applying SHAP and LIME to hiring models; Delecraz et al. [42] used SHAP for bias detection in résumé screening; Hofeditz et al. [12] demonstrated experimentally that XAI moderates AI-based hiring recommendations; Fabris et al. [43] identified bias sources across the algorithmic hiring pipeline; and Alsubaie and Aleisa [44] showed that SHAP-based glass-box frameworks can uncover disproportionate contributions of demographic features in hiring systems. While this body of work has extended XAI applications in HR, to the authors’ knowledge, no prior study has combined a Shapash-based explainability layer with API-aggregated candidate matching designed specifically for non-technical practitioners in a headhunting context.
Beretta et al. [11] underscore that recruitment ML models must be both accurate and explainable. However, most studies in this domain either (i) omit XAI techniques [4,7,15,17], (ii) report cosine similarity without explaining ranking factors [21], or (iii) apply only SHAP or LIME without addressing non-technical usability [41,42]. Shapash’s combination of accessibility, visualization, scalability, consistency, and deployment readiness makes it uniquely suited for this framework, bridging the gap between advanced ML and practical headhunting for non-technical recruiters.
2.4. Research Gap and Contributions
The preceding subsections reveal three interconnected gaps. First, while data fragmentation is acknowledged as a major recruitment challenge [4,13], limited research has demonstrated solutions that integrate professional aggregation APIs with ML-based matching systems specifically for headhunting purposes. Second, comparative evaluations of regression models (particularly Ridge versus ensemble methods) for TF-IDF-based candidate matching with rigorous statistical validation are absent from existing literature. Third, although XAI’s importance in recruitment is increasingly recognized, with recent studies demonstrating meaningful applied advances [11,12,43], most studies either omit explainability entirely or employ technically complex methods such as raw SHAP and LIME outputs without addressing accessibility for non-technical recruitment practitioners. Table 1 situates the present study within the broader landscape of related work, comparing prior studies across five dimensions: data sourcing approach, ML method, XAI technique employed, accessibility of explanations for non-technical users, and multi-portal candidate data aggregation. As the table illustrates, existing studies tend to address one or two of these dimensions in isolation, with advances in text-based matching [21,22], recruitment explainability [41,42,44], and candidate profile processing [16] each contributing meaningfully but remaining partial in scope. The literature has yet to demonstrate a unified framework that combines professional API-based multi-portal aggregation, rigorous model comparison, and an explainability layer designed for recruiter accessibility, which is the integration that the present study proposes.
Table 1.
Comparison of Related AI Recruitment Studies.
This study bridges these gaps by:
- Demonstrating Coresignal API integration for consolidated candidate data access across multiple job portals;
- Conducting rigorous comparative evaluation of Ridge regression, Gradient Boosting, and Random Forest for TF-IDF-based matching with full statistical validation;
- Implementing Shapash-based explainability designed for recruiter accessibility, advancing practical XAI applications in recruitment.
These contributions position our work at the intersection of data aggregation, interpretable machine learning, and accessible AI explainability, an integration not previously addressed in recruitment literature.
3. Methodology
3.1. Study Design and Data Collection
This study employed a quantitative research design to develop and evaluate an ML-based candidate–job matching system. The research proceeded in four phases: (i) data collection via API integration, (ii) data preprocessing and feature engineering, (iii) model development and training, and (iv) performance evaluation with explainability analysis. A web-based user interface was also developed to facilitate practical deployment.
3.1.1. Selection of Data Source and API Evaluation
Mydyti and Ware [14] emphasize ethical issues such as breaches of data privacy regulations and discrepancies that may arise with web scraping, particularly when obtaining sensitive data. They further highlight that scraped data can be inconsistent and incomplete due to frequent website updates, leading to errors and outdated information. In the present work, we leverage professional data aggregation APIs that provide access to publicly available employee data from multiple job portals, including experience history, skills, education, and certifications, ensuring that the data is current and relevant.
This methodology addresses the need for ethical consolidated candidate data sources that enhance the efficiency and scalability of candidate searches. We evaluated two official employee data aggregation APIs, Coresignal and Proxycurl (now called Enrich Layer). These APIs provide access to real-world, consolidated, and publicly available employee data across the globe from multiple job portals such as LinkedIn, Glassdoor, GitHub, and Indeed. Crucially, these APIs adhere to data privacy regulations such as the GDPR, CCPA, and POPIA, offering a legally compliant alternative to manual scraping. While such APIs require paid subscriptions, they offer free trials with sufficient data access for research purposes, making them viable for this study.
After a comparative analysis of employee data coverage between the two APIs, Coresignal (https://coresignal.com, accessed on 12 January 2026) was selected as the data source for this study for its broader coverage of job portals, better reflecting the multiple job portal searches employed by recruiters in practice. Coresignal boasts more than 20 employee data sources compared with Proxycurl’s four.
3.1.2. Job Description Development
To enable controlled evaluation of feature–job requirement alignment, a standardized Data Scientist job description was developed based on systematic analysis of authentic job postings. Ten Data Scientist job descriptions were collected from South African companies posted on LinkedIn and Indeed between 20 and 22 February 2026, spanning organizations across the financial services, retail, healthcare, technology, and education sectors. Analysis revealed the following requirement frequencies:
- Python (100% of postings);
- SQL (100%);
- Statistical Analysis (100%);
- Machine Learning (90%);
- Data Visualization (70%);
- Cloud Platforms, specifically AWS and/or Azure (60%).
A bachelor’s degree was the stated minimum qualification in 60% of postings, with a master’s degree specified or strongly preferred in 40% of postings. Preferred fields of study included Statistics, Mathematics, Data Science, and Computer Science. Regarding experience, 5+ years was the most frequently specified minimum requirement, with an average minimum of 4.9 years across all postings and 60% of postings explicitly targeting senior-level candidates. These common elements were synthesized into a standardized job description incorporating required skills, education, and experience levels representative of the South African Data Scientist market:
- Required Skills: Python, SQL, Machine Learning, Statistical Analysis, Cloud Platforms (AWS and/or Azure), Data Visualization;
- Required Education: Master’s degree in Computer Science, Statistics, Mathematics, Data Science, or a related quantitative field;
- Required Experience: 5+ years in a data science or analytical role, with at least 2 years at senior or lead level.
The full synthesized job description used for model training and evaluation is provided in Appendix A.
3.1.3. Data Collection
Candidate data was retrieved through the Coresignal Career Data API, which aggregates publicly available professional profile data from multiple job portals. Coresignal exclusively collects data that individuals have themselves disclosed publicly for professional purposes, and no personally identifiable information, such as names or email addresses, was retained in the analysis dataset.
The dataset comprised N = 587 candidate profiles targeting Data Scientist positions in South Africa. This geographic and occupational focus was determined by three factors: (i) Coresignal API data availability and coverage depth for the South African market, (ii) the need for a coherent professional sample with comparable backgrounds, and (iii) Data Scientist being a well-defined role with clear skill requirements, facilitating controlled evaluation. The methodology is generalizable and can be applied to other job titles and geographic locations.
Profiles were retrieved using the Coresignal employee search endpoint (/cdapi/v1/professional_network/employee/search/es_dsl). Queries were structured using Elasticsearch DSL (Domain-Specific Language) format, targeting professional profiles within the platform’s employee index. The search payload was configured with two primary parameters: a nested job title match querying for “Data Scientist” against candidates’ career history, ensuring only profiles with explicit Data Scientist experience were returned, and a country-level geographic filter set to “South Africa”. A maximum retrieval cap of 587 records was applied. Figure 1 displays an example of the constructed payload. For each matching employee ID returned by the search endpoint, a subsequent collect request was made to the profile retrieval endpoint (/cdapi/v1/professional_network/employee/collect/) to fetch the complete candidate profile, with the API returning responses in JSON (JavaScript Object Notation) format.
Figure 1.
JSON payload structure for retrieving candidates with Data Scientist job titles located in South Africa from the Coresignal API.
Subsequently, a request was sent to the Coresignal API using the payload represented in Figure 1. Figure 2 shows an example of the raw JSON response from the Coresignal API.
Figure 2.
Sample raw JSON response from the Coresignal API, illustrating a candidate’s profile with details on experience, education, skills, and certifications.
The raw JSON responses were then processed to convert nested, unstructured data into a tabular format suitable for machine learning model training. Data cleaning steps included JSON parsing and flattening of nested structures, handling of missing values and data inconsistencies, and standardization of field formats and naming conventions. Ten features were extracted from each candidate profile: professional headline/title, industry, job roles held, companies worked at, total years of experience, educational institutions attended, qualifications obtained, skills, certifications, and projects. Text fields were concatenated to construct a comprehensive candidate profile document suitable for natural language processing. The final dataset of 10 features is represented in Table 2.
Table 2.
Features of candidate profile data from the Coresignal API.
3.2. User Interface Development
As an additional contribution of this work, a web-based user interface (UI) was developed using Streamlit to demonstrate how the Coresignal data aggregation API can power a unified candidate search platform. The UI serves as a proof-of-concept that enables recruiters to search and rank candidates through a single interface, potentially eliminating the need to manually navigate multiple job portals.
Streamlit is an open-source Python framework designed for the rapid development and sharing of data science and machine learning applications. The interface integrates with the Coresignal API to retrieve candidate profiles matching specified search criteria from various job portals. Users can input search parameters such as job titles, skills, educational institutions, certifications, and geographic locations, along with a job description. The system then ranks the retrieved candidates based on predicted similarity scores, which reflect the alignment between each candidate’s professional profile and the job description.
Importantly, the candidate data retrieved via Coresignal consists solely of publicly available professional profile information that candidates have voluntarily shared on job portals. It does not indicate whether a candidate is actively interested in the target position. Therefore, the match scores should be interpreted as measures of profile-to-job alignment rather than indicators of candidate intent.
This UI was not evaluated through a formal user study with recruiters. It is presented solely to demonstrate the technical feasibility of a consolidated, ML-powered candidate search environment built on aggregated professional profile data. Future work should include a structured user study with practicing recruiters to assess its practical utility and integration into real-world recruitment workflows. Figure 3 shows an example of the user interface developed in this study.
Figure 3.
Consolidated candidate search and job matching user interface.
3.3. Data Preprocessing and Feature Engineering
3.3.1. Text Processing
The Natural Language Toolkit (NLTK) and scikit-learn libraries were used to apply Natural Language Processing (NLP) techniques to job descriptions and candidate profiles. Text preprocessing comprised:
- Text extraction: Consolidated all textual fields (skills, experience descriptions, education, certifications) into unified profile texts;
- Lowercasing: Converted all text to lowercase for case-insensitive matching;
- Punctuation removal: Removed special characters while preserving spaces between words;
- Stopwords removal: Filtered common English stopwords (e.g., “the”, “and”, “is”);
- Tokenization: Split texts into individual word tokens.
An example of the before and after transformation is provided as:
- Raw text: “Experienced Senior Data Scientist with Python, Machine Learning & AWS”;
- Transformed text: “experienced senior data scientist python machine learning aws”.
3.3.2. TF-IDF Vectorization
TF-IDF (Term Frequency–Inverse Document Frequency) was applied to convert the concatenated candidate profile text into numerical feature vectors. The combined TF-IDF score for a term t in a document d is defined as [45]:
where TF(t, d) is the term frequency, defined as the number of times term t appears in document d divided by the total number of terms in d; IDF(t) is the inverse document frequency, defined as the log of the total number of documents divided by the number of documents containing term t; and t and d represent a term and a document respectively. More precisely, the smoothed IDF formula is defined as [46]:
where N is the total number of documents in the corpus and df(t) is the number of documents containing term t. The additive smoothing factor prevents zero-division when a term appears in all documents, and the +1 offset ensures all IDF values remain positive.
TF-IDF(t, d) = TF(t, d) × IDF(t),
IDF(t) = log((1 + N)/(1 + df(t))) + 1,
This weighting scheme emphasizes terms that are frequent within individual profiles but rare across the corpus, thereby capturing distinctive candidate characteristics while suppressing uninformative high-frequency terms. The vectorizer was configured with the following parameters:
- max_features = 230, retaining only the top 230 terms by corpus-wide frequency;
- min_df = 2, excluding terms appearing in fewer than two documents;
- max_df = 0.75, excluding terms appearing in more than 75% of documents to remove near-universal terms;
- ngram_range = (1, 3), capturing unigrams, bigrams, and trigrams to preserve multi-word technical phrases such as “senior data scientist”, “machine learning”, and “data science”.
This configuration balanced dimensionality reduction with information retention, producing a 230-dimensional feature vector for each candidate profile [46].
3.3.3. Similarity Score Calculation
Cosine similarity was used to quantify the degree of alignment between candidate profiles and the job description. This metric computes the cosine of the angle between two vector representations in the TF-IDF feature space, providing a scale-invariant measure of textual similarity that is robust to differences in document length. Cosine similarity was calculated between the TF-IDF feature vectors of each candidate profile and the job description using the cosine similarity function from the scikit-learn library [46], calculated as:
where A represents the TF-IDF vector of the job description and B represents the TF-IDF vector of a candidate profile, A · B denotes their dot product, and ‖A‖ and ‖B‖ denote their respective Euclidean norms.
cosine_similarity(A, B) = (A · B) ÷ (‖A‖ × ‖B‖),
Although cosine similarity theoretically ranges from −1 to 1, TF-IDF vectors contain only non-negative term weights, which constrains the resulting similarity scores to the [0, 1] interval. A score of 0 indicates no term overlap between the two documents, while a score of 1 indicates identical term distributions. This score served as the primary target variable for machine learning model training, with higher scores reflecting stronger alignment between candidate attributes and job requirements. Candidates were subsequently ranked in descending order of similarity score, with the highest-scoring profiles considered most suitable for the role.
Cosine similarity was chosen as the regression target rather than direct similarity ranking or learning-to-rank approaches for two reasons. First, regression on continuous similarity scores preserves fine-grained distinctions between candidates that ordinal ranking would discard. Second, the regression framework enables the integration of non-text features such as total years of experience alongside TF-IDF features, allowing the model to learn weighted relationships between heterogeneous feature types and match quality, which pure cosine similarity alone cannot capture.
3.3.4. Feature Engineering
A numerical feature representing a candidate’s total years of professional experience was derived. To calculate this feature, the candidate’s earliest recorded employment start date was subtracted from the current year (as determined by the Coresignal API). Edge cases were handled as follows: ongoing positions (where date_to was null) were treated as current employment using the data retrieval date; candidates with missing start dates were assigned a total experience of zero; and overlapping roles were not double-counted, as the calculation used only the earliest start date and the latest end date to determine career span. This provides a measure of a candidate’s professional career longevity and can be useful for ML modeling. One of the regression models used in our study, Ridge Regression, requires normalization of numerical features because it uses L2 regularization, which applies a penalty to feature coefficients that are sensitive to the scale of the features [25]. Three transformation approaches were evaluated: Standard Scaler (z-score normalization), Robust Scaler (median and interquartile range-based scaling), and the Natural Logarithm transformation. Performance comparison guided the selection of the optimal transformation method. Their mathematical formulations are represented in Equations (7)–(9).
Standard Scaler [46]:
where is the mean and is the standard deviation of the feature X (Years of experience).
Robust Scaler [46]:
where is the median (50th percentile) and is the interquartile range (IQR) of the feature X.
Natural Logarithm Transformation:
where is the natural logarithm.
Additionally, a new feature, Candidate_Profile, was created by concatenating all other text columns, such as professional headline, industry, roles, companies worked at, educational institutions, skills, certifications, and projects, to form a comprehensive candidate profile. This aggregated text serves as a corpus for creating independent TF-IDF features for training ML models. Table 3 displays a snapshot of the cleaned data after feature engineering, text normalization, lowercasing, removal of stop words, and special characters.
Table 3.
Sample of the cleaned candidate data after preprocessing.
3.4. Machine Learning Model Development
Since the target variable (similarity score) is continuous, this problem is framed as regression. Three regression algorithms were evaluated for predicting candidate–job similarity: Ridge Regression, Gradient Boosting Regressor, and Random Forest Regressor. These models were selected to represent distinct modeling approaches with varying interpretability characteristics: a linear regularized approach (Ridge), a boosted ensemble (Gradient Boosting), and a bagged ensemble (Random Forest). They were trained on TF-IDF feature vectors derived from candidate profiles and job descriptions, along with the numerical years-of-experience feature. Candidates with higher predicted similarity scores were ranked highest and considered the most ideal for the role.
Although the target variable is bounded within [0, 1], standard regression models were deemed appropriate for this setting because the observed similarity scores were concentrated well within the interior of the interval (mean = 0.166, SD = 0.098), with no values at or near the boundary extremes of 0 or 1. Under these conditions, boundary violations in predictions are unlikely, and Ridge Regression’s L2 regularization further constrains coefficient magnitudes, reducing the risk of out-of-range predictions. Post-hoc inspection confirmed that all predicted values fell within the valid [0, 1] range across all cross-validation folds.
To ensure methodological rigor and prevent data leakage, the TF-IDF vectorizer was fitted exclusively on the training data prior to its application to the test set. This critical preprocessing step prevents the test set from influencing the vocabulary and feature statistics used in model development, which would artificially inflate performance estimations. Specifically, the 230 most frequent terms with TF-IDF weighting were extracted from training documents only, using unigrams, bigrams, and trigrams (ngram_range = (1, 3)) with English stopwords removal. These learned features were then applied without modification to transform the test set. The standardization procedure follows the same principle: scaling parameters (mean and standard deviation) were computed from training data only, then applied to transform the test set. This procedural approach ensures that model performance metrics genuinely reflect generalization capability rather than memorization of patterns present across the entire corpus.
To ensure complete reproducibility of all computational results, random seeds were systematically fixed at 42 throughout the pipeline at all stages where stochasticity could occur. The train-test split at a 70/30 ratio was performed with random_state = 42 to ensure identical data partitioning across independent runs. All regression models, Ridge, Random Forest, and Gradient Boosting, were initialized with random_state = 42 to control model-level randomness during parameter initialization and internal sampling. The 5-fold stratified cross-validation employed random_state = 42 to ensure identical fold assignments across runs, with stratification performed jointly by experience level and education level to maintain representative distributions. Bootstrap sampling for confidence interval estimation used random_state = 42 with N = 1000 permutations. This comprehensive seeding strategy guarantees that all results can be reproduced in future reimplementation.
All regression models were trained using default scikit-learn parameters. This choice prioritizes interpretability and reproducibility, aligning with the goal of building transparent, accessible tools for recruiters. Ridge Regression was configured with the following parameters:
- α = 1.0;
- solver = ‘auto’;
- fit_intercept = True;
- max_iter = 10,000;
- random_state = 42.
The α = 1.0 value represents the default scikit-learn value that balances model complexity and fit without aggressive penalization. The solver was set to ‘auto’ to allow scikit-learn to select the most efficient computational method, fit_intercept was True to include an intercept term, and max_iterations was set to 10,000 to ensure convergence for the 230-dimensional TF-IDF feature space. Ridge regression with α = 1.0 is a widely established default for text-based regression tasks and provides interpretable L2 regularization penalty without requiring extensive parameter tuning.
Random Forest Regressor was configured with the following parameters:
- n_estimators = 100;
- max_depth = None;
- min_samples_split = 2;
- min_samples_leaf = 1;
- max_features = None;
- random_state = 42.
The 100 base learner trees represent a standard ensemble size that balances predictive accuracy and computational cost. Maximum tree depth was set to None, allowing the algorithm to grow trees as deep as needed to fit the training data without artificial constraints. Minimum samples for splitting and minimum leaf samples were set to default values to permit fine-grained tree structure. The max_features parameter was set to None, allowing the algorithm to consider all available features at each split decision.
Gradient Boosting Regressor was configured with the following parameters:
- n_estimators = 100;
- learning_rate = 0.1;
- max_depth = 3;
- min_samples_split = 2;
- min_samples_leaf = 1;
- subsample = 1.0;
- random_state = 42.
The 100 boosting stages represent sequentially-trained shallow decision trees. The learning_rate parameter was set to 0.1, a moderate shrinkage parameter that controls the contribution of each boosting stage and provides measured adaptation per iteration. Maximum tree depth was constrained to 3, ensuring shallow individual trees that reduce overfitting risk while maintaining sufficient expressiveness to capture non-linear patterns. Minimum samples for splitting and subsampling were set to defaults (2 and 1.0, respectively).
The linear Ridge Regression model was chosen as one of the models in this study for its ability to handle regularization and prevent overfitting in high-dimensional data such as candidate–job TF-IDF feature vectors, while ensemble methods (Random Forest and Gradient Boosting Regressors) were selected for their robustness in capturing non-linear relationships and feature interactions [47,48,49,50,51,52]. Their mathematical foundations are outlined in Equations (10)–(12).
3.4.1. Ridge Regression
Ridge Regression uses the L2 regularization term to minimize the residual sum of squares (RSS). Its objective function is represented in Equation (10):
where is the observed similarity score, is the predicted score, is the feature vector, are the coefficients, is the regularization parameter, and is the number of features.
3.4.2. Gradient Boosting Regressor
Gradient Boosting Regressor builds a sequence of decision trees, each correcting the residuals of its predecessor, to minimize a loss function such as the mean squared error. Its update rule is represented in Equation (11):
where is the model at iteration , is the new tree, is the learning rate, and is the feature vector.
3.4.3. Random Forest Regressor
Random Forest Regressor builds multiple decision trees using bootstrap samples to make predictions. The prediction is the average of individual tree outputs represented in Equation (12):
where represents the predicted similarity score, is the number of trees, X is the feature vector, and is the prediction of the -th tree.
3.5. Model Evaluation and Statistical Analysis
3.5.1. Baseline Establishment: Cosine Similarity
Before applying machine learning regression models, a non-parametric baseline was established using pure TF-IDF-based cosine similarity to provide a performance reference point. For this baseline approach, each test candidate’s TF-IDF feature representation was compared with all training candidates’ representations using cosine similarity, and the mean similarity score across the entire training set was used as the predicted job-fit score for all test samples. This baseline required no model training and no hyperparameter tuning—it served purely as an unsupervised heuristic representing what raw text similarity matching alone could achieve without leveraging supervised learning signals from labelled candidate–job pairs.
3.5.2. Cross-Validation Procedure
Stratified 5-fold cross-validation was employed to assess model performance robustly. The dataset (N = 587) was partitioned such that each fold maintained representative distributions across experience levels (entry-level (0–2 years), mid-level (3–5 years), and senior-level (6+ years)), as well as education levels. Each fold comprised approximately 470 training profiles and 117 test profiles. K-fold cross-validation is a well-established validation strategy that balances bias and variance in model performance estimation; comparative analyses confirm that stratified K-fold cross-validation provides reliable performance estimates for both classification and regression tasks while avoiding the computational overhead of leave-one-out approaches [53,54].
3.5.3. Performance Evaluation Metrics
The root mean squared error (RMSE) and coefficient of determination (R2) were used to assess the performance of the models. RMSE was selected over mean absolute error (MAE) for model performance assessment because it penalizes larger errors more heavily due to its squared term, making it more sensitive to significant deviations in similarity score predictions, which are critical for ranking candidates accurately [55]. This is particularly important in recruitment, where large errors could result in high-value candidates being ranked incorrectly. RMSE is defined as:
where is the number of candidates, is the actual similarity score, and is the predicted similarity score.
The coefficient of determination R2 measures the proportion of variance in the target variable explained by the model, defined as:
where ȳ is the mean of the actual similarity scores.
R2 values closer to 1 indicate stronger predictive accuracy, meaning the model’s predictions closely track the actual similarity scores. Values at or below 0 indicate that the model performs no better than predicting the mean. For non-linear models such as Gradient Boosting and Random Forest, R2 is interpreted as a goodness-of-fit measure rather than a strict proportion of variance explained, since the decomposition SST = SSE + SSR holds exactly only for ordinary least squares regression. Higher R2 and lower RMSE indicate better model performance.
3.5.4. Statistical Significance Tests
To rigorously compare model performance, paired t-tests were conducted on the cross-validated R2 scores across all five folds [56]. Paired t-tests are appropriate in this context because each model was evaluated on identical data folds, producing dependent samples. The following procedure was applied to each pair of models:
- R2 scores were recorded for each of the five folds for both models under comparison, and the fold-wise differences in R2 were computed;
- A paired t-test was performed on these differences, with the test statistic defined as , where is the mean of the fold-wise differences and , with SDd denoting the standard deviation of the differences and = 5 the number of folds;
- A Bonferroni correction was applied to account for multiple comparisons across three pairwise model combinations (Ridge vs. Gradient Boosting, Ridge vs. Random Forest, and Gradient Boosting vs. Random Forest), yielding an adjusted significance threshold of ;
- Effect sizes were calculated using Cohen’s d to quantify the practical magnitude of performance differences between models: , where .
Effect sizes were interpreted according to conventional benchmarks: small (d = 0.2), medium (d = 0.5), and large (d = 0.8) [57].
3.5.5. Confidence Intervals
Ninety-five percent confidence intervals for R2 were computed using bootstrapping to quantify uncertainty in model performance estimates. For each model, the following procedure was applied:
- Test predictions were resampled with replacement over 1000 bootstrap iterations;
- Corresponding true similarity scores were retained for each resampled set;
- R2 was calculated for each bootstrap sample;
- The 2.5th and 97.5th percentiles of the resulting bootstrap distribution were taken as the lower and upper confidence interval bounds respectively.
3.6. Explainability Analysis with Shapash
To provide interpretable insights accessible to non-technical recruiters, we integrated Shapash [38] for feature importance visualization and explanation generation.
3.6.1. Shapash Implementation
Shapash was applied to the best-performing model (Ridge Regression) to perform feature importance analysis and generate model explanations. The implementation involved: (i) integrating the trained Ridge model into the Shapash framework, (ii) computing global feature importance scores, (iii) generating individual candidate prediction explanations, and (iv) creating interactive dashboards and HTML reports shareable with non-technical users.
3.6.2. Feature Importance Interpretation
Shapash provides two levels of explanation. Global feature importance identifies features with the highest overall impact on predictions across all candidates, computed by averaging absolute feature contributions. Local feature contributions show which features increased or decreased a specific candidate’s similarity score. For example, a candidate’s profile might show:
- “machine learning”: +0.076 contribution (increases similarity);
- “data science”: +0.027 contribution (increases similarity);
- Absence of “python”: −0.009 contribution (decreases similarity).
3.6.3. Validation of Feature–Job Alignment
To validate that models learned meaningful feature–job relationships, the top-ranked features were assessed against the explicit requirements of the job description. The following procedure was applied:
- The top 10 features by global importance were extracted using Shapash;
- These features were compared against the explicit job requirements specified in the standardized job description, including Python, Machine Learning, and master’s degree, among others;
- A feature–job alignment percentage was computed as: Alignment (%) = (Number of matched features ÷ Total required features) × 100.
High alignment, defined as a score exceeding 80%, was taken as evidence that the model correctly identified job-relevant features rather than learning spurious correlations in the data.
3.7. Implementation and Software
All analyses were conducted using Python 3.11. The following libraries were used:
- Requests 2.32.5 for API integration;
- pandas 1.3.5 and nltk 3.6.7 for data preprocessing;
- scikit-learn 1.0.2 for TF-IDF vectorization and machine learning modelling;
- scipy 1.7.3 for statistical significance testing;
- shapash 2.0.0 for model explainability;
- matplotlib 3.5.1 and seaborn 0.11.2 for visualization.
Upon acceptance, the analysis code and anonymized datasets will be deposited in a public GitHub repository to enable replication of the methodology and results.
3.8. Ethical Considerations
This study used publicly accessible aggregated candidate profile data including skills, education, certification names, and professional experience compiled through a legitimate API service. No human participants were directly involved in this research, and no personally identifiable data was recorded, processed, or retained in the analysis dataset. The API used in this research, Coresignal, indicates that they collect only data that is publicly accessible and shared by individuals. Additionally, Coresignal underscores its commitment to major data privacy regulations, including compliance with GDPR, CCPA, and POPIA, and is a founding member of the Ethical Web Data Collection Initiative.
4. Results
4.1. Exploratory Data Analysis
An exploratory data analysis (EDA) was performed to gain key insights from the data and to inform both model design decisions and the interpretation of algorithmic outputs for recruiter decision-making. Figure 4 presents the distribution of professional experience among the 587 candidate profiles retrieved for Data Scientist-related roles in South Africa. Most candidates (78.2%, n = 459) fall into the senior (6+ years) category, followed by mid-level experience (3–5 years) at 14.3% (n = 84), and entry-level (0–2 years) at 7.5% (n = 44). This class imbalance informed the use of stratified sampling during cross-validation to ensure that model evaluation remained representative across all experience levels.
Figure 4.
Candidate experience level distribution.
Figure 5 illustrates the highest qualification level reported by the 587 candidates. A bachelor’s degree is the most common qualification (41.2%, n = 242), followed by a master’s degree (31.0%, n = 182) and a Ph.D. (9.4%, n = 55). The substantial representation of postgraduate qualifications (combined Master’s and Ph.D. = 40.4%) reflects the advanced analytical and technical demands of Data Scientist roles. The relatively high proportion of master’s degree holders (31.0%) is particularly noteworthy, as it aligns with the frequent requirement for advanced degrees observed in South African Data Science job postings. For model design, this distribution confirms sufficient variation in qualification levels within the TF-IDF feature representations, enabling the matching algorithm to differentiate candidates based on educational credentials.
Figure 5.
Candidate education level distribution.
Figure 6 displays the most frequently mentioned skills across the 587 candidate profiles. The most prevalent skill is Data Analysis, followed by Management, Programming, Business, and Research. Technical tools such as Python, SQL, and Microsoft Office also appear prominently. These results indicate that South African candidates in data-related roles possess a balanced mix of core technical competencies (data analysis, programming, SQL, Python) and transferable soft or business skills. This distribution informed the construction of the standardized job description (Section 3.1.2) and provides recruiters with a market-level view of skill availability, enabling them to calibrate expectations when defining shortlisting criteria.
Figure 6.
Top skills in candidate profiles.
The distribution of candidates’ years of experience displayed in Figure 7 is right-skewed, with a median and mean of 9.0 years and 10.2 years, respectively. Most candidates have between 5 and 10 years of professional work experience, with a few having over 20 years of experience. The right-skewed distribution of experience levels presents an interesting decision-making challenge for recruiters. With most candidates clustered between 5–10 years of experience, recruiters must rely on other distinguishing features to differentiate candidates. This right-skewed distribution also motivated the feature transformation analysis (Section 3.3.4 and Figure 8) to ensure that the years-of-experience variable did not disproportionately influence model predictions.
Figure 7.
Distribution of candidates’ years of professional experience before transformation. The blue line represents the kernel density estimate (KDE) of the distribution.
Figure 8.
Distribution of candidates’ years of professional work experience after transformation using (a) Standard Scaler, (b) Robust Scaler, and (c) Log Transformation.
The visualization in Figure 8 shows a comparison of different feature transformation methods explored as outlined in Section 3.3.4. One of the selected models in this study, Ridge Regression, applies L2 regularization, which is sensitive to feature scales. The StandardScaler method was selected as the most suitable transformation method because it normalized the data to have a mean of 0 and a standard deviation of 1, as shown in Figure 8a, which aligns with Ridge Regression that is sensitive to feature scales.
Figure 9 presents the distribution of candidate–job similarity scores stratified by the highest qualification level. Candidates holding a master’s degree exhibited the highest median similarity score to the Senior Data Scientist job description, followed by those with a Ph.D. and a bachelor’s degree. This pattern validates the effectiveness of the matching algorithm, as the standardized job description explicitly requires a master’s degree in computer science or a related field, and the model appropriately ranked candidates with a master’s degree as the strongest matches. This close alignment between algorithmic rankings and stated job requirements offers recruiters verifiable evidence that the model accurately interprets and prioritizes key job criteria.
Figure 9.
Distribution of candidate–job similarity scores stratified by qualification level.
The analysis of candidate years of professional experience in relation to job–candidate similarity scores (Figure 10) revealed a weak, statistically non-significant positive correlation (r = 0.066, p = 0.108), indicating that tenure alone is not a reliable predictor of candidate–job fit. The wide dispersion of scores across all experience levels suggests that skills, qualifications, and domain-specific expertise are substantially more predictive of alignment with the job description than years of experience. This finding validates the decision to weight TF-IDF features alongside experience rather than relying on experience as a primary predictor, and alerts recruiters that filtering candidates by tenure alone would miss qualified candidates.
Figure 10.
Relationship between years of professional experience and candidate–job similarity scores.
A multi-panel comparison of similarity scores for candidates possessing versus lacking each key skill explicitly mentioned in the job description is presented in Figure 11. The analysis reveals that candidates with the required skills consistently achieved higher similarity scores across all evaluated competencies. The most pronounced differences were observed for big data expertise, cloud platform experience, and machine learning, with Python and SQL skills also showing strong positive associations with similarity scores. By visualizing the skill-based differentiations, the figure offers recruiters transparent evidence of how the algorithm evaluates candidates. Rather than delivering an opaque overall score, the system enables recruiters to verify that highly ranked candidates possess the specific competencies required.
Figure 11.
Candidate–job similarity scores stratified by presence of key skills specified in the job description.
The relationship between the number of job-required skills possessed by candidates and their corresponding similarity scores is illustrated in Figure 12. The analysis reveals that candidates with zero matching skills showed the lowest median similarity, while those possessing three or more job-required skills achieved substantially higher scores. This pattern arises because TF-IDF cosine similarity is computed over the full vocabulary of job-required terms; candidates who possess more of the specified skills contribute more matching terms to the similarity calculation, yielding higher scores. Importantly, this figure does not indicate how many candidates match the position, which is a separate question of candidate pool size. Rather, it shows that for any individual candidate, possessing a greater number of the required skills results in a higher similarity score, reflecting stronger alignment with the job description at the profile level. This is the expected and desirable behavior of a matching system: candidates whose profiles cover more of the stated requirements should be ranked higher than those who meet only a subset. Rather than treating similarity scores as abstract numbers, recruiters can use this visualization to understand that higher scores reflect candidates with more comprehensive coverage of job requirements, supporting transparent and evidence-based shortlisting decisions.
Figure 12.
Candidate–job similarity scores by cumulative number of job-required skills present in candidate profiles.
4.2. Model Performance Results
4.2.1. Baseline Performance: Cosine Similarity
The pure cosine similarity baseline yielded a mean cosine similarity of 0.0903 (SD = 0.0436), with individual predictions ranging from 0.0036 to 0.1609. When treating these heuristic predictions as naïve baseline predictions and comparing them to actual test similarity scores, the result was R2 = −0.5595 and RMSE = 0.1213. The negative R2 is methodologically expected and informative: it indicates that the baseline’s single-point prediction (approximately 0.0903 for all test samples) performs substantially worse than the null model of predicting the test set mean. This occurs because actual test scores are distributed across a wider range (typically 0.2–0.3) than the baseline’s fixed prediction. This finding demonstrates that unsupervised similarity matching alone is fundamentally insufficient for candidate–job matching. Importantly, this poor baseline demonstrates supervised learning’s value. Ridge Regression subsequently achieved a held-out test R2 = 0.930, representing a relative improvement of 266% over the baseline (absolute improvement: +1.4895 R2 points). This dramatic contrast demonstrates that supervised regression modelling, informed by labelled candidate–job pairs, substantially outperforms unsupervised similarity matching for predicting job-fit scores.
4.2.2. Model Performance on Held-Out Test Data
The data was split into 70% training (n = 411) and 30% test sets (n = 176) from a total of 587 candidate records, where the training set was used to fit each model and the test set was used to evaluate performance on unseen data. As shown in Figure 13, Ridge Regression achieved the highest test R2 of 0.930 and the lowest test RMSE of 0.026, outperforming Random Forest (test R2 = 0.722, RMSE = 0.051) and Gradient Boosting (test R2 = 0.822, RMSE = 0.041). Ridge Regression’s train R2 of 0.954 and test R2 of 0.930 are closely aligned, suggesting a well-fitted model without overfitting, attributable to the L2 regularization that penalizes large coefficients. By contrast, Random Forest exhibited a larger train-test gap (train R2 = 0.965 vs. test R2 = 0.722) and Gradient Boosting a more moderate gap (train R2 = 0.982 vs. test R2 = 0.822), indicating greater overfitting in these ensemble methods on this high-dimensional TF-IDF feature space. To confirm these findings beyond a single split, stratified 5-fold cross-validation was subsequently conducted, as reported in Section 4.2.3.
Figure 13.
Model performance comparison on held-out test data.
4.2.3. Model Cross-Validation Performance
Table 4 presents model performance metrics across stratified 5-fold cross-validation. Ridge Regression achieved the highest cross-validated mean R2 of 0.935 (SD = 0.018), with bootstrap resampling confirming a point estimate of 0.954 (95% CI [0.939, 0.965]) and the lowest mean RMSE of 0.025 (SD = 0.003), indicating superior and consistent performance in predicting candidate–job similarity scores across all five folds. Additionally, as illustrated in Figure 14, Ridge maintained stable R2 values ranging from 0.914 to 0.954 across folds, reflecting minimal sensitivity to data partitioning. Gradient Boosting achieved a cross-validated mean R2 of 0.840 (SD = 0.038), with bootstrap R2 of 0.885 (95% CI [0.846, 0.916]) and mean RMSE of 0.039 (SD = 0.003), while Random Forest achieved a cross-validated mean R2 of 0.733 (SD = 0.065), with bootstrap R2 of 0.805 (95% CI [0.746, 0.845]) and mean RMSE of 0.050 (SD = 0.004). The wider confidence intervals and higher standard deviations for Gradient Boosting and Random Forest indicate greater variability relative to Ridge Regression, suggesting these ensemble methods are more sensitive to the specific composition of training data. In practical recruitment terms, Ridge Regression’s cross-validated mean RMSE of 0.025 on a [0, 1] similarity scale means that predicted candidate rankings deviate from true rankings by approximately 2.5 percentage points on average, yielding stable candidate orderings that would potentially reduce the manual screening effort required by recruiters when evaluating shortlisted candidates.
Table 4.
Model performance metrics across 5-fold cross-validation.
Figure 14.
Per-fold R2 (a) and RMSE (b) across stratified 5-fold cross-validation for Ridge Regression, Gradient Boosting, and Random Forest.
4.2.4. Statistical Significance Testing
Paired t-tests were conducted to assess the statistical significance of performance differences between models (Table 5). After Bonferroni correction (adjusted α* = 0.017), all three pairwise comparisons remained statistically significant. Ridge Regression significantly outperformed Gradient Boosting (t(4) = 9.599, p = 0.0007, Cohen’s d = 3.165) and Random Forest (t(4) = 9.073, p = 0.0008, Cohen’s d = 4.205). Gradient Boosting also significantly outperformed Random Forest (t(4) = 8.569, p = 0.0010, Cohen’s d = 1.992). All effect sizes exceeded the conventional threshold for a large effect (d = 0.8), with Cohen’s d values ranging from 1.992 to 4.205, indicating that the performance differences between models are not only statistically significant but practically substantial. As illustrated in Figure 15, these results confirm that Ridge Regression provides robust, superior performance for TF-IDF-based candidate–job matching compared with both ensemble methods, reinforcing the suitability of regularized linear models for high-dimensional TF-IDF-based similarity prediction tasks in recruitment.
Table 5.
Pairwise statistical comparison of model performance.
Figure 15.
Paired t-test p-values (a) and Cohen’s d effect sizes (b) for pairwise model comparisons under Bonferroni correction (α* = 0.017).
4.3. Model Explainability and Feature Importance
After evaluating model performance, Shapash was applied to the Ridge Regression model to generate global and local feature importance. Global feature importance provides insights into the overall drivers of candidate rankings across the entire dataset, while local feature importance reveals which specific features influenced an individual candidate’s predicted similarity score.
Global Feature Importance
Analysis revealed strong alignment between the top-ranked features and the synthesized job description requirements (Table 6). Of the top 15 features, 14 (93%) corresponded directly to skills, education, fields of study, or experience level specified in the job description. Critical features included “engineering” and “data science” (joint rank 1–2), “machine learning” (rank 3), and “python” (rank 4), all explicitly required. Seniority signals were captured through “senior data” (rank 9) and “lead” (rank 8), while educational requirements were reflected by “master degree” (rank 13) and “bachelor degree” (rank 14). The single “Partial” alignment, “business” (rank 12), is classified as partial rather than full because the term does not appear as a named required skill, qualification, or experience criterion in the job description; however, it is directly traceable to the job description’s explicit requirement for “strategic business decision-making” and “stakeholder communication,” meaning the model identified a contextually relevant term that spans the boundary between technical and non-technical job requirements. This classification is internally consistent: “business” carries genuine job-fit signal but does not map to a discrete required skill the way “python,” “machine learning,” or “master degree” do. This high alignment validates that the model learned meaningful, job-relevant relationships from candidate profiles rather than spurious correlations.
Table 6.
Top features by global importance (ridge regression with Shapash).
4.4. Individual Candidate Explanations
Table 7 summarizes the Shapash-derived feature contributions for five candidates spanning all defined score ranges, from Very High (≥0.35) to Low (<0.10). This broader distribution demonstrates that the Shapash explanations are consistent and interpretable across the full spectrum of predicted similarity scores, not only for the highest-ranked candidates. For each candidate, the top positive contributors indicate which skills, qualifications, or experience signals drove the score upward toward the job requirements, while the top negative contributors reveal which critical requirements were absent or underweighted in the profile. This feature-level transparency enables recruiters to move beyond opaque numerical rankings and understand, for any candidate in the shortlist, precisely why they scored as they did, supporting more defensible, auditable, and bias-aware hiring decisions.
Table 7.
Summary of local feature contributions for five representative candidates.
The patterns evident in Table 7 reinforce several key findings. First, across all five predicted similarity score ranges, the negative contributors consistently include core Senior Data Scientist requirements, “data science,” “engineering,” “machine learning,” and “senior”, reflecting the mode’s stable understanding of the job requirements regardless of a candidate’s overall predicted similarity score. Second, the positive contributors differentiate candidates in a meaningful, role-relevant way: Candidate 148 (Very High) scores on cloud infrastructure terms (“aws,” “cloud”) and educational signals (“master”), while Candidate 83 (Low) scores on “engineering” and “mathematics” yet lacks the data science and seniority signals needed for the role. Third, the table reveals that even low-scoring candidates have detectable, explainable strengths. This provides insights for recruiter transparency, since it prevents the shortlisting process from appearing as a black box and allows recruiters to identify candidates who may be worth considering for adjacent or future roles. Together, these five examples demonstrate that the Shapash-based explanation layer produces consistent, human-interpretable output across the full candidate ranking, directly supporting transparent and evidence-based headhunting decisions.
4.5. Model Interpretability: Ridge Coefficients vs. Shapash Visualization
To assess whether Shapash adds interpretability value beyond Ridge regression’s inherent transparency, Figure 16 (Ridge coefficients) and Figure 17 (Shapash dashboard) are compared for the same set of job-relevant features, with global importance scores reported in Table 6. Ridge regression coefficients provide direct mathematical interpretability. As shown in Figure 16, “data science” (β = 0.171), “machine learning” (β = 0.169), “statistical” (β = 0.165), and “engineering” (β = 0.155) carry the highest coefficients, confirming the model correctly learned to weight job-relevant features. For example, a coefficient of β = 0.169 for “machine learning” indicates that each unit increase in the TF-IDF weight of this term in a candidate’s profile increases their predicted similarity score by 0.169, meaning a candidate who has machine learning will receive a meaningfully higher score than one who does not. However, for non-technical recruiters, several interpretation challenges arise:
Figure 16.
Ridge regression coefficients for the top 15 job-relevant features.
Figure 17.
Shapash’s interactive HTML report, showcasing dynamic feature exploration.
- TF-IDF scale: Coefficients are expressed on the TF-IDF scale, which is not intuitive; it is unclear whether β = 0.169 represents a large or small effect without understanding the underlying value distribution;
- Feature context: Coefficients alone do not indicate how a feature compares to others in terms of its actual impact on individual predictions;
- Individual predictions: Coefficients reflect global average effects and cannot explain why a specific candidate received a particular score.
As illustrated in Figure 17, Shapash addresses these limitations through an interactive dashboard that presents global feature importance, candidate clustering by explainability, feature contribution scatter plots, and individual local explanations, all in a single unified view accessible to non-technical users. Specifically, Shapash:
- Expresses contributions in the predicted similarity score scale: Rather than β values, Shapash reports candidate-specific contributions. For example, “machine learning” contributed +0.076 to Candidate 195’s predicted similarity score;
- Provides global and local views simultaneously: The dashboard’s feature importance panel (top left) mirrors the ranking in Table 6, while the local explanation panel (bottom right) drills into any individual candidate, as shown for Candidate 195;
- Supports non-technical decision-making: The clustering view groups candidates by explainability patterns, enabling recruiters to identify candidate segments without interpreting raw coefficients or SHAP mathematics.
While Ridge regression’s coefficients confirm the model has learned a mathematically sound weighting of job-relevant features, Shapash bridges the gap between mathematical transparency and practical usability for recruitment practitioners without machine learning backgrounds.
4.6. Summary of Key Findings
The results demonstrate four key findings:
- Stratified 5-fold cross-validation and bootstrap confidence intervals confirmed robust, generalizable performance, with Ridge maintaining stable R2 values ranging from 0.914 to 0.954 across all folds and a held-out test RMSE of 0.026, consistent with the cross-validated mean RMSE of 0.025;
- Ridge Regression significantly outperformed both ensemble methods for TF-IDF-based candidate–job matching (cross-validated R2 = 0.935, bootstrap R2 = 0.954, 95% CI [0.939, 0.965] vs. Gradient Boosting R2 = 0.840 and Random Forest R2 = 0.733), with all pairwise differences statistically significant after Bonferroni correction (all ps ≤ 0.001, Cohen’s d ≥ 1.992);
- Global feature importance analysis revealed strong alignment between the model’s top-ranked features and job description requirements (14/15 features, 93%), validating that the model learned meaningful job-relevant relationships rather than spurious correlations;
- Shapash enhances the practical usability of Ridge regression’s inherent interpretability by translating global coefficients into candidate-specific contribution scores, enabling non-technical recruiters to understand not just candidate rankings but the specific skills, qualifications, and experience gaps driving each score.
These findings support both technical contributions (superior model performance) and practical utility (accessible explainability) of our integrated approach.
5. Discussion
5.1. Principal Findings and Theoretical Implications
This study developed and evaluated an integrated system for transparent candidate–job matching in recruitment headhunting, addressing two critical challenges identified in the literature: data fragmentation across multiple job portals and algorithmic opacity in ML-based candidate ranking. The findings advance recruitment technology in three interconnected ways.
First, the integration of the Coresignal API demonstrated that professional data aggregation APIs, which aggregate publicly available profile data that individuals have chosen to share on professional platforms, can consolidate candidate information from multiple platforms into a unified interface, potentially eliminating repetitive manual searches. While commercial recruitment tools exist, academic literature has not previously documented the integration of such APIs with ML-based matching systems [4,18]. This implementation provides a methodological template for researchers and practitioners seeking to leverage professional data sources ethically and at scale.
Second, the comparative evaluation revealed that Ridge Regression significantly outperformed Gradient Boosting and Random Forest for TF-IDF-based candidate–job matching (cross-validated R2 = 0.935, bootstrap R2 = 0.954 vs. 0.885 and 0.805, respectively), with all pairwise differences statistically significant after Bonferroni correction (all ps ≤ 0.001, Cohen’s d ≥ 1.992). This finding challenges the common assumption that complex ensemble models necessarily provide superior accuracy and aligns with Rudin’s [58] advocacy for inherently interpretable models in high-stakes domains. The superiority of Ridge Regression is theoretically explicable. TF-IDF feature vectors produce high-dimensional but relatively sparse feature spaces where linear relationships often suffice for similarity assessment. L2 regularization prevents overfitting to noisy TF-IDF features, particularly important given that many terms carry limited discriminative signal. Tree-based ensembles, designed to capture complex feature interactions, introduce unnecessary complexity for this task, resulting in greater fold-to-fold variability as evidenced by the higher standard deviations observed for Gradient Boosting (SD = 0.038) and Random Forest (SD = 0.065) compared with Ridge (SD = 0.018).
Third, global feature importance analysis demonstrated strong alignment (93%, 14/15 features) between model-identified important features and explicit job description requirements. Features such as “engineering”, “data science”, “machine learning”, and “python” ranked highest in importance, precisely the skills and qualifications specified in the synthesized job description. This alignment provides face validity for the model’s learning process and directly addresses a critical concern in AI recruitment, whether algorithms learn legitimate job-relevant factors or spurious correlations [43].
5.2. Efficiency Gains Through Data Consolidation
5.2.1. Aggregation of Candidate Data
By aggregating candidate data from multiple platforms, recruiters can reduce the need for redundant searches and manual data compilation. In conventional practice, recruiters conduct similar searches repeatedly across LinkedIn, Indeed, Glassdoor, and other portals before manually consolidating results [4,13]. The Coresignal API integration demonstrated in this study streamlines this fragmented process by enabling a single structured query that retrieves standardized candidate profiles spanning skills, experience, qualifications, and certifications in a unified format, which are then surfaced through a consolidated web-based interface for recruiter review. This consolidation helps address the operational inefficiencies identified by Bogers and Kaya [4] and the multi-platform fragmentation challenges noted by Glenny Jocelyn and Judy Grace Nitta [13] and Mashayekhi et al. [19] as persistent barriers to effective AI-driven recruitment.
5.2.2. Transparent Algorithmic Decision Support
The integration of Shapash addresses a fundamental challenge in AI recruitment: building recruiter trust through transparency [11,12]. When recruiters receive candidate rankings, they can view not just predicted similarity scores but the specific features driving those scores. The individual candidate explanations presented in Section 4.4 illustrate this concretely. For Candidate 148 (score = 0.420), the explanation confirms that the high ranking is driven by genuine data science expertise, cloud skills, and a master’s qualification; for Candidate 98 (score = 0.234), it reveals partial alignment through data analyst experience but a clear gap in data science and machine learning signals; for Candidate 83 (score = 0.092), it exposes the presence of junior-level roles and the absence of machine learning and seniority indicators that actively penalize the score. This transparency enables several beneficial practices for recruiters:
- Verification: recruiters can confirm that rankings reflect actual job requirements rather than accepting opaque scores;
- Gap identification: for promising candidates with moderate scores, specific skill gaps can be identified and communicated directly;
- Bias detection: if irrelevant features such as geographic tokens or institution names rank highly, this signals problems requiring correction before deployment.
This operationalizes the “human-in-the-loop” AI principle by providing decision support rather than full automation, consistent with research showing that hybrid human-AI systems often outperform either humans or AI alone when humans can assess AI reliability [31].
5.2.3. Interpretability Design Rationale
Our integration of Shapash with Ridge Regression merits discussion, given that linear models are inherently interpretable through coefficient inspection. While ML practitioners can readily interpret Ridge coefficients, non-technical users, such as recruiters, typically lack exposure to regression mathematics or TF-IDF weighting schemes. As demonstrated in Section 4.5, a coefficient of β = 0.169 for “machine learning” is technically informative but practically ambiguous for a non-technical user without knowledge of the TF-IDF value distribution. Shapash transforms these coefficients into candidate-specific contribution scores expressed in the predicted similarity score scale, making the model’s behavior immediately interpretable without requiring a technical background. This approach aligns with Liao et al. [40], who found that effective XAI systems must accommodate diverse user needs through interactive rather than static interfaces, and with Spinner et al. [39], who demonstrated that interactive visual analytics frameworks significantly improve user comprehension compared with static alternatives.
5.3. Comparison with Prior Work
Our study extends prior research on AI recruitment in several dimensions.
Compared with Ajjam and Al-Raweshidy [21], who applied TF-IDF with cosine similarity for job–candidate matching without regression models or explainability, this study demonstrates that regression models learn more nuanced weighted relationships between features and match quality, while Shapash explanations make those relationships accessible to non-technical users.
Compared with Datto et al. [22], who applied TF-IDF with cosine similarity for résumé-job matching but likewise did not address explainability, this study confirms TF-IDF’s effectiveness while extending it with rigorous statistical validation and interpretable outputs.
Compared with Magham [41], who applied SHAP for recruitment explainability but acknowledged interpretability challenges for non-technical users, the use of Shapash in this study specifically targets recruiter accessibility through interactive dashboards and contribution score visualizations.
Compared with Jirjees et al. [7], who achieved high accuracy with complex models but provided no explainability, this study demonstrates that interpretable models can achieve superior or comparable performance while maintaining full transparency, directly addressing the accuracy-interpretability trade-off often assumed to be necessary.
Finally, the integration of the Coresignal API distinguishes this work from prior studies that relied on synthetic datasets or single-platform data, addressing the multi-platform data fragmentation challenge that the broader literature identifies as a persistent operational barrier [18].
5.4. Limitations
5.4.1. Dataset Scope and Generalizability
This study focused on Data Scientist positions in South Africa, limiting generalizability to other occupations, seniority levels, and geographic regions. The choice of South Africa and Data Scientist roles was determined by Coresignal API data availability and the need for a coherent professional sample with comparable backgrounds. Data Scientist represents a relatively well-defined occupational category with clear technical requirements. The performance metrics, feature alignment results, and model behaviour reported here should be interpreted as specific to this context and not assumed to transfer directly to other roles or regions without further validation. Generalization to roles with less structured requirements, or to labour markets with different professional platform adoption patterns, remains uncertain.
5.4.2. Single Job Description
Although the synthesized job description was grounded in systematic analysis of ten authentic South African Data Scientist job postings collected from LinkedIn and Indeed (Section 3.1.2), the study ultimately evaluated model performance against a single consolidated job description. While this approach ensured controlled and reproducible evaluation, it may not fully capture the authentic organizational variation in phrasing, emphasis, and implicit requirements present across individual postings. Real job descriptions exhibit diversity in writing style, the relative emphasis on hard versus soft skills, and unstated cultural fit expectations that a single synthesized description cannot wholly represent. Future work should evaluate model performance and feature alignment independently across multiple authentic job descriptions to further strengthen ecological validity and confirm that the findings generalize beyond the synthesized specification used here.
5.4.3. Absence of Recruiter User Validation
While we demonstrated technical performance (model accuracy, feature–job alignment), we did not conduct formal usability studies with professional recruiters. This represents the study’s most significant limitation. The following research questions should guide future validation efforts:
- Do recruiters find Shapash visualizations more comprehensible than raw regression coefficients?
- Does the consolidated interface reduce actual time-to-hire in real recruitment workflows?
- How do recruiters integrate algorithmic rankings into holistic hiring decisions?
- Does transparency increase recruiter trust and willingness to use AI recommendations?
Addressing these questions requires controlled experiments or field studies with recruiter participants. Such research would: (i) validate practical utility claims through empirical measurement, (ii) identify usability issues requiring interface refinements, (iii) assess impacts on recruitment outcomes such as time-to-hire, and (iv) investigate trust calibration and human-AI collaboration dynamics.
Future work should prioritize these user-centered evaluations to strengthen claims about real-world applicability.
5.4.4. Fairness and Bias Considerations
This study did not evaluate the model for demographic bias. ML models can propagate historical biases present in training data [28,43], potentially disadvantaging protected groups. Furthermore, the reliance on publicly available LinkedIn and Indeed profiles may introduce selection bias: candidates with richer online professional profiles are more likely to be represented in the dataset, potentially disadvantaging older workers, career-changers, or demographic groups with lower social media engagement. Future research should evaluate the framework across diverse occupations, multiple experience levels, and international labour markets, and should explicitly test whether the methodology transfers to non-English speaking markets or roles where professional profile conventions differ substantially from the South African Data Scientist context examined here.
5.4.5. Regulatory Compliance and Data Governance
The dataset used in this study comprises South African candidates, making compliance with the Protection of Personal Information Act (POPIA) [59] applicable. POPIA, which became enforceable in July 2021, governs the processing of personal information of individuals in South Africa and imposes specific requirements regarding lawful basis, purpose limitation, and data subject consent. Coresignal states that it adheres to major data privacy regulations, including GDPR, CCPA, and POPIA, and is a founding member of the Ethical Web Data Collection Initiative. However, the extent of Coresignal’s POPIA-specific compliance documentation is limited in the public domain, and this study did not conduct an independent legal audit of the API provider’s data processing agreements against POPIA’s conditions for lawful processing. Furthermore, even if Coresignal’s data collection practices are compliant, the downstream use of aggregated candidate profiles for ML-based headhunting may raise additional POPIA considerations. For instance, POPIA requires that personal information be collected for a specific, explicitly defined purpose, and using publicly available professional profiles for automated candidate ranking could be interpreted as a secondary processing purpose not originally contemplated by data subjects. Future implementations should formally assess POPIA compliance across the full data pipeline, from API sourcing through model inference, including whether legitimate interest provides sufficient lawful basis for processing candidate data in a headhunting context, and should document data protection impact assessments as recommended by South Africa’s Information Regulator.
5.4.6. API Dependency and Cost Considerations
The framework relies on a single commercial data provider (Coresignal), which introduces vendor dependency risks. API subscription costs, which vary based on query volume and data access tier, may present barriers for smaller recruitment firms or academic replication. The sustainability of any API-dependent research pipeline is contingent on the provider’s continued operation and pricing stability. Future work should evaluate multi-provider architectures to reduce single-vendor dependency.
5.4.7. Positioning Relative to Commercial Recruitment Tools
Several commercial platforms, such as SeekOut and hireEZ, aggregate candidate profiles from hundreds of millions of records and incorporate AI-driven matching capabilities. However, these tools typically operate as proprietary systems without transparent documentation of their matching algorithms, feature weighting, or decision rationale. The present study’s contribution lies not in competing with the scale of commercial platforms but in demonstrating that reproducible and explainable matching pipelines can achieve strong predictive performance while providing the algorithmic transparency that commercial tools currently lack. A formal empirical comparison between this framework and commercial alternatives in terms of matching accuracy, transparency, and recruiter satisfaction would strengthen these claims and is recommended for future research.
6. Conclusions
This study presented an integrated framework for transparent candidate–job matching in recruitment headhunting, addressing two critical challenges: data fragmentation across job portals and algorithmic opacity in ML-based ranking. The Coresignal API successfully consolidated candidate profiles (N = 587) from multiple platforms into a unified interface, eliminating repetitive manual searches. Ridge Regression achieved superior predictive performance (cross-validated R2 = 0.935, bootstrap R2 = 0.954, 95% CI [0.939, 0.965], RMSE = 0.025) over Gradient Boosting and Random Forest, with all differences statistically significant after Bonferroni correction (all ps ≤ 0.001, Cohen’s d ≥ 1.992), demonstrating that interpretable linear models can excel in high-dimensional TF-IDF-based matching tasks. Shapash-based feature importance analysis revealed strong alignment (93%) between model-identified features and explicit job requirements, validating meaningful learning rather than spurious correlations, while individual candidate explanations demonstrated practical utility for recruiter decision support.
These findings confirm that accuracy and transparency are not inherently conflicting goals in AI recruitment. Limitations include the focus on a single occupation (Senior Data Scientist) and a single geographic market (South Africa), which means that the performance metrics, feature alignment results, and model behaviour reported here should be interpreted as specific to this context and not assumed to transfer directly to other roles or regions without further validation. The reliance on publicly available Coresignal-aggregated profiles also introduces potential selection bias toward candidates with a strong online professional presence. These scope constraints are acknowledged, and the framework is presented as a reproducible foundation for broader validation rather than a universally applicable solution. Three specific directions are recommended for future work:
- Multi-role and multi-country validation to establish generalizability boundaries beyond the South African Data Scientist context;
- Formal recruiter usability trials measuring time-to-hire reduction, trust calibration, and decision quality when using Shapash-based explanations versus conventional screening;
- Fairness auditing with demographic parity and equal opportunity metrics to identify and mitigate potential bias in candidate rankings.
As AI systems become increasingly prevalent in high-stakes hiring decisions, and as regulatory frameworks such as the EU AI Act classify AI-assisted recruitment as high-risk, frameworks that combine technical rigour with accessible explainability will be essential for building trustworthy, fair, and practitioner-ready recruitment tools.
Author Contributions
Conceptualization, M.M. and T.P.; methodology, M.M.; software, M.M.; validation, M.M. and T.P.; formal analysis, M.M.; investigation, M.M.; resources, M.M.; data curation, M.M.; writing—original draft preparation, M.M.; writing—review and editing, T.P.; visualization, M.M.; supervision, T.P.; project administration, T.P. All authors have read and agreed to the published version of the manuscript.
Funding
This research received no external funding.
Data Availability Statement
The analysis code and anonymized dataset supporting this study will be deposited in a public GitHub repository upon acceptance for publication.
Acknowledgments
During the preparation of this manuscript, the author(s) used Claude (Anthropic, claude-sonnet-4-5) for the purposes of language editing and grammar checking. The authors have reviewed and edited the output and take full responsibility for the content of this publication.
Conflicts of Interest
The authors declare no conflicts of interest.
Appendix A. Synthesized Job Description
Job Title: Senior Data Scientist, Location: South Africa.
We are looking for a Senior Data Scientist with strong machine learning and statistical modelling expertise to design, build, and deploy data-driven solutions that support strategic business decision-making. The ideal candidate will work across the full data science lifecycle, from data extraction and feature engineering to model deployment and stakeholder communication.
Required skills: Python, SQL, Machine Learning, Statistical Analysis, Cloud Platforms (AWS and/or Azure), Data Visualization. Required education: Master’s degree (or Honours) in Computer Science, Statistics, Mathematics, Data Science, Engineering, or a related quantitative field, a Bachelor’s degree with substantial experience will be considered. Required experience: 5+ years in a data science or analytical role, with at least 2 years at senior or lead level.
References
- Köchling, A.; Wehner, M.C. Discriminated by an algorithm: A systematic review of discrimination and fairness by algorithmic decision-making in the context of HR recruitment and HR development. Bus. Res. 2020, 13, 795–848. [Google Scholar] [CrossRef] [Scilit]
- Burrell, J. How the machine ‘thinks’: Understanding opacity in machine learning algorithms. Big Data Soc. 2016, 3, 2053951715622512. [Google Scholar] [CrossRef] [Scilit]
- Zhaldak, A.; Krasovska, M. Modeling the phased implementation of headhunting as a way to fill vacancies. Technol. Audit. Prod. Reserves 2021, 6, 6–11. [Google Scholar] [CrossRef] [Scilit]
- Bogers, T.; Kaya, M. An Exploration of the Information Seeking Behavior of Recruiters. In Proceedings of the HR@ RecSys, Amsterdam, The Netherlands, 27 September–1 October 2021. [Google Scholar]
- Peicheva, M. Data analysis from the applicant tracking system. Choveshki Resur. Tehnol. HR Technol. Creat. Space Assoc. 2022, 2, 6–15. [Google Scholar]
- Tambe, P.; Cappelli, P.; Yakubovich, V. Artificial intelligence in human resources management: Challenges and a path forward. Calif. Manag. Rev. 2019, 61, 15–42. [Google Scholar] [CrossRef] [Scilit]
- Jirjees, A.K.; Ahmed, A.M.; Abdulla, A.A.; Lu, J.; Noori, E.M.; Kareem, R.N.; Hassan, B.A.; Veisi, H.; Rashid, T.A. Machine Learning for Recruitment: Analysing Job-Matching Algorithm. Doctoral Dissertation, University of Kurdistan Hewlêr, Erbil, Iraq, 2024. [Google Scholar]
- Madanchian, M. From recruitment to retention: AI tools for human resource decision-making. Appl. Sci. 2024, 14, 11750. [Google Scholar] [CrossRef] [Scilit]
- Kostopoulos, G.; Davrazos, G.; Kotsiantis, S. Explainable artificial intelligence-based decision support systems: A recent review. Electronics 2024, 13, 2842. [Google Scholar] [CrossRef] [Scilit]
- Hunkenschroer, A.L.; Kriebitz, A. Is AI recruiting (un) ethical? A human rights perspective on the use of AI for hiring. AI Ethics 2023, 3, 199–213. [Google Scholar] [CrossRef] [Scilit]
- Beretta, A.; Ercoli, G.; Ferraro, A.; Guidotti, R.; Iommi, A.; Mastropietro, A.; Monreale, A.; Rotelli, D.; Ruggieri, S. Requirements of eXplainable AI in Algorithmic Hiring. In Proceedings of the AIMMES 2024 Workshop on AI Bias: Measurements, Mitigation, Explanation Strategies|Co-Located with EU Fairness Cluster Conference 2024, Amsterdam, The Netherlands, 20 March 2024. [Google Scholar]
- Hofeditz, L.; Clausen, S.; Rieß, A.; Mirbabaie, M.; Stieglitz, S. Applying XAI to an AI-based system for candidate management to mitigate bias and discrimination in hiring. Electron. Mark. 2022, 32, 2207–2233. [Google Scholar] [CrossRef] [Scilit]
- Glenny Jocelyn, G.; Judy Grace Nitta, J. The Effectiveness and Challenges of Online Platforms for Talent Sourcing: A Perception Study of Recruiters in the IT Sector. Int. J. Sci. Res. Technol. 2025, 2, IJSRT/250307017. [Google Scholar] [CrossRef]
- Mydyti, H.; Ware, A. Integrating Intelligent Web Scraping Techniques in Internship Management Systems: Enhancing Internship Matching. Ann. Emerg. Technol. Comput. (AETiC) 2025, 9, 1–23. [Google Scholar]
- Kumar, N.; Gupta, M.; Sharma, D.; Ofori, I. Technical job recommendation system using APIs and web crawling. Comput. Intell. Neurosci. 2022, 2022, 7797548. [Google Scholar] [CrossRef] [Scilit]
- Frazzetto, P.; Haq, M.U.U.; Fabris, F.; Sperduti, A. From Text to Talent: A Pipeline for Extracting Insights from Candidate Profiles. arXiv 2025, arXiv:2503.17438. [Google Scholar] [CrossRef] [Scilit]
- Smelyakov, K.; Hurova, Y.; Osiievskyi, S. Analysis of the effectiveness of using machine learning algorithms to make hiring decisions. In Proceedings of the International Conference on Computational Linguistics and Intelligent Systems, Kharkiv, Ukraine, 20–21 April 2023; Volume 1613, p. 73. [Google Scholar]
- Mori, M.; Sassetti, S.; Cavaliere, V.; Bonti, M. A systematic literature review on artificial intelligence in recruiting and selection: A matter of ethics. Pers. Rev. 2025, 54, 854–878. [Google Scholar] [CrossRef] [Scilit]
- Mashayekhi, Y.; Li, N.; Kang, B.; Lijffijt, J.; De Bie, T. A challenge-based survey of e-recruitment recommendation systems. ACM Comput. Surv. 2024, 56, 1–33. [Google Scholar]
- Campion, E.D.; Campion, M.A. Impact of machine learning on personnel selection. Organ. Dyn. 2024, 53, 101035. [Google Scholar] [CrossRef] [Scilit]
- Ajjam, M.-H.; Al-Raweshidy, H.S. AI-driven semantic similarity-based job matching framework for recruitment systems. Inf. Sci. 2025, 724, 122728. [Google Scholar]
- Datto, S.; Ahmed, M.; Emran, A.; Redwan, K.; Nadim, R.; Mahmood, S. Enhancing Candidate Selection with NLP-Driven Resume Analysis for Industry 4.0 Recruitment Systems. In International Conference on Data Science, AI and Applications; Springer: Cham, Switzerland, 2025; pp. 46–60. [Google Scholar]
- Deshmukh, A.; Raut, A. Applying bert-based nlp for automated resume screening and candidate ranking. Ann. Data Sci. 2025, 12, 591–603. [Google Scholar] [CrossRef] [Scilit]
- Pessach, D.; Singer, G.; Avrahami, D.; Ben-Gal, H.C.; Shmueli, E.; Ben-Gal, I. Employees recruitment: A prescriptive analytics approach via machine learning and mathematical programming. Decis. Support Syst. 2020, 134, 113290. [Google Scholar] [CrossRef] [Scilit]
- Larsson, J.; Wallin, J. The Choice of Normalization Influences Shrinkage in Regularized Regression. arXiv 2025, arXiv:2501.03821. [Google Scholar] [CrossRef] [Scilit]
- Friedman, J.H. Greedy function approximation: A gradient boosting machine. Ann. Stat. 2001, 29, 1189–1232. [Google Scholar] [CrossRef] [Scilit]
- Liaw, A.; Wiener, M. Classification and regression by randomForest. R News 2002, 2, 18–22. [Google Scholar]
- Albaroudi, E.; Mansouri, T.; Alameer, A. A comprehensive review of AI techniques for addressing algorithmic bias in job hiring. AI 2024, 5, 383–404. [Google Scholar] [CrossRef] [Scilit]
- Chen, Z. Ethics and discrimination in artificial intelligence-enabled recruitment practices. Humanit. Soc. Sci. Commun. 2023, 10, 567. [Google Scholar] [CrossRef] [Scilit]
- Smuha, N.A. Regulation 2024/1689 of the Eur. Parl. & Council of June 13, 2024 (eu artificial intelligence act). Int. Leg. Mater. 2025, 64, 1234–1381. [Google Scholar] [CrossRef] [Scilit]
- Buçinca, Z.; Swaroop, S.; Paluch, A.E.; Doshi-Velez, F.; Gajos, K.Z. Contrastive explanations that anticipate human misconceptions can improve human decision-making skills. In Proceedings of the 2025 CHI Conference on Human Factors in Computing Systems; Association for Computing Machinery: New York, NY, USA, 2025; pp. 1–25. [Google Scholar]
- Gómez-Talal, I.; Azizsoltani, M.; Bote-Curiel, L.; Rojo-Álvarez, J.L.; Singh, A. Towards Explainable Artificial Intelligence in Machine Learning: A study on efficient Perturbation-Based Explanations. Eng. Appl. Artif. Intell. 2025, 155, 110664. [Google Scholar] [CrossRef] [Scilit]
- Ribeiro, M.T.; Singh, S.; Guestrin, C. “Why should i trust you?” Explaining the predictions of any classifier. In Proceedings of the 22nd ACM SIGKDD International Conference on Knowledge Discovery and Data Mining; Association for Computing Machinery: New York, NY, USA, 2016; pp. 1135–1144. [Google Scholar]
- Qin, L.; Zhu, Y.; Liu, S.; Zhang, X.; Zhao, Y. The Shapley Value in Data Science: Advances in Computation, Extensions, and Applications. Mathematics 2025, 13, 1581. [Google Scholar] [CrossRef] [Scilit]
- Shapley, L.S. A Value for n-Person Games; Princeton University Press: Princeton, NJ, USA, 1953. [Google Scholar]
- Kaur, H.; Nori, H.; Jenkins, S.; Caruana, R.; Wallach, H.; Wortman Vaughan, J. Interpreting interpretability: Understanding data scientists’ use of interpretability tools for machine learning. In Proceedings of the 2020 CHI Conference on Human Factors in Computing Systems; Association for Computing Machinery: New York, NY, USA, 2020; pp. 1–14. [Google Scholar]
- Miller, T. Explanation in artificial intelligence: Insights from the social sciences. Artif. Intell. 2019, 267, 1–38. [Google Scholar] [CrossRef] [Scilit]
- MAIF. Shapash: Making Machine Learning Interpretable. Available online: https://github.com/MAIF/shapash (accessed on 20 August 2025).
- Spinner, T.; Schlegel, U.; Schäfer, H.; El-Assady, M. explAIner: A visual analytics framework for interactive and explainable machine learning. IEEE Trans. Vis. Comput. Graph. 2019, 26, 1064–1074. [Google Scholar] [CrossRef] [Scilit]
- Liao, Q.V.; Gruen, D.; Miller, S. Questioning the AI: Informing design practices for explainable AI user experiences. In Proceedings of the 2020 CHI Conference on Human Factors in Computing Systems; Association for Computing Machinery: New York, NY, USA, 2020; pp. 1–15. [Google Scholar]
- Ravi, K.M. Mitigating bias in AI-driven recruitment: The role of explainable machine learning (XAI). Int. J. 2024, 10, 461–469. [Google Scholar]
- Delecraz, S.; Eltarr, L.; Oullier, O. Transparency and explainability of a machine learning model in the context of human resource management. In Proceedings of the Workshop on Ethical and Legal Issues in Human Language Technologies and Multilingual De-Identification of Sensitive Data in Language Resources Within the 13th Language Resources and Evaluation Conference; European Language Resources Association: Marseille, France, 2022; pp. 38–43. [Google Scholar]
- Fabris, A.; Baranowska, N.; Dennis, M.J.; Graus, D.; Hacker, P.; Saldivar, J.; Zuiderveen Borgesius, F.; Biega, A.J. Fairness and bias in algorithmic hiring: A multidisciplinary survey. ACM Trans. Intell. Syst. Technol. 2025, 16, 1–54. [Google Scholar] [CrossRef] [Scilit]
- Alsubaie, N.; Aleisa, N. Mitigating bias in AI model using explainable AI in terms of hiring process in the industry. IEEE Access 2025, 13, 147218–147241. [Google Scholar] [CrossRef] [Scilit]
- Salton, G.; Buckley, C. Approaches to Text Retreival for Structured Documents; Cornell University: Ithaca, NY, USA, 1990. [Google Scholar]
- Pedregosa, F.; Varoquaux, G.; Gramfort, A.; Michel, V.; Thirion, B.; Grisel, O.; Blondel, M.; Prettenhofer, P.; Weiss, R.; Dubourg, V. Scikit-learn: Machine learning in Python. J. Mach. Learn. Res. 2011, 12, 2825–2830. [Google Scholar]
- Ngwenya, B.; Paepae, T.; Bokoro, P.N. Advancing SDG 6.3. 2 with machine learning-based virtual sensors for high-frequency nutrient monitoring. J. Water Process Eng. 2025, 79, 108831. [Google Scholar] [CrossRef] [Scilit]
- Ngwenya, B.; Paepae, T.; Bokoro, P.N. Monitoring ambient water quality using machine learning and IoT: A review and recommendations for advancing SDG indicator 6.3.2. J. Water Process Eng. 2025, 73, 107664. [Google Scholar] [CrossRef] [Scilit]
- Paepae, T.; Bokoro, P.N.; Kyamakya, K. From fully physical to virtual sensing for water quality assessment: A comprehensive review of the relevant state-of-the-art. Sensors 2021, 21, 6971. [Google Scholar] [CrossRef] [Scilit] [PubMed]
- Paepae, T.; Bokoro, P.N.; Kyamakya, K. A virtual sensing concept for Nitrogen and Phosphorus monitoring using machine learning techniques. Sensors 2022, 22, 7338. [Google Scholar] [CrossRef] [Scilit]
- Paepae, T.; Bokoro, P.N.; Kyamakya, K. Data augmentation for a virtual-sensor-based nitrogen and phosphorus monitoring. Sensors 2023, 23, 1061. [Google Scholar] [CrossRef] [Scilit]
- Mokgwatjane, K.; Paepae, T. An explainable ensemble machine learning approach for multi-domain, multiclass sentiment analysis in Amazon product reviews. Mach. Learn. Appl. 2026, 23, 100825. [Google Scholar] [CrossRef] [Scilit]
- Wilimitis, D.; Walsh, C.G. Practical considerations and applied examples of cross-validation for model development and evaluation in health care: Tutorial. JMIR AI 2023, 2, e49023. [Google Scholar] [CrossRef] [Scilit] [PubMed]
- Lumumba, V.W.; Kiprotich, D.; Lemasulani Mpaine, M.; Grace Makena, N.; Daniel Kavita, M. Comparative analysis of cross-validation techniques: LOOCV, K-folds cross-validation, and repeated K-folds cross-validation in machine learning models. Am. J. Theor. Appl. Stat. 2024, 13, 127–137. [Google Scholar]
- Hodson, T.O. Root mean square error (RMSE) or mean absolute error (MAE): When to use them or not. Geosci. Model Dev. Discuss. 2022, 15, 5481–5487. [Google Scholar] [CrossRef] [Scilit]
- Demšar, J. Statistical comparisons of classifiers over multiple data sets. J. Mach. Learn. Res. 2006, 7, 1–30. [Google Scholar]
- Cohen, J. Set correlation and contingency tables. Appl. Psychol. Meas. 1988, 12, 425–434. [Google Scholar] [CrossRef] [Scilit]
- Rudin, C. Stop explaining black box machine learning models for high stakes decisions and use interpretable models instead. Nat. Mach. Intell. 2019, 1, 206–215. [Google Scholar] [CrossRef] [Scilit]
- Republic of South Africa. Protection of Personal Information Act, No. 4 of 2013. Gov. Gaz. 2013, 581, 1–148.
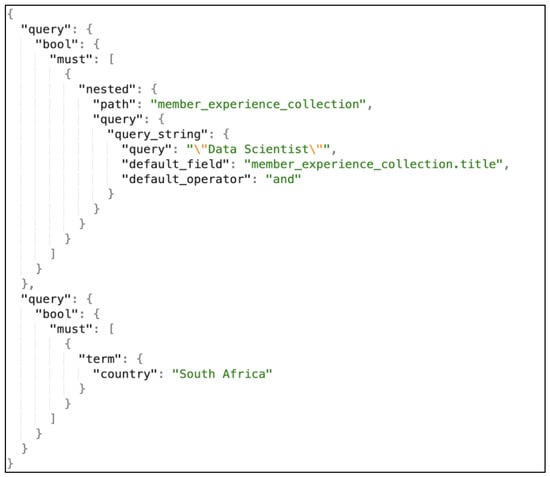
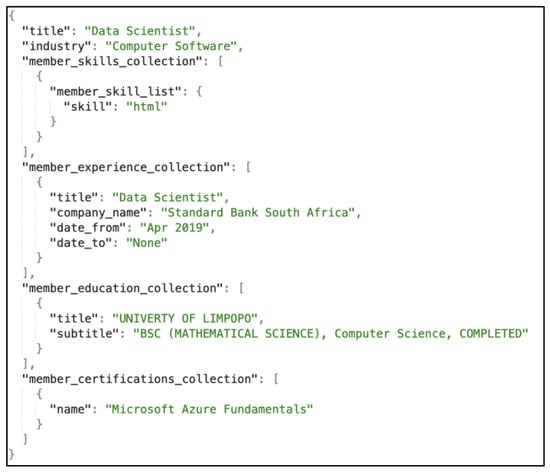
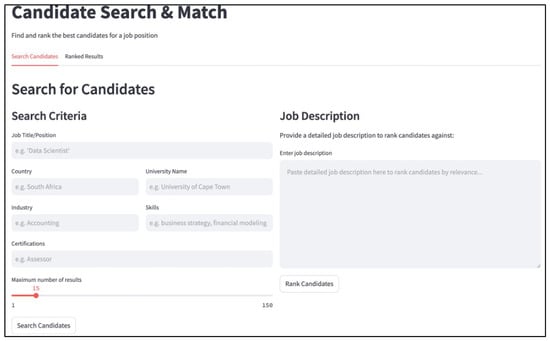
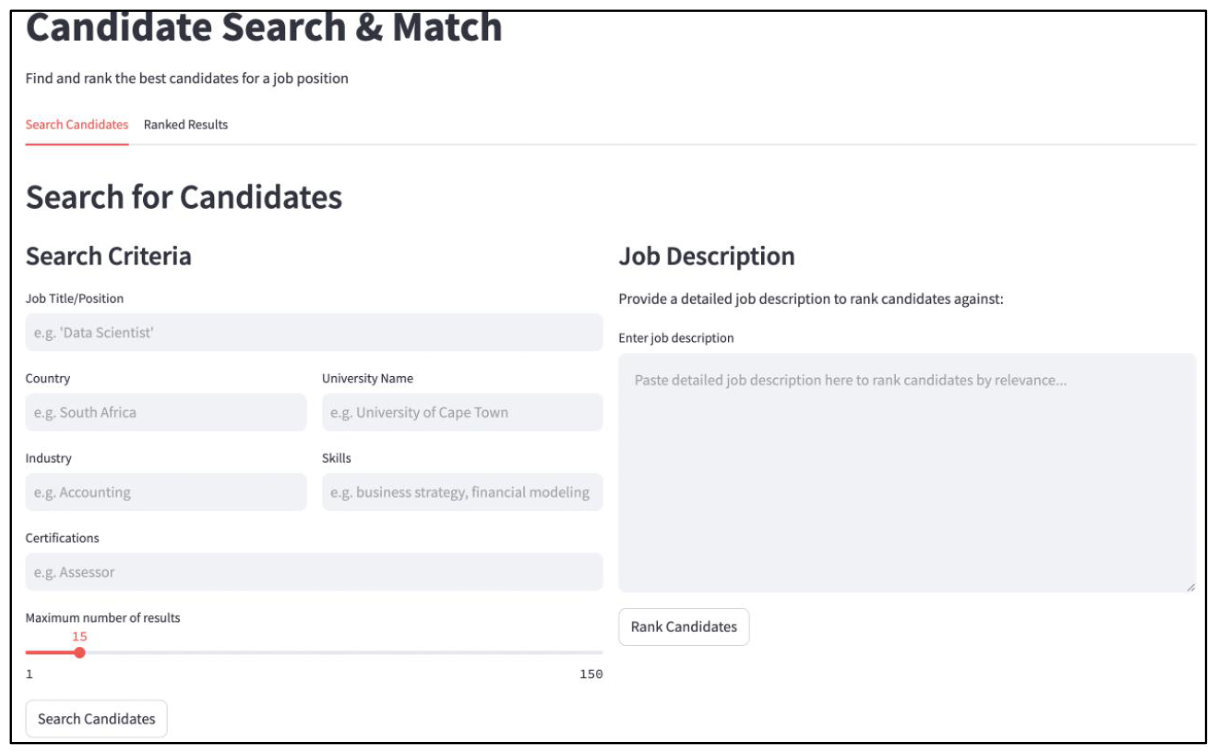
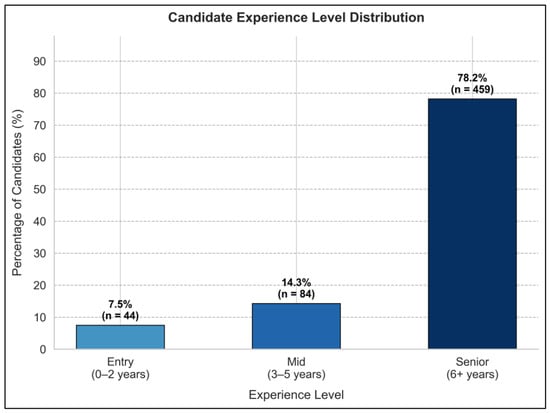
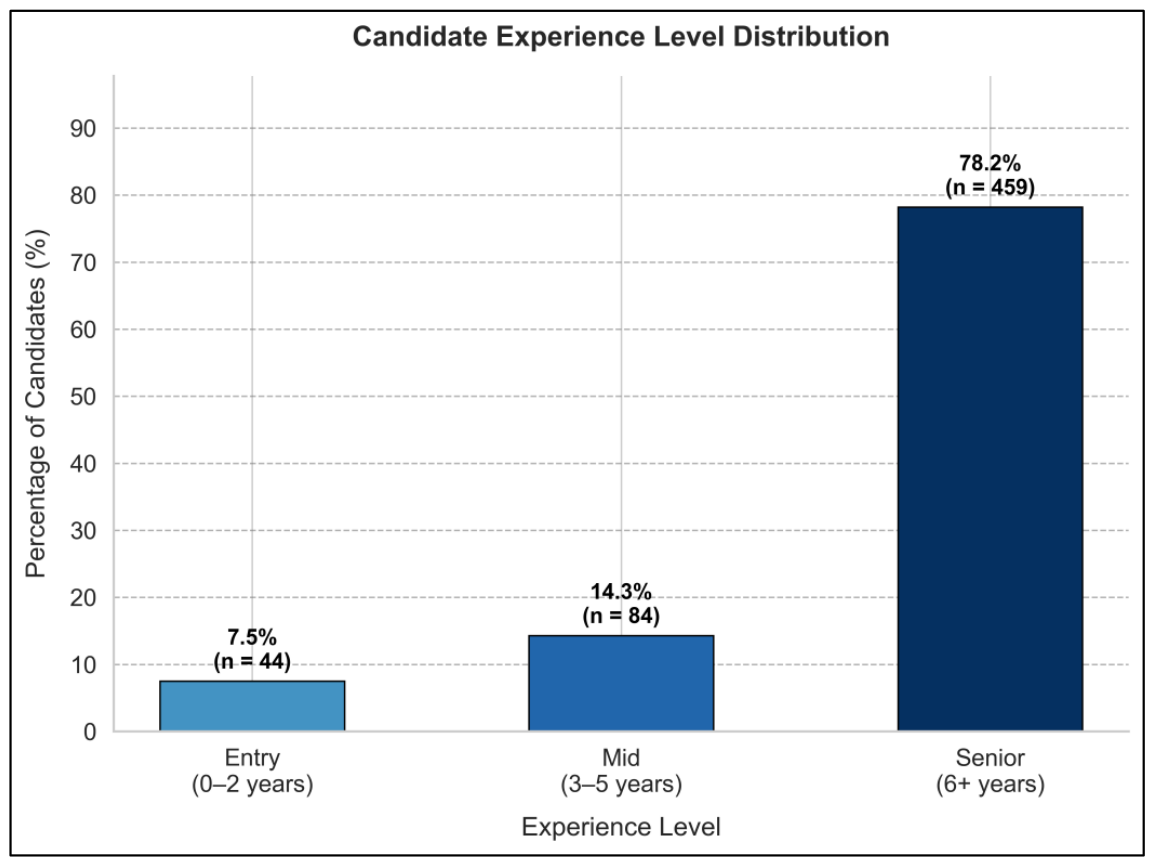
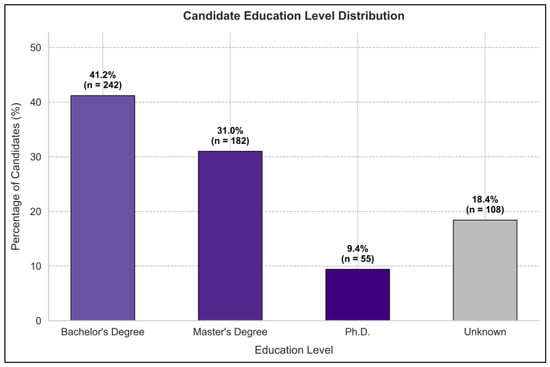
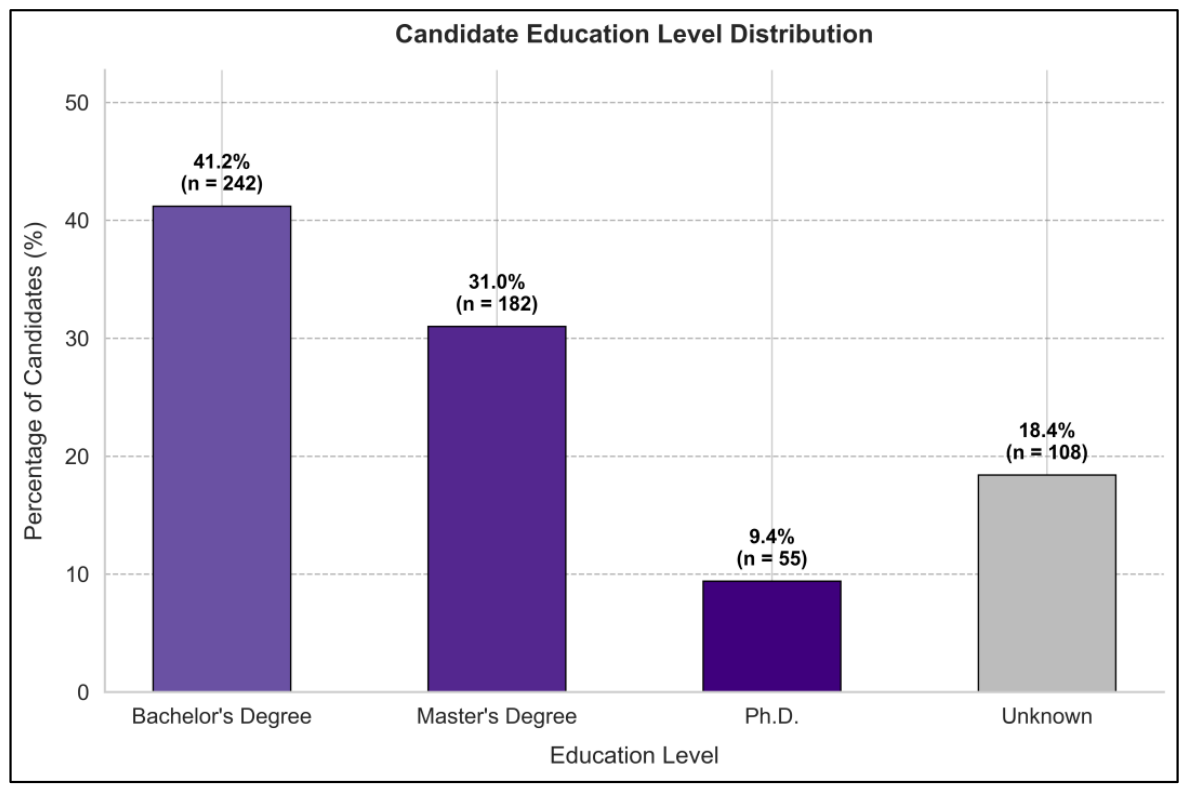
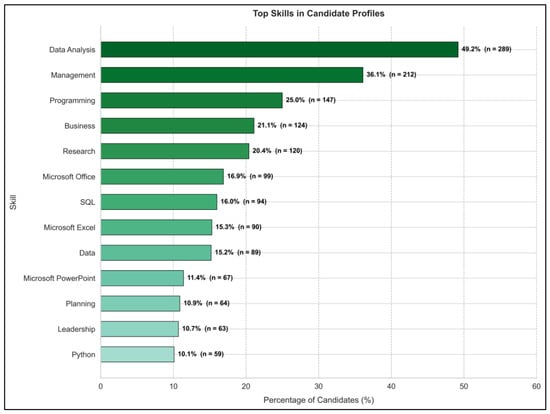
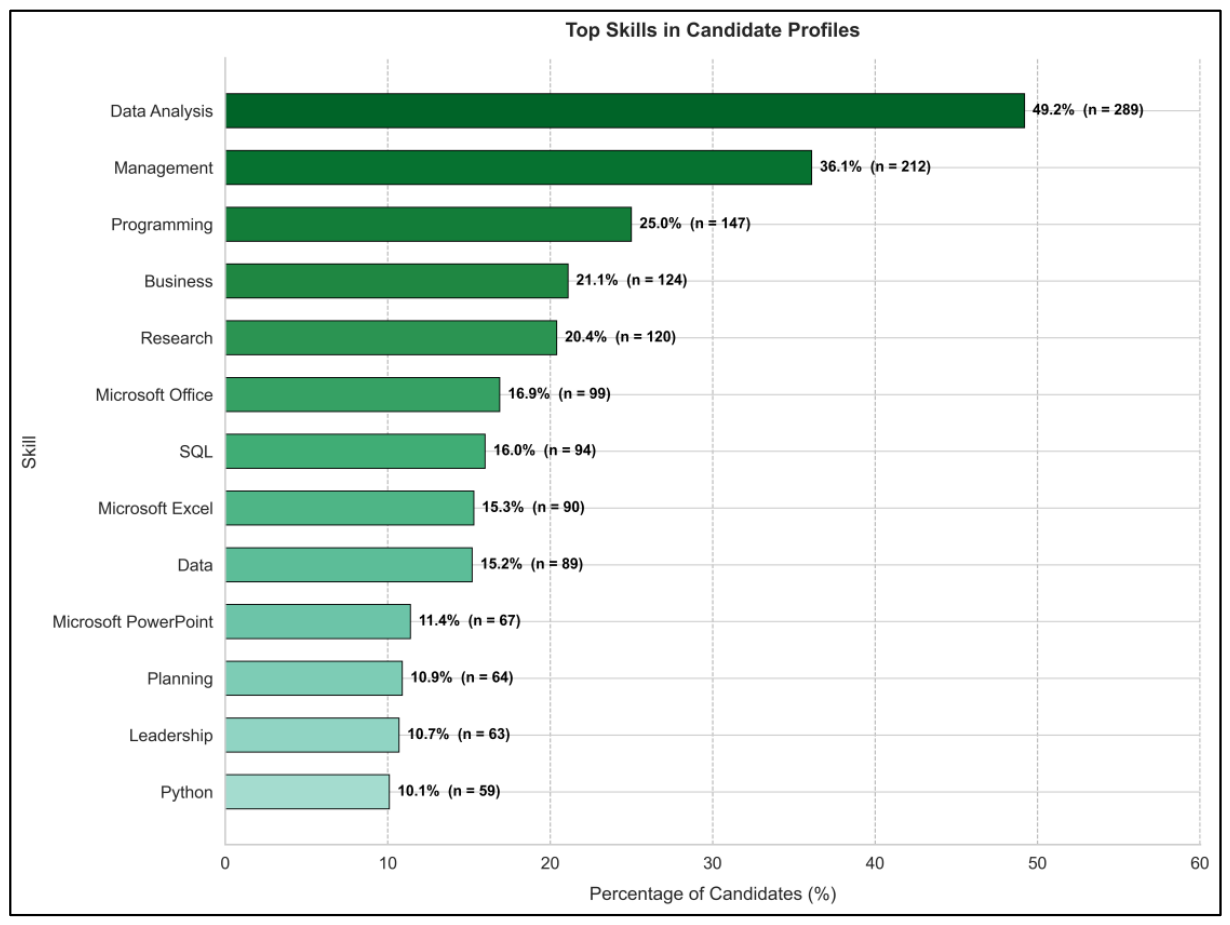
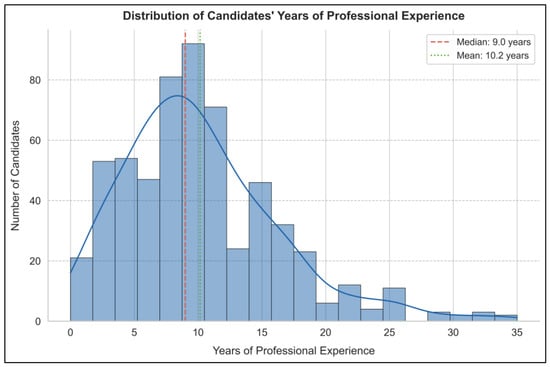
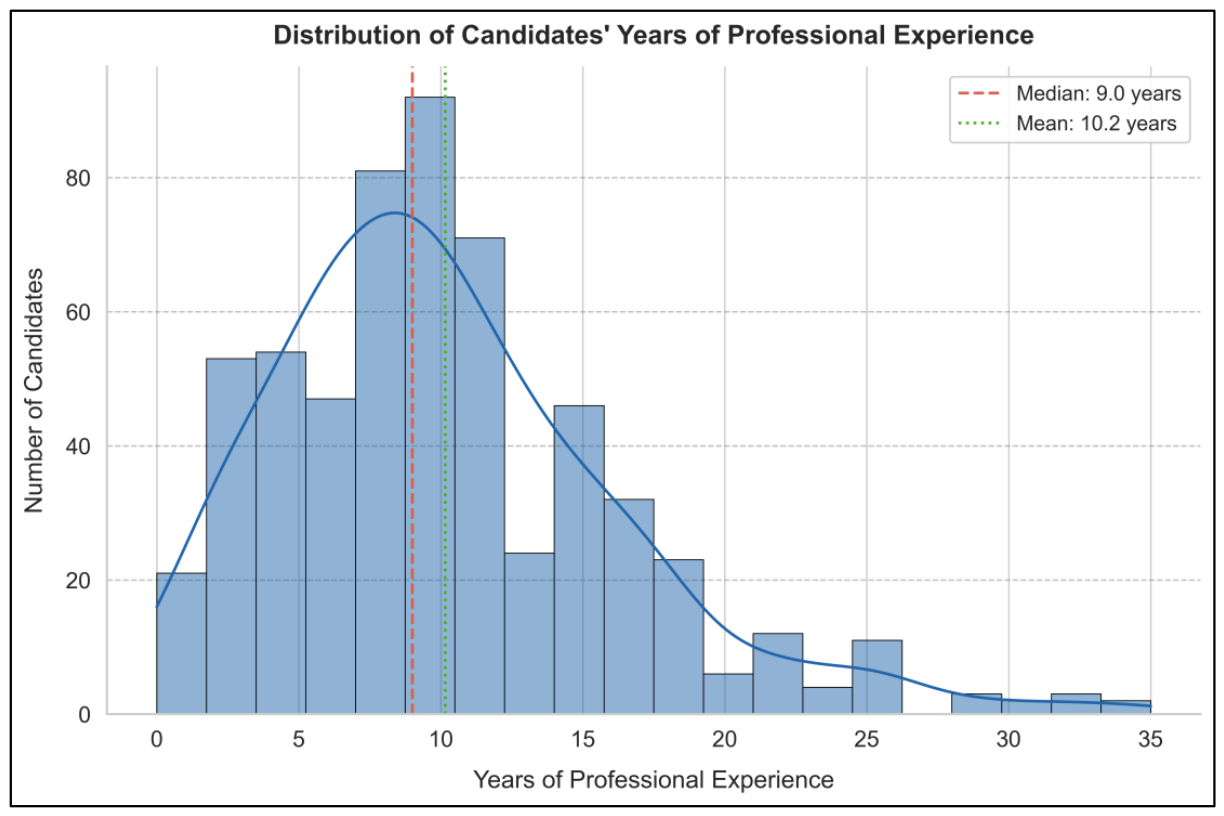
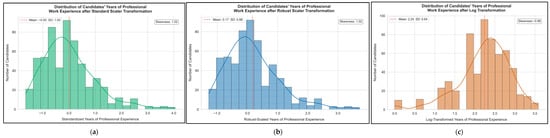
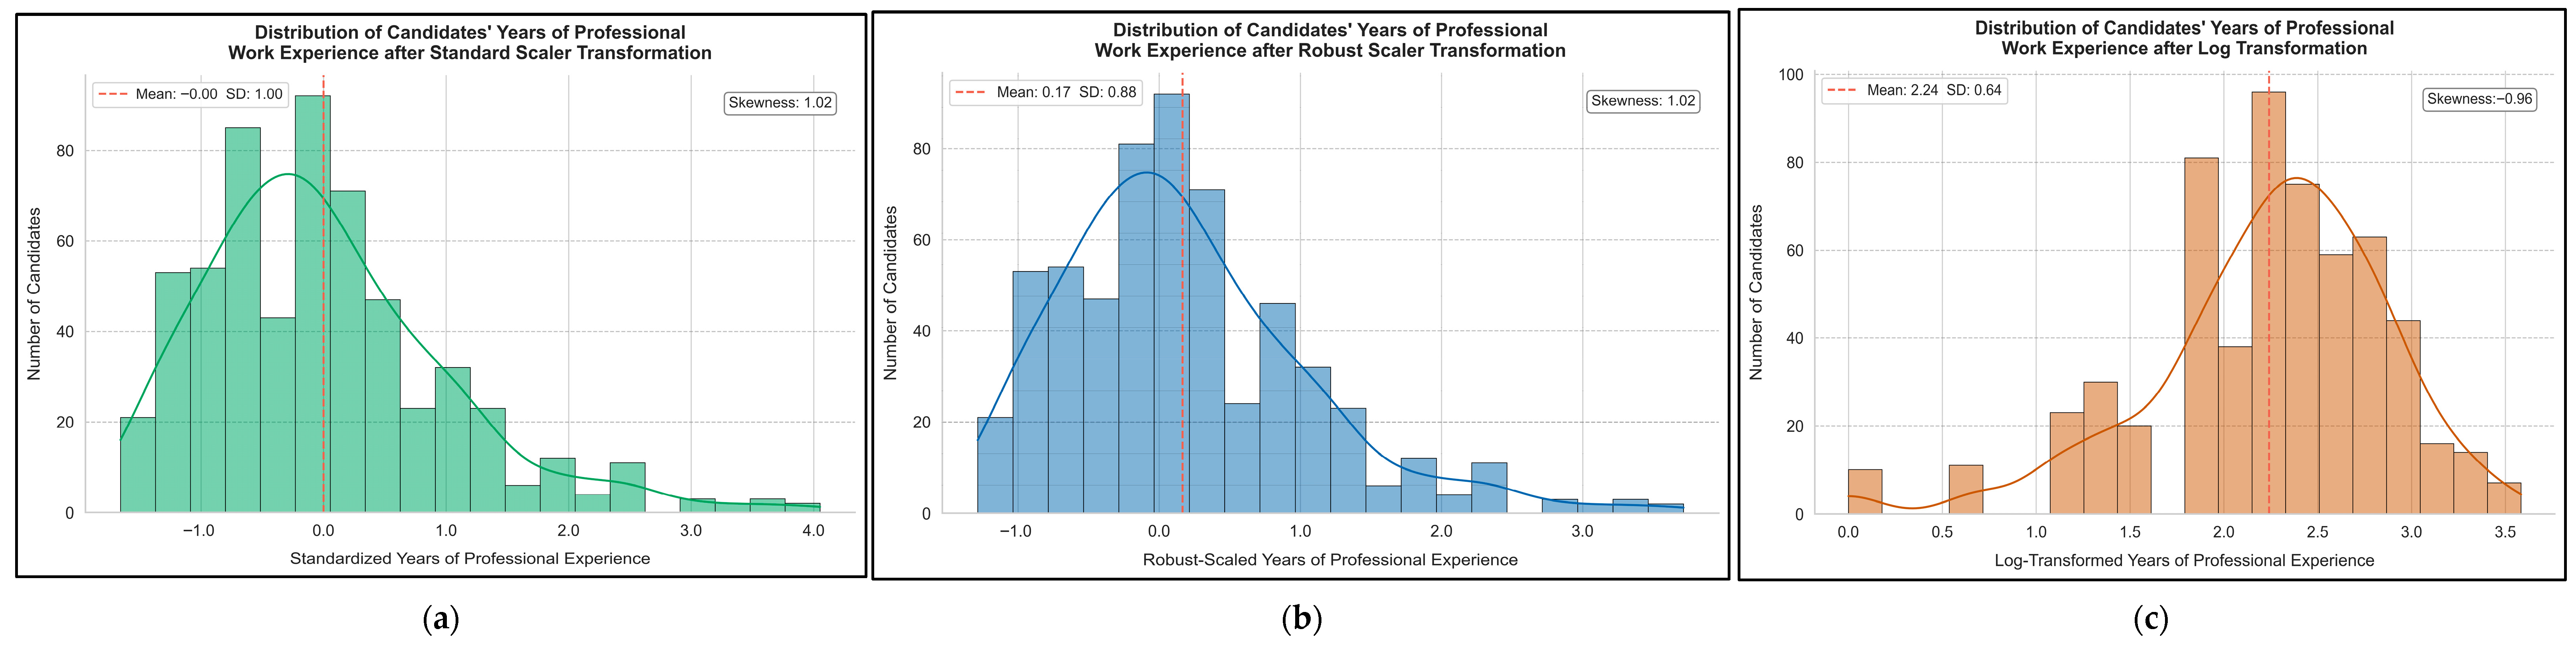
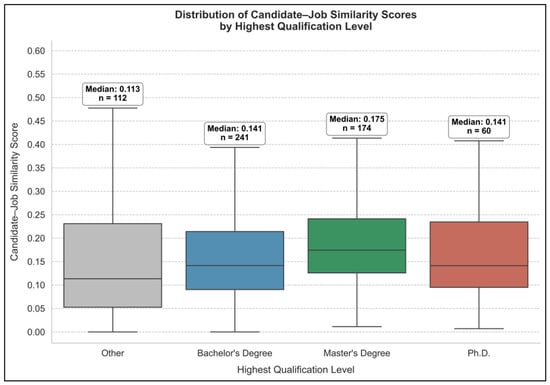
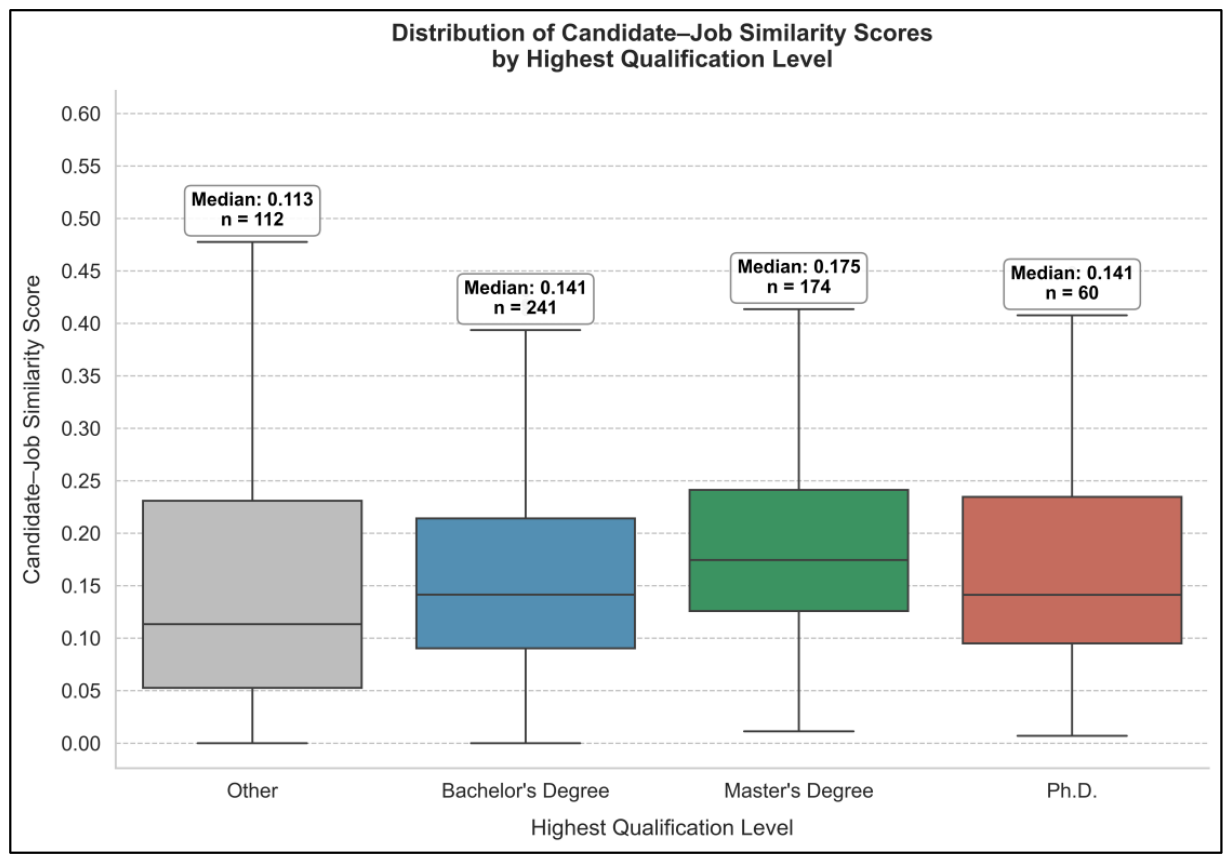
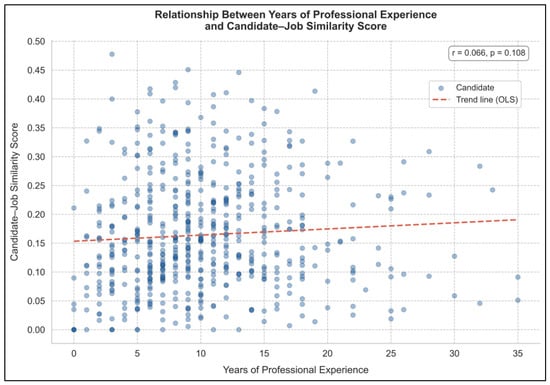
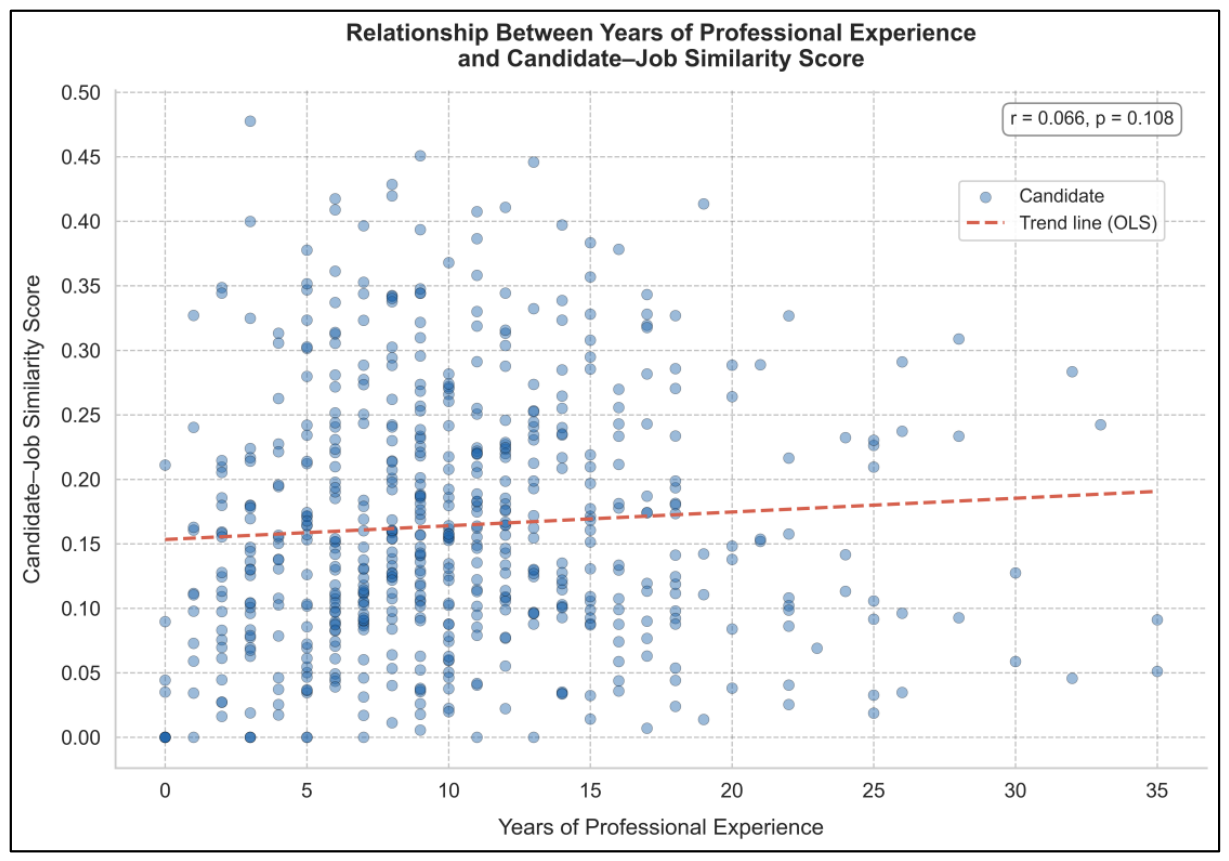
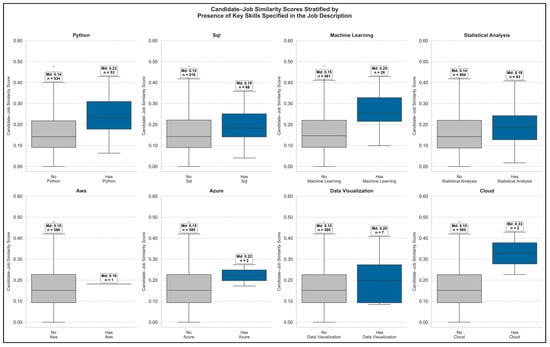
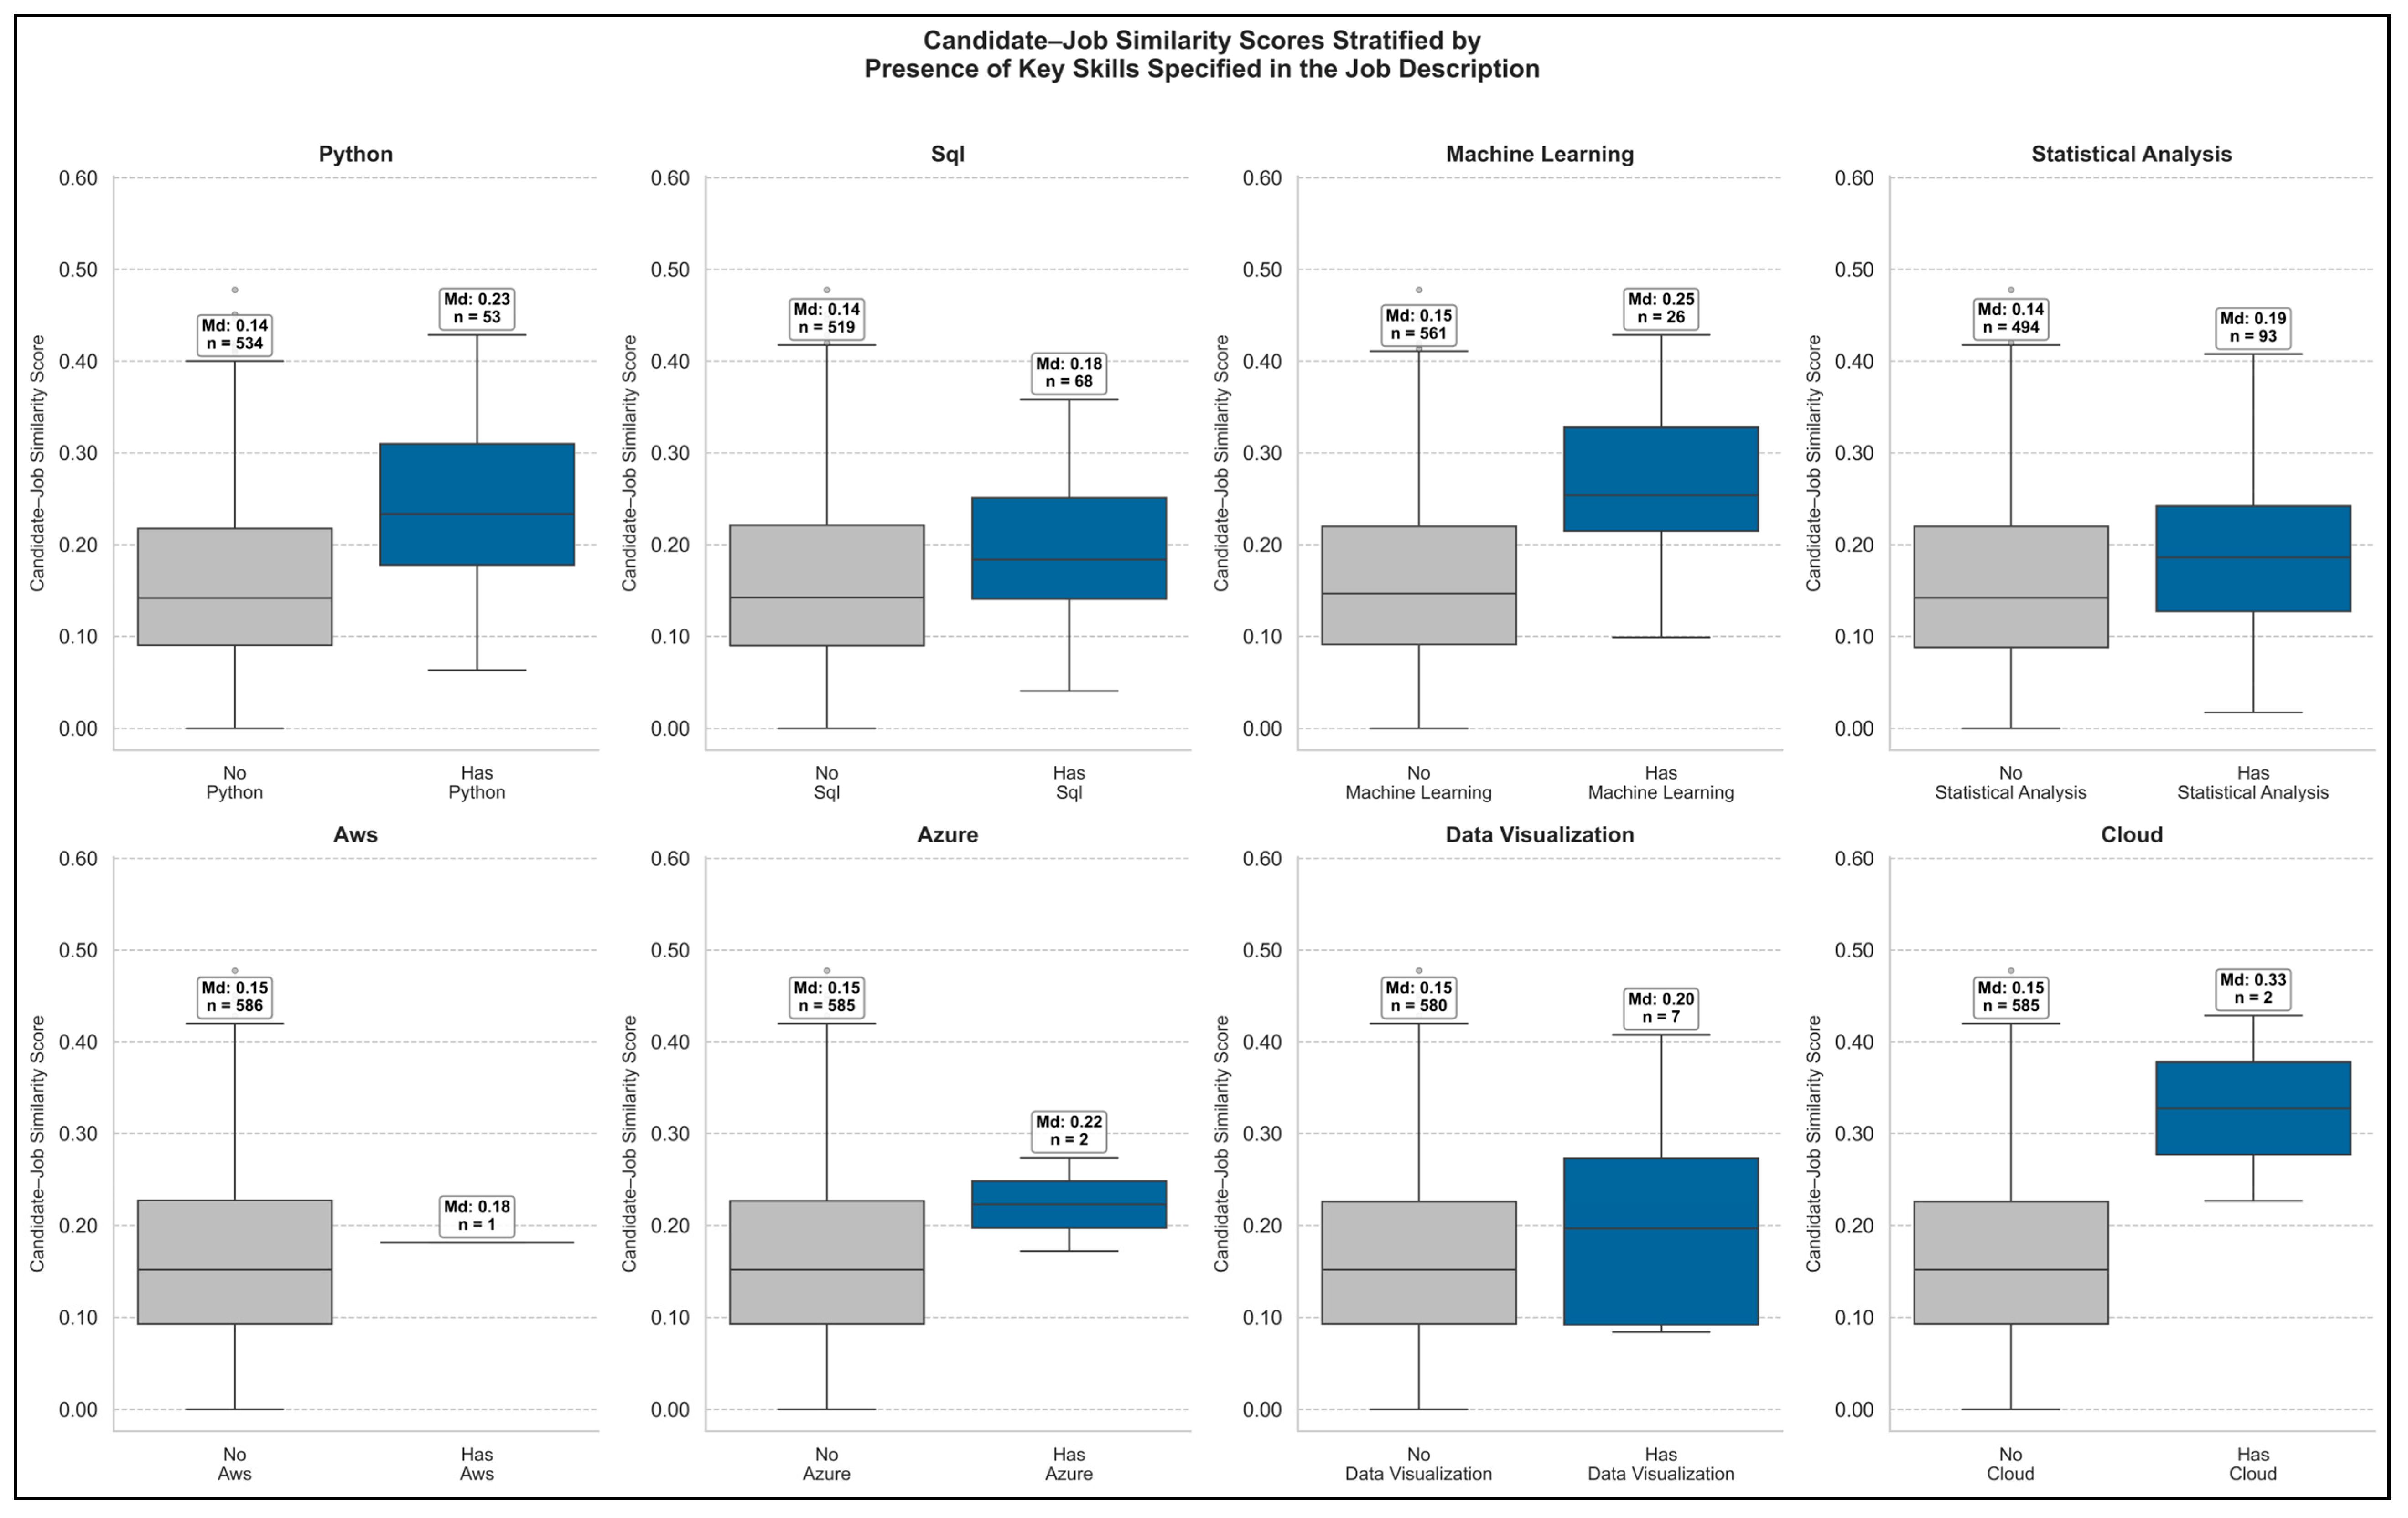
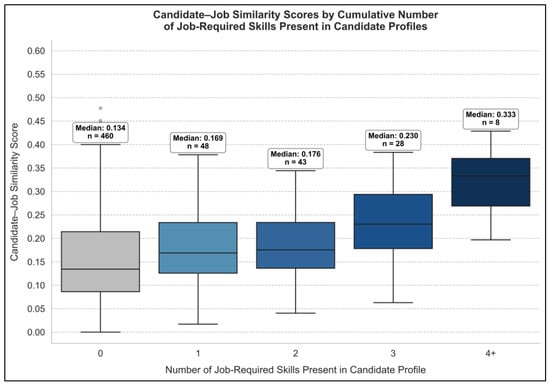
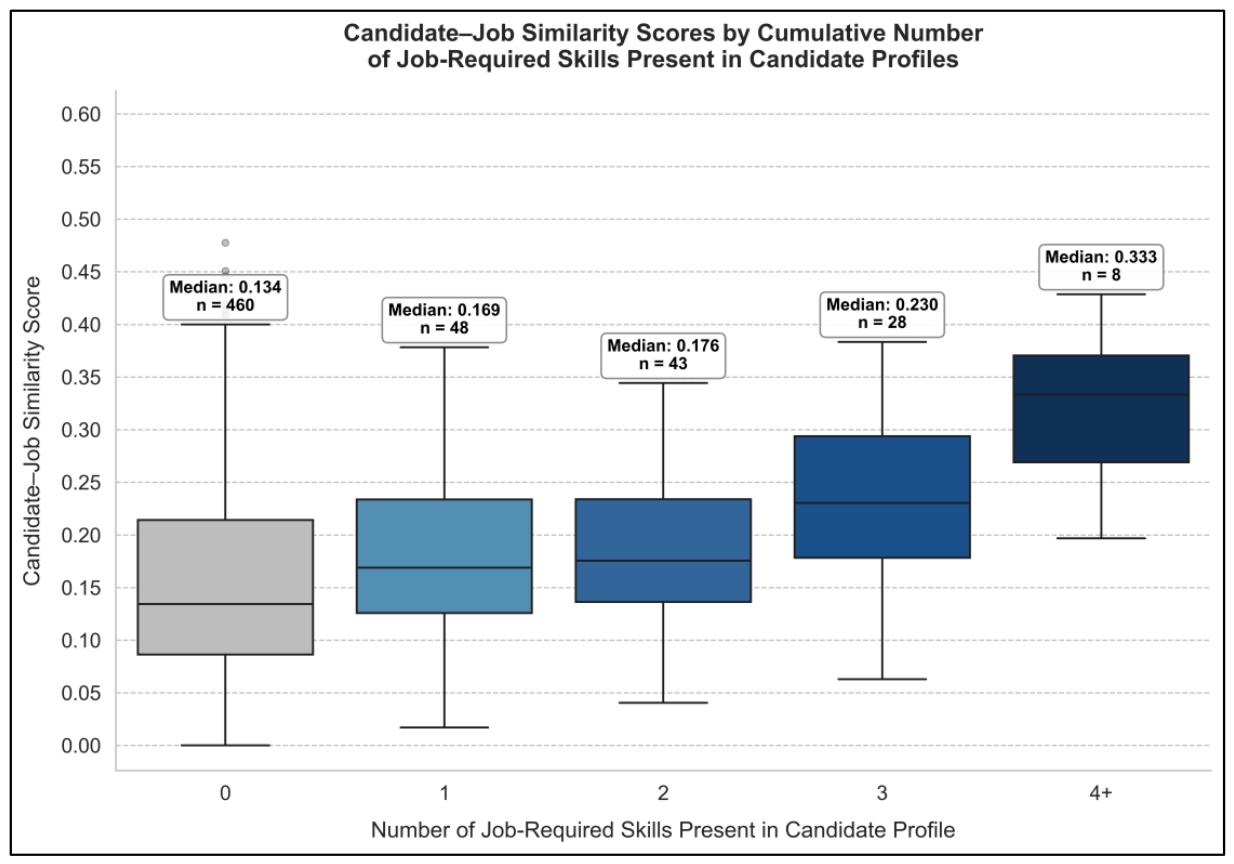
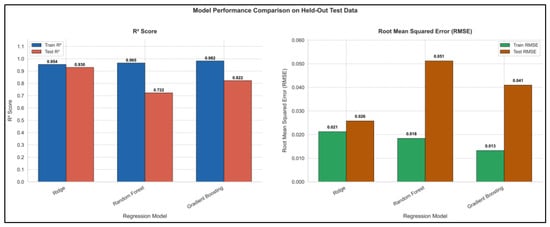
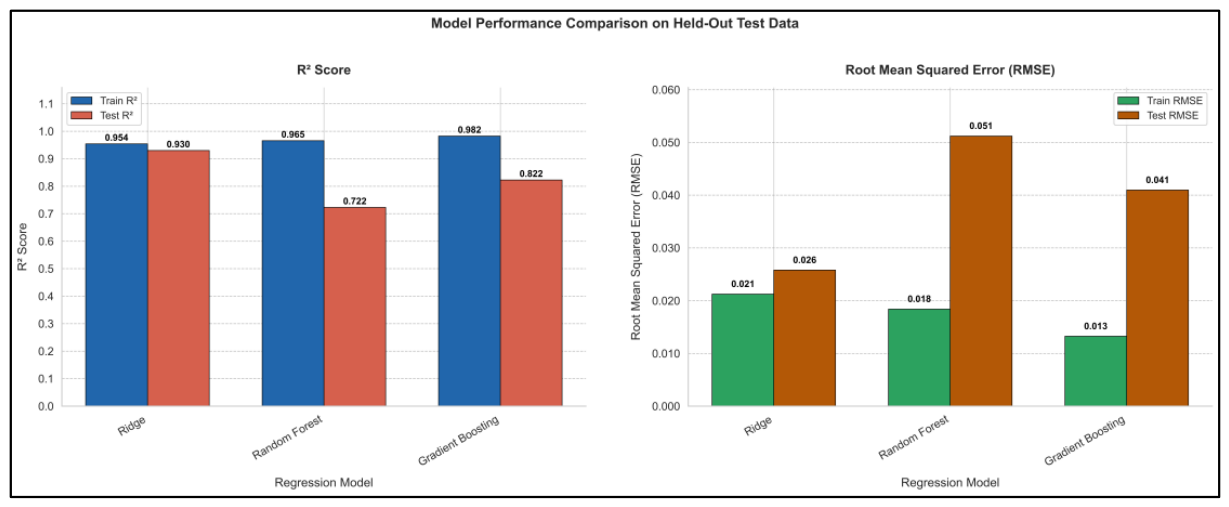
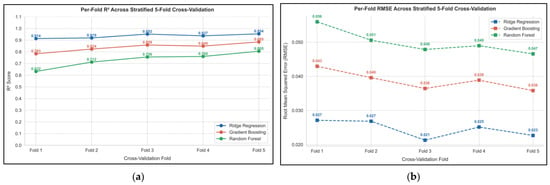
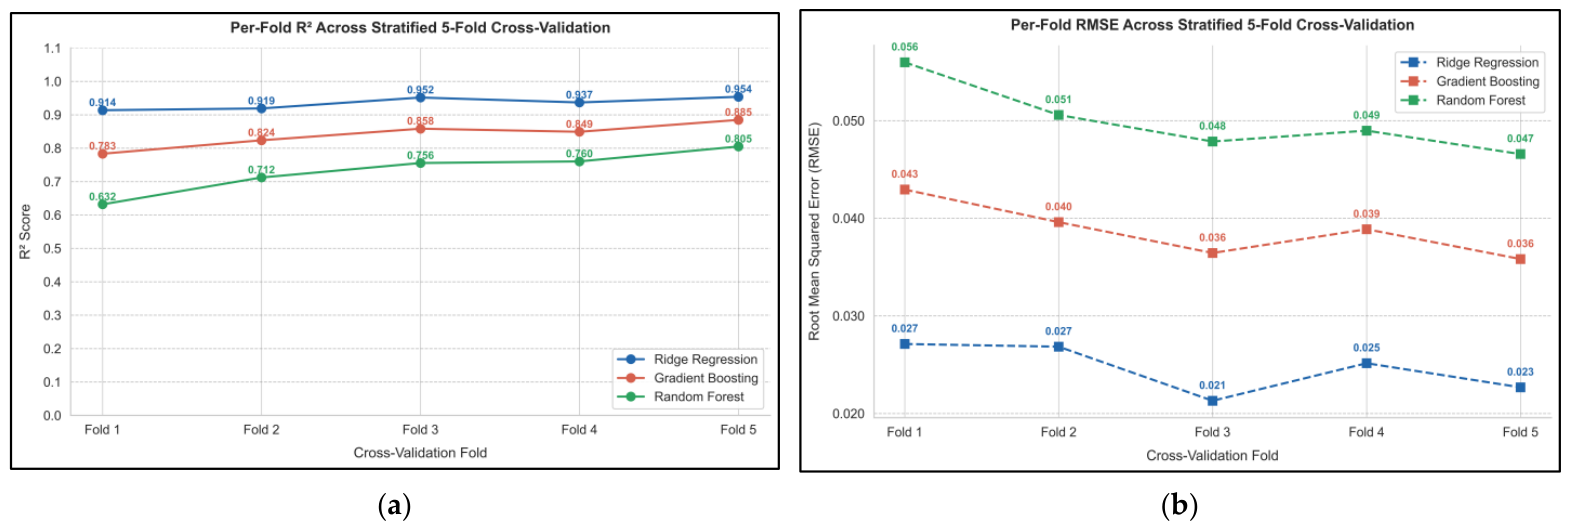
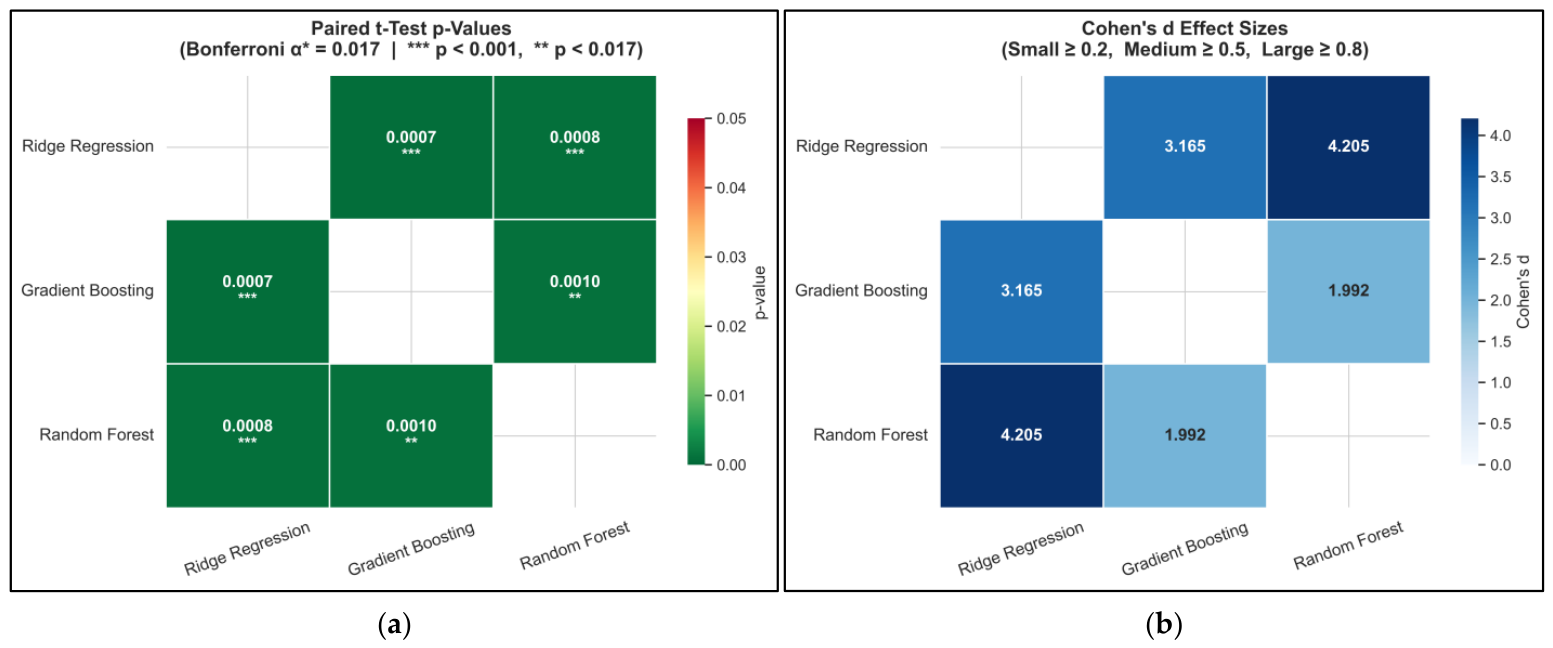
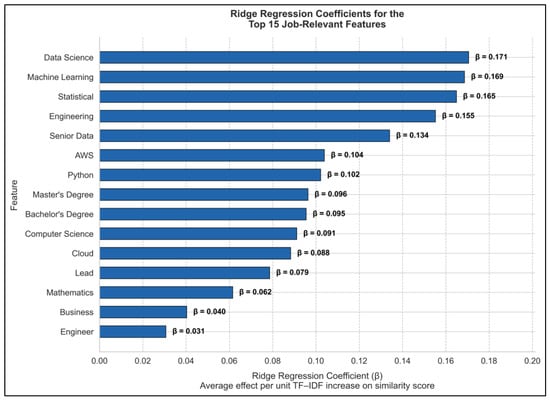
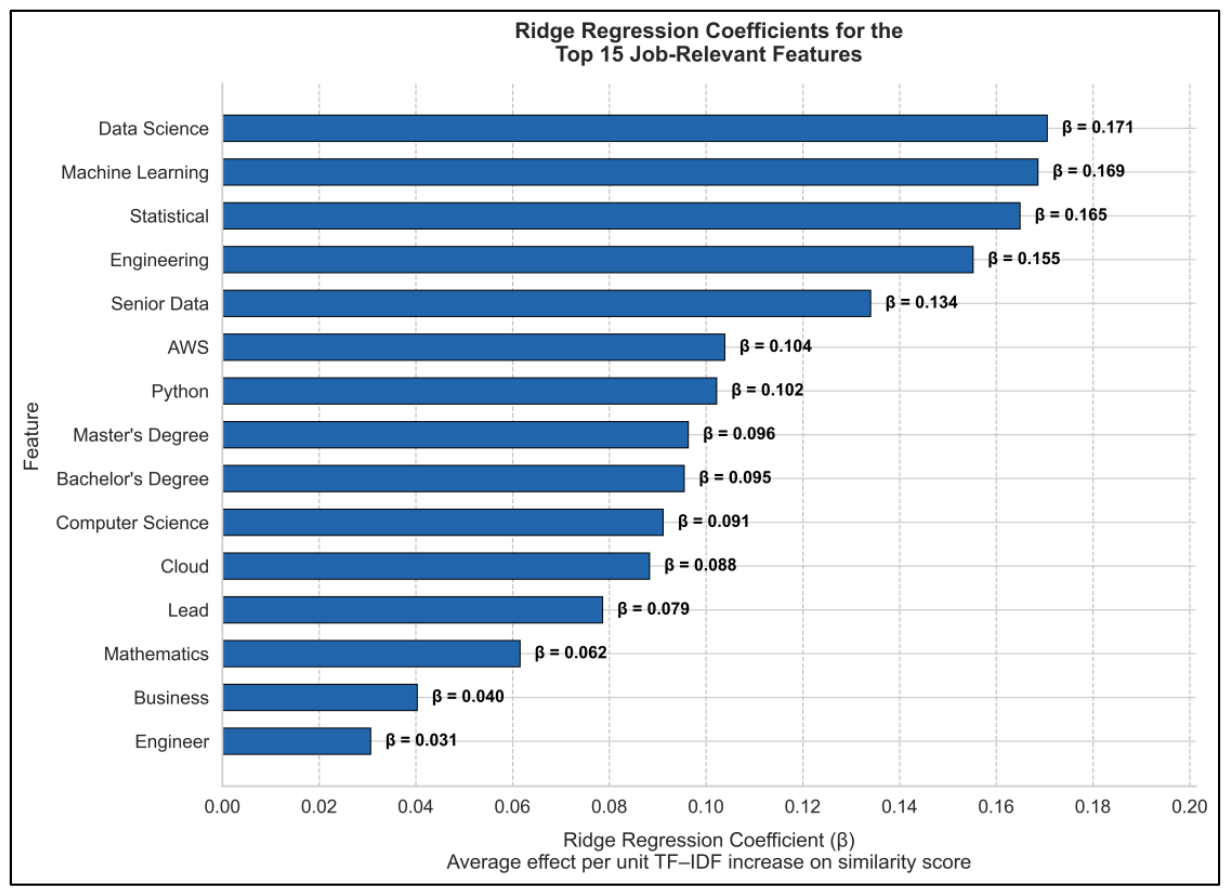
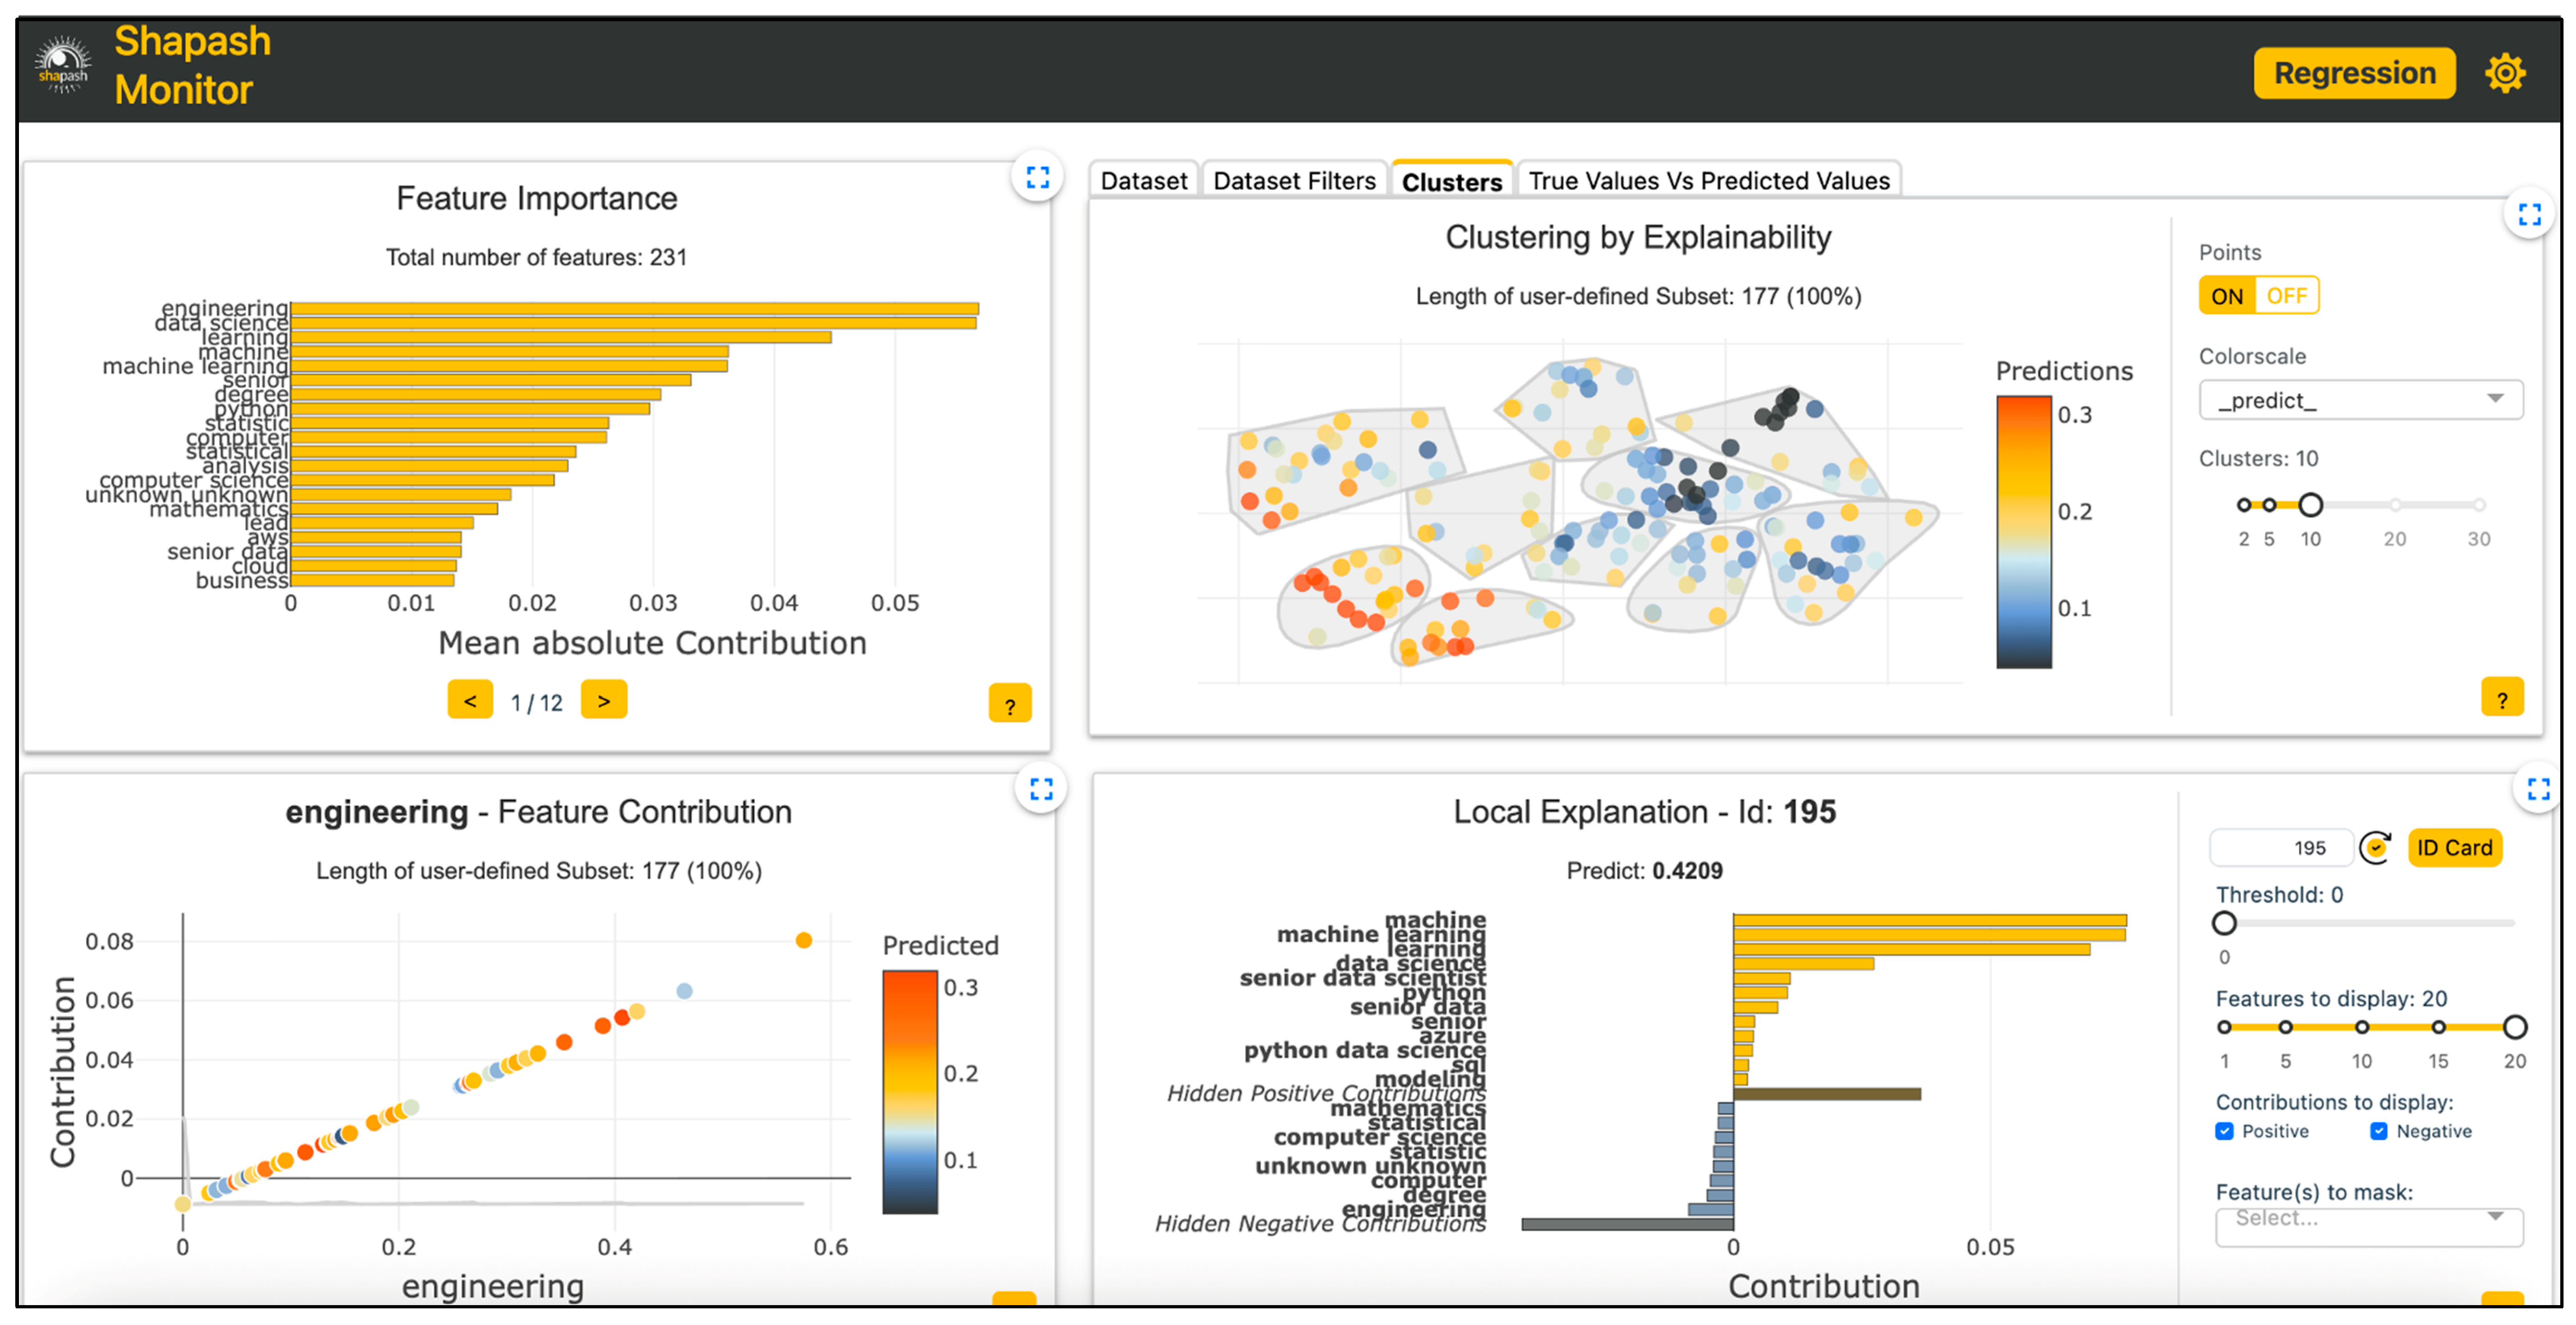

Disclaimer/Publisher’s Note: The statements, opinions and data contained in all publications are solely those of the individual author(s) and contributor(s) and not of MDPI and/or the editor(s). MDPI and/or the editor(s) disclaim responsibility for any injury to people or property resulting from any ideas, methods, instructions or products referred to in the content. |
© 2026 by the authors. Licensee MDPI, Basel, Switzerland. This article is an open access article distributed under the terms and conditions of the Creative Commons Attribution (CC BY) license.