


Abstract
University students may use generative artificial intelligence (GenAI) for practical assistance while delegating independent cognitive activity. We examined whether these behaviors form contrasting profiles or increase together, and whether separate psychological and contextual measures predict profile membership. A cross-sectional survey at a Thai public university yielded 593 analyzed respondents from 634 eligible responses, divided before clustering into development (n = 474) and locked-test (n = 119) cohorts. Two K-means profiles represented lower and higher levels across Information Use, Productivity Use, and Cognitive Substitution; the primary solution did not identify a distinct high-use, low-substitution group. Among development-selected classifiers, the construct-only support vector machine achieved locked-test Macro-F1 of 0.824, compared with 0.787 for combined gradient boosting and 0.553 for context/usage logistic regression. The combined block had the highest development mean Macro-F1 (0.814), but adding context offered little incremental information beyond the constructs. Cognitive Offloading was the strongest predictive discriminator, followed by trust in AI and AI self-efficacy. These associations are conditional on related self-report measures and a sample-specific partition, with substantial disagreement between clustering algorithms. The findings support examining what students delegate alongside usage frequency and motivate assessment that makes independent reasoning visible, without establishing causal mechanisms or learning effects.
1. Introduction
Generative artificial intelligence (GenAI) places information retrieval, explanation, content production, and planning within a conversational interface. For universities, the relevant question is therefore broader than whether students adopt the technology. Students can engage with the same system for substantially different purposes and can allocate different amounts of reasoning, verification, and decision-making to it. Research on university students has already identified heterogeneous patterns of reliance across learning tasks and different forms of engagement with AI [1,2]. Understanding these patterns is important for educational informatics because a usage count provides limited information about the cognitive work that remains with the learner.
This distinction becomes particularly consequential when instrumental use and cognitive substitution coexist. A student may use GenAI to organize information or prepare an outline while independently evaluating the content; another may use similar functions while accepting the resulting reasoning with limited examination. These examples describe different allocations of cognitive activity, even when both students report frequent use. Experimental research illustrates why immediate task performance and independent learning should be distinguished. Fan et al. found that ChatGPT 4.0 support improved essay performance without a significant corresponding advantage in knowledge gain or transfer [3]. In a separate educational setting, Darvishi et al. examined how AI assistance related to student agency and subsequent independent work [4]. These findings do not establish that GenAI generally impairs thinking. They show that the value of assistance cannot be inferred from the presence of assistance alone.
Person-centered analysis offers a way to examine how several dimensions of engagement occur together. Instead of estimating only an average relationship between use and a single outcome, it identifies empirical patterns across multiple behavioral domains. Stojanov et al. distinguished five profiles of self-reported ChatGPT reliance across learning tasks [1]. Other studies have classified students by AI literacy engagement or have identified adoption personas among students and educators [2,5]. These approaches establish the relevance of heterogeneity, but the meaning of each profile remains dependent on its defining variables, population, and analytical choices. A profile of attitudes toward adoption is not equivalent to a profile of behavior, and neither is necessarily a stable psychological type.
A further challenge arises when profile discovery is combined with machine learning. If the same variables are used first to create clusters and then to predict those cluster labels, a classifier may mainly reproduce the partitioning rule. High accuracy then says little about whether separate psychological or contextual information can distinguish the behavioral profiles. Likewise, a test sample cannot provide independent evidence about a discovery procedure if it influenced preprocessing or the selection of the cluster solution. These concerns follow the broader principle that evaluation data must be kept separate from data-dependent analytical choices [6]. They are especially relevant when unsupervised labels become the target of a subsequent supervised model.
We address these issues by distinguishing three profile-defining behavioral domains—Information Use, Productivity Use, and Cognitive Substitution—from five theoretically relevant predictor constructs: trust in AI, cognitive offloading, ethical concern, self-reported AI literacy, and AI self-efficacy. Productivity Use comprises content creation and planning; perceived work efficiency is examined separately as an external characterization measure. Using responses from Generation Z students at a Thai public university, we separate development and test cohorts before profile discovery, select profiles using development data, and assign test respondents to the resulting frozen solution. We then evaluate whether distinct constructs and contextual information predict those assignments.
The contribution is a behavioral account of GenAI engagement supported by a carefully bounded discovery-and-prediction design. We test whether the data support a high-use, low-substitution configuration, rather than assuming that an augmentation-oriented profile must exist. Feature-block comparisons, explanation stability, and sensitivity analyses further assess what information distinguishes membership and how much the conclusions depend on analytical choices. The objective is to characterize a sample-specific pattern of human–AI interaction, with machine learning serving the substantive inquiry.
2. Related Work and Research Questions
2.1. GenAI Engagement and Person-Centered Heterogeneity
Research on student GenAI engagement encompasses different analytical objects, including adoption attitudes, self-reported competence, task-specific reliance, and learning behavior. These objects should be distinguished when comparing profile solutions. In a study of 490 university students, Stojanov et al. used latent profile analysis of reliance across 13 learning tasks and identified five profiles [1]. Their task-based approach demonstrates that reliance can be differentiated by the activities in which support is sought. Medina-Gual and Parejo combined principal component analysis and K-means clustering among 353 undergraduates at a Mexican private university to identify three profiles of engagement in AI literacy [2]. Saihi and Ahmed examined 192 students and educators and identified four adoption personas through hierarchical and K-means clustering [5].
The different profile counts do not necessarily indicate conflicting evidence. Each study partitions a different set of attributes in a different population. More clusters may reveal finer distinctions, but an interpretable distinction alone does not establish that it is stable or generalizes beyond the discovery sample. For the present study, the relevant attributes are the intensity of information use, the intensity of content creation and planning, and the extent of cognitive substitution. This behavioral focus makes it possible to ask whether productive uses and substitution form contrasting configurations or rise together. Attitudes and perceived capabilities are reserved for the subsequent prediction analysis so that their contribution can be assessed against profiles defined independently of those predictor scores.
2.2. Instrumental Use, Cognitive Substitution, and Offloading
We distinguish the function performed with GenAI from the cognitive activity delegated to it. Information Use concerns engagement with AI for information-related tasks. Productivity Use concerns content creation and planning. Cognitive Substitution concerns the reported replacement of independent cognitive activity by AI-supported responses. These domains can correlate without being interchangeable. Instrumental usefulness is not evidence that independent reasoning has been retained, and reported substitution is not a direct measure of learning loss. Accordingly, a high-use, low-substitution configuration would be consistent with an augmentation-oriented pattern within the questionnaire, but it would not by itself demonstrate superior learning outcomes.
Cognitive offloading provides a theoretical basis for examining delegation. Risko and Gilbert describe offloading as the use of external actions or resources to reduce a task’s internal cognitive demands [7]. Such practices can be adaptive: external resources may support memory or release capacity for other operations. In GenAI interaction, however, the range of delegable activities extends beyond storage to explanation, synthesis, reasoning, and idea generation. The educational significance therefore depends on which operations are delegated, how outputs are checked, and what independent understanding is expected.
Cognitive offloading and cognitive substitution are operationalized as related constructs with different item emphases. Offloading items include delegating initial information processing and idea generation to reduce cognitive effort (I029 and I035); substitution items emphasize relying on AI while doing little independent thinking, analysis, or verification (I088, I094, and I097). The boundary is not absolute: an offloading item also concerns using AI instead of memorizing information (I028). Offloading therefore does not necessarily preserve independent reasoning. The distinction rests on the pattern of item content and empirical separation, not on a claim that the two processes are mutually exclusive. Shared self-report methods and related content may strengthen their predictive relationship.
Evidence from human–AI collaboration reinforces the need for task-specific interpretation. A systematic review and meta-analysis by Vaccaro et al. found substantial variation in the performance of human–AI combinations across tasks [8]. Educational experiments similarly distinguish performance with assistance from learning or performance after assistance is withdrawn [3,4]. These studies motivate examining the allocation of cognitive work while avoiding the assumption that either greater use or lower use is intrinsically preferable.
2.3. Trust, Self-Efficacy, Literacy, and Ethical Concern
Trust can make AI assistance acceptable and usable, but the appropriate objective is calibrated reliance. The trust-in-automation framework of Lee and See emphasizes the relationship between trust and reliance in a particular context [9]. Applied to student GenAI engagement, this perspective suggests that trust may distinguish students who readily incorporate AI into their work. It does not imply that a high trust score establishes accurate recognition of the system’s capabilities or limitations. Trust is consequently examined as predictive information about profile membership, rather than as an intrinsically beneficial or detrimental attitude.
AI Self-Efficacy concerns perceived capability to work with AI. Instrument-development research treats this as a measurable psychological construct with multiple facets [10]. Confidence may support experimentation, persistence, and integration into study practices; it may also coexist with greater delegation. The direction and practical meaning of its association therefore depend on the behavioral profile being predicted. We do not assume that confident users necessarily retain more independent cognitive control.
AI literacy extends beyond familiarity with an interface. Conceptual work includes understanding AI, using it, evaluating its outputs, and considering ethical issues [11]. Validation research also distinguishes self-assessed literacy from related psychological competencies [12]. The present questionnaire measures self-reported AI literacy. Its score therefore indicates perceived understanding and capability rather than performance on an objective knowledge test. This boundary matters when interpreting its relationship with use and self-efficacy: a respondent can report substantial competence without demonstrating the ability to detect an erroneous explanation or an unsupported citation.
Ethical concern may capture reservations that are not reducible to usage intensity. Student survey evidence documents perceived benefits alongside concerns about accuracy, privacy, and ethics [13]. Such concerns may relate to conduct or consequences that the profile variables do not measure. Its value for predicting a particular partition must therefore be distinguished from its normative and educational importance. Including trust, offloading, literacy, self-efficacy, and ethical concern together allows their predictive contributions to be compared within a common model while recognizing that correlated constructs may share information.
2.4. Profile Discovery, Prediction, and Explanation
A behavioral profile is an analytical representation of multivariate variation. Internal separation, stability under perturbation, adequate group size, and parsimony provide complementary evidence about a candidate partition. None establishes that clusters are natural classes. A solution may be reproducible because a continuous intensity gradient is strongly represented, rather than because sharply distinct categories exist. As methodological work on clustering emphasizes, the usefulness of a partition depends on the substantive problem and the criteria used to assess it [14]. The empirical question is therefore which partition provides the most defensible summary under the specified measurement and evaluation design.
Profile prediction introduces an additional distinction between constructing a target and predicting it. In this study, behavioral scores define the target, whereas theoretically related constructs and contextual variables supply the predictors. Preventing direct reuse of profile-defining items and scores limits circular classification. Reserving a test cohort before clustering separately protects the final evaluation from test-informed scaling or profile selection [6]. These controls concern different sources of optimism and must operate together.
Predictive explanations can clarify which features a fitted model uses, but they remain dependent on the model, feature representation, and reference distribution. Permutation importance evaluates changes in predictive performance when feature information is disrupted. Shapley-based explanations distribute model predictions across features or groups according to a specified coalition procedure. Neither method identifies causal effects, and attribution depends on how the distribution of removed features is represented [15]. Agreement across explanation methods and folds is consequently used as evidence of a consistent predictive pattern, not as proof of a psychological mechanism.
2.5. Research Questions
The study addresses five research questions:
RQ1: What stable behavioral profiles emerge from Information Use, Productivity Use, and Cognitive Substitution among the surveyed students?
RQ2: Do the data support an asymmetric profile characterized by high instrumental GenAI use but comparatively low Cognitive Substitution?
RQ3: How accurately can membership in the frozen profiles be predicted out of sample using context and usage features, psychological and cognitive constructs, and their combination?
RQ4: How much predictive information do the psychological and cognitive constructs add beyond basic context and usage history, and how much does context add beyond those constructs?
RQ5: Which theoretically grounded predictors contribute most consistently to profile classification across explanation and ablation analyses?
3. Materials and Methods
3.1. Study Design and Setting
We analyzed a cross-sectional survey of Generation Z university students at Mahasarakham University, a public university in Thailand. Online questionnaire responses were recorded from 22 to 27 September 2026. The analysis focused on behavioral profile discovery and prediction and did not estimate causal effects or evaluate an educational intervention.
The same broader survey cohort underlies the published study by Sukprasert and Phothong, Responsible GenAI Augmentation and Cognitive Agency in Higher Education [16]. That report uses structural equation modeling to examine theory-driven associations concerning responsible GenAI augmentation and university service intention. The present study examines behavioral profiles and their prediction, with distinct research questions and analytical roles for the constructs.
3.2. Participants and Data Collection
The questionnaire was administered through Google Forms using non-probability convenience sampling with eligibility screening. Instructors helped disseminate and explain the invitation, and the survey was accessible through electronic invitations/email, LINE groups, and QR codes [16]. Recruitment and data collection followed ethics approval on 4 September 2026; recorded responses span 22–27 September 2026. Exact invitation dates and an invitation denominator are not documented in the available records, so a response rate could not be established.
Eligibility required an age of 18–27 years and previous use of GenAI at least once. Both screening questions were required, and all 634 responses satisfied these criteria. The export contained demographic, educational, and usage-context fields, multi-item measures, and an optional comment field. We defined Generation Z operationally through the survey’s age eligibility rather than making claims about an entire birth cohort. The responses were not weighted to university enrollment. No authoritative enrollment benchmark was available for assessing whether the observed faculty distribution matched the university population.
3.3. Questionnaire and Construct Boundaries
We used a literature-informed Thai questionnaire whose historical item-development records are incomplete [16]. Consequently, item-by-item adaptation from published instruments and precollection pilot testing, expert/content review or IOC assessment, and formal translation/back-translation procedures cannot be verified from those records. Conceptual correspondence with existing measures does not establish which sources were used during development.
Three behavioral domains defined the profiles. Information Use comprised 12 items covering information seeking, knowledge acquisition, analysis, and utilization. Productivity Use comprised six items covering content creation and planning. Cognitive Substitution comprised 12 items covering reliance on AI thinking, AI-dependent decision-making, reduced independent thinking, and acceptance of AI output. Each domain used five-point frequency responses. Productivity Use excluded the four agreement items measuring Perceived Work Efficiency, which were used only for profile characterization.
The predictor constructs were trust in AI, cognitive offloading, ethical concern toward AI, self-reported AI literacy, and AI self-efficacy, each measured with 10 items. Cognitive offloading used frequency responses; the other four predictor constructs used agreement responses. All substantive responses were coded from 1 to 5, with higher scores representing more of the named construct. AI Literacy measured perceived knowledge and capability, rather than performance on an objective literacy test. These questionnaire-specific composites were analyzed using their prespecified item sets; internal-consistency estimates do not establish independent instrument validation. Supplementary Methods S1 gives the item mapping and response anchors. Supplementary Section S6 (Tables S2–S10) provides descriptive English translations of all 84 items used in this study, their construct roles, response formats, and fixed scoring. These translations document the Thai questionnaire; they are not evidence of a formally validated English instrument.
3.4. Data-Quality Screening
We assessed eligibility, missing values, out-of-range responses, exact duplicate records, repeated timestamps, and within-person response variation. There were no invalid measurement values, no missing required substantive responses outside the institutional-support items reserved for separate research, and no exact duplicate response records. Institutional-support responses indicating insufficient knowledge were treated as missing for response-quality screening and did not enter the profile or predictor scores.
Exact straightlining was defined as zero within-person standard deviation across the 92 scored items in the broader questionnaire, ignoring non-substantive institutional-support responses. We excluded 41 exact straightliners under this prespecified response-pattern rule. We retained 23 near-straightliners with a positive within-person standard deviation no greater than 0.25 and examined their exclusion in sensitivity analysis. These rules did not establish whether an individual response was careless or fraudulent. The export did not provide completion durations or unique participant identifiers, so response speed and repeat participation could not be established. Eighteen records shared a timestamp with another record; a shared timestamp alone was not an exclusion criterion. The primary cohort comprised 593 respondents (Table 1).
Table 1.
Sample characteristics and response-quality flow.
3.5. Construct Scores and Measurement Assessment
Construct scores were unweighted item means, requiring at least 80% substantive responses, rounded upward to the next whole item. No item was reverse-scored or deleted to improve reliability. The nine constructs used in this paper were complete in the primary cohort, so the minimum-response rule did not require imputation. We examined distributions, corrected item–total correlations, floor and ceiling proportions, Cronbach’s alpha, and one-factor omega total. The one-factor omega reliability coefficient was calculated from a single-factor analysis of standardized items and therefore summarized internal consistency under that approximation, rather than confirming the instrument’s full dimensional structure. We also inspected Pearson correlations and heterotrait–monotrait ratios (HTMT) as preliminary evidence of construct separation [17]. These descriptive checks used the primary cohort. Item content and scoring were fixed; measurement summaries did not determine feature removal or supervised preprocessing. The complete HTMT and composite-correlation matrices for this study are reported in Supplementary Section S7 (Tables S11 and S12). They provide within-sample diagnostics for fixed composites, rather than latent-variable confirmation or independent scale validation.
3.6. Development and Locked-Test Split
We randomly divided the primary cohort into development (n = 474) and locked-test (n = 119) sets, using an 80:20 allocation and seed 20260927. The split was unstratified because profiles had not yet been estimated. It preceded profile standardization and discovery. The test set did not determine cluster number, classifier selection, or hyperparameters. Standardization for profile discovery used development means and population standard deviations, which were then frozen for test assignment. This separation addresses test contamination while retaining a distinct final assessment of the fitted workflow [6].
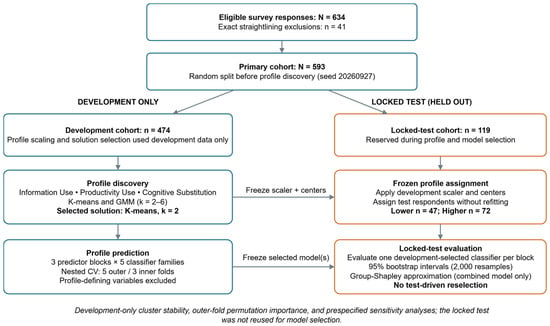
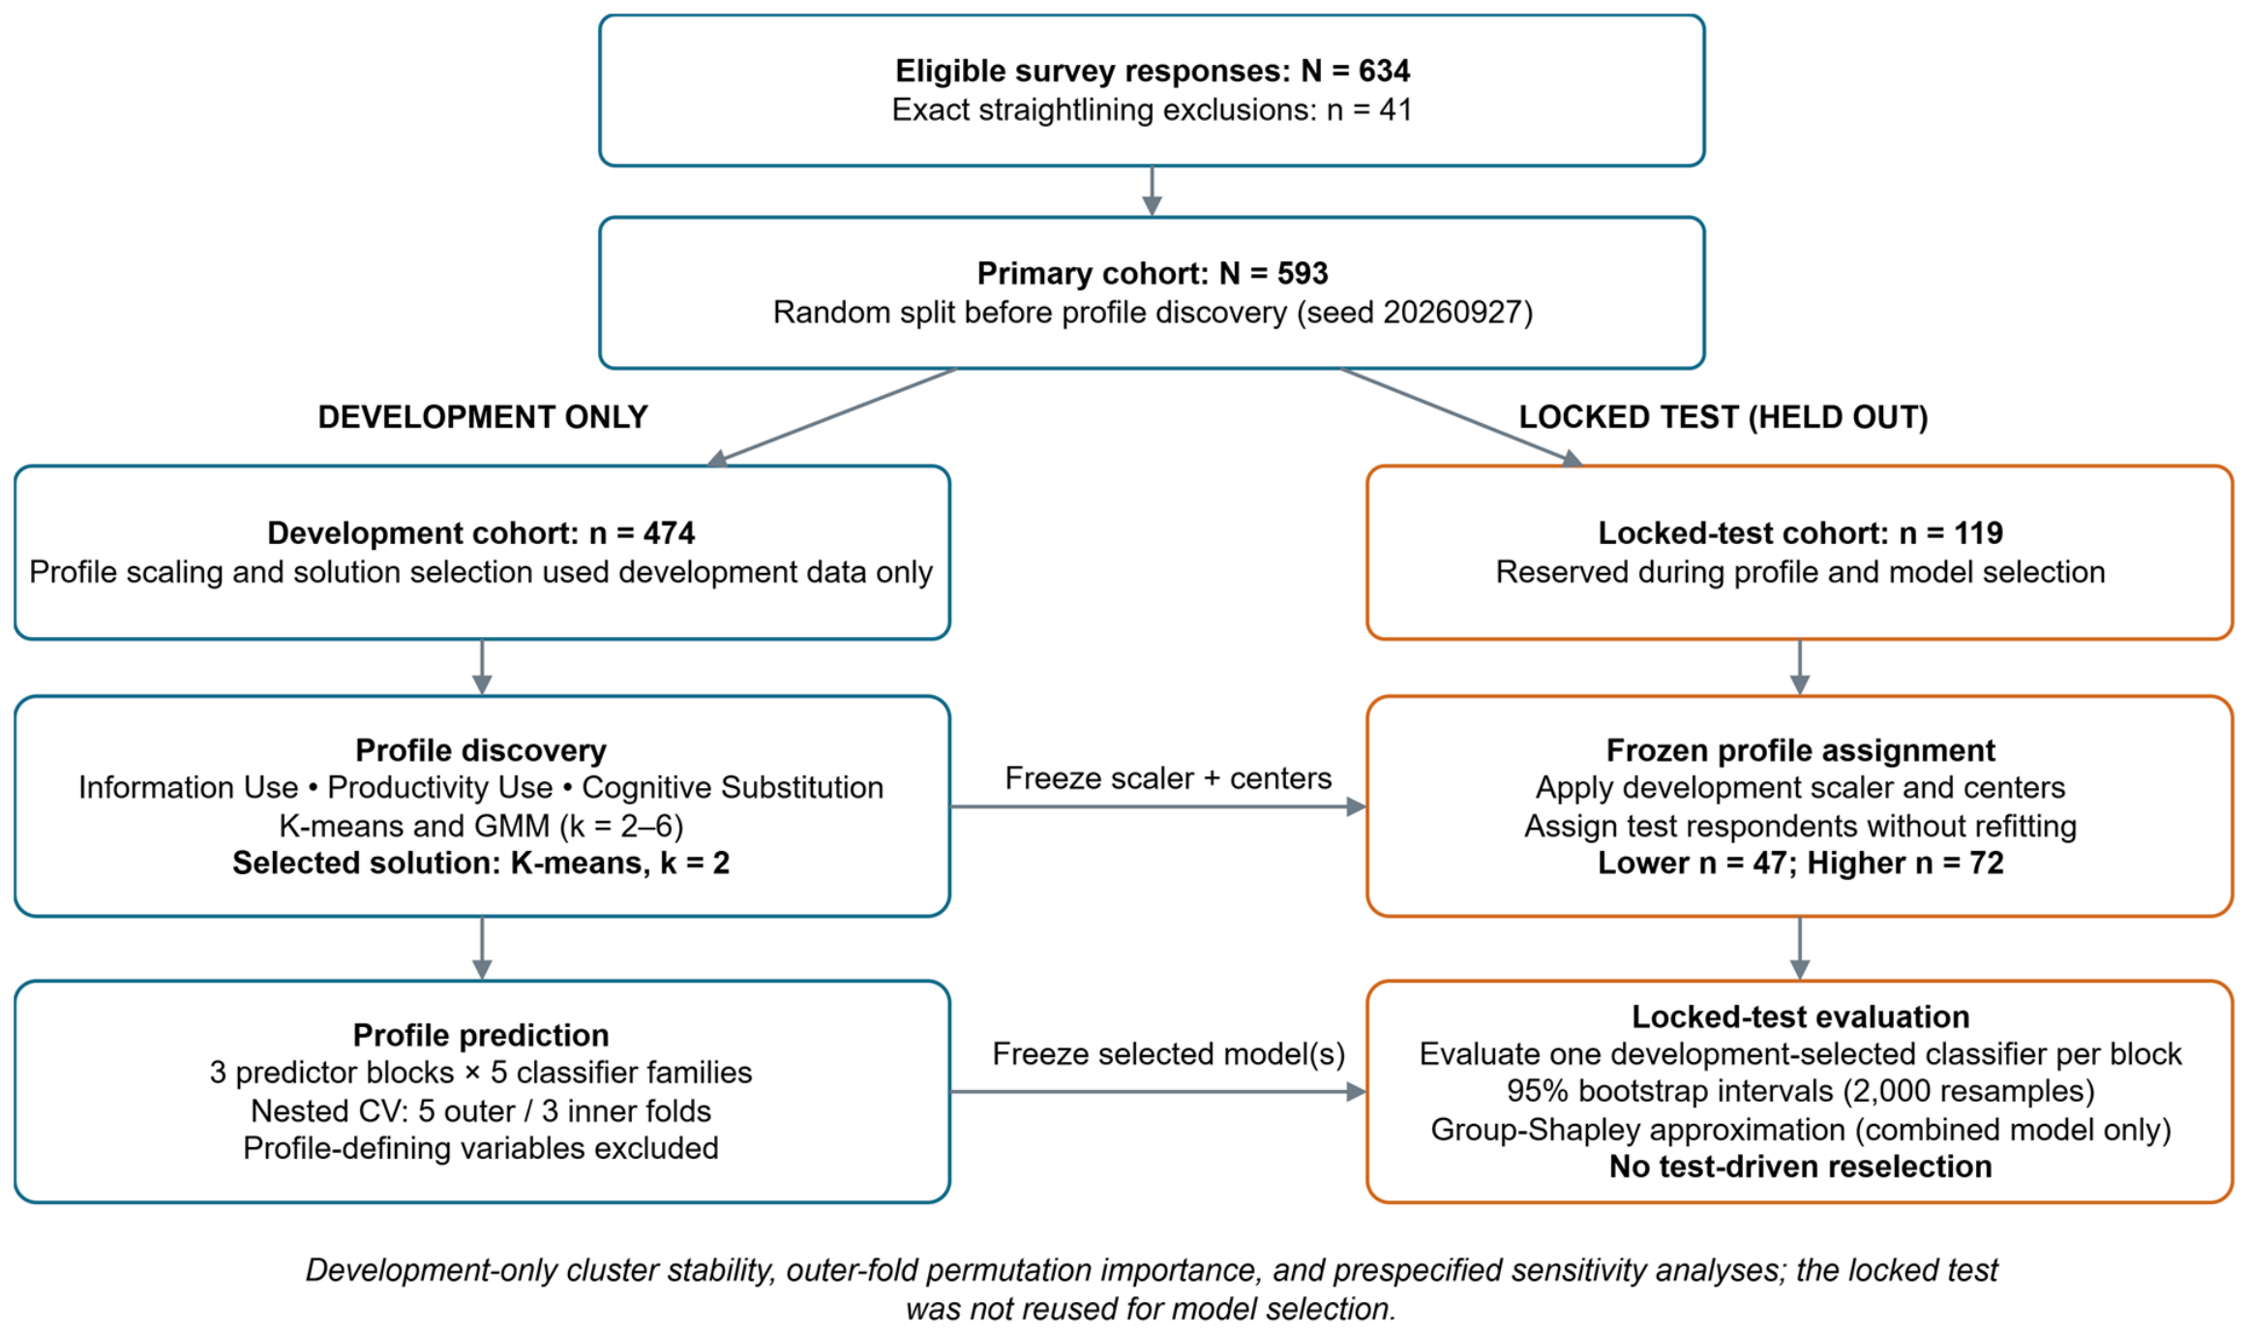
The overall analytical workflow is summarized in Figure 1.
Figure 1.
Analytical workflow. After response-pattern screening, respondents were divided into development and locked-test cohorts before profile discovery. Scaling and solution selection used development observations; locked-test observations were assigned to frozen centers without refitting. Three predictor blocks and five classifier families were compared with nested cross-validation. Only the selected classifier within each block was evaluated on the locked test.
3.7. Profile Discovery
We standardized Information Use, Productivity Use, and Cognitive Substitution and compared K-means and Gaussian mixture models (GMMs) with k = 2–6. K-means used 100 initializations and a maximum of 1000 iterations. For each GMM cluster number, we compared full, diagonal, tied, and spherical covariance structures, using 20 initializations, a covariance regularization of 10−6, and up to 1000 iterations. The covariance structure with the lowest Bayesian information criterion was retained at each k. We retained default convergence tolerances in scikit-learn. GMM information criteria were compared within the mixture-model family; they were not used as a common objective for comparing mixtures with K-means. The GMM comparison probes dependence on a different distributional representation. Its likelihood-based fit criterion and the geometric separation summarized by silhouette address different properties; a low GMM silhouette alone does not invalidate a mixture model.
3.8. Cluster Selection and Stability
We considered silhouette separation, Davies–Bouldin and Calinski–Harabasz indices, cluster sizes, stability, parsimony, and substantive interpretability. Silhouette values summarized separation in the three-score Euclidean space [18]. For each candidate, 100 subsamples containing 80% of development respondents were drawn without replacement. We compared each subsample partition with the full-development labels for those same respondents using the adjusted Rand index (ARI) and label-matched Jaccard coefficients [19,20]. K-means subsample fits used 30 initializations; GMM subsample fits used 10. The original development scaling was held fixed in these comparisons. Consequently, stability estimates describe perturbations of the fitted development representation rather than the uncertainty of re-estimating every preprocessing step. We additionally examined 50 single-initialization K-means fits. No single statistical index was treated as proof of natural classes.
3.9. Frozen Assignment of Test Respondents
K-means with two clusters was selected and frozen, including its scaler, centers, and label mapping. Lower and higher overall use/substitution labels were assigned according to the sum of the standardized centers. Test respondents were standardized with the development parameters and assigned to their nearest frozen center without refitting. We summarized assigned group sizes, empirical test means, distances, and the test silhouette. Development center coordinates refer to the fitted K-means prototypes; empirical means of assigned observations can differ slightly under finite convergence tolerance. Test separation assesses transport of the frozen partition within this sample split, rather than independently rediscovering or externally validating the clusters.
3.10. Predictor Feature Blocks
Block A contained context and usage variables: gender, age group, educational level, year of study, exposure to university AI training, length of GenAI experience, recent use frequency, payment mode, and model awareness. It also contained counts of reported tools and purposes, five common tool indicators, and five common purpose indicators. A token was retained if it appeared at least 10 times in development responses. This vocabulary was established once in development and applied unchanged to test records. Faculty was included only in sensitivity analysis. Block B comprised the five psychological and cognitive scores. Block C combined Blocks A and B, giving 26 raw predictor groups. One-hot encoding of categorical variables and standardization of numeric variables occurred inside the supervised training pipeline, with unseen categories ignored during transformation.
The profile-defining items, scores, subdimensions, and their derived variables were excluded from all predictor blocks. Perceived Work Efficiency was also excluded. The broader survey’s institutional-support and service-intention constructs did not enter profile discovery, prediction, or the substantive framework of this paper. Keeping behavioral target construction separate from the predictor matrix prevents direct reconstruction of cluster labels from the same variables used to create them.
3.11. Classifier Families
We compared logistic regression, random forest, radial-basis support vector machine (SVM), gradient boosting, and histogram gradient boosting, all implemented in scikit-learn [21]. Class weighting was used for logistic regression, random forest, SVM, and histogram gradient boosting. Conventional gradient boosting was unweighted. No synthetic oversampling was performed. XGBoost and LightGBM were unavailable and were not run; the two scikit-learn boosting implementations were the evaluated alternatives. Supplementary Table S1 gives the search grids, and Table S14 lists the hyperparameters selected on the full development cohort.
3.12. Nested Classifier Validation and Selection
We used five stratified outer folds shared across all models and feature blocks. Within each outer-training partition, three-fold stratified cross-validation selected hyperparameters by Macro-F1. We selected a classifier family within each block by mean outer-fold Macro-F1, with mean MCC and pooled out-of-fold log loss as successive tie-breakers. The selected family was tuned using five-fold cross-validation on the complete development cohort and then evaluated on the locked test set. Unselected candidate families were not evaluated on the test set. Supplementary Table S13 reports the five outer-fold scores for every family and block; Table S14 lists full-development hyperparameters for all candidate families and blocks, with the selected classifiers marked.
This nesting concerned supervised preprocessing and hyperparameter selection. The profile labels had already been defined using the complete development cohort; clustering was not repeated inside the classifier folds. Development cross-validation therefore estimates classification performance conditional on that empirical profile definition and the development-derived feature vocabulary, and its use for selecting model families can favor the winning development estimate [22]. The locked test assesses the final frozen profile-assignment and classification workflow independently of those selection decisions. It does not remove uncertainty about the population-level existence of the profiles.
We evaluated a no-predictor majority-class comparator using the same five outer folds and locked test (Supplementary Section S11). Each validation prediction used the majority label of its outer-training partition; locked-test predictions used the majority label in the complete development cohort. The comparator used the fixed profile assignments and cohort membership and did not inform classifier selection.
3.13. Evaluation Metrics and Uncertainty
Macro-F1 was the primary selection metric. We also reported balanced accuracy, Matthews correlation coefficient (MCC), accuracy, weighted F1, ROC-AUC, log loss, Brier score, class-specific metrics, and calibration plots. We distinguished mean fold-level performance from metrics calculated after pooling out-of-fold predictions. Class predictions used each fitted estimator’s predict method, without separate threshold optimization. In the locked test, 95% percentile intervals were obtained from 2000 bootstrap samples drawn with replacement within the two assigned profiles, preserving their observed sizes. These intervals are conditional on the trained models, frozen cluster definition, and observed class composition; they do not incorporate uncertainty from the entire discovery process. Between-block differences were reported descriptively without a claim of statistical superiority. Macro-F1 averages the two class-specific F1 scores with equal class weight, despite unequal class sizes. The test bootstrap retained 47 lower-profile and 72 higher-profile observations in every replicate. For the constant majority prediction, hard-label metrics are identical across these fixed-composition resamples; this degeneracy does not imply absence of population or profile-discovery uncertainty.
3.14. Explainable Prediction
For the selected combined-model family, we retuned hyperparameters within each outer-training partition and measured permutation importance on its outer-validation partition. Each raw predictor was shuffled 30 times, and importance was the decrease in Macro-F1 from the unshuffled prediction. Categorical inputs were permuted before encoding, preserving their one-hot representation as a group. We summarized mean importance, variation across folds, and the share of folds with positive importance. Permutation measures describe the fitted model’s reliance on a variable and can be affected by correlated predictors [23].
We also approximated interventional group-Shapley contributions to the higher-profile probability for each of the 119 test respondents. For each respondent, 48 random feature orderings were generated, each starting from a sampled development background row. Features were replaced sequentially with that respondent’s values, and marginal probability changes were averaged. Each raw feature formed one group. This model-agnostic Monte Carlo procedure used the Shapley attribution principle but was not the TreeSHAP algorithm or a call to the SHAP software package [24].
Global importance was the mean absolute contribution across test respondents. Its 95% bootstrap intervals used 2000 resamples of respondents and did not include additional Monte Carlo or model-fitting uncertainty. Because an auxiliary reference probability was estimated separately from the feature paths, it was not used for exact additive local explanations. We interpreted aggregate attribution patterns only. Interventional feature replacement can form combinations that are uncommon when inputs are dependent, and attribution depends on the chosen background distribution [25]. Neither attribution nor permutation importance estimates causal effects.
3.15. Profile Characterization, Ablation, and Sensitivity Analyses
We characterized assigned profiles using continuous means and standard deviations, Cohen’s d, categorical distributions, and Cramér’s V. Welch tests and chi-square tests with Holm adjustment were available as exploratory summaries. Comparisons of the variables used to form clusters were descriptive; their separation was not independent validation. Perceived Work Efficiency provided an external-to-clustering self-report comparison, not an independent measure of task performance.
Structural sensitivity analyses examined all 634 eligible responses, the exclusion of both exact and near-straightliners (n = 570), alternative cluster numbers and algorithms, and 10 profile subdimension scores. The response-quality scenarios used their own reproducible 80:20 splits, so their differences were not interpreted as paired causal effects of exclusions. Targeted predictive sensitivity analyses retained the selected combined classifier family and the five outer folds, retuned within each training partition using a common separate inner-split schedule, and compared the complete combined block with faculty inclusion, cognitive offloading removal, and AI self-efficacy removal. These pooled out-of-fold results form their own ablation comparison and are not interchangeable with the primary mean outer-fold estimates.
3.16. Ethics and Software
The study was reviewed and approved under an exemption review by the Ethics Committee for Research Involving Human Subjects, Mahasarakham University, Thailand (Approval No. 752-769/2026; approval date: 4 September 2026). Responses were recorded from 22 to 27 September 2026, following ethics approval.
The questionnaire provided respondents with information about the study purpose, confidentiality, the academic use of responses, and the non-disclosure of personal information before they completed the survey. No separate signed consent form was used. Names and direct contact details were not included in the profile or predictor matrices.
Analyses used Python 3.12.14, NumPy 2.3.5, pandas 2.2.3, SciPy 1.17.0, and scikit-learn 1.8.0. The master seed was 20260927; deterministic offsets controlled subsampling, tuning, permutation, and bootstrap routines. Supplementary Sections S1–S4 document the feature specifications and seed schedules.
4. Results
4.1. Sample and Response-Quality Flow
All 634 responses met the age and prior-use screening criteria. Excluding 41 exact straightliners left 593 respondents, including 23 near-straightliners retained for primary analysis. Development and test sets contained 474 and 119 respondents, respectively (Figure 1; Table 1). No exclusions arose from invalid required measurements or missing required non-institutional-support responses.
The primary sample included 422 women (71.2%), 163 men (27.5%), and eight respondents who did not disclose gender (1.3%). Most respondents were aged 18–20 years (410; 69.1%); 174 were aged 21–23 years (29.3%), and nine were aged 24–27 years (1.5%). There were 591 undergraduates (99.7%), and 338 respondents were in their first year (57.0%). The Business School accounted for 364 respondents (61.4%), with the remainder distributed across 17 other faculties or colleges. These figures describe the sample composition; their correspondence with university enrollment could not be assessed. Regarding recent use, 273 respondents reported GenAI use on 4–6 days per week (46.0%) and 100 reported daily use (16.9%). The full distribution across all 18 faculties and colleges is reported in Supplementary Table S17.
4.2. Measurement Summary
The nine construct scores were complete for all 593 respondents (Table 2). Cronbach’s alpha ranged from 0.898 for ethical concern to 0.969 for cognitive substitution. One-factor omega ranged from 0.899 to 0.969. The highest HTMT value was 0.819 between AI literacy and AI self-efficacy. These diagnostics supported the use of the fixed composite scores while leaving their full dimensional structure and potential common-method overlap unresolved. For the focal cognitive offloading–cognitive substitution pair, HTMT was 0.670, and the composite Pearson correlation was 0.633 (Supplementary Tables S11 and S12). The measures were empirically distinguishable in these diagnostics while remaining substantially related; these values do not establish conceptual independence.
Table 2.
Construct scores and internal consistency in the primary cohort (N = 593).
Mean scores were 4.098 for Information Use, 3.763 for Productivity Use, and 3.513 for Cognitive Substitution. Perceived Work Efficiency averaged 4.044. The predictor means ranged from 3.676 for trust in AI to 3.969 for AI Self-Efficacy. No item was removed during the analysis.
4.3. Profile Discovery and Solution Comparison
K-means with two clusters provided the strongest joint support among the evaluated solutions (Table 3). Its development silhouette was 0.407, compared with 0.322–0.335 for K-means solutions with three to six clusters. The two-cluster solution had mean subsample ARI of 0.955 and mean matched Jaccard similarity of 0.976. It divided development respondents into groups of 183 (38.6%) and 291 (61.4%), avoiding the small groups present in higher-k solutions. The three-cluster K-means solution was also stable (mean ARI = 0.953), but its lower separation did not support replacing the more parsimonious partition.
Table 3.
Development-cohort comparison of candidate profile solutions (n = 474).
Mixture models produced materially different partitions. The two-component GMM had silhouette 0.034 and mean subsample ARI 0.746; its agreement with the two-cluster K-means labels was ARI = −0.021. Although mixture information criteria improved across some higher-component specifications, the mixture solutions did not combine separation, stability, and group-size adequacy as favorably as the selected K-means partition. The results therefore support the specified K-means representation within this sample, rather than algorithm-independent classes.
4.4. Profile Characterization
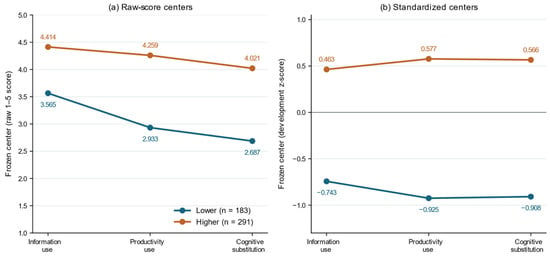
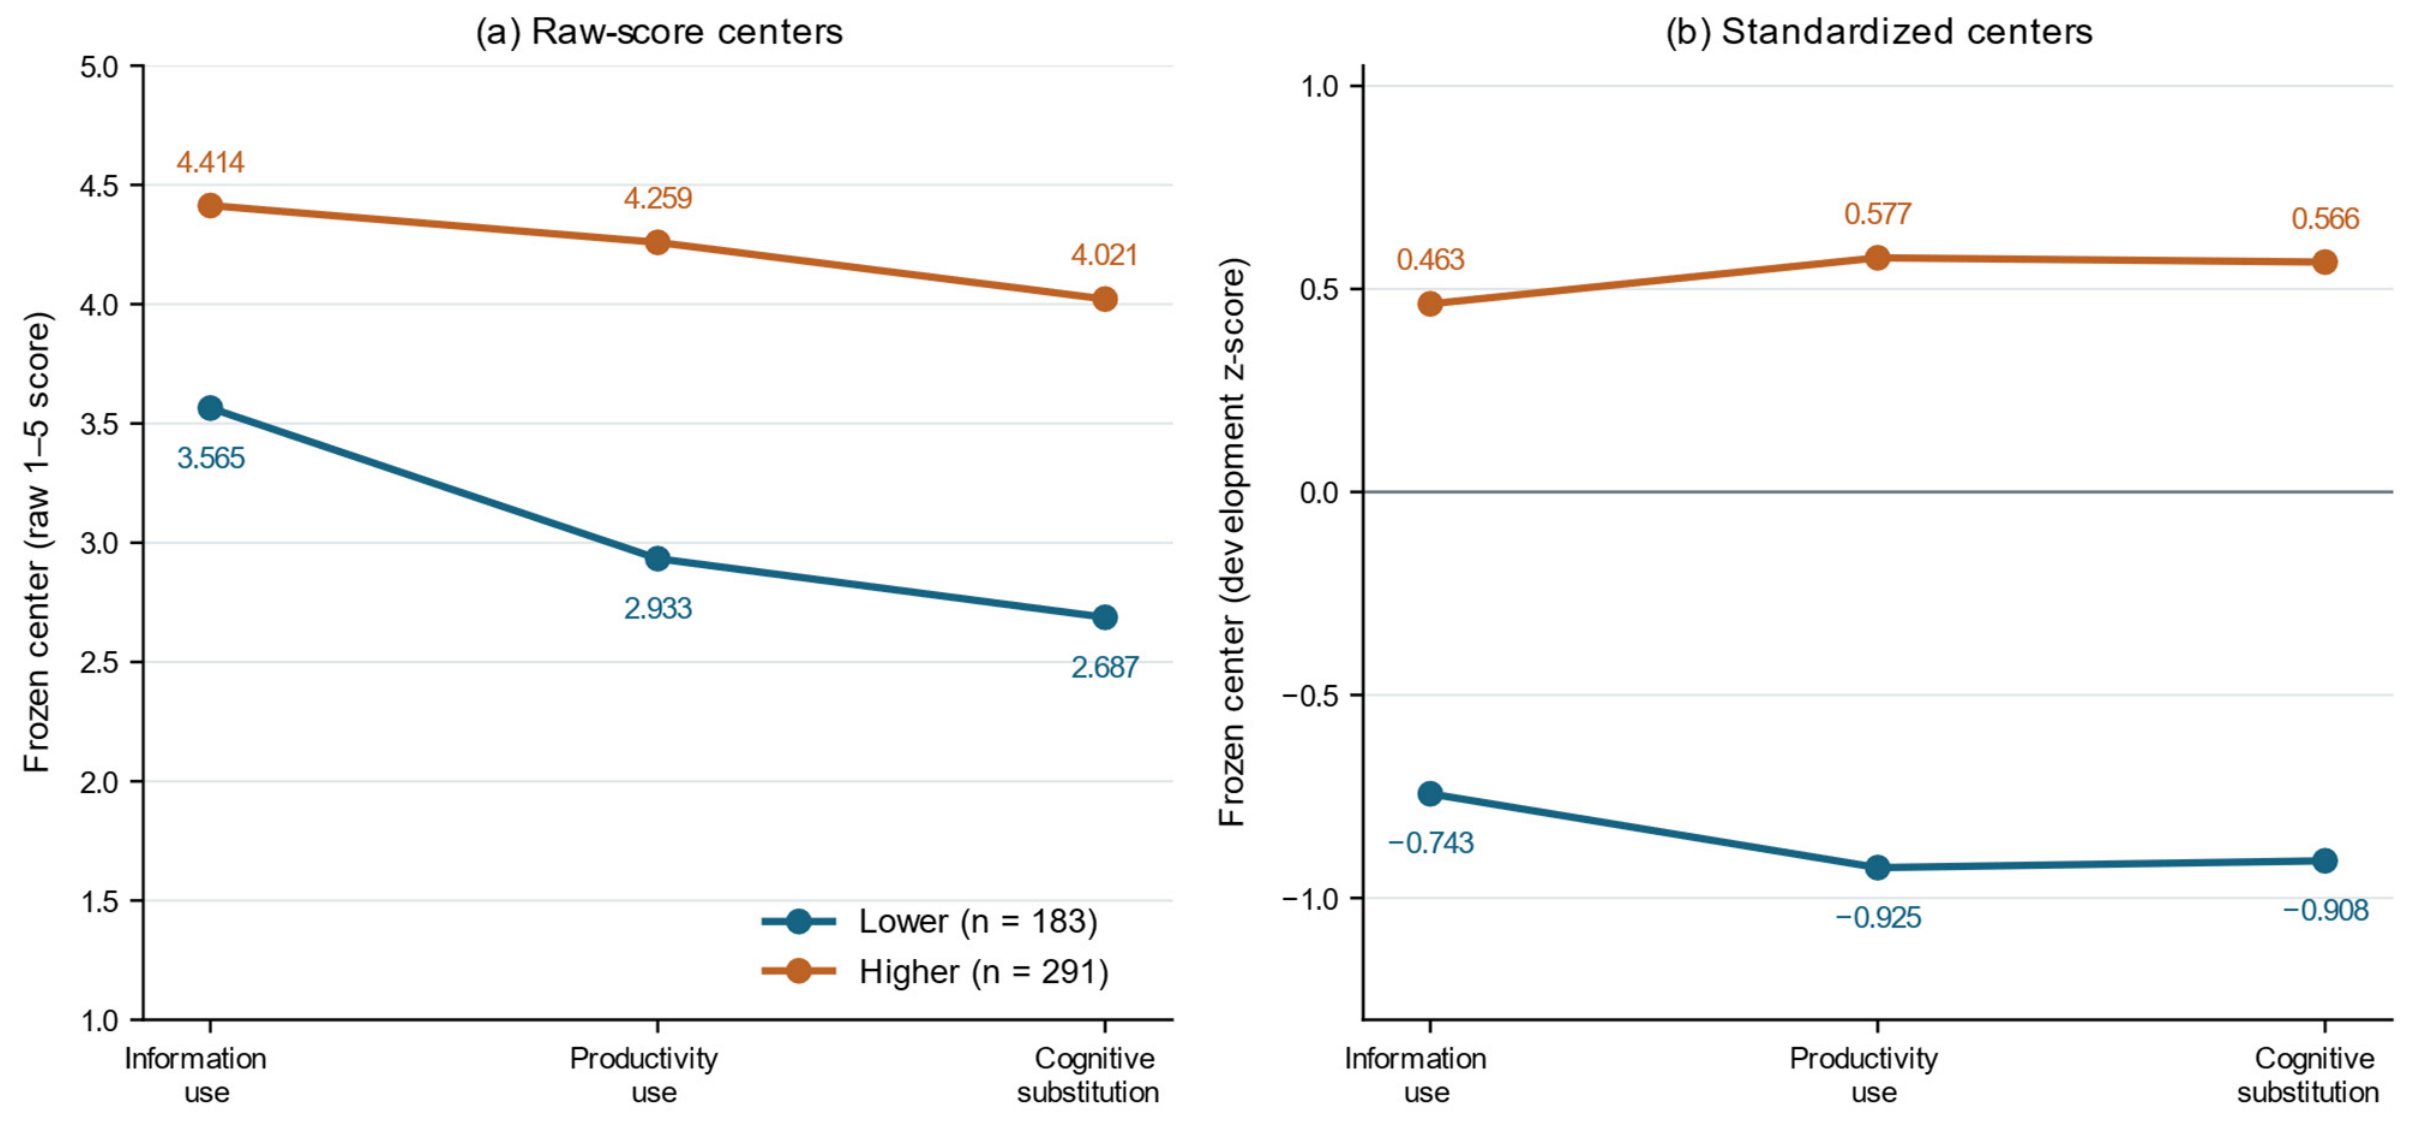
All three behavioral domains increased together across the selected profiles (Figure 2; Table 4). On the original 1–5 scales, the frozen lower-profile center was 3.565 for Information Use, 2.933 for Productivity Use, and 2.687 for Cognitive Substitution. The higher-profile center was 4.414, 4.259, and 4.021, respectively. The primary distinction was overall behavioral intensity. It did not isolate a high-information/high-productivity subgroup with distinctly low substitution.
Figure 2.
Development profile centers for the two-profile K-means solution (n = 474). Panels display raw-score (a) and development-standardized (b) frozen model centers for Information Use, Productivity Use, and Cognitive Substitution. The lower and higher overall use/substitution profiles contained 183 and 291 respondents, respectively. Centers define the frozen classifier-independent assignment rule; they are not empirical means recomputed after final assignment.
Table 4.
Frozen development profile centers and locked-test assigned-group means.
Across the 593 assigned respondents, the higher profile also reported greater Perceived Work Efficiency (mean 4.399 versus 3.485; Cohen’s d = 1.477). Cognitive offloading means were 4.040 versus 3.122 (d = 1.515); trust in AI means were 3.934 versus 3.268 (d = 1.199); and AI Self-Efficacy means were 4.220 versus 3.574 (d = 1.122). Ethical concern showed a smaller difference, with means of 3.872 versus 3.665 (d = 0.309). These are descriptive associations with profile assignment. Greater perceived efficiency did not establish objectively better performance or demonstrate that cognitive substitution was beneficial.
4.5. Assignment in the Locked Test
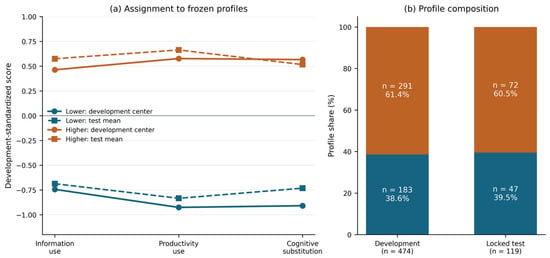
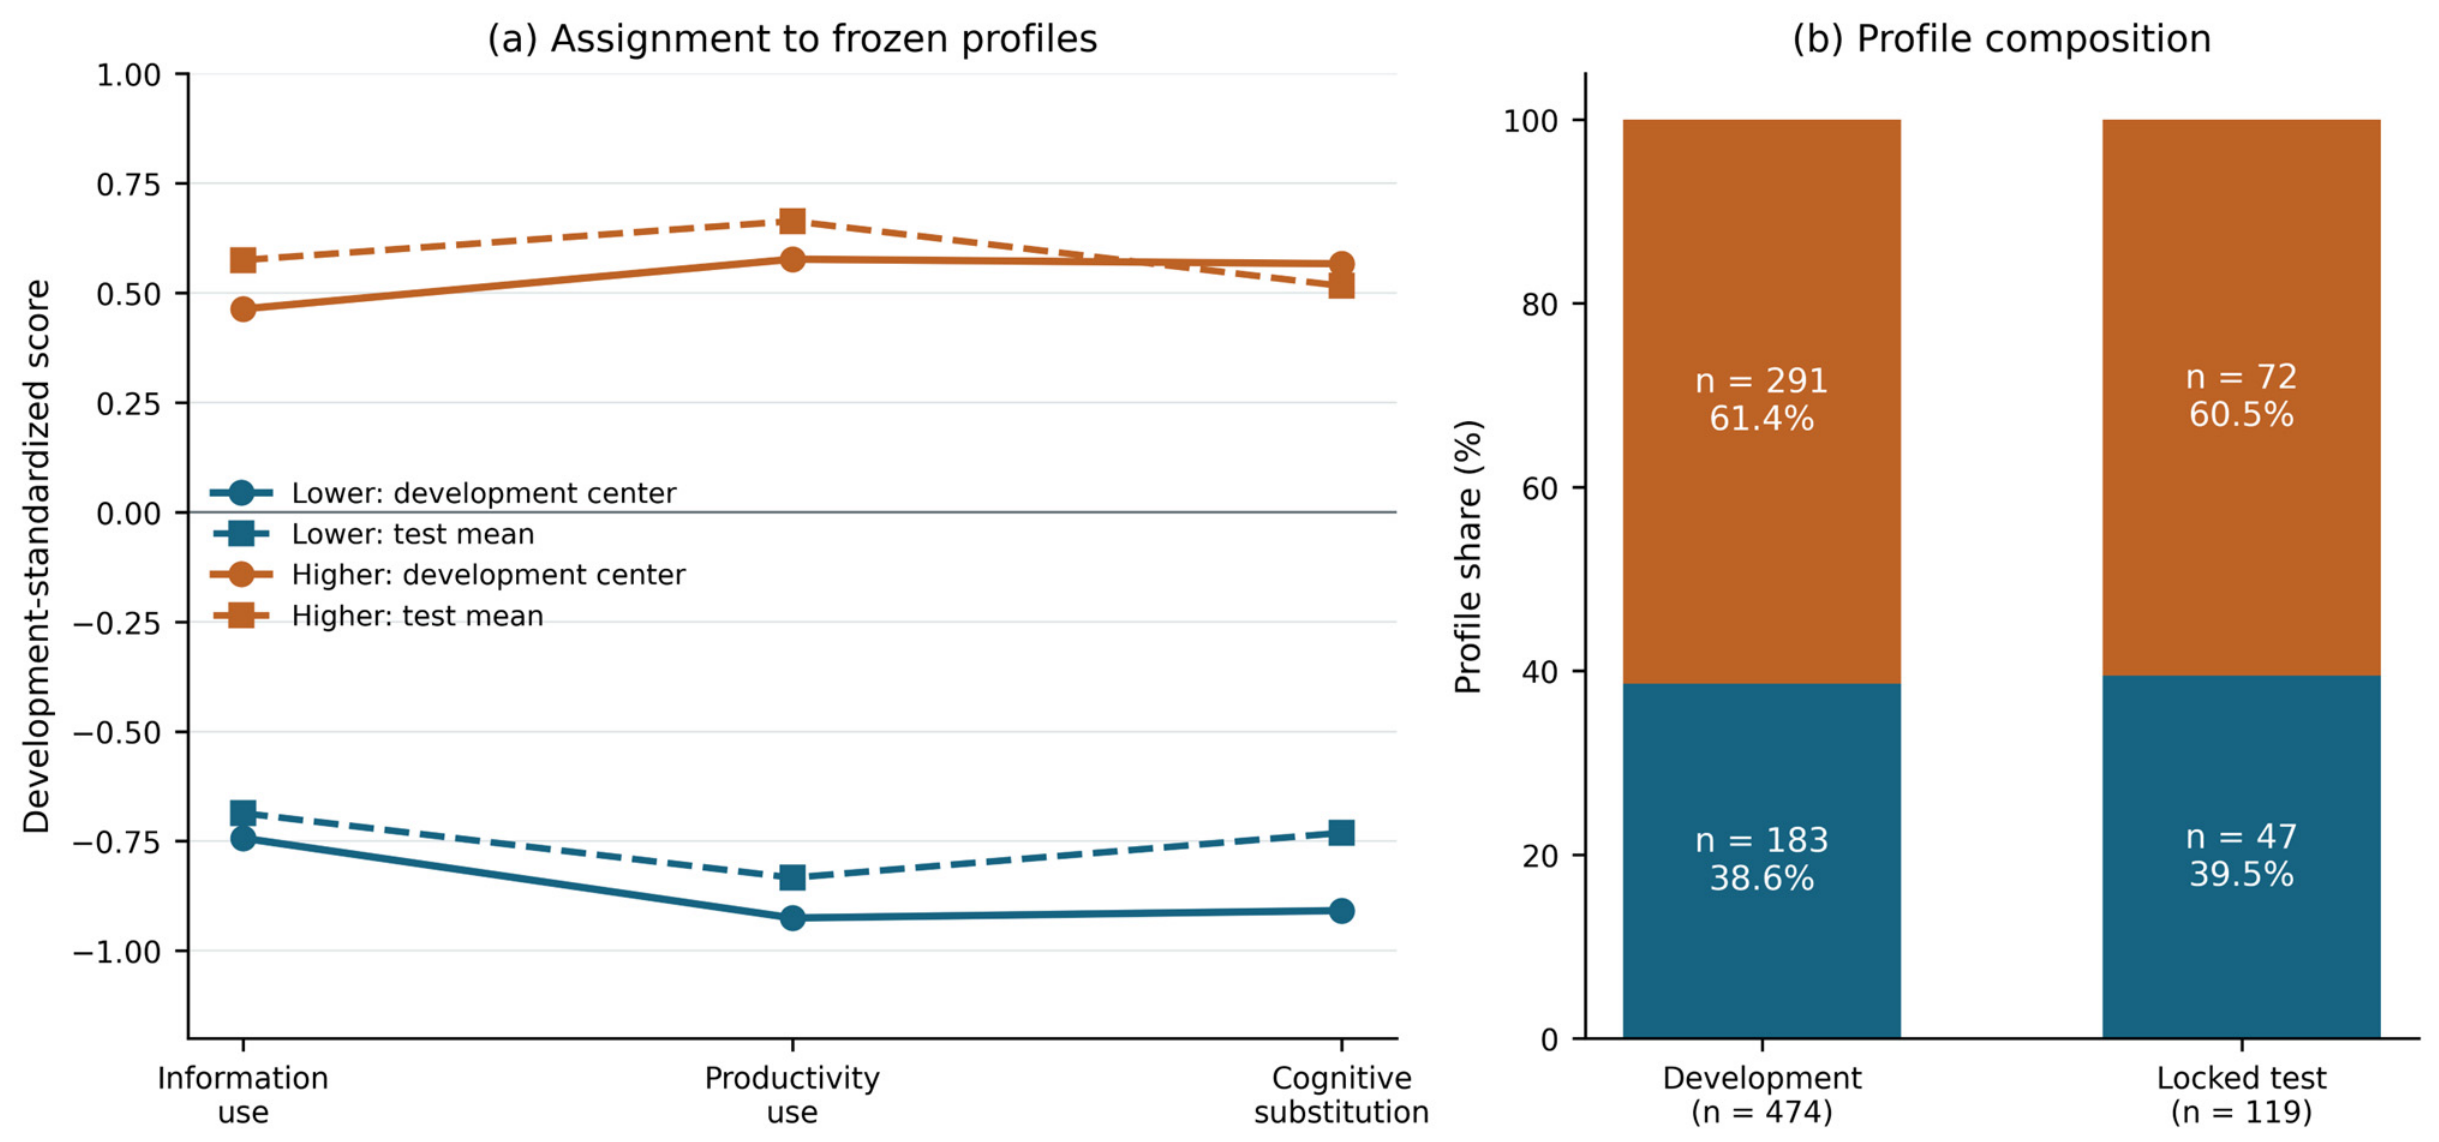
The frozen centers assigned 47 test respondents to the lower profile (39.5%) and 72 to the higher profile (60.5%), close to the development proportions. The assigned test silhouette was 0.431 (Figure 3). Distances between empirical test group means and their respective frozen centers were 0.207 and 0.150 in standardized Euclidean space. Twelve respondents (10.1%) had a distance margin below 0.25 between the first- and second-nearest centers. The test groups retained the lower-versus-higher pattern across all three domains, although some assignments lay relatively close to the decision boundary. The larger-to-smaller class ratio was 72:47 (1.53:1). Class-specific precision, recall, F1, and confusion counts for each selected classifier are shown in Supplementary Tables S15 and S16.
Figure 3.
Locked-test profile assignment. Panel (a) compares frozen development centers (solid lines) with empirical means of assigned test respondents (dashed lines), using the same development standardization. Panel (b) compares profile composition. No test centroid was fitted. The assigned test silhouette was 0.431; the lower and higher profiles contained 47 and 72 respondents.
4.6. Predictive Performance
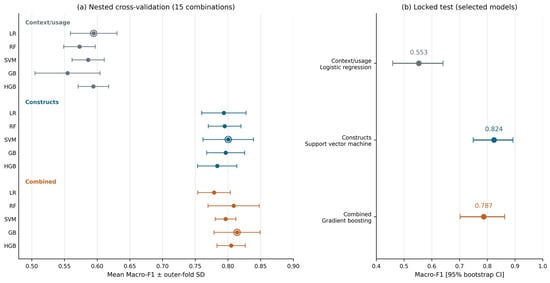
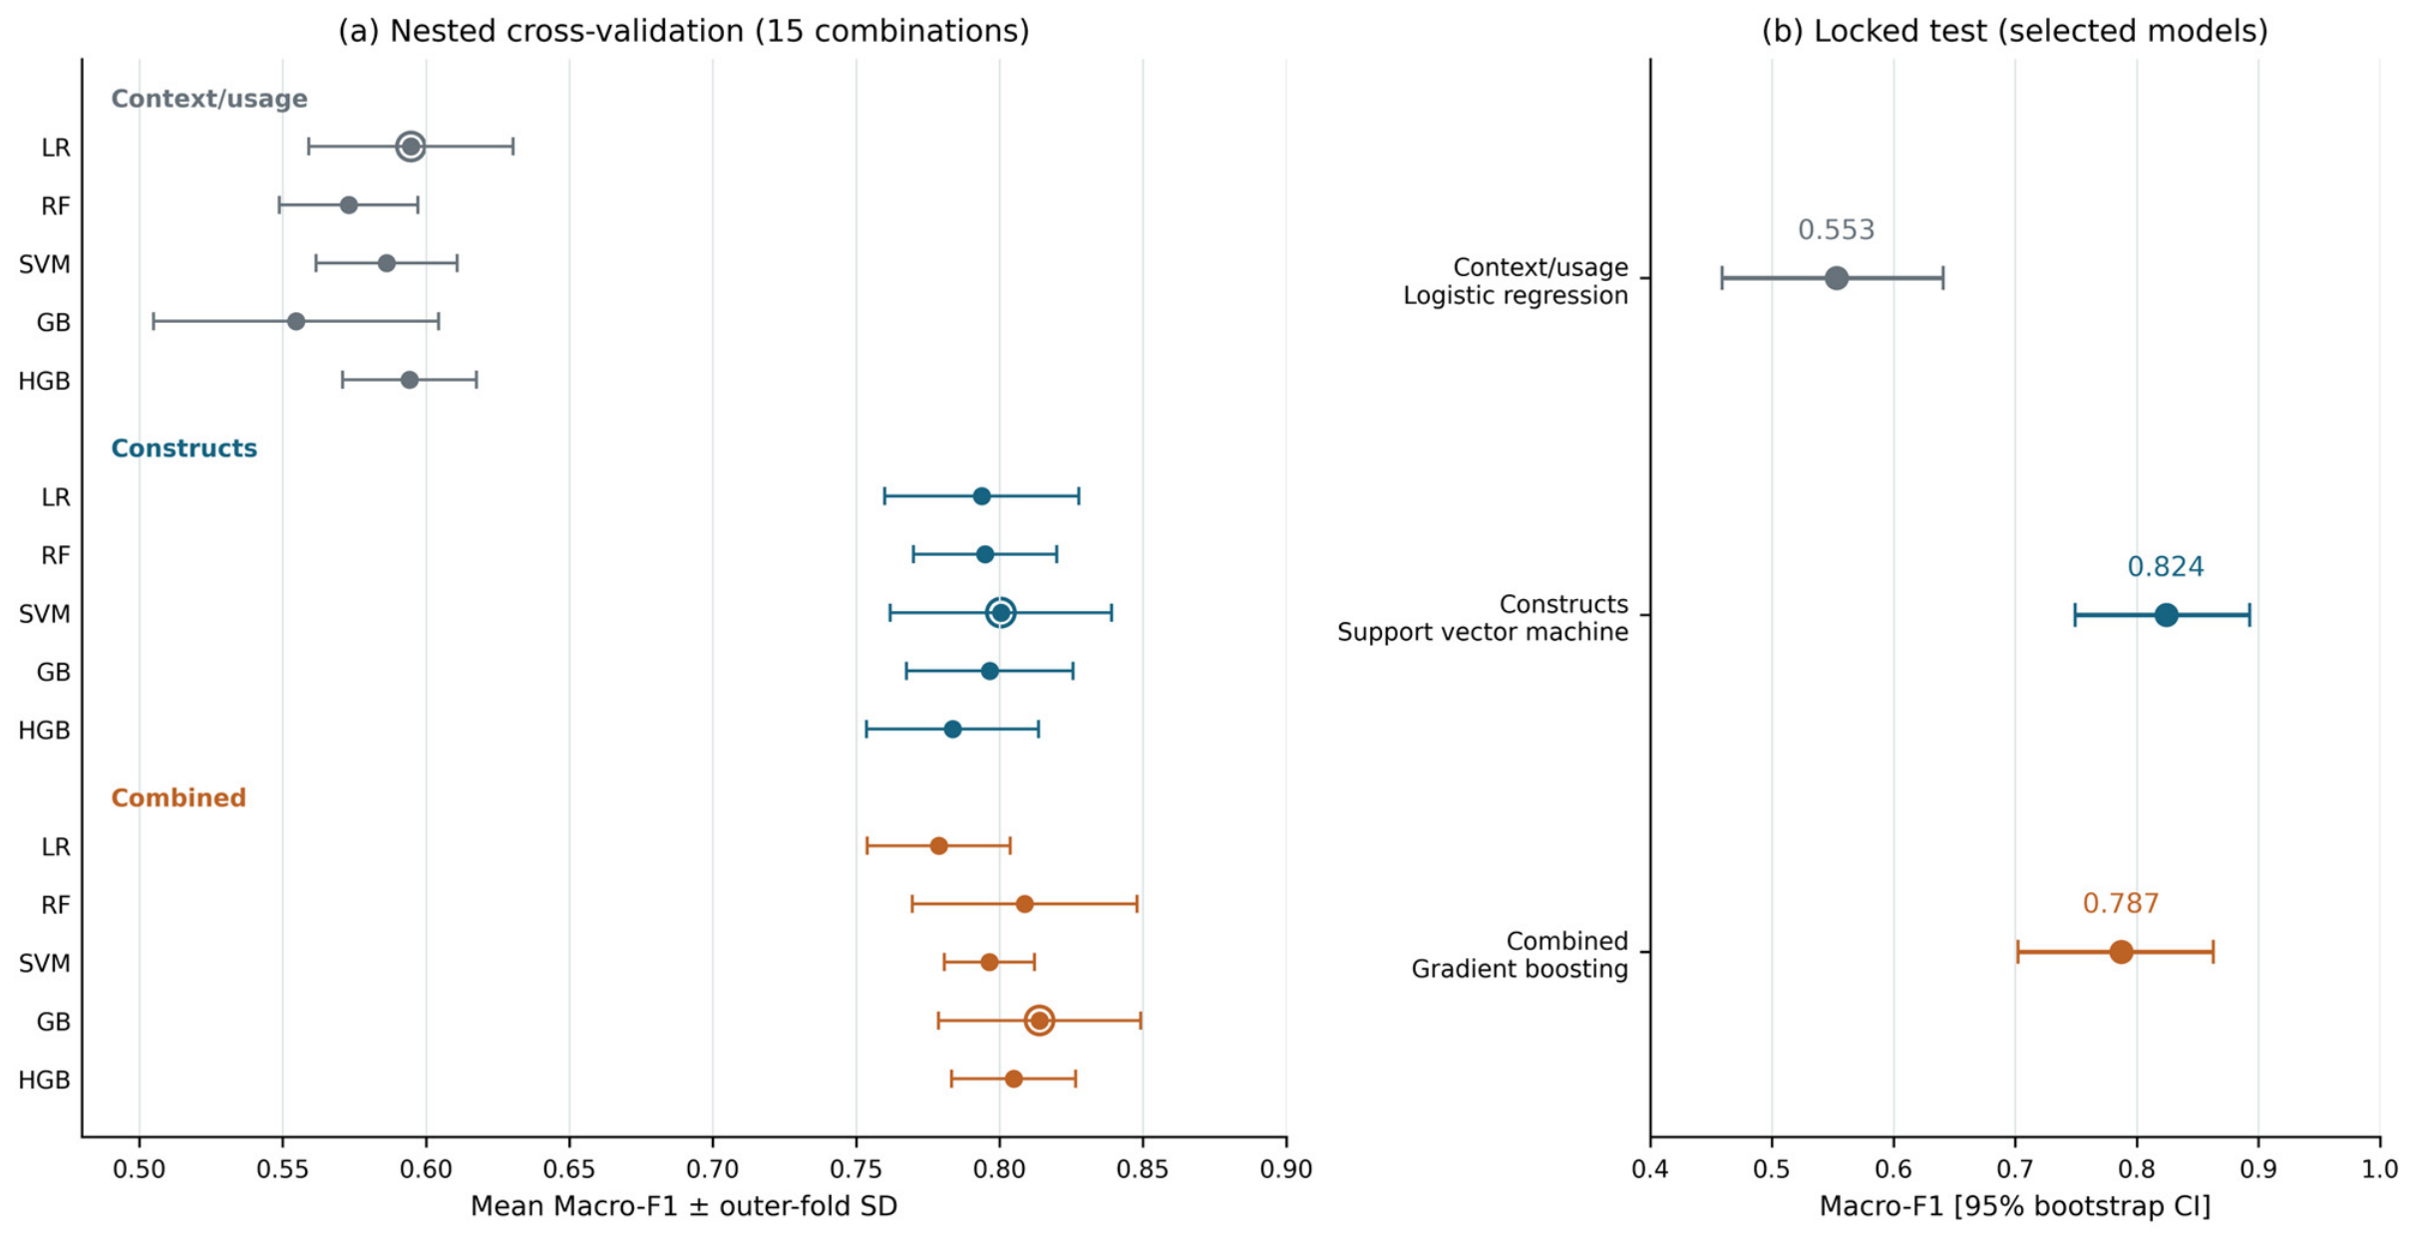
Table 5 reports all 15 classifier–feature-block comparisons. Logistic regression was selected for context/usage variables, SVM for the psychological/cognitive block, and gradient boosting for the combined block. Their mean outer-fold Macro-F1 values were 0.595, 0.800, and 0.814, respectively; the corresponding fold standard deviations were 0.036, 0.039, and 0.035. These are development estimates conditional on the frozen development profile labels.
Table 5.
Nested cross-validation performance for all 15 classifier–feature-block combinations.
In the locked test, the selected combined model achieved Macro-F1 of 0.787 (95% bootstrap interval 0.702–0.863), balanced accuracy of 0.777, MCC of 0.591, and ROC-AUC of 0.915 (Table 6; Figure 4). It correctly classified 30 of 47 lower-profile respondents and 66 of 72 higher-profile respondents, giving 96 correct classifications out of 119. Its higher-profile recall exceeded its lower-profile recall, despite its high threshold-independent discrimination.
Table 6.
Locked-test performance of the three development-selected classifiers (n = 119).
Figure 4.
Classifier performance in development and locked-test cohorts. Panel (a) reports nested-CV mean Macro-F1 for all 15 combinations, with outer-fold standard deviations. Open rings mark the classifier selected within each feature block. LR, logistic regression; RF, random forest; SVM, support vector machine; GB, scikit-learn gradient boosting; HGB, scikit-learn histogram gradient boosting. Panel (b) reports the three development-selected models on the locked test, with 95% percentile bootstrap confidence intervals from 2000 class-stratified resamples. The construct-only model had the highest numerical test Macro-F1; the combined block had the highest development-CV mean. Uncertainty summaries differ across panels and do not establish statistically significant model differences.
The psychological/cognitive-only SVM achieved a test Macro-F1 of 0.824, compared with 0.553 for context/usage logistic regression. The construct-only block, therefore, had the highest observed test Macro-F1 among the three development-selected models. The development-selected models were retained; the test comparison was descriptive and did not establish statistically significant superiority of the construct-only block.
The majority-class comparator predicted the higher profile from training labels in every outer fold and from all development labels for the test cohort. Its mean outer-fold Macro-F1 was 0.380 (SD = 0.002); locked-test Macro-F1 was 0.377, balanced accuracy was 0.500, MCC was 0.000, and accuracy was 0.605 (Supplementary Table S18). All three selected classifiers had higher test Macro-F1, but context/usage logistic regression had lower accuracy (0.571) than this comparator. Performance gains therefore depend on the metric, especially under unequal class sizes.
4.7. Incremental Information Across Feature Blocks
In development, the combined block exceeded context/usage alone by 0.219 Macro-F1, but exceeded the psychological/cognitive block by only 0.013. Most of the improvement over basic context and usage history was therefore associated with the five theory-grounded scores. The test comparison provided no evidence of a large benefit from adding context to those scores. Because the best-performing classifier family differed across blocks, these comparisons evaluate the predictive utility of each block under the model-selection procedure; they are not isolated coefficients or causal effects of feature inclusion.
4.8. Explainability and Stability
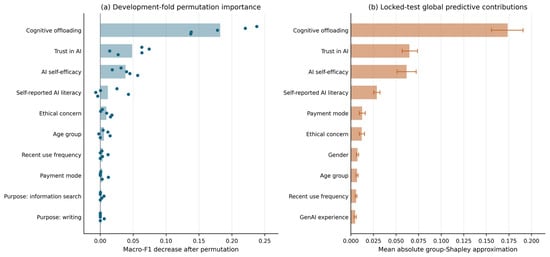
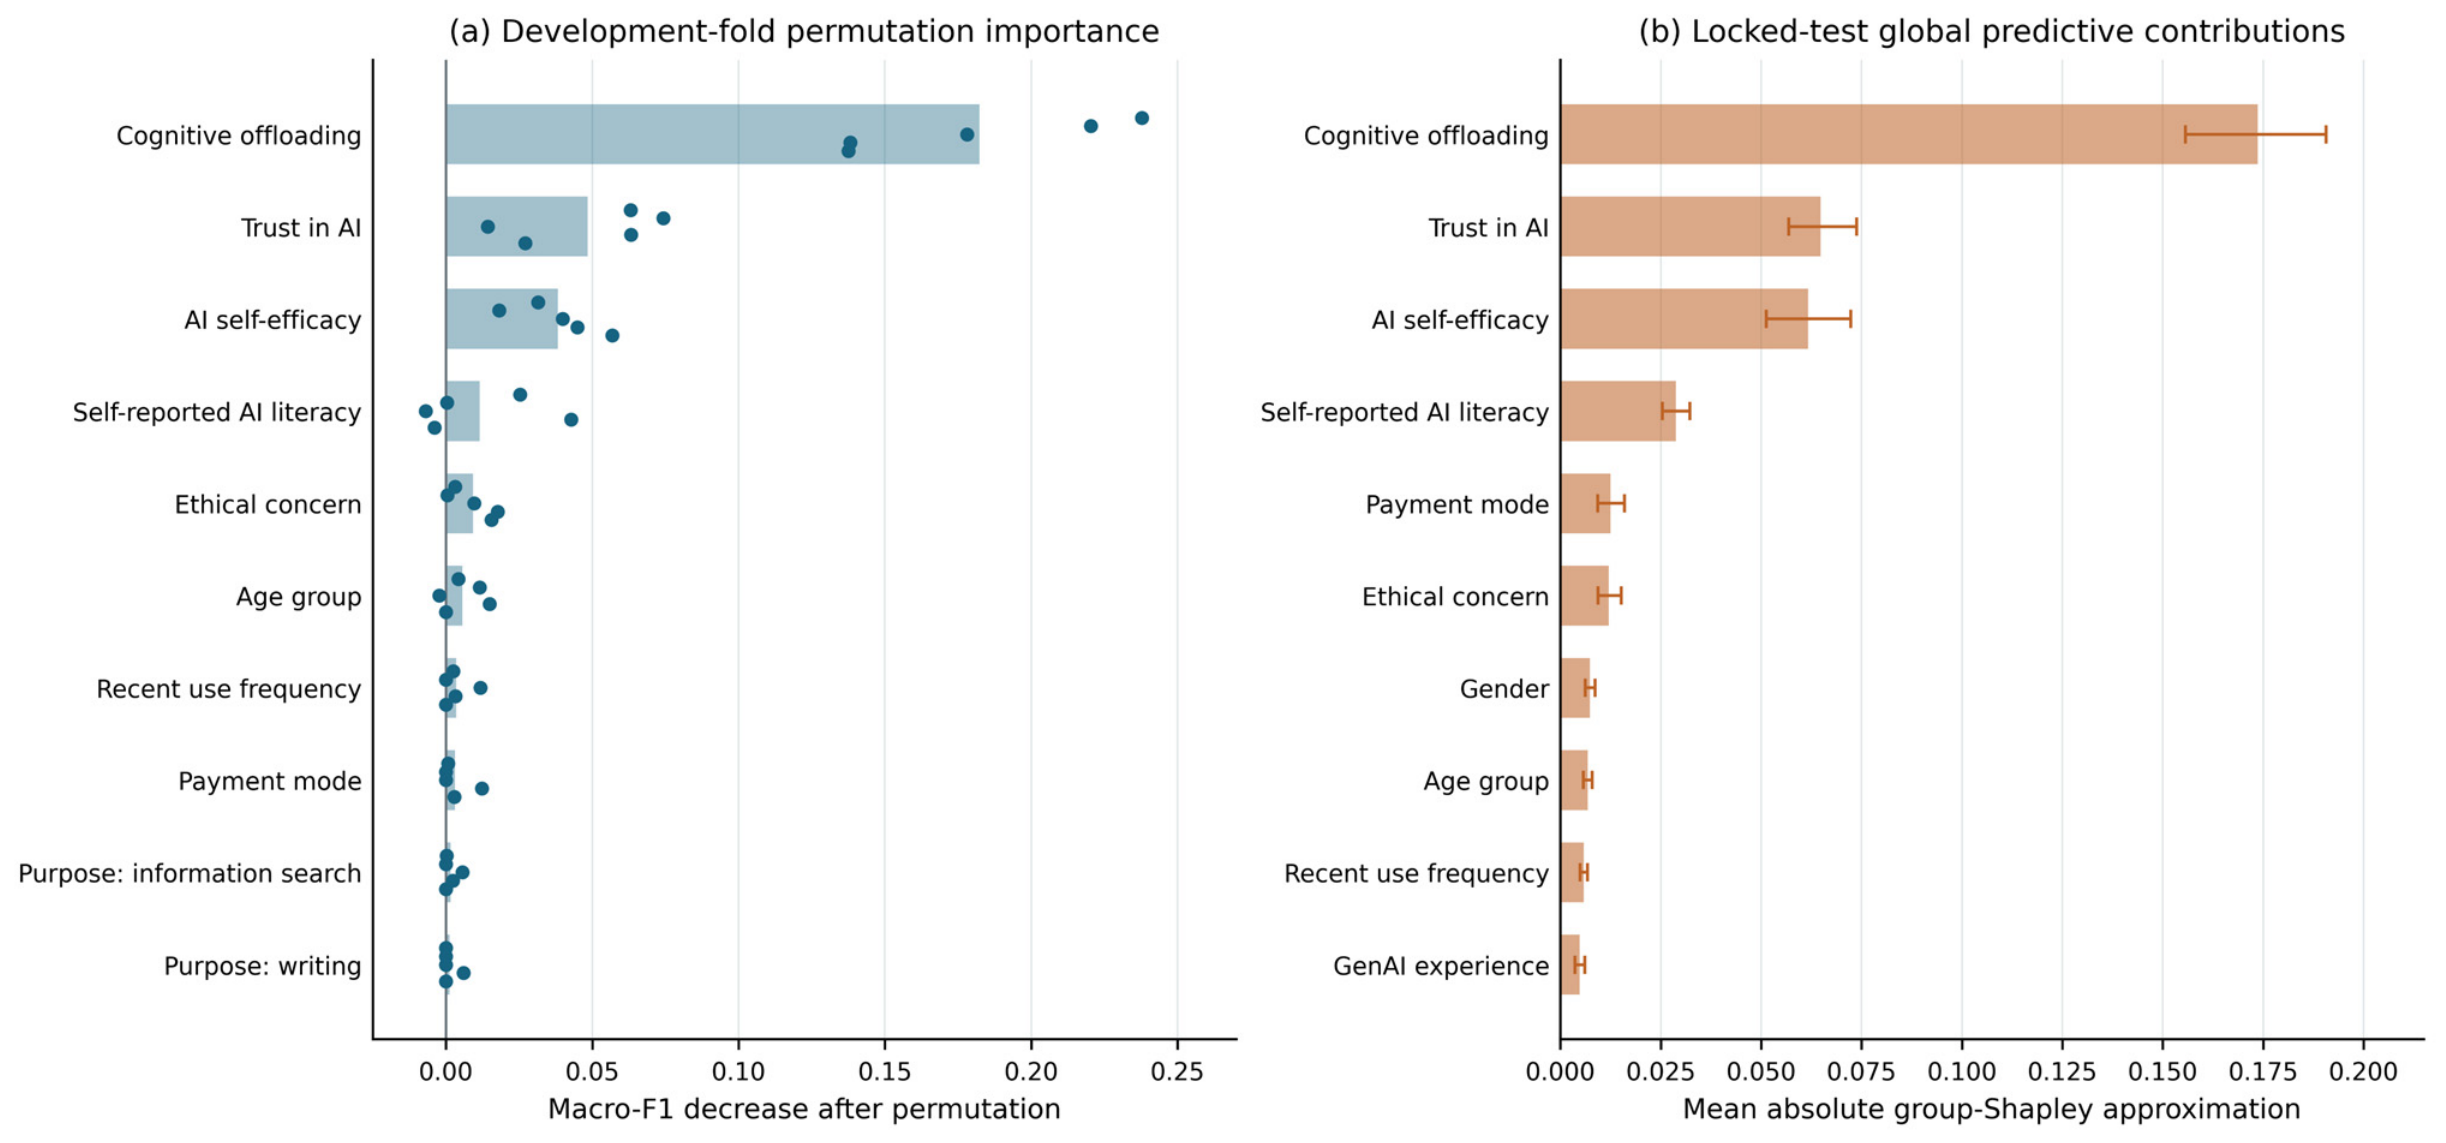
Cognitive offloading had the largest mean permutation importance, with a Macro-F1 decrease of 0.182 across development folds and positive importance in all five folds (Table 7; Figure 5). Trust in AI and AI Self-Efficacy followed, with mean decreases of 0.048 and 0.038; both were positive in every fold. Ethical concern had a smaller but consistently positive mean decrease of 0.009. AI Literacy had a mean importance of 0.011 and positive importance in three of five folds, indicating less consistent incremental discrimination in the combined model.
Table 7.
Explainability, feature-block comparison and predictive ablation.
Figure 5.
Predictive contribution and explanation stability for the selected combined-model family. Panel (a) shows mean permutation-related Macro-F1 decreases (bars) and estimates from each of five outer development folds (points). Panel (b) shows mean absolute Monte Carlo interventional group-Shapley approximations for locked-test respondents, with 95% respondent-bootstrap intervals. Each panel displays its own top 10 of 26 feature groups. The intervals in (b) do not quantify Monte Carlo integration error. Raw categorical features were grouped before one-hot encoding. Contributions describe predictions and do not imply causal effects.
The group-Shapley approximation produced the same leading order. Mean absolute probability contributions were 0.174 for cognitive offloading, 0.065 for trust in AI, and 0.062 for AI self-efficacy. AI literacy and ethical concern contributed 0.029 and 0.012, respectively. Agreement between the two summaries concerned their dominant aggregate pattern; their magnitudes are not directly comparable because permutation loss is measured on Macro-F1 whereas Shapley contributions are measured on predicted probability.
4.9. Targeted Ablation
Under the separate ablation tuning schedule, pooled out-of-fold Macro-F1 was 0.792 for the complete combined predictor block. Removing cognitive offloading reduced it to 0.753, a decrease of 0.039. Removing AI self-efficacy yielded 0.802, despite that construct’s positive importance in the fitted complete model. Adding faculty yielded 0.794. These results show that a variable can be used by a fitted model without being indispensable to prediction after retuning with correlated alternatives. The ablation baseline differs from the primary mean-fold value of 0.814 because it uses pooled out-of-fold predictions and a different, shared inner-fold schedule for the ablation comparisons.
4.10. Sensitivity of Profile Structure
The two-profile intensity pattern persisted in the response-quality sensitivity analyses (Table 8). Retaining all 634 eligible respondents, including exact straightliners, produced a development subset of 507 and a silhouette of 0.426. Excluding both the 41 exact and 23 near-straightliners left 570 respondents, with a development subset of 456 and a silhouette of 0.406. Both scenarios retained the lower-to-higher pattern across the three defining domains. Each used its own reproducible split, so these are structural sensitivity comparisons rather than paired exclusion effects or evidence that classifier performance and feature importance are invariant to the screening rule. Using 10 profile subdimension scores yielded a two-cluster silhouette of 0.342 and agreement of ARI = 0.861 with the primary K-means partition.
Table 8.
Sensitivity of profile structure to inclusion rules, clustering method and score granularity.
The four-cluster K-means solution included an asymmetric pattern with comparatively higher Information Use and lower Substitution. However, its silhouette of 0.330 and mean subsample ARI of 0.916 did not justify promoting that pattern above the primary two-cluster solution. Its presence remains sensitivity evidence about finer subdivisions. Taken together with the weak K-means–GMM agreement, the analyses support an intensity distinction that is reasonably stable to the examined response-quality and score-granularity choices, while remaining dependent on the clustering representation.
5. Discussion
5.1. An Intensity Gradient in Use and Substitution
The best-supported empirical partition separated lower from higher overall use/substitution. Information Use, Productivity Use, and Cognitive Substitution increased together, and the frozen two-profile structure showed similar proportions and geometric separation in the test cohort. This pattern answers RQ1 while constraining the interpretation of RQ2. The primary evidence supports an intensity gradient within the surveyed students; it does not establish a distinct augmentation-oriented subgroup as the principal organization of their behavior.
The four-cluster sensitivity solution included an asymmetric pattern with relatively high Information Use and lower Substitution. That pattern remains substantively interesting, but its weaker separation and less parsimonious representation do not justify replacing the primary solution. The distinction between an appealing interpretation and a well-supported partition is important in person-centered research. Existing studies identify different numbers of reliance, literacy, or adoption profiles because they use different indicators and populations [1,2,5]. Our two-profile result is therefore a contribution about these behavioral domains and this sample, rather than a competing universal classification of GenAI users.
The co-occurrence of instrumental use and substitution also complicates a simple opposition between benefit and cognitive delegation. Students in the higher profile reported greater Perceived Work Efficiency, which was excluded from profile construction and prediction. This association is compatible with students experiencing practical benefits while also reporting more cognitive substitution. It does not establish objective productivity gains or learning deficits. The distinction resembles the broader separation between assisted task performance and independent learning highlighted by experimental research [3,4]. Our cross-sectional findings extend that concern to the joint pattern of students’ reported uses, without establishing the underlying temporal process.
5.2. Cognitive Offloading as the Principal Predictive Discriminator
Cognitive offloading was the strongest and most consistent predictor of profile membership. Its mean permutation-related reduction in Macro-F1 was 0.182, exceeding those of trust in AI and AI self-efficacy, and its contribution was positive in every development fold. The group-Shapley analysis produced the same leading order. Removing offloading in the targeted ablation reduced out-of-fold Macro-F1 from 0.792 to 0.753. Together, these findings answer RQ5 by showing that information about cognitive delegation was particularly useful for distinguishing the observed profiles.
This association is consistent with offloading theory, which focuses on the redistribution of cognitive demands between internal and external resources [7]. GenAI offers a broad external resource, and students who report more delegation may also report more use across information, production, and substitution activities. Nevertheless, the result cannot determine whether an offloading tendency preceded extensive GenAI engagement, developed through that engagement, or reflected other unmeasured characteristics.
Offloading and substitution involve related descriptions of cognitive delegation despite their separate, non-overlapping item sets. Excluding profile variables prevents direct feature reuse while leaving shared conceptual content and common-method covariance possible. The focal HTMT of 0.670 and correlation of 0.633 support distinguishable composite scores within this sample, with substantial semantic proximity. Offloading therefore represents a strong predictive association within this measurement system. Investigating a mechanism would require longitudinal measures, observed delegation decisions, and tasks that independently assess reasoning and verification. AI Literacy likewise measures self-assessed capability, so its predictive contribution does not establish objectively demonstrated literacy.
5.3. Trust and Self-Efficacy in More Intensive Engagement
Trust in AI and AI Self-Efficacy followed offloading in both leading explanation rankings, with positive permutation contributions in all five folds. Their roles are consistent with the possibility that students who accept AI assistance and feel capable of using it incorporate the technology more broadly into their activities. However, the higher profile also reported greater Cognitive Substitution. Confidence and trust therefore cannot be treated here as evidence of an augmentation-oriented pattern.
The educational implication is to consider calibration alongside capability. Lee and See’s framework distinguishes appropriate reliance from simply maximizing trust [9]. Similarly, self-efficacy measures perceived capability rather than the accuracy of a student’s judgment about when AI assistance is suitable [10]. Training that increases willingness and confidence could be complemented by explicit practice in checking evidence, recognizing task limitations, and deciding which reasoning steps require independent effort. These are implications for instructional design to be evaluated prospectively; the present data do not demonstrate that any particular training intervention changes profile membership.
5.4. Interpreting Smaller Contributions from Literacy and Ethical Concern
Self-reported AI Literacy had a smaller and less stable permutation contribution than offloading, trust, or self-efficacy. This result does not show that AI literacy is irrelevant to effective engagement. Literacy is multidimensional, and the predictive task concerned a two-group intensity partition rather than output verification, factual accuracy, or learning quality [11,12]. A self-assessment may also capture perceived familiarity or confidence that overlaps with other predictors. Objective literacy tasks could yield a different pattern, particularly if they evaluate the recognition of model limitations and unsupported claims.
Ethical concern also contributed relatively little to classification, although its permutation contribution was positive across folds. The appropriate conclusion is that concern supplied limited additional discrimination between the two observed profiles. A feature’s predictive rank is not a ranking of educational priorities. Ethical awareness may matter for privacy, attribution, fairness, and responsible conduct without closely tracking overall use intensity. The present result therefore provides no basis for reducing the importance of ethical education.
5.5. Predictive Value and the Scope of Validation
Psychological and cognitive constructs carried substantially more predictive information than context and usage history. Development Macro-F1 increased from 0.595 for context alone to 0.800 for constructs alone and 0.814 for their combination. The combined-minus-context difference of 0.219 addresses RQ4 by showing that most of the incremental predictive information was associated with the theory-grounded constructs. The additional 0.013 beyond constructs alone was small and does not establish a material benefit from adding demographic and usage-history features.
On the locked test, the selected combined gradient-boosting model achieved Macro-F1 of 0.787, whereas the selected construct-only support vector machine achieved 0.824. The construct-only model thus had the higher observed test score, consistent with most useful predictive information residing in the constructs. The development-selected models were retained, and the descriptive comparison did not establish a statistically significant performance difference. Mean outer-fold scores, pooled out-of-fold scores, and the final test score summarize different evaluations. Their differences may reflect sampling variation, tuning and family-selection effects, and the respondents in each partition; these influences cannot be separated here. Fold SDs and conditional test intervals quantify different sources of variability and do not constitute a paired test of model superiority.
Classifier validation was conditional on profiles estimated once using the full development cohort. Cross-validation predicted those fixed labels without repeating profile discovery in each training fold. Outer-fold scores also guided model-family selection, leaving the selected family’s development estimate subject to selection optimism [22]. The locked test independently evaluated the resulting frozen profile-assignment and classification workflow. This design assesses conditional classifier performance rather than fully resampling profile discovery and prediction together.
Separating profile-defining behavior from supervised predictors and protecting the final test enabled assessment of how well distinct measures predict frozen empirical assignments. These assignments describe a sample-specific partition rather than externally established psychological categories. Model explanations characterize the measured associations supporting that partition.
5.6. Implications for Educational Informatics
The findings favor examining what students delegate alongside how often they use GenAI. A frequency-only approach can miss the coexistence of practical assistance and cognitive substitution. Educational support could make the allocation of cognitive work explicit: students might document which operations were delegated, which claims were checked, and which conclusions they independently justified. The objective would be to strengthen reflective use across the observed range of engagement, rather than to assign students a desirable or undesirable identity.
One potential instructional application is an assignment involving an AI-generated literature outline in which students verify each source, justify the final conceptual structure, and explain revisions to the generated argument. It illustrates how information and productivity support can be retained while making independent evaluation observable. Comparable designs could be evaluated using both assisted task quality and subsequent unaided performance. A corresponding assessment could ask students to annotate which claims they accepted, revised, or rejected, provide reasons and source checks, and complete a brief unaided explanation of the final argument. Responsible-use guidance could require disclosure of delegated tasks and attention to privacy and attribution. These examples make reasoning and verification observable; their effects on learning or delegation would require prospective evaluation.
The profile labels should likewise remain descriptive. They do not justify punitive screening, individual diagnosis, or assumptions about a student’s ability. Approximately one in ten test assignments had a small distance margin, underscoring uncertainty near the boundary. Any future educational application should assess whether identifying such patterns adds value beyond ordinary formative assessment and whether students understand how the classification is used.
5.7. Synthesis of the Research Questions
RQ1: The selected two-profile K-means solution summarized lower and higher intensity across all three behavioral domains, with stable development partitions and coherent assignment in the locked test. This is evidence for a useful sample-specific partition under the chosen representation, not natural student types.
RQ2: The primary solution did not support a distinct high-use, low-substitution profile. An asymmetric configuration appeared only in the four-cluster sensitivity solution and remains subordinate to the primary intensity interpretation.
RQ3: Among the classifiers selected in development, locked-test Macro-F1 was 0.553 for context/usage, 0.824 for constructs alone, and 0.787 for their combination. All exceeded the training-majority comparator on Macro-F1, without establishing universal superiority across metrics or external populations.
RQ4: Adding the constructs to context/usage increased the development mean Macro-F1 by 0.219, whereas adding context to the constructs increased it by only 0.013. The test results did not show an advantage for the combined block over constructs alone. These are descriptive comparisons of selected block-specific models.
RQ5: Cognitive offloading contributed most consistently across permutation and group-Shapley summaries, and its removal reduced predictive performance in the separate ablation evaluation. Trust in AI and AI Self-Efficacy followed in the aggregate rankings. These findings describe model-dependent predictive information, not causal effects or educational priorities.
5.8. Limitations and Future Research
The cross-sectional, observational design cannot establish causal direction, changes in engagement, or learning effects; self-reports do not measure objective AI competence. Common-method variance and conceptual proximity among constructs may contribute to predictive performance. Incomplete historical item-development records limit assessment of adaptation and content development, while reliability and construct-separation estimates provide sample-specific diagnostics rather than independent instrument validation. Repeated surveys combined with interaction logs, source-checking tasks, and independent performance measures could clarify how use and substitution develop together.
The sample comes from one Thai public university, with 364 of 593 respondents (61.4%) from the Business School, 71.2% women, and 57.0% first-year students. The remaining 229 respondents span 17 faculties or colleges (Supplementary Table S17). Concentration in particular courses and stages of study could increase shared exposure to information, writing, and planning tasks, potentially emphasizing a common intensity gradient over discipline-specific uses. This sampling explanation remains untested. Including faculty in predictive sensitivity analysis addresses neither representativeness nor measurement equivalence across fields. Without an authoritative enrollment benchmark, the profile proportions describe the sample rather than university-wide prevalence. Generalization requires independent cohorts with broader disciplinary coverage and renewed examination of the measurements and profile structure.
K-means can partition a continuous underlying structure. The observed stability and held-out separation support reproducibility of the selected partition within this study, with substantial dependence on the clustering method: agreement with the two-component Gaussian mixture solution was poor (ARI = −0.021), and the mixture solution had much weaker separation (silhouette = 0.034) and lower subsample stability (mean ARI = 0.746). Response-quality and dimension-scoring sensitivities support robustness within the K-means approach, while alternative distributional assumptions, measurements, or populations may reveal different configurations. These results establish neither natural classes nor an advantage of discretizing the behavioral domains over modeling them continuously. Excluding 41 exact straightliners also changes the population analyzed. Similar structures under alternative response-quality rules reduce concern about dependence on that choice; the screening rules do not identify dishonesty or inattention.
Explanation and uncertainty estimates are conditional on the fitted models and chosen profile solution. The interventional group-Shapley approximation used 48 permutations, while respondent-level bootstrap intervals omit Monte Carlo uncertainty, model-selection uncertainty, and uncertainty in cluster discovery. Interventional perturbations can also produce unusual combinations of correlated predictors. These explanations characterize aggregate predictive patterns rather than exact local additive decompositions or causal effects. Larger independent cohorts and validation procedures that repeat profile discovery within each training resample would support a more comprehensive assessment of uncertainty.
6. Conclusions
K-means summarized an intensity gradient across Information Use, Productivity Use, and Cognitive Substitution among the surveyed Generation Z students. The two-component Gaussian mixture model grouped these students differently, so the K-means profiles serve as an exploratory description of this sample. Instrumental GenAI engagement and substitution co-occurred, and a distinct augmentation-oriented profile was not sufficiently supported as the primary solution. Psychological and cognitive constructs predicted these K-means assignments substantially better than context and usage history, while adding context to those constructs provided little improvement in development and no observed advantage on the locked test. Cognitive offloading was the most consistent discriminator, followed by trust in AI and AI self-efficacy. These findings identify predictive associations within a single-institution self-report sample, not causal mechanisms or universal user types. With profile-defining variables excluded from the predictors, locked-test performance measures how well the classifiers recover the development-defined assignments in held-out students. Future work should evaluate their external reproducibility and examine whether reflective instructional practices support productive assistance with less cognitive substitution.
Supplementary Materials
The following supporting information can be downloaded at https://www.mdpi.com/article/10.3390/informatics13110199/s1. Supplementary File S1 contains the following sections: Section S1, Questionnaire scoring and boundaries; Section S2, Classifier search spaces; Section S3, Profile algorithms and assignment; Section S4, Explanations and uncertainty; Section S5, Additional descriptive results; Section S6, Questionnaire items and analytical roles; Section S7, Composite separation diagnostics; Section S8, Development fold results and selected settings; Section S9, Locked-test class composition and performance; Section S10, Faculty distribution; and Section S11, Majority-Class Comparator. The file also includes the following supplementary tables: Table S1, Classifier settings and hyperparameter search spaces; Table S2, Trust in AI items; Table S3, Cognitive offloading items; Table S4, Ethical concern items; Table S5, AI Literacy items; Table S6, AI self-efficacy items; Table S7, Information use items; Table S8, Productivity use items; Table S9, Perceived work efficiency items; Table S10, Cognitive substitution items; Table S11, Heterotrait–monotrait ratios; Table S12, Pearson correlations between composite scores; Table S13, Outer-fold Macro-F1 for all candidate classifier and feature-block combinations; Table S14, Full-development hyperparameter selections; Table S15, Class-specific test performance of the three development-selected classifiers; Table S16, Test confusion counts by feature block; Table S17, Faculty or college composition of the primary cohort; and Table S18, Training-selected majority-class performance.
Author Contributions
Conceptualization, L.P., R.K. and P.R.; methodology, L.P.; software, R.K. and P.R.; data curation, L.P. and P.R.; investigation, L.P.; validation, L.P. and R.K.; formal analysis, L.P.; resources, R.K. and P.R.; visualization, R.K. and P.R.; supervision, L.P.; project administration, L.P.; funding acquisition, L.P.; writing—original draft preparation, L.P.; writing—review and editing, R.K. and P.R. All authors have read and agreed to the published version of the manuscript.
Funding
This research project was financially supported by Mahasarakham University. No grant number was assigned.
Institutional Review Board Statement
The study was reviewed and approved under an exemption review by the Ethics Committee for Research Involving Human Subjects, Mahasarakham University, Thailand (approval No. 752-769/2026; approval date: 4 September 2026).
Informed Consent Statement
The study was conducted under the approved exemption-review protocol. Before responding, participants received the questionnaire information statement describing the study purpose, confidentiality, the academic use of responses, and the non-disclosure of personal information. No separate signed consent form was used.
Data Availability Statement
The analysis code, non-data-derived configuration files, software-environment specifications, and minimal variable/construct mappings are publicly available on Zenodo at https://doi.org/10.5281/zenodo.23099646. Participant-level survey data are not publicly available because the consent and ethics framework did not authorize unrestricted public sharing of individual-level responses.
Acknowledgments
This research was financially supported by Mahasarakham University, Thailand.
Conflicts of Interest
The authors declare no conflicts of interest.
References
- Stojanov, A.; Liu, Q.; Koh, J.H.L. University students’ self-reported reliance on ChatGPT for learning: A latent profile analysis. Comput. Educ. Artif. Intell. 2024, 6, 100243. [Google Scholar] [CrossRef] [Scilit]
- Medina-Gual, L.; Parejo, J.-L. University Students’ Engagement with Artificial Intelligence: A Cluster Analysis of Learner Profiles in AI Literacy. Technol. Knowl. Learn. 2026, 31, 291–309. [Google Scholar] [CrossRef] [Scilit]
- Fan, Y.; Tang, L.; Le, H.; Shen, K.; Tan, S.; Zhao, Y.; Shen, Y.; Li, X.; Gašević, D. Beware of metacognitive laziness: Effects of generative artificial intelligence on learning motivation, processes, and performance. Br. J. Educ. Technol. 2025, 56, 489–530. [Google Scholar] [CrossRef] [Scilit]
- Darvishi, A.; Khosravi, H.; Sadiq, S.; Gašević, D.; Siemens, G. Impact of AI assistance on student agency. Comput. Educ. 2024, 210, 104967. [Google Scholar] [CrossRef] [Scilit]
- Saihi, A.; Ahmed, V. Uncovering adoption personas for generative AI in higher education: A clustering-based segmentation approach. Int. J. Educ. Technol. High. Educ. 2026, 23, 7. [Google Scholar] [CrossRef] [Scilit]
- Kapoor, S.; Narayanan, A. Leakage and the reproducibility crisis in machine-learning-based science. Patterns 2023, 4, 100804. [Google Scholar] [CrossRef] [Scilit] [PubMed]
- Risko, E.F.; Gilbert, S.J. Cognitive Offloading. Trends Cogn. Sci. 2016, 20, 676–688. [Google Scholar] [CrossRef] [Scilit] [PubMed]
- Vaccaro, M.; Almaatouq, A.; Malone, T. When combinations of humans and AI are useful: A systematic review and meta-analysis. Nat. Hum. Behav. 2024, 8, 2293–2303. [Google Scholar] [CrossRef] [Scilit] [PubMed]
- Lee, J.D.; See, K.A. Trust in Automation: Designing for Appropriate Reliance. Hum. Factors 2004, 46, 50–80. [Google Scholar] [CrossRef] [Scilit] [PubMed]
- Wang, Y.-Y.; Chuang, Y.-W. Artificial intelligence self-efficacy: Scale development and validation. Educ. Inf. Technol. 2024, 29, 4785–4808. [Google Scholar] [CrossRef] [Scilit]
- Ng, D.T.K.; Leung, J.K.L.; Chu, S.K.W.; Qiao, M.S. Conceptualizing AI literacy: An exploratory review. Comput. Educ. Artif. Intell. 2021, 2, 100041. [Google Scholar] [CrossRef] [Scilit]
- Koch, M.J.; Carolus, A.; Wienrich, C.; Latoschik, M.E. Meta AI literacy scale: Further validation and development of a short version. Heliyon 2024, 10, e39686. [Google Scholar] [CrossRef] [Scilit] [PubMed]
- Chan, C.K.Y.; Hu, W. Students’ voices on generative AI: Perceptions, benefits, and challenges in higher education. Int. J. Educ. Technol. High. Educ. 2023, 20, 43. [Google Scholar] [CrossRef] [Scilit]
- von Luxburg, U.; Williamson, R.C.; Guyon, I. Clustering: Science or Art? In Proceedings of ICML Workshop on Unsupervised and Transfer Learning; Proceedings of Machine Learning Research, PMLR: New York, NY, USA, 2012; pp. 65–79. [Google Scholar]
- Janzing, D.; Minorics, L.; Bloebaum, P. Feature relevance quantification in explainable AI: A causal problem. In Proceedings of the Twenty Third International Conference on Artificial Intelligence and Statistics, Proceedings of Machine Learning Research; Chiappa, S., Calandra, R., Eds.; PMLR: New York, NY, USA, 2020; pp. 2907–2916. [Google Scholar]
- Sukprasert, A.; Phothong, L. Responsible GenAI Augmentation and Cognitive Agency in Higher Education. Sustainability 2026, 18, 10831. [Google Scholar] [CrossRef] [Scilit]
- Henseler, J.; Ringle, C.M.; Sarstedt, M. A new criterion for assessing discriminant validity in variance-based structural equation modeling. J. Acad. Mark. Sci. 2015, 43, 115–135. [Google Scholar] [CrossRef] [Scilit]
- Rousseeuw, P.J. Silhouettes: A graphical aid to the interpretation and validation of cluster analysis. J. Comput. Appl. Math. 1987, 20, 53–65. [Google Scholar] [CrossRef] [Scilit]
- Hubert, L.; Arabie, P. Comparing partitions. J. Classif. 1985, 2, 193–218. [Google Scholar] [CrossRef] [Scilit]
- Hennig, C. Cluster-wise assessment of cluster stability. Comput. Stat. Data Anal. 2007, 52, 258–271. [Google Scholar] [CrossRef] [Scilit]
- Pedregosa, F.; Varoquaux, G.; Gramfort, A.; Michel, V.; Thirion, B.; Grisel, O.; Blondel, M.; Prettenhofer, P.; Weiss, R.; Dubourg, V.; et al. Scikit-learn: Machine Learning in Python. J. Mach. Learn. Res. 2011, 12, 2825–2830. [Google Scholar]
- Cawley, G.C.; Talbot, N.L.C. On Over-fitting in Model Selection and Subsequent Selection Bias in Performance Evaluation. J. Mach. Learn. Res. 2010, 11, 2079–2107. [Google Scholar]
- Fisher, A.; Rudin, C.; Dominici, F. All Models are Wrong, but Many are Useful: Learning a Variable’s Importance by Studying an Entire Class of Prediction Models Simultaneously. J. Mach. Learn. Res. 2019, 20, 1–81. [Google Scholar]
- Lundberg, S.M.; Lee, S.-I. A Unified Approach to Interpreting Model Predictions. In Advances in Neural Information Processing Systems; Guyon, I., Luxburg, U.V., Bengio, S., Wallach, H., Fergus, R., Vishwanathan, S.V.N., Garnett, R., Eds.; Curran Associates, Inc.: New York, NY, USA, 2017. [Google Scholar]
- Aas, K.; Jullum, M.; Løland, A. Explaining individual predictions when features are dependent: More accurate approximations to Shapley values. Artif. Intell. 2021, 298, 103502. [Google Scholar] [CrossRef] [Scilit]

Disclaimer/Publisher’s Note: The statements, opinions and data contained in all publications are solely those of the individual author(s) and contributor(s) and not of MDPI and/or the editor(s). MDPI and/or the editor(s) disclaim responsibility for any injury to people or property resulting from any ideas, methods, instructions or products referred to in the content. |
© 2026 by the authors. Licensee MDPI, Basel, Switzerland. This article is an open access article distributed under the terms and conditions of the Creative Commons Attribution (CC BY) license.