


Abstract
Background: Generative Adversarial Networks (GANs) produce synthetic faces that are behaviorally indistinguishable from real faces by explicit evaluative criteria. However, whether and how human perceptual processing of synthetic faces differs from that of real faces remains unclear. Methods: Forty-one participants completed a face judgement task, in which they decided whether a face image of the sender of an online friend request was trustworthy. The face images were synthetic or real human faces. Gaze metrics were monitored by an eye-tracker. A hierarchical Bayesian drift diffusion model (DDM) was used to analyze explicit responses, which were compared between the two face types using repeated measures ANOVA. Results: Trustworthiness ratings did not differ between face types. However, RT and cumulative fixation time for synthetic faces were longer compared to real faces. Importantly, DDM indicated that the RT cost was driven mainly by longer non-decision time, with a small, tentative increase in boundary separation and no change in drift rate. Conclusions: Synthetic faces lengthened non-decision time, which encompasses perceptual encoding as well as response preparation and execution, whereas the rate of evidence accumulation was unchanged. The findings highlight processing differences that explicit judgments do not reveal in interaction with AI agents and inform the future design of AI systems.
1. Introduction
The human face is one of the most information-rich stimuli in the social environment, providing a channel through which humans infer intent, emotion, and trustworthiness; increasingly, faces also serve as the front end of artificial intelligence (AI) systems [1]. The inferences of face images, though rapid and often automatic, exert disproportionate influence on downstream social behavior, shaping decisions in human-AI interaction [2]. Impressions of trustworthiness, competence, and warmth are formed from synthetic faces at the initial stage of human-AI interaction [3]. Moreover, subtle variations in expression, gaze, and timing of face images influence the perception of the emotions they convey, which may lead to uncanny communications [4]. Therefore, understanding how people perceive AI-generated faces is of great importance for trust calibration and the design of AI systems.
Generative Adversarial Networks (GANs) produce photorealistic face images of individuals who have never existed. These synthetic portraits have already proliferated across social media platforms, dating applications, political advertising, and state-sponsored influence operations, embedding artificial social stimuli into contexts where viewers have no reason to suspect their artificiality [5,6,7]. A GAN operates through an adversarial training architecture in which a generator network creates specified images and an adversarial discriminator network evaluates those images against a database of real images; the two networks are optimized in opposition across iterations until the discriminator can no longer reliably distinguish generated outputs from authentic examples [8]. The practical consequence of this adversarial optimization is the removal of perceptual cues that humans once relied upon to identify synthetic imagery.
Early empirical work on inferior GAN iterations demonstrated that synthetic faces were rated as significantly less trustworthy than real faces, a pattern consistent with an uncanny-valley account in which subtle artifacts around the eyes, hair boundaries, and facial symmetry triggered a diffuse sense of perceptual anomaly sufficient to suppress trustworthiness judgments [9]. However, rapid improvements in GAN architecture, particularly the advent of StyleGAN2, have fundamentally altered this empirical and social landscape. Nightingale and Farid (2022) reported that observers could not reliably discriminate StyleGAN2-generated faces from real faces and, critically, that synthetic faces were rated as marginally more trustworthy than their real counterparts [5]. The empirical consensus has appropriately shifted from a position in which synthetic faces were detectable to one in which they are, by explicit evaluative criteria, perceptually indistinguishable from the real faces they were trained to imitate [10,11]. Additionally, these synthetic faces may be even more socially favorable than naturally occurring faces [5].
The development of GANs stimulated considerable research interest in automated detection methods, much of which focuses on residual statistical fingerprints in synthetic images that remain invisible to unassisted human perception. However, less attention has been directed toward the possibility that the human perceptual system, despite failing at explicit discrimination [4,10], may nonetheless register something anomalous about GAN-generated faces at a level of processing that is not reflected in explicit judgments. The dissociation between explicit responses and processing measures in perception of GAN-generated faces may be accounted for by dual-process accounts of social evaluation [12,13]. Specifically, rapid, automatic appraisal processes operate below the threshold of conscious report, while slower, deliberative evaluations produce explicit judgments [12]. Within this framework, perceptual fluency (i.e., the subjective ease with which a stimulus is processed) serves as a heuristic input to social judgment; stimuli that are processed disfluently (i.e., with greater difficulty or longer latency) can trigger a diffuse sense of anomaly without the observer being able to identify the source of that difficulty [14]. GAN-generated faces, despite their photorealism, are the product of statistical optimization against a loss function rather than biological development [5,6]. Subtle distributional properties of the image may introduce a form of perceptual disfluency that is registered by early visual processing but does not resolve into a consciously accessible decision criterion. Consequently, the disfluency may be manifested as increased processing latency without a corresponding shift in explicit evaluative judgments, if the anomaly signal does not reach the evaluative process that produces the explicit judgment.
According to the above-described theoretical possibility, an important research question is the locus of additional processing time for synthetic faces. The latency of explicit responses, or response times (RTs), is an inherently ambiguous index of underlying processes [15,16,17]. Specifically, longer RTs to judge GAN faces could result from slower evidence accumulation, longer pre-decisional encoding, or more cautious responding, which reflect fundamentally different mental processes but are indistinguishable from RT data [18].
One approach to dissociating these stages of processing from observed RTs is the drift-diffusion model (DDM) [18,19]. The DDM decomposes the joint distribution of RTs and choices into four latent parameters: drift rate (v; indexes the rate and quality of evidence accumulation toward a decision boundary), boundary separation (a; the amount of evidence required before committing to a response), non-decision time (t; captures all processing time outside the decision itself, including perceptual encoding and motor preparation), and starting point (z; reflects any prior bias toward one response alternative before evidence accumulation begins). Critically, a reduction in drift rate broadens the tail of the distribution, whereas an increase in non-decision time shifts the entire distribution rightward by a constant [19].
To address the research gaps about AI-generated faces, the current study focused on mental processes underlying perception and appraisal of synthetic and real human faces using DDM. Based on the trustworthiness rating paradigm [5], we examined subjective binary trustworthiness judgments of face images and analyzed RTs at a trial-by-trial level using a hierarchical Bayesian DDM, which enables decomposition of the behavioral latency effect into its constituent processing stages [20].
Consistent with the prior study [5], we hypothesized that synthetic faces would be rated as more trustworthy than real faces and would induce slower RTs (Hypothesis 1). Eye-gaze metrics (cumulative fixation times, total fixation counts, and average fixation duration) would also be increased for synthetic faces (Hypothesis 2). Regarding the DDM parameters, the competing accounts of the latency cost make separable predictions. An encoding account predicts increased non-decision time (t) for synthetic faces, an evidence-quality account predicts reduced drift rate (v), that is, slower or noisier accumulation of evidence toward a trustworthiness judgment, a response-caution account predicts greater boundary separation (a), and a response-bias account predicts a shifted starting point (z). Following the disfluency rationale above, we predicted increased non-decision time with no corresponding change in drift rate (Hypothesis 3); the response-caution and response-bias accounts were evaluated as alternatives through formal model comparison. This hypothesis reflected the aforementioned theoretical plausibility derived from the dual processes of social evaluation [12,13] and was consistent with the notion that the processing cost arises before evidence accumulation begins.
2. Materials and Methods
2.1. Participants
Forty-five college-aged participants were recruited from psychology courses at Old Dominion University (ODU). We ran an a priori power analysis using G*Power version 3.1.9 to estimate the required sample size. Specifically, in the power analysis, the significance level (α) and power (1-β) were set as 0.05 and 0.8, respectively. Moreover, a medium effect size (f = 0.25) was assumed based on the previous studies [5,7], which resulted in a sample size of 34 to detect a desired effect. The additional participants were recruited to prevent the impact of attrition in the study. A sensitivity analysis for the final sample (N = 41, α = 0.05, two-tailed, 1 − β = 0.80) indicated that the within-subject comparisons could reliably detect effects of d_z ≥ 0.45 (η2p ≥ 0.17). All participants were free of neurological and visual problems and had normal or corrected-to-normal vision. Four participants were excluded from the analyses due to the failure to adhere to the instructions or complete all trials of the task. Therefore, the final sample consisted of 41 participants (Mage = 21.12 years, SD = 6.23 years; 28 female and 13 male). Participants received course credit for their participation. This research complied with the tenets of the Declaration of Helsinki and was approved by the Institutional Review Board at ODU (protocol code: 2248702-3). Informed consent was obtained from each participant.
2.2. Materials
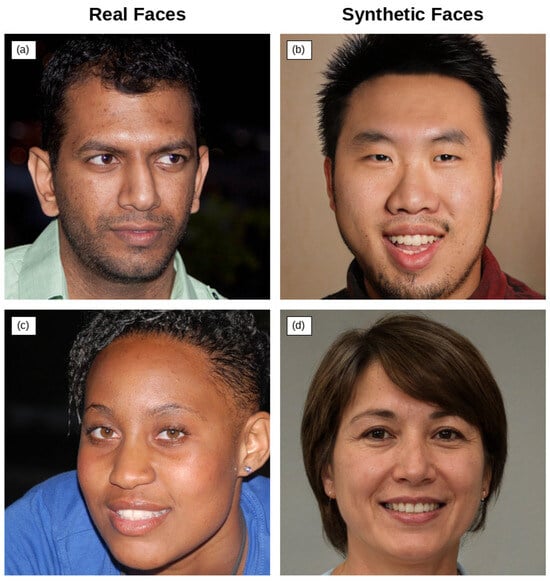
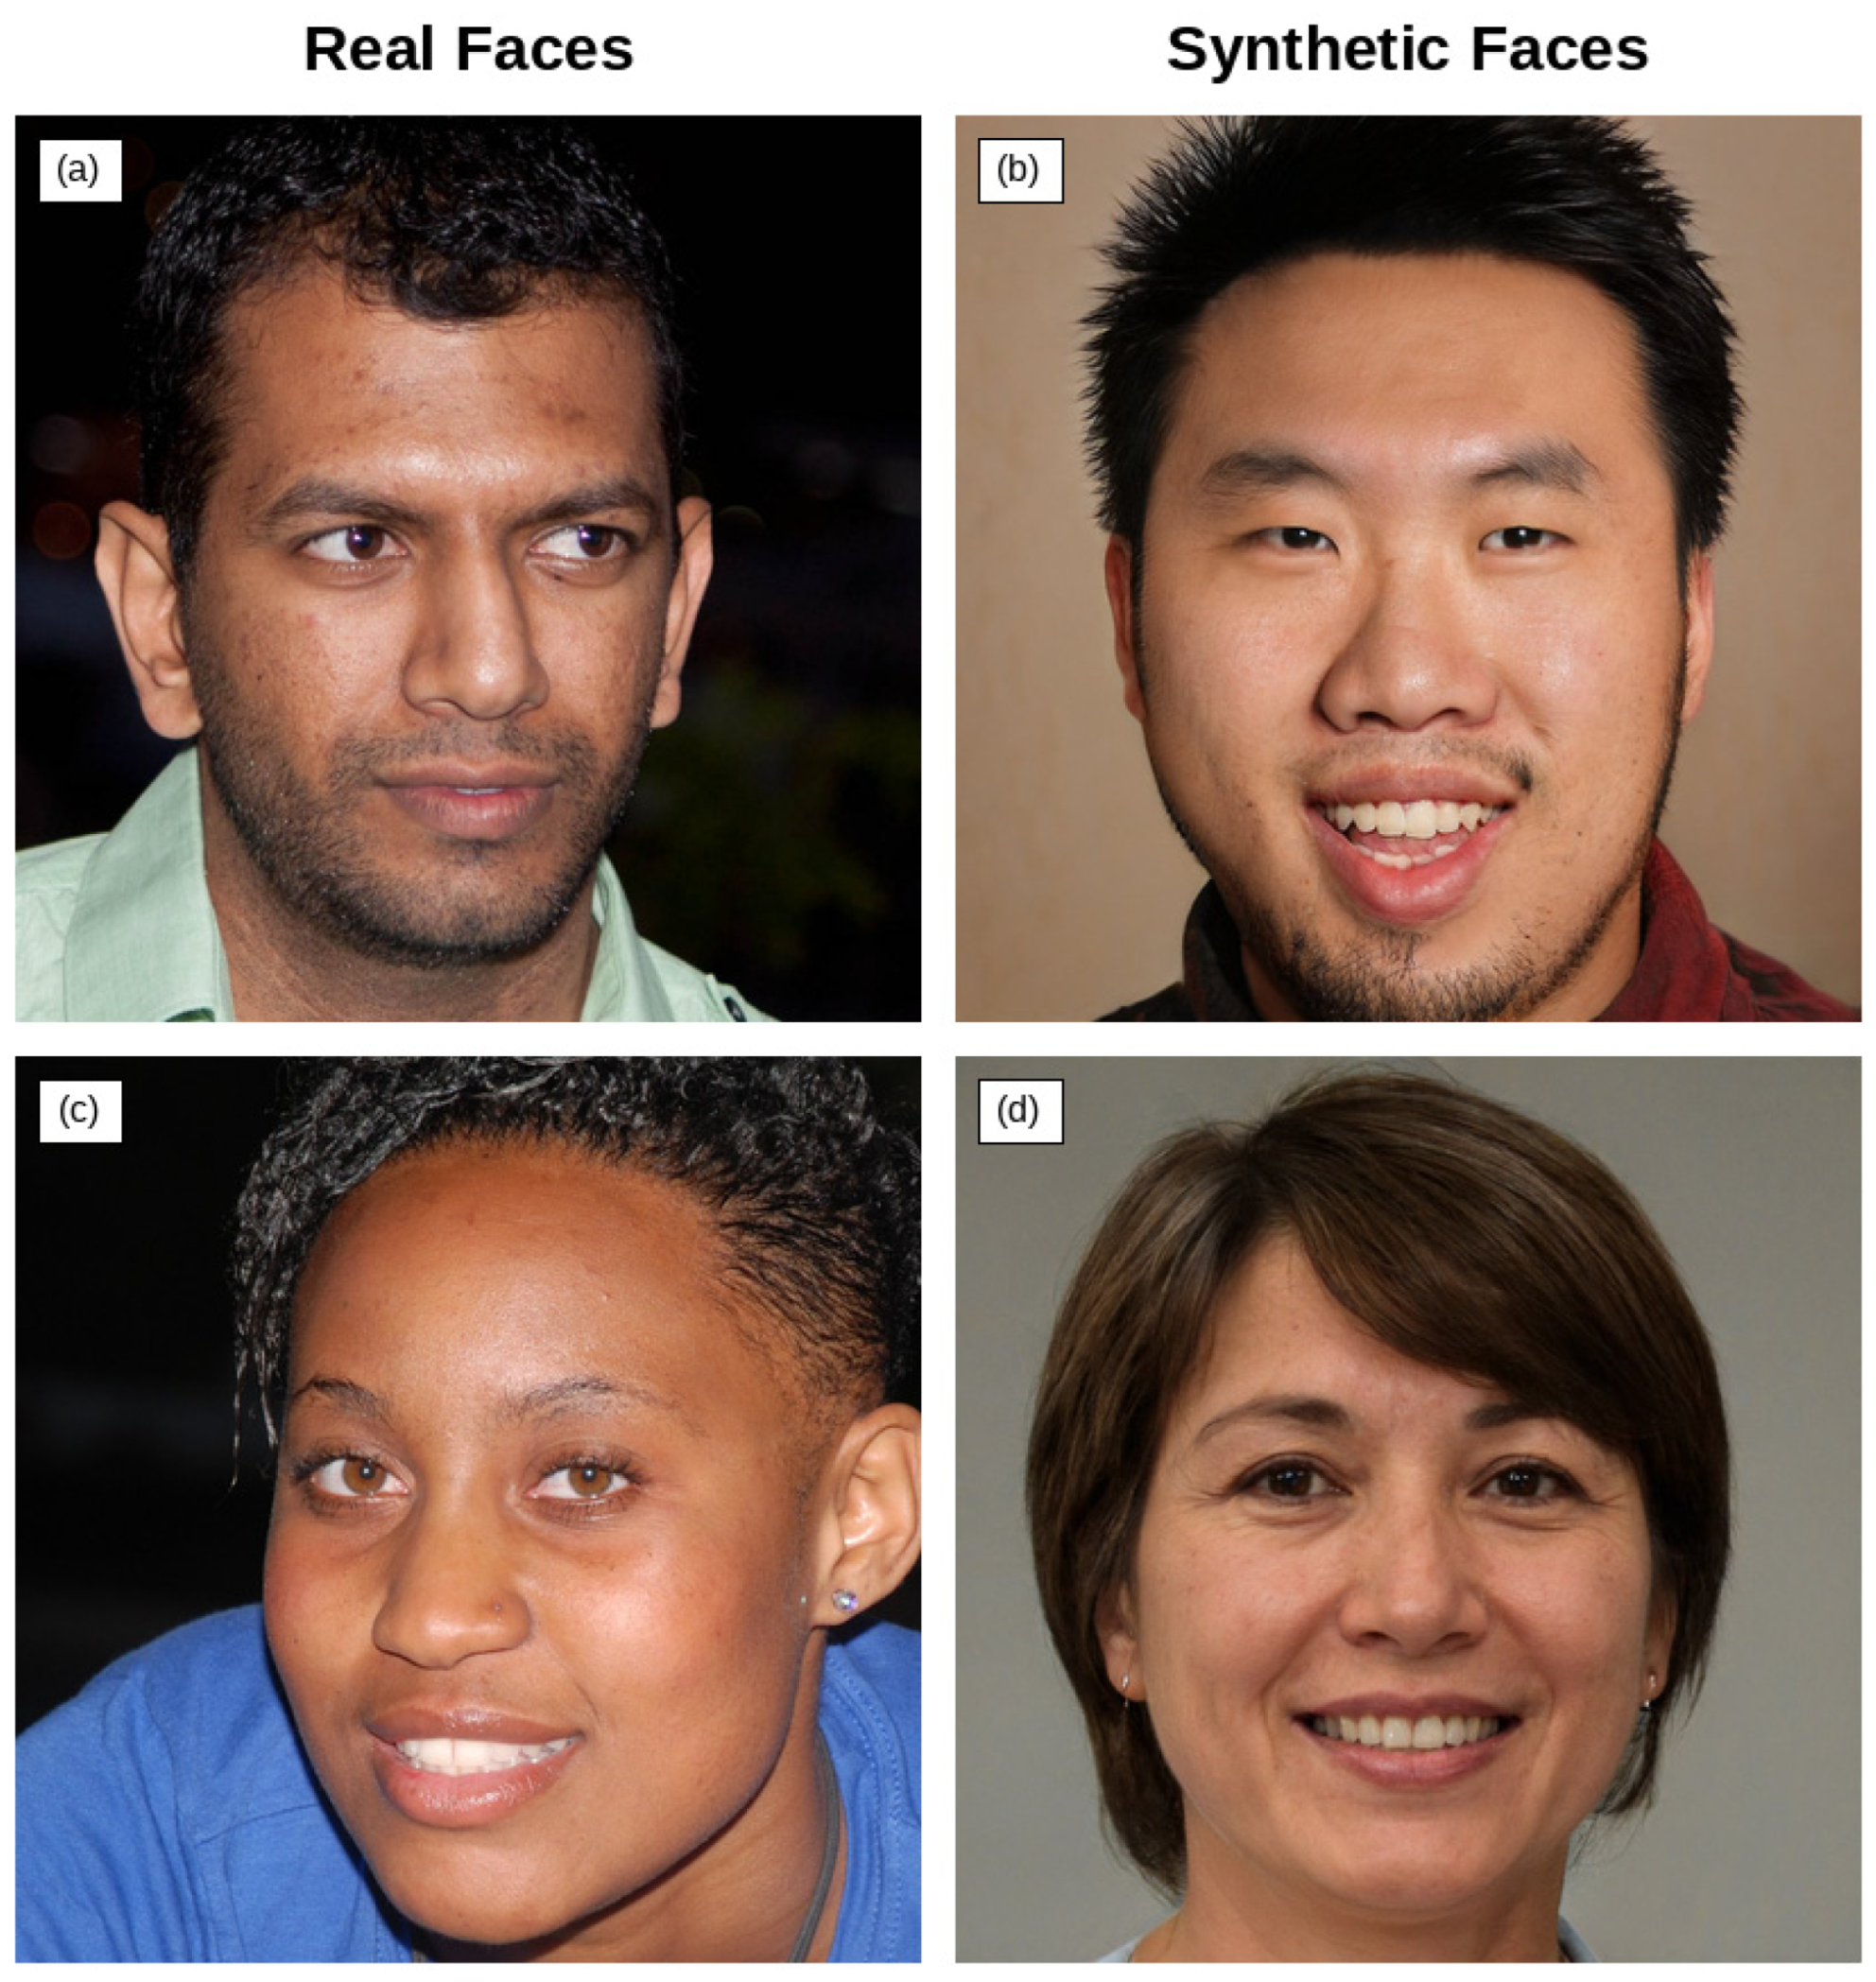
The face images used in the present study were selected from the face set in the previous study [5,6]. There was a total of 160 face images, including 80 real human faces and 80 GAN-generated faces (see Figure 1). The real faces were taken from the StyleGAN2 training set, and the synthetic faces were synthesized using StyleGAN2 [21]. The face images were equally distributed between two sexes (male and female), as well as among four races: Black, White, East Asian, Southwest Asian. Matched face pairs based on demographic categories (i.e., a pair of real and synthetic faces that matched in race and gender) were used to ensure even demographic distribution across the trials, following the method of the previous study [5].
Figure 1.
Exemplary Face Stimuli Used in the Experiment. Face images (a,c) are real faces from the StyleGAN2 training set. Face images (b,d) are synthetic faces generated by StyleGAN2. Stimuli were adapted from Nightingale and Farid (2022) [5] and the published repository [6], and included four race categories and two sexes, with 10 faces per demographic category per face type.
2.3. Design and Task
The present study utilized a within-subject design. All participants received two conditions: real faces and synthetic faces, during a trustworthiness rating task.
The trustworthiness rating task consisted of 160 dichotomous choice trials. In the task, participants were instructed that they would be presented with faces, which were framed as profile images, and that they needed to imagine that this person had sent them a friend request online. Participants would then judge the trustworthiness of the presented face. In each trial, the face was presented in the middle of the computer screen, and participants could press the right arrow key to indicate that they appraised the face as trustworthy or the left arrow key to indicate that they appraised the face as untrustworthy. While there was no time limit for how long participants could spend on each face image, they were instructed to try to answer as soon as they made the trustworthiness appraisal. The face images were presented in a single intermixed sequence containing both real and synthetic faces. Stimulus order was determined by random number generation to ensure unbiased distribution of face demographics across the sequence.
The face judgment task was built with Tobii Pro Lab Advanced software version 25.23 (Tobii Pro AB, 2014). During the task, participants’ eye-gaze metrics were also recorded using a Tobii Pro Spark eye tracker (Tobii AB, Stockholm, Sweden) with a sampling rate of 60 Hz.
2.4. Procedure
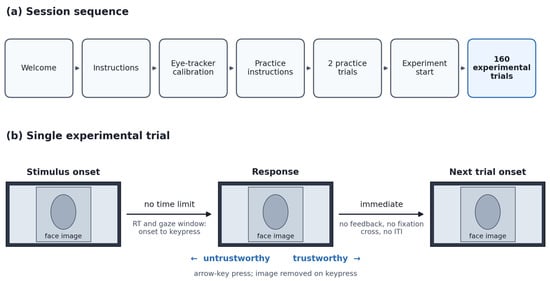
After providing informed consent, participants completed a health and demographics questionnaire. Afterward, participants were comfortably seated in front of a computer, and the calibration of eye-tracking was performed. Then, participants were instructed to perform the task, and they were asked to decide if the presented face was trustworthy. Participants completed two practice trials, using face images that did not appear in the experimental trials, before beginning the experimental trials (see Figure 2 for the session sequence and trial structure). The full session, including instructions, calibration, and practice, lasted M = 6.60 min (SD = 2.05; range 3.96–12.42 min), and the 160 experimental trials took M = 3.45 min (SD = 1.48; range 1.92–9.03 min). After completion of the task, the GAN-generated nature of synthetic faces was disclosed, and participants were thanked for their participation.
Figure 2.
Session Sequence and Trial Structure. (a) Sequence of the experimental session as recorded in the Tobii Pro Lab event logs: text screens were advanced with the space bar, and two practice trials preceded the 160 experimental trials. (b) Structure of a single experimental trial. A face image (1024 × 1024 px, centered on a 1920 × 1080 display) remained on screen until the participant pressed the right arrow key (trustworthy) or the left arrow key (untrustworthy); there was no time limit. The image was removed on the keypress, and the next trial began immediately, with no feedback, fixation cross, or inter-trial interval. Response time and all gaze metrics were computed over the interval from stimulus onset to keypress.
2.5. Data Reduction
Behavioral performance was recorded as trustworthiness ratings and response time (RT). Trustworthiness ratings for real and synthetic faces were calculated as the number of trustworthy responses relative to the total number of responses. Mean RTs were calculated as the latency from the onset of the presentation of an image to a detected keypress response for each face type. Eye-tracking data were processed using Tobii Pro Lab’s I-VT fixation filter. The analysis window for every gaze metric was the interval from stimulus onset to the keypress; the face image was removed upon the keypress (median latency 40 ms), and the next trial began immediately, with no inter-trial interval or feedback (Figure 2). The face area of interest (AOI) was defined in Tobii Pro Lab on each image as four non-overlapping rectangles tiling the face (upper-left, upper-right, lower-left and lower-right quadrants from the viewer’s perspective), together spanning approximately 435 × 465 px of the 1024 × 1024 px image; the rectangles were anchored to facial landmarks, with the vertical boundary along the facial midline and the horizontal boundary at the level of the nose bridge, just below the eyes, so that the upper quadrants contained the eyes and the lower quadrants the nose and mouth; the same construction rule was applied to every image, and a fixation was assigned to the face AOI when its fixation point fell within any of the rectangles. Three gaze metrics were extracted for each trial within the face AOI: cumulative fixation time (the summed duration of face-AOI fixations within the analysis window, with a fixation straddling stimulus onset counted only for its in-window portion), fixation count (the number of face-AOI fixations within the analysis window), and average fixation duration (cumulative fixation time divided by fixation count, computed for trials with at least one face-AOI fixation). Mean values were calculated per face type within each participant. Calibration and validation were performed with the standard Tobii Pro Lab calibration and validation procedure, and a timed point calibration procedure with five calibration targets and a four-target validation check procedure were performed. Each calibration was accepted as returned by that procedure; no numerical acceptance threshold was applied during data collection, so data quality was instead quantified from the validation results and addressed through the robustness analyses described below. Mean validation accuracy was 0.89° (SD = 0.60) and mean validation precision (RMS) was 0.63° (SD = 0.60). Within the analysis windows, 96.1% of samples for synthetic faces and 95.4% for real faces were valid for at least one eye. No participant or trial was excluded based on eye-tracking quality; 126 analyzed trials (1.9%; 55 synthetic, 71 real) contained no face-AOI fixation and contributed zero to cumulative fixation time and fixation count; because average fixation duration is undefined without a fixation, these trials were omitted from that metric, which was averaged over each participant’s remaining trials for each face type. The robustness of the gaze results to data quality was assessed by repeating the analyses after excluding participants with validation accuracy above 1.0° (n = 13), 1.5° (n = 5) or 2.0° (n = 2). There is no single accepted cut-off for validation accuracy: 1.0° is a common target for high-quality calibration, whereas more lenient thresholds are adequate when AOIs are large relative to the expected offset. Because the AOIs here were face quadrants rather than individual facial features, offsets of 1–2° were unlikely to reassign fixations between AOIs, and the three thresholds were chosen to span a strict criterion and the more lenient criteria appropriate to AOIs of this size.
The present study employed a hierarchical Bayesian DDM [22,23], which estimates person-level parameters as draws from group-level distributions. This hierarchical structure provided partial pooling across participants, yielding more stable estimates for individuals with fewer trials or noisier data, while preserving the capacity to detect condition-level differences in the population parameters. Trial-level RTs and binary trustworthiness judgments were modeled by using the Hierarchical Sequential Sampling Modeling framework (HSSM 0.3.0) [24] built on PyMC 5.28 [25]. Responses were coded such that the upper boundary corresponded to trustworthy (i.e., right arrow key) and the lower boundary to untrustworthy (i.e., left arrow key). Face type was dummy coded as a binary predictor (0 = real, 1 = synthetic). Because the trustworthiness task has no objectively correct response, drift rate is interpreted as the direction and strength of evidence accumulation toward trustworthiness rather than as accuracy per se; this approach follows established precedent for applying the DDM to subjective judgment and preference tasks [26].
Trials with RTs below 300 ms (i.e., anticipatory responses) or above 10 s (i.e., inattentive responses) were trimmed, yielding a total of 6520 trials for model fitting (40 of 6560 trials, 0.61%; 32 of 41 participants had no trials removed, and two participants accounted for 29 of the 40 removals). The model was specified as follows: drift rate (v) and non-decision time (t) were each modeled with a fixed intercept (i.e., representing real faces as the reference condition), a fixed effect of face type (i.e., the GAN–Real difference), and subject-level random intercepts. Boundary separation (a) was modeled with a fixed intercept and subject-level random intercepts but was held constant across face types in the primary model. Because perceptual difficulty could plausibly increase response caution, an alternative model in which boundary separation also varied by face type (a fixed effect of face type with subject-level random intercepts) was fitted and compared with the primary model. Starting point (z) was pinned at 0.5 (unbiased) in the primary model. Because a response bias toward either judgment is plausible in a social appraisal task, a model in which z was estimated freely (i.e., an intercept and subject-level random intercepts) was also fitted, as was a model in which z was free and boundary separation also varied by face type; to test the response-bias account directly, a model in which the starting point additionally varied by face type was also fitted. The model with the best expected out-of-sample predictive accuracy was selected for inference (see Section 3.3.1).
Priors were weakly informative: Normal(1.0, 2.0) on v-intercept, Normal(0, 1.0) on v face-type effect, Normal(0.3, 0.3) on t-intercept, Normal(0, 0.2) on t face-type effect; Normal(1.5, 1.0) on a-intercept, Normal(0, 0.5) on the a face-type effect when estimated, Normal(0.5, 0.1) bounded (0.1, 0.9) on the z-intercept when free, and Normal(0, 0.1) on the z face-type effect when estimated. A 5% contaminant process (p_outlier = 0.05) was included to absorb trials generated by processes outside the DDM (e.g., lapses of attention). Posterior distributions were estimated via the No-U-Turn Sampler (NUTS) [27] with 4 chains × 2000 draws after 2000 tuning iterations and a target acceptance probability of 0.95 (an initial run with 1000 tuning iterations and 1000 draws per chain at a target acceptance of 0.85 did not meet the convergence criterion of ≤ 1.01 and bulk and tail ESS ≥ 400 for all key parameters, and the model was therefore re-sampled with these settings). Inference was conducted on the posterior distributions of the face-type fixed effects. For each effect, we report the posterior mean, 95% highest density interval (HDI), and the posterior probability of the effect being in the theoretically predicted direction, i.e., P(t_GAN > 0) for non-decision time and P(v_GAN < 0) for drift rate. An effect is considered reliable if the 95% HDI excludes zero. Evidence for the presence or absence of each face-type effect was further quantified with Savage–Dickey Bayes factors computed against the prior on the effect [28] and with a region of practical equivalence (ROPE) defined as ±0.1 SD of the corresponding between-participant distribution [29]. Candidate models were compared with Pareto-smoothed importance-sampling leave-one-out cross-validation (PSIS-LOO) and the widely applicable information criterion (WAIC) [30], and the adequacy of the selected model was assessed with posterior predictive checks of choice proportions and RT quantiles (0.1, 0.3, 0.5, 0.7, 0.9) for each face type and response, with the RT trimming applied to the simulated data as to the observed data.
2.6. Analytic Plan
Behavioral and eye-tracking variables were compared between face types using repeated-measures ANOVAs. All behavioral and gaze measures were computed on the same RT-trimmed trials used for the DDM. The main analyses applied only exclusion rules that follow conventional practice: the exclusion of participants who did not follow the instructions or complete the task (Section 2.1) and the trimming of anticipatory (<300 ms) and inattentive (>10 s) responses (Section 2.5). No rule for excluding participants who responded rapidly on many trials was specified in advance; the fast-responder criterion below was defined post hoc for a sensitivity analysis, and both sets of results are reported in Section 3.1. Robustness was assessed by repeating these comparisons after excluding participants with poor validation accuracy (see Section 2.5) and participants who made more than 10% of their responses in under 500 ms (n = 3; Appendix A). Additional fixations were localized with face type × quadrant repeated-measures ANOVAs (Greenhouse–Geisser corrected) on fixation count and cumulative fixation time, followed by comparisons of the two face types within each quadrant, with Holm correction across the four quadrants, and a planned contrast of the face-type difference in the upper-left quadrant against the mean of the other three. To relate individual differences in the DDM face-type effects to gaze, a supplementary model with subject-level random face-type slopes on v and t was fitted (Appendix A), and each participant’s Δt and Δv (synthetic − real) were correlated with gaze difference scores within each posterior draw, with and without controlling for the RT difference. DDM parameters were estimated via hierarchical Bayesian inference as described above.
In the present study, we used generative artificial intelligence (GenAI) to create the synthetic face images as the stimuli in the experiment, following the previous study [5]. However, GenAI was not used in any other parts of the study or manuscript preparation.
3. Results
3.1. Trustworthiness Proportion and Response Time
The descriptive statistics are shown in Table 1. The results of the repeated measures ANOVA showed that trustworthiness proportions did not differ significantly between real and synthetic faces, F(1, 40) = 2.59, p = 0.115, η2p = 0.06. The proportion of trustworthy responses was 0.71 for real faces and 0.74 for synthetic faces (see Table 1).
Table 1.
Descriptive Statistics for Different Face Types.
Unlike trustworthiness ratings, the results of ANOVA indicated that RT was longer for synthetic faces compared to real faces, F(1, 40) = 4.64, p = 0.037, η2p = 0.10 (see Table 1).
Three participants made more than 10% of their responses in under 500 ms. Because no rule for excluding such participants was specified in advance, they were retained in the main analyses; Table 2 reports each face-type comparison with and without them. Excluding them reversed the significance of both behavioral effects: the trustworthiness difference became significant, whereas the RT difference was no longer significant, although the direction and approximate size of both effects were unchanged. The gaze effects on cumulative fixation time and fixation count remained significant.
Table 2.
Face-type Comparisons with and without the Three Fast Responders.
3.2. Eye-Tracking Data
Fixation count per trial was significantly higher for synthetic faces than for real faces, F(1, 40) = 4.99, p = 0.031, η2p = 0.11 (see Table 1), although fixation rate (fixations per second of viewing) did not differ between face types (synthetic − real = −0.02 fixations/s, t(40) = −0.43, p = 0.669), indicating that the additional fixations reflect the longer viewing of synthetic faces rather than a denser sampling pattern.
Cumulative fixation time was significantly longer for synthetic faces than for real faces, F(1, 40) = 5.78, p = 0.021, η2p = 0.13 (see Table 1). These results supported Hypothesis 2, indicating that synthetic faces elicited more visual exploration than real faces.
Average fixation duration did not differ significantly between face types, F(1, 40) = 1.03, p = 0.317, η2p = 0.03. The absence of an effect on individual fixation duration, combined with the significant increase in fixation count, suggests that the cumulative fixation time effect was driven by a greater number of fixations on synthetic faces rather than longer individual fixations.
To localize the additional fixations, face type × quadrant repeated-measures ANOVAs were conducted. The interaction was significant for fixation count (F(2.20, 87.8) = 3.24, Greenhouse–Geisser corrected p = 0.040) and marginal for cumulative fixation time (F(2.28, 91.4) = 2.81, p = 0.059). Within quadrants, the face-type difference was largest in the upper-left quadrant from the viewer’s perspective, which contains the face’s right eye (fixation count: real M = 1.42, synthetic M = 1.63 per trial, F(1, 40) = 9.48, Holm-corrected p = 0.015, η2p = 0.19; cumulative fixation time: real M = 346 ms, synthetic M = 401 ms, F(1, 40) = 9.73, Holm-corrected p = 0.013, η2p = 0.20), and no other quadrant differed reliably (all Holm-corrected p ≥ 0.22). The planned contrast of the upper-left quadrant against the other three was significant for fixation count (t(40) = 2.36, p = 0.024) and marginal for cumulative fixation time (t(40) = 2.00, p = 0.052). The additional fixations were therefore most pronounced in the upper-left quadrant, although the evidence that the face-type difference varied across quadrants was stronger for fixation count than for cumulative fixation time. Fixation count remained significant at every validation-accuracy threshold; cumulative fixation time remained significant after excluding participants above 1.5° or 2.0°, but not above 1.0° (p = 0.077, with 13 of 41 participants excluded and a similar effect size, η2p = 0.11; Appendix A, Table A1).
3.3. Hierarchical Bayesian Drift Diffusion Model
3.3.1. Model Comparison and Convergence
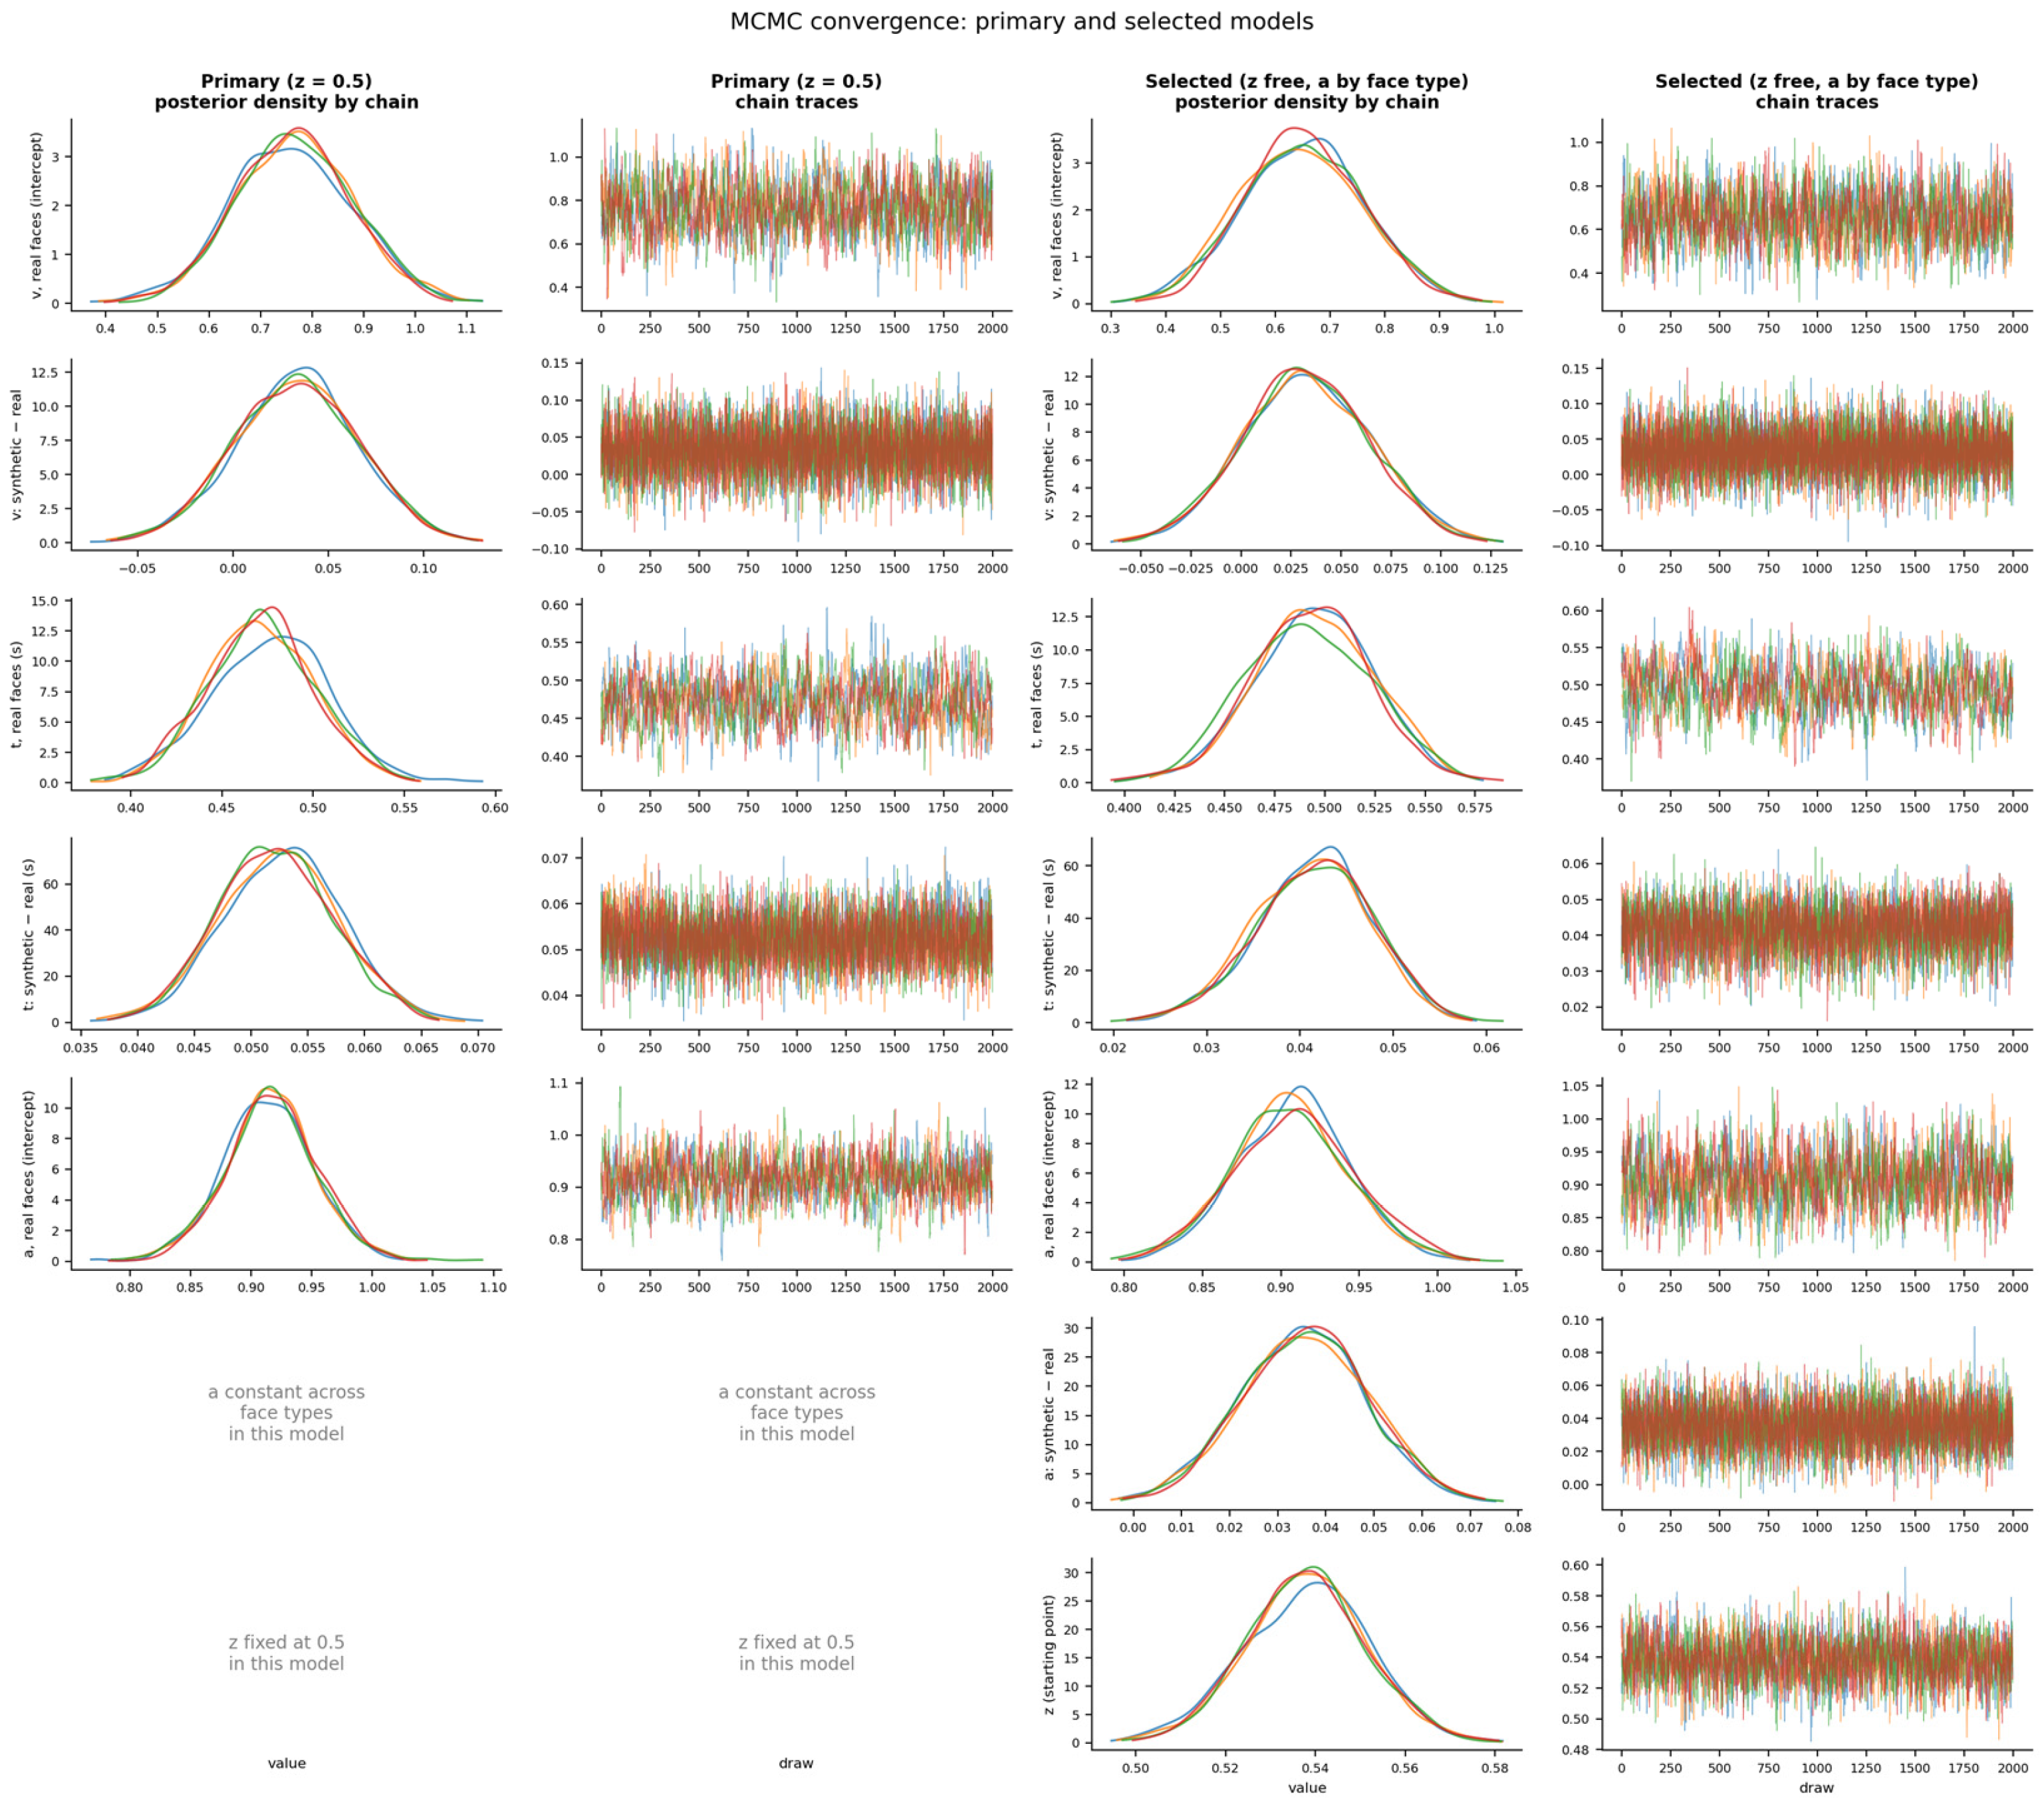
The candidate models are compared in Table A2 (Appendix A). The model in which the starting point was free, and boundary separation varied by face type, had the highest expected predictive accuracy (ELPD-LOO = −6370.3, SE = 104.7). It exceeded the primary model by ΔELPD = 89.7 (SE = 12.9) and the model with a free starting point but constant boundary separation by ΔELPD = 5.6 (SE = 4.1); the latter difference is small relative to its standard error, but WAIC (difference = 23.7) and the approximate DIC also ranked this model first. Allowing boundary separation to vary with the starting point fixed at 0.5 did not improve fit (ΔELPD = −17.0, SE = 4.5, relative to the primary model). Allowing the starting point to vary by face type, which tests the response-bias account directly, did not improve fit either: the expected predictive accuracy of that model was lower than that of the selected model (ΔELPD = −6.2, SE = 1.3; WAIC difference = −20.5), although its approximate DIC was marginally lower. In every model, fewer than 1.3% of the 6520 observations had Pareto k > 0.7. This model was therefore selected, and its face-type effects are reported below alongside those of the primary model. Posterior predictive checks (Figure A1; Appendix A) showed that the selected model reproduced the observed data more closely than the primary model (12 of 22 summary statistics within the 95% predictive interval, compared with 7 of 22), including the proportion of trustworthy responses for both face types. The improvement was concentrated in the leading edge of the RT distributions, which the primary model predicted to be faster than observed for untrustworthy judgments. Both models over-predicted the upper quantiles (0.7 and 0.9) of the RT distributions. The selected model met the convergence criterion ( ≤ 1.01; bulk and tail ESS ≥ 400) for every key parameter (maximum = 1.01, minimum bulk ESS = 480; 1 of 8000 transitions diverged), as did the primary model (maximum = 1.01, minimum ESS = 546; 2 of 8000 transitions diverged; Figure 3; Appendix B). In the two other candidate models, the non-decision time face-type effect mixed slowly ( = 1.02); this was traced to a single participant whose narrow RT distribution left their non-decision time and boundary separation weakly identified, and a refit without this participant converged fully and left the effect unchanged (Figure A2 Appendix B). The participant was retained in all reported analyses.
Figure 3.
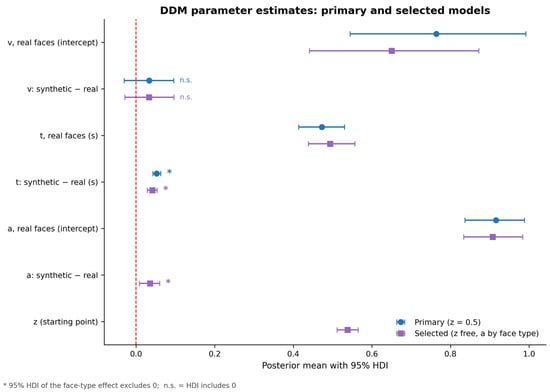
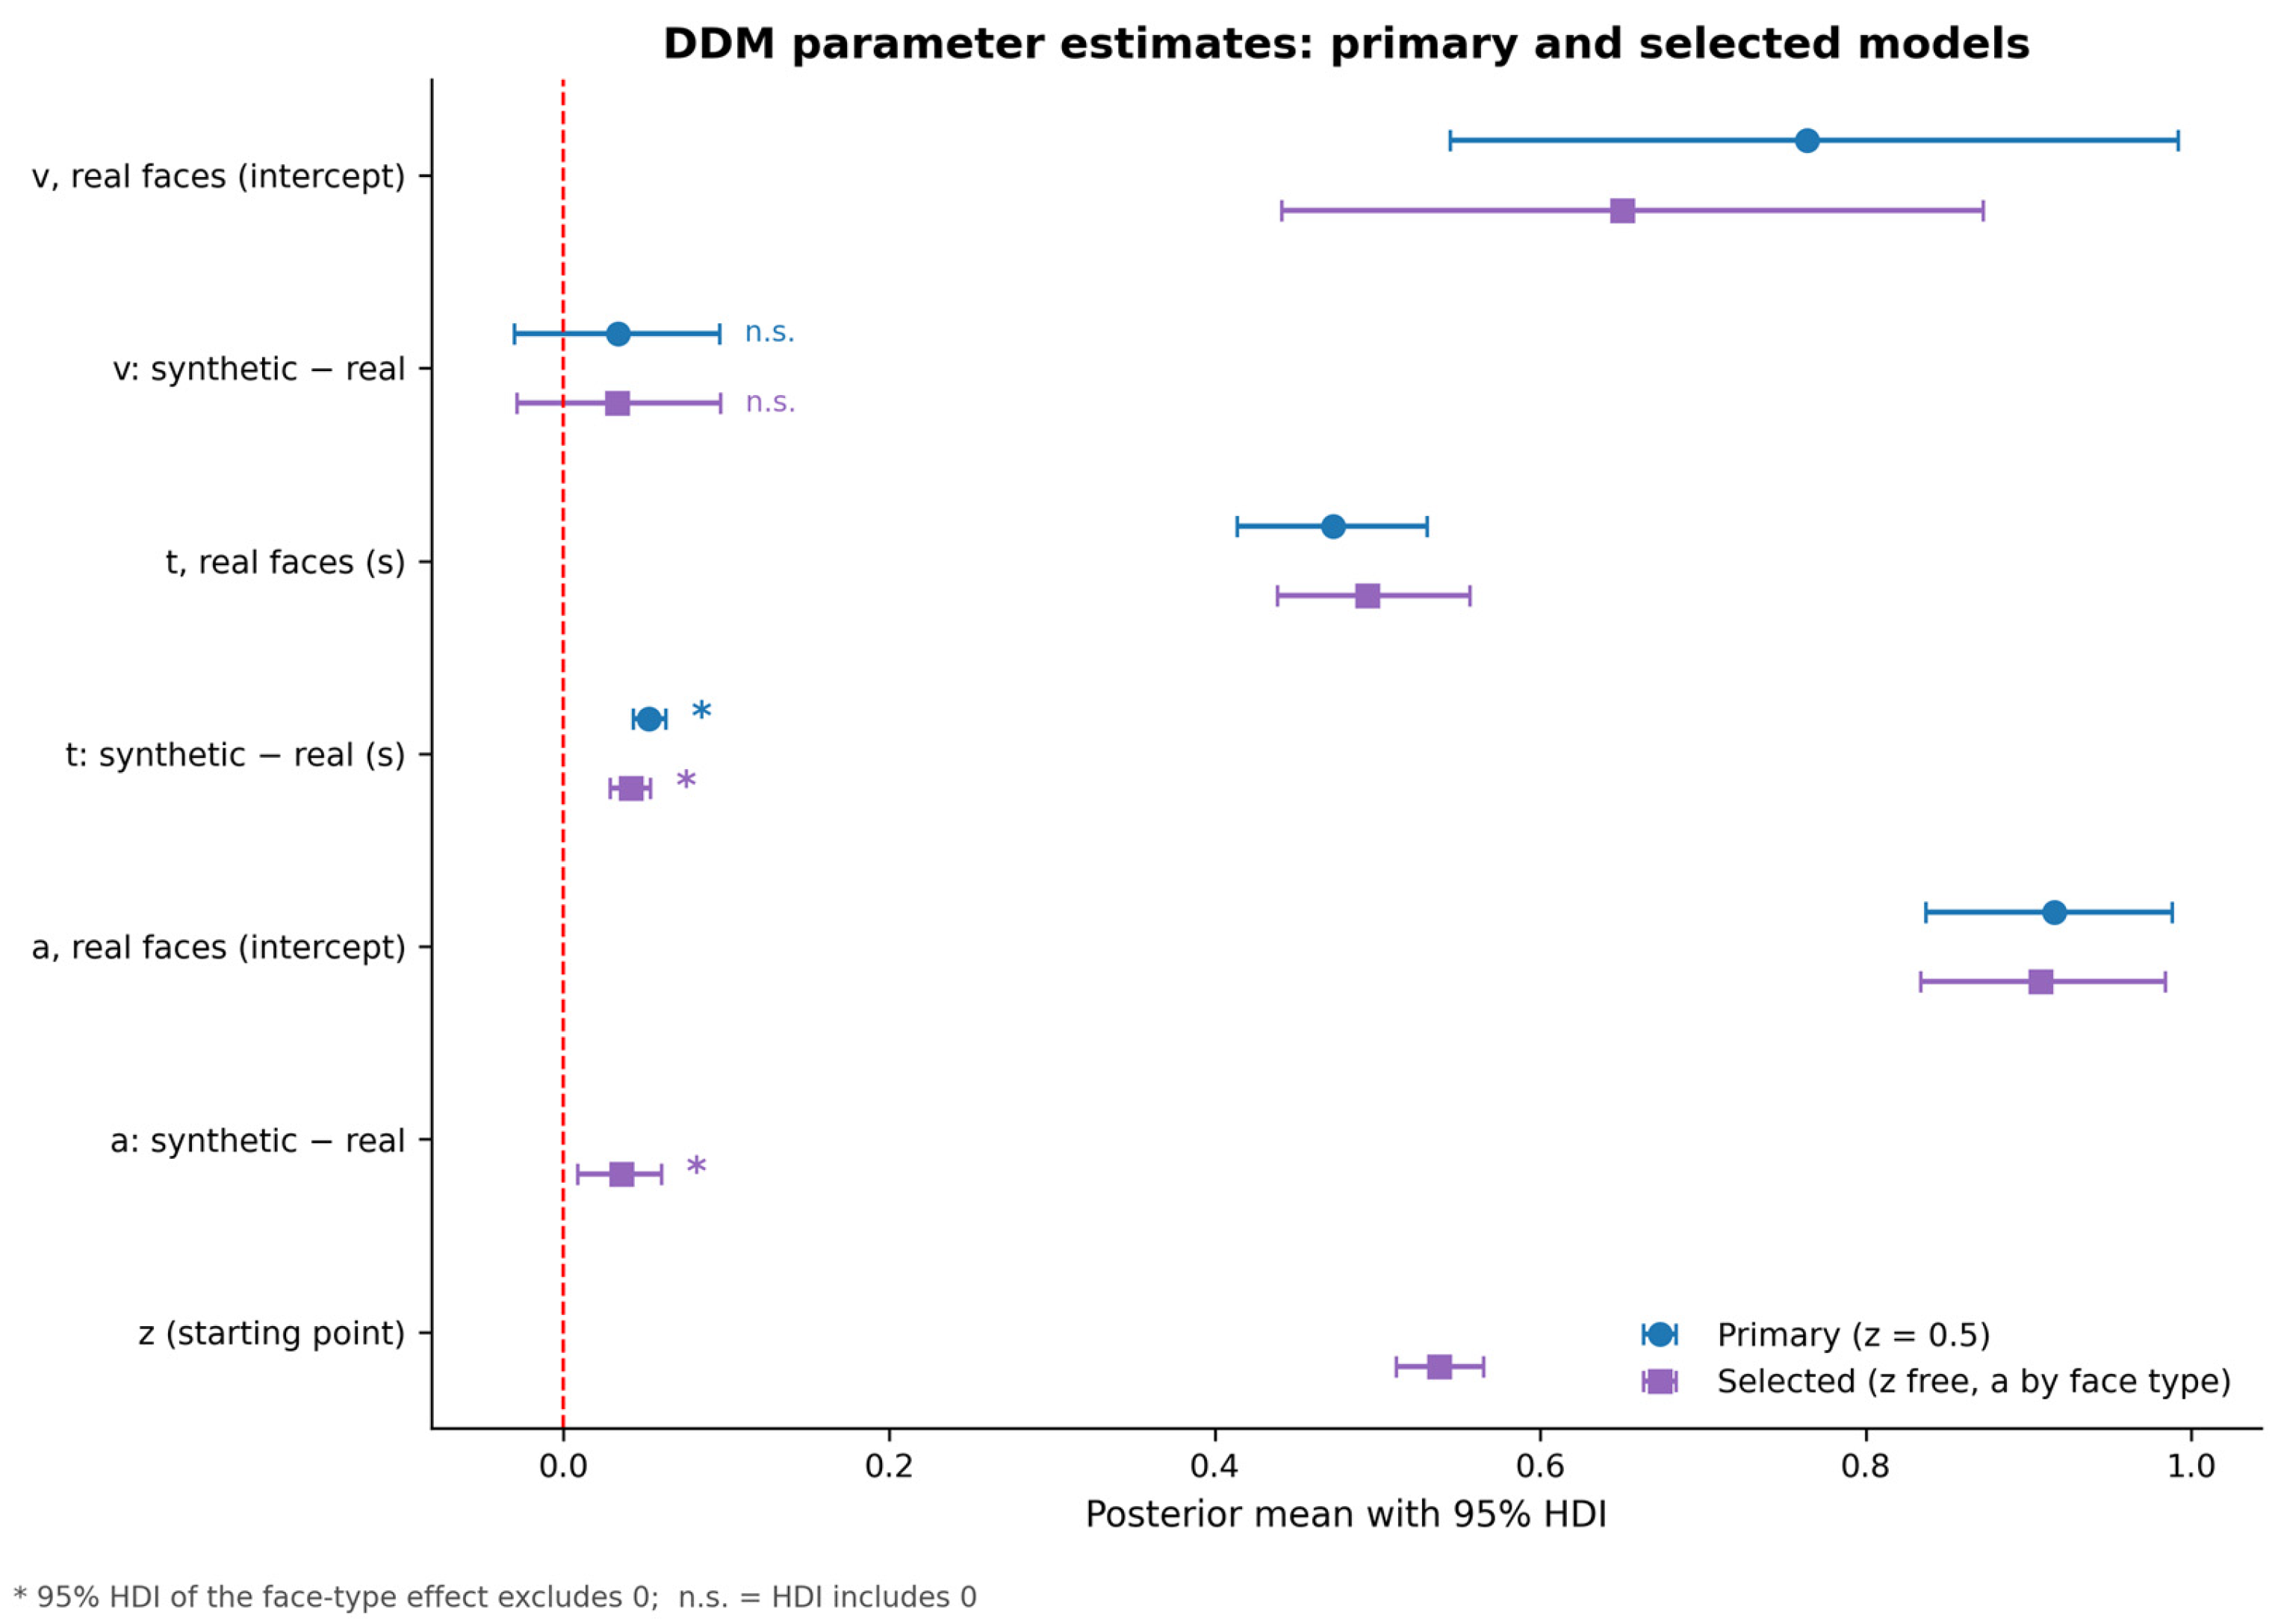
Drift Diffusion Model Parameter Estimates for the Primary and Selected Models. Points show posterior means and horizontal bars show 95% highest-density intervals (HDIs) of the group-level parameters for the primary model (z = 0.5, constant boundary separation; circles) and the selected model (z free, boundary separation varying by face type; squares). Rows labelled “synthetic − real” are face-type effects, and the dashed red line marks zero; an asterisk (*) marks a face-type effect whose 95% HDI excludes zero, and n.s. marks one whose HDI includes zero. Non-decision time is shown in seconds. Non-decision time was reliably longer for synthetic faces in both models and the drift-rate effect was centered near zero; in the selected model, boundary separation was slightly larger for synthetic faces and the starting point lay slightly above 0.5 (Section 3.3).
3.3.2. Non-Decision Time
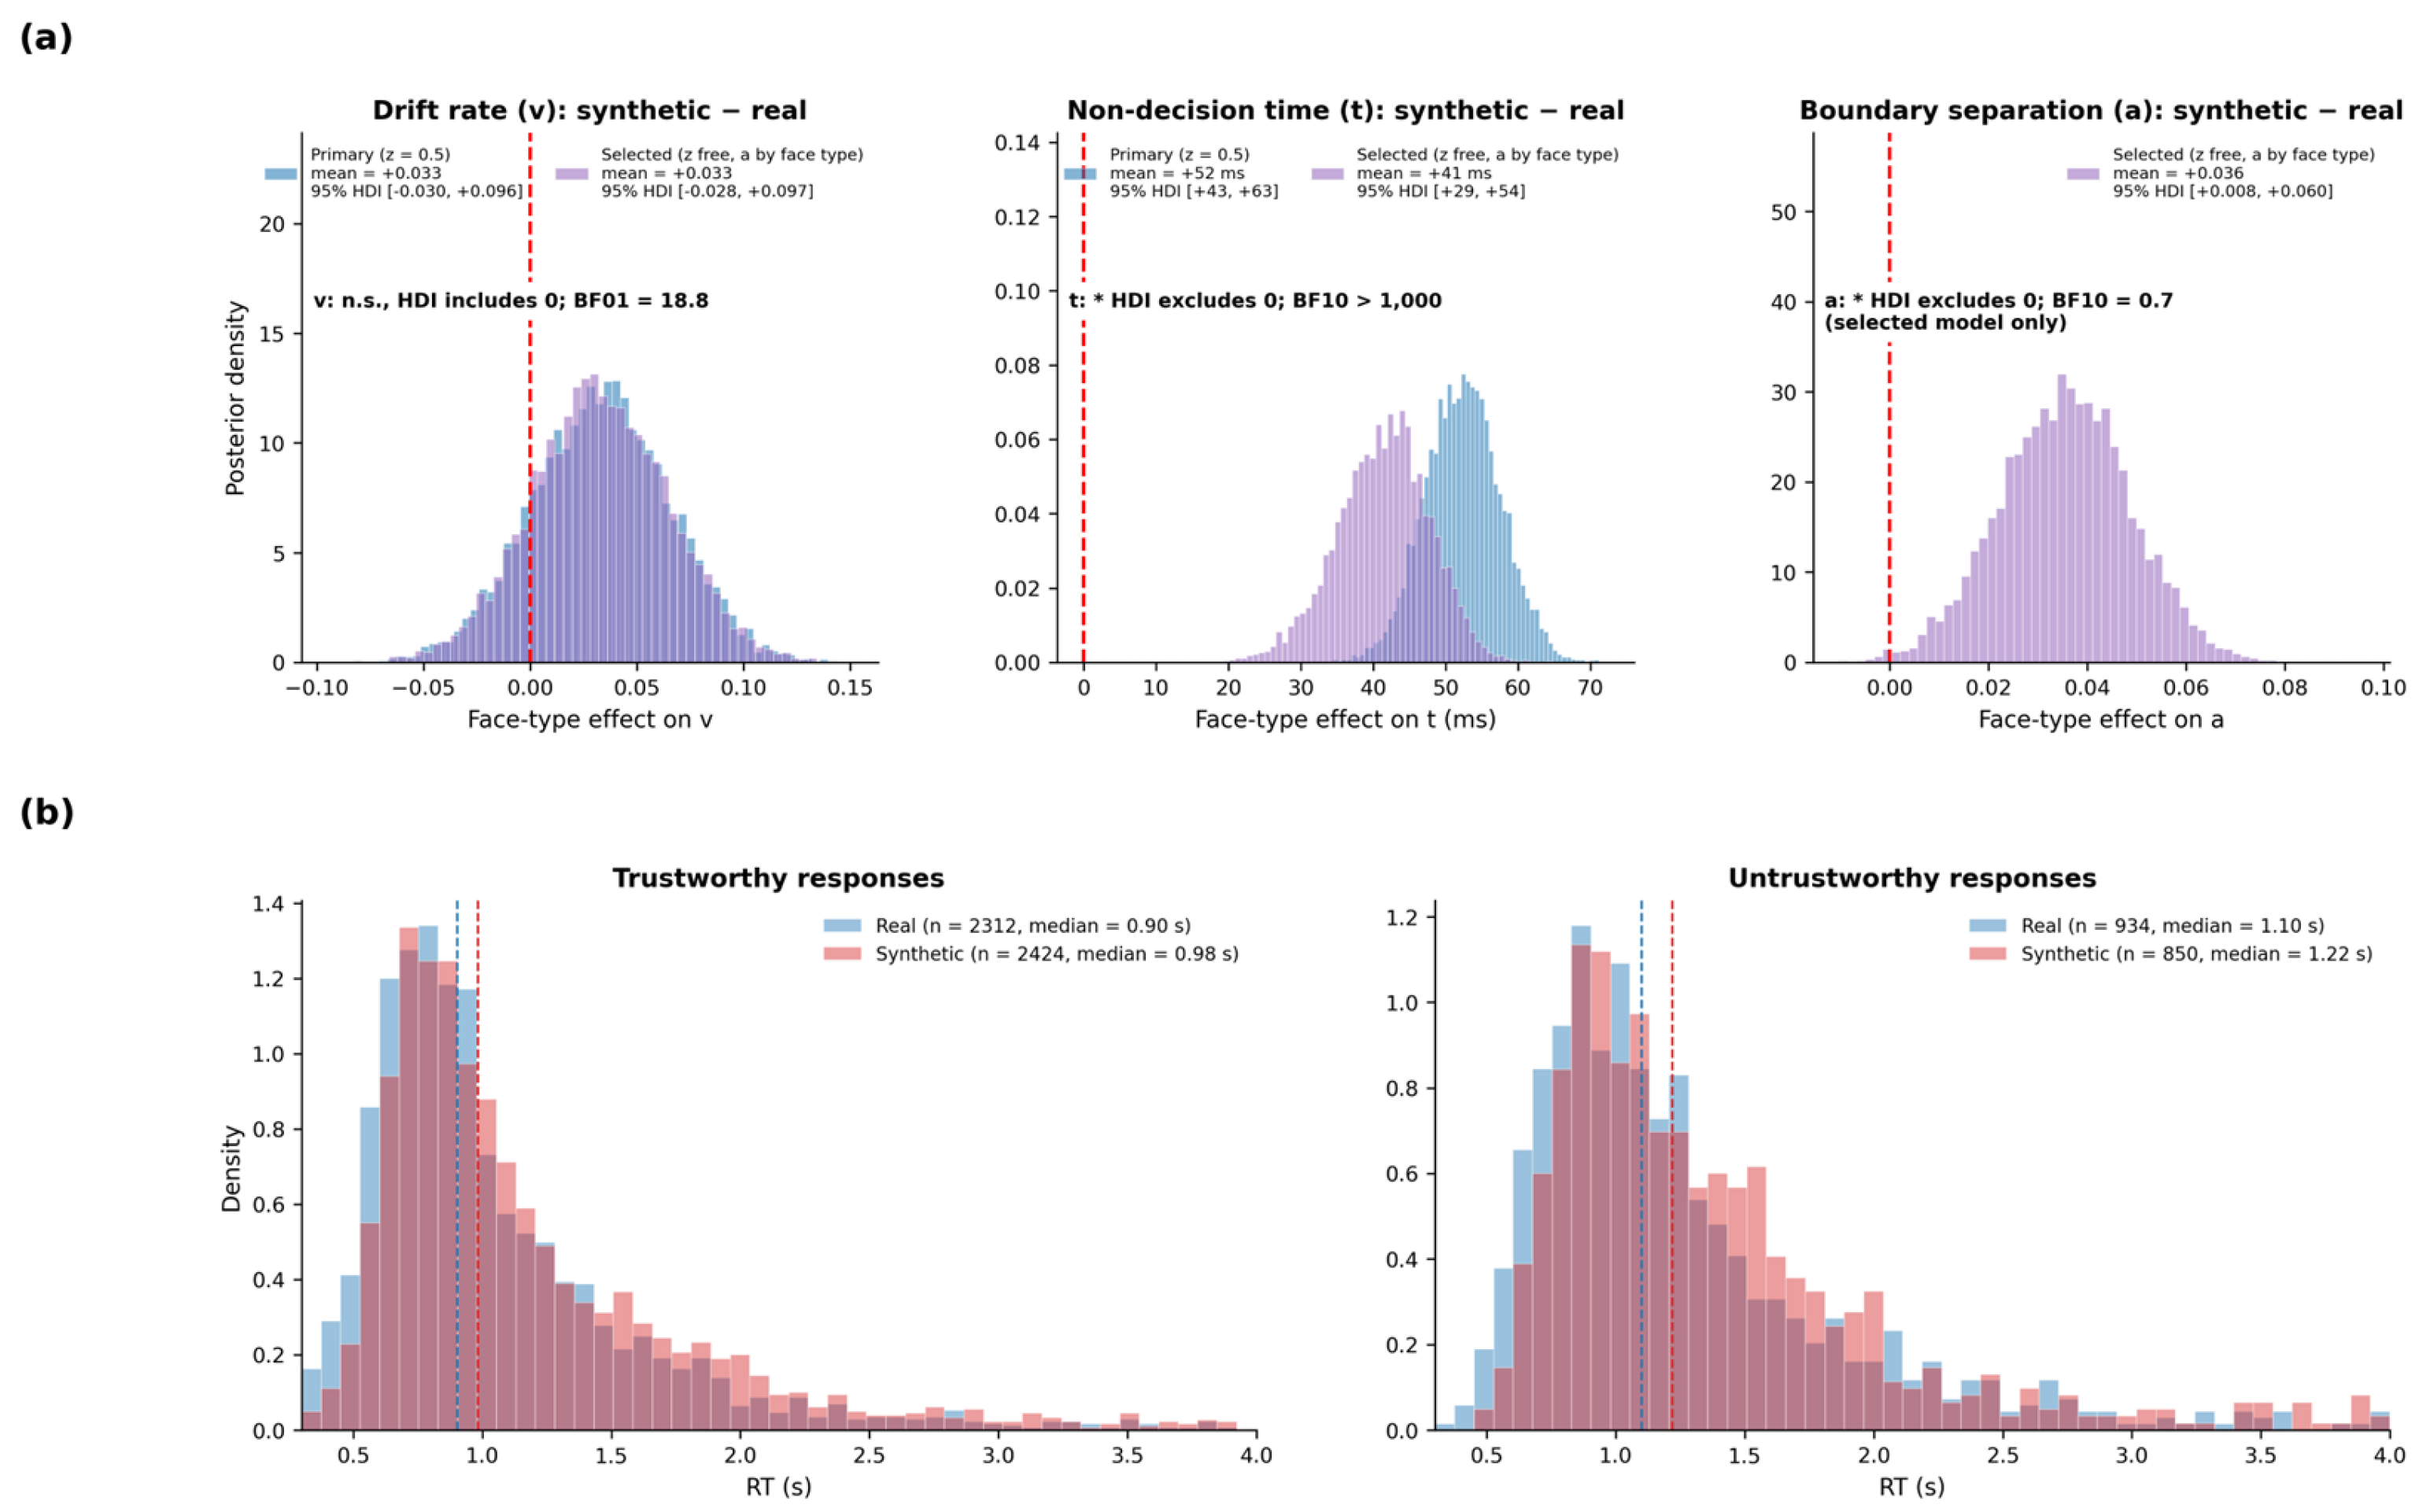
Synthetic faces produced a reliable increase in non-decision time relative to real faces. In the primary model, the posterior mean of the face-type effect on t was +52 ms (95% HDI [+43, +63 ms]), with a posterior probability of P(t_GAN > 0) = 1.000. This effect was robust to model specification. In the selected model, in which part of the latency cost was attributed to boundary separation (Section 3.3.4), the estimate was smaller but remained reliable (+41 ms, 95% HDI [+29, +54 ms]; P(t_GAN > 0) = 1.000), with the entire HDI outside the ROPE (±19.1 ms). The 95% HDI excluded zero by a wide margin in both models (see Figure 4). The entire 95% HDI also fell outside the ROPE (±19.6 ms, i.e., ±0.1 SD of the between-participant distribution of non-decision time), and no posterior samples fell at or below zero (Savage–Dickey BF10 > 1000).
Figure 4.
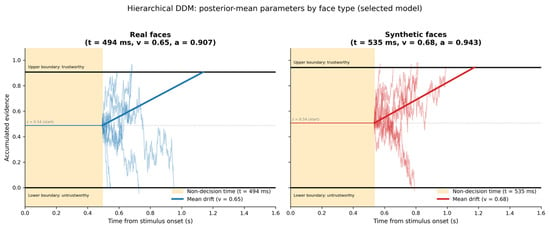
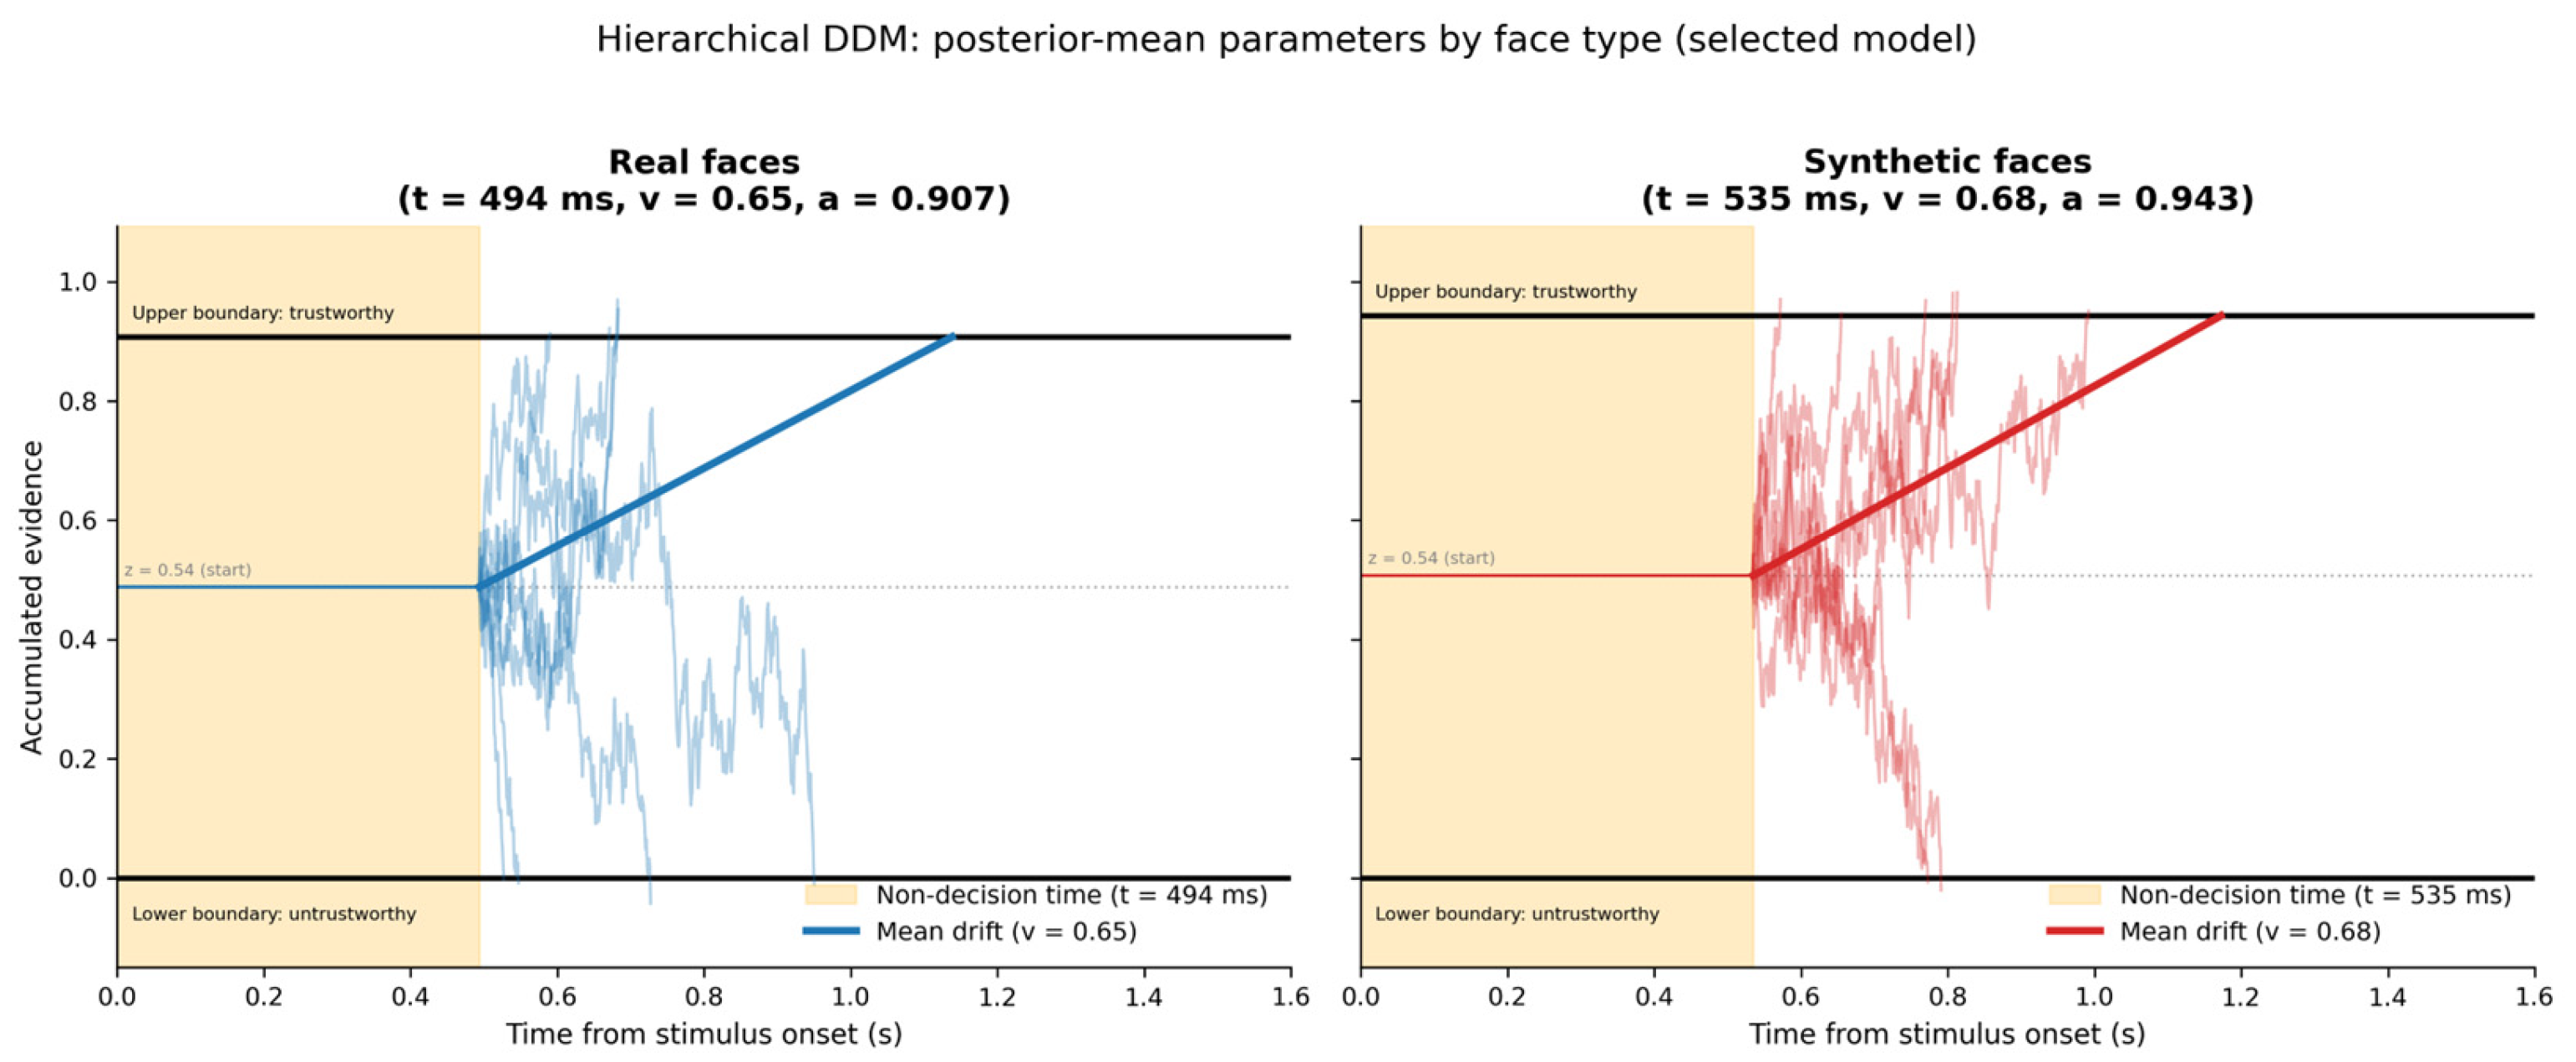
Hierarchical Bayesian Drift Diffusion Models for Real and Synthetic Faces. Each panel illustrates the diffusion process implied by the posterior-mean group-level parameters of the selected model for one face type. After the non-decision period (shaded), evidence accumulates from the starting point (dotted line) until it reaches the upper (“trustworthy”) or lower (“untrustworthy”) boundary; thin lines are eight simulated trials, and the thick line shows the mean drift. The two face types differ mainly in the length of the non-decision period and slightly in boundary separation (about 4% more evidence required for synthetic faces), whereas their drift rates are similar (values in the panel titles). The starting point (z = 0.538) was the same for both face types.
3.3.3. Drift Rate
The face-type effect on drift rate was not reliable. In the primary model, the posterior mean was +0.033 (95% HDI [−0.030, +0.096]; P(v_GAN < 0) = 0.154). In the selected model, the estimate was +0.033 (95% HDI [−0.028, +0.097]; P(v_GAN < 0) = 0.149). The 95% HDI included zero in both models, and the posterior mass was not concentrated in the theoretically predicted negative direction. Evidence accumulation toward trustworthiness judgments did not differ between synthetic and real faces (see Figure 5). The Savage–Dickey Bayes factor favored the absence of a face-type effect on drift rate (BF01 = 18.3 under the model’s Normal(0, 1) prior; BF01 = 9.2 and 4.6 under narrower Normal(0, 0.5) and Normal(0, 0.25) priors). With the ROPE defined as ±0.1 SD of the between-participant drift distribution (±0.071), 87% of the posterior fell within the ROPE, but the 95% HDI extended slightly beyond its upper bound, so equivalence was not formally established; the drift-rate result therefore constitutes moderate-to-strong evidence against a meaningful face-type effect rather than a definitive demonstration of equivalence; the selected model led to the same conclusion (BF01 = 18.8 under the Normal(0, 1) prior).
Figure 5.
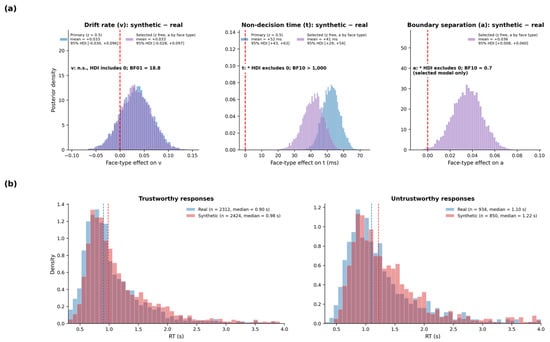
Face-type Effects on Drift Diffusion Model Parameters and Observed Response Times. (a) Posterior distributions of the face-type effect (synthetic − real) on drift rate (left), non-decision time (middle) and boundary separation (right) in the primary (blue) and selected (purple) models; overlapping regions appear darker, and the dashed red line marks no effect. Boundary separation varied by face type only in the selected model. The non-decision time posterior lies entirely above zero in both models; the drift-rate posterior straddles zero, and the small boundary-separation effect has an HDI that excludes zero but is not supported by its Bayes factor (each panel gives the Bayes factor; Section 3.3.2, Section 3.3.3 and Section 3.3.4). (b) Observed RT distributions for real (blue) and synthetic (red) faces, shown separately for trustworthy (left) and untrustworthy (right) responses; dashed lines mark the medians. Synthetic faces shifted both distributions to the right (medians in the legends).
3.3.4. Boundary Separation and Starting Point
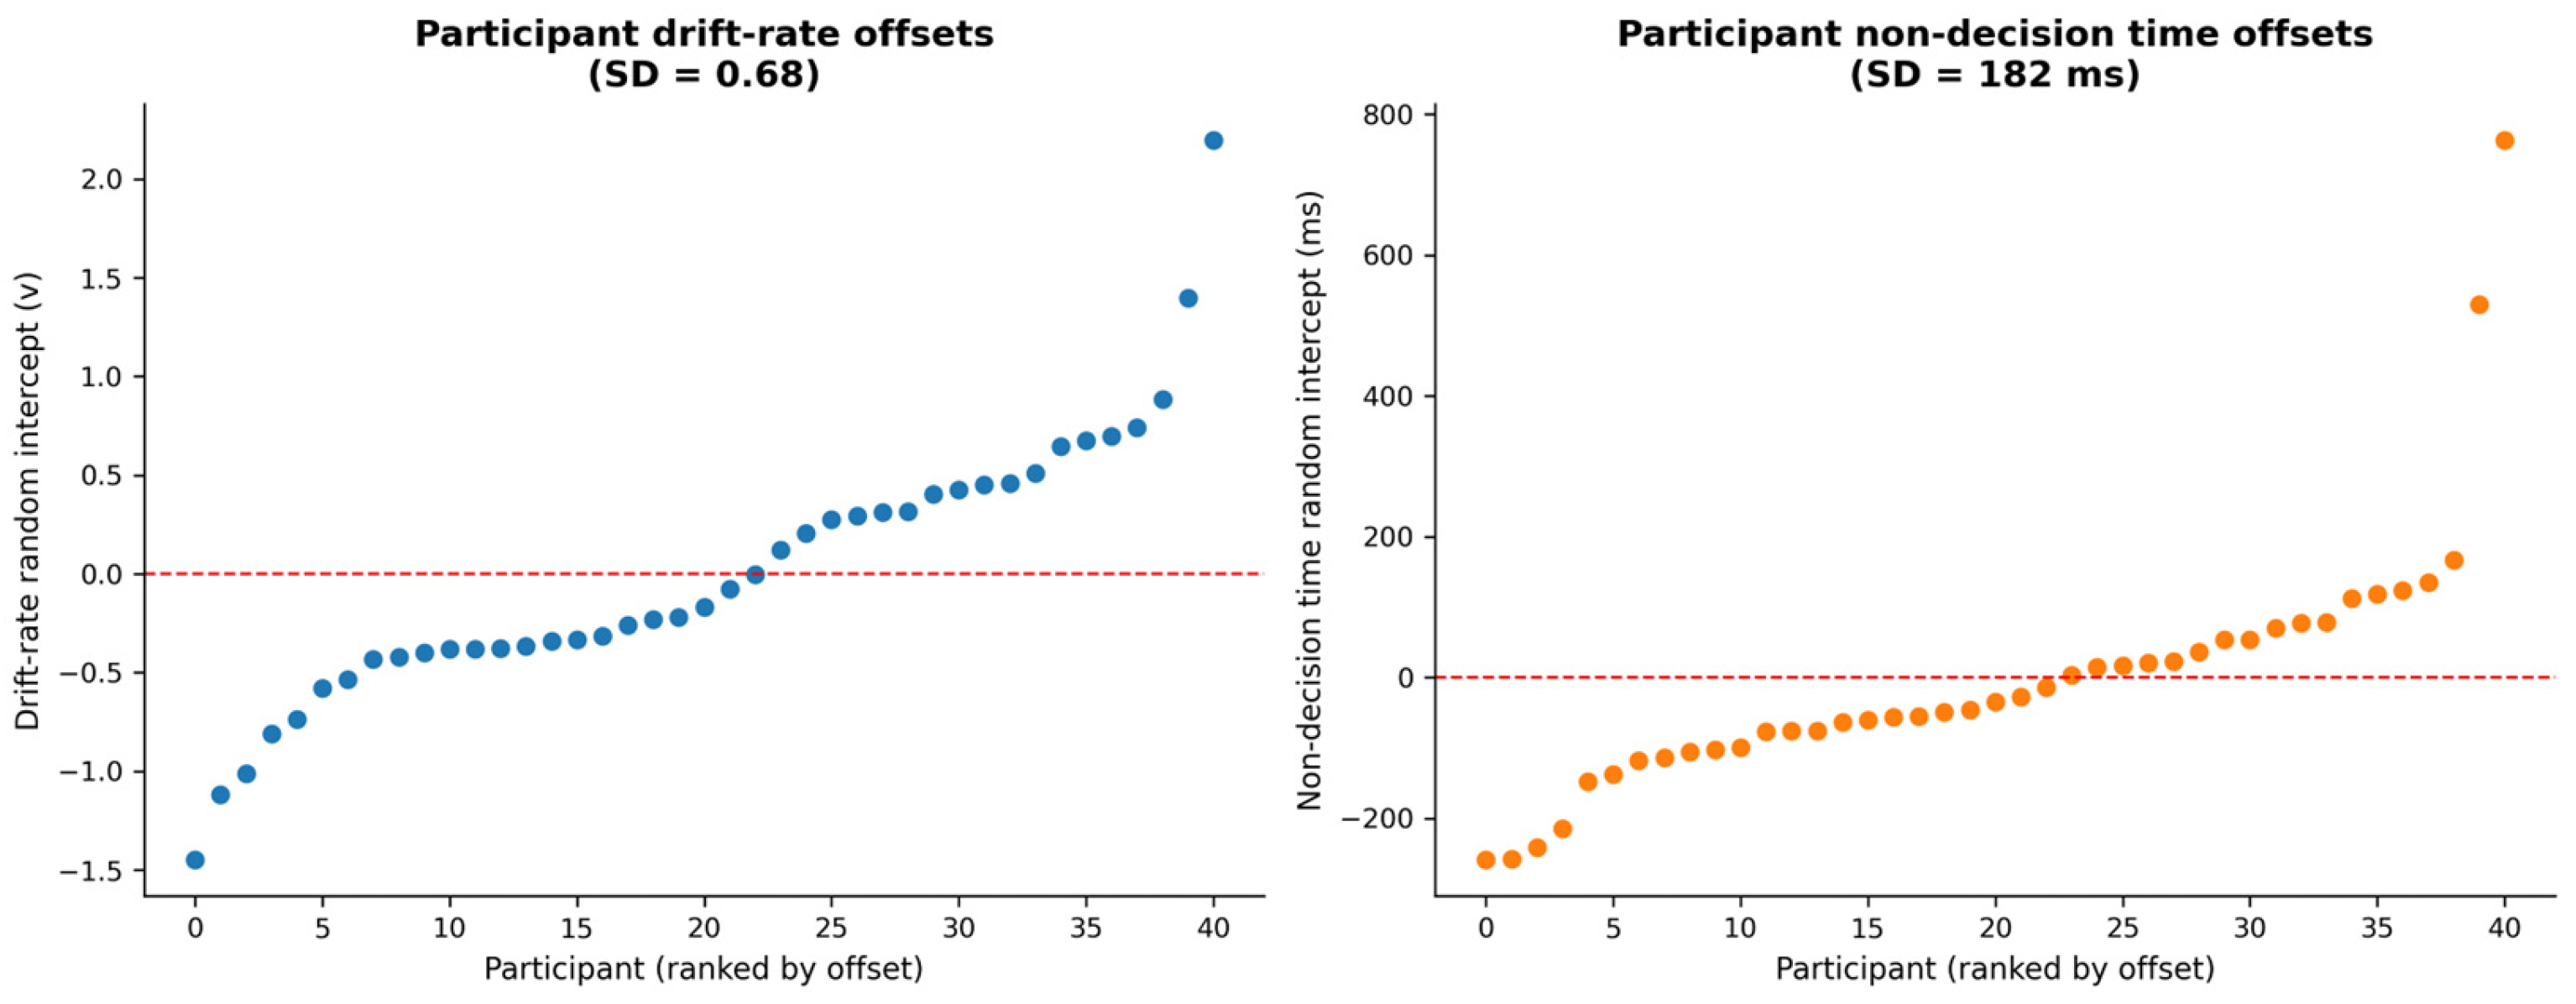
Boundary separation was estimated at a = 0.916 (95% HDI [0.837, 0.988]) in the primary model and a = 0.907 (95% HDI [0.834, 0.984]) for real faces in the selected model, indicating moderate response caution. In the selected model, boundary separation was larger for synthetic faces (a_GAN = +0.036, 95% HDI [+0.008, +0.060]; P(a_GAN > 0) = 0.996), an increase of about 4% that indicates slightly greater response caution for synthetic faces. Evidence for this effect was weak, however: the Savage–Dickey Bayes factor did not favor its presence (BF10 = 0.7 under the Normal(0, 0.5) prior), and 18% of its posterior fell within the ROPE (±0.024), so it should be regarded as tentative. In the selected model, the starting-point intercept was estimated at z = 0.538 (95% HDI [0.512, 0.565]), reflecting a modest population-level bias toward the trustworthy boundary. In the model in which the starting point also varied by face type, the face-type effect on z was negligible (z_GAN = +0.006, 95% HDI [−0.013, +0.028]; BF01 = 8.0 under its Normal(0, 0.1) prior; 49% of the posterior within the ROPE of ±0.008), and the other face-type effects were unchanged (non-decision time +43 ms, 95% HDI [+29, +56 ms]; boundary separation +0.036, [+0.010, +0.062]; drift rate +0.016, [−0.071, +0.096]). The bias toward the trustworthy boundary therefore applied equally to both face types, and the response-bias account of the latency cost was not supported. Critically, allowing the starting point to vary did not alter the non-decision time or drift rate estimates, confirming that the primary finding is not an artifact of unmodeled starting-point bias. Allowing boundary separation to vary as well reduced the non-decision time effect from +52 to +41 ms, attributing part of the latency cost to response caution, but the non-decision time effect remained reliable and the drift-rate effect null. Additionally, subject-level random intercepts revealed substantial individual variation in both drift rate (SD = 0.68) and non-decision time (SD = 182 ms) in the selected model, indicating that the hierarchical structure was necessary to accommodate the heterogeneity in the sample. The partial-pooling structure of the hierarchical model ensures that these individual differences are accommodated without permitting noisy individual estimates to distort the group-level inference (see Figure A3 Appendix C).
Subject-level associations. In the supplementary model with subject-level face-type slopes (see Appendix A for its convergence; because some transitions diverged, subject-level estimates should be interpreted with caution), each participant’s Δt correlated with Δcumulative fixation time (r = 0.68, 95% HDI [0.57, 0.77]) and Δfixation count (r = 0.65, [0.54, 0.74]), and Δv correlated negatively with both (r = −0.36, [−0.46, −0.27]; r = −0.35, [−0.45, −0.25]). Because both gaze measures accrue within the response window, both parameters are partly linked to them through response time (correlation with each participant’s RT difference: Δt, r = 0.66; Δv, r = −0.38). After controlling for the RT difference, Δt remained associated with Δcumulative fixation time (partial r = 0.23, [0.10, 0.34]) but not with Δfixation count (partial r = 0.05, [−0.05, 0.16]), whereas Δv was not associated with either gaze measure (partial r = 0.08, [−0.07, 0.22]; r = 0.05, [−0.09, 0.19]). Beyond what is shared through response time, the synthetic-face cost on non-decision time, but not on drift rate, therefore tracked how much longer participants fixated on synthetic faces, providing modest converging support for a non-decisional locus.
4. Discussion
In the present study, we investigated mental processes underlying appraisal of synthetic and real human faces using hierarchical Bayesian DDM. The present study was designed based on the trustworthiness rating paradigm [5], and eye-tracking metrics were also recorded to indicate perception of face images. The hypotheses were partially supported. Our findings suggest that GAN-generated faces incur an additional processing cost that is not reflected in explicit trustworthiness judgments, which did not differ significantly between face types. In other words, the additional time participants spent processing synthetic faces arose mainly before evidence accumulation, with a smaller, tentative contribution from greater response caution. To our knowledge, the present study is among the first applications of hierarchical DDM to the question of synthetic face processing.
The hypothesis regarding trustworthiness ratings and RTs was partially supported (Hypothesis 1). In line with prior studies [7,8,9,10,11], the present results showed that, while participants spent longer time to decide whether to trust a synthetic face, the proportion of trustworthy ratings was numerically higher for synthetic than for real faces, as predicted, but the difference was not significant, a pattern consistent with, although not a direct test of, the absence of an explicit detection strategy. The evaluative output did not differ significantly between real and synthetic faces, although the design was sensitive only to moderate or larger effects. These behavioral results should also be interpreted with caution because they depended on the treatment of three participants who responded very rapidly on many trials: when these participants were excluded, the trustworthiness difference became significant, and the RT difference did not (Table 2), although both effects kept their direction. Neither the RT cost nor the absence of a difference in trustworthiness should therefore be regarded as firmly established by the present sample. The starting-point estimate (z = 0.538) indicates a general bias toward judging faces as trustworthy, consistent with the high overall proportion of trustworthy responses (0.71 for real and 0.74 for synthetic faces). Because this bias did not differ between face types (Section 3.3.4), the numerically higher trustworthiness of synthetic faces did not arise from a face-type-specific response bias; within the model, it corresponds to the small and non-reliable positive drift-rate effect.
The results partially supported the hypothesis about eye-gaze metrics (Hypothesis 2). Cumulative fixation time and fixation count were both significantly elevated for synthetic faces, while average fixation duration was not. The pattern across eye-tracking metrics clarifies the nature of the additional visual engagement with synthetic faces, indicating that the cumulative fixation time effect was driven by a greater number of fixations rather than longer individual fixations, and, because fixation rate was unchanged, suggesting that participants sampled synthetic faces at the same rate but for longer. This pattern is also consistent with a disfluency account [14]. That is, the perceptual anomaly introduced by synthetic faces did not alter the basic unit of visual engagement but increased the number of sampling events required before the observer disengaged from the stimulus. Importantly, this increased visual sampling did not translate into differential evaluative output, as trustworthiness proportions did not differ significantly despite the greater gaze engagement with synthetic faces.
Our hypothesis about DDM parameters was supported (Hypothesis 3). While previous research documented that synthetic faces elicit behavioral differences [8,9,10,11], those findings did not examine the processing stages underlying these differences. Non-decision time indexes all processing outside evidence accumulation, including response preparation and execution, and its motor component can vary with task conditions [18]. Although the response mapping was identical for both face types, condition-dependent response preparation cannot be excluded by the present design; the increase in non-decision time is therefore most plausibly, but not exclusively, attributable to encoding, an interpretation supported by the concurrent increase in fixation count on synthetic faces. This interpretation is consistent with the notion that GAN-generated faces, despite their explicit photorealism, introduce subtle distributional properties registered as perceptual anomaly [14]. The model comparison also favored slightly larger boundary separation for synthetic faces, so part of the latency cost (about 11 of 52 ms) may reflect greater response caution, as the response-caution account predicts; this effect was small and not supported by its Bayes factor, and it leaves the main conclusion unchanged, because the non-decision time effect remained reliable and drift rate was unaffected in every model.
The conjunction of longer processing times with a marginal trend toward higher trustworthiness ratings for synthetic faces introduces a dissociation that the standard fluency-affect framework does not straightforwardly predict. Under the classical account, disfluent processing produces less favorable evaluations [14]. Given that synthetic faces are processed disfluently, as the non-decision time increase suggests, the expected result would be lower trustworthiness, not higher. This paradox admits a specific resolution within the dual-process framework. The disfluency signal, localized in non-decision time, feeds perceptual encoding systems that do not directly modulate the evaluative computation captured by drift rate. The explicit trustworthiness judgment, by contrast, may be driven by configural facial properties (i.e., symmetry, averageness, skin uniformity, etc.) [5]. Under this account, the same optimization that makes synthetic faces perceptually disfluent at the encoding level simultaneously makes them configurally attractive at the evaluative level.
Because perceptual fluency can serve as evidence in social judgment [14], the absence of a drift-rate effect requires explanation rather than assumption. Two mechanisms, which are not mutually exclusive, could produce the observed pattern. Under an encoding account, the anomaly lengthens the time required to form a stable configural representation of the face; once that representation is formed, the information passed to the comparison process is equivalent for both face types, so the cost appears when evidence accumulation begins rather than in its rate. The longer viewing of synthetic faces, with more fixations at an unchanged fixation rate and duration, is consistent with continued sampling before the representation stabilizes. Under an offsetting account, a disfluency signal does enter the evaluative process, but synthetic faces are also more average than real faces [11], and prototypicality is itself a source of processing fluency [14]; the two influences could cancel, leaving drift rate unchanged on average. The present data cannot fully separate these accounts, but they make different predictions: the encoding account predicts that the non-decision time cost should shrink when the face is pre-exposed before the judgment is required, whereas the offsetting account predicts drift-rate effects of opposite sign for synthetic faces that differ in averageness.
The proliferation of GAN-generated faces represents an ecologically consequential shift in which AI-generated representations increasingly occupy roles historically reserved for human faces. This shift is represented by the construct of relational role attribution (RRA), by which a user infers that an AI system is socially capable, involving judgments of competence, mutuality, and social functionality [31,32,33]. The present study served to address how human perceptual systems respond to AI-generated social stimuli before interaction occurs.
Our findings suggest that the perceptual ground upon which RRA is constructed is not neutral. Specifically, observers begin appraising AI-generated stimuli at a pre-relational stage, indicating that the mechanisms supporting later relational inferences are already engaged during early perceptual encoding. The processing cost observed here may therefore represent the earliest observable signature of the broader appraisal processes that, in interactive contexts, culminate in relational and role attribution. This interpretation situates the present findings within a developmental trajectory linking low-level perception to higher-order social cognition.
In applied contexts, AI-generated avatars and synthetic agents increasingly function as the primary visual interfaces through which systems project relational roles—a process described as technology role projection [34,35]. If synthetic faces impose a perceptual processing cost at the outset, then the initial conditions under which users encounter AI agents differ systematically from those associated with human faces. This asymmetry in perceptual starting points may propagate forward, shaping the efficiency, fluency, and outcomes of subsequent relational appraisals.
The practical implications are particularly salient for interactive and time-sensitive environments. AI-generated avatars are now widely deployed across domains, e.g., conversational agents, autonomous vehicle interfaces, telehealth systems, and customer service platforms. If a synthetic face introduces a processing cost that arises mainly before evidence accumulation, even in static, non-interactive contexts, this cost is unlikely to diminish when embedded in dynamic interactions requiring rapid perceptual processing. In tasks where timely interpretation of visual or communicative cues is critical, even modest delays in encoding could degrade the temporal coordination between human users and AI systems.
From a system design perspective, our findings reframe the choice of visual representation as a factor with measurable cognitive consequences rather than a purely aesthetic consideration. Synthetic faces, often optimized for attractiveness and configurational regularity, may simultaneously enhance explicit evaluations (e.g., perceived trustworthiness or appeal) while introducing perceptual disfluency that increases processing demands. As a result, anthropomorphic interfaces may carry a dual signature: one that facilitates favorable evaluative judgments while taxing the encoding processes that preceded them. The balance between these opposing effects is likely to depend on contextual factors such as cognitive load, temporal constraints, and the relational stakes of the interaction [16,19].
Several constraints on the present findings should be noted. First, the sample was relatively small and only included college students, limiting the generalizability of the findings. With 41 participants, the within-subject comparisons were sensitive only to effects of d_z ≥ 0.45; the non-significant trustworthiness difference should therefore not be read as evidence of equivalent ratings, and the significance of the RT and trustworthiness results changed when three participants who responded very rapidly on a substantial proportion of trials were excluded (Appendix C). Second, the total duration of the task varied across participants, which may lead to confounding effects of fatigue and attention lapses. Fixed response time windows and assessments of those confounding factors should be included in future studies. Third, the stimuli were generated using StyleGAN2, which has been surpassed by diffusion-based architectures that produce outputs with different distributional properties. Thus, our findings should be replicated in future studies using more advanced AI-generated stimuli. Fourth, the present task used static, non-interactive stimuli, which may decrease the ecological validity of the findings. In realistic settings, dynamic human–AI interaction is uncertain, and the processing cost identified here, which arises mainly before evidence accumulation, may operate differently when synthetic faces are embedded in systems that engage conversational, relational, and task-oriented processing simultaneously. Fifth, no independent measure of awareness was collected, so the claim that the processing cost is not reflected in explicit report is inferred from the dissociation between processing measures and ratings rather than tested directly; a post-task discrimination test or retrospective report should be included in future studies. Sixth, non-decision time includes response preparation and execution as well as encoding, and the present design cannot rule out condition-dependent differences in response preparation. Seventh, eye-tracking data quality varied across participants (validation accuracy 0.30–3.38°), and the face AOI was defined only at the level of four quadrants, which limits the spatial precision with which the additional fixations could be localized.
Meanwhile, our findings open several lines of future investigation. First, future studies should determine whether the processing cost is general to AI-generated imagery or specific to GAN-based distributional artifacts. Next, neuroimaging and physiological methods could provide convergent evidence that the effect arises before evidence accumulation by testing whether synthetic faces elicit differential neural activity in early visual processing regions prior to the engagement of evaluative processing in the prefrontal cortex [36,37]. Finally, the fluency paradox identified above warrants systematic investigation across judgment domains, stimulus modalities, and cultural contexts to determine whether this dissociation is a stable feature of how the human processing architecture responds to synthetic stimuli or a boundary condition specific to the present paradigm.
5. Conclusions
Our findings indicated that GAN-generated faces incur a processing cost that is not reflected in explicit trustworthiness judgments. The hierarchical Bayesian DDM decomposition revealed that this processing cost lies mainly in non-decision time, which includes response preparation and execution as well as perceptual encoding, accompanied by a slight increase in response caution, and that it does not alter the trustworthiness judgment. Because the behavioral effects depended on the treatment of three participants who responded very rapidly on many trials (Table 2), these conclusions should be confirmed in a larger sample. As AI-generated content proliferates across social, commercial, and political domains, the present findings contribute to a better understanding of the perceptual processing costs of synthetic stimuli and how the human processing architecture engages with an increasingly artificial social environment. The present study also highlights the application of DDM to studying perception of AI-generated information.
Author Contributions
Conceptualization, M.J.G., K.H. and X.Y.; methodology, M.J.G., K.H. and X.Y.; software, M.J.G. and K.H.; validation, X.Y.; formal analysis, M.J.G.; investigation, M.J.G., K.H. and X.Y.; resources, X.Y.; data curation, K.H.; writing—original draft preparation, M.J.G. and K.H.; writing—review and editing, X.Y.; visualization, M.J.G. and K.H.; supervision, X.Y.; project administration, X.Y.; funding acquisition, X.Y. All authors have read and agreed to the published version of the manuscript.
Funding
This research received no external funding.
Institutional Review Board Statement
The study was conducted in accordance with the Declaration of Helsinki and approved by the Institutional Review Board of Old Dominion University (protocol code 2248702-3 and date of approval: 24 October 2024).
Informed Consent Statement
Informed consent was obtained from all subjects involved in the study. Written informed consent has been obtained from the patients to publish this paper.
Data Availability Statement
The raw data supporting the conclusions of this article will be made available by the authors on request.
Acknowledgments
We would like to thank the research team in the Applied and Translational Psychophysiology Lab at Old Dominion University for their contributions to this study.
Conflicts of Interest
The authors declare no conflicts of interest.
Abbreviations
The following abbreviations are used in this manuscript:
| GANs | Generative adversarial networks |
| DDM | Drift diffusion model |
| RT | Response time |
| ANOVA | Analysis of variance |
| SD | Standard deviation |
| AI | Artificial intelligence |
| I-VT | Identification by velocity-threshold |
| AOI | Area of interest |
| HDI | Highest density interval |
| ESS | Effective sample size |
| MCSE | Monte Carlo standard error |
| RRA | Relational role attribution |
| BF | Bayes factor |
| ITI | Inter-trial interval |
| PSIS-LOO | Pareto-smoothed importance-sampling leave-one-out cross-validation |
| ROPE | Region of practical equivalence |
| WAIC | Widely applicable information criterion |
Appendix A
This appendix reports the formal comparison of the candidate drift diffusion models (Table A1), the posterior predictive check of the selected model (Figure A1), the sensitivity of the behavioral and gaze results to participant exclusions (Table A2), and the model with participant-level face-type slopes used for the subject-level analyses in Section 3.3.4.
Table A1.
Sensitivity of Face-type Effects to Participant Exclusions.
Figure A1.
Posterior Predictive Check of the Selected Model. Open circles show the observed 0.1, 0.3, 0.5, 0.7 and 0.9 RT quantiles for trustworthy (blue) and untrustworthy (orange) responses to real (left) and synthetic (middle) faces, and the observed proportion of trustworthy responses for each face type (right). Dashes show the mean and shaded bars the 95% interval of the same statistics computed from data sets simulated from the posterior (each simulated with the 300 ms–10 s trimming applied to the observed data). 12 of the 22 observed statistics fell within the 95% predictive interval (7 of 22 for the primary model), including the proportion of trustworthy responses for both face types; the main misfit was an over-prediction of the slowest responses (0.7 and 0.9 quantiles).
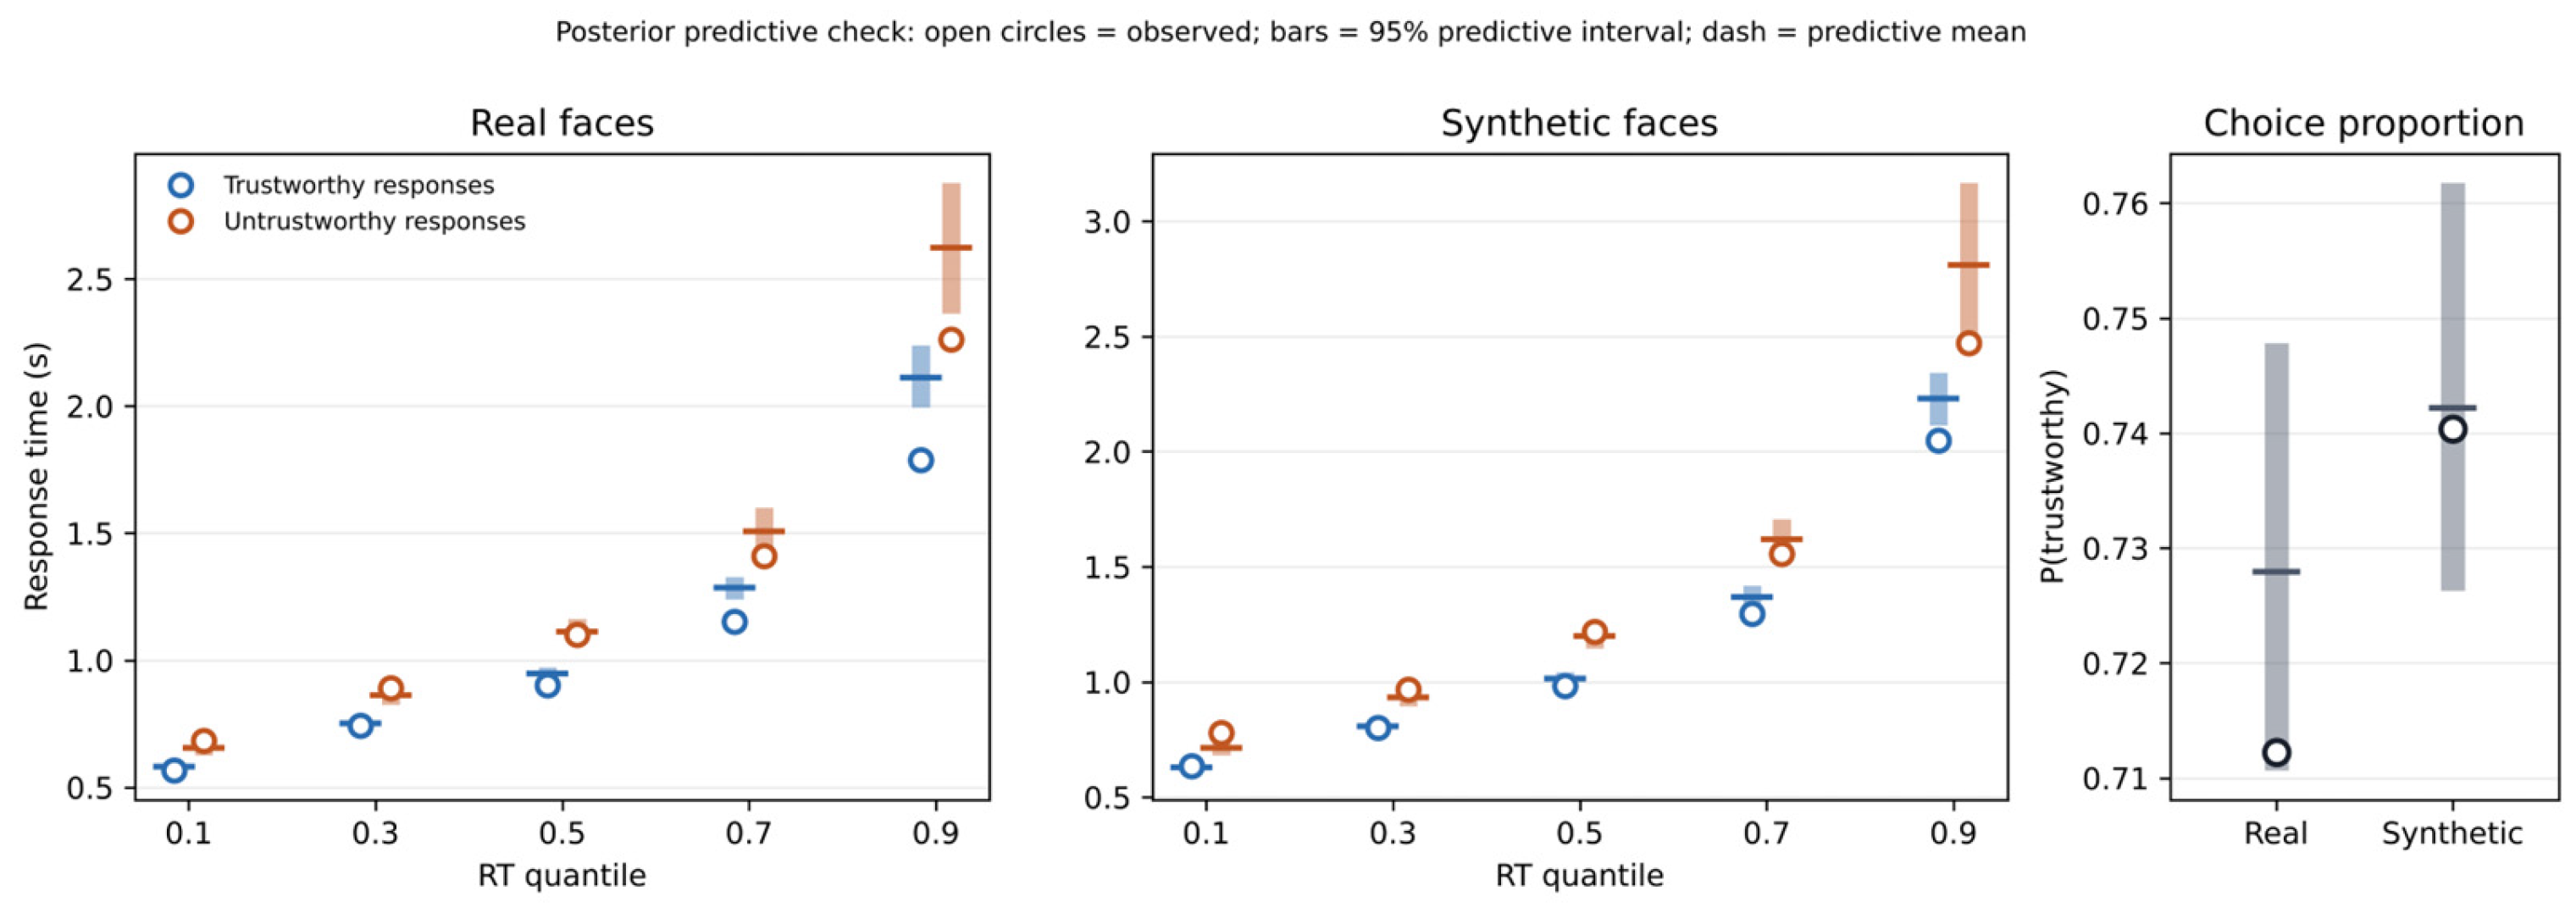
Table A2.
Comparison of Candidate Drift Diffusion Models.
Random-slopes model. To obtain participant-level face-type effects for the analyses in Section 3.3.4, a model with participant-level random slopes for face type on v and t (with the starting point fixed at 0.5 and boundary separation constant) was fitted with the same priors and sampler settings as the primary model. The group-level non-decision time effect was +101 ms (95% HDI [+53, +153 ms]), with a between-participant SD of the slope of 160 ms, and 33 of 41 participants had a positive posterior-mean effect. The maximum was 1.01 and the minimum ESS 506, but 86 of 8000 transitions diverged; refitting at a target acceptance probability of 0.99 left 82 divergent transitions and reproduced the participant-level correlations to two decimal places. The participant-level estimates from this model are therefore used only for correlational analyses and should be interpreted with caution.
Appendix B
Convergence of the alternative models. In the model with a free starting point and constant boundary separation, and in the model with face-type boundary separation and the starting point fixed at 0.5, the non-decision time face-type effect mixed slowly ( = 1.02). Refitting the former with 8 chains of 4000 draws after 2000 tuning iterations did not resolve this ( = 1.02, bulk ESS = 262). Inspection of the chains traced the slow mixing to a single participant whose narrow RT distribution left their non-decision time and boundary separation weakly identified, so that individual chains settled on different values of that participant’s parameters (chain means of the group-level effect ranged from 50.7 to 53.3 ms, and every chain’s 95% HDI excluded zero). When the model was refitted without this participant (8 chains of 3000 draws), all key parameters converged (maximum = 1.00, minimum bulk ESS = 1904; 14 of 24,000 transitions diverged), and the non-decision time effect was unchanged (+49 ms, 95% HDI [+40, +59 ms], compared with +52 ms with the participant included). The participant met all inclusion criteria and was retained in all reported analyses.
Figure A2.
Convergence Diagnostics for the Primary and Selected Models. For each group-level pa- rameter (rows), the left panel of each pair shows the posterior density estimated separately for each chain, and the right panel shows the chain traces across post-warm-up draws, for the primary model (4 chains × 2000 draws; left pair) and the selected model (4 chains × 2000 draws; right pair). Over- lapping chain densities and stationary, well-mixed traces indicate convergence. In the primary model, the starting point was fixed at 0.5, and boundary separation did not vary by face type. The maximum was 1.01 in both models, and the minimum bulk ESS was 546 and 480 for the primary and selected models, respectively.
Appendix C
Figure A3.
Participant-level Variation in Drift Rate and Non-decision Time. Posterior-mean random intercepts (each participant’s deviation from the group-level intercept) for drift rate (left) and non-decision time (right) in the selected model, with participants ranked by their offset; the dashed line marks the group-level intercept. The spread of the offsets (SD = 0.68 for drift rate and 182 ms for non-decision time) shows substantial individual differences, which the hierarchical model accommodates through partial pooling, so that noisy individual estimates do not distort the group-level face-type effects.
References
- Willis, J.; Todorov, A. First impressions: Making up your mind after a 100-ms exposure to a face. Psychol. Sci. 2006, 17, 592–598. [Google Scholar]
- Todorov, A.; Olivola, C.Y.; Dotsch, R.; Mende-Siedlecki, P. Social attributions from faces: Determinants, consequences, accuracy, and functional significance. Annu. Rev. Psychol. 2015, 66, 519–545. [Google Scholar] [CrossRef] [Scilit]
- Bonnefon, J.F.; Rahwan, I.; Shariff, A. The moral psychology of artificial intelligence. Annu. Rev. Psychol. 2024, 75, 653–675. [Google Scholar] [CrossRef] [Scilit]
- Weisman, W.D.; Peña, J.F. Face the uncanny: The effects of doppelganger talking head avatars on affect-based trust toward artificial intelligence technology are mediated by uncanny valley perceptions. Cyberpsychol. Behav. Soc. Netw. 2021, 24, 182–187. [Google Scholar] [CrossRef] [Scilit]
- Nightingale, S.J.; Farid, H. AI-synthesized faces are indistinguishable from real faces and more trustworthy. Proc. Natl. Acad. Sci. USA 2022, 119, e2120481119. [Google Scholar] [CrossRef] [Scilit]
- Nightingale, S.J. Distinguishing Between Real and Synthetic Faces. 2022. Available online: https://osf.io/ru36d/overview (accessed on 11 November 2026).
- Whittaker, L.; Kietzmann, T.C.; Kietzmann, J.; Dabirian, A. “All around me are synthetic faces”: The mad world of AI-generated media. IT Prof. 2020, 22, 90–99. [Google Scholar] [CrossRef] [Scilit]
- Goodfellow, I.J.; Pouget-Abadie, J.; Mirza, M.; Xu, B.; Warde-Farley, D.; Ozair, S.; Courville, A.; Bengio, Y. Generative Adversarial Networks. arXiv 2014, arXiv:1406.2661v1. [Google Scholar]
- Balas, B.; Pacella, J. Trustworthiness perception is disrupted in artificial faces. Comput. Hum. Behav. 2017, 77, 240–248. [Google Scholar] [CrossRef] [Scilit]
- Abbas, F.; Taeihagh, A. Unmasking deepfakes: A systematic review of deepfake detection and generation techniques using artificial intelligence. Expert Syst. Appl. 2024, 252, 124260. [Google Scholar] [CrossRef] [Scilit]
- Dunn, J.D.; White, D.; Sutherland, C.A.M.; Miller, E.J.; Steward, B.A.; Dawel, A. Too good to be true: Synthetic AI faces are more average than real faces and super-recognizers know it. Br. J. Psychol. 2026, 117, 1279–1294. [Google Scholar] [CrossRef] [Scilit]
- Evans, J.S.B.T. Dual-processing accounts of reasoning, judgment, and social cognition. Annu. Rev. Psychol. 2008, 59, 255–278. [Google Scholar] [CrossRef] [Scilit]
- Kahneman, D.; Tversky, A. On the psychology of prediction. Psychol. Rev. 1973, 80, 237–251. [Google Scholar] [CrossRef] [Scilit]
- Reber, R.; Schwarz, N.; Winkielman, P. Processing fluency and aesthetic pleasure: Is beauty in the perceiver’s processing experience? Personal. Soc. Psychol. Rev. 2004, 8, 364–382. [Google Scholar] [CrossRef] [Scilit]
- Praamstra, P.; Kourtis, D.; Kwok, H.F.; Oostenveld, R. Neurophysiology of implicit timing in serial choice reaction-time performance. J. Neurosci. 2006, 26, 5448–5455. [Google Scholar] [CrossRef] [Scilit]
- Smith, P.L.; Ratcliff, R. Psychology and neurobiology of simple decisions. Trends Neurosci. 2004, 27, 161–168. [Google Scholar] [CrossRef] [Scilit]
- Shanks, D.R.; Johnstone, T. Evaluating the relationship between explicit and implicit knowledge in a sequential reaction time task. J. Exp. Psychol. Learn. Mem. Cogn. 1999, 25, 1435–1451. [Google Scholar] [CrossRef] [Scilit]
- Ratcliff, R. A theory of memory retrieval. Psychol. Rev. 1978, 85, 59–108. [Google Scholar] [CrossRef] [Scilit]
- Ratcliff, R.; McKoon, G. The diffusion decision model: Theory and data for two-choice decision tasks. Neural Comput. 2008, 20, 873–922. [Google Scholar] [CrossRef] [Scilit]
- Spangler, D.P.; Yang, X.; Weidler, B.J.; Thayer, J.F.; McGinley, J.J. Unraveling the cognitive correlates of heart rate variability with the drift diffusion model. Int. J. Psychophysiol. 2022, 181, 73–84. [Google Scholar] [CrossRef] [Scilit]
- Karras, T.; Laine, S.; Aittala, M.; Hellsten, J.; Lehtinen, J.; Aila, T. Analyzing and improving the image quality of StyleGAN. In Proceedings of the IEEE/CVF Conference on Computer Vision and Pattern Recognition (CVPR), Virtual, 13–19 June 2020; pp. 8110–8119. [Google Scholar] [CrossRef] [Scilit]
- Vandekerckhove, J.; Tuerlinckx, F.; Lee, M.D. Hierarchical diffusion models for two-choice response times. Psychol. Methods 2011, 16, 44–62. [Google Scholar] [CrossRef] [Scilit]
- Wiecki, T.V.; Sofer, I.; Frank, M.J. HDDM: Hierarchical Bayesian estimation of the drift-diffusion model in Python. Front. Neuroinform. 2013, 7, 14. [Google Scholar] [CrossRef] [Scilit]
- Fengler, A.; Bera, K.; Pedersen, M.L.; Frank, M.J. Beyond drift diffusion models: Fitting a broad class of decision and reinforcement learning models with HDDM. J. Cogn. Neurosci. 2022, 34, 1780–1805. [Google Scholar] [CrossRef] [Scilit]
- Abril-Pla, O.; Andreani, V.; Carroll, C.; Dong, L.; Fonnesbeck, C.J.; Kochurov, M.; Kumar, R.; Lao, J.; Luhmann, C.C.; Martin, O.A.; et al. PyMC: A modern, and comprehensive probabilistic programming framework in Python. PeerJ Comput. Sci. 2023, 9, e1516. [Google Scholar] [CrossRef] [Scilit]
- Krajbich, I.; Lu, D.; Camerer, C.; Rangel, A. The attentional drift-diffusion model extends to simple purchasing decisions. Front. Psychol. 2012, 3, 193. [Google Scholar] [CrossRef] [Scilit]
- Hoffman, M.D.; Gelman, A. The No-U-Turn sampler: Adaptively setting path lengths in Hamiltonian Monte Carlo. J. Mach. Learn. Res. 2014, 15, 1593–1623. [Google Scholar]
- Wagenmakers, E.-J.; Lodewyckx, T.; Kuriyal, H.; Grasman, R. Bayesian hypothesis testing for psychologists: A tutorial on the Savage–Dickey method. Cogn. Psychol. 2010, 60, 158–189. [Google Scholar] [CrossRef] [Scilit]
- Kruschke, J.K. Rejecting or accepting parameter values in Bayesian estimation. Adv. Methods Pract. Psychol. Sci. 2018, 1, 270–280. [Google Scholar] [CrossRef] [Scilit]
- Vehtari, A.; Gelman, A.; Gabry, J. Practical Bayesian model evaluation using leave-one-out cross-validation and WAIC. Stat. Comput. 2017, 27, 1413–1432. [Google Scholar] [CrossRef] [Scilit]
- Gazzanigo, M.J.; House, S.; Yang, X. User AI self-efficacy and attitudes toward AI predict positive perceptions of AI-generated text. Proc. Hum. Factors Ergon. Soc. Annu. Meet. 2026. [Google Scholar] [CrossRef] [Scilit]
- Gazzanigo, M.J.; Yang, X. Artificial intelligence agent tone influences perceived informational value and affective valence. Technol. Mind Behav. 2026; advance online publication. [CrossRef] [Scilit]
- Gazzanigo, M.J.; Yang, X. Relational role attribution: A unifying construct in human-AI interaction. Int. J. Hum.-Comput. Interact. 2026. [Google Scholar] [CrossRef] [Scilit]
- Heberlein, K.; Rapacon, S.; Aquino, A.J.; Yang, X. Implications of error message design and student status on error recovery in university course registration systems. Proc. Hum. Factors Ergon. Soc. Annu. Meet. 2026. [Google Scholar] [CrossRef] [Scilit]
- Gazzanigo, M.; Quesnel, A.; Roldan, C.; Yang, X. Cellphone separation modulates the effects of working memory load on ex-Gaussian parameters of choice reaction time. Cogn. Res. Princ. Implic. 2025, 10, 72. [Google Scholar] [CrossRef] [Scilit]
- Causse, M.; Chua, Z.; Peysakhovich, V.; Del Campo, N.; Matton, N. Mental workload and neural efficiency quantified in the prefrontal cortex using fNIRS. Sci. Rep. 2017, 7, 5222. [Google Scholar] [CrossRef] [Scilit]
- Dixon, M.L.; Thiruchselvam, R.; Todd, R.; Christoff, K. Emotion and the prefrontal cortex: An integrative review. Psychol. Bull. 2017, 143, 1033–1081. [Google Scholar] [CrossRef] [Scilit]

Disclaimer/Publisher’s Note: The statements, opinions and data contained in all publications are solely those of the individual author(s) and contributor(s) and not of MDPI and/or the editor(s). MDPI and/or the editor(s) disclaim responsibility for any injury to people or property resulting from any ideas, methods, instructions or products referred to in the content. |
© 2026 by the authors. Licensee MDPI, Basel, Switzerland. This article is an open access article distributed under the terms and conditions of the Creative Commons Attribution (CC BY) license.