


Errors in the Analysis and Reporting
In the original publication [1], errors were identified in numerical processing and reporting, the specification of the mediation analysis for the paired within-participant design, and the description of the condition-group factor. The overlap of questionnaire item Q13 between the self-expression-fit and interpersonal-affinity composites was also not explicitly disclosed. The affected analyses were recalculated from the preserved source questionnaire responses using documented condition mappings and a two-condition within-participant mediation model.
The source questionnaire responses, 21 participants, 12 experimental conditions, experimental procedures, materials, and ethics approval are unchanged. Some original intermediate analysis files were not preserved in a form that permits every published calculation to be reconstructed exactly; the affected results were therefore rebuilt directly from the preserved source responses.
The corrected results retain the main finding that congruent avatar–text pairings increase self-expression fit and interpersonal affinity within the directly manipulated Harmony conditions (H1). The interpretation of H2 is narrowed to a significant indirect pathway through self-expression fit, with sensitivity to the composition of the affinity measure; a full-mediation interpretation is not warranted. The condition-group analysis does not provide a confirmatory test of moderation by immersion (H3). Accordingly, the correction changes the scope and strength of several interpretations; it does not leave every original claim unchanged.
The corrected text, tables, and figures are provided below. Section, table, and figure numbers refer to the original article [1].
Text Corrections
- Abstract
In social virtual reality (VR) and metaverse platforms, users express their identity through both avatar appearance and on-avatar textual cues, such as speech balloons. However, little is known about how the harmony between these cues influences self-representation and social impressions. We propose that when avatar appearance and text design, including color, font, and tone, are consistent, users experience a stronger self-expression fit and elicit greater interpersonal affinity. A within-subject study (N = 21) in VRChat manipulated the social context, color harmony between avatar hair and text, and style or content consistency between tone and font. Questionnaires provided composite indices for perceived congruence, self-expression fit, and affinity. Analyses included repeated-measures ANOVA and mediation tests. Results showed that congruent pairings increased both self-expression fit and affinity compared to mismatches. A two-condition within-participant mediation analysis supported a significant indirect pathway through self-expression fit, although the result was sensitive to the composition of the affinity measure. These findings integrate theories of avatar influence and computer-mediated communication into a framework for metaverse design, highlighting the value of consistent avatar and text styling.
- Section 1 Introduction Final Sentence Before Contribution and Scope
The study examines three hypotheses presented in Section 3.
- Section 1 Contribution and Scope
We formalize a theory-driven account that links cross-modal harmony to self-expression fit and interpersonal affinity; operationalize harmony with jointly controlled color, font, and tone; evaluate effects with reliability, sphericity, effect size, and within-participant mediation analyses; and derive metaverse interface implications while restricting claims to the tested settings (within-subject, N = 21).
- Section 4.1 Overview of Approach
The study examines H1–H3 using a within-subject design from a fixed third-person vantage in a private VRChat world (standardized lighting/camera; free chat disabled). H1 and H2 are evaluated directly, whereas the available condition-group analysis does not provide a confirmatory test of H3. After each scene, participants rate perceived congruence, self-expression fit, and interpersonal affinity. Text-focused stimuli are included to isolate textual design (tone × style), while retaining the scene context; participants evaluated only the text stimulus in this group.
- Section 4.4 Condition Groups in the Analysis
The second factor corresponds to the three condition groups described in Section 4.6.1 (harmony, presence, and text content). It does not represent an independently manipulated 2D/VR/social-VR immersion factor.
The heading of Section 4.4 has been changed from “Sessions and Immersion Levels” to “Condition Groups in the Analysis”.
- Section 4.6.1 Table 3 Presence-Condition Descriptions
P1: Warm avatar baseline (no overhead text on either the presenter or audience avatar)
P2: Cool avatar baseline (overhead text on the presenter avatar only)
P3: Two-avatar context baseline (overhead text on the audience avatar only)
P4: Two-avatar context baseline (overhead text on both the presenter and audience avatars)
- Section 4.6.2 Avatar-Focused Control (Figure 3)
We included an avatar-focused Presence group in which both the presenter and audience avatars were displayed in all four conditions. Overhead-text visibility varied according to the P1–P4 assignments in Table 3. The avatar–text congruence manipulation involving text color, font, and wording used in the Harmony group was not introduced in this group. The screenshots were captured under the same lighting and camera settings as the main stimuli. Participants were instructed to evaluate the target avatar rather than any constant on-screen UI elements used by the platform.
- Section 4.7 Measures Opening Paragraph
We targeted three constructs: perceived congruence (1 item), self-expression fit (2 items), and interpersonal affinity (6 items). All item wordings (English translations; original Japanese in Supplementary Materials) are listed in Table 4. Composites were formed by averaging items on 5-point Likert scales; in the condition-level data, Cronbach’s α was 0.759 for self-expression fit and 0.881 for interpersonal affinity. Cronbach’s α is reported for internal consistency and is distinct from hypothesis testing. Self-expression fit was computed from Q9 and Q13, whereas interpersonal affinity was computed from Q2, Q5, Q7, Q11, Q12, and Q13; Q13 therefore contributes to both composites, and a sensitivity analysis is reported with the mediation results. Note that, while Table 4 describes the constructs in terms of an “avatar–text pair” for brevity, in the presence (avatar-focused) conditions participants applied the same questions to the designated target avatar in the presented scene, and in the text content (text-focused) conditions they applied them to the text stimulus alone.
- Table 4 Added Note
Note. Self-expression fit consists of Q9 and Q13, and interpersonal affinity consists of Q2, Q5, Q7, Q11, Q12, and Q13. Thus, Q13 is included in both composites.
- Section 4.9 Evaluation Framework and Statistical Plan
Primary analyses used repeated-measures ANOVA (Mauchly’s test; Greenhouse–Geisser corrections) with planned contrasts and effect sizes (partial η2, dz). Mediation (harmony → self-expression fit → affinity) was estimated using a two-condition within-participant model with participant-level bootstrap confidence intervals, and indirect effects were considered significant if 95% CIs excluded zero. Cronbach’s α indexes internal consistency and is distinct from hypothesis testing. The inferential conclusions are based on the repeated-measures ANOVA and within-participant mediation specified above.
- Section 5.1 Descriptive Statistics First Paragraph
In the condition-level data, Cronbach’s α was 0.881 for affinity and 0.759 for self-expression fit. Means indicated a clear advantage for congruent conditions. For self-expression fit, the average rating was higher for congruent pairs (M = 3.88, SD = 0.67) than for mismatched pairs (M = 2.79, SD = 0.72). Affinity ratings were also higher for congruent pairs (M = 3.67, SD = 0.45) than for mismatched pairs (M = 3.19, SD = 0.47). Distributions were unimodal and showed no severe skew.
- Section 5.2 Manipulation Checks
Ratings of perceived congruence were significantly higher in congruent conditions (M = 4.40, SD = 0.86) than in mismatched conditions (M = 2.14, SD = 0.59), confirming that the direct harmony manipulation was recognized (F(1,20) = 77.27, p < 0.001, partial η2 = 0.79).
- Section 5.3 ANOVA Results
Repeated-measures ANOVA revealed a main effect of harmony on self-expression fit (F(1,20) = 33.73, p < 0.001, partial η2 = 0.63), indicating that congruent conditions supported stronger self-expression. For affinity, the main effect of harmony was also significant (F(1,20) = 17.14, p < 0.001, partial η2 = 0.46). These results support H1.
The second factor corresponds to the condition group rather than to an independent immersion manipulation. In the three-group analysis, the contrast × group interaction was significant for self-expression fit (F(2,40) = 7.08, Greenhouse–Geisser-adjusted p = 0.0030, partial η2 = 0.26) but not for affinity (F(2,40) = 0.54, adjusted p = 0.5743, partial η2 = 0.03). Because the constituent contrasts differ across groups, these values are not interpreted as a confirmatory test of immersion moderation; H3 was therefore not confirmatorily tested. The repeated-measures ANOVA results are summarized in Table 6.
- Section 5.4 Linear Mixed-Effects Models
The conclusions reported here are based on the repeated-measures ANOVA and within-participant mediation analyses; linear mixed-effects results are not included in the inferential evidence.
- Section 5.6 Mediation Analysis First Paragraph
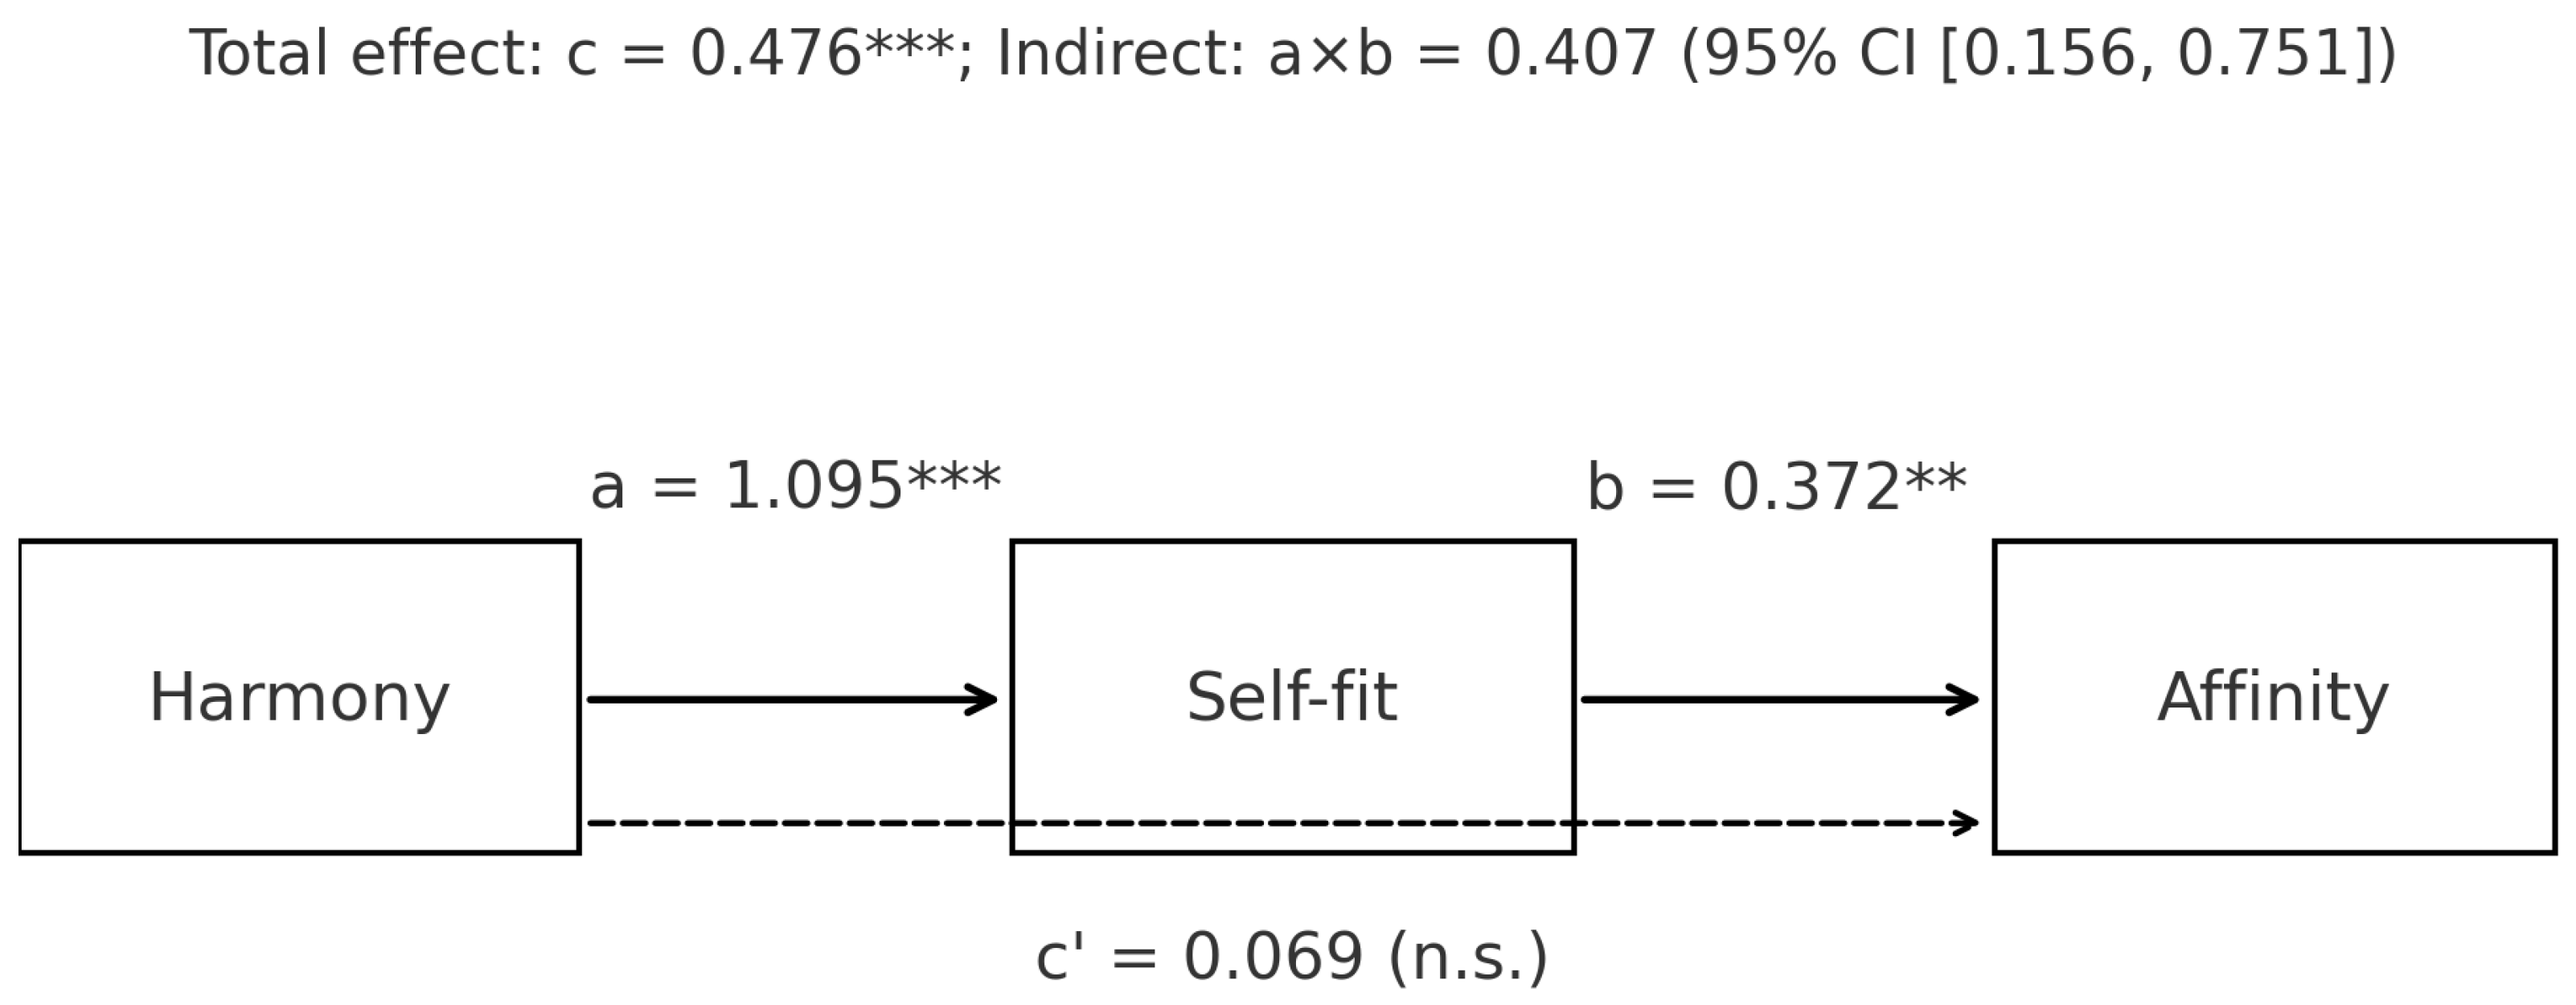
A two-condition within-participant mediation analysis tested whether self-expression fit explained the link between harmony and affinity. The total within-participant effect was c = 0.476 (p < 0.001). The effect of harmony on self-expression fit was a = 1.095 (p < 0.001). In the outcome-difference model, the mediator-difference path was b = 0.372 (p = 0.0035), and the direct effect was c′ = 0.069 (p = 0.659). The model also included the mean-centered mediator sum (d = 0.115, p = 0.204). The participant-level bootstrap indirect effect was a × b = 0.407, 95% CI [0.156, 0.751]. A sensitivity analysis excluding the shared Q13 item from affinity yielded a smaller indirect effect (0.277, 95% CI [0.014, 0.633]; b path p = 0.051). These results support a significant indirect pathway through self-expression fit, but the sensitivity to composite specification does not warrant a full-mediation interpretation. The mediation model is shown in Figure 6.
- Section 5.6 Mediation Analysis Sentence Before Table 7
The corresponding unstandardized within-participant coefficients and significance levels for the mediation analysis are summarized in Table 7.
- Section 5.7 Exploratory Analyses
The three-group contrasts in Table 6 are treated as exploratory because the binary contrasts have different substantive meanings across harmony, presence, and text content. They are not interpreted as a common harmony effect or as evidence for H3.
- Section 5.8 Robustness and Additional Checks
The sensitivity analysis reported above evaluates the effect of excluding the shared Q13 item from interpersonal affinity. The conclusions are based on the repeated-measures and within-participant analyses reported above.
- Section 6.1 Discussion First Paragraph
Within the directly manipulated harmony conditions, the results confirm H1: congruent avatar–text pairings enhance both self-expression fit and affinity. These effects align with the Proteus effect and with the hyperpersonal model, which highlights the amplification of impressions through coherent multimodal cues. The within-participant mediation analysis supported H2 as a significant indirect pathway through self-expression fit. In addition, the strong association between harmony and perceived congruence indicates that perceived congruence functions as a proximal indicator of the harmony manipulation. Because perceived congruence and harmony exhibited tightly aligned patterns across conditions, using harmony as the independent variable in the mediation model is justified; harmony effectively captures the same variance that would otherwise be modeled through perceived congruence. This supports the interpretation that harmony is an appropriate operational variable for testing the hypothesized pathway. The second factor in Table 6 corresponds to condition group rather than an independent immersion manipulation. Therefore, the condition-group interaction is not interpreted as a confirmatory test of H3. The mediation result supports an indirect pathway for H2, but the shared Q13 item and the attenuation in the sensitivity analysis preclude a full-mediation claim.
- Section 6.1 Discussion Third Paragraph
While our theoretical motivation predicted stronger cross-modal coupling under higher immersion, the present data do not provide a confirmatory test of moderation by immersion. Future studies should independently manipulate immersion while holding the harmony manipulation constant and determine sample size prospectively for the corresponding interaction.
- Section 6.3 Conclusions
Within the directly manipulated harmony conditions, harmony between avatar appearance and on-avatar text significantly enhances both self-expression fit and interpersonal affinity in social VR. Congruence supports users in feeling authentic and fosters positive impressions among others.
- Section 6.4 Contribution Recap
This article (i) formalizes a theory-driven account linking avatar–text harmony to interpersonal outcomes via self-expression fit; (ii) isolates harmony with jointly controlled color, font, and tone; (iii) demonstrates direct harmony effects using ANOVA and a significant indirect pathway using within-participant mediation with bootstrap inference, while not treating the condition-group analysis as a confirmatory test of H3; and (iv) translates findings into design guidance for metaverse interfaces.
Corrections to Tables 5–7
Tables 5–7 are replaced with the following corrected versions. Table 5 summarizes the four direct harmony conditions. Table 6 retains the six-row structure but identifies the condition-group contrasts explicitly. Table 7 reports unstandardized coefficients from the two-condition within-participant mediation analysis.
Table 5.
Descriptive statistics for key outcomes by harmony condition (based on the four direct harmony conditions). Means, standard deviations, and 95% CIs are reported.
Table 6.
Repeated-measures ANOVA summaries. Greenhouse–Geisser corrections applied where required.
Table 7.
Mediation summary with unstandardized within-participant coefficients. The indirect effect (a × b) was significant by bootstrap CI.
Correction to Figure 3 Caption
- Figure 3. Avatar-focused Presence conditions used in the experiment. Both the presenter and audience avatars were displayed in all four conditions; overhead text was absent from both avatars (P1), displayed only on the presenter avatar (P2), displayed only on the audience avatar (P3), or displayed on both avatars (P4). Any constant platform UI elements visible in the scene were not evaluated. These screenshots are illustrative examples of the experimental conditions; minor overlaps or partial occlusions of avatars and UI elements do not affect the operational definition of the conditions or the interpretation of the experimental results.
Corrections to Figures 5 and 6
Figures 5 and 6 are replaced with the corrected figures below. Figure 5 uses the corrected descriptive statistics in Table 5. Figure 6 and its caption use the corrected unstandardized within-participant mediation coefficients in Table 7.
Figure 5.
Mean ratings of self-expression fit and interpersonal affinity by harmony condition. Error bars represent 95% confidence intervals. Congruent conditions yielded significantly higher scores than mismatched conditions, supporting H1.
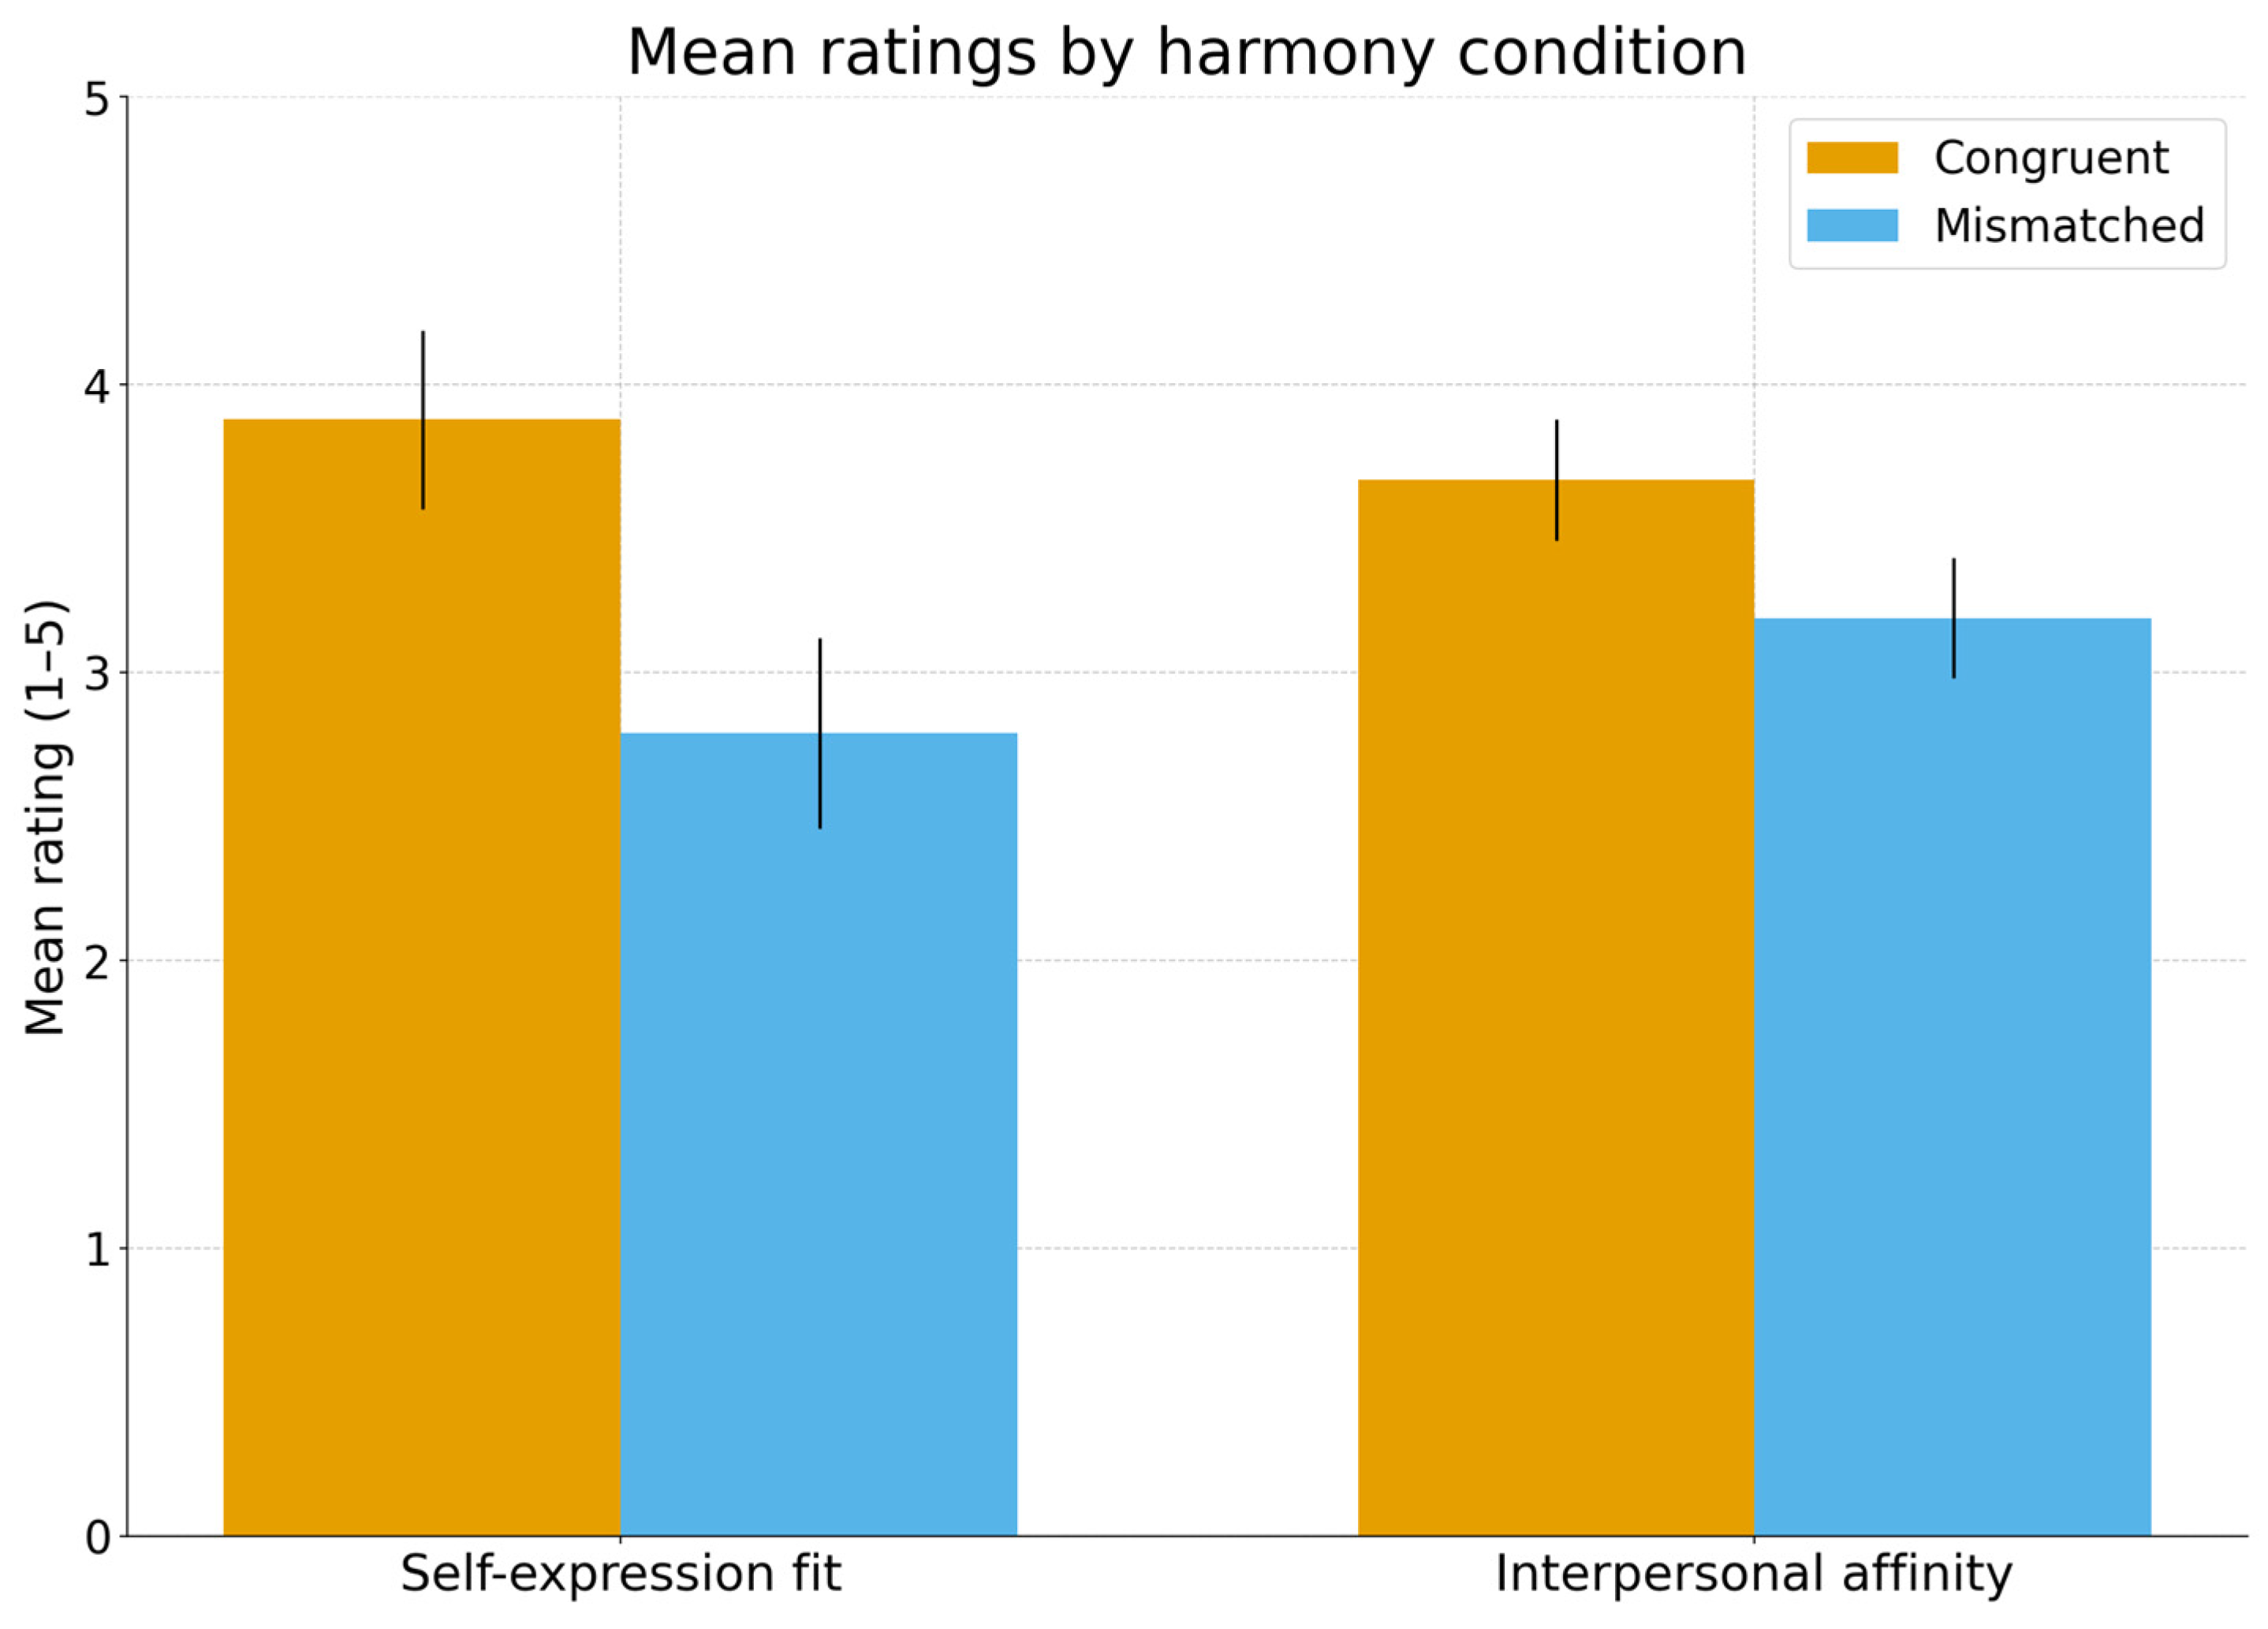
Figure 6.
Mediation model depicting the relationship between harmony, self-expression fit, and interpersonal affinity. The unstandardized within-participant coefficients are a = 1.095, b = 0.372, c′ = 0.069, total effect c = 0.476, and indirect effect a × b = 0.407 (bootstrap 95% CI [0.156, 0.751]). ** p < 0.01; *** p < 0.001; n.s., not statistically significant.
The main finding for the directly manipulated harmony conditions (H1) is retained, while the interpretations of H2 and H3 are revised as described above. This correction was approved by the Academic Editor. The original publication has also been updated.
Reference
- Guang, Y.; Sakurai, S.; Nojima, T.; Hirota, K. Visual Harmony Between Avatar Appearance and On-Avatar Text: Effects on Self-Expression Fit and Interpersonal Perception in Social VR. Informatics 2026, 13, 5. [Google Scholar] [CrossRef] [Scilit]
Disclaimer/Publisher’s Note: The statements, opinions and data contained in all publications are solely those of the individual author(s) and contributor(s) and not of MDPI and/or the editor(s). MDPI and/or the editor(s) disclaim responsibility for any injury to people or property resulting from any ideas, methods, instructions or products referred to in the content. |
© 2026 by the authors. Licensee MDPI, Basel, Switzerland. This article is an open access article distributed under the terms and conditions of the Creative Commons Attribution (CC BY) license.