


Abstract
Using a balanced panel of 30 Chinese provinces from 2018 to 2024, this study examines the association between the crop-protection unmanned aerial vehicle (UAV) service area and the agricultural insurance claims paid-to-premium income ratio. The outcome is interpreted narrowly as annual paid-claims burden relative to premium income, not as an actuarial incurred loss ratio or a measure of profitability, solvency, or sustainability. Two-way fixed-effects models with province-clustered standard errors show that an additional 100,000 hectares of UAV service area is associated with a 1.07-percentage-point lower ratio. Decomposition regressions show a negative association with log claims paid (β = −0.0153, p = 0.040) but no significant association with log premium income (β = −0.0020, p = 0.787). The association remains negative across robustness checks, with weaker evidence for the lagged specification. In 10,000 within-year province-reassignment placebo draws, the observed coefficient is extreme relative to the placebo distribution (randomization p = 0.0001). A clustered bootstrap is consistent with a broad multi-hazard pathway rather than causal mediation. Formal tests show that detectable regional differences are concentrated in comparisons involving the Western region. Given the observational design, the findings document associations rather than causal effects.
1. Introduction
Agricultural production is persistently exposed to natural disasters, pests and diseases, climate variability, and market fluctuations. As an important component of agricultural risk management, agricultural insurance disperses risk and provides ex post compensation, thereby helping to stabilize farm income, sustain agricultural production, and strengthen resilience (Goodwin and Smith 1995; Barnett et al. 2008). Insurance transfers the financial consequences of covered losses but does not necessarily change the underlying physical risk. When disaster frequency or loss severity rises, paid claims and the fiscal burden of premium subsidies may also increase. This motivates attention to production-side loss prevention alongside ex post compensation. The present analysis, however, evaluates only an annual claims paid-to-premium income ratio and does not measure insurer profitability, solvency, or long-term sustainability.
Crop-protection unmanned aerial vehicles (UAVs), hereafter crop-protection UAVs, provide a useful setting for examining this question. Compared with manual spraying and some ground-based machinery, crop-protection UAVs can complete pesticide application, fertilization, and seeding operations rapidly and can adjust flight and spraying parameters to field and crop conditions. Their low-altitude spraying efficiency, droplet deposition, and adaptability to difficult terrain may improve the timeliness and precision of pest and disease control (Huang et al. 2013; Lan et al. 2019; Qin and Chen 2023; Ragiman et al. 2024). If these production effects reduce selected crop losses under suitable conditions, wider crop-protection UAV deployment could be associated with claim payments and the claims-to-premium ratio. This conditional proposition motivates the empirical analysis; it is not assumed to hold for hazards that UAV operations cannot directly prevent.
The outcome is the claims paid-to-premium income ratio, hereafter the claims-to-premium ratio. It captures the annual paid-claims burden relative to premium income. It is not an actuarial incurred loss ratio because the numerator is paid, rather than incurred, claims and the denominator is premium income rather than earned premiums. Nor does it measure overall underwriting performance, profitability, solvency, or sustainability. Its annual variation may reflect paid claims, premium growth, underwriting composition, or settlement timing. The relationship between production-side UAV operations and this narrow insurance outcome remains understudied. Research on crop-protection UAVs examines technical performance, farmer adoption, and outsourced service provision, with operating efficiency, pesticide use, production costs, or crop yields as the main outcomes (Zheng et al. 2018; Di et al. 2020; Shi et al. 2024; Sun et al. 2025). Studies of agricultural insurance claims and payment accuracy emphasize moral hazard, subsidy arrangements, market competition, and indemnification methods (Chai and Zhao 2016; Xiao et al. 2020; Niu et al. 2021; Liu et al. 2022; Yi et al. 2022). A separate body of work considers remote sensing, the Internet of Things, and UAV imagery in underwriting verification, disaster monitoring, and loss assessment (Yao et al. 2020; Tang and Li 2023; Zhao et al. 2024; Hongo et al. 2024). Together, these studies establish the production value of crop-protection UAVs and the insurance value of digital observation, but direct quantitative evidence linking production-side deployment with paid-claims outcomes remains limited.
We examine this relationship using a balanced panel of 30 Chinese provinces from 2018 to 2024. In addition to baseline and conventional robustness checks, we decompose the ratio into log claims paid and log premium income, conduct a 10,000-draw placebo test based on year-by-year reassignment of UAV service-area values across provinces, assess the aggregate crop disaster rate as a broad indirect loss-exposure pathway, and formally test regional coefficient differences. A larger UAV service area is statistically associated with a lower claims-to-premium ratio. The decomposition supports a claims-side interpretation, while the bootstrap estimates are consistent with a broad indirect pathway. The formal pairwise tests indicate that the statistically detectable cross-regional differences are concentrated in comparisons involving the Western region. The Eastern–Northeastern and Central coefficients do not differ significantly. Because the analysis uses aggregate provincial observational data, these findings describe conditional associations rather than causal effects.
The study makes three contributions. First, it links the actual operating scale of a production technology to a narrowly defined agricultural insurance outcome: the annual claims paid-to-premium income ratio. This extends claims research beyond insurance contracts and market behavior without treating the ratio as overall performance. Second, it distinguishes a claims-side interpretation from a premium-denominator explanation and combines alternative specifications, a reassignment placebo, a clustered indirect-effect test, and formal regional coefficient comparisons. Third, it identifies empirical conditions relevant to future evaluation of cooperation between insurers and crop-protection service organizations. The study does not directly test an ‘agricultural insurance + crop-protection service’ institutional model; it provides evidence on actual UAV service deployment and claims outcomes that can inform the design of such evaluations.
The remainder of the paper is organized as follows: Section 2 reviews the technical and production effects of crop-protection UAVs, the determinants of agricultural insurance claims outcomes, and the informational and physical roles of UAVs in agricultural insurance. Section 3 describes the data, variables, and empirical methods. Section 4 reports the baseline results, robustness checks, numerator–denominator decomposition, randomization placebo, aggregate loss-exposure pathway, and regional coefficient-difference tests. Section 5 discusses the findings, practical implications, and limitations. Section 6 concludes.
2. Literature Review
2.1. Technical Performance, Production Effects, and Adoption of Crop-Protection UAVs
Early research on agricultural UAVs focused primarily on technical feasibility and operating performance. Huang et al. (2013) reviewed their development prospects in agricultural production management and argued that low-altitude remote sensing and precision operations could expand the spatial scope of agricultural information collection and input application. Research on crop-protection operations subsequently examined spraying parameters, droplet deposition, drift control, and nozzle design. Lan et al. (2019) identified strong application potential in China but emphasized the need for improved operating standards, personnel training, and regulation. Qin and Chen (2023) reviewed spray deposition and drift and stressed the joint influence of operating parameters, environmental conditions, crop canopies, and rotor airflow. Yu et al. (2023) and Ragiman et al. (2024) likewise showed that spraying performance depends on equipment configuration and specific production conditions. Crop-protection UAVs therefore cannot be treated as equipment that automatically produces loss-reduction effects; their insurance relevance depends on actual operational coverage and effective crop-protection performance.
A related group of studies explains UAV adoption from the perspectives of farmers and agricultural service organizations. Zheng et al. (2018) found that operated land area, cooperative participation, technology awareness, and prior disaster experience affect farmers’ awareness and adoption of crop-protection UAV technology. Di et al. (2020) showed that operating scale and service quality risk influence farmers’ outsourcing choices for crop-protection machinery. Shi et al. (2024) found that farmers’ trust affects the outsourcing of UAV crop-protection services in rice production, while Sun et al. (2025) associated UAV adoption with cost savings and efficiency gains in cotton production. These findings indicate that the diffusion of UAVs in agricultural production is not determined by equipment counts alone; it also depends on service supply, field conditions, farmer perceptions, and the organization of agricultural production.
2.2. Determinants of Agricultural Insurance Claims Outcomes and Loss Mitigation
The agricultural insurance claims-to-premium ratio jointly reflects annual paid claims and premium income. A high ratio may accompany severe insured losses, but it may also indicate that the insurance system paid substantial compensation; a lower ratio may reflect fewer paid losses, premium expansion, underwriting composition, or settlement timing. It therefore cannot be ranked mechanically as better or worse overall insurance performance. Crop insurance research further shows that systemic risk, subsidy and program design, spatial dependence in loss experience, ratemaking assumptions, and historical weather information can affect insurance loss experience and rating accuracy (Miranda and Glauber 1997; Glauber 2004; Woodard et al. 2011, 2012; Liu and Ramsey 2023). Existing studies explain agricultural insurance claims outcomes primarily through institutional arrangements and behavioral responses. Chai and Zhao (2016) discussed farmer moral hazard in crop insurance and showed how insurance may alter production and claim-reporting behavior. Xiao et al. (2020) found that indemnification methods affect the risk-protection function of subsidized agricultural insurance. Niu et al. (2021) described the tension between business expansion and underwriting performance under intensified market competition. Liu et al. (2022) examined determinants of indemnification accuracy in crop insurance, Yi et al. (2022) identified divergence between production risk and indemnity levels under particular subsidy arrangements, and Mao et al. (2025) discussed claims-protection efficiency from the perspective of farm-size heterogeneity.
Prior studies predominantly explain claims outcomes through insurance contracts, fiscal arrangements, market structures, and participant behavior. UAV deployment and the claims-to-premium ratio may also share other time-varying determinants, including rural income, agricultural subsidies, mechanization, crop structure, weather, insurance-market development, and digital infrastructure. Our controls capture rural economic development, human capital, fiscal support for agriculture, agricultural production scale, and mechanization. Province fixed effects absorb time-invariant geographic, agricultural, and institutional differences, while year fixed effects absorb common nationwide shocks. These controls do not fully remove province-specific changes in weather, crop mix, insurance penetration, underwriting practices, or other policies. The remaining potential confounding motivates the paper’s association-based interpretation. Few studies examine whether agricultural production technology is reflected in the claims-to-premium ratio by changing how losses occur. Recent research considers agricultural insurance risk-reduction services and whether insurance encourages farmers to adopt productive services (Zhang et al. 2024; Ling et al. 2025), but it does not test whether a specific production technology is reflected in portfolio-level paid-claims outcomes.
2.3. The Dual Roles of UAV Technology in Agricultural Insurance
The first role of UAVs in agricultural insurance is that of an information-verification tool at the claims stage. This literature examines how insurers use multispectral or hyperspectral UAV sensors to reduce information asymmetry in post-loss assessment. Iwahashi et al. (2023) used multispectral imagery and vegetation indices to identify and quantify drought damage in paddy fields. Hongo et al. (2024) used high-resolution UAV data to assess rice bacterial leaf blight damage, demonstrating the value of spatial mapping for more objective and efficient loss assessment. Zeng (2025) discussed the standardization of UAV applications in crop insurance loss assessment. These studies show how UAVs can improve the verification of losses after damage has occurred.
The second role is that of a physical intervention tool on the production side before loss occurs. Precision aerial application and coordinated area-wide crop protection can improve the timing, consistency, and coverage of pest and disease control (Lan et al. 2019; Qin and Chen 2023). From an economic-risk perspective, these technologies can raise factor productivity while reducing preventable production losses when operating conditions are suitable (Finger et al. 2019; Sun et al. 2025). In insurance and risk management theory, a technological action that changes the physical risk state of the insured asset constitutes active loss prevention or risk mitigation (Ehrlich and Becker 1972; Shavell 1979; Zhang et al. 2024). This production-side role provides a conceptual link between crop-protection UAV operations and agricultural insurance claims outcomes.
2.4. Literature Synthesis and Research Gap
The literature reaches its clearest consensus on three points. First, crop-protection UAVs can improve selected field operations, but performance is conditional on equipment, operator quality, crop canopy, weather, terrain, and service organization. Second, agricultural insurance claims outcomes are shaped by disaster exposure as well as contracts, subsidies, market structure, and participant behavior. Third, UAV remote sensing can improve loss identification and assessment after damage. The evidence is less settled on whether physical crop-protection services before loss are reflected in aggregate insurance payments. This relationship may vary by peril and region, and it may also reflect common determinants of technology diffusion and insurance outcomes.
This study addresses that gap by linking crop-protection UAV service area, a measure of actual production-side deployment, to the claims paid-to-premium income ratio. The analysis separates claims paid from premium income, evaluates robustness under alternative timing and reassignment, assesses the aggregate crop disaster rate as a broad indirect pathway, and formally compares regional coefficients. It can establish whether these variables covary within provinces after observed controls and fixed effects. It cannot identify a strict causal effect, isolate peril-specific agronomic mechanisms, or directly test the institutional performance of an ‘agricultural insurance + crop-protection service’ arrangement.
3. Data and Empirical Strategy
3.1. Sample and Data Sources
The sample covers province-level administrative regions in mainland China. Tibet is excluded because of extensive missing data on crop-protection UAV operations and several control variables. The final balanced panel contains 30 provinces, autonomous regions, and municipalities (collectively referred to as provinces) over 2018–2024, yielding 210 province-year observations. The sample begins in 2018 for two reasons. First, province-level crop-protection UAV service-area and equipment-stock series are sufficiently continuous from that year to construct a balanced panel. Second, 2018 is the first complete calendar year after the national 2017 pilot used agricultural machinery purchase subsidies to guide the standardized application of crop-protection UAVs in six provinces and municipalities; the 2018–2020 policy continued the pilot and allowed additional provinces to participate through filing (Ministry of Agriculture of the People’s Republic of China et al. 2017; Ministry of Agriculture of the People’s Republic of China and Ministry of Finance of the People’s Republic of China 2018). This policy context supports the timing of the sample but is not used as a source of causal identification. Claims paid and premium income are compiled from the China Insurance Yearbook; UAV variables are drawn from the China Agricultural Machinery Industry Yearbook, provincial agricultural mechanization statistics, and related provincial yearbooks. The remaining variables are obtained from the China Statistical Yearbook, China Rural Statistical Yearbook, and provincial statistical yearbooks.
3.2. Variable Definitions and Descriptive Statistics
The dependent variable is the agricultural insurance claims paid-to-premium income ratio. It captures the annual paid-claims burden relative to premium income. Because the numerator uses paid claims and the denominator uses premium income, it is a simple claims-to-premium indicator rather than an actuarial incurred loss ratio based on incurred claims, earned premiums, and changes in claims reserves. It also does not measure overall insurer profitability, solvency, sustainability, or the social value of agricultural insurance. A lower value can reflect fewer paid claims, premium growth, underwriting composition, or settlement timing, while a higher value can reflect severe losses or substantial compensation. We therefore interpret the ratio narrowly and separately estimate its claims-paid and premium-income components.
The core explanatory variable is the annual area serviced by crop-protection UAVs in each province. It measures the actual operational scale and use of crop-protection UAV technology. Compared with equipment stock, the service area more directly reflects the extent to which the technology is used in agricultural production, including services supplied through cooperatives and professional providers. Because the published data are aggregated at the provincial level, the measure represents operational scale and coverage rather than a household adoption rate or service-intensity measure. The published series is recorded in 1000 hectares. In the regressions, the series is divided by 100, so one regression unit represents 100,000 hectares.
The pathway variable is the crop disaster rate, calculated as crop area affected by disasters divided by total crop sown area. It is used to assess whether the estimates are statistically consistent with an aggregate loss-exposure pathway. The indicator combines pests and diseases with drought, flooding, low temperatures, and other hazards. Crop-protection UAVs are most directly relevant to pest and disease management and cannot directly prevent many of the other hazards included in the measure. The pathway analysis therefore cannot establish that UAV deployment generally reduces crop disasters; at most, it identifies a broad indirect multi-hazard statistical pathway. The controls capture rural economic development, agricultural production scale, fiscal support for agriculture, human capital, and agricultural mechanization.
Table 1 reports descriptive statistics. The mean agricultural insurance claims-to-premium ratio is 0.757, with a standard deviation of 0.156 and a range from 0.484 to 1.443, indicating substantial variation in annual claims outcomes across provinces and years. The mean crop-protection UAV service area is 601.04 thousand hectares, with a standard deviation of 782.45 thousand hectares, indicating substantial variation in UAV service coverage across provinces and years. The crop disaster rate averages 0.088 and reaches 0.507 in the most severely affected province-year.
Table 1.
Variable definitions and descriptive statistics.
3.3. Empirical Models
To estimate the within-province relationship between crop-protection UAV service area and the claims paid-to-premium income ratio, the study uses the following two-way fixed-effects model:
where indexes provinces and indexes years; is the claims-to-premium ratio; is crop-protection UAV service area; and includes rural disposable income per capita, average years of schooling, fiscal support for agriculture, gross agricultural output, and total power of agricultural machinery. Province fixed effects () control for time-invariant geography, long-run agricultural conditions, and institutional features, while year fixed effects () absorb common macroeconomic movements, policy changes, and nationwide shocks. The error term is , and standard errors are clustered at the province level. All regression tables use province-clustered standard errors; the indirect-effect panel additionally uses a province-clustered bootstrap. Throughout the empirical tables, *, **, and *** indicate statistical significance at the 10%, 5%, and 1% levels, respectively. Fixed effects and observed controls cannot eliminate time-varying province-level confounding, so the estimated UAV coefficient is interpreted as a conditional association.
To assess the proposed aggregate multi-hazard loss-exposure pathway, the study estimates a two-equation pathway model and directly tests the indirect effect using a province-clustered bootstrap:
denotes the aggregate crop disaster rate. A negative estimate of , a positive estimate of , and a bias-corrected bootstrap confidence interval for the indirect effect × that excludes zero are statistically consistent with a broad pathway from wider UAV service coverage to lower aggregate loss exposure and then to a lower claims-to-premium ratio. Because the disaster indicator combines multiple hazards and unobserved shocks may jointly affect the pathway variable and the outcome, the analysis is not interpreted as strict causal mediation or as a causal decomposition (MacKinnon et al. 2002; Preacher and Hayes 2008).
4. Empirical Results
4.1. Baseline Results
Table 2 presents the baseline estimates. Column (1), which includes province and year fixed effects, reports a coefficient of −0.0116 on crop-protection UAV service area, significant at the 1% level. After rural disposable income per capita, average schooling, fiscal support for agriculture, gross agricultural output, and total power of agricultural machinery are added in column (2), the coefficient remains negative and significant at the 1% level (−0.0107). Conditional on fixed effects and observed provincial covariates, an increase of 100,000 hectares in the service area is associated with an average 1.07-percentage-point lower claims-to-premium ratio. This difference equals about 1.4% of the sample mean of 75.7%. None of the control coefficients in column (2) is statistically significant at the 10% level. The estimate is a conditional association in a narrow annual claims-burden indicator; it is not evidence of a causal reduction in claims or broader insurance performance.
Table 2.
Baseline estimates of the agricultural insurance claims-to-premium ratio.
4.2. Robustness Checks
Table 3 reports four robustness checks, with province-clustered standard errors used consistently in all columns. Replacing service area with the number of crop-protection UAVs (thousands) produces a coefficient of −0.0130 (p = 0.033). Equipment count measures installed stock, whereas service area measures actual operations, so this test assesses directional consistency rather than coefficient comparability. The one-period-lag coefficient is −0.0080 (p = 0.087): the negative relationship remains under an alternative time ordering, but the evidence is weaker and significant only at the 10% level. The lag does not resolve time-varying omitted variables or establish causality. After Beijing, Tianjin, Shanghai, and Chongqing are excluded, the coefficient is −0.0089 (p = 0.021). Winsorizing the claims-to-premium ratio, service area, and UAV count at the 1st and 99th percentiles yields −0.0093 (p = 0.015). Thus, the negative coefficient is directionally stable, although inferential strength varies across specifications.
Table 3.
Robustness checks for the claims-to-premium relationship.
To assess whether the baseline ratio relationship is primarily driven by its numerator or denominator, Table 4 reports two-way fixed-effects regressions for log claims paid and log premium income using the same five controls and fixed effects. The UAV coefficient is −0.0153245 (SE = 0.0071075, p = 0.040) in the claims-paid regression and −0.0019640 (SE = 0.0072067, p = 0.787) in the premium-income regression. This pattern supports a claims-side interpretation and provides no evidence that the baseline ratio association is primarily driven by premium growth. It does not establish that UAV deployment causally reduced claims.
Table 4.
Decomposition of the claims-to-premium ratio.
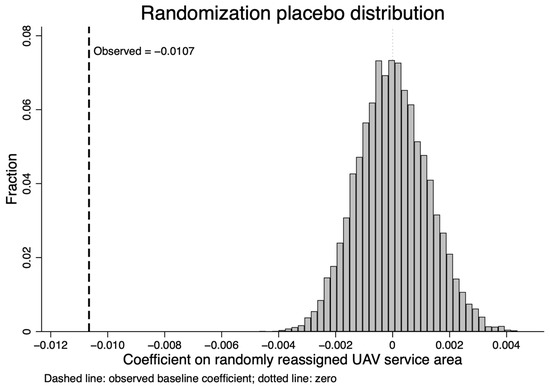
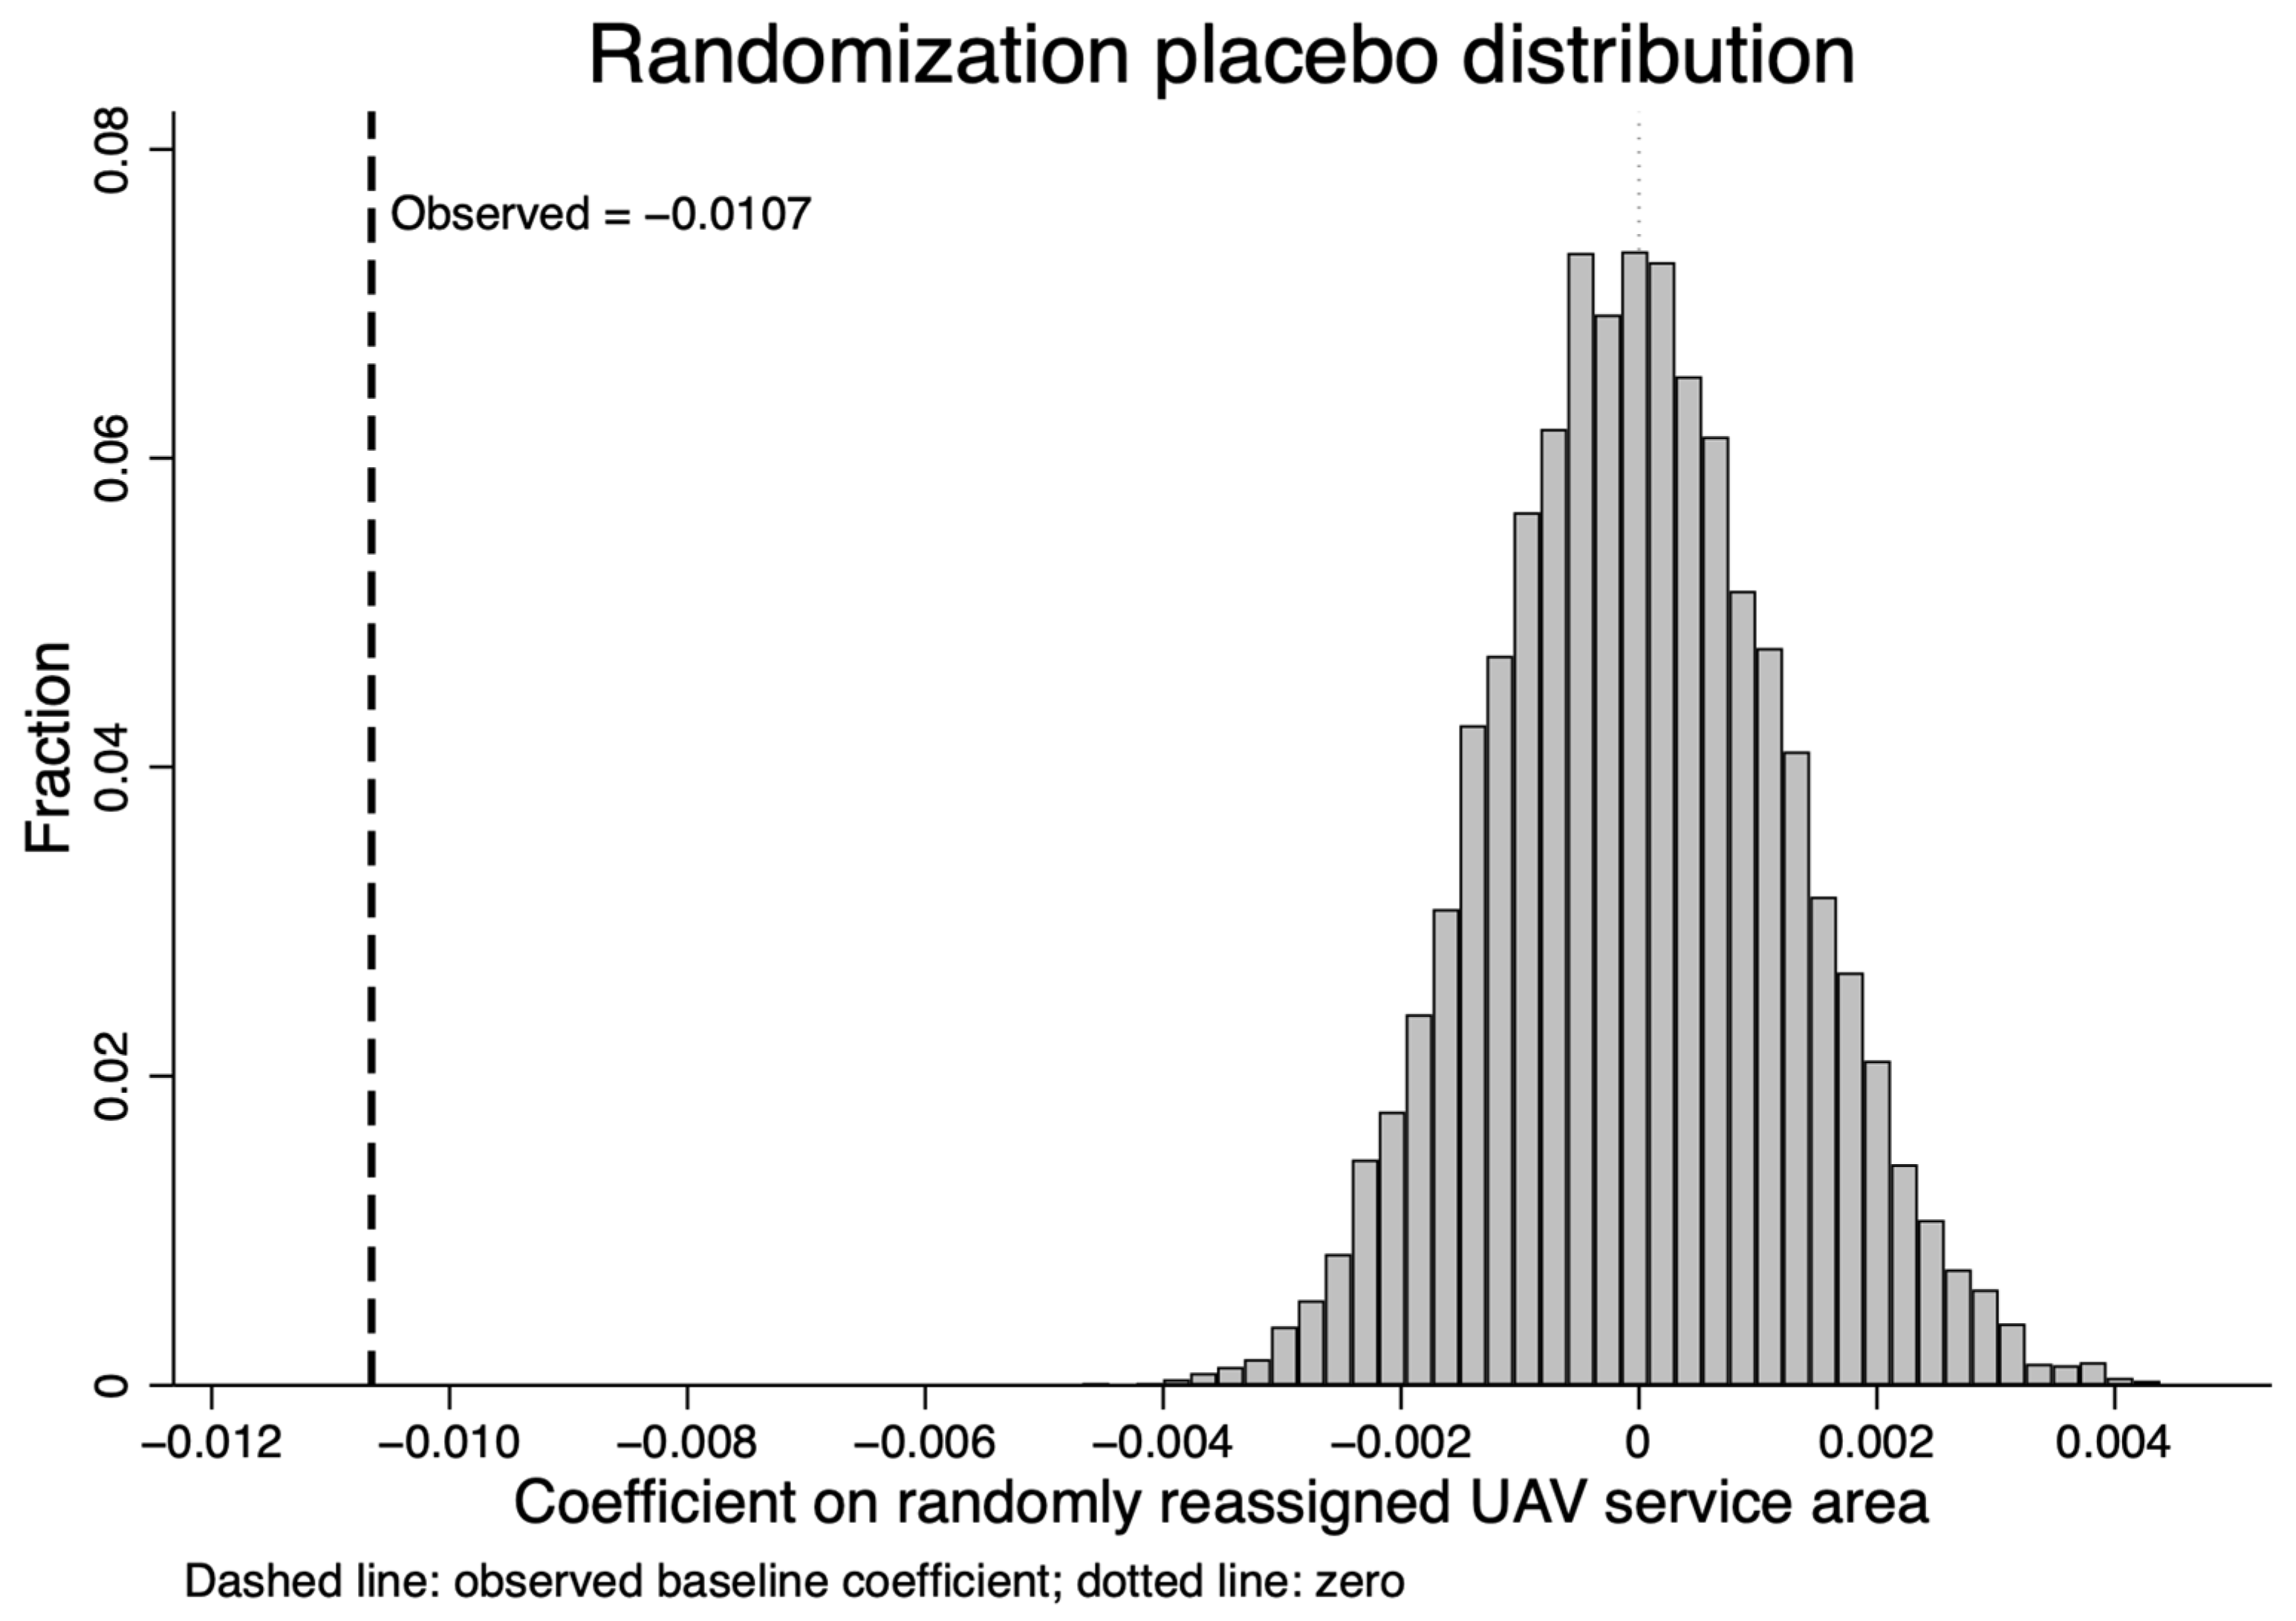
Figure 1 reports 10,000 placebo estimates obtained by randomly reassigning each year’s UAV service-area values across provinces while preserving the cross-sectional distribution of UAV service area within each year. This procedure breaks the observed province–UAV matching within each year while retaining the annual cross-sectional distribution. The placebo coefficients are centered near zero (mean = 0.000001; SD = 0.001244), whereas the observed baseline coefficient is −0.010656. The finite-sample randomization p-value is 0.000100. The observed coefficient is therefore extreme relative to these within-year random reassignments, but the placebo test cannot eliminate time-varying omitted variables or convert the observational design into causal identification.
Figure 1.
Distribution of coefficients from 10,000 placebo draws obtained by randomly reassigning each year’s UAV service-area values across provinces while preserving the cross-sectional distribution of UAV service area within each year. The procedure breaks the observed province–UAV matching within each year while retaining the annual cross-sectional distribution. The dashed line denotes the observed baseline coefficient (−0.010656), and the dotted line denotes zero.
4.3. Pathway Analysis: The Aggregate Crop Disaster Rate
To assess whether the estimates are statistically consistent with a broad indirect loss-exposure pathway, the aggregate crop disaster rate is introduced as the pathway variable. Panel A of Table 5 shows that service area is negatively associated with the crop disaster rate (−0.0036, p = 0.029). When the disaster rate enters the claims-to-premium equation, its coefficient is positive (0.8837, p < 0.001), while the coefficient on service area remains negative (−0.0074, p = 0.037). These estimates are consistent with a statistical pathway linking wider UAV service coverage, lower aggregate loss exposure, and a lower claims-to-premium ratio. Because the disaster rate combines pests and diseases with drought, flooding, low temperatures, and other hazards, it does not show that UAV deployment generally reduces agricultural disasters.
Table 5.
Aggregate loss-exposure pathway regressions and clustered bootstrap result.
Panel B reports the province-clustered bootstrap test. Based on 1000 replications, the indirect effect is −0.003156, with a bootstrap standard error of 0.001632 and a bias-corrected 95% confidence interval of [−0.007002, −0.000220]. The interval excludes zero and is consistent with the proposed broad indirect pathway. We do not report a mediated proportion because such a proportion could be misread as a decomposable causal share. Given the aggregate observational design and possible mediator–outcome confounding, the result is not a strict causal mediation estimate.
4.4. Regional Heterogeneity Analysis
China’s regions differ in terrain, farm scale, crop-protection UAV diffusion, and agricultural insurance development. The combined Eastern–Northeastern subsample includes Beijing, Tianjin, Hebei, Liaoning, Jilin, Heilongjiang, Shanghai, Jiangsu, Zhejiang, Fujian, Shandong, Guangdong, and Hainan; the Central subsample includes Shanxi, Anhui, Jiangxi, Henan, Hubei, and Hunan; and the Western subsample includes Inner Mongolia, Guangxi, Chongqing, Sichuan, Guizhou, Yunnan, Shaanxi, Gansu, Qinghai, Ningxia, and Xinjiang. Tibet is excluded because of missing data. Panel A of Table 6 retains separate regressions as descriptive within-region estimates. With province-clustered inference, the UAV coefficient is −0.0184 in the Eastern–Northeastern subsample (p = 0.002), −0.0275 in the Central subsample (p = 0.055), and −0.0016 in the Western subsample (p = 0.497). The Central estimate is therefore significant only at the 10% level in the separate regression. Differences in within-group significance do not by themselves establish coefficient differences.
Table 6.
Regional estimates and formal coefficient-difference tests.
Panel B reports the formal subgroup-equivalent fully interacted pooled model. It allows the five control-variable slopes to differ by region and absorbs region-by-year fixed effects, matching the flexibility of the separate regressions while permitting formal tests. The joint equality test rejects equal regional UAV slopes (F = 7.8325, p = 0.0019). The pooled regional slopes are −0.0183972 for the Eastern–Northeastern region (p = 0.001), −0.0275292 for the Central region (p = 0.007), and −0.0016444 for the Western region (p = 0.480). The Western coefficient differs from the Eastern–Northeastern coefficient (p = 0.003) and the Central coefficient (p = 0.013), whereas the Eastern–Northeastern and Central coefficients do not differ significantly (p = 0.397). The formal pairwise tests indicate that the statistically detectable cross-regional differences are concentrated in comparisons involving the Western region. The Eastern–Northeastern and Central coefficients do not differ significantly. Terrain, service networks, field fragmentation, and hazard composition are possible explanations, not mechanisms established by these estimates.
5. Discussion
5.1. Main Findings and Discussion
A larger crop-protection UAV service area is statistically associated with a lower agricultural insurance claims-to-premium ratio. Previous research has evaluated UAVs through farm revenue, input costs, operating time, pesticide use, or crop yields (Quan et al. 2023; Li et al. 2025). Our estimates connect actual production-side deployment with a narrow annual insurance outcome. The numerator–denominator decomposition provides additional support for a claims-side interpretation: service area is negatively associated with log claims paid, while no significant relationship is detected for log premium income. This does not imply that UAV deployment causally reduces claims, nor does a lower ratio establish higher profitability, solvency, or sustainability.
The results also distinguish the established informational use of UAV imagery from a possible production-side loss-exposure pathway. Iwahashi et al. (2023) and Hongo et al. (2024) examine how UAV imagery supports loss identification and assessment. This study instead uses crop-protection service area to measure intervention before an insured loss occurs. The clustered indirect-effect estimate is consistent with a broad pathway through the aggregate crop disaster rate, but the indicator includes hazards that crop-protection UAVs cannot directly prevent. Timelier field management, identification of high-risk plots, and changes in claims information remain possible explanations for future research; they are not mechanisms established here.
Service area is easier to interpret economically than equipment count because it measures actual use. Digital agriculture research emphasizes that equipment, data, and services affect outcomes only when incorporated into production processes (Klerkx et al. 2019). In smallholder-dominated systems, equipment ownership may not measure technology use well because cooperatives and professional service firms can provide cross-farm operations. For evaluating the potential insurance relevance of precision-agriculture technology, verifiable operational coverage, service quality, timing, and continuity are therefore more informative than equipment stock alone.
The formal pairwise tests indicate that the statistically detectable cross-regional differences are concentrated in comparisons involving the Western region. The Eastern–Northeastern and Central coefficients do not differ significantly. This pattern does not show that the technology is inherently effective in some regions and ineffective in others. Crop and peril composition, operating scale, service networks, terrain, and field fragmentation are plausible conjectures. Cause-specific and service quality data are required before any of these explanations can be treated as established.
5.2. Practical and Policy Implications
The findings motivate further evaluation, rather than automatic adoption, of arrangements that combine agricultural insurance with crop-protection services in China. Such evaluation should be conditional on crop type, dominant peril, service organization, and regional production conditions. Because the outcome is a narrow paid-claims ratio and the design is observational, the following points are potential policy options rather than conclusions about insurer profitability or program sustainability:
First, risk–technology matching should precede program design. Crop-protection UAV services are most plausibly relevant where pests, diseases, or time-sensitive field operations materially affect insured losses. They should not be presumed to prevent drought, flooding, low-temperature events, or other hazards outside their direct agronomic function. Crop- and peril-specific pilots could test whether service timing, coverage, and quality are associated with claim frequency and severity before services are incorporated into insurance arrangements.
Second, service organization matters. Cooperatives and professional providers may enable small farmers to access UAV operations without owning equipment. Insurers and public agencies could evaluate procurement, voucher, or partnership pilots where operational records are verifiable and responsibilities are clear. Such pilots should be evaluated against credible comparison groups and should measure service costs, paid and incurred claims, claim frequency, claim severity, and farmer outcomes; the present estimates do not demonstrate that any particular arrangement improves underwriting performance.
Third, regional adaptation and data governance should be incorporated into future evaluation. The different Western estimate, together with the formal coefficient-difference tests, suggests that a uniform relationship should not be assumed ex ante. Local pilots could account for terrain, field fragmentation, service-network maturity, and dominant risks. With appropriate authorization and quality controls, UAV flight paths, operating times, field coverage, and input parameters could support evaluation of service delivery. They should be linked to policy- and crop-level claims data only under clear privacy, access, and accountability rules.
5.3. Limitations and Future Research
The main limitation is data granularity and identification. Annual province-level data can estimate conditional aggregate associations between technology deployment and the claims-to-premium ratio, but they cannot match field-level crop-protection records with individual policies, claim frequency, or loss severity. Province and year fixed effects do not remove time-varying provincial weather, crop structure, insurance penetration, underwriting changes, land consolidation, high-standard farmland investment, or other policies. The lag and reassignment placebo provide useful diagnostics but do not resolve these sources of confounding. Linked field–crop–policy data and designs with defensible exogenous variation would permit stronger causal analysis.
The crop disaster rate is an aggregate multi-hazard indicator and cannot distinguish pests and diseases from drought, flooding, low temperatures, and other risks. The indirect-effect result is therefore evidence consistent with a broad statistical pathway, not proof that UAV services generally reduce agricultural disasters. Cause-specific data would improve assessment of risk–technology matching. In addition, the claims paid-to-premium income ratio focuses on annual payments and premium income; it does not include expenses, changes in claims reserves, or a complete measure of profitability. Absolute service area measures operational scale but not service intensity relative to eligible cropland. Future research could combine underwriting-year incurred-loss data with crop-specific claim frequency, average claim severity, combined ratios, and normalized service intensity.
Agricultural insurance in China is also heavily subsidized. Subsidy disbursement, premium growth, portfolio composition, claim-payment timing, and policy adjustments can affect the annual claims-to-premium ratio. The decomposition finds no significant UAV association with contemporaneous premium income, but it cannot rule out all denominator or timing channels. Future research using underwriting-year outstanding and incurred claims would help determine whether UAV deployment is associated with ultimate losses and loss-reserve development.
6. Conclusions
Using a balanced panel of 30 Chinese provinces over 2018–2024, this study finds that a larger crop-protection UAV service area is statistically associated with a lower claims paid-to-premium income ratio. An increase of 100,000 hectares is associated with an average 1.07-percentage-point lower ratio. This outcome is a narrow indicator of annual paid-claims burden relative to premium income, not an actuarial incurred loss ratio or a measure of overall profitability, solvency, or sustainability. The negative relationship remains under alternative UAV measures, municipality exclusion, and winsorization; the lagged estimate is weaker and significant only at the 10% level. Decomposition results support a claims-side interpretation, and the observed coefficient is extreme relative to 10,000 placebo estimates generated by reassigning UAV service-area values across provinces within each year.
The clustered bootstrap indirect effect is consistent with a broad pathway through the aggregate crop disaster rate, but the multi-hazard indicator cannot establish that UAV deployment generally reduces agricultural disasters or support a causal mediated share. The formal pairwise tests indicate that the statistically detectable cross-regional differences are concentrated in comparisons involving the Western region. The Eastern–Northeastern and Central coefficients do not differ significantly. Terrain, service networks, field structure, and hazard composition remain conjectures requiring direct testing.
The contribution is to document a conditional relationship between actual production-side UAV deployment and a narrowly defined agricultural insurance claims outcome. The evidence can inform further evaluation in China of crop- and peril-matched cooperation between insurers and crop-protection service organizations, but it does not establish that such arrangements improve overall insurance performance. Aggregate provincial observational data, time-varying omitted factors, annual payment timing, and the multi-hazard pathway measure limit causal interpretation. Future work should use linked crop–field–policy data and credible comparison designs to evaluate specific service arrangements and ultimate insured losses.
Author Contributions
Conceptualization, J.W. (Jian Wu); methodology, J.W. (Jian Wu) and J.W. (Jiaxuan Wei); software, J.W. (Jiaxuan Wei); validation, J.W. (Jian Wu); formal analysis, J.W. (Jiaxuan Wei); investigation, J.W. (Jiaxuan Wei); resources, J.W. (Jian Wu); data curation, J.W. (Jiaxuan Wei); writing—original draft preparation, J.W. (Jiaxuan Wei); writing—review and editing, J.W. (Jian Wu); supervision, J.W. (Jian Wu); project administration, J.W. (Jian Wu); funding acquisition, J.W. (Jian Wu). All authors have read and agreed to the published version of the manuscript.
Funding
This research was funded by the Chongqing Social Science Planning Youth Project, grant number 2022NDQN50, and the High-Level Talent Research Start-Up Project of Chongqing Technology and Business University, grant number 2055028.
Data Availability Statement
The source data were obtained from publicly available statistical yearbooks and provincial statistical publications identified in Section 3.1, some of which are subject to publisher access conditions. The processed dataset and replication code supporting the reported results are available from the corresponding author upon reasonable request.
Conflicts of Interest
The authors declare no conflicts of interest. The funders had no role in the design of the study; in the collection, analyses, or interpretation of data; in the writing of the manuscript; or in the decision to publish the results.
References
- Barnett, Barry J., Christopher B. Barrett, and Jerry R. Skees. 2008. Poverty traps and index-based risk transfer products. World Development 36: 1766–85. [Google Scholar] [CrossRef] [Scilit]
- Chai, Zhihui, and Yuanfeng Zhao. 2016. The formation mechanism and case evidence of farmers’ moral hazard in crop insurance: Evidence from Inner Mongolia. Insurance Studies 12: 85–93. Available online: https://www.isc-org.cn/2016ndbxyj/10537.jhtml (accessed on 28 August 2026). (In Chinese; Title Translated by the Authors).
- Di, Shuai, Fei Gao, and Yueqing Ji. 2020. Operation scales, service quality risks and farmer’s outsourcing for pest control machinery: A case study of the Manas River Basin of Xinjiang. Research of Agricultural Modernization 41: 285–93. (In Chinese) [Google Scholar] [CrossRef]
- Ehrlich, Isaac, and Gary S. Becker. 1972. Market insurance, self-insurance, and self-protection. Journal of Political Economy 80: 623–48. [Google Scholar] [CrossRef] [Scilit] [PubMed]
- Finger, Robert, Scott M. Swinton, Nadja El Benni, and Achim Walter. 2019. Precision farming at the nexus of agricultural production and the environment. Annual Review of Resource Economics 11: 313–35. [Google Scholar] [CrossRef] [Scilit]
- Glauber, Joseph W. 2004. Crop insurance reconsidered. American Journal of Agricultural Economics 86: 1179–95. [Google Scholar] [CrossRef] [Scilit]
- Goodwin, Barry K., and Vincent H. Smith. 1995. The Economics of Crop Insurance and Disaster Aid. Washington, DC: American Enterprise Institute. [Google Scholar]
- Hongo, Chiharu, Shun Isono, Gunardi Sigit, and Eisaku Tamura. 2024. Efficient damage assessment of rice bacterial leaf blight disease in agricultural insurance using UAV data. Agronomy 14: 1328. [Google Scholar] [CrossRef] [Scilit]
- Huang, Yubin, Steven J. Thomson, W. Clint Hoffmann, Yubin Lan, and Bradley K. Fritz. 2013. Development and prospect of unmanned aerial vehicle technologies for agricultural production management. International Journal of Agricultural and Biological Engineering 6: 1–10. [Google Scholar] [CrossRef]
- Iwahashi, Yu, Gunardi Sigit, Budi Utoyo, Iskandar Lubis, Ahmad Junaedi, Bambang Hendro Trisasongko, I Made Anom Sutrisna Wijaya, Masayasu Maki, Chiharu Hongo, and Koki Homma. 2023. Drought damage assessment for crop insurance based on vegetation index by unmanned aerial vehicle (UAV) multispectral images of paddy fields in Indonesia. Agriculture 13: 113. [Google Scholar] [CrossRef] [Scilit]
- Klerkx, Laurens, Emma Jakku, and Pierre Labarthe. 2019. A review of social science on digital agriculture, smart farming and Agriculture 4.0: New contributions and a future research agenda. NJAS: Wageningen Journal of Life Sciences 90–91: 100315. [Google Scholar] [CrossRef] [Scilit]
- Lan, Yubin, Shengde Chen, Jizhong Deng, Zhiyan Zhou, and Fan Ouyang. 2019. Development situation and problem analysis of plant protection unmanned aerial vehicle in China. Journal of South China Agricultural University 40: 217–25. (In Chinese) [Google Scholar] [CrossRef]
- Li, Junpeng, Wanglin Ma, Bowen Shen, and Longwei Li. 2025. Can unmanned aerial vehicle (UAV) adoption reduce pesticide use and enhance yields? Evidence from mountainous rice farming in Yunnan, China. Food Policy 136: 102965. [Google Scholar] [CrossRef] [Scilit]
- Ling, Tao, Haoge Lan, Weichuan Cui, and Guiqin Zhao. 2025. From risk protection to production empowerment: Can agricultural insurance promote farmers’ adoption of productive services? Journal of Finance and Economics 51: 125–39. (In Chinese) [Google Scholar] [CrossRef]
- Liu, Wei, Libing Sun, and Guozhu Tuo. 2022. Determinants of indemnity accuracy: An analysis based on crop insurance. Financial Forum 27: 33–42. Available online: https://www.cnki.com.cn/Article/CJFDTOTAL-CSJR202203004.htm (accessed on 28 August 2026). (In Chinese; Title Translated by the Authors).
- Liu, Yong, and Austin Ford Ramsey. 2023. Incorporating historical weather information in crop insurance rating. American Journal of Agricultural Economics 105: 546–75. [Google Scholar] [CrossRef] [Scilit]
- MacKinnon, David P., Chondra M. Lockwood, Jeanne M. Hoffman, Stephen G. West, and Virgil Sheets. 2002. A comparison of methods to test mediation and other intervening variable effects. Psychological Methods 7: 83–104. [Google Scholar] [CrossRef] [PubMed]
- Mao, Yifei, Shengwei Chen, Jun Wang, and Hao Niu. 2025. The protection efficiency of agricultural insurance claims from the perspective of farm-size heterogeneity. Insurance Studies 12: 90–100, (In Chinese; Title Translated by the Authors). [Google Scholar] [CrossRef]
- Ministry of Agriculture of the People’s Republic of China, and Ministry of Finance of the People’s Republic of China. 2018. Notice on Conducting Agricultural-Machinery New-Product Purchase-Subsidy Pilot Work for 2018–2020 (Nong Ban Ji [2018] No. 5). Available online: https://njhs.moa.gov.cn/zcjd1/201904/t20190428_6244491.htm (accessed on 28 August 2026).
- Ministry of Agriculture of the People’s Republic of China, Ministry of Finance of the People’s Republic of China, and Civil Aviation Administration of China. 2017. Notice on Launching Pilot Work Using Agricultural-Machinery Purchase Subsidies to Guide the Standardized Application of Crop-Protection Unmanned Aircraft (Nong Ban Ji [2017] No. 10). Available online: https://njhs.moa.gov.cn/tzggjzcjd/201711/t20171102_6314837.htm (accessed on 28 August 2026).
- Miranda, Mario J., and Joseph W. Glauber. 1997. Systemic risk, reinsurance, and the failure of crop insurance markets. American Journal of Agricultural Economics 79: 206–15. [Google Scholar] [CrossRef] [Scilit]
- Niu, Hao, Zheng Li, Le Sun, and Shengwei Chen. 2021. The dual operating dilemma of agricultural insurers under intensified market competition. Insurance Studies 3: 32–43, (In Chinese; Title Translated by the Authors). [Google Scholar] [CrossRef]
- Preacher, Kristopher J., and Andrew F. Hayes. 2008. Asymptotic and resampling strategies for assessing and comparing indirect effects in multiple mediator models. Behavior Research Methods 40: 879–91. [Google Scholar] [CrossRef] [Scilit] [PubMed]
- Qin, Weicai, and Panyang Chen. 2023. Analysis of the research progress on the deposition and drift of spray droplets by plant protection UAVs. Scientific Reports 13: 14935. [Google Scholar] [CrossRef] [Scilit] [PubMed]
- Quan, Xiuhao, Qiaoling Guo, Ji Ma, and Reiner Doluschitz. 2023. The economic effects of unmanned aerial vehicles in pesticide application: Evidence from Chinese grain farmers. Precision Agriculture 24: 1965–81. [Google Scholar] [CrossRef] [Scilit]
- Ragiman, Sreenath, Kiran Babu Talluri, Varma NRG, and Vidya Sagar B. 2024. Unmanned aerial vehicle (UAV)-assisted pesticide application for pest and disease prevention and control in rice. International Journal of Agricultural and Biological Engineering 17: 88–95. [Google Scholar] [CrossRef] [Scilit]
- Shavell, Steven. 1979. On moral hazard and insurance. Quarterly Journal of Economics 93: 541–62. [Google Scholar] [CrossRef] [Scilit]
- Shi, Min, Fengbo Chen, and Fengxian Chen. 2024. The effect of farmers’ trust on outsourcing services in agricultural production stages: A case study of socialized UAV crop-protection services in rice production. Journal of China Agricultural University 29: 314–26, (In Chinese; Title Translated by the Authors). [Google Scholar] [CrossRef]
- Sun, Xu, Yulan Chen, Dajun Zhao, and Tong Xiao. 2025. Effects of intelligent-technology adoption on cost savings and efficiency gains in agricultural production: Evidence from UAV use in Xinjiang cotton fields. Journal of Chinese Agricultural Mechanization 46: 314–22, (In Chinese; Title Translated by the Authors). [Google Scholar] [CrossRef]
- Tang, Jincheng, and Baoxin Li. 2023. Research on innovation and development of China’s agricultural insurance empowered by the Internet of Things. Southern Finance 9: 15–27. Available online: https://gdjr.cbpt.cnki.net/ (accessed on 28 August 2026). (In Chinese; Title Translated by the Authors).
- Woodard, Joshua D., Bruce J. Sherrick, and Gary D. Schnitkey. 2011. Actuarial impacts of loss cost ratio ratemaking in U.S. crop insurance programs. Journal of Agricultural and Resource Economics 36: 211–28. [Google Scholar] [CrossRef]
- Woodard, Joshua D., Gary D. Schnitkey, Bruce J. Sherrick, Nancy Lozano-Gracia, and Luc Anselin. 2012. A spatial econometric analysis of loss experience in the U.S. crop insurance program. Journal of Risk and Insurance 79: 261–86. [Google Scholar] [CrossRef] [Scilit]
- Xiao, Yugu, Ke Wang, Xiaowei He, and Hong Holly Wang. 2020. Effects of indemnification methods on the risk-protection function of fiscally subsidized agricultural insurance. Insurance Studies 7: 63–76. Available online: https://www.cnki.com.cn/Article/CJFDTOTAL-BXYJ202007005.htm (accessed on 28 August 2026). (In Chinese; Title Translated by the Authors).
- Yao, Xue, Lijun Cheng, Hongying Shang, and Guozhu Tuo. 2020. Design and application of a smart agricultural insurance system based on ‘3S + ABC’ technologies. Journal of Insurance Professional College 34: 53–62. Available online: https://edt.cqvip.com/journal/bxzyxyxb/article/534428960 (accessed on 28 August 2026). (In Chinese; Title Translated by the Authors).
- Yi, Fujin, Yu Lu, and Ke Wang. 2022. Small indemnities for major disasters and large indemnities for minor disasters: The paradox between agricultural production risk and indemnity levels under a lump-sum premium-subsidy model—Evidence from policy-supported corn insurance. Chinese Rural Economy 3: 128–44. Available online: http://rdi.cass.cn/xskw/zgncjj/qkmlyzw/2022n/202409/P020240926593437717059.pdf (accessed on 28 August 2026). (In Chinese; Title Translated by the Authors).
- Yu, Seung-Hwa, Yeongho Kang, and Chun-Gu Lee. 2023. Comparison of the spray effects of air induction nozzles and flat fan nozzles installed on agricultural UAVs. Applied Sciences 13: 11552. [Google Scholar] [CrossRef] [Scilit]
- Zeng, Fanlei. 2025. Application and standardization of low-altitude economy in agricultural insurance loss assessment. Xinjiang Finance & Economics 5: 41–49. (In Chinese) [Google Scholar] [CrossRef]
- Zhang, Daoming, Wei Hu, Qing Guo, and Hao Wang. 2024. Study on the mechanism of risk-reduction services in agricultural insurance. Development Finance Research 3: 15–24. (In Chinese) [Google Scholar] [CrossRef]
- Zhao, Sijian, Jian Zhao, Ailian Chen, Jibao Lai, and Hongwei Li. 2024. Pathways and indicators for cross-validating agricultural insurance data using remote sensing. Insurance Studies 1: 49–58, (In Chinese; Title Translated by the Authors). [Google Scholar] [CrossRef]
- Zheng, Shi, Qianmiao Chen, and Zhigang Wang. 2018. Scale of land, enrollment of cooperatives, and cognition and adoption of plant-protection UAV technology: Evidence from Jilin Province. Journal of Agrotechnical Economics 6: 92–105. (In Chinese) [Google Scholar] [CrossRef]

Disclaimer/Publisher’s Note: The statements, opinions and data contained in all publications are solely those of the individual author(s) and contributor(s) and not of MDPI and/or the editor(s). MDPI and/or the editor(s) disclaim responsibility for any injury to people or property resulting from any ideas, methods, instructions or products referred to in the content. |
© 2026 by the authors. Licensee MDPI, Basel, Switzerland. This article is an open access article distributed under the terms and conditions of the Creative Commons Attribution (CC BY) license.