


Abstract
This study examines whether corporate governance helps explain cross-sectional stock return variation on the Tokyo Stock Exchange. We construct 32 portfolios sorted by firm size, book-to-market equity, profitability, investment, and a governance indicator distinguishing institutional and participatory structures. Using monthly data from 2010–2017, we estimate Fama–French five-, six-, and seven-factor models with ARIMAX specifications to address serial correlation. Unlike most existing Japan-focused studies that examine corporate governance primarily through firm-level regressions or simple portfolio sorts without incorporating it as a risk factor, this study adopts a more comprehensive approach by constructing governance-sorted portfolios and including a governance-mimicking factor (IMP) as an additional risk factor within multi-factor asset pricing models. We find governance has strong explanatory power, second only to market risk, and is associated with lower returns for firms with greater shareholder participation. Furthermore, governance alters size and value effects, while momentum is largely insignificant. In sum, the findings provide valuable information that portfolio managers, analysts, and investors may use for optimizing portfolio choices.
1. Introduction
Fluctuations in asset prices directly affect investor decisions, risk exposure, and stakeholder returns, making the identification of systematic risk factors central to modern finance. Developed asset-pricing models provide investors with tools to assess the drivers of portfolio returns and to manage associated risks effectively (Lohano and Kashif 2019). Considerable progress has been made in identifying factors such as market, size, value, profitability, investment, and momentum. However, the role of corporate governance in shaping investment returns remains comparatively underexplored, particularly in advanced economies with unique institutional arrangements. This study examines whether and how the governance structure of firms influences returns on stocks traded on the Tokyo Stock Exchange (TSE).
The fundamental notion of the Capital Asset Pricing Model (CAPM) is that returns from investments in publicly traded companies are determined by the degree of market risks investors are willing to take (Sharpe 1964; Lintner 1965). The market risk factor is still the most important risk premium for asset pricing models among the other variables. Gray and Zhong (2021) showed this for Australian equities. Fama and French (1993) modified the CAPM by adding two components, namely the ‘size premium’ and the ‘value premium.’ Carhart (1997) suggested that portfolio returns also depend on a fourth factor, namely the ‘momentum risk premium.’ Fama and French (2014) extended their earlier model by incorporating two additional factors, namely the ‘profitability’ and ‘investment’ factors. Subsequently, Fama and French (2018) also included Carhart’s momentum factor in their model, which is recognized as the Fama–French six-factor model. However, these models do not include the level of corporate governance of the underlying companies as a factor that is highly likely to influence stock returns.
A large body of prior work in finance literature suggests companies with strong shareholder rights and effective external governance mechanisms typically reduce agency conflicts (Silveira et al. 2003), enhance firm value (Dahya and McConnell 2007), and generate superior investment performance (Gompers et al. 2003).
Corporate governance practices vary notably both across countries (La Porta et al. 1999) and among individual firms within the same country (Gompers et al. 2003). Japan’s financial system offers a particularly instructive setting for this study. Historically, it has been characterized by bank-centered financing (Yao et al. 2010), extensive cross-shareholding structures (Bonn et al. 2004), and limited shareholder influence (Sato and Takeda 2023). Over the past three decades, however, financial liberalization has significantly expanded the role of capital markets. A commonly used indicator of financial system orientation, the ratio of banking sector assets to stock market capitalization, places Japan close to unity. This is not consistent with either a purely bank-based or a purely market-based system (Claessens et al. 2000). Corporate ownership in Japan is also more dispersed than in many traditional bank-based economies. A substantial share of Japanese firms has no single dominant shareholder, with ownership spread across many uncoordinated investors (Miyajima and Kuroki 2007). We therefore characterize Japan as a hybrid financial system (Miyajima 2022; Renou et al. 2023). Nonetheless, residual bank-oriented features continue to shape the governance environment in ways that are distinct from the United States and United Kingdom. These include main-bank monitoring, whereby a firm’s primary lending bank holds equity, maintains privileged access to internal financial information, and retains authority to intervene in management during periods of distress, as well as cross-shareholding and stable long-term ownership arrangements among affiliated firms. We argue that these features cause the governance premium in Japan to diverge from conventional expectations.
In this context, the TSE represents an ideal environment to test whether corporate governance constitutes a systematic risk factor and how it is priced in asset returns. These considerations generate an empirical question regarding the magnitude and direction of the governance risk premium.
To address this question, we integrate a binary corporate governance indicator, distinguishing between institutional and participatory governance, into the Fama–French six-factor framework, alongside traditional factors. Using firm-level monthly data from 2010 to 2017, we construct 32 characteristic-sorted portfolios based on firm size, book-to-market equity ratio, profitability, investment strategy, and governance structure.
Initial estimation using ordinary least squares (OLS) revealed bias in 12 of the 32 portfolios due to autocorrelation, motivating the adoption of portfolio-specific ARIMAX (p, I, q) time-series models. Maximum likelihood estimation (MLE) is employed to estimate Fama–French five-factor, six-factor, and seven-factor specifications, with out-of-sample forecasting used to evaluate predictive performance.
The empirical results demonstrate that corporate governance is a significant determinant of stock returns in Japan, with lower shareholder participation associated with higher excess returns. This finding contrasts with evidence from other developed markets such as the U.S. (Giroud and Mueller 2011), the U.K. (Affes and Jarboui 2023), and Hong Kong (Cheung et al. 2007) but aligns with observations from emerging markets such as Brazil (Carvalhal and Nobili 2011), Thailand (Connelly et al. 2012), and Indonesia (Kurniati 2019). The difference between Japan and other developed countries may be attributed to the fact that, although Japanese corporate law provides shareholders powerful legal rights, cross-shareholding and long-term ownership relationships make these rights difficult to exercise in practice, resulting in both domestic and foreign investors receiving only weak real protection (Goto 2014). Corporate governance attributes are especially crucial in countries with a fragile legal environment (Klapper and Love 2003).
The outperformance of firms with lower shareholder participation (i.e., lower corporate governance score) is consistent with agency theory: stronger (i.e., higher corporate governance score) corporate governance reduces shareholders’ monitoring and auditing costs, which in turn lowers the expected return on equity (Lombardo and Pagano 2000).
Moreover, the governance risk factor exhibits stronger explanatory power than all other non-market factors, while delivering the higher return premium relative to that of the market factor. From an investment perspective, the results suggest that long positions in firms with weaker governance and short positions in firms with stronger governance can help to maximize expected returns. Additionally, the analysis reveals that governance structure materially influences the traditional size and value effects: the size effect is amplified for small firms and attenuated for big firms under participatory governance relative to institutional governance, while shareholder participation strengthens the value effect among high book-to-market firms but weakens it among low book-to-market firms. Furthermore, momentum risk plays a negligible role in the Japanese market, and substituting momentum with governance improves model performance without materially altering other parameter estimates.
This study makes several important contributions to the literature on corporate governance and asset pricing. First, while most existing Japan-focused studies examine corporate governance either through firm-level regressions or by constructing governance-sorted portfolios without incorporating it as a risk factor, this study adopts a more comprehensive approach by constructing governance-sorted portfolios based on annually updated governance scores and incorporating corporate governance as an additional risk factor within the Fama–French asset pricing frameworks. Second, this study provides new evidence on the pricing of governance risk, specifically in Japan’s hybrid financial system, where formal governance provisions often diverge from effective shareholder protection. Third, it shows that governance not only influences average returns but also modulates the size and value effects in ways that have not been well documented in the Japanese context, offering practical implications for investors and policymakers seeking to optimize portfolio strategies.
The paper proceeds as follows. Section 2 reviews the theoretical and empirical literature on corporate governance and asset pricing. Section 3 introduces empirical models and discusses estimation issues. Section 4 describes the data, constructs characteristic portfolios, and identifies econometric specifications. Section 5 presents estimation results, while Section 6 evaluates out-of-sample forecasting performance. Section 7 concludes with implications for theory, investment strategy, and policy.
2. Measures of Corporate Governance
The International Federation of Accountants (IFAC) defined corporate governance as the “set of responsibilities and practices exercised by the board and executive management with the goal of providing strategic direction, ensuring that objectives are achieved, ascertaining that risks are managed appropriately and verifying that the organization’s resources are used responsibly” (CIMA & IFAC 2004).
2.1. Theoretical Foundations
The relationship between corporate governance and asset pricing can be grounded in several complementary theoretical frameworks, each with distinct predictions about the direction and magnitude of the governance risk premium. Agency theory provides the foundational argument. Jensen and Meckling (1976) show that poor governance amplifies conflicts of interest between managers and shareholders, raising agency costs and firm risk. Higher risk demands higher expected returns. Fama and Jensen (1983) extend this view: delegating decision-making authority to professional managers introduces moral hazard and adverse selection, elevating the cost of equity capital. In Japan’s hybrid financial system, where cross-shareholding and main-bank monitoring substitute for external shareholder oversight, firms with weaker formal governance are likely to leave outside investors bearing higher residual agency costs. Consequently, we expect ex ante that weaker governance will be associated with higher expected returns. Under agency theory, weaker governance is associated with higher expected returns. The direction of the effect is observed in our data.
Information asymmetry theory offers a related but distinct mechanism. Poor governance reduces transparency and increases information asymmetry between corporate insiders and outside investors (Akerlof 1970; Grossman and Hart 1980). Investors facing greater uncertainty demand a return premium to compensate for adverse selection risk. Stronger governance reduces this asymmetry and lowers the required return through rigorous disclosure, independent board oversight, and active audit committees (Ferreira and Laux 2005). In the Japanese context, where cross-shareholding and long-term relational ownership already limit information flow to external shareholders, weak formal governance is likely to exacerbate these information problems. The prediction is the same as under agency theory: weaker governance, higher expected returns.
Stewardship theory provides a useful counterpoint, particularly for Japan. Donaldson and Davis (1991) argue that managers are intrinsically motivated stewards who act in shareholders’ interests without requiring external governance constraints. In bank-based or hybrid systems, where main banks provide close monitoring and managers maintain stable long-term relationships with major shareholders, formal shareholder-participatory governance mechanisms may be redundant. If stewardship theory applies in Japan, firms with lower formal governance scores may still be effectively monitored through informal channels, dampening the governance premium relative to market-based systems.
From a risk-based asset pricing perspective (Fama and French 1993, 2014), governance is priced as a systematic risk factor if it generates return co-variation that cannot be diversified away. Firms with similar governance structures may respond similarly to regulatory shocks, shifts in institutional investor sentiment, or governance-related policy changes. The IMP factor constructed in this study captures precisely this co-variation. Its significance across 21 of 32 portfolios supports the interpretation of governance as a genuine systematic risk factor. Japan’s hybrid financial system, characterized by cross-shareholding and main-bank monitoring, generates substantial variation in the actual effectiveness of corporate governance across firms. While some firms are subject to close oversight by main banks and stable shareholders, others operate with relatively weak external monitoring despite satisfying formal governance requirements. This institutional variation creates systematic differences in exposure to agency costs and information asymmetry. Consequently, we expect ex ante that firms with weaker formal governance will exhibit higher expected returns.
These frameworks converge on the prediction that governance is priced in equilibrium. They also help explain the counter-intuitive direction of the premium in Japan. Even if formal governance provisions are weak, informal bank-based monitoring may substitute effectively, but it does not eliminate the underlying agency costs that investors must be compensated for bearing.
Relatively little theoretical guidance exists in the literature on how corporate governance should interact with traditional risk factors such as size, value, profitability, and investment, especially in the context of Japan’s hybrid financial system. Thus, we followed a partially exploratory method by investigating the interactions between governance and other risk premiums and interpreting them ex post from agency theory and stewardship viewpoints. This structure is suitable, because the theoretical basis for such differentiated heterogeneous patterns is still weak in the context of Japan’s institutional environment. For completeness, we also offer some theoretical motivation on why participatory governance may have heterogeneous effects on size and value premium. From a signaling theory perspective (e.g., Botosan 1997; Healy and Palepu 2001), small firms that have traditionally relied more on main-bank relationships may have different implications when adopting participatory governance. This may signal a strategic shift towards greater market discipline and external financing. Such a shift might be due to higher growth opportunities but also increased exposure to market volatility and consequently higher returns demanded by investors, and it impacts on the magnitude of the size premium. Similarly, in accordance with the agency theory of free cash flow (Jensen 1986), high book-to-market (value) firms are often associated with higher free cash flows and more managerial discretion. In this context, participatory governance could impose stronger discipline, and managers might take on higher-risk, higher-return projects, which could increase the value premium overgrowth companies. These considerations give general theoretical motivation to look at the interactions of governance with size and value factors.
2.2. Measurement of Corporate Governance and Prior Literature
Despite its importance, corporate governance is inherently difficult to measure because it encompasses multiple qualitative and structural attributes that are not directly observable. Empirical literature therefore relies on various proxies. Some studies employ individual governance characteristics in regression analysis, whereas others construct composite indices to capture governance quality more comprehensively. For instance, Dahya and McConnell (2007) use the number of independent directors on the board of British firms as a proxy for shareholder participation. Hamza and Mselmi (2018) measure governance quality in French firms through audit committee independence, while Ullah (2016) focuses on ownership structure for Japanese companies. Koji et al. (2020) employ seven indicators reflecting board structure and ownership patterns for publicly traded Japanese manufacturing firms, and Chalevas and Tzovas (2016) examine the effects of multiple governance attributes on stock prices in Greece.
Recognizing the multidimensional nature of governance, several studies construct aggregate governance indices. Gompers et al. (2003) develop an index based on twenty-four governance provisions for U.S. firms. Aman and Nguyen (2008) propose a composite index for Japanese firms comprising board structure, ownership composition, and disclosure policy, finding that firms with weaker governance earned higher returns due to greater exposure to risk premiums rather than governance inefficiencies. However, their approach fixes governance scores over the entire sample period, resulting in static portfolio classifications and potentially distorting both portfolio formation and inference. Our study overcomes this limitation by updating governance scores annually for all firms. Over the sample period, 35 firms improved their governance sufficiently to transition from “institutional” to “participatory” status, while only one firm moved in the opposite direction. Several additional firms also exhibited governance improvements without crossing the classification threshold, indicating meaningful within-firm governance dynamics. Other international governance indices include that of Carvalhal and Nobili (2011) for Brazilian firms and the governance scores published by the Thai Institute of Directors Association, used by Pugdeepunt (2017) to evaluate portfolio performance in Thailand. Most relevant to this study, Singareddy et al. (2018) construct a comprehensive governance index for firms in China, India, Indonesia, Japan, South Korea, and Thailand based on thirteen governance attributes. The thirteen attributes and their coding are presented in Table 1. Each attribute is coded in binary form and aggregated to produce a governance score ranging from 0 to 13, where 0 indicates complete institutional control and 13 represents full independence of the executive board.
Table 1.
Structure of corporate governance provisions.
We adopt the Singareddy et al. (2018) corporate governance index, because it provides the most comprehensive and internationally consistent measure of governance for Japanese firms given available institutional data and has not been used previously in the literature to construct a corporate governance risk premium within the Fama–French asset pricing framework. To reflect the economic interpretation of the index, firms with lower scores are classified as “institutional”, while firms with higher scores are classified as “participatory.” The underlying objective of all major governance indices is to quantify the degree of institutional (proprietary) control over corporate decision making. Accordingly, higher index values indicate greater participation by independent shareholders in corporate governance.
Three points support the use of this index in the Japanese context. First, Japan is one of the six economies for which the index was explicitly constructed. It is therefore not a cross-contextual adaptation but a direct application. Second, the thirteen governance provisions reflect the OECD Principles of Corporate Governance (OECD 2015), which Japan formally incorporated through the Companies Act and the 2015 Corporate Governance Code. The index thresholds are consistent with these regulatory guidelines. Third, the index captures formal governance quality rather than de facto enforcement. This distinction is central to our argument. Japanese firms frequently satisfy formal governance criteria while cross-shareholding and main-bank relationships simultaneously limit the practical influence of independent shareholders. It is this gap between formal compliance and effective enforcement that we propose as the mechanism explaining the direction of the governance risk premium. We acknowledge that Japan-specific measures, such as main-bank loan intensity or cross-shareholding ratios, would offer complementary insights and represent a clear direction.
3. Empirical Model and Estimation Issues
To estimate the effects of corporate governance on excess returns on investment, we employ the theoretical framework of the Fama–French six-factor model. The model expresses that excess return on investment is a linear function of six factors: market risk, size premium, value premium, momentum, profitability, and investment factors. Following Costa et al. (2016), we include governance as an additional factor. Thus, excess return on investment in a stock portfolio can be given by:
where represents returns from investment in the portfolio, is the risk-free rate of return, stands for return from the market portfolio (e.g., Dow Jones Index, Nikkei 225 Index, etc.) at time t. Thus, () is the excess return from the specific portfolio, while is the excess return on market portfolio at time t.
Explanatory variable SMBt (small minus big) represents the size (i.e., market equity) factor, while HMLt (high minus low) denotes the value factor, which is the average of the differences between the risk premiums for portfolios with high book-to-market equity ratios (high-value) and risk premiums for portfolios with low book-to-market equity ratios (low-value). Variable RMWt (robust minus weak) stands for the profitability risk premium and will be defined as the difference between the average return of portfolios including businesses with robust profitability and the average return of portfolios containing firms with poor profitability at time t. The investment factor (CMAt, conservative minus aggressive) is the difference between the average returns of the portfolios that have conservative firms and the average returns of the portfolios that have aggressive investment companies. The momentum (UMDt, up minus down) is the difference between the average returns of the winner portfolios and loser portfolios. Lastly, the corporate governance factor (IMPt, institutional minus participatory) is the difference in corporate governance scores between the portfolios with institutional governance and participatory governance. The pairwise correlations among the risk factors are generally low to moderate, suggesting that multicollinearity is unlikely to be a serious concern (Table S8). A clarification is warranted regarding the governance variables. The 13 binary attributes from Singareddy et al. (2018) are not included as separate regressors in the ARIMAX models. Following Singareddy et al. (2018), they are aggregated into a single composite governance score ranging from 0 to 13. That score is then used to classify firms into institutional and participatory groups, and IMP is constructed as the return differential between these groups. Governance therefore enters each regression as one continuous factor. There is no risk of a dummy variable trap. To assess multicollinearity among the seven risk factors, we compute variance inflation factors (VIFs) for each factor in the seven-factor specification. All VIF values (Table S14) are below the conventional threshold of 10, with the highest observed value being 8.70, confirming that multicollinearity is not a serious concern. The intercept indicates Jensen’s alpha and stands for an independently and normally distributed error term.
Financial time series often exhibit autocorrelation, meaning stock prices (especially weekly and monthly) tend to follow trends or cycles rather than move independently. Caporale et al. (2012) confirmed these patterns using ARMA, ARIMA, and ARFIMA models. Conrad and Kaul (1988) found autocorrelation in weekly portfolio returns, while Campbell et al. (2012) demonstrated that past monthly returns influence current ones. This autocorrelation can occur in two ways: first, when returns have delayed effects, for example, today’s size risk premium may influence next month’s portfolio excess returns in an asset pricing model; second, because portfolio returns tend to persist over time due to market behavior or investor psychology. These delayed effects and momentum as a behavior in excess returns have been captured by the residuals and cause autocorrelation problems in an OLS regression model because the model assumes that errors are independent and does not account for delayed effects (i.e., lagged terms) and persistence over time. Therefore, autocorrelation problems occur and induce biased standard errors and inefficient coefficient estimates. After conducting OLS regression on 32 portfolios in Fama–Fama asset pricing models (Tables S9–S11), we identified autocorrelation issues in 12 of the 32 portfolios using the Breusch–Godrey test (Table S12). ARIMA models are widely used to capture such dynamics where AR (autoregressive) terms address any delays and persistence in excess returns including independent variables (if there are any), while MA (moving average) terms catch error patterns left from that time series dynamic. In other words, ARIMA models provide efficient coefficients with reduced variance, hence enhancing accuracy and producing non-inflated standard errors compared to OLS when encountering autocorrelation problems. In addition to this, most of the time OLS regression has been applied with stationary data; however, it might cause an issue if data is not stationary. Financial time series, including stock returns, usually have a type of data series in which mean and variance change over time (Tsay 2010). ARIMA fixes this problem by implementing differencing methods.
A natural question concerns why ARIMAX is preferred over GARCH-type or state-space alternatives. The choice is driven by the nature of the econometric problem. The Breusch–Godfrey test revealed autocorrelation in 12 of 32 portfolios. Autocorrelation is a conditional mean problem, precisely what ARIMAX is designed to address. GARCH-family models, by contrast, target heteroskedasticity and volatility clustering in the conditional variance. These features are well-documented in daily return data, but the case for their presence in monthly portfolio excess returns is considerably weaker. As a robustness check, we ran ARCH-LM tests on the residuals of all ARIMAX models; these diagnostics do not reveal systematic ARCH effects (Table S13). Estimating ARIMAX-GARCH specifications for 32 portfolios across three factor models would also introduce many additional parameters relative to the monthly observation windows available, between 24 and 84 months per portfolio, raising concerns about degrees of freedom. State-space and dynamic factor models impose further structural assumptions that are not warranted by our objective, which is to explain cross-sectional return variation, not to model the full conditional distribution of returns. ARIMAX is therefore the appropriate and parsimonious choice for our setting.
Building on this foundation, we adopted the ARIMAX model, which is an extension of ARIMA. ARIMAX accounts for both serial correlation and the direct influence of risk factors on expected portfolio returns, aligning with the Fama–French asset pricing framework. Shibanda et al. (2024) used a similar ARIMAX-like approach to analyze how size, profitability, investment, and liquidity influence equity premiums on the Nairobi Securities Exchange, finding profitability to be a significant factor. Tadepalli et al. (2021) found ARIMAX more effective than standard models in capturing patterns such as the turn-of-the-month effect on daily returns.
The values of dependent and independent variables in Equation (1) at a particular point in time are likely related to their values in previous time periods, and adding relevant control factors enables the econometric model to capture the impact of risk premiums in this regard. Therefore, a time series specification such as auto-regressive integrated moving average (ARIMAX) is appropriate for estimation purposes (Brockwell and Davis 2016).
Using the same notations for the variables and parameters, the ARIMAX version of the model in Equation (1) can be stated as:
where ρ represents the autocorrelation parameter with order p, and θ denotes the moving-average parameter with order q.
Non-stationarity can be detected by plotting the series or using an augmented Dickey–Fuller test. For non-stationary data, Box et al. (1994) recommend the ‘differencing’ approach to achieving stationarity. For non-constant variance, taking the logarithm or square root of the series may stabilize the variance. Seasonal effects are examined using seasonal subseries plots and multiple box plots. The identification of seasonal autoregressive and moving-average components relies on inspection of autocorrelation (ACF) and partial autocorrelation (PACF) functions.
The main approaches for estimation of the identified ARIMAX model are non-linear least squares and maximum likelihood methods, while the latter is the preferred technique Tsay (2010). For stationary data series, full or unconditional maximum likelihood estimates of the parameters in Equation (2) can be obtained using the Kelman filter via the prediction error decomposition (Hamilton 1994).
By applying the above processes on monthly data for thirty-two different portfolios traded in Tokyo Stock Exchange (TSE), we specify the ARIMAX model in Equation (2) with appropriate orders of autoregressive and moving average terms. We employ the maximum likelihood estimation (MLE) technique to estimate the parameters, evaluate values of the Akaike Information Criterion (AIC), Bayesian Information Criterion (BIC), and Log-Likelihood (LL) for model diagnostics that reflect the goodness of fit, and assess the residuals for white noise features.
4. Data and Analysis
To estimate the models and examine the effects of corporate governance on excess returns on investments, we first utilize monthly data from January 2010 to December 2016. Subsequently, we incorporate the next 12 months of 2017 data to generate out-of-sample forecasts for all companies listed in the Nikkei 225 index of the Tokyo Stock Exchange (TSE). The sample period 2010–2017 is determined by the coverage of the Singareddy et al. (2018) governance dataset. This period is analytically well-suited to our purpose for two reasons. First, it captures the aftermath of the global financial crisis, a period during which governance scrutiny intensified among institutional investors globally. Second, and more importantly, it encompasses the introduction of Japan’s Stewardship Code (2014) and Corporate Governance Code (2015), two landmark regulatory reforms that reshaped expectations for board independence, shareholder engagement, and disclosure among TSE-listed firms. The presence of these reforms within the sample introduces governance variation that directly supports identification of the IMP factor. We acknowledge that the Japanese governance environment has continued to evolve after 2017. The 2021 restructuring of the Tokyo Stock Exchange into Prime, Standard, and Growth segments, along with sustained pressure from domestic and foreign institutional investors, may have altered the governance premium. Whether these developments have moderated the premium documented here, as Japan’s governance practices converge toward international norms, is an empirically open question that future research, using updated panel data, should address.
Data for different variables are sourced from multiple platforms. The stock prices and market returns are obtained from Yahoo Finance database. Risk-free interest rates associated with the Japan 10-year bond yield are derived from the Trading Economics database. Corporate governance attributes of the companies have been acquired from the work done by Singareddy et al. (2018), in which they used Bloomberg, Thomson Reuters, and Prowess-CMIE databases. Following their method, 13 corporate governance provisions were transformed into binary measurements, and the aggregated corporate governance score was generated. As a result, for each company, the corporate governance index has a maximum score of 13 and a minimum score of 0.
Upon compilation, we filter the data by excluding the companies with defective or missing information, as well as companies shares of which were not traded on TSE for at least one month between 2010 and 2017. The final sample consists of 94 companies, all of which have been ranked within the top 100 in terms of market capitalization during the data period (2010–2017). The sample focuses on the largest firms by market capitalization as a deliberate design choice. These firms account for a disproportionately large share of TSE market capitalization and trading volume, making the results particularly relevant for portfolio managers and institutional investors. Restricting the analysis to large and liquid stocks also helps reduce thin-trading concerns that could otherwise confound return calculations. This sample choice is consistent with Fama and French (2014). The authors show that their five-factor model has difficulty explaining the returns of certain small stocks. This suggests that large-firm samples provide a cleaner setting for testing whether a new candidate risk factor, such as corporate governance, is systematically priced. We acknowledge that our sample of 94 firms represents only a small fraction of all TSE-listed companies and that this may introduce selection bias. The governance risk premium documented here may not generalize to small- and mid-cap segments.
4.1. Construction of Portfolios
First, we rank the stocks of 94 companies according to the ascending order of the values of their market equity, book-to-market equity ratio, operating profits, investment strategy, and corporate governance separately. Second, using the median values as the cutoff point, we categorize the companies into two groups for each of the indicators. Companies with a market value smaller than the sample’s median market value are categorized as ‘small’ (S), and companies with a market value higher than the sample’s median market value are categorized as ‘big’ (B). Similarly, companies are categorized into ‘low’ (L) and ‘high’ (H) categories based on the order of their book-to-market equity ratio, ‘weak’ (W) and ‘robust’ (R) groups based on their operating profits, ‘conservatives’ (C) and ‘aggressive’ (A) groups based on their investment profile, and ‘institutional’ (I) and ‘participatory’(P) categories based on their corporate governance scores.
Finally, following Fama and French (2014), we construct thirty-two (2 × 2 × 2 × 2 × 2) different portfolios by distinct combinations of these categories. For example, ‘SLWCI’ represents the portfolio constructed by companies with ‘small’ market capital (S), ‘low’ book-to-market equity ratio (L), ‘weak’ operating profits (W), ‘conservative’ investment (C), and ‘institutional’ governance (I). On the other hand, ‘BHRAP’ represents the portfolio with companies that have ‘big’ market capital (B), ‘high’ book-to-market equity ratio (H), ‘robust’ operating profits (R), ‘aggressive’ investment (A), and ‘participatory’ government (P).
The low rate of governance-category switching warrants discussion. The IMP factor is identified through cross-sectional return differences between the institutional and participatory groups in each period. This approach is analogous to how Fama and French identify SMB and HML. Time variation in the factor derives from changes in group-level returns period by period, not from individual firms changing classification. The 35 firms that did transition contribute to variation in portfolio composition over time, which enriches the factor, but they are not its primary source of identification. The directional asymmetry, i.e., improvement far more common than deterioration, is consistent with the regulatory momentum created by Japan’s Corporate Governance Code (2015). It reflects the literature’s finding that governance in Japan tends to improve gradually rather than to reverse. A higher transition rate would strengthen within-firm identification; the constraint here is inherent in the institutional stability of Japanese corporate ownership during this period. Despite this limitation, the cross-sectional variation in governance classification across 94 firms each year provides sufficient variation to identify the governance risk premium, as evidenced by the significance of IMP in 21 of 32 portfolios.
The number of firms in each portfolio during 2010–17 ranges from 0 to 13 which are listed in Table S1 to conserve space. Notably, some portfolios do not consist of any firms in some years, but none are empty in all the years.
4.2. Measurement of Risk Factors
The market risk factor and the additional asset pricing factors, such as size (SMB), value (HML), profitability (RMW), investment (CMA), and momentum (UMD), are constructed following the methodology of Fama and French (2018). The SMB factor is computed as the average return difference between small-cap and big-cap portfolios. The HML factor represents the average return difference between high and low book-to-market portfolios. The RMW factor is the difference between the average returns of firms with robust and weak profitability. The CMA factor captures the return spread between conservative and aggressive investment firms. The momentum (UMD) factor is obtained as the difference between the average return of past winner portfolios and that of past loser portfolios.
Following Singareddy et al. (2018), we classify firms with governance scores between 0 and 6 (0 ≤ G ≤ 6) as institutional and firms with scores between 7 and 13 (7 ≤ G ≤ 13) as participatory. We construct the corporate governance factor (IMP) as the return differential between the portfolio of institutional firms and the portfolio of participatory firms.
4.3. Summary Statistics
Table 2 shows the mean, standard deviation, minimum, and maximum values of the dependent and independent variables. In general, small-sized portfolios realized higher excess returns than big market-cap portfolios. The average excess returns were the highest (2.4%) for the BLWAP portfolio and lowest for the SHRAP portfolio. Among the portfolios with small-sized firms, SLWCP earned the highest average excess returns (2.2%), while BHWAP earned the lowest average excess returns (−1.2%) among the big-market firms. On average, portfolios with small firms earned higher excess returns (0.73% per month) than portfolios with large firms (0.36% per month). This result of size effect is consistent with the finding of Fama and French (1993) that small-sized firms outperform large-sized firms in terms of total average return.
Table 2.
Summary statistics of dependent and independent variables.
The average excess returns of the portfolios with low-value firms (0.80%) are higher than the portfolios with high-value firms (0.30%). The difference is larger for the portfolios with big-size firms than portfolios with small-size firms. The observed value effect is conflicting with the evidence presented by Fama and French (2014) but consistent with the findings of Sheth and Lim (2017) and Meyers (2010), who found that companies with low book-to-market ratio (i.e., growth stocks) tend to perform better than the companies with high book-to-market ratio (i.e., value stocks).
The average excess returns of the portfolios constructed by firms with weak operating profits (0.76%) is higher than the portfolios constructed by firms with robust operating profits (0.37%). This result is consistent with recent literature (Kubota and Takehara 2017).
The average excess returns of portfolios constructed by firms with conservative investment (0.69%) is higher than the portfolios constructed by the firms with aggressive investment (0.41%). This finding is congruous to that of Kubota and Takehara (2017) and Fama and French (2014).
The average excess returns of the portfolios constructed by firms with participatory governance (0.58%) is slightly higher than the portfolios constructed by firms with institutional governance (0.51%). The difference is positive for the portfolios with small-sized firms, while the difference is negative for the portfolios with big-sized firms. Notably, both the highest and lowest average excess returns were secured by the portfolios constructed by firms with participatory governance.
Additionally, the average monthly excess returns for the risk premiums are 0.2%, 0.3%, −0.2%, −0.1%, 0.4%, 0.4%, and 1.5% for the market, size, value, profitability, investment, momentum, and corporate governance factors, respectively. Therefore, it can be stated that the average excess return of the corporate governance risk premium is bigger than any other factor in the model.
The governance factor (IMP) displays markedly higher volatility than the other non-market factors. This elevated volatility is largely attributable to the construction of IMP as a long–short return differential between two groups of portfolios and does not reflect data errors. Detailed discussion of this feature is provided in the footnote to Table 2.
4.4. Identification of the Model
Identification of the time series model in Equation (2) includes making each data series stationary and removing seasonality. Following Box et al. (1994), we take the first difference of each data series to achieve stationarity and include seasonal autoregressive and moving average terms in the model.
To check if the differenced data are stationary, we first perform the trend and correlation analysis of each series. Figure 1 and Figure 2 depict the trends and a correlation analysis of the first-difference excess returns for portfolios SLRCP and BHWAI, respectively. The plots for autocorrelation function (ACF, lower-left) and partial autocorrelation function (PACF, lower-right) suggest that the time series excess return for portfolios SLRCP and BHWAI exhibits stationarity, characterized by a consistent mean and variance over time. The time series does not generate any apparent patterns associated with heteroscedasticity, trend, or seasonality. The ACF and PACF plots indicate that the current values of the excess returns of the portfolios are correlated with not just their own value at previous times in the series but also with times after the effects of previous values have been taken away. The same analysis was conducted for the remaining portfolios (Supplementary Figures Section S1). Moreover, the portmanteau (Q) statistics show a significant relationship between lags after differencing as well (not presented to conserve space).
Figure 1.
Trend and correlation analysis of first-differenced excess returns for portfolio SLRCP.
Figure 2.
Trend and correlation analysis of first-differenced excess returns for portfolio BHWAI.
The same graphical analysis and statistical test results also indicate that the first differenced data series for the dependent and explanatory variables are stationary (see Table S2).
As the final step for checking stationarity, we perform the Augmented Dickey–Fuller (ADF) and Phillips–Perron (P-P) unit root tests. The unit root test results indicate that all data series, including SLRCP and BHWAI, are stationary (Tables S3 and S4).
The diagnostics suggest that an ARIMAX model would be appropriate for estimation and forecasting. To determine the orders of the autoregressive and moving average terms of the ARIMAX (p, I, q) processes with differencing order I = 1, we use the autocorrelation function (ACF) and partial autocorrelation function (PACF) of each time series. Employing the Akaike Information Criterion (AIC) and Bayesian Information Criterion (BIC), the autoregressive order (p) is determined by the number of significant PACF values, while the moving average order (q) is determined by the number of significant ACF values. The appropriate orders of the lags for the ARIMAX specifications for all 32 portfolios (Table S5) are examined in the Fama–French five-factor, Fama–French six-factor, and seven-factor asset pricing models.
5. Estimation Results
Upon identification of the ARIMAX (p, I, q) model for each portfolio, the MLE technique is employed for estimation of the Fama–French five-factor, Fama–French six-factor, modified six-factor, and seven-factor asset pricing models.
In addition to these factors, two interaction variables, between value and profitability and value and momentum factors, are included in each model to account for multicollinearity among the factors.
5.1. Results from the Fama–French Five-Factor Model
Table 3 presents the estimated coefficients of the Fama–French five-factor asset pricing model (excluding the momentum and governance factors) for the 32 portfolios. The values of the Akaike Information Criterion (AIC), Bayesian Information Criterion (BIC), and log-likelihood (LL) are reported in the final columns of Table 3, Table 4 and Table 5. All three statistics confirm that the identified ARIMAX models fit the data well. AIC and BIC consistently favor parsimonious specifications, and their rankings are consistent across portfolios, confirming that model selection is not sensitive to the choice of information criterion. The estimated values of intercepts for 4 out of 32 portfolios are significantly different from zero (two positive and two negative).
Table 3.
Estimated ARIMAX (p, I, q) model results for the Fama–French five-factor asset pricing model for 32 portfolios.
Table 4.
Estimated ARIMAX (p, I, q) model results for the Fama–French six-factor asset pricing model for 32 portfolios.
Table 5.
Estimated ARIMAX (p, I, q) model results for the seven-factor asset pricing model for 32 portfolios.
The third column of Table 3 shows that the coefficients for the market risk factor are positive and highly significant for all portfolios. This result validates the theoretical prediction and previous empirical findings that portfolio returns are positively associated with market movement and market returns have a significant influence on excess return (Susanti 2013).
As the fourth column of Table 3 shows, out of the 16 portfolios with small-sized (big-sized) firms, the coefficients for the size factor (SMB) are found to be positive and significant for 8 (0) portfolios, while they are found to be negative and significant for 1 (8) portfolio. This finding validates the theoretical prediction as well as previous empirical findings that excess returns decline as firm size grows (Hawawini and Keim 1995). Notably, the size effect is the highest (+1.98) for the portfolio constructed by small-sized, high-value, robust-profitability firms with aggressive investment strategy and participatory governance (SHRAP).
On the other hand, the size effect is the lowest (−1.85) for the portfolio constructed by big-sized, low-value, weak-profitability firms with conservative investment strategy and institutional governance (BLWCI). Pairwise comparisons of the portfolios constructed by small-sized (large-sized) firms suggest that the size effect is considerably larger (smaller) with participatory governance for the majority.
Irrespective of firm size, the value effects are positive (negative) for the portfolios with high-value (low-value) firms (see the fifth column of Table 3). Estimated coefficients for the value factor (HML) are positive and significant for 14 of 16 portfolios constructed by firms with high book-to-market equity ratios, whereas the others are not statistically different from zero. On the other hand, estimated coefficients for the value factor (HML) are positive (negative) and significant for 7 (2) of 16 portfolios with low book-to-market equity ratio firms, while the other coefficients are not statistically different from zero. Notably, the value effect is the highest (+1.99) for the portfolio constructed by big-sized, high-value, robust-profitability firms with aggressive investment strategy and participatory governance (BHRAP). The value effect is the lowest (−1.07) for the portfolio constructed by big-sized, low-value, weak-profitability firms with aggressive investment approach and participatory governance (BLWAP). This result also supports theoretical prediction and previous empirical findings that high-value portfolios are likely to capture more excess returns than low-value portfolios (Daniel et al. 2001; Carvalhal and Nobili 2011).
Further comparisons of the estimated coefficients for the value factor (HML) indicate that the value effect is substantially higher for all high-value firms with participatory governance than those with proprietary or institutional governance. On the other hand, the value effect is lower (higher) for 5 (2) of 8 portfolios with low-value firms with participatory governance (5 of 8).
Thus, shareholders’ participation in the governance of the high-value firms positively influences the value effect on excess returns, while the effect is negative for most of the low-value firms.
The coefficient estimates for the profitability factor (RMW) indicate that the effect of profitability on excess returns is non-negative for the portfolios with robust-profitability firms but non-positive for the portfolios with weak-profitability firms. As shown in the sixth column of Table 3, the coefficient is positive and significant for 8 of 16 portfolios with robust-profitability firms, negative (positive) and significant for 6 (1) of 16 portfolios with weak-profitability firms, and not statistically different from zero for the rest of the portfolios. This result is congruent to the prediction and previous findings that robust-profitability firms generate higher returns than weak-profitability firms in general (Fama and French 2014). This result is irrespective of the governance structure of the firms.
As the coefficient estimates for the investment factor (CMA) reflect, the effect of investment approach on excess returns is non-negative for the portfolios with conservative firms, while it is non-positive for the portfolios with aggressive firms. The coefficient is positive and significant for 13 of 16 portfolios with conservative firms, negative and significant for 6 of 16 portfolios with aggressive firms, and not statistically different from zero for the rest of the portfolios (see the seventh column of Table 3). Thus, conservative investment approaches are likely to result in greater excess returns. This effect is evident across portfolios irrespective of the governance structure of the underlying firms.
The estimated coefficients for the interaction between value and profitability factors are positive and significant for 6 portfolios, negative and significant for 3 portfolios, and not statistically different from zero for the rest.
The coefficients for the interaction between value and momentum factors are positive and significant for 4 portfolios, negative and significant for 2 portfolios, and not statistically different from zero for the rest. While no pattern of interaction effects is observed, the significant coefficients for the interaction variables need to be used to calculate the net effects of the related factors on excess returns and predictions from the models.
5.2. Results from the Fama–French Six-Factor Model
To examine if the momentum risk factor is important for explaining the variations in excess returns from investments in TSE, we examine the Fama–French six-factor model. Table 4 presents the estimated coefficients from the ARIMAX (p, I, q) regressions for the 32 portfolios. The results demonstrate that 3 out of 32 portfolios have intercept values that are significantly different from zero (two positive, one negative).
As shown in the eighth column of Table 4, the coefficient for the momentum factor (UMD) is negative and significant for only 4 of the 16 portfolios with small firms and another 4 of the 16 portfolios with large firms. Most of the other momentum coefficients are negative but not statistically different from zero. This result is in contradiction to the theoretical prediction and previous empirical findings for developed as well as developing markets that purchasing stocks that have gained value (i.e., winners or up) and selling those that have lost value (i.e., losers or down) in recent months are likely to give positive returns (Carhart 1997; Novak 2021). Apparently, that is not the case for TSE.
Notably, excess returns increase with momentum as the portfolios replace small firms with weak profitability and institutional governance by small firms with weak profitability but participatory governance. This pattern, however, is not observed for the portfolios with big firms or the ones with small firms with robust profitability.
Pairwise comparisons of the estimated coefficients of the Fama–French six-factor model to those of the Fama–French five-factor model indicates that inclusion of the momentum risk factor (UMD) does not change the other results. The magnitudes of the coefficients change, while the significance of only 29 (of 256) coefficients changes—13 of the coefficients become significant, while the other 16 become insignificant (excluding momentum risk premium). The inclusion of the UMD factor in the model slightly improves (worsens) model fitness for 14 (18) of the 32 portfolios. Model performance further improves when we modify the Fama–French six-factor model by replacing the momentum factor by governance factor (Table S6).
5.3. Results from the Seven-Factor Model
Finally, we run the identified ARIMAX (p, I, q) regressions for each portfolio including the governance risk factor (IMP) as an additional variable in the Fama–French six-factor model. Table 5 presents the estimated coefficients of this seven-factor asset pricing model for the 32 portfolios. The inclusion of governance variable in the model slightly changes the magnitudes of the coefficients, while it alters the significance of only 36 (of 288) coefficients as compared to those of the six-factor model—17 coefficients become significant, and 19 coefficients become insignificant. These changes do not alter the inferences of the five-factor or six-factor model results. Notably, the effect of momentum risk factor becomes less significant as compared to that in the Fama–French six-factor model; the momentum coefficient is negative and significant for only four portfolios. More importantly, the effect of governance structure of the firms on excess returns becomes apparent from the associated coefficient estimates.
The estimated coefficients of the governance factor (IMP) are found to be significant for 21 of 32 portfolios, which is the highest across the variables, excluding the market risk premium (i.e., SMB(19), HML(19), RMW(12), CMA(18), UMD(6), Int-1(9), and Int-2(6)). When considering slope coefficients at the 1% level, corporate governance risk premium (i.e., IMP) has 14 statistically significant coefficients, compared to 10 for size, 13 for value, 9 for profitability, 11 for investment, and 2 for momentum risk premiums. Of the 16 portfolios constructed by firms with institutional governance, the coefficient is positive and significant for 10 portfolios, while it is negative and significant for 1 portfolio. On the other hand, of the other 16 portfolios constructed by firms with participatory governance, the coefficient is positive and significant for 1 portfolio, while it is negative and significant for 9 portfolios. Also, pairwise comparisons of portfolios that differ only in governance structure of the firms indicate that excess returns decrease as firms with institutional governance are replaced by firms with participatory governance. That is the case for 5 of 8 pairs of portfolios with small-sized firms and 6 of 8 pairs of portfolios with big-sized firms. This result holds even when we modify the Fama–French six-factor model by replacing the momentum factor with the governance factor (Table S6).
The result that excess returns decrease with shareholders’ participation in the governance of the firms in TSE contrasts with the previous findings from the stock exchanges in the U.S. (Giroud and Mueller 2011), the U.K. (Affes and Jarboui 2023), and Hong Kong (Cheung et al. 2007). However, this result is in line with the findings from developing markets such as Brazil (Carvalhal and Nobili 2011), Thailand (Connelly et al. 2012), and Indonesia (Kurniati 2019). The fact that Japanese corporate law gives shareholders very strong formal legal rights, but cross-shareholding and stable long-term ownership relationships make it hard to put these rights into practice, means that both domestic and foreign investors are not very well protected (Goto 2014). In this setting, participatory governance can function as a partial substitute for weak legal investor protection by increasing formal transparency and board oversight. From an industrial ecology perspective, Japan’s hybrid system has evolved to allow more influence from outside shareholders, but the real power to monitor remains heavily shaped by companies tied through cross-shareholding and other business corporations that hold large blocks of shares. External shareholders have obtained a voice, but they do not yet hold the main power in practice (Miyajima 2022; Renou et al. 2023). Since relational networks and insider blockholdings continue to play a major role, the additional monitoring benefits from participatory governance mechanisms, such as independent directors or outside shareholder pressure, are limited (Renou et al. 2023).
From a corporate operation perspective, this creates a situation where participatory firms bear formal compliance costs and procedural burdens, but without meaningful improvements in actual managerial accountability or firm performance. As a result, participatory governance provides only modest risk reduction for investors. When firms adopt stronger corporate governance practices, investors perceive a lower risk of managerial opportunism and expropriation. As a result, they require lower expected returns, reflecting a lower cost of equity (La Porta et al. 2002). However, participatory governance cannot fully replace strong legal investor protection. Therefore, even well-governed firms in Japan still carry relatively higher risk compared to firms in countries with strong legal environments.
This interpretation generates a testable prediction: the governance premium should be attenuated in firms with greater main-bank dependency or higher cross-shareholding ratios. Formally testing this prediction using firm-level interaction terms is an important direction for future research. The present study establishes the existence and magnitude of the premium and offers an institutional interpretation; empirical verification of the moderating role of bank-based monitoring awaits richer data.
As noted in the Introduction, Japan operates within a hybrid financial system that retains important bank-oriented institutional features despite decades of market-oriented reform. Three structural characteristics distinguish Japan’s governance environment from other developed markets: (1) managerial control exercised through cross-shareholding, (2) limited effective shareholder influence, and (3) a financing model that remains more bank-dependent than those of the United States or United Kingdom. These features persist even as Japan’s capital markets have expanded and deepened, and they help explain why governance risk is priced differently on the Tokyo Stock Exchange.
Finally, the highlighted AIC, BIC, and LL values in Table 3, Table 4 and Table 5 indicate which model fits the best for the portfolios. The seven-factor model has the lowest AIC values across 18 distinct portfolios, whereas the Fama–French five-factor and Fama–French six-factor models have the lowest AIC values for 8 and 6 different portfolios, respectively. Notably, the differences in AIC values are negligible. Thus, in terms of goodness of fit, none of these factor models exhibits absolute superiority over the others. For further comparison of model performance, we use the estimation results to forecast excess returns of the portfolios.
6. Forecasting
Using the ARIMAX estimates from the three models, we perform out-of-sample forecasting. Monthly data from 2010 to 2016 are used to estimate the models, while monthly excess returns for 2017 are forecasted. 2017 excess returns for 2 of the 32 portfolios were not available. The forecasts for the three models are compared to the actual values as well as across the models. However, we acknowledge that the out-of-sample period is limited to only 12 months (2017) due to data availability. This relatively short forecast horizon limits the strength of conclusions that can be drawn regarding predictive performance. Therefore, the forecasting results should be interpreted with caution and are presented only as a supplementary robustness check.
When selecting an appropriate model for forecasting excess returns from each portfolio, we consider three specific criteria: correlated lagged values, AIC values, and white noise residuals. In the event that these criteria are not met, we repeat the selection process and estimation procedure to identify possible candidates for the forecasting model. Furthermore, we investigate forecasting performance of the models by comparing mean absolute error (MAE) and root mean square error (RMSE), and symmetric mean absolute percentage error (sMAPE) for each portfolio.
The resulting MAE, RMSE, and sMAPE values for three different asset pricing models are displayed with highlighted lowest values across the models for each portfolio (see Table S7). Based on the relative MAE, RMSE, and sMAPE values, the Fama–French five-factor model appears to be the most suitable for forecasting the excess returns of 18 out of the 30 portfolios for MAE and RMSE and 15 out of 30 portfolios for sMAPE. The Fama–French six-factor model is the most effective for another 5 portfolios and 4 portfolios for sMAPE, while the seven-factor model best forecasts the performance of the remaining 7 portfolios and 11 portfolios for sMAPE. However, as Table S7 shows, the differences in the MAE and RMSE values across the models are not trivial.
Figure 3, Figure 4 and Figure 5 display the actual monthly excess returns and forecasted excess returns from the three models for portfolios SLRAI (i.e., firms with small size, low value, robust profitability, aggressive investment, and institutional governance), BLRAP (i.e., firms with big size, low value, robust profitability, aggressive investment, and participatory governance), and BLRAI (i.e., firms with big size, low value, robust profitability, aggressive investment, and institutional governance), respectively. As highlighted in the figures, the Fama–French five-factor, Fama–French six-factor, and seven-factor models give the best forecasts for these portfolios. Similar figures for other portfolios are available in the supplementary materials (Supplementary Figures Section S2). We complement MAE and RMSE with sMAPE (Table S7). The sMAPE results are consistent with MAE and RMSE: the five-factor model provides the best forecasts for most portfolios, while the seven-factor model performs best for a smaller subset, primarily those for which IMP is most statistically significant in estimation.
Figure 3.
Out-of-sample forecast of portfolio BHRCP for 3 different asset pricing models.
Figure 4.
Out-of-sample forecast of portfolio SLWCP for 3 different asset pricing models.
Figure 5.
Out-of-sample forecast of portfolio BLRAP for 3 different asset pricing models.
In general, our findings indicate that neither of the three models dominate the others while forecasting. Given the insignificant difference in the MAE and RMSE values, any of these models can be used for forecasting. Since the seven-factor asset pricing model includes all possible factors, it could be preferred over the other models. Note that ARIMAX models are not efficient in forecasting long-term outcomes (Du 2022; Wu et al. 2023).
The forecasting results carry practical implications for portfolio planning and diversification. The fact that the five-factor model, which excludes both governance and momentum, gives the best out-of-sample forecasts for most portfolios suggests a trade-off. Adding governance as a factor improves in-sample explanatory power but does not always translate into superior short-horizon return prediction. This is consistent with the broader finding that in-sample fit and out-of-sample predictability can diverge in time-series models.
The portfolios for which the seven-factor model forecasts are best concentrated among institutional-governance firms with small capitalization, conservative investment, and low book-to-market ratios. Portfolio managers who wish to exploit the governance risk premium should focus on this segment, specifically, long positions in institutional-governance, small-cap, conservative-investment portfolios, offset by short positions in participatory-governance counterparts.
From a diversification standpoint, the governance factor adds cross-sectional return variation not captured by the standard Fama–French five-factor set. The return patterns of governance-sorted portfolios are not fully explained by size, value, profitability, and investment factors. Governance-aware portfolio construction therefore offers diversification benefits beyond conventional factor strategies.
7. Conclusions
This article empirically examines the role of corporate governance on returns from investment in the stocks traded on the Tokyo Stock Exchange. A binary governance indicator (i.e., institutional vs. participatory) for each company is constructed based on various attributes of corporate governance, which is used as an additional factor in the Fama–French six-factor model. Using time-series data on excess returns and other attributes of the companies obtained from reliable sources, 32 typical portfolios are constructed considering different combinations of firm size (i.e., market equity), value (i.e., book-to-market equity ratio), profitability strength, investment strategy, and governance structure. As the values of both dependent and independent variables are likely related across time periods, an auto-regressive integrated moving average (ARIMAX) model is specified and identified for each portfolio with appropriate orders of autoregressive and moving average terms. The identified ARIMAX (p, I, q) models are estimated employing the maximum likelihood estimation (MLE) technique for the Fama–French five-factor, six-factor, and seven-factor models. Future excess returns are forecasted using the model estimates and compared to the actual outcomes. We also utilized OLS regression approach for the Fama–French five-factor, six-factor, and seven-factor models to display coefficient estimate differences from ARIMAX model and identified whether autocorrelation problem exist across the 32 portfolios.
The most important result from the model estimations is that corporate governance structure plays a crucial role in explaining stock returns of listed companies on the Tokyo Stock Exchange, with lower shareholder participation associated with greater excess returns. Our findings align with agency theory. Moreover, the effect of governance appears to be stronger than any other risk premium apart from the market risk factor. The strong negative effect of shareholders’ participation in corporate governance implies that, with other considerations the same, investments in stocks with low governance scores are likely to result in higher returns. Furthermore, an investment strategy may maximize average return by longing firms with low corporate governance scores and shorting companies with high scores.
Another important result is that the governance structure of the underlying companies also influences the size effect and value effect on investment returns. In particular, the size effect is larger (smaller) for the companies with small (large) market equity and participatory governance as compared to that for the small (large) firms with institutional governance. Also, shareholders’ participation in the governance of the companies with high book-to-market equity ratios positively influences the value effect on excess returns but negatively influences the value effect for the companies with low book-to-market equity ratios. Such effects were not reported in previous literature. These attributes may be specific to the stock market of Japan.
Results from both the Fama–French six-factor and seven-factor models indicate that the impact of momentum on investment returns is negligible in the Japanese market. A negative effect is observed for a small percentage of portfolios, while theory as well as empirical evidence suggests a positive effect. Notably, substituting the momentum factor with the governance factor enhances model performance without significantly altering other estimates. Thus, momentum risk can be disregarded in investment decision making within the Japanese stock market.
The other results are consistent with theoretical predictions of asset pricing models as well as empirical findings of previous literature. First, the effect of the market risk factor on the Tokyo Stock Exchange is positive and highly significant for investment returns. Second, the size effect on investment returns is negative, i.e., the rate of returns on investment declines as the volume of market equity of stock grows. Third, stocks with high book-to-market equity ratios capture higher returns than stocks with low book-to-market equity ratios. Fourth, stocks with robust profitability generate higher returns than stocks with weak profitability. Fifth, conservative investment approaches are likely to secure higher returns than aggressive investment strategies.
Out of sample forecasting based on the estimates does not indicate superiority of one model over the others, although ARIMAX specifications are not known to be efficient in forecasting long-term outcomes. While any of these factor models can be used for forecasting, the seven-factor model may be preferred as it includes all potential risk factors.
Future research could directly test the proposed moderating mechanism by including cross-shareholding ratios and main-bank loan intensity as interaction variables in the governance–return relationship. This would provide stronger empirical support for the institutional interpretation offered here. Additionally, a limitation of this study is that the governance data end in 2017. Japan’s corporate governance environment has changed substantially since then, including the 2021 TSE market restructuring. Whether the institutional governance premium documented here has narrowed as Japan’s formal and de facto governance practices have converged remains an open question that could be addressed with updated governance panel data.
Finally, this study makes three contributions to the literature on corporate governance and asset pricing. First, while most existing Japan-focused studies examine corporate governance either through firm-level regressions or by constructing governance-sorted portfolios without incorporating it as a risk factor, this study adopts a more comprehensive approach by constructing governance-sorted portfolios using annually updated governance scores and incorporating corporate governance as an additional risk factor in the Fama–French asset pricing models. Second, this study examines the pricing of governance risk specifically in Japan’s hybrid financial system, where formal governance rules often do not translate into real shareholder protection. Third, the results show that governance structure influences not only average returns but also the size and value effects in a manner not previously documented in Japanese markets. Overall, these findings suggest that the effect of shareholders’ participation in corporate governance does not necessarily lead to higher investment returns across all markets irrespective of legal and institutional settings or corporate culture.
Supplementary Materials
The following supporting information can be downloaded at: https://www.mdpi.com/article/10.3390/risks14070171/s1.
Author Contributions
Conceptualization, A.K.; Methodology, A.K.; Software, A.K.; Validation, A.K. and S.M.R.; Investigation, A.K.; Resources, A.K.; Data curation, A.K.; Writing—original draft, S.M.R.; Writing—review & editing, S.M.R.; Visualization, A.K.; Supervision, S.M.R.; Project administration, S.M.R. All authors have read and agreed to the published version of the manuscript.
Funding
This research received no external funding.
Data Availability Statement
The data that support the findings of this study are available on request from the authors. The data are not publicly available due to their containing information that could compromise the privacy of research participants.
Conflicts of Interest
The authors declare no conflicts of interest.
References
- Affes, Wajdi, and Anis Jarboui. 2023. The impact of corporate governance on financial performance: A cross-sector study. International Journal of Disclosure and Governance 20: 374–94. [Google Scholar] [CrossRef] [Scilit]
- Akerlof, George Arthur. 1970. The Market for Lemons: Quality Uncertainty and the Market Mechanism. Quarterly Journal of Economics 84: 488–500. [Google Scholar] [CrossRef] [Scilit]
- Aman, Hiroyuki, and Pascal Nguyen. 2008. Do Stock Prices Reflect the Corporate Governance Quality of Japanese Firms? Journal of the Japanese and International Economies 22: 647–62. [Google Scholar] [CrossRef] [Scilit]
- Bonn, Ingrid, Toru Yoshikawa, and Phillip Hin Choi Phan. 2004. Effects of board structure on firm performance: A comparison between Japan and Australia. Asian Business & Management 3: 105–25. [Google Scholar] [CrossRef] [Scilit]
- Botosan, Christine Ann. 1997. Disclosure Level and the Cost of Equity Capital. The Accounting Review 72: 323–49. [Google Scholar] [CrossRef] [Scilit]
- Box, George Edward Pelham, Gwilym Meirion Jenkins, and Gregory Charles Reinsel. 1994. Time Series Analysis: Forecasting and Control, 4th ed. Lebanon: Prentice Hall. [Google Scholar]
- Brockwell, Peter John, and Richard A. Davis. 2016. Introduction to Time Series and Forecasting, 3rd ed. Cham: Springer. [Google Scholar]
- Campbell, John Young, Andrew Wen-Chuan Lo, and Archie Craig MacKinlay. 2012. The Econometrics of Financial Markets, 2nd ed. Princeton: Princeton University Press. [Google Scholar]
- Caporale, Guglielmo Maria, Juncal Cuñado, and Luis Alberiko Gil-Alana. 2012. Modelling long-run trends and cycles in financial time series data. Journal of Time Series Analysis 34: 405–21. [Google Scholar] [CrossRef] [Scilit]
- Carhart, Mark Monroe. 1997. On persistence in mutual fund performance. The Journal of Finance 52: 57–82. [Google Scholar] [CrossRef]
- Carvalhal, Andre, and Carolina Nobili. 2011. Does Corporate Governance Matter for Stock Returns? Estimating a Four-factor Asset Pricing Model Including a Governance Index. Quantitative Finance 11: 247–59. [Google Scholar] [CrossRef] [Scilit]
- Chalevas, Constantinos, and Christos Tzovas. 2016. Do Stock Prices Reflect Regulatory Reforms in the Corporate Governance Mechanisms? Corporate Ownership and Control 13: 419–31. [Google Scholar] [CrossRef] [Scilit]
- Cheung, Yan-Leung, J. Thomas Connelly, Piman Limpaphayom, and Lynda Zhou. 2007. Do Investors Really Value Corporate Governance? Evidence From the Hong Kong Market. Journal of International Financial Management and Accounting 18: 86–122. [Google Scholar] [CrossRef] [Scilit]
- CIMA & IFAC. 2004. Enterprise Governance: Getting the Balance Right. London: CIMA and the International Federation of Accountants. [Google Scholar]
- Claessens, Stijn, Simeon Djankov, and Larry Hsien Ping Lang. 2000. The separation of ownership and control in East Asian corporations. Journal of Financial Economics 58: 81–112. [Google Scholar] [CrossRef] [Scilit]
- Connelly, J. Thomas, Piman Limpaphayom, and Nandu Jay Nagarajan. 2012. Form versus substance: The effect of ownership structure and corporate governance on firm value in Thailand. Journal of Banking & Finance 36: 1722–43. [Google Scholar] [CrossRef] [Scilit]
- Conrad, Jennifer, and Gautam Kaul. 1988. Time-Variation in Expected Returns. The Journal of Business 61: 409–25. [Google Scholar] [CrossRef] [Scilit]
- Costa, Hudson Chaves, João Henrique Gonçalves Mazzeu, and Newton Carneiro Affonso Da Costa, Jr. 2016. O Comportamento dos Componentes Da Volatilidade das Ações no Brasil. Brazilian Review of Finance 14: 225–68. [Google Scholar] [CrossRef] [Scilit]
- Dahya, Jay, and John J. McConnell. 2007. Board Composition, Corporate Performance, and the Cadbury Committee Recommendation. Journal of Financial and Quantitative Analysis 42: 535–64. [Google Scholar] [CrossRef] [Scilit]
- Daniel, Kent, Sheridan Titman, and Kuo-Chiang John Wei. 2001. Explaining the cross-section of stock returns in Japan: Factors or characteristics? The Journal of Finance 56: 743–66. [Google Scholar] [CrossRef] [Scilit]
- Donaldson, Lex, and James Herbert Davis. 1991. Stewardship Theory or Agency Theory: CEO Governance and Shareholder Returns. Australian Journal of Management 16: 49–64. [Google Scholar] [CrossRef] [Scilit]
- Du, Yang. 2022. A time series forecasting system based on ARIMA for industrial big data. In Proceedings of SPIE, International Conference on Computer, Artificial Intelligence, and Control Engineering (CAICE 2022). Bellingham: SPIE, vol. 12288, p. 1228805. [Google Scholar] [CrossRef] [Scilit]
- Fama, Eugene Francis, and Kenneth Ronald French. 1993. Common Risk Factors in the Returns on Stocks and Bonds. Journal of Financial Economics 33: 3–56. [Google Scholar] [CrossRef] [Scilit]
- Fama, Eugene Francis, and Kenneth Ronald French. 2014. A Five-factor Asset Pricing Model. Journal of Financial Economics 116: 1–22. [Google Scholar]
- Fama, Eugene Francis, and Kenneth Ronald French. 2018. Choosing Factors. Journal of Financial Economics 128: 234–52. [Google Scholar] [CrossRef] [Scilit]
- Fama, Eugene Francis, and Michael Cole Jensen. 1983. Separation of Ownership and Control. The Journal of Law and Economics 26: 301–25. [Google Scholar] [CrossRef] [Scilit]
- Ferreira, Miguel Almeida, and Paul Anthony Laux. 2005. Corporate Governance, Idiosyncratic Risk, and Information Flow. The Journal of Finance 62: 951–89. [Google Scholar]
- Giroud, Xavier, and Holger M. Mueller. 2011. Corporate Governance, Product Market Competition, and Equity Prices. The Journal of Finance 66: 563–600. [Google Scholar] [CrossRef] [Scilit]
- Gompers, Paul, Joy Ishii, and Andrew Metrick. 2003. Corporate Governance and Equity Prices. The Quarterly Journal of Economics 118: 107–56. [Google Scholar] [CrossRef] [Scilit]
- Goto, Gen. 2014. Legally ‘Strong’ Shareholders of Japan. Michigan Business & Entrepreneurial Law Review 3: 125–64. [Google Scholar] [CrossRef] [Scilit]
- Gray, Philip, and Angel Zhong. 2021. Assessing the Usefulness of Daily and Monthly Asset-pricing Factors for Australian Equities. Accounting and Finance 62: 181–211. [Google Scholar] [CrossRef] [Scilit]
- Grossman, Sanford Jay, and Oliver Simon D’Arcy Hart. 1980. Takeover Bids, the Free-Rider Problem, and the Theory of the Corporation. Bell Journal of Economics 11: 42–64. [Google Scholar] [CrossRef] [Scilit]
- Hamilton, James Douglas. 1994. Time Series Analysis, 1st ed. Princeton: Princeton University Press. [Google Scholar]
- Hamza, Taher, and Nada Mselmi. 2018. Corporate Governance and Equity Prices: The Effect of Board of Directors and Audit Committee Independence. Management International 21: 152–64. [Google Scholar] [CrossRef] [Scilit]
- Hawawini, Gabriel Alfred, and Donald Bruce Keim. 1995. Chapter 17 on the predictability of common stock returns: World-wide evidence. In Handbooks in Operations Research and Management Science. North-Holland: Elsevier. [Google Scholar] [CrossRef] [Scilit]
- Healy, Paul M., and Krishna Gour Palepu. 2001. Information Asymmetry, Corporate Disclosure, and the Capital Markets: A Review of the Empirical Disclosure Literature. Journal of Accounting and Economics 31: 405–40. [Google Scholar] [CrossRef] [Scilit]
- Jensen, Michael Cole. 1986. Agency Costs of Free Cash Flow, Corporate Finance, and Takeovers. American Economic Review 76: 323–29. [Google Scholar]
- Jensen, Michael Cole, and William Hyde Meckling. 1976. Theory of the Firm: Managerial Behavior, Agency Costs and Ownership Structure. Journal of Financial Economics 3: 305–60. [Google Scholar] [CrossRef] [Scilit]
- Klapper, Leora Frances, and Inessa Love. 2003. Corporate governance, investor protection, and performance in emerging markets. Journal of Corporate Finance 10: 703–28. [Google Scholar] [CrossRef] [Scilit]
- Koji, Kojima, Bishnu Kumar Adhikary, and Le Tram. 2020. Corporate governance and firm performance: A comparative analysis between listed family and non-family firms in Japan. Journal of Risk and Financial Management 13: 215. [Google Scholar] [CrossRef] [Scilit]
- Kubota, Keiichi, and Hitoshi Takehara. 2017. Does the Fama and French Five-Factor Model Work Well in Japan? International Review of Finance 18: 137–46. [Google Scholar] [CrossRef] [Scilit]
- Kurniati, Siti. 2019. Stock Returns and Financial Performance as Mediation Variables in the Influence of Good Corporate Governance on Corporate Value. Corporate Governance 19: 1289–309. [Google Scholar] [CrossRef] [Scilit]
- La Porta, Rafael, Florencio Lopez-de-Silanes, Andrei Shleifer, and Robert Vishny. 1999. Investor Protection: Origins, Consequences, and Reform. Cambridge: National Bureau of Economic Research. [Google Scholar] [CrossRef] [Scilit]
- La Porta, Rafael, Florencio Lopez-de-Silanes, Andrei Shleifer, and Robert Ward Vishny. 2002. Investor Protection and Corporate Valuation. Journal of Finance 57: 1147–70. [Google Scholar] [CrossRef] [Scilit]
- Lintner, John. 1965. Security prices, risk, and maximal gains from diversification*. The Journal of Finance 20: 587–615. [Google Scholar] [CrossRef] [Scilit]
- Lohano, Kiran, and Muhammad Kashif. 2019. Testing Asset Pricing Models on the Pakistan Stock Exchange. Business Review 13: 1–19. [Google Scholar] [CrossRef] [Scilit]
- Lombardo, Davide, and Marco Pagano. 2000. Legal determinants of the return on equity. SSRN Electronic Journal [Preprint]. [Google Scholar] [CrossRef] [Scilit]
- Meyers, Robert Allen. 2010. Complex Systems in Finance and Econometrics, 2011th ed. New York: Springer. [Google Scholar]
- Miyajima, Hideaki. 2022. Nihon-gata moderu 2.0 ni mukete: Pāpasu keiei to shoyū kōzō [Toward Japanese Model 2.0: Purpose of business, governance and ownership]. Shōken Anarisuto Jānaru 60: 80–92. (In Japanese) [Google Scholar]
- Miyajima, Hideaki, and Fumiaki Kuroki. 2007. The unwinding of cross-shareholding in Japan: Causes, effects, and implications. In Corporate Governance in Japan: Institutional Change and Organizational Diversity. Edited by Masahiko Aoki, Gregory Jackson and Hideaki Miyajima. New York: Oxford University Press. [Google Scholar]
- Novak, Daniel Georg. 2021. The Fama and French Six-Factor Model–Evidence for the German Market. Master’s thesis, Universidade Catolica Portuguesa, Lisbon, Portugal. Available online: https://ciencia.ucp.pt/en/studentTheses/the-fama-and-french-six-factor-model/ (accessed on 16 May 2026).
- Pugdeepunt, Visarut. 2017. Corporate Governance and Fama-French Five-Factor: Evidence from Stock Exchange of Thailand. Master’s thesis, Thammasat University, Bangkok, Thailand. Available online: https://digital.library.tu.ac.th/tu_dc/frontend/Info/item/dc:92728 (accessed on 16 May 2026).
- Renou, Théo, René Carraz, and Thierry Burger-Helmchen. 2023. Japan’s Corporate Governance Transformation: Convergence or Reconfiguration? Administrative Sciences 13: 141. [Google Scholar] [CrossRef] [Scilit]
- Sato, Ryo, and Fumiko Takeda. 2023. Effects of shareholder proposals on the market value of Japanese firms. International Review of Economics & Finance 86: 320–33. [Google Scholar] [CrossRef] [Scilit]
- Sharpe, William Forsyth. 1964. Capital asset prices: A theory of market equilibrium under conditions of risk*. The Journal of Finance 19: 425–42. [Google Scholar] [CrossRef] [Scilit]
- Sheth, Arnav, and Tee Lim. 2017. Fama-French Factors and Business Cycles. SSRN Electronic Journal. [Google Scholar] [CrossRef] [Scilit]
- Shibanda, George, Tobias Olweny, and Tabitha Nasieku. 2024. Profitability, Investment Factors and Trading Volume Adjustment on Equity Risk Premium an Empirical Evidence from Nairobi Stock Exchange. Journal of Accounting and Finance in Emerging Economies 10: 449–66. [Google Scholar] [CrossRef] [Scilit]
- Silveira, Alexandre Miceli, Lucas Bruno Cerqueira Barros, and Rubens Famá. 2003. Estrutura de governança e valor das companhias abertas brasileiras. Revista de Administração de Empresas 43: 50–64. [Google Scholar] [CrossRef] [Scilit]
- Singareddy, Raja R. R., Shabana Chandrasekaran, Balamurugan Annamalai, and Pratyush Ranjan. 2018. Corporate Governance Data of 6 Asian Economies (2010–2017). Data in Brief 20: 53–56. [Google Scholar] [CrossRef] [Scilit] [PubMed]
- Susanti, Neneng. 2013. Pengujian Fama and French Three Factor Model Pada Perusahaan di Indonesia yang Sahamnya Terdapat di LQ 45 Tahun 2005–2009. Master’s thesis, Indonesian University of Education, Bandung, Indonesia. Available online: http://repository.widyatama.ac.id/handle/123456789/4284 (accessed on 16 May 2026).
- Tadepalli, Meher Shiva, Ravi Kumar Jain, and Bhimaraya A. Metri. 2021. An Enquiry into the Persistence of Turn-of-the-Month Effect on Stock Markets in India: Insights and Perspectives on a Seasonal Anomaly. Business Perspectives and Research 10: 9–26. [Google Scholar] [CrossRef] [Scilit]
- Tsay, Ruey Shiong. 2010. Analysis of Financial Time Series, 3rd ed. Hoboken: Wiley. [Google Scholar]
- Ullah, Wali. 2016. Evolving Corporate Governance and Firms Performance: Evidence From Japanese Firms. Economics of Governance 18: 1–33. [Google Scholar] [CrossRef] [Scilit]
- Wu, Hao, Sheng Chen, and Ying Ding. 2023. Comparison of ARIMA and LSTM for stock price prediction. Financial Engineering and Risk Management 6: 1–7. [Google Scholar] [CrossRef] [Scilit]
- Yao, Tong, Tong Yu, Ting Zhang, and Shaw Chen. 2010. Asset growth and stock returns: Evidence from Asian financial markets. Pacific-Basin Finance Journal 19: 115–39. [Google Scholar]
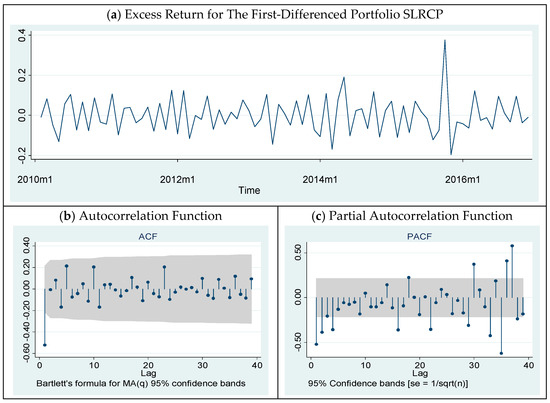
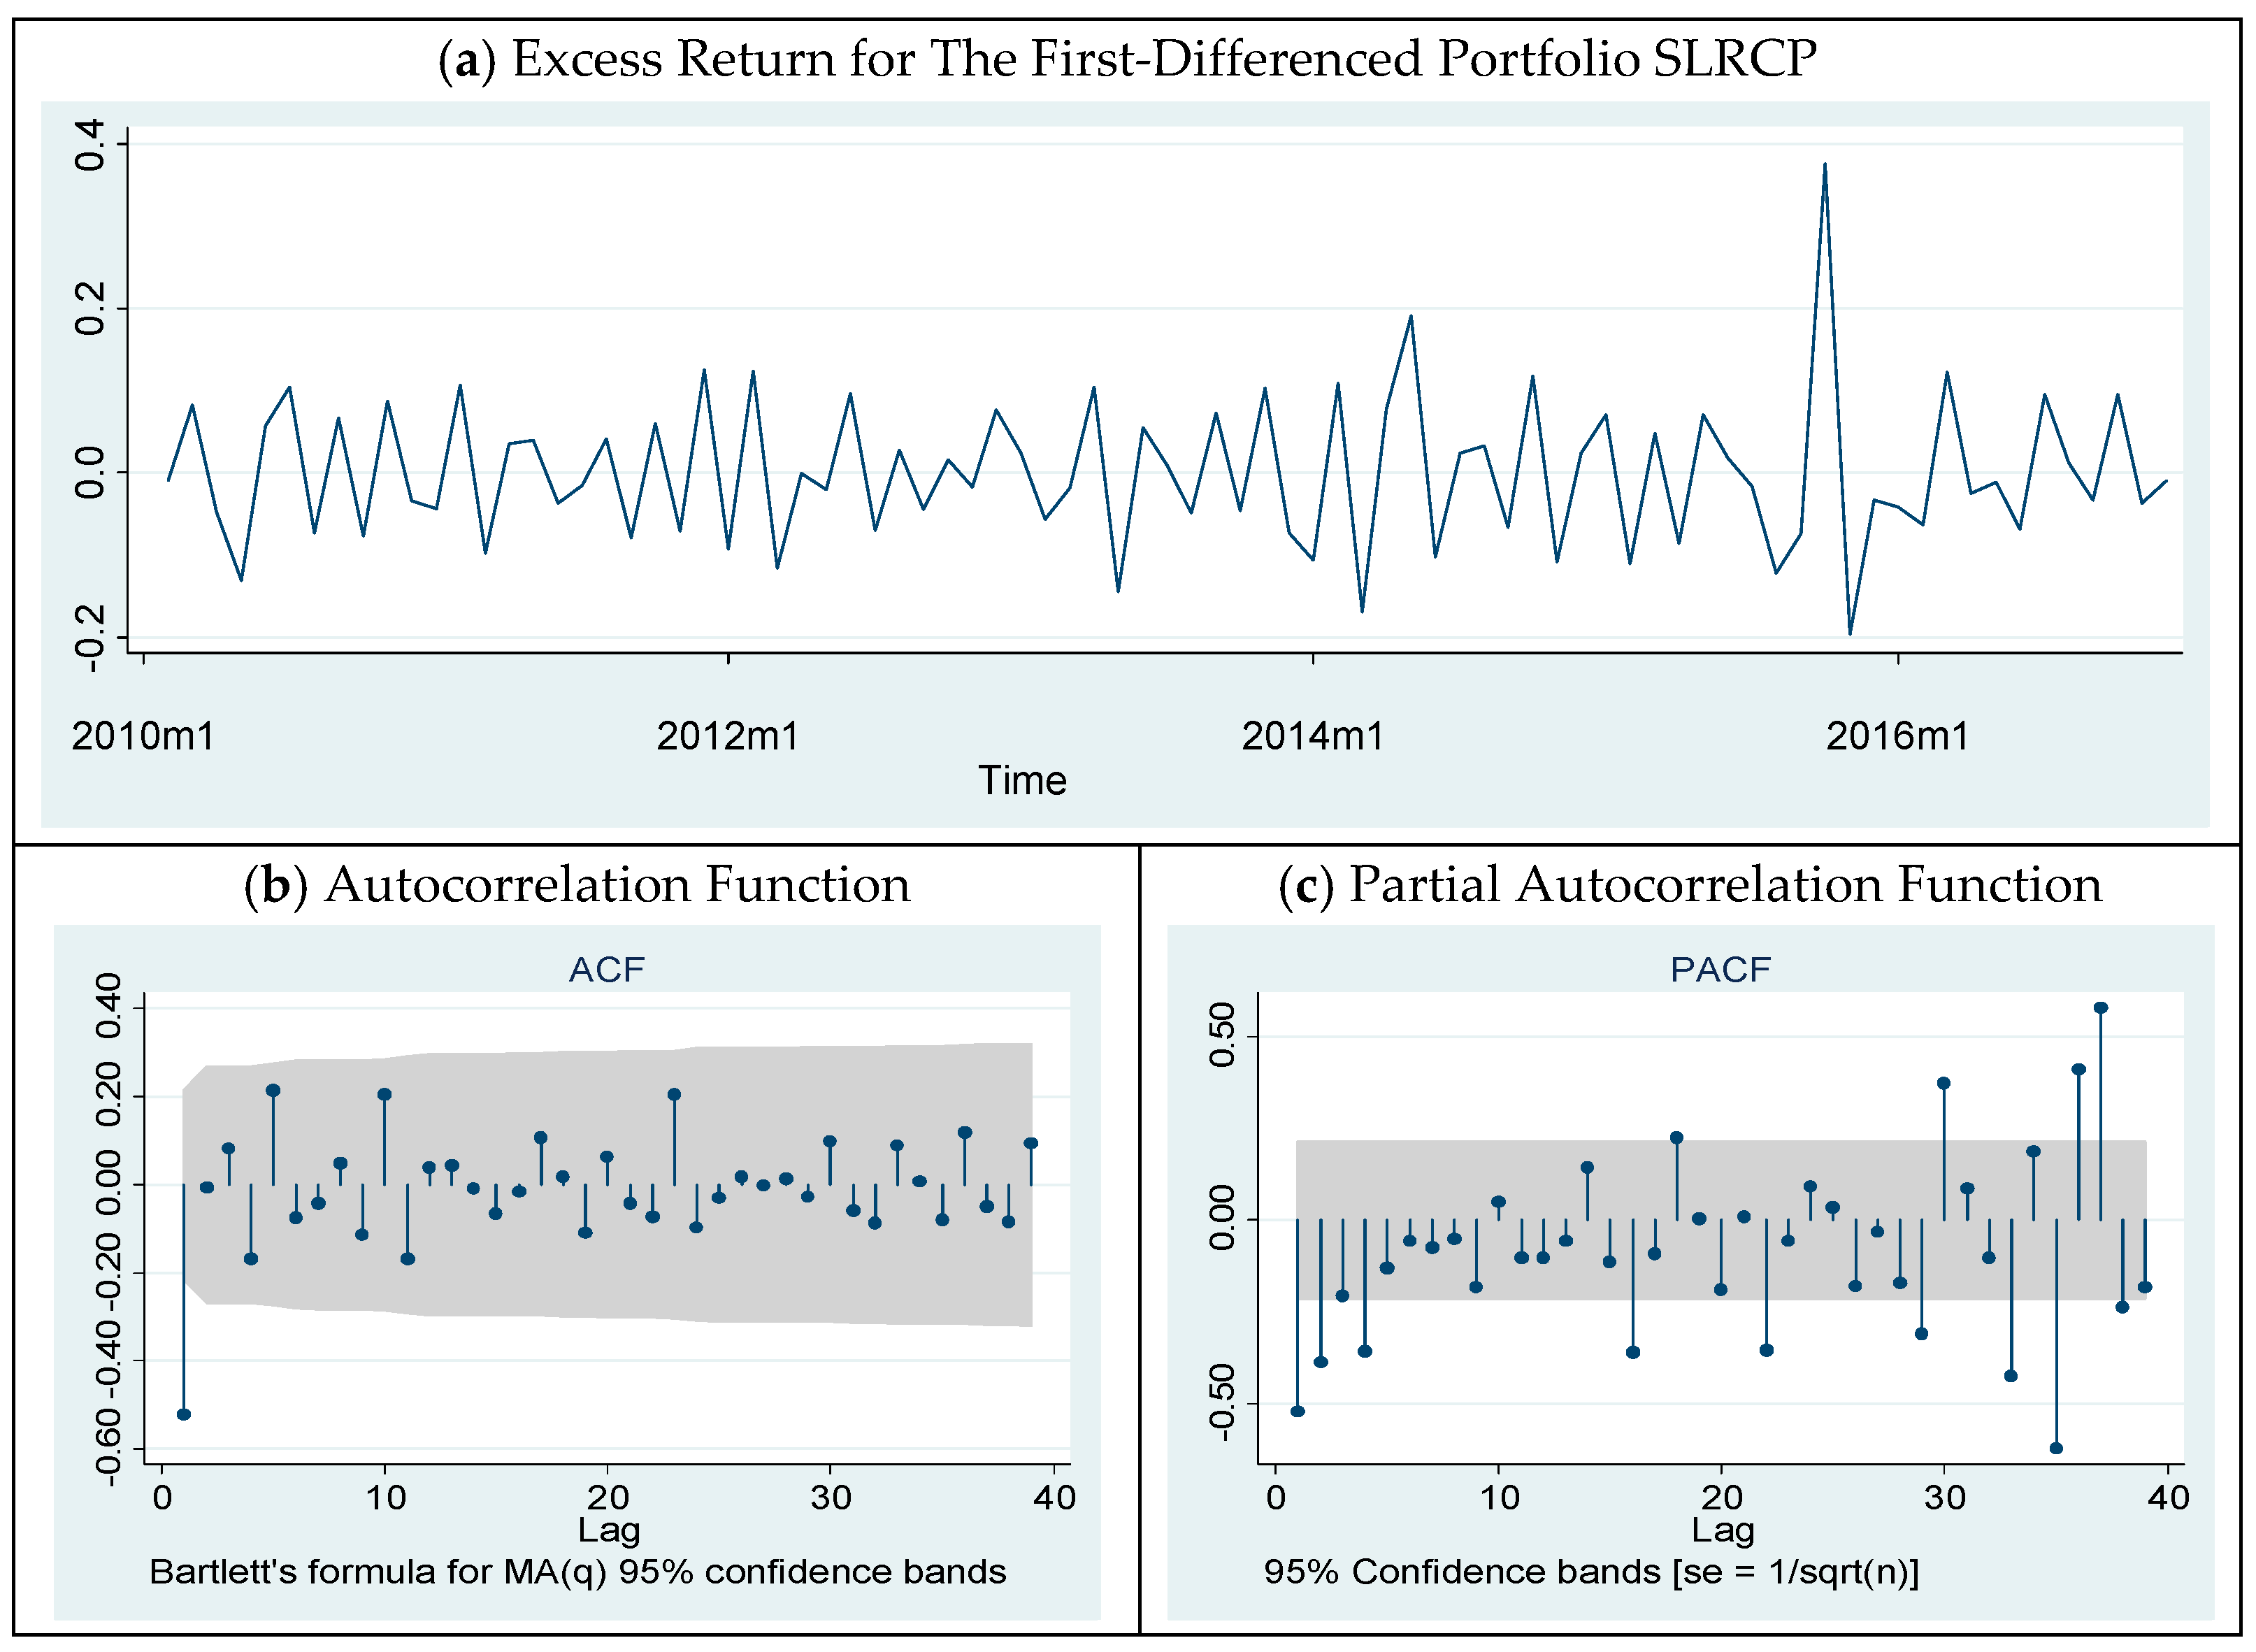
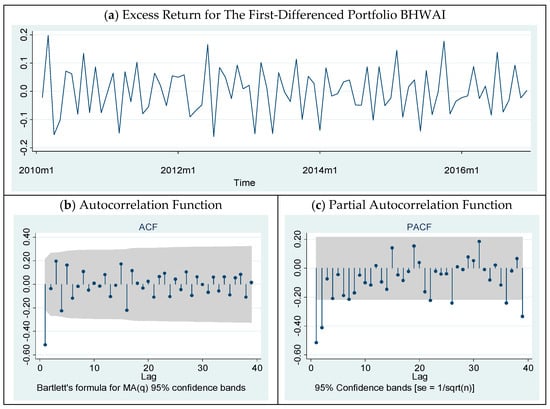
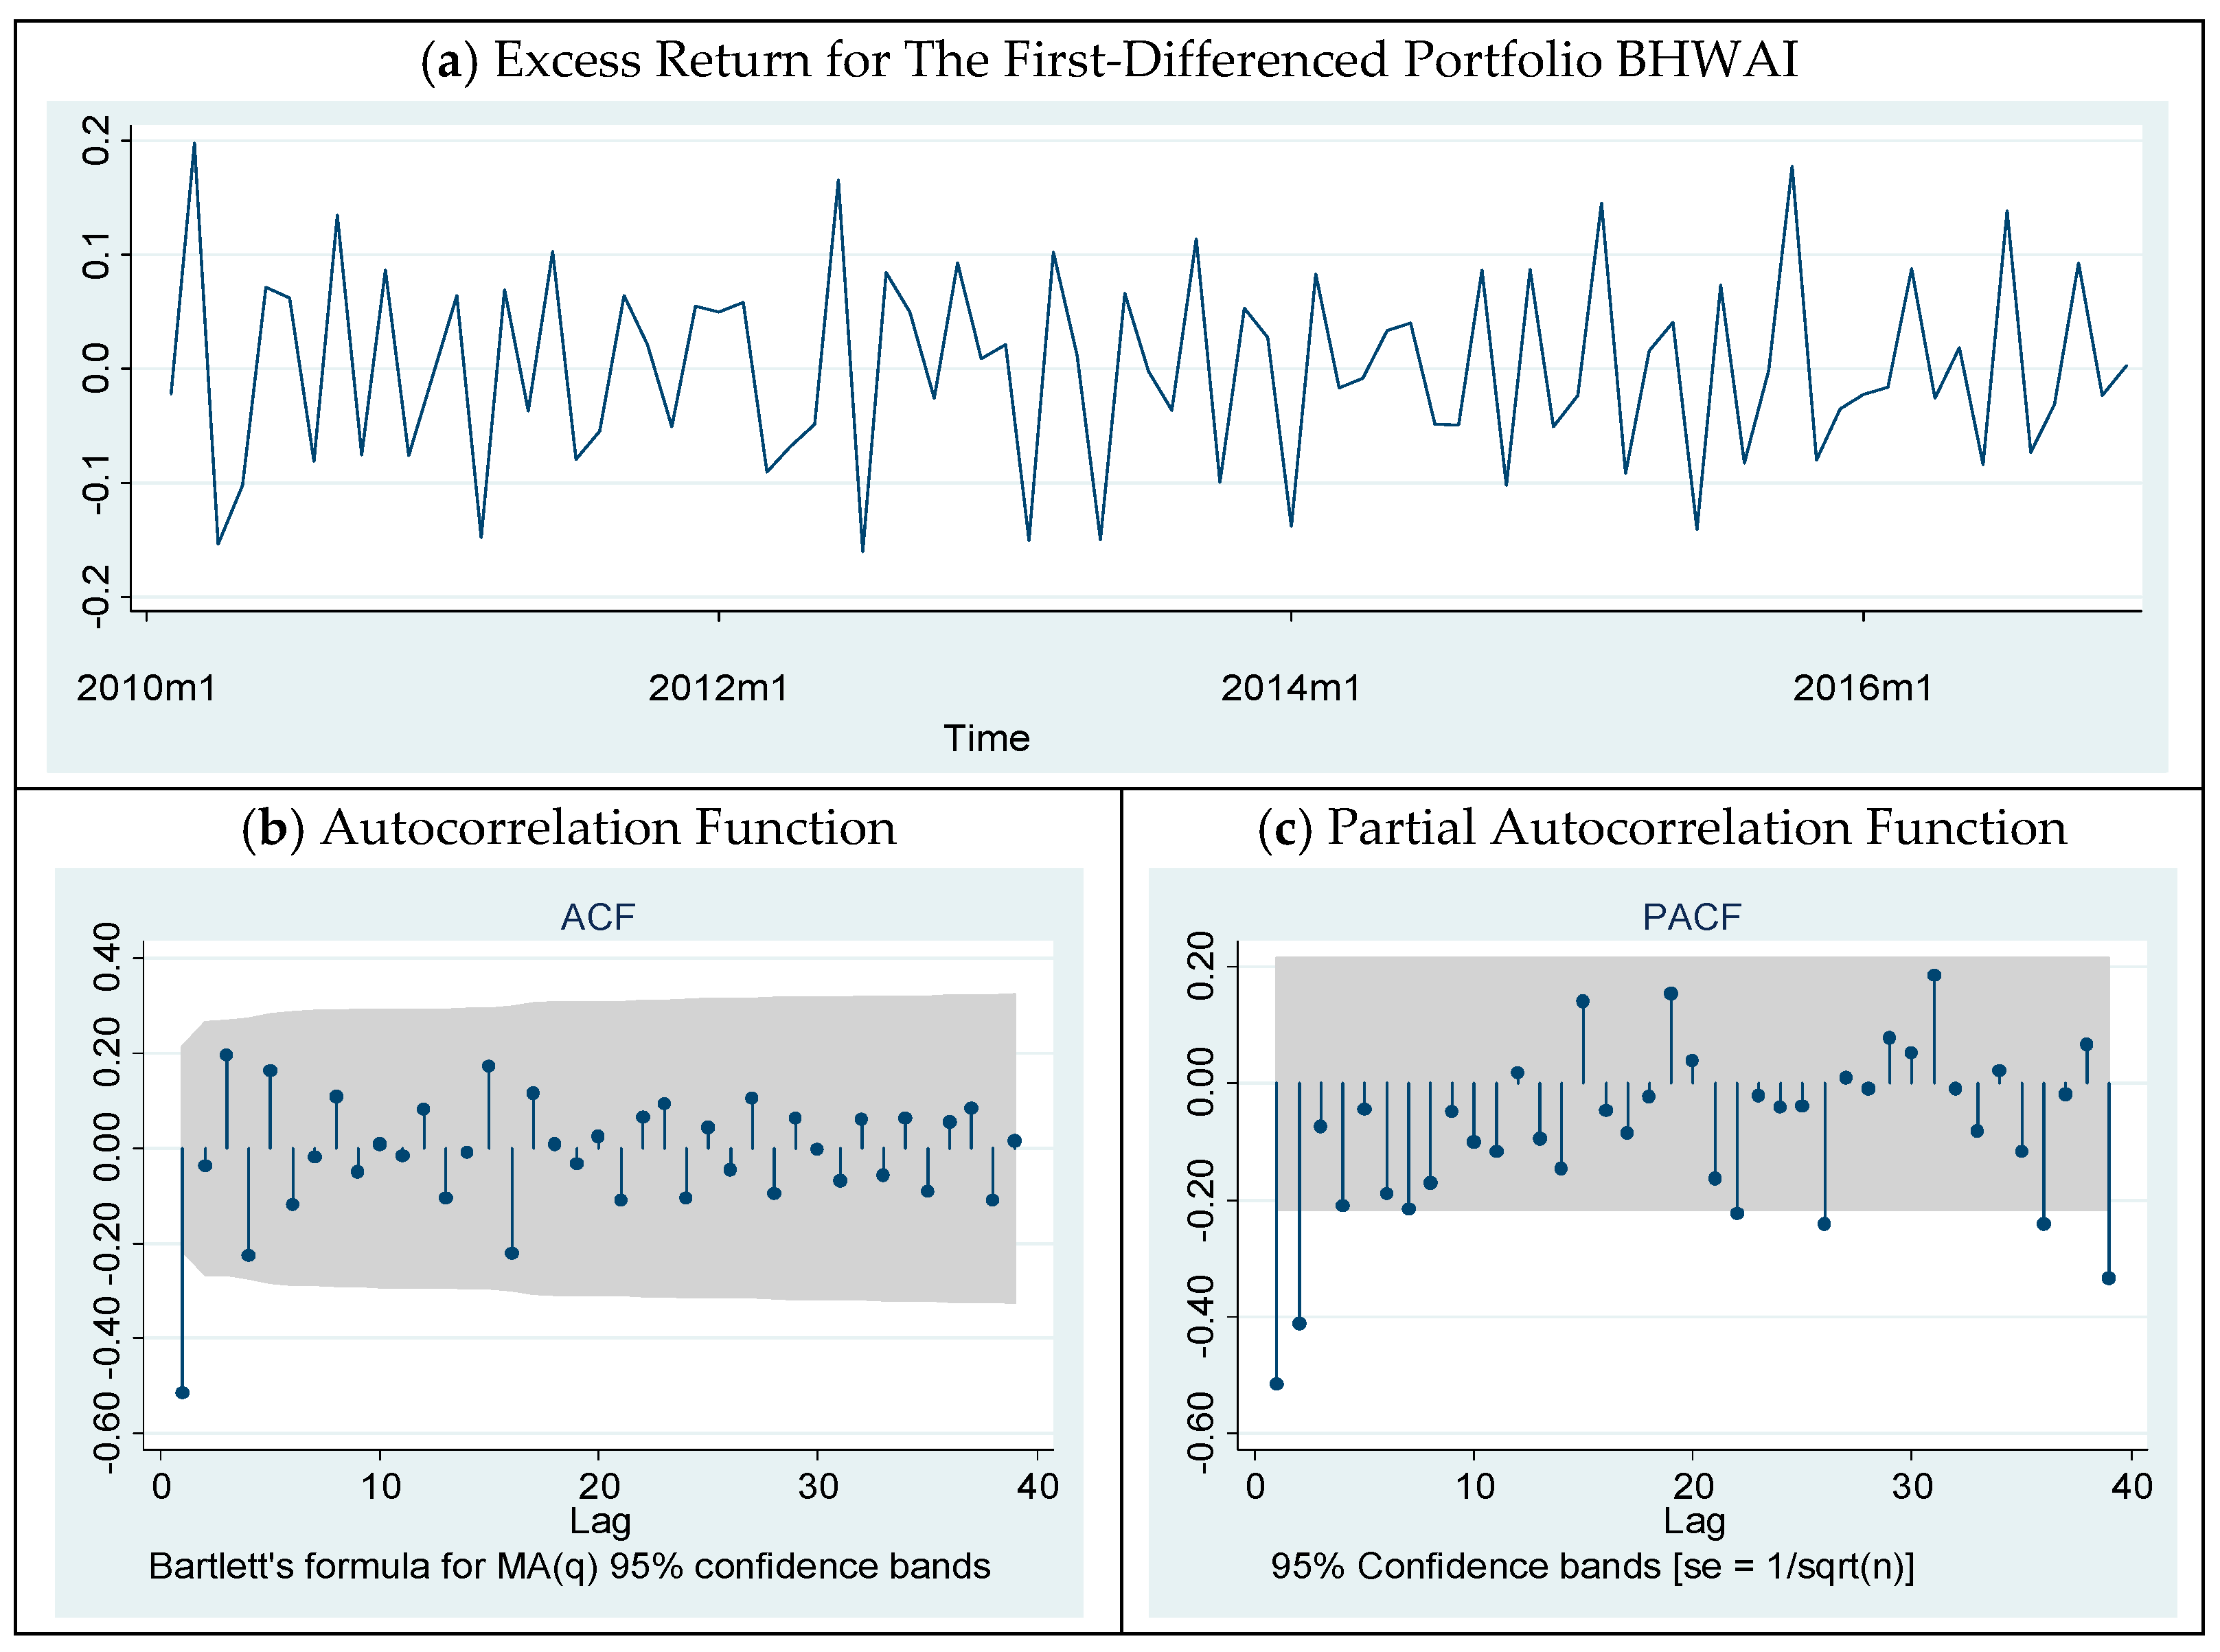
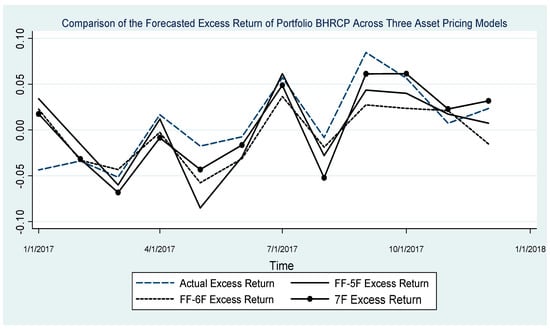
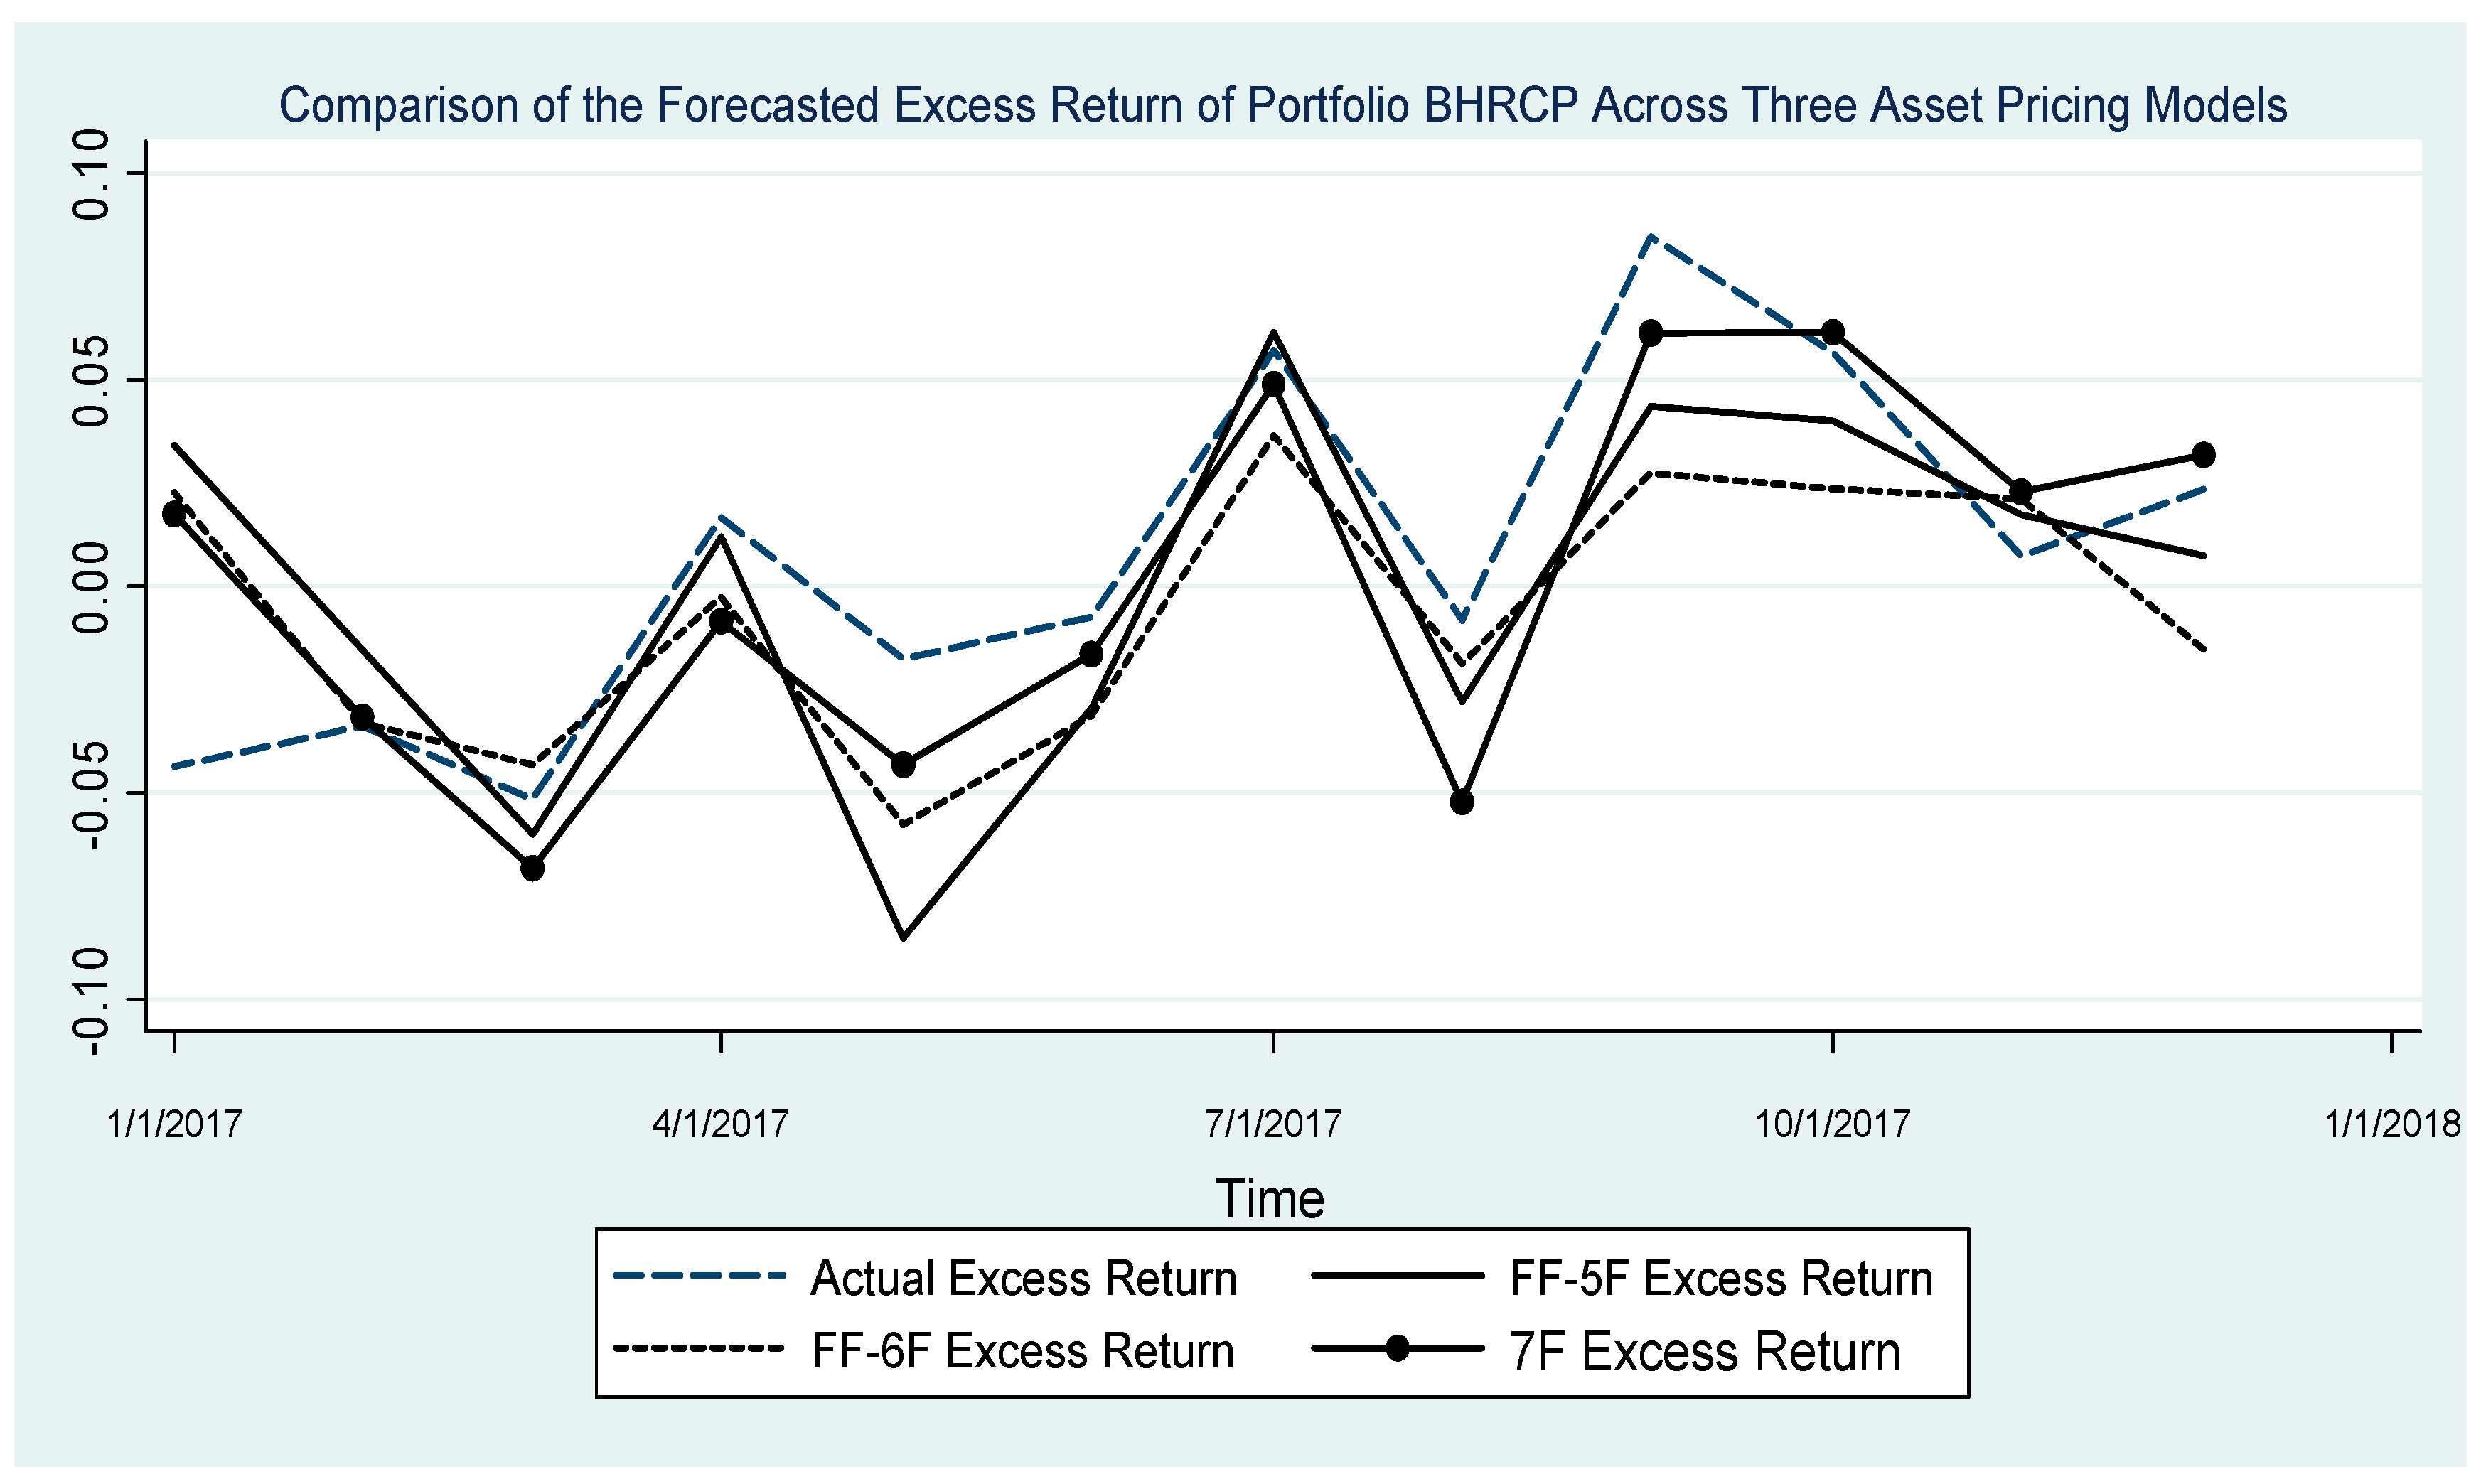
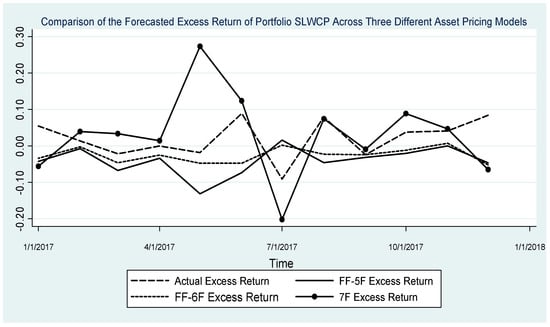
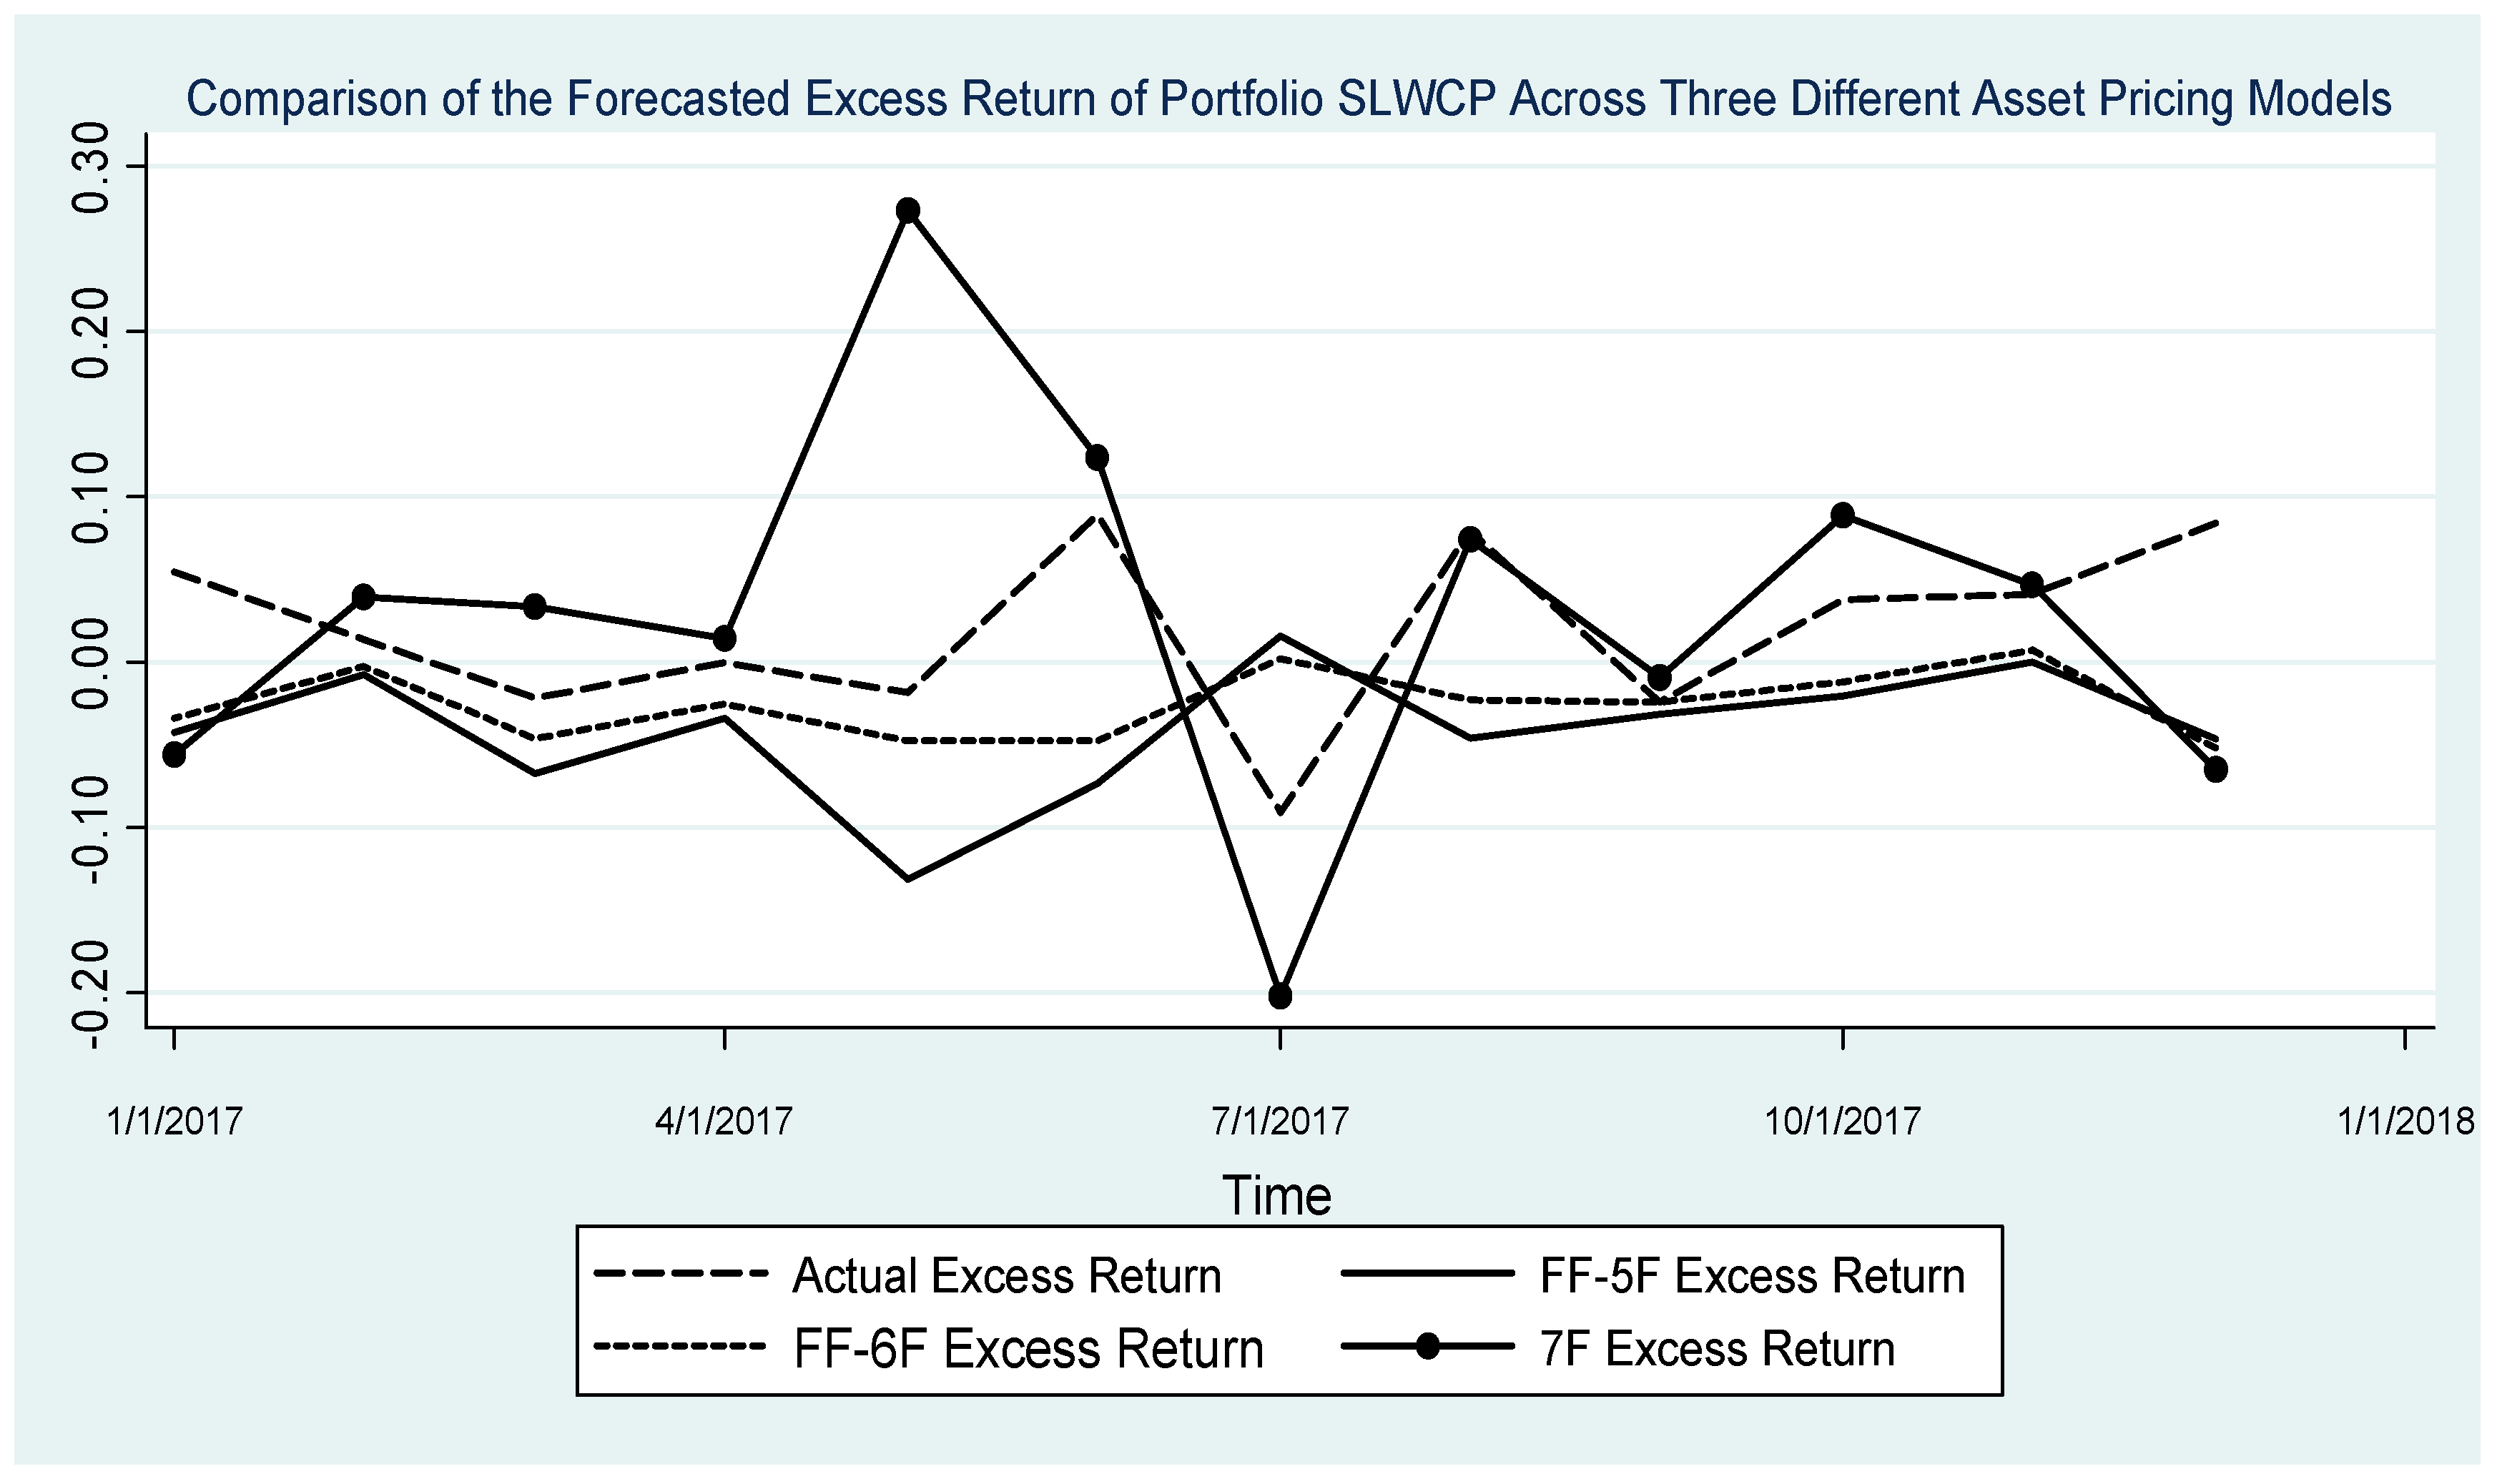
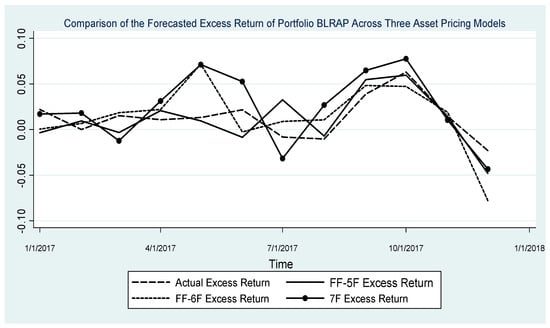
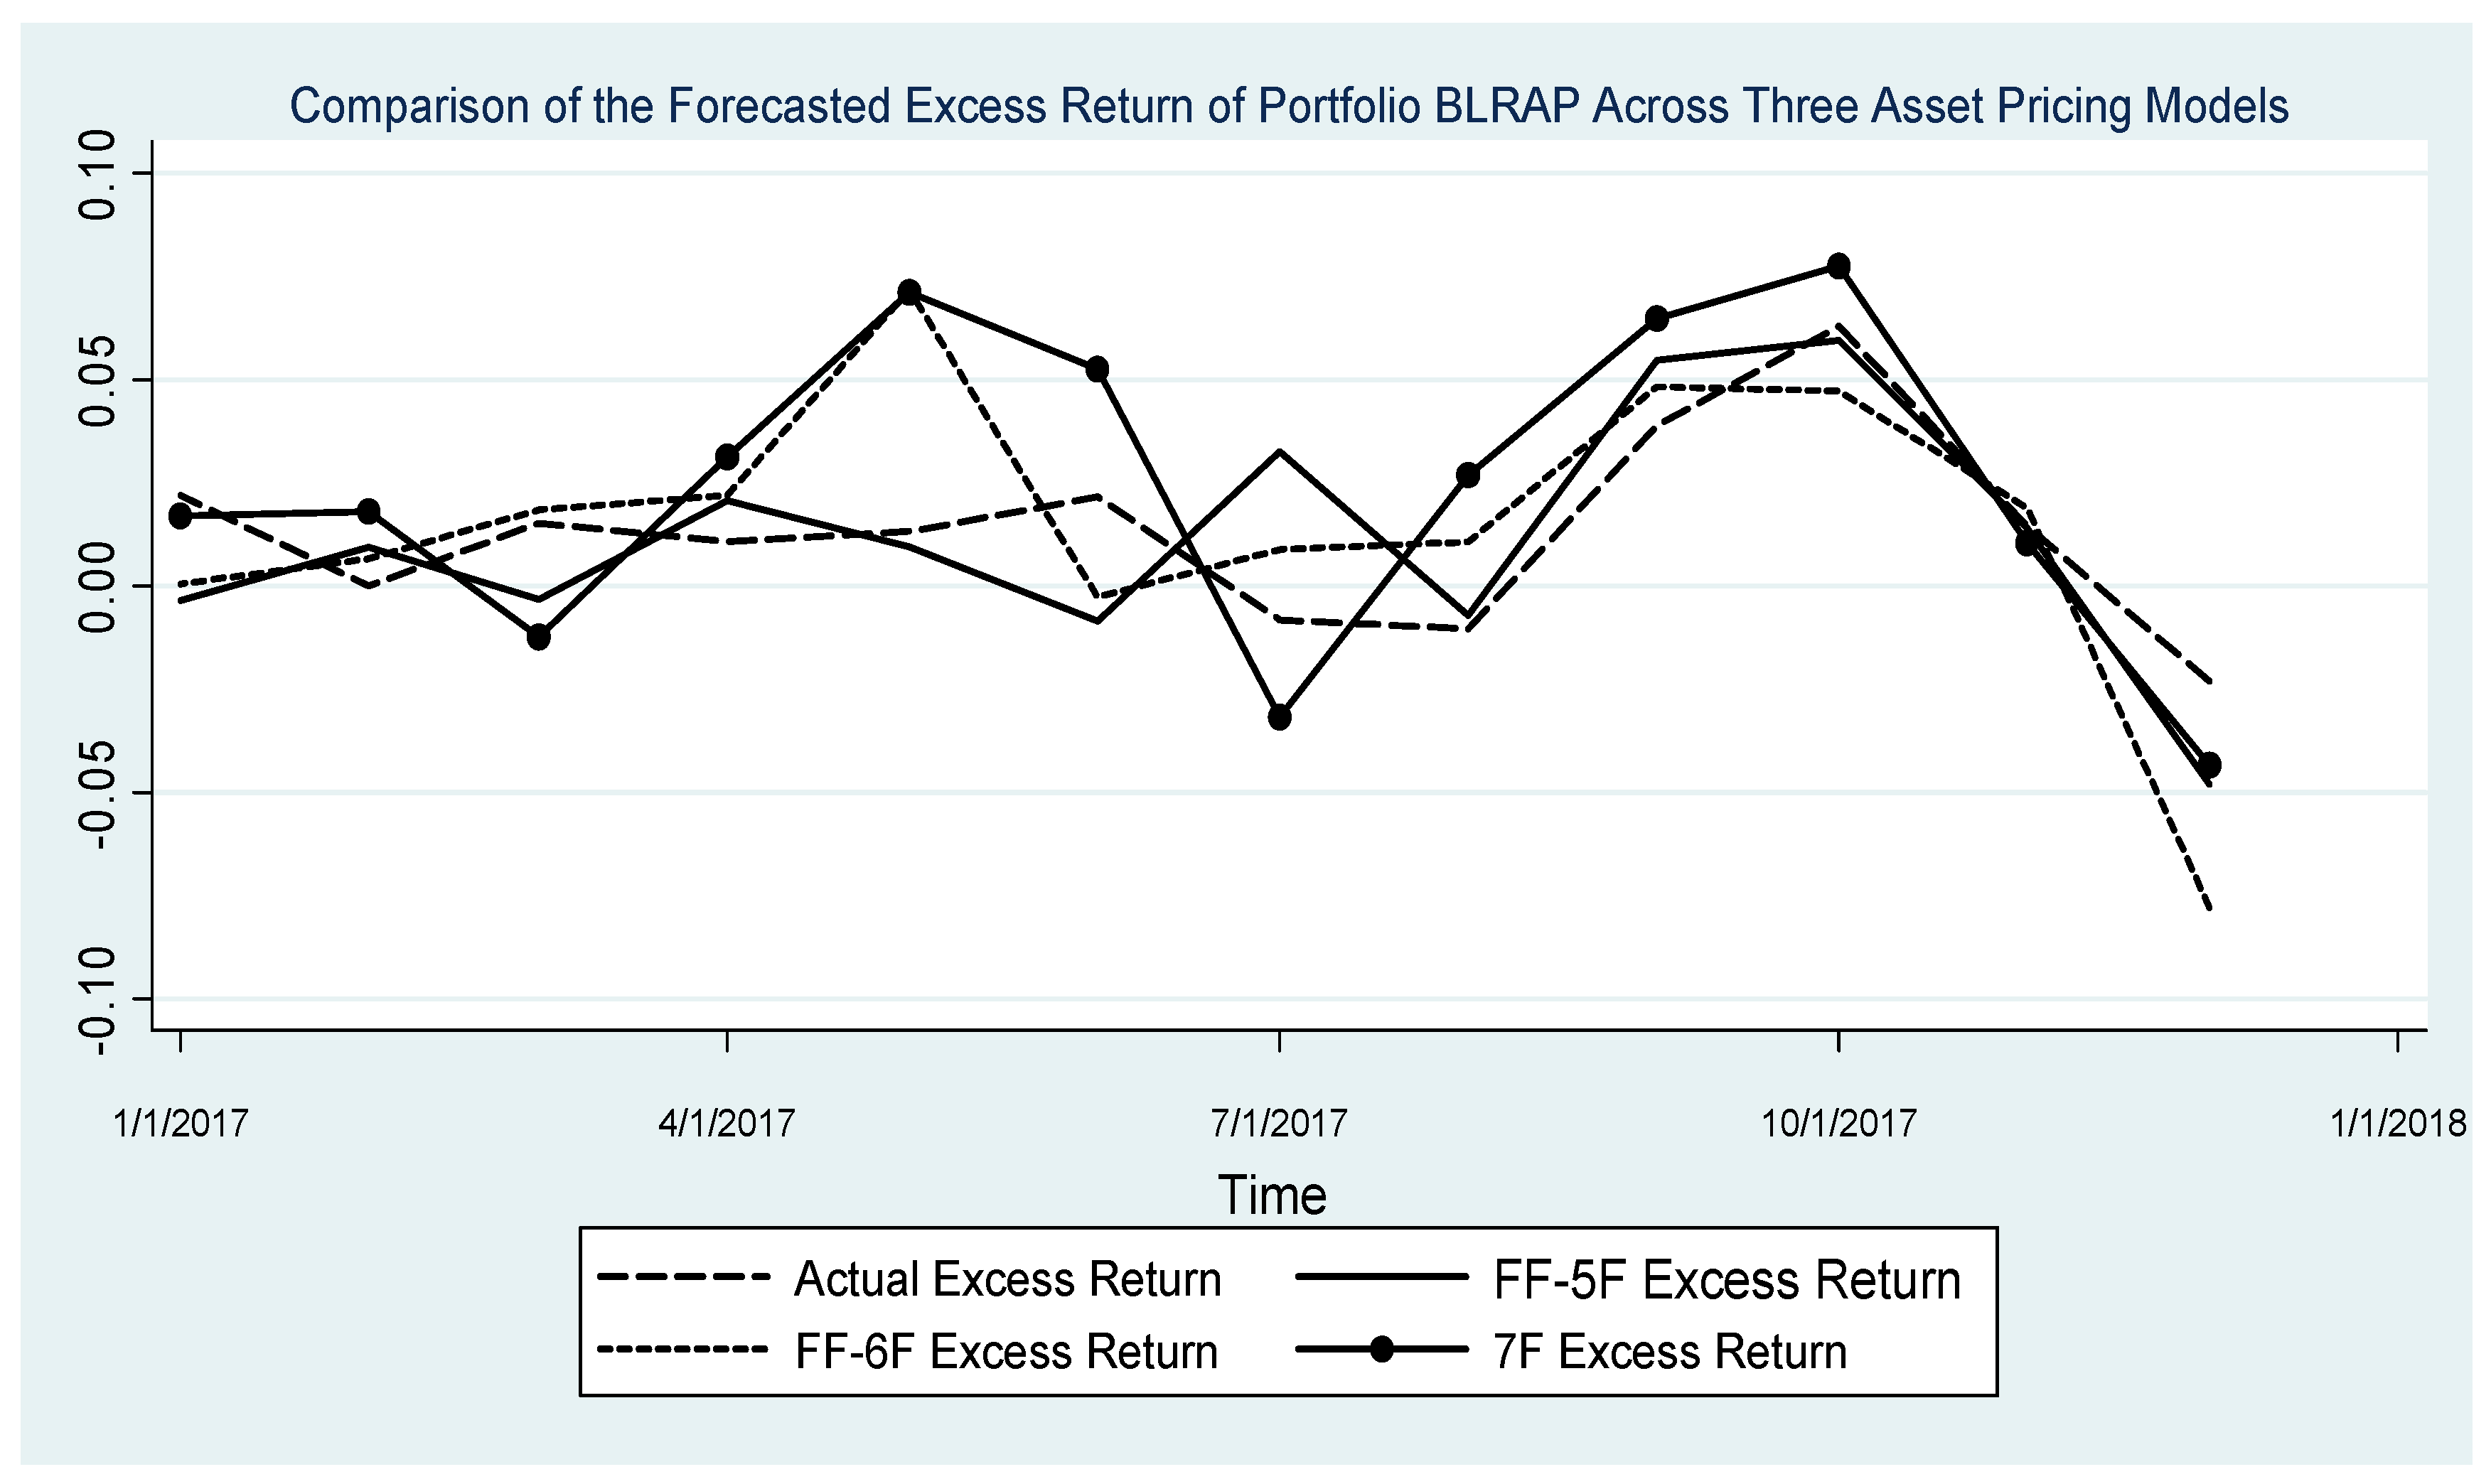

Disclaimer/Publisher’s Note: The statements, opinions and data contained in all publications are solely those of the individual author(s) and contributor(s) and not of MDPI and/or the editor(s). MDPI and/or the editor(s) disclaim responsibility for any injury to people or property resulting from any ideas, methods, instructions or products referred to in the content. |
© 2026 by the authors. Licensee MDPI, Basel, Switzerland. This article is an open access article distributed under the terms and conditions of the Creative Commons Attribution (CC BY) license.