


Abstract
This study develops an interpretable machine learning framework for type 1 motor insurance renewal classification using 70,290 real-world Thai policies, providing essential insights for pricing, customer retention, and operational decision making. The dataset was partitioned into a 70% training set, utilizing 5-fold cross-validation for hyperparameter tuning and model selection, and a 30% hold-out testing set to evaluate final model performance. Five machine learning models including Binary Logistic Regression, K-Nearest Neighbors, Support Vector Machines, Random Forests, and XGB are systematically evaluated across multiple curated feature sets generated through statistical filtering, stepwise selection, and permutation-based importance. Non-parametric tests are employed to compare model performance across scenarios. Experimental results show that a reduced four-feature Random Forest model (car age, net premium, sum insured, and car group) achieves the highest predictive performance (AUC = 99.62%; F1 = 98.15%), outperforming full-feature models while maintaining superior computational efficiency. Consequently, H2OAutoML serves as an external validation tool to verify that this manually curated, interpretable pipeline remains highly competitive with fully automated systems. Integrating a SHAP-based explainability layer quantifies predictor influence, ensuring transparency and regulatory alignment. Prioritizing feature parsimony, this study provides integrable insights for dynamic pricing and risk-adjusted retention, enhancing decision support within evolving motor insurance markets through transparent systems.
1. Introduction
Sustaining policy renewals is fundamental to motor insurance profitability, as retaining existing customers costs substantially less than acquiring new ones and contributes directly to portfolio stability and long-term loss-ratio management. Increasing price competition, rising operational costs, and rapid technological shifts, particularly the uptake of electric vehicles, have intensified insurers’ reliance on data-driven renewal strategies (Ad Addict 2025; Hosein 2024; Marketeer Online 2024; Roojai.com 2024). Despite these pressures, Thailand’s average renewal rate remains near 54%, indicating substantial room for improvement within a market of more than 40 million registered vehicles.
Type 1 motor insurance, the focus of this study, is the most comprehensive voluntary motor policy in Thailand, covering vehicle damage, theft, fire, flooding, and third-party liability. It is commonly recommended for new or low-age vehicles and high-risk or inexperienced drivers. Premiums vary by vehicle characteristics, claim history, repair options, insured value, and insurer. At renewal, policyholders also consider deductibles, service networks, and competing offers, leading to increasingly heterogeneous renewal behaviors. Early actuarial models predicting renewal decisions largely relied on logistic regression or heuristic scorecards. However, recent evidence demonstrates that policy renewal is influenced by diverse and interacting factors, including distribution channel, no-claim discount, vehicle age, premium level, and purchase price (Hanafy and Ming 2021; Kiyosov 2025; Logeswaran et al. 2025; Rustam and Ariantari 2018; Saikia et al. 2024; Wang 2020). Competitive pricing, operational efficiency, and even real-time social media sentiment further shape retention (England et al. 2022; Hosein 2024). In response, machine learning (ML) techniques have gained increasing attention for renewal prediction. Numerous studies confirm that ML models outperform traditional approaches (Guillén 2025; Hanafy and Ming 2021; Logeswaran et al. 2025; Saikia et al. 2024; Segura-Gisbert et al. 2025; Wang 2020; Wang et al. 2020). Their effectiveness, however, depends critically on access to broad, well-structured datasets capturing vehicle attributes, customer behaviors, economic conditions, and temporal dynamics (Cesarini et al. 2023; Segura-Gisbert et al. 2025; Simmachan and Boonkrong 2024). Telematics data capturing speed, acceleration, braking, and mileage have been particularly valuable for dynamic risk assessment and personalized pricing (Guillén 2025). Despite global advances, significant gaps remain in the Thai context. Over 40% of registered vehicles lack voluntary insurance, and renewal behavior is driven by pricing sensitivity, rapidly evolving digital ecosystems, and emerging vehicle technologies (Ad Addict 2025; Marketeer Online 2024; Priceza Money 2025; Roojai.com 2024; Segura-Gisbert et al. 2025; Thai General Insurance Association (TGIA) 2025). Traditional actuarial models struggle to incorporate these nonlinearities and behaviorally driven patterns. Moreover, high-quality, publicly accessible motor insurance datasets in Thailand are scarce, limiting reproducibility and methodological innovation. Consequently, there is an urgent need for accurate, explainable, and computationally efficient ML-based renewal systems tailored to Thai market realities. Bridging this gap necessitates a transition from static modeling to robust Machine Learning Operations (MLOps) frameworks (Balona 2024; Bayram and Ahmed 2025). Operationalization in a production environment requires these engineering and MLOps perspectives for insurer adoption, ensuring models remain resilient to data drift and scalable across high-concurrency digital channels. Furthermore, sophisticated feature selection in motor insurance, integrating telematics with socioeconomic indicators, is vital for predictive precision. Such frameworks must align with the EU AI Act and Solvency II, mandating that transparent, auditable, and fair underwriting remains central to regulatory compliance and capital efficiency (De Filippis 2025; Larochelle et al. 2023; Tereszkiewicz and Skalski 2025).
Therefore, this study investigates whether an interpretable ML framework can reliably predict motor insurance renewal risk using 70,290 Thai private-car policies (2024). Combining multiple classifiers, rigorous feature-selection strategies, SHAP-based interpretability, and statistical benchmarking, the study aims to deliver actionable, transparent insights for pricing, retention, and risk management in Thailand’s motor insurance market.
2. Related Works
Recent research on motor insurance analytics demonstrates rapid progress in predictive modeling, feature engineering, and explainable AI. Table 1 summarizes existing literature by author and year, sample size, study objectives, response variables, applied machine learning or statistical models, feature-selection approaches, and interpretation techniques. It highlights methodological diversity, data scales, and explainability strategies, positioning the present study within current research trends and identifying gaps addressed by the proposed approach. Early works such as Spiteri and Azzopardi (2018) applied classical machine learning classifiers and survival models to understand customer churn, highlighting the value of risk factor identification.
Table 1.
Comparative review of prior studies on motor insurance analytics and risk modeling from 2018 to 2025.
The authors of Huang and Meng (2019) extended this direction by proposing a UBI-oriented framework combining crash prediction and claim frequency modeling using wrapper-based feature selection. Studies on claim prediction, e.g., Abdelhadi et al. (2020) and Wang (2020), incorporated tree-based ensembles and domain-knowledge filters (e.g., VIF) to improve accuracy and interpretability. Telematics-driven modeling has become increasingly prominent. The authors of Gao et al. (2022) integrated deep learning with Poisson regressions for claim frequency prediction, while those of Strada et al. (2025) engineered dynamic GPS-based behavioral features to enhance accident-risk estimation. Parallel work on claim severity by Staudt and Wagner (2021) emphasized model comparison using GAM, GLM, and RF, supported by spatial effect plots. Recent contributions broaden the interpretability landscape: Byrne (2024) and Ding et al. (2025) used SHAP for premium fairness and fraud detection, respectively; Deng et al. (2024) introduced causal inference to quantify environmental impacts on accidents; and Simmachan and Boonkrong (2024) combined GLMs with frequency model diagnostics to identify influential predictors, while existing insurance and diagnostic models demonstrate high performance, they often lack generalizability across diverse geographic markets due to a reliance on cohorts from Europe, China, and Africa that may not reflect the specific regulatory and behavioral dynamics of Southeast Asia. Consequently, a notable research gap exists in the integration of high-performing ensemble models with rigorous feature selection and SHAP-based interpretability specifically within the Thai market. The present study addresses the lack of regional generalizability by utilizing a large-scale Thai dataset to establish a localized benchmark, effectively bridging the gap between global computational trends and Thailand’s unique market structure. By systematically comparing multiple machine learning classifiers, this research fills a critical gap through the simultaneous integration of statistical tools, such as VIF and the Wald test, with advanced interpretability methods like MDA, MDI, and SHAP.
3. Data and Problem Specification
In the context of motor insurance renewal decision support, the principal factors driving policyholder retention are identified. The renewal outcome is modeled as a binary variable , where indicates policy renewal and indicates non-renewal. According to the Office of Insurance Commission (OIC), Thai motor insurance policies carry a one-year term, with coverage officially terminating at 4:30 P.M. on the expiration date, after which the policy is deemed lapsed. For analytical purposes, an active policy is defined as 1 for renewal and 0 otherwise, based on a dataset containing nine predictor variables () per policy. Before implementing ML classifiers, the descriptive statistics of these features are presented, and the binary classification problem is formally defined.
3.1. Data Description
The preliminary data examination of motor insurance policy renewals from an insurance company in Thailand revealed no missing values. Removing 184 duplicated and incomplete policies, 70,290 policies remained for analysis. Of these, 37,980 policies were renewed, accounting for 53.91%, while 32,468 policies were not renewed, representing 46.09%. The dataset’s 1.17:1 ratio represents a negligible imbalance where standard optimization remains effective as class overlap and data complexity are more critical to performance than minor distribution skews (Brownlee 2020; He and Garcia 2009). Table 2 summarizes the categorical distribution of policy renewals in term of renewal proportion () by Gender, Region, and Car Group among 70,290 policies. Males (n = 31,683) renewed at 55.13% versus 53.00% for females (n = 38,607). Renewal rates peaked in Central (56.63%) and bottomed in Northeast (46.69%). Car group rates ranged from 78.87% (Group 02) to 54.50% (Group 03), indicating heterogeneity and guiding targeted retention strategies for motor insurance renewals and policy design. Particularly in Thai motor insurance, Car Group categorizes vehicles by chassis value and repair cost brackets. Group 01 (THB ≥ 5 million) includes ultra-luxury models; Group 02 (THB 1.5–5 million) premium vehicles; Group 03 (THB 1–1.5 million) mid-range sedans; Group 04 (THB 0.7–1 million) compact cars; and Group 05 (THB ≤ 0.7 million) economy models. Imported and sports vehicles are assigned to Group 01, higher to reflect elevated repair costs. Furthermore, there are seven quantitative features including car age, sum insured, premium, recovery, number of claims, total claim and incurred loss. Table 3 presents descriptive statistics for the continuous predictors by renewal status. Renewed policies exhibit higher mean car age (4.99 vs. 1.53 years) but lower mean sum insured (THB 585,612 vs. THB 750,077) and premium (THB 14,282 vs. THB 16,896) than non-renewals. Recovery, claim count, total claim, and incurred loss are right-skewed (median = 0; IQR = 0), with non-renewals showing greater mean and variance, reflecting elevated loss exposure.
Table 2.
Descriptive statistics of categorical features.
Table 3.
Descriptive statistics of continuous features.
Despite this, the variable remains a high-value predictor, as it enables differentiation between “at-fault” and “not-at-fault” claim experiences, which directly influence the no-claim discount (NCD) structure and subsequent renewal decisions. Total claim is defined as the gross estimated value of all loss incidents reported by the policyholder during the policy term, reflecting the initial damage assessment recorded at claim intimation, prior to loss adjustment or the application of policy limits. Incurred loss represents the insurer’s recognized financial liability for claims within the policy period and is calculated as the sum of paid claims and outstanding case reserves, net of deductibles. As this measure reflects the finalized claim cost after adjustments, its value may be lower than the initial total claim.
3.2. Problem Specification
Predicting policy renewals is a binary classification task critical to an insurer’s profitability, regulatory compliance, and customer retention. Let denote the dataset of N policies, where comprises demographic, geographic, vehicle and claim-history attributes, and . Accurate renewal forecasts enable targeted retention incentives, mitigate adverse selection and optimize loss ratios. The 5 effective ML algorithms including BLR, KNN, SVM, RF and XGB were selected as classifier candidates. To address heterogeneity across feature subsets, the classifiers were trained on multiple feature sets , including the full variable complement and subsets derived via penalized and embedded selection methods. The analytic pipeline includes model training and hyperparameter tuning via stratified 5-fold CV to optimize for AUC, F1-score, and accuracy. Post hoc interpretability is then achieved using SHAP analysis and partial dependence plots to quantify how key features drive renewal propensity.
4. Machine Learning Framework
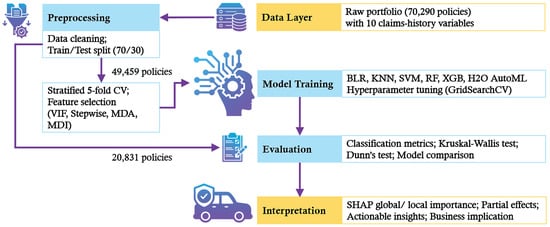
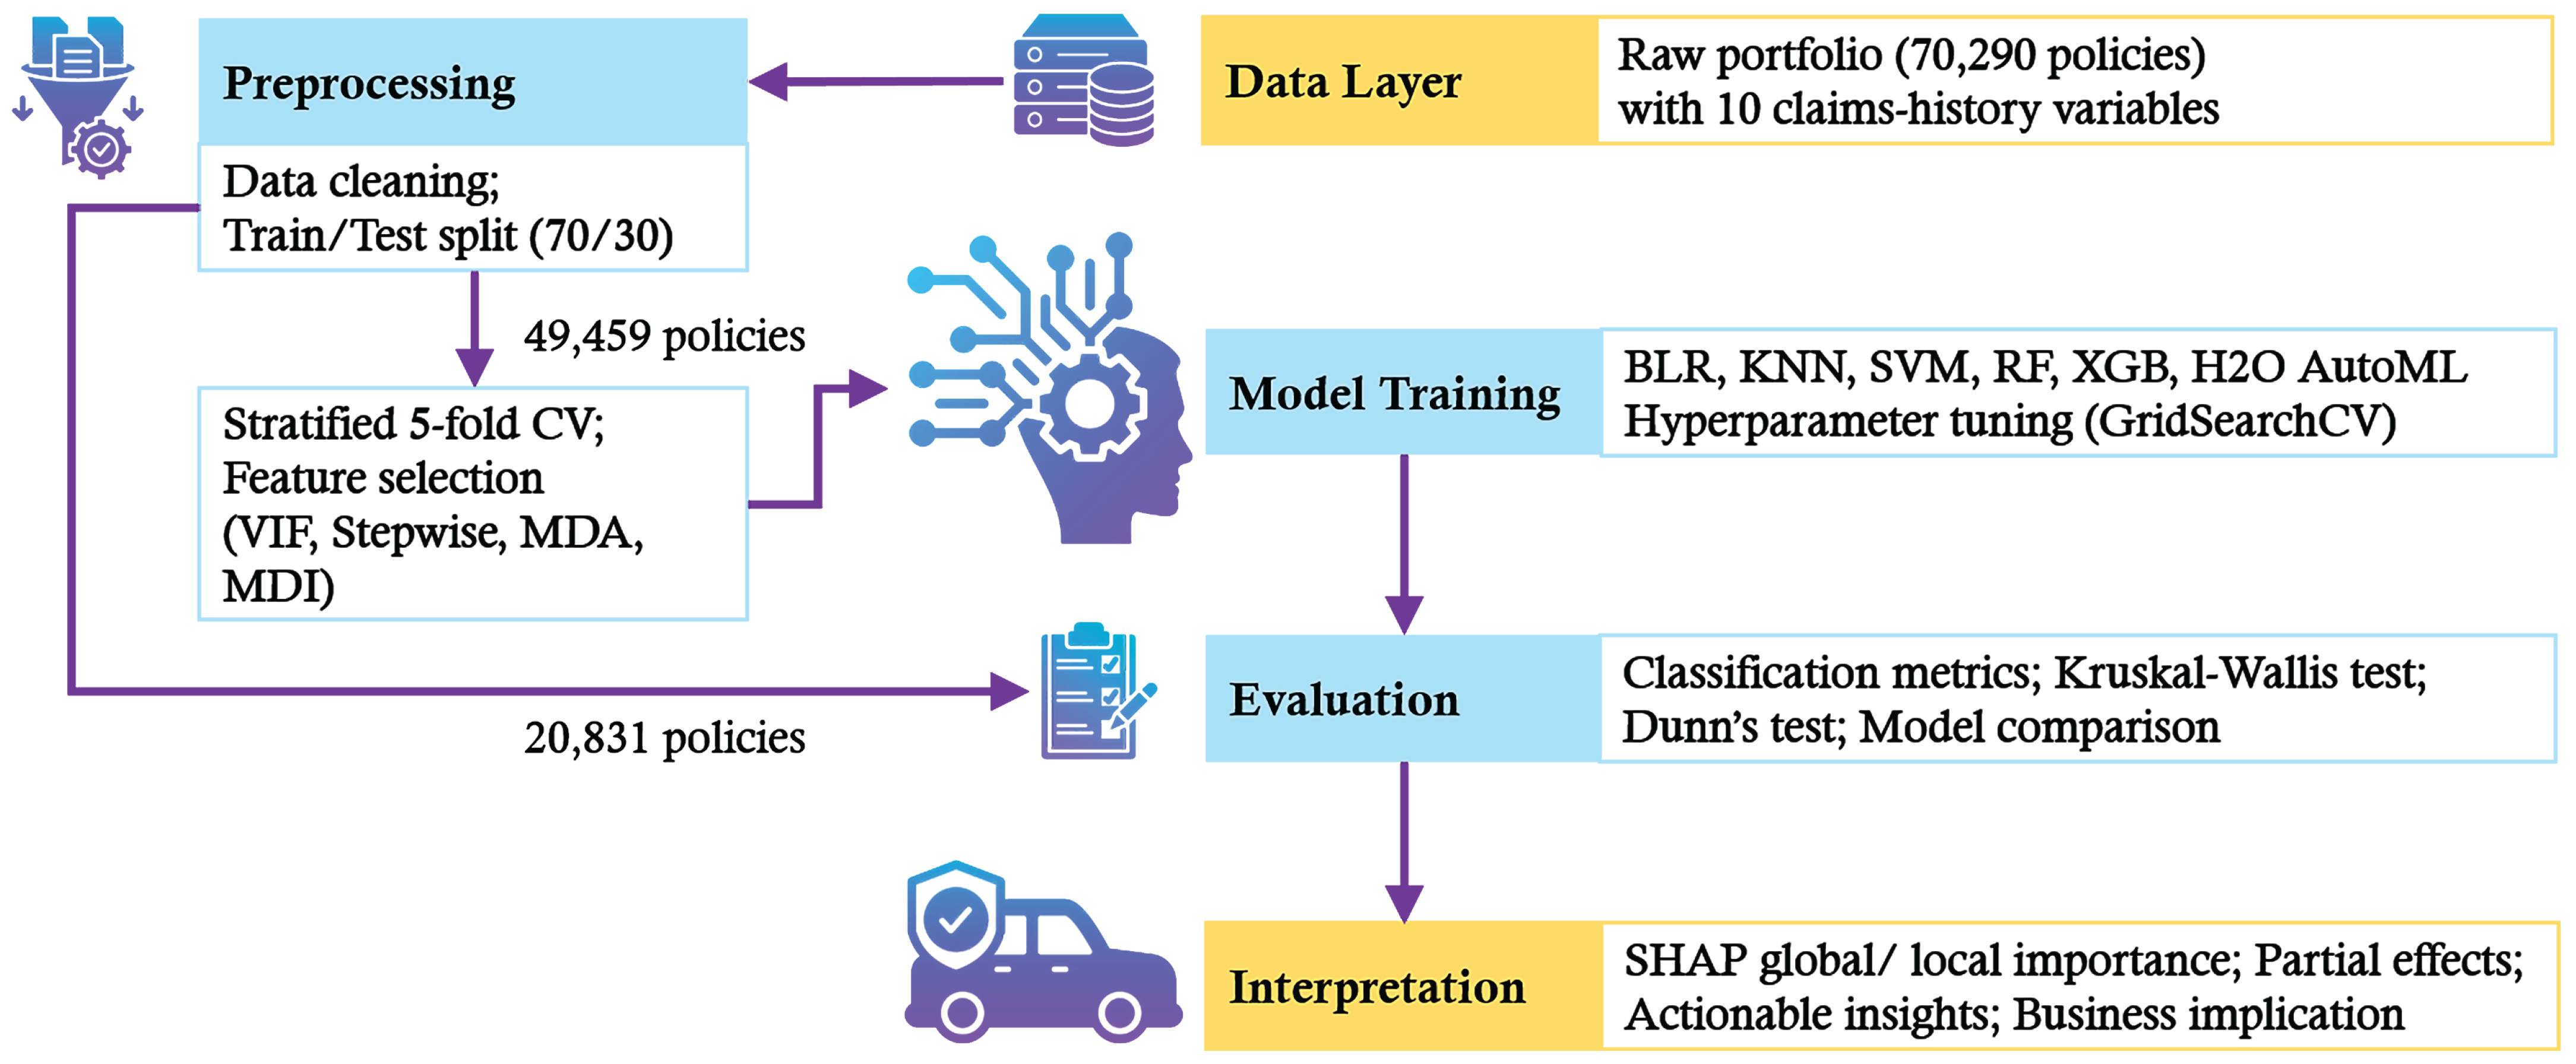
To investigate the factors influencing the decision to renew the car insurance policy, the ML framework concerns preprocessing, classifiers, hyperparameter tuning, evaluation metric and feature importance. Figure 1 presents the end-to-end workflow for interpretable motor insurance renewal prediction, encompassing data acquisition, preprocessing and feature selection, comparative ML modeling, statistical performance evaluation, and SHAP-based explainability, culminating in transparent, actionable insights to support pricing, customer retention, and regulatory-compliant decision making in Thailand’s motor insurance context. It is important to note that this framework represents our specific design choices tailored to the problem at hand, and not a universally definitive approach. Each process is described as follows:
Figure 1.
A possible methodological framework for interpretable motor insurance renewal prediction based on our design choices and specific context.
4.1. Preprocessing
Preprocessing plays a vital role in ensuring reliable and interpretable model outcomes. This section details the procedures applied prior to model development, including stratified train/test splitting, fivefold CV for robust validation and tuning, and multiple feature selection strategies. These steps aim to maintain class distribution, reduce overfitting, and improve computational efficiency, thereby supporting accurate and generalizable predictions for motor insurance policy renewal decisions.
4.1.1. Train/Test Splitting
Throughout this study, the train/test splitting was established to 70/30. That is, the total 70,290 was split into training and testing sets. In the original data, the training set consists of 26,649 renewed and 22,810 non-renewed policies, with 11,331 renewed and 9658 non-renewed in the testing set. The renewal rate remained consistent across both sets. The fractions of the major (renewed) to minor (non-renewed) class were 1.168, 1.173 and 1.170 for training, testing and overall dataset, respectively. Thus, the balancing technique is not required.
4.1.2. K-Fold Cross-Validation
To tune hyperparameters and estimate generalization performance, stratified 5-fold cross-validation (CV) was conducted exclusively on the 70% training set. In response to concerns regarding the unusually high AUC and F1 values and the potential risk of data leakage, all model development and hyperparameter optimization were strictly confined to the training data, while the held-out test set was used solely for final performance evaluation. The training data was partitioned into 5 folds such that where is held out in fold k, and stratification preserved the renewal-to-lapse ratio in each fold. All 5 ML classifiers were each evaluated on 5 feature sets. Within each fold, GridSearchCV exhaustively searched the predefined hyperparameter grid for the given classifier and feature set, selecting the configuration that maximized mean validation accuracy. For each feature set combination, the mean accuracy, F1-score, and AUC across the 5 folds were recorded.
4.1.3. Feature Selection
Screening of important features is a critical preprocessing step in ML that significantly impacts model performance by reducing dimensionality, eliminating noise, and improving accuracy (Boonkrong et al. 2025; Dali et al. 2024). Models without feature selection may face challenges, e.g., increased complexity, noise, and redundancy, which can adversely affect their performance. Incorporating feature selection techniques is generally recommended for building efficient and accurate ML models. The feature sets were obtained as follows:
- All Features: Without any feature selection technique, all 10 features were directly recruited into ML models. That is,
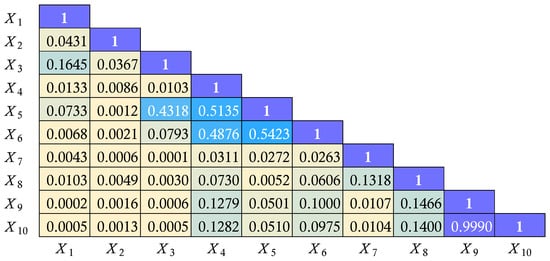
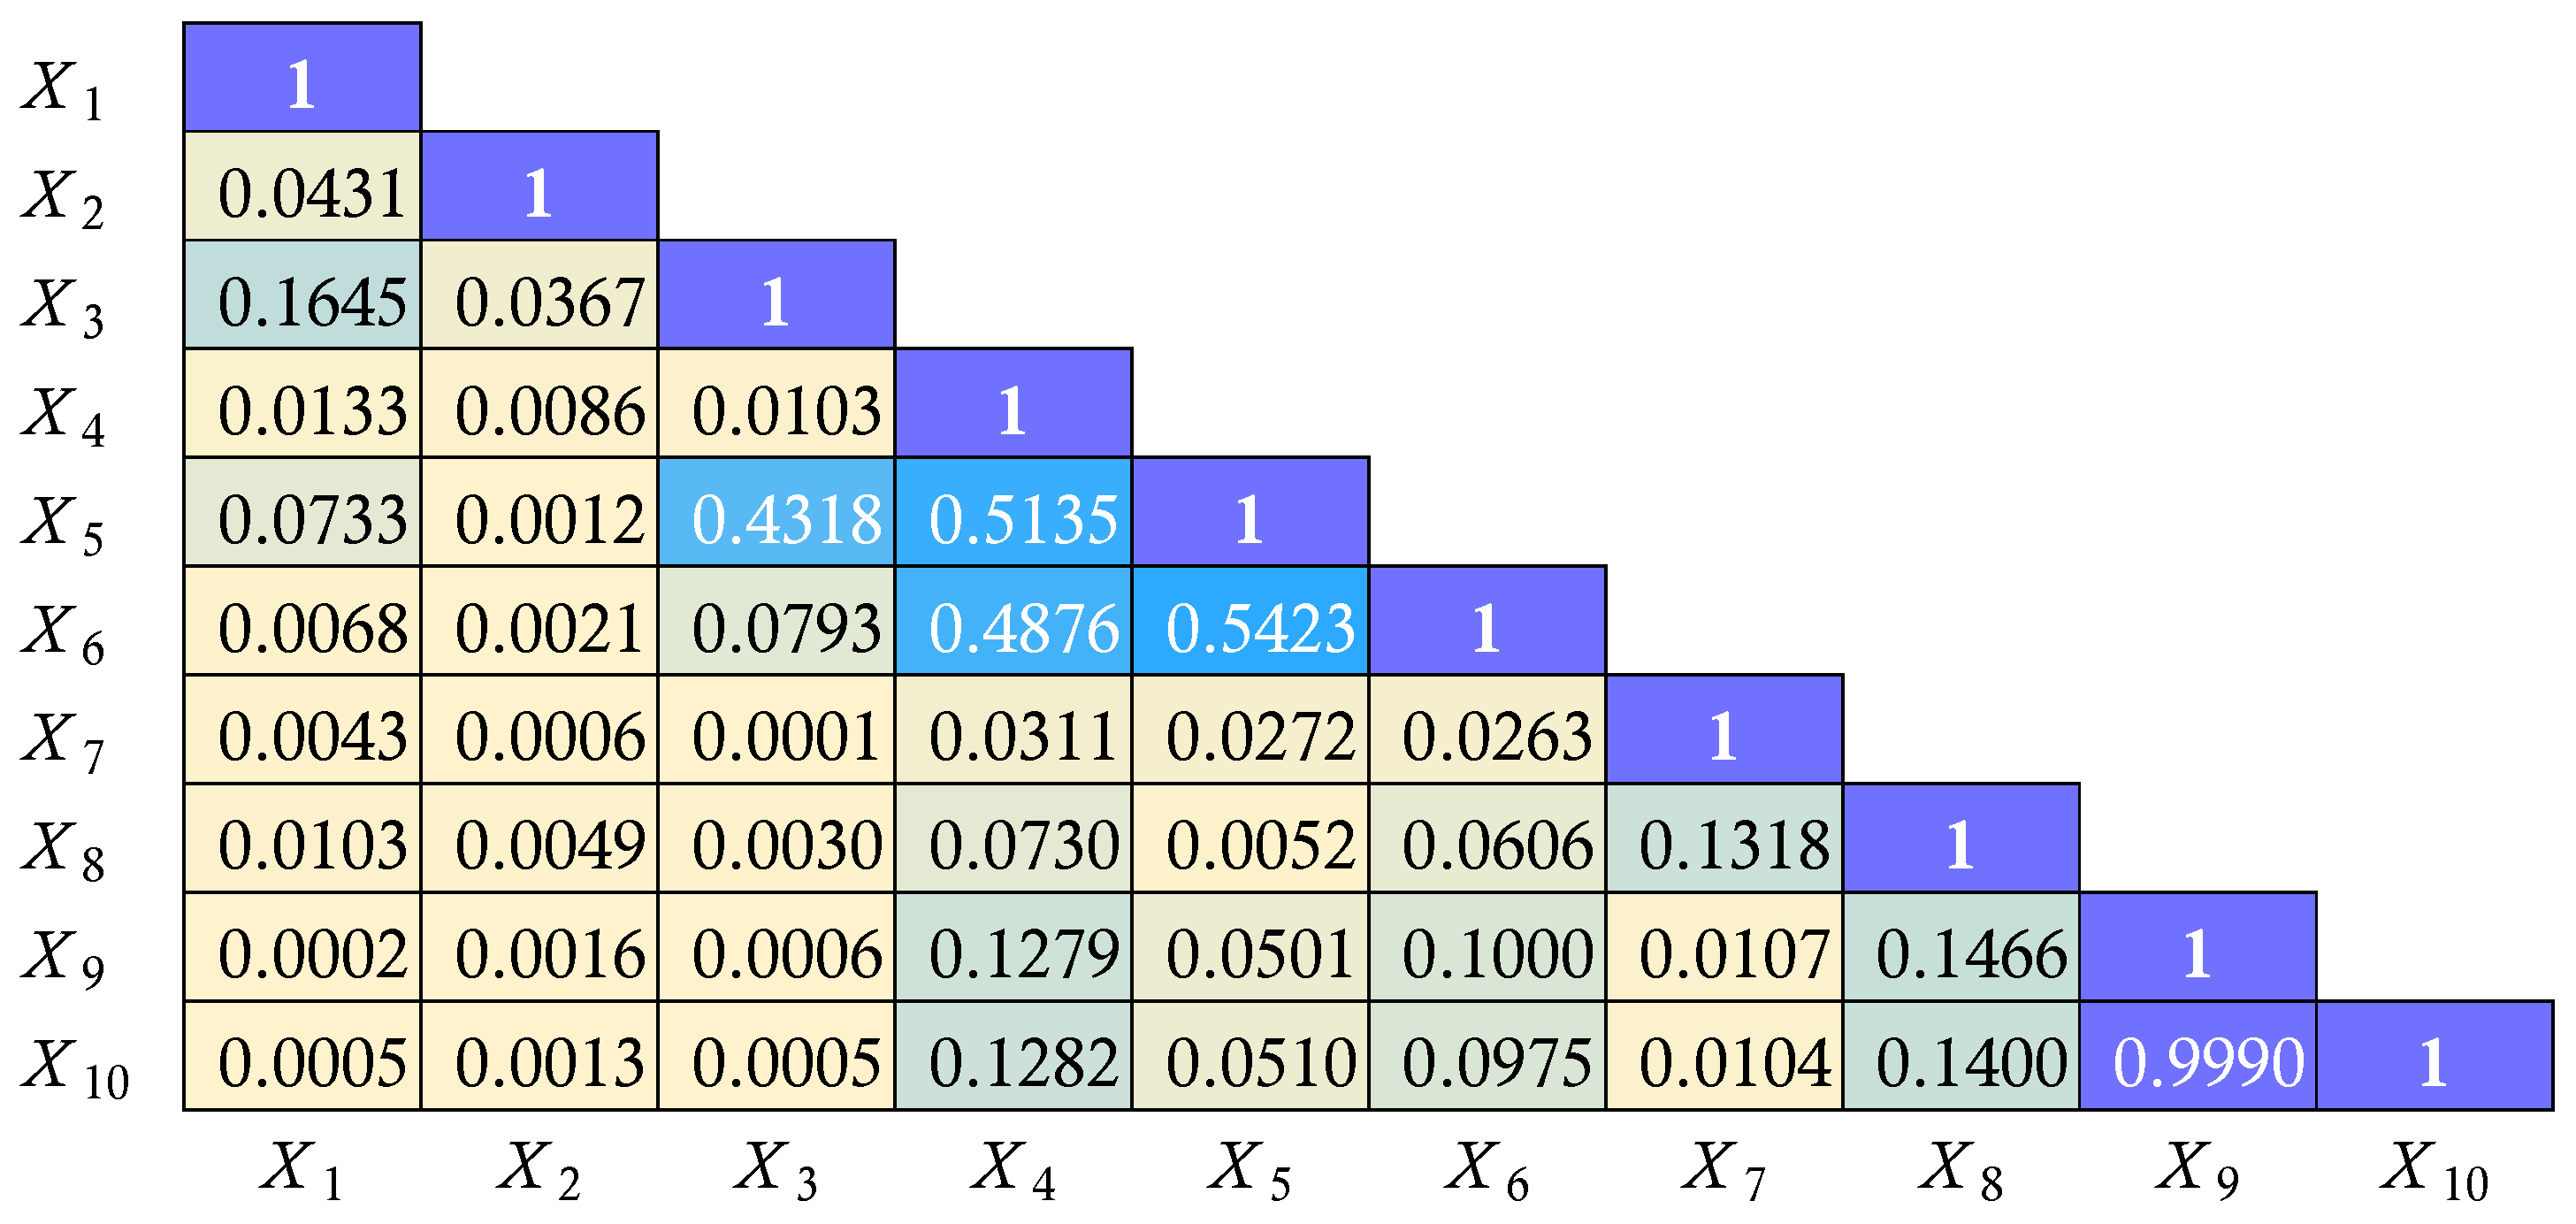
- Filter Methods: Statistical associations among the 10 predictors were assessed using point-biserial (binary vs. continuous), Cramer’s V (categorical pairs), Pearson (continuous pairs), and (categorical vs. continuous). As shown in Figure 2, all associations were weak, except for a near-perfect Pearson correlation () between Total Claim () and Incurred Loss (). We conducted an ablation study to evaluate if the choice of variable affects model performance or interpretability. Experimental results showed that swapping these features resulted in negligible changes to predictive accuracy and model stability (AUC variance ). Consequently, Incurred Loss was retained for the final model. This decision is justified by its superior operational relevance, as it reflects the ultimate financial impact on the insurer’s Loss Ratio after loss adjustments and policy deductibles have been applied, making it a more precise predictor of renewal underwriting behavior in the Thai market. Thus, the new feature set is obtained asAdditionally, the variance inflation factor (VIF) was employed to detect multicollinearity. As shown in Table 4, the remaining candidate predictors selected by VIF are the same as .
- Stepwise Selection: Stepwise feature selection refines model inputs by removing irrelevant variables, enhancing interpretability and reducing variance. Applied to motor insurance renewal data in Thailand using BLR at , the method excluded Constant () and Gender (). Setting , the final feature set was reduced to the following eight significant features:
- Mean Decrease Accuracy: MDA permutation test was applied to both RF and XGB ensembles to quantify each predictor’s contribution to overall model accuracy. For every feature , its values were randomly permuted while all remaining variables were held constant; the resulting decline in predictive accuracy was interpreted as that feature’s importance score. Near zero or negative MDA is a strong indicator that the feature should be dropped (Boonkrong et al. 2025; Zhou et al. 2021). Thus, the non-predictive feature is dropped if MDA < 0.001 in this study. In RF, the accuracy loss was assessed on out-of-bag samples, yielding the set of features as shown in Table 4. The features for MDA_RF is denoted bySimilarly for XGB, the same procedure was embedded within a 5-fold CV loop, producing the set of features from MDA_XGB as
- Mean Decrease Impurity: To complement the permutation analysis, MDI was evaluated for the same tree ensembles. In RF, the total reduction in Gini impurity contributed by each predictor across all split nodes was accumulated and averaged over the forest; the resulting scores were recorded as shown in Table 4, i.e.,In XGB, feature importance was computed as the mean gain in log-loss achieved at every split that involved a given variable, with the averages reported as MDI_XGB and the feature set was then obtained asAs shown in Table 4, 6 feature selections were used for classifying motor insurance renewal decision support. However the feature sets from MDI_RF, and MDI_XGB cover all features as . Finally, there are 5 different feature sets to be experimented with, ranging from to .
Figure 2.
The statistical association measure among 10 features for motor insurance renewal. Color intensity represents the magnitude of association, with darker shades indicating stronger associations.
Table 4.
Comparative importance of candidate predictors across six feature-selection techniques.
4.2. Classification Models
Classifying motor insurance renewal, 5 popular supervised classification algorithms including BLR, KNN, SVM, RF and XGB are employed (Boonkrong et al. 2025; Dali et al. 2024; Hanafy and Ming 2021). The binary outcome variable is defined as , where indicates renewal and indicates lapse. Each policy is represented by a feature vector as given in Table 2 and Table 3. A supervised classification model is trained to estimate the conditional probability . To clarify the operational purpose of the model, we adopt a decision theoretic framing in which the predicted probability serves as a risk signal rather than an autonomous decision rule. Specifically, the decision for policy i is formalized as
where denotes a predefined risk threshold. BLR serves as a standard baseline for comparison. KNN provides a non-parametric approach, leveraging local data structure without strong distributional assumptions. SVM introduces a robust boundary-based classifier, particularly effective in high-dimensional spaces with well-separated classes. RF, an ensemble method based on decision trees, captures nonlinear relationships and interactions among variables while offering intrinsic measures of feature importance. XGB is selected for its computational efficiency, regularization capabilities, and high predictive accuracy (Simmachan and Boonkrong 2025). AutoML is used as an external validation tool to assess whether the manually designed, interpretable pipeline leads to competitive performance. Classifying policy renewal, the corresponding confusion matrix provides vital performance insights. Accuracy, precision, recall, F1-score and AUC were employed for model performances (Boonkrong et al. 2025; Simmachan and Boonkrong 2025).
4.3. Hyperparameter Tuning
In motor insurance renewals decision support framework, hyperparameter tuning was conducted using GridSearchCV with 5-fold stratified CV to maximize classification accuracy. Let denote the dataset, and parameter grids spanned all relevant dimensions. The hyperparameter tuning for each ML classifier is given as follows:
- BLR: A 5-fold stratified grid search over the set was conducted using the lbfgs solver (tolerance = , max_iter = 1000). Predictors were standardized, and the C value maximizing mean validation accuracy was selected.
- SVM: A 5-fold stratified grid search over with an RBF kernel was employed, where C balances margin width and misclassification penalty, and . Class proportions were preserved across folds, and the configuration maximizing mean validation accuracy was selected.
- KNN: An exhaustive grid search over where , , , was conducted via 5-fold stratified CV to maximize mean accuracy. Here, n specifies the neighborhood size, w the weighting scheme, and p the Minkowski metric ( for Manhattan, for Euclidean). Stratification preserved class proportions and extensive evaluation ensured reproducibility.
- RF: The RF hyperparameter space defined as . The parameters , , , , were optimized through exhaustive 5-fold stratified grid search using GridSearchCV. Tuning of ensemble size (), tree depth (d), split (s) and leaf (ℓ) constraints, and impurity criterion (c) balanced bias-variance, with a fixed random_state ensuring reproducibility.
- XGB: The XGB hyperparameter grid was specified as where , , , , and . The notation is the learning rate and , are the subsample and column sample fractions. Early stopping limited overfitting, while a 5-fold grid search identified the configuration with optimal validation accuracy.
The optimal hyperparameters were then fixed, and final model performance was assessed on the independent 30% test set.
4.4. Statistical Tests for Comparisons
Non-parametric multiple comparison procedures (MCPs) was used when the assumptions of normality and homogeneity of variances are violated. Following a significant Kruskal–Wallis test, a non-parametric alternative to one-way ANOVA, multiple comparison procedures (MCPs) were applied to the mean 5-fold CV results to isolate statistically significant performance differences across the classification metrics and model groups (Boonkrong et al. 2025; Rainio et al. 2024). Among these, Dunn’s test is one of the most widely used non-parametric post hoc tests, designed for all-pairs comparisons using rank sums. To control the family-wise error rate (FWER) in the context of multiple testing, the Holm step-down method can be applied to adjust p-values. Effect magnitudes were interpreted using Cohen’s conventional thresholds (small, moderate, and large), with practical significance quantified via rank-biserial correlation. Non-parametric pairwise comparisons of AUC and F1-scores were conducted using Dunn’s test, with Holm’s sequential adjustment applied to control for multiple testing, where ordered p-values were compared against progressively less stringent thresholds . This approach was chosen for its robust control over false positives while providing greater statistical power than more conservative corrections.
4.5. SHapley Additive exPlanations
High predictive accuracy alone is insufficient when a model’s mechanism is opaque. SHAP mitigates this limitation by decomposing each prediction into feature-level contributions with game-theoretic guarantees (Boonkrong et al. 2025; Salih et al. 2025; Simmachan et al. 2025; Wang et al. 2024). Since SHAP satisfies the axioms of efficiency, symmetry, dummy, and additivity, it yields coherent importance rankings across algorithms and datasets, outperforming earlier post hoc heuristics. Accordingly, SHAP is employed herein to rank predictors and visualize their marginal effects, ensuring interpretability without sacrificing performance. Thus, ML models enhance motor insurance operations by identifying risk drivers and segmenting customers through interpretable frameworks that ensure fair, transparent, and compliant pricing.
5. Numerical Results
A comprehensive evaluation of 25 ML scenarios, derived from 5 classifiers and 5 feature sets, is conducted to identify the optimal model and assess the effectiveness of feature reduction. Additionally, SHAP analysis is employed to provide model interpretability by quantifying the importance and impact of key predictors on insurance renewal decisions.
5.1. Classification Performance
Classification algorithms are systematically benchmarked across various feature sets to assess their impact on key metrics. The superiority of specific classifiers is demonstrated, and it is shown that predictive accuracy can be maintained or improved with more parsimonious feature sets.
5.1.1. Comparison of ML Classifiers
To investigate the impact of different feature sets and classifiers, Table 5 summarizes the performance of 5 classifiers across 5 feature selection strategies. In addition to mean performance, standard deviations (SDs) from 5 to fold CV were included to validate model stability. The SDs showed less than 5% suggested that the model stability is satisfied. The best performer in each feature set is indicated in bold. Particularly for the classification purposes, key evaluation metrics reported include AUC, F1-score and accuracy are, respectively, prioritized. Based on numerical results, among the 25 manual models, RF-MDA_RF or Random Forest model with four features () is the best model. Interestingly, when compared with the H2O AutoML using all features, the results are comparable. Instead of descriptive statistic comparison, statistical tests were employed. Since all 3 evaluation metrics are not normally distributed (Shapiro–Wilk Statistics, ), Kruskal–Wallis H test (non-parametric test) was used instead of ANOVA F-test. The statistical test claims that at least one classifier is different from others for the three metrics (). Subsequently, the non-parametric MCP test was further implemented. The pairwise comparison results in Table 6 provide insights into both the statistical significance and the practical relevance of performance differences between the classifiers. The table presents adjusted p-values from the post hoc test and the corresponding rank-biserial correlation (r) effect sizes with their magnitude interpretation. The bold font is used to indicate significant pairwise comparisons where the adjusted p-value is less than the significance level ( = 0.05). The analysis concludes that RF and XGB are the most effective models for this renewal classification task, while various models show statistically significant differences, the large effect sizes emphasize that using advanced ensemble methods provides substantial practical improvements in AUC and F1-score compared to traditional methods like BLR or KNN. The post hoc test results for Accuracy are equivalent to the two metrics. The choice between RF and XGB can therefore be made based on other practical considerations, e.g., interpretability requirements, or specific operational constraints, rather than performance metrics alone.
Table 5.
Mean (%) and SD of model performance across classifiers and feature selection techniques.
Table 6.
Pairwise comparison of classification performance.
5.1.2. Impact of Feature Selection
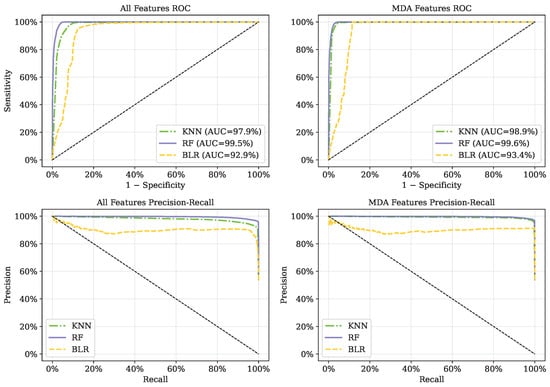
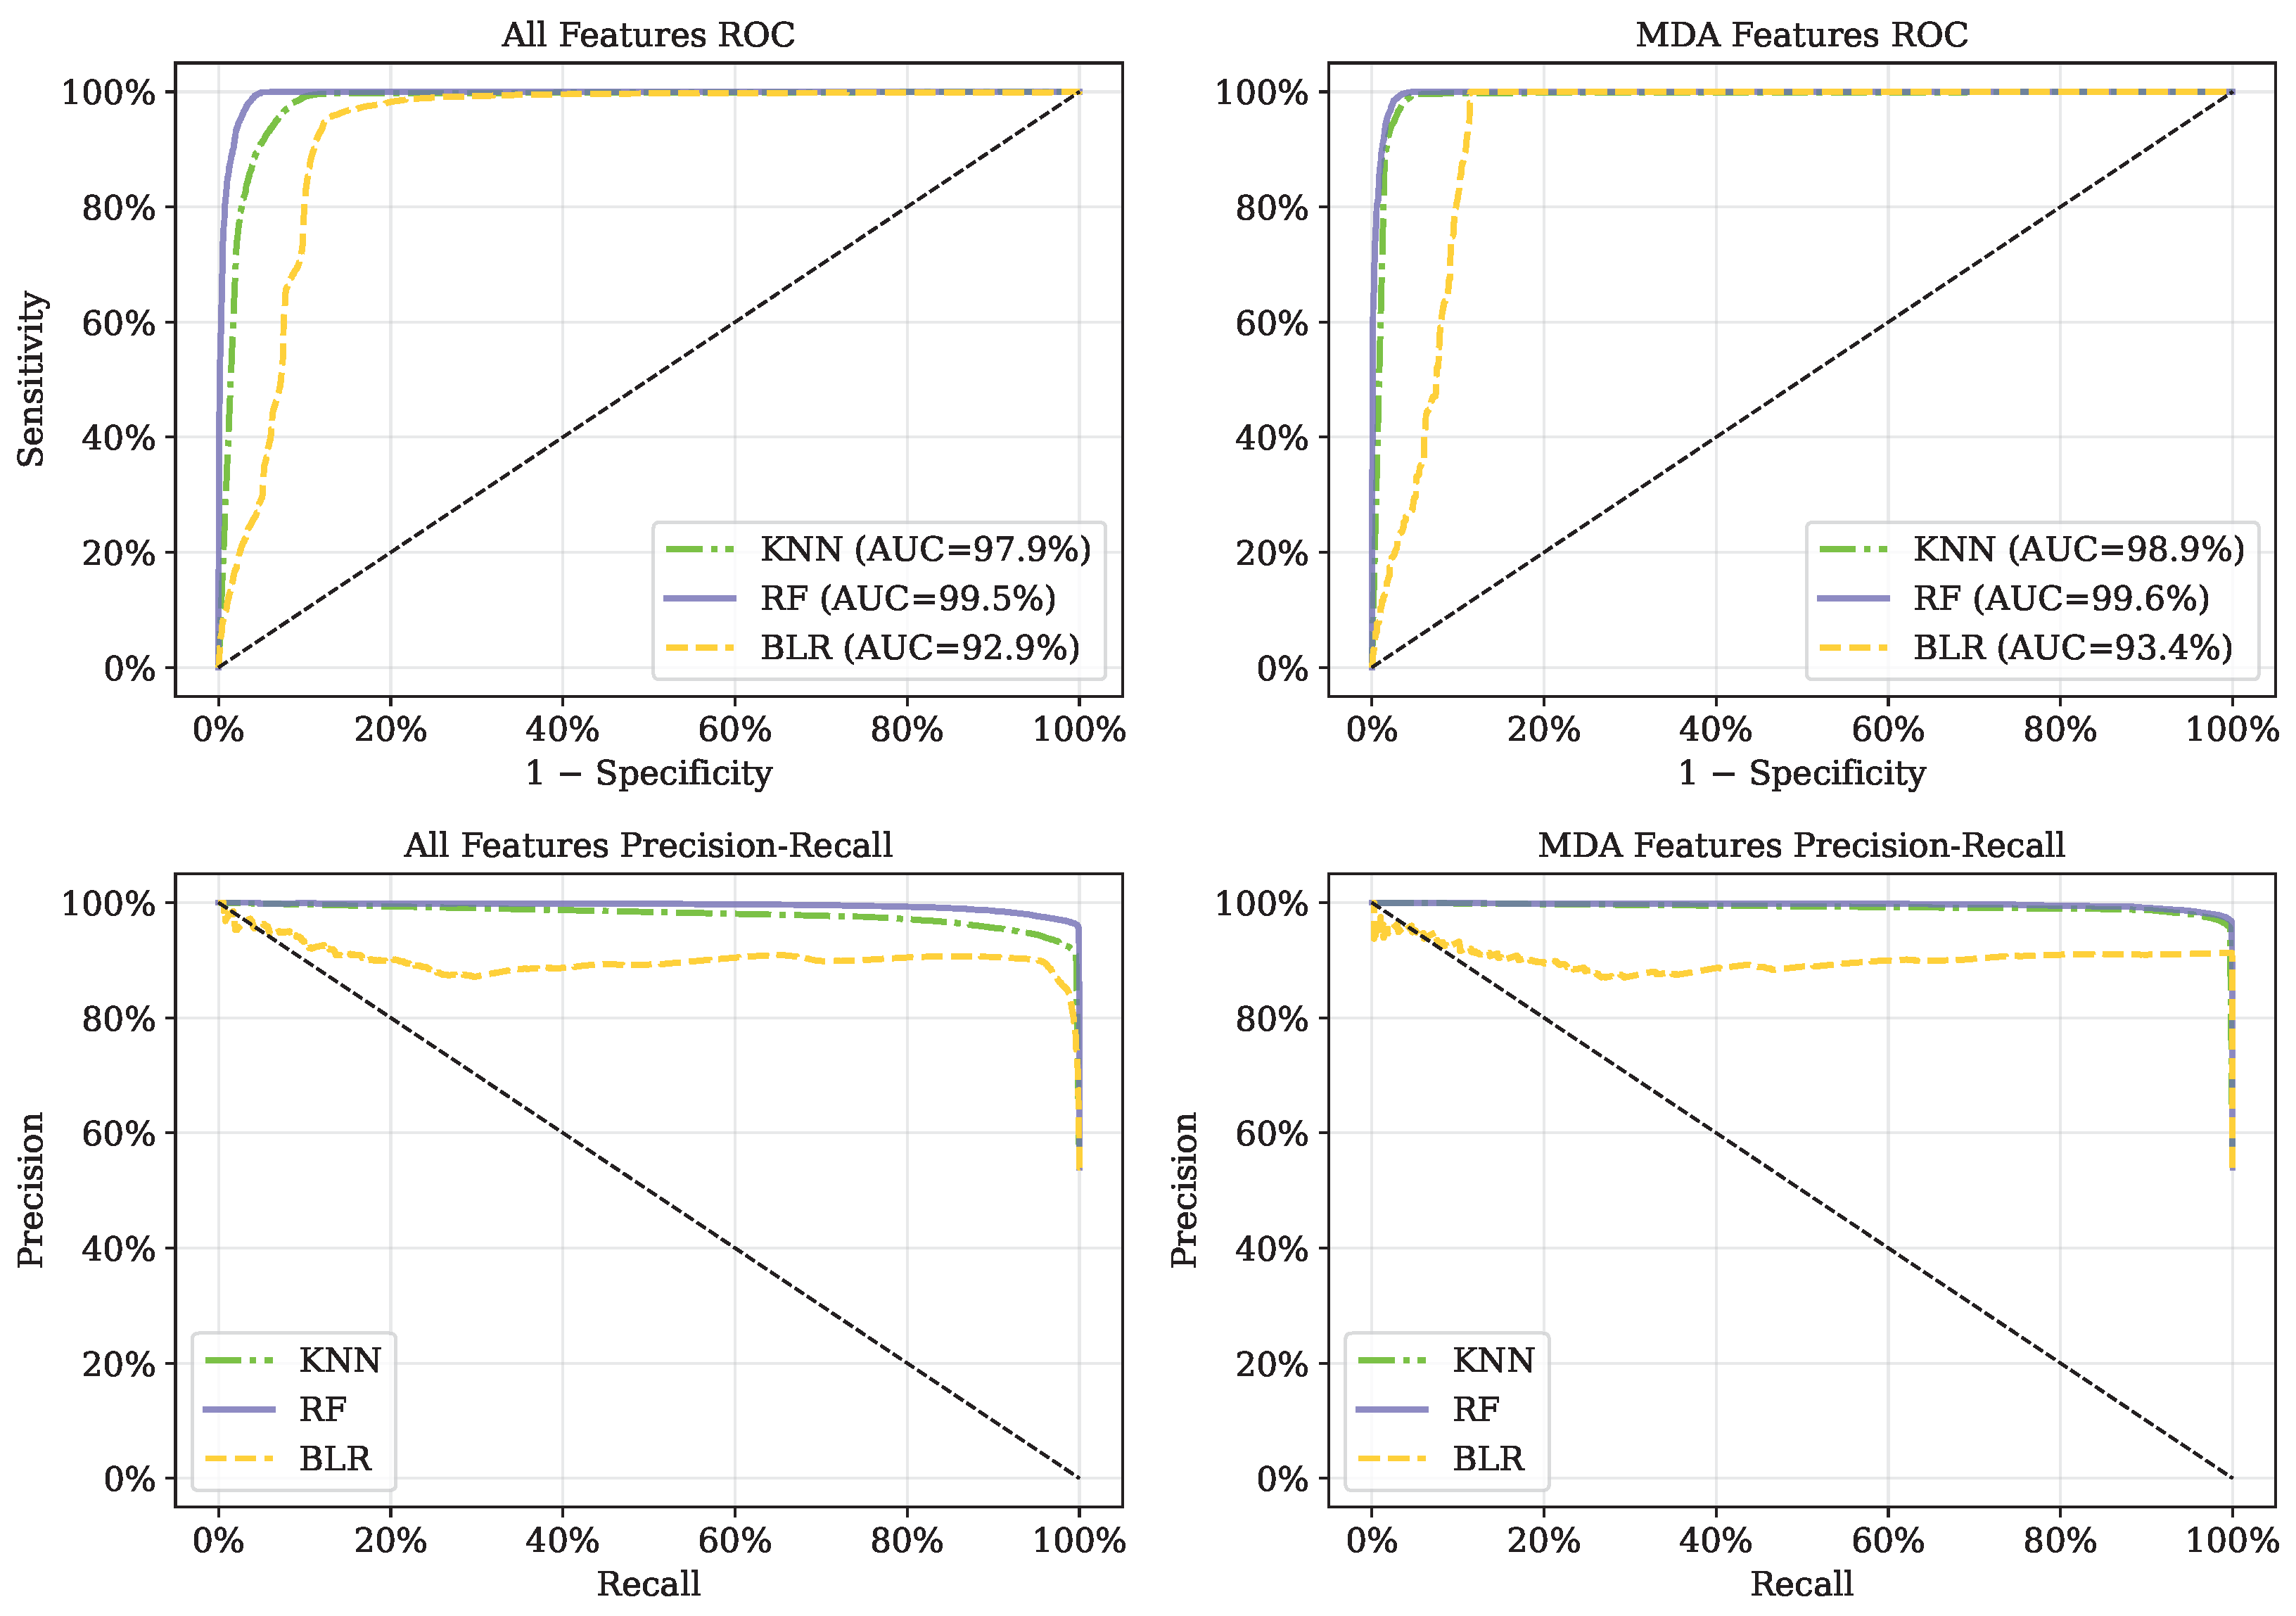
Feature selection plays a critical role in enhancing the performance, interpretability, and generalizability of ML models. Comparing the combinations of ML models and –, it is seen that a reduced model can maintain, or even improve classification performance. Taking into account the feature selection techniques, there was no difference among all metrics: accuracy (), F1-score () and AUC (). That is, all 5 feature sets showed comparable performance in creating classification models. As shown in Figure 3, RF and XGB models using achieved an AUC of 99.62% and 99.54%, respectively, with F1-scores approximately 98%. The ROC/AUC and precision-recall curves confirmed that the reduced feature set achieved comparable or superior predictive accuracy while enhancing computational efficiency and the model interpretability required in regulated sectors like insurance. AutoML serves as an external validation benchmark to verify that the manually curated, interpretable pipeline remains competitive with fully automated systems. The RF_MDA () configuration demonstrates that a parsimonious model can match or slightly exceed the predictive performance of AutoML while offering significantly better transparency for stakeholders.
Figure 3.
Comparison of ROC/AUC and precision-recall curves from three example classifiers for 10 (left) and 4 features (right).
5.2. Model Interpretation
To enhance model transparency and explainability, SHAP analysis was applied to quantify the marginal impact of each predictor on renewal decisions. The global feature importance and individual-level effects across selected features were highlighted. The SHAP framework enables visual interpretation of how feature values influence predictions and offers insights into customer behavior patterns.
5.2.1. SHAP Analysis
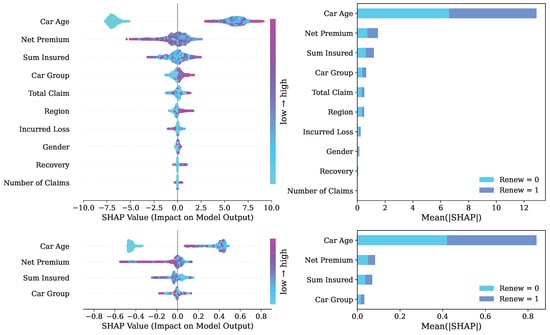
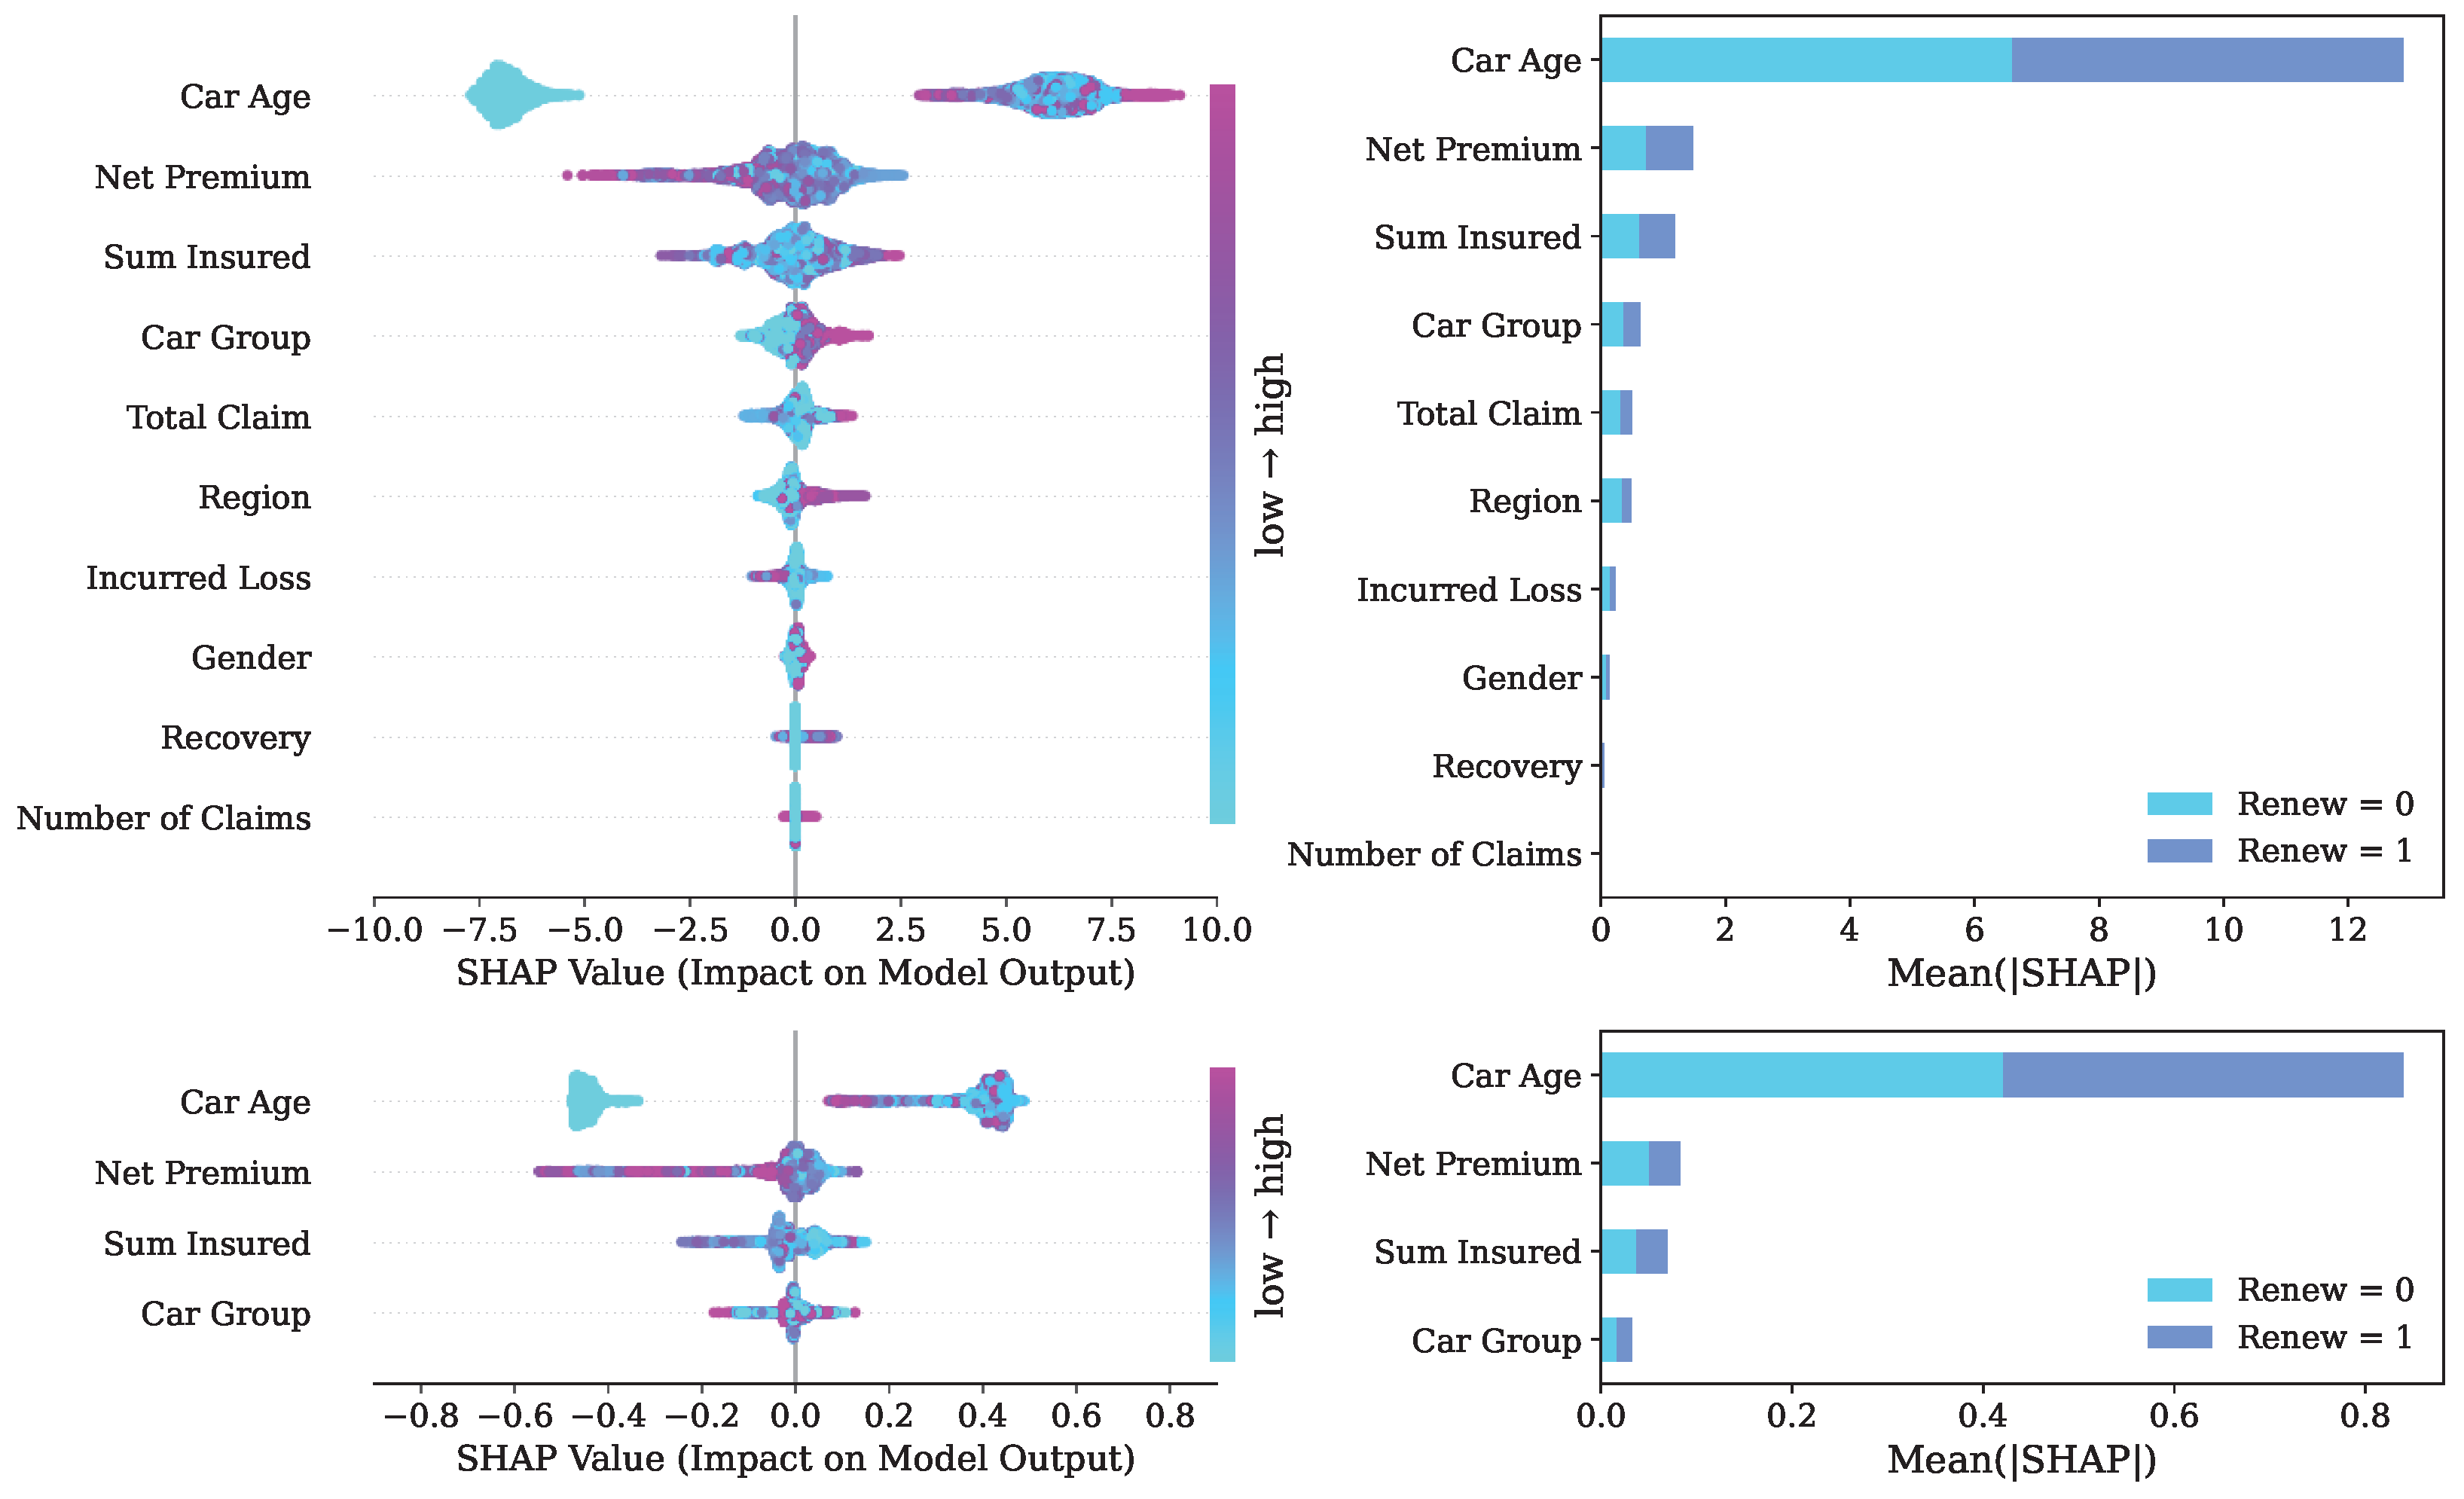
SHAP-based feature importance, partial dependence insights, and sensitivity analyses to assess model stability under varying data-perturbation scenarios. As shown in Figure 4, 10 predictors were ranked for motor insurance renewals. The largest contribution was generated by Car Age, i.e., newer vehicles were positively associated with renewal, whereas older vehicles were linked to negative contributions. A similarly pronounced influence was exhibited by net premium; high premiums were found to diminish retention, while competitive premiums were seen to increase it. sum insured produced a comparable but more moderate gradient, reflecting the trade-off perceived between coverage and price. Car group was identified as the fourth driver: economical segments were favored, whereas luxury segments were penalized. Claim-related attributes including total claim, region, incurred loss, and number of claims were clustered next, indicating that loss-free histories were rewarded, while recent or costly claims were penalized. Finally, marginal yet non-zero effects were produced by gender and a proprietary recovery flag. SHAP analysis identifies car age as the most influential predictor of renewal decisions. Higher car age consistently produce strong positive SHAP values, while younger cars show mixed or negative contributions. With the highest mean SHAP value of 6.33, car age clearly outweighs all other variables, indicating that older vehicles are more likely to renew, possibly reflecting price sensitivity, perceived value of continued coverage, or reduced incentive to switch insurers.
Figure 4.
SHAP summary plots of ranking factors and impacts of features: XGB (10 features) and RF (4 features).
5.2.2. Individual Effects of Important Features
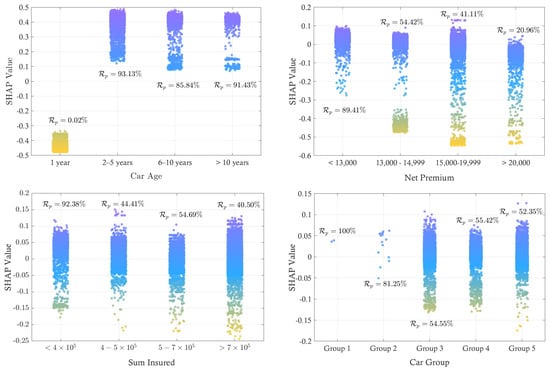
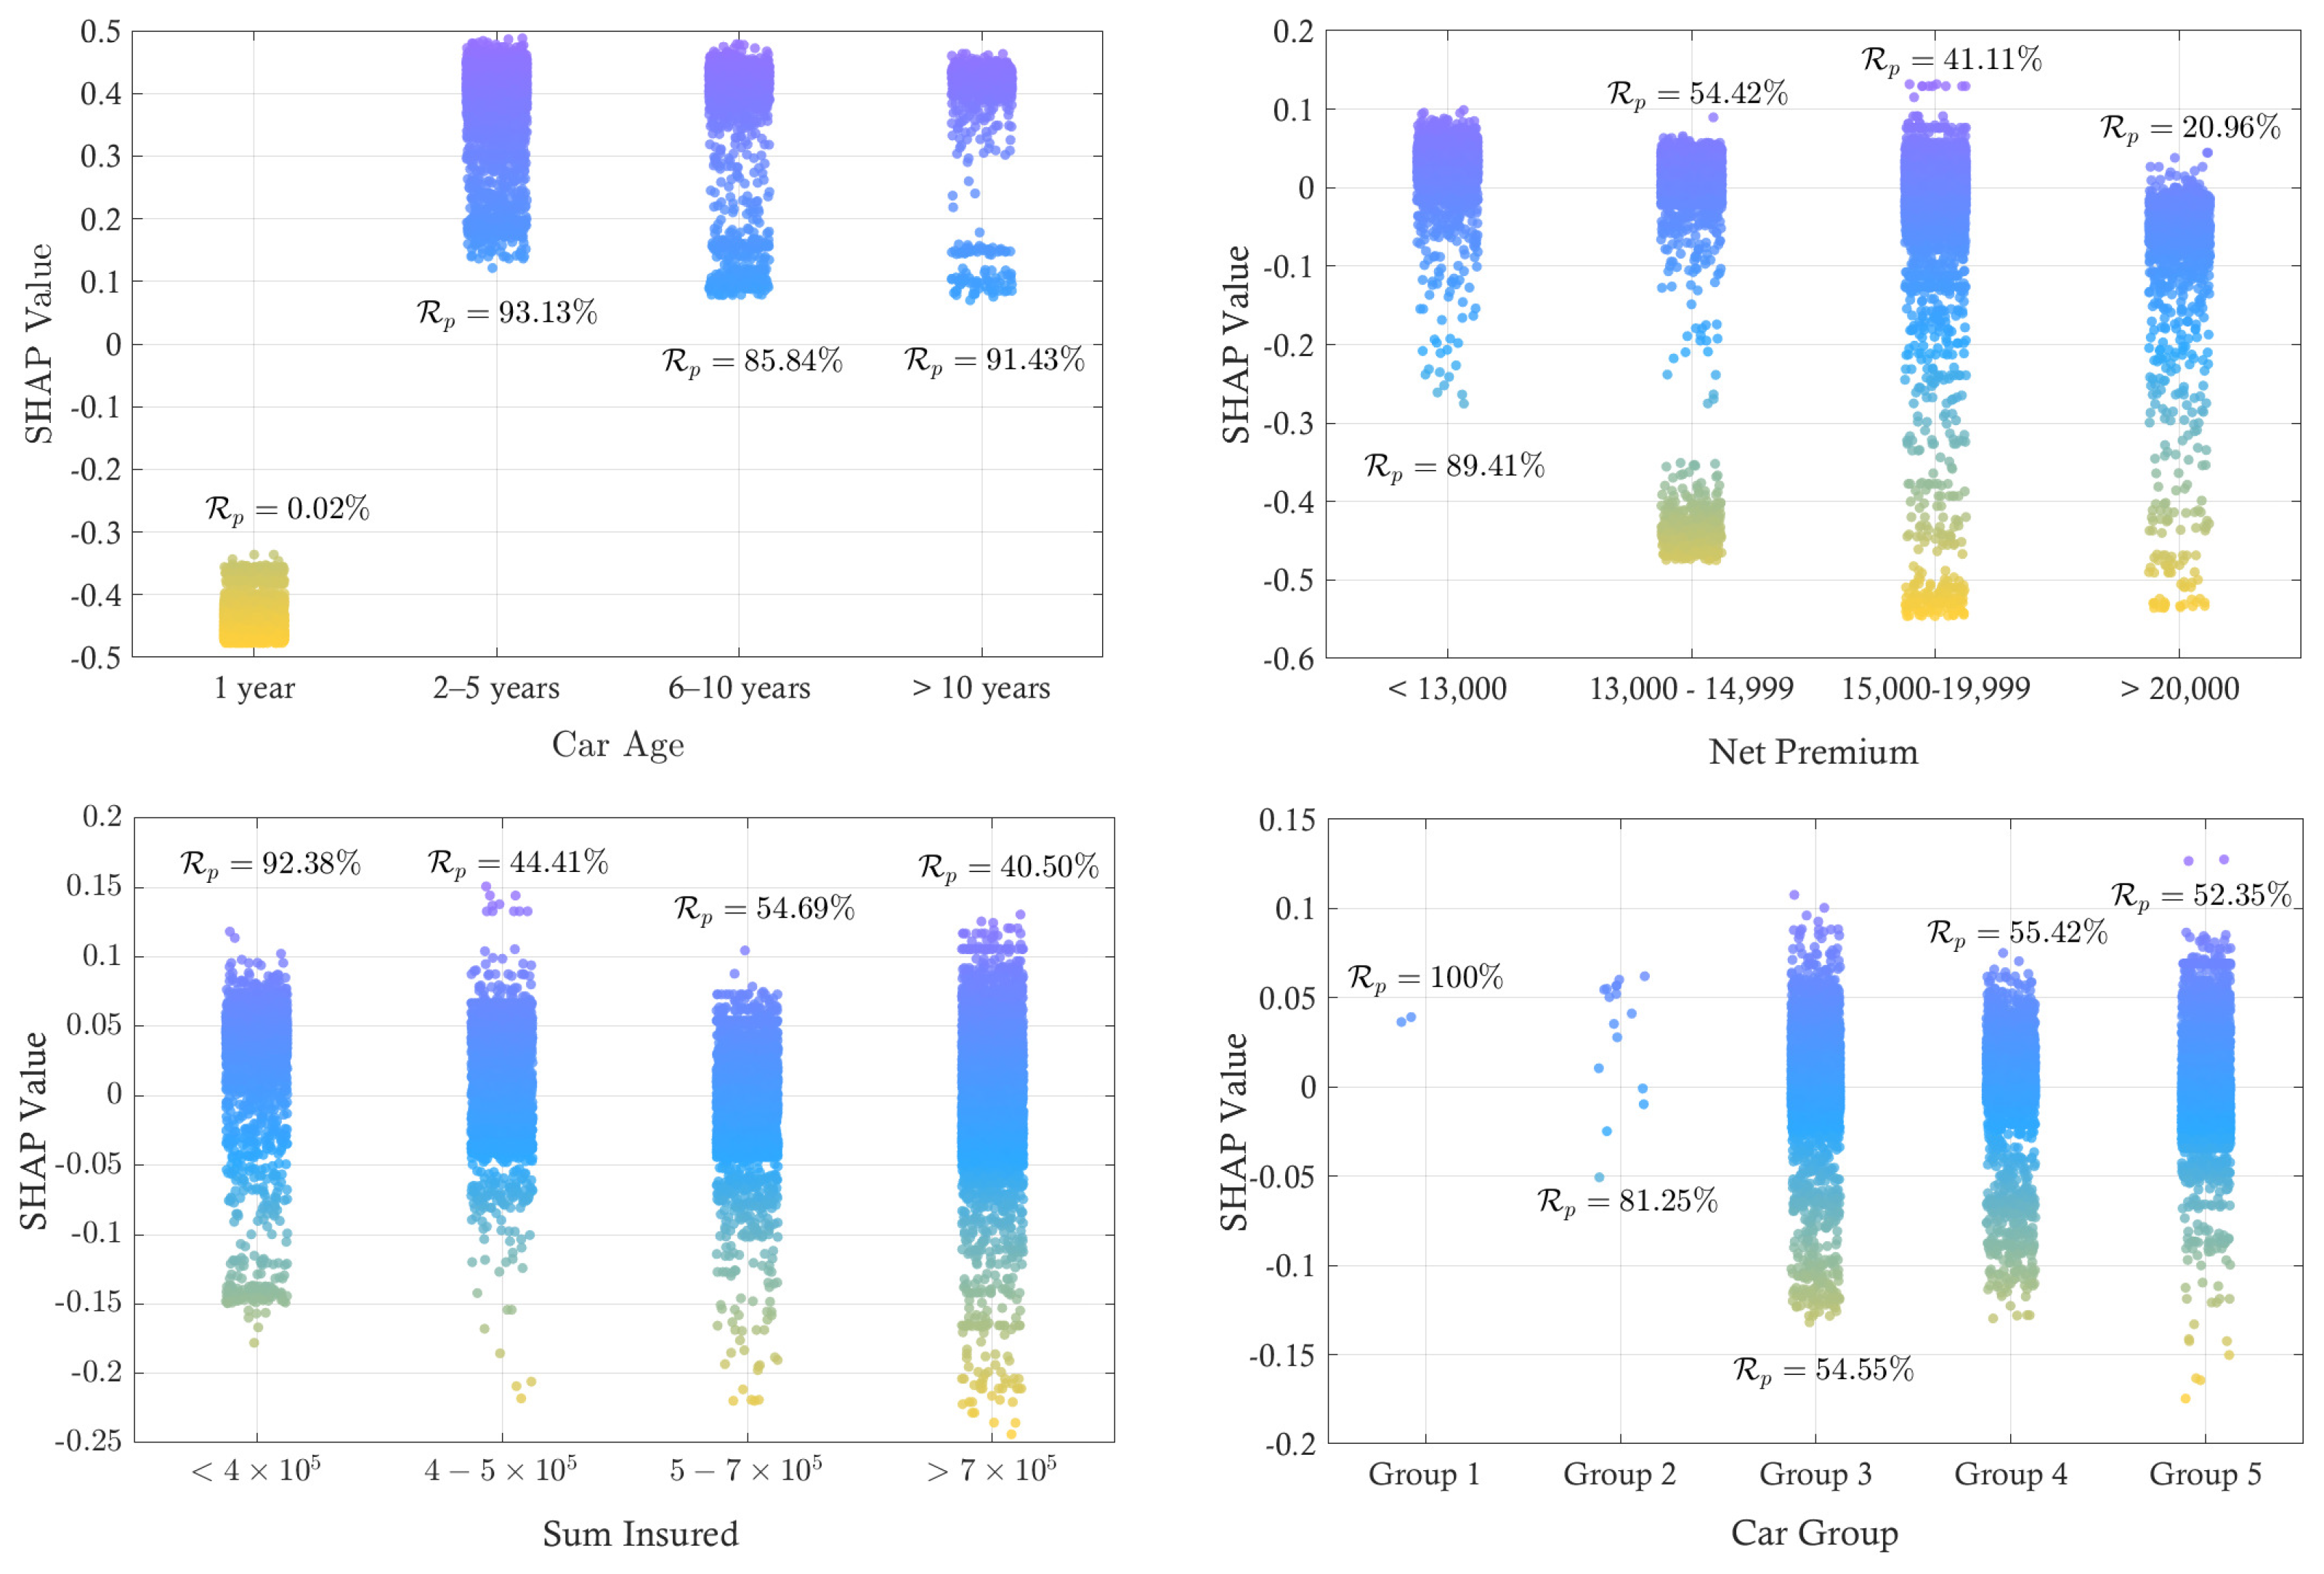
The details of the feature contributions of the top four features was further investigated. Figure 5 displays SHAP value dispersion for , stratified into , where yellow denotes lower SHAP values (associated with lower renewal rates) and purple denotes higher SHAP values (associated with higher renewal rates). One-year-old vehicles cluster near , indicating negative influence on the renewal score, and exhibit the lowest observed of 0.02%. Car age of 2–5 years yield dense, highly positive SHAP values (up to 0.5) and the highest of 93.13%. Categories 6–10 years and >10 years maintain positive, though weaker, contributions, aligning with of 85.84% and 91.43%, respectively. First-year vehicles show higher early churn due to price sensitivity and insurer switching, while renewal rates rise notably after year one, reflecting growing customer loyalty. Focusing on net premium across four price bands, premiums under 13,000 yield mainly positive SHAP values (0–0.1) and the highest of 89.41%. As premiums rise, SHAP distributions shift downward, reaching in the >20,000 band, and renewal proportions fall sharply through successive categories, highlighting price sensitivity within the insurer’s customer base. Thus, maintaining competitively low premiums remains crucial for sustaining renewal rates. Sums insured below 4 present predominantly positive SHAP values (to 0.15) and the highest renewal share (). In the 4–5 and 5–7 bands, median contributions drift toward zero while negative tails deepen to , paralleling lower renewal proportions. Policies exceeding display the most negative dispersion and record the lowest renewal rate. Similarly, lower coverage limits promote retention, whereas high sums insured markedly diminish renewal likelihood. For the car group, group 1 exhibits uniformly positive values around 0.04 and achieves a perfect of 100%. Group 2 remains positive but slightly lower (). Groups 3–5 exhibit lower renewal rates ( of 54–55%). This pattern highlights risk segmentation in pricing. Strategies should prioritize retention of groups 1–2 while addressing risk factors in groups 3–5.
Figure 5.
Individual effect of top 4 features: car age, net premium, sum insured and car groups.
6. Discussion and Implementation
The findings of this study provide new perspectives on renewal behavior within Thailand’s motor insurance sector and reflect broader industry changes toward personalized pricing, digital adoption, and data-driven marketing. The predictive modeling framework developed here offers a robust tool to support retention strategies, while the interpretability features ensure regulatory compliance and operational transparency.
6.1. Model Insights and Practical Relevance
This study highlights the effectiveness of feature selection in improving the predictive performance and interpretability of ML models for the renewal of motor insurance policies. Using the MDA method under RF, the original set of 10 features was reduced to four key predictors including car age, net premium, sum insured, and car group, while preserving near-perfect classification performance. Statistical tests confirmed the reduced model’s equivalence to full-feature versions, validating its practical use. Beyond computational efficiency, the selected features align with core insurance principles for the following reasons:
- Car age emerged as the most influential factor, with older vehicles showing higher renewal rates. This may reflect customer perceptions of higher value in maintaining coverage for aging assets, as well as decreased willingness to switch providers for lower-value vehicles.
- Net premium and sum insured were inversely associated with renewal likelihood, indicating that customers facing higher insurance costs are more prone to lapse.
- Car group further stratified the risk, with economical vehicles more likely to renew and the luxury segments showing lower retention, likely due to increased exposure to claims and competitive market alternatives.
These insights align well with the observed trends in Thailand’s motor insurance sector. Voluntary insurance plans (Types 1, 2+, 3+, and 3) offer varying levels of protection at different price points. Customers are increasingly motivated by perceived value and affordability, especially in a landscape where nearly 40% of vehicle owners remain uninsured due to misalignment between premium costs and income levels (Ad Addict 2025; Marketeer Online 2024; Priceza Money 2025; Roojai.com 2024). The model’s ability to identify and isolate key drivers related to financial and vehicle activities reinforces its utility to support personalized pricing strategies (Wang et al. 2020). These strategies are growing in Thailand as insurers tailor products to user behavior, while structured feature selection enhances model generalization and streamlines retention, underwriting, and resource use.
6.2. Comparison with Prior Studies
Various ML models have been extensively explored for predicting customer decisions in the motor insurance sector. These include decision trees, Random Forests, gradient boosting, AdaBoost, Naive Bayes, logistic regression, neural networks, and LightGBM (Guillén 2025; Hanafy and Ming 2021; Logeswaran et al. 2025; Saikia et al. 2024; Segura-Gisbert et al. 2025; Wang 2020; Wang et al. 2020). Among these, LightGBM has consistently demonstrated superior performance and robustness in predicting auto insurance renewals. Similarly, models such as RF and XGB have shown high accuracy and robustness, with Random Forests achieving an AUC of over 0.8 in several studies (Hanafy and Ming 2021; Logeswaran et al. 2025; Wang 2020), while confirming the superiority of RF and XGB, this study achieves high performance using a parsimonious set of four features, unlike prior works relying on extensive telematics (Dali et al. 2024; Ortega et al. 2023; Saikia et al. 2024). Verified through SHAP-based interpretability, these ML models enhance operational efficiency and customer trust, supporting targeted renewal strategies (Wang et al. 2020). Key predictors identified include acquisition channels, no-claim discounts (NCD), vehicle age, purchase price, and telematics-based behaviors (Roojai.com 2024; Wang 2020; Wang et al. 2020).
6.3. Industry Implications
Thailand’s motor insurance landscape is undergoing rapid transformation driven by technological, regulatory, and consumer behavior changes. The adoption of new insurance regulations for electric vehicles (EVs), effective mid-2024, underscores the need for predictive models that are adaptable to emerging risk profiles (Ad Addict 2025; Marketeer Online 2024; Roojai.com 2024), while centered on traditional vehicles, this study offers a modular framework adaptable to EV-specific attributes. Its SHAP-based interpretability meets the rising demand for transparency in digital insurance, especially post-COVID. These explainable models can enhance quote personalization, automated underwriting, and real-time engagement (Ortega et al. 2023). Additionally, the rise of telematics enables a shift toward usage-based pricing by integrating data on driving behavior, mileage, and time-of-day, thereby improving underwriting accuracy, promoting safe driving, and reducing fraud. As digital ecosystems mature, integrating telematics with interpretable ML models will be essential for developing adaptive, customer-centric solutions (Ad Addict 2025; Marketeer Online 2024; Roojai.com 2024; Wang 2020; Wang et al. 2020). Furthermore, the findings of this study provide insurers with actionable insights to implement customer-centric strategies as follows:
- Personalized Pricing: The strong association between renewal proportion and features, e.g., vehicle age and current premium levels, provides a robust foundation for dynamic pricing optimization (Byrne 2024; Hosein 2022). Quantifying the price elasticity of different customer segments, insurers can implement precision discounting for high-likelihood renewers to secure long-term lifetime value. Conversely, for higher-risk segments, premium adjustments can be calibrated to balance loss ratios without triggering mass churn. This granularity shifts the paradigm from collective actuarial pools to individualized risk-reward profiles, optimizing competitiveness in price-sensitive markets.
- Loyalty Incentives: Customers exhibiting consistent renewal histories represent lower acquisition costs and higher portfolio stability. These insights allow for the design of data-driven loyalty programs, e.g., tiered premium reductions, “no-claim” bonuses, or bundled extended service packages that create high switching costs for competitors (Ortega et al. 2023; Spiteri and Azzopardi 2018). Beyond simple retention, these incentives foster a virtuous cycle of customer engagement, where positive behavioral data is rewarded with tangible financial benefits, thereby reducing the churn rate and improving the overall quality of the insurer’s book of business.
- Risk-Based Customization: SHAP analysis facilitates sophisticated underwriting by isolating the marginal contribution of features like incurred losses and specific vehicle categories (Byrne 2024; Ding et al. 2025). This interpretability allows underwriters to move beyond static rating tables toward flexible policy structures that dynamically reflect individual risk trajectories. By identifying the exact drivers of risk, insurers can offer hyper-niche coverage options, e.g., mileage-limited or usage-restricted policies that align premium costs with actual exposure. This precision not only optimizes the loss ratio but also ensures that lower-risk individuals are not subsidizing high-risk outliers.
- Digital Communication: Personalized reminders, AI-driven chatbots, and mobile-first policy management interfaces have become critical touchpoints in Thailand’s maturing digital economy. By integrating predictive renewal insights into these channels, insurers can automate “next-best-action” prompts, e.g., one-click renewals for low-risk clients or proactive support for complex claims. However, operationalization in a production environment requires these engineering and MLOps perspectives for insurer adoption, as maintaining real-time responsiveness and model reliability is paramount (Balona 2024; Tereszkiewicz and Skalski 2025). Without a structured MLOps pipeline, these digital ecosystems risk deploying stale models or failing to handle the high-concurrency demands of a live insurance APP. Engineering robust data pipelines and automated monitoring ensures that predictive insights remain accurate and latency-free, streamlining the administrative burden while satisfying consumer demand for seamless, transparent, and instantaneous service delivery.
- Regulatory Alignment: Transparent pricing mechanisms and fair underwriting practices, informed by interpretable ML models, can ensure compliance with evolving standards, e.g., the EU AI Act and Solvency II while fostering trust and credibility in the competitive insurance sector (De Filippis 2025; Larochelle et al. 2023; Tereszkiewicz and Skalski 2025). Under the EU AI Act, AI-driven risk assessments are categorized as “high-risk” due to their impact on financial inclusion. Leveraging SHAP values enables insurers to move beyond opaque predictions, satisfying the “right to explanation” mandated by global data protection standards. Furthermore, these models support the Solvency II “Use Test” by demonstrating that predictive logic is both statistically robust and functionally integrated into capital allocation and technical provision frameworks.
6.4. Limitations
Although this study demonstrates strong predictive performance using a large, structured type 1 motor insurance dataset, certain scope-related considerations remain. The available predictors primarily capture vehicle and financial attributes, while behavioral and telematics-based factors, shown in prior literature to influence renewal decisions, were not accessible. The dataset also reflects only type 1 voluntary policyholders, meaning renewal dynamics under alternative coverage levels may differ. Furthermore, additional contextual variables, e.g., distribution channels or claim-handling experience, may enhance practical deployment. These considerations suggest valuable avenues for expanding the framework to broader policy types, behavioral indicators, and richer customer experience data in future work. A modular integration pathway is proposed in which the current four-feature model () serves as a static baseline for risk assessment. Within this framework, a stable predictive core can be maintained by insurers while Thailand’s digital infrastructure matures to support the collection of behavioral data. It is envisioned that dynamic features, such as telematics-derived scores, may be appended to this foundational model as a behavioral multiplier once market adoption facilitates such data integration.
7. Conclusions
This study developed a data-driven framework for predicting Type 1 motor insurance policy renewals in Thailand, combining multiple classification models and structured feature-selection techniques. Among 5 ML algorithms including BLR, KNN, SVM, RF, and XGB, the RF model trained on a reduced four-variable feature set demonstrated the highest overall performance. Using the MDA method under RF, four key predictors were identified: car age, net premium, sum insured, and car group. These variables explained over 93% of the variance in renewal decisions and enabled the model to achieve an AUC of 99.62% and an F1-score of 98.15%. SHAP analysis further revealed that older vehicles, lower premiums, and lower sums insured were strongly associated with higher renewal probabilities, while luxury car segments and higher claim exposure reduced the likelihood of renewal. The findings confirm the importance of financial and risk-related variables, enabling the development of interpretable and efficient tools, e.g., risk-adjusted pricing models and targeted retention campaigns. The framework’s practical scalability ensured by high accuracy with a minimal feature set and its modular design facilitate both immediate implementation and future adaptation for emerging data like electric vehicle attributes and telematics. Future research should extend this work by incorporating telematics and behavioral data with advanced models like deep learning to address evolving market dynamics, e.g., post-COVID trends and wider EV adoption, thereby providing a continually improving tool for customer retention in Thailand.
Author Contributions
Conceptualization, methodology, formal analysis, writing—original draft preparation, project administration, validation, interpretation, P.B. and T.S.; data curation, visualization, investigation, J.Y.; writing—review and editing, X.H. All authors have read and agreed to the published version of the manuscript.
Funding
This work was supported by the Thammasat University Research Unit in Statistical Theory and Applications.
Data Availability Statement
The data presented in this study are not publicly available due to restrictions imposed by the data provider, including confidentiality agreements and data protection regulations. The authors are not authorized to share the data.
Acknowledgments
The authors gratefully acknowledge the insightful comments and constructive suggestions provided by the anonymous reviewers, which have significantly contributed to the enhancement of this manuscript. Any errors that remain are the sole responsibility of the authors.
Conflicts of Interest
The authors declared no conflicts of interest.
References
- Abdelhadi, Shady, Khaled Elbahnasy, and Mohamed Abdelsalam. 2020. A proposed model to predict auto insurance claims using machine learning techniques. Journal of Theoretical and Applied Information Technology 98: 3428–37. [Google Scholar]
- Ad Addict. 2025. 9 Key Takeaways on the Future of Car Insurance in Thailand. Available online: https://adaddictth.com/knowledge/9-Insights-Car-Insurance-of-Thailand (accessed on 2 June 2025).
- Aslam, Faheem, Ahmed Imran Hunjra, Zied Ftiti, Wael Louhichi, and Tahira Shams. 2022. Insurance fraud detection: Evidence from artificial intelligence and machine learning. Research in International Business and Finance 62: 101744. [Google Scholar] [CrossRef] [Scilit]
- Balona, Caesar. 2024. Actuarygpt: Applications of large language models to insurance and actuarial work. British Actuarial Journal 29: e15. [Google Scholar] [CrossRef] [Scilit]
- Bayram, Firas, and Bestoun S. Ahmed. 2025. Towards trustworthy machine learning in production: An overview of the robustness in mlops approach. ACM Computing Surveys 57: 121. [Google Scholar] [CrossRef] [Scilit]
- Boonkrong, Pichit, Subij Shakya, Wantika Kraunamkam, and Teerawat Simmachan. 2025. Dietary patterns and psoriasis severity in thai patients: A machine learning approach for small sample data. Scientific Reports 15: 33088. [Google Scholar] [CrossRef] [Scilit]
- Boonkrong, Pichit, Teerawat Simmachan, Roumporn Sittimongkol, and Rattana Lerdsuwansri. 2025. Data-driven approach in provincial clustering for sustainable tourism management in thailand. Thailand Statistician 23: 481–500. [Google Scholar]
- Brownlee, Jason. 2020. Imbalanced Classification with Python: Better Metrics, Balance Skewed Classes, Cost-Sensitive Learning. Vermont: Machine Learning Mastery. [Google Scholar]
- Byrne, Adrian. 2024. Pricing risk: An xai analysis of irish car insurance premiums. In World Conference on Explainable Artificial Intelligence. Cham: Springer, pp. 315–30. [Google Scholar]
- Cesarini, M., E. Brentegani, G. Ceci, F. Cerreta, D. Messina, F. Petrarca, and M. Robutti. 2023. Usage of the kullback–leibler divergence on posterior dirichlet distributions to create a training dataset for a learning algorithm to classify driving behaviour events. Journal of Computational Mathematics and Data Science 8: 100081. [Google Scholar] [CrossRef] [Scilit]
- Dali, Aryan, Jayesh Bane, Niranjan Badhe, and Reena Sonkusare. 2024. Car-accident insurance-claim verification with deep learning. Paper presented at 1st International Conference on Pioneering Developments in Computer Science & Digital Technologies, Delhi, India, April 26–28; Piscataway: IEEE, pp. 1–6. [Google Scholar]
- De Filippis, Michele. 2025. Ai-Driven Credit Risk Models in b2b Trade Credit Insurance: Transparency and Accountability Under the AI Act and Solvency ii Directive. Master’s thesis, Lund University, Lund, Sweden. [Google Scholar]
- Deng, Yongheng, Jia He, Bingqing Li, and Xixi Shen. 2024. Does air pollution cause more car accidents? evidence from auto insurance claims. China Economic Review 88: 102261. [Google Scholar] [CrossRef] [Scilit]
- Ding, Ning, Xiao Ruan, Hao Wang, and Yuan Liu. 2025. Automobile insurance fraud detection based on pso-xgboost model and interpretable machine learning method. Insurance: Mathematics and Economics 120: 51–60. [Google Scholar] [CrossRef] [Scilit]
- England, Rei, Iqbal Owadally, and Douglas Wright. 2022. An agent-based model of motor-insurance customer behaviour in the UK with word of mouth. Journal of Artificial Societies and Social Simulation 25: 2. [Google Scholar] [CrossRef] [Scilit]
- Gao, Guangyuan, He Wang, and Mario V. Wüthrich. 2022. Boosting poisson regression models with telematics car driving data. Machine Learning 111: 243–72. [Google Scholar]
- Grize, Yves-Laurent, Wolfram Fischer, and Christian Lützelschwab. 2020. Machine learning applications in nonlife insurance. Applied Stochastic Models in Business and Industry 36: 523–37. [Google Scholar] [CrossRef] [Scilit]
- Guillén, Montserrat. 2025. Econometrics of insurance based on telematics information and machine learning. In Handbook of Insurance. Edited by Georges Dionne. Cham: Springer. [Google Scholar]
- Hanafy, Mohamed, and Ruixing Ming. 2021. Machine learning approaches for auto-insurance big data. Risks 9: 42. [Google Scholar]
- He, Haibo, and Edwardo A. Garcia. 2009. Learning from imbalanced data. IEEE Transactions on Knowledge and Data Engineering 21: 1263–84. [Google Scholar] [CrossRef] [Scilit]
- Hosein, Patrick. 2022. A data-driven pricing strategy for automobile insurance policies. Paper presented at 5th Asia Conference on Machine Learning and Computing, Bangkok, Thailand, December 28–30; Piscataway: IEEE, pp. 1–4. [Google Scholar]
- Hosein, Patrick. 2024. A data science approach to risk assessment for automobile insurance policies. International Journal of Data Science and Analytics 17: 127–38. [Google Scholar]
- Huang, Yifan, and Shengwang Meng. 2019. Automobile insurance classification ratemaking based on telematics driving data. Decision Support Systems 127: 113156. [Google Scholar] [CrossRef] [Scilit]
- Kim, Moogeon, and Min Ho Ryu. 2025. Customer churn prediction in the automotive maintenance industry: A machine learning approach. Journal of Korea Society of Industrial Information Systems 30: 67–80. [Google Scholar]
- Kiyosov, Sherzod. 2025. Predictive analytics in automotive insurance for financial risk mitigation. In AI’s Role in Enhanced Automotive Safety. Hershey: IGI Global, pp. 423–36. [Google Scholar]
- Larochelle, Jean-Philippe, Peter Carlson, Vincent Carrier Cote, Ying Lu, Noah Shapiro, Alex Tam, Viresh Thusu, and Ally Zhang. 2023. Predictive Analytics and Machine Learning. Practical Applications for Actuarial Modeling (Nested Stochastic). Schoumburg: Society of Actuaries. [Google Scholar]
- Logeswaran, K., S. Savitha, A. S. S. Harshan, S. Suganraj, M. D. Kumar, K. R. P. Kumar, M. Gunasekar, and R. Rajdevi. 2025. Machine-learning-driven precise automobile-insurance claim predictions. In Proceedings of the 15th International Conference on Soft Computing and Pattern Recognition. Cham: Springer Nature Switzerland, pp. 125–33. [Google Scholar]
- Marketeer Online. 2024. Forty Percent of Car Owners Remain Uninsured Due to High Premium Costs. Available online: https://marketeeronline.co/archives/353974 (accessed on 2 June 2025).
- Ortega, Milagros, Jericho Quintanilla, Edward Ryan Ong, Raymond Marius Ramos, and Carla Joy Trinidad. 2023. Asfalis: A web-based system for customer-retention strategies optimisation of a car-insurance company using cohort and churn analysis. Paper presented at International Conference on Inventive Computation Technologies, Lalitpur, Nepal, April 26–28; Piscataway: IEEE, pp. 1065–72. [Google Scholar]
- Poufinas, Thomas, Periklis Gogas, Theophilos Papadimitriou, and Emmanouil Zaganidis. 2023. Machine learning in forecasting motor insurance claims. Risks 11: 164. [Google Scholar] [CrossRef] [Scilit]
- Priceza Money. 2025. Which Car-Insurance Company Is Best in 2025. Available online: https://money.priceza.com/blog/car-insurance/review-all-carinsure/ (accessed on 1 June 2025).
- Rainio, Oona, Jarmo Teuho, and Riku Klén. 2024. Evaluation metrics and statistical tests for machine learning. Scientific Reports 14: 6086. [Google Scholar] [PubMed]
- Roojai.com. 2024. Exploring the Role of Emerging Technologies and AI in the Car Insurance Industry. Available online: https://www.roojai.com/article/car-insurance-tips/ai-technology-role-car-insurance/ (accessed on 1 June 2025).
- Rustam, Zuherman, and Ni Putu Ayu Audia Ariantari. 2018. Support vector machines for classifying policyholders satisfactorily in automobile insurance. Journal of Physics: Conference Series 1028: 012005. [Google Scholar] [CrossRef] [Scilit]
- Saikia, Deepratim, Rion Barua, Mahendra Kumar Gourisaria, Anjan Bandyopadhyay, Soumya Ranjan Mishra, and Saurabh Bilgaiyan. 2024. Machine learning enhancements for car-insurance claim prediction. Paper presented at 15th International Conference on Computing, Communication and Networking Technologies, Kamand, India, June 24–28; Piscataway: IEEE, pp. 1–6. [Google Scholar]
- Salih, Ahmed M., Zahra Raisi-Estabragh, Ilaria Boscolo Galazzo, Petia Radeva, Steffen E. Petersen, Karim Lekadir, and Gloria Menegaz. 2025. A perspective on explainable artificial-intelligence methods: SHAP and LIME. Advanced Intelligent Systems 7: 2400304. [Google Scholar] [CrossRef] [Scilit]
- Segura-Gisbert, Jorge, Josep Lledó, and Jose M. Pavía. 2025. Dataset of an actual motor-vehicle insurance portfolio. European Actuarial Journal 15: 241–53. [Google Scholar] [CrossRef] [Scilit]
- Seyam, Eslam Abdelhakim. 2025. Predicting motor insurance claim incidence using generalized and tree-based models: A comparative statistical approach. Insurance Markets and Companies 16: 38. [Google Scholar] [CrossRef] [Scilit]
- Simmachan, Teerawat, and Pichit Boonkrong. 2024. A comparison of count and zero-inflated regression models for predicting claim frequencies in thai automobile insurance. Lobachevskii Journal of Mathematics 45: 6400–14. [Google Scholar] [CrossRef] [Scilit]
- Simmachan, Teerawat, and Pichit Boonkrong. 2025. Effect of resampling techniques on machine-learning models for classifying road-accident severity in Thailand. Journal of Current Science and Technology 15: 99. [Google Scholar] [CrossRef] [Scilit]
- Simmachan, Teerawat, Napatsawan Lerdpraserdpakorn, Jarupa Deesrisu, Chanadda Sriwipat, Subij Shakya, and Pichit Boonkrong. 2025. A penalized regression and machine learning approach for quality-of-life prediction in psoriasis patients. Healthcare Analytics 8: 100417. [Google Scholar] [CrossRef] [Scilit]
- Spiteri, Maria, and George Azzopardi. 2018. Customer churn prediction for a motor insurance company. Paper presented at 2018 Thirteenth International Conference on Digital Information Management (ICDIM), Berlin, Germany, September 24–26; Piscataway: IEEE, pp. 173–78. [Google Scholar]
- Staudt, Yves, and Joël Wagner. 2021. Assessing the performance of random forests for modeling claim severity in collision car insurance. Risks 9: 53. [Google Scholar] [CrossRef] [Scilit]
- Strada, Silvia, Emanuele Costantini, Simone Formentin, and Sergio M Savaresi. 2025. Machine learning based car accident risk prediction for usage-based insurance. Intelligent Data Analysis 29: 156–70. [Google Scholar] [CrossRef] [Scilit]
- Tereszkiewicz, Piotr, and Szymon Skalski. 2025. Robo-advisory services in the insurance sector under the eu regulatory framework. The Geneva Papers on Risk and Insurance-Issues and Practice 50: 545–64. [Google Scholar] [CrossRef] [Scilit]
- Thai General Insurance Association (TGIA). 2025. Member Company List. Available online: https://www.tgia.org/insurance/company (accessed on 2 June 2025).
- Verma, Vikrant, Padmavati Shrivastava, and Dhananjay Sahu. 2022. Churn Prediction using Various Machine Learning Algorithms in Telecom Sector. International Journal of Computer Applications 184: 39–45. [Google Scholar] [CrossRef] [Scilit]
- Wang, Huanjing, Qianxin Liang, John T. Hancock, and Taghi M. Khoshgoftaar. 2024. Feature-selection strategies: A comparative analysis of SHAP-value and importance-based methods. Journal of Big Data 11: 44. [Google Scholar] [CrossRef] [Scilit]
- Wang, Hui Dong. 2020. Research on the features of car insurance data based on machine learning. Procedia Computer Science 166: 582–87. [Google Scholar] [CrossRef] [Scilit]
- Wang, Jinsong, Jian Xiao, and Bo Mei. 2020. Insurance renewal probability model based on a deep-learning algorithm. Paper presented at Asia-Pacific Conference on Image Processing, Electronics and Computers, Dalian, China, April 14–16; Piscataway: IEEE, pp. 252–56. [Google Scholar]
- Zhou, Ying, Mohammad Shamsu Uddin, Tabassum Habib, Guotai Chi, and Kunpeng Yuan. 2021. Feature selection in credit risk modeling: An international evidence. Economic Research-Ekonomska Istraživanja 34: 3064–91. [Google Scholar] [CrossRef] [Scilit]

Disclaimer/Publisher’s Note: The statements, opinions and data contained in all publications are solely those of the individual author(s) and contributor(s) and not of MDPI and/or the editor(s). MDPI and/or the editor(s) disclaim responsibility for any injury to people or property resulting from any ideas, methods, instructions or products referred to in the content. |
© 2026 by the authors. Licensee MDPI, Basel, Switzerland. This article is an open access article distributed under the terms and conditions of the Creative Commons Attribution (CC BY) license.