


Highlights
What are the main findings?
- In the combined pediatric and adult cohort, automated measurements showed mean absolute errors of 0.52–1.26° across six alignment angles. Mean measurement time was 2.7 s per radiograph, compared with 77.9–100.5 s for unassisted measurement.
- AI-assisted resident measurements had lower errors for all six angles. Mean measurement time decreased from 100.5 to 10.5 s per radiograph.
What are the implications of the main findings?
- Visible anatomical landmarks and axes allow physicians to review measurements and adjust landmark positions within the clinical workflow.
- Combining automation with physician review retains the time advantage and supports efficient lower-limb alignment assessment in pediatric and adult clinical practice.
Abstract
Background/Objectives: Standing full-length radiographs support pediatric lower-limb deformity assessment and preoperative evaluation. Manual alignment measurement is time-consuming and observer-dependent. We evaluated an author-developed artificial intelligence (AI) system that provides automated measurements and reviewable anatomical landmarks. Methods: This single-center retrospective study used 240 training, 80 validation, and 80 independent test radiographs, partitioned by patient. The test cohort included 80 patients (22 pediatric) and 160 limbs (44 pediatric). Six alignment angles were assessed against the mean of three measurements by an experienced deformity surgeon. Fully automated AI, unassisted physician workflows, and an AI-assisted resident workflow were compared using intraclass correlation coefficients (ICCs), mean absolute error (MAE), Bland–Altman analysis, and measurement time. Results: Fully automated AI achieved ICCs of 0.728–0.966 and MAEs of 0.52–1.26° across the six angles. In pediatric limbs, average-measure ICCs were 0.936–0.975 for five major alignment angles; the single-measure ICC for joint line convergence angle was 0.825. For the resident evaluated, AI-assisted MAEs were 0.57–1.41°, compared with 1.22–6.83° without assistance. Mean measurement time per radiograph was 2.7 ± 0.4 s for fully automated AI and 10.5 ± 3.4 s for physician-reviewed AI, compared with 77.9–100.5 s for unassisted physician workflows. Conclusions: The AI system provided angle-specific agreement with the expert reference and substantially faster measurement than unassisted workflows. Physician-supervised AI was associated with lower measurement error for the resident evaluated. The findings suggest potential utility as a physician-reviewed measurement aid. Pediatric results are encouraging and should be interpreted as descriptive evidence within the evaluated age range.
1. Introduction
Standing anteroposterior (AP) full-length lower-limb radiographs are fundamental to the assessment of coronal mechanical alignment and joint orientation [1,2]. By depicting the hip, knee, and ankle together, they provide measurements used to characterize deformity and inform preoperative evaluation. The hip-knee-ankle angle (HKA) describes global coronal alignment, while segmental joint-orientation measurements help identify the anatomical contribution to malalignment [3,4]. In children, skeletal maturation, developmental variation, and incomplete ossification can complicate identification of anatomical reference points [5]. Reproducible assessment of alignment and deformity location is therefore relevant to both pediatric and adult practice [4,6,7].
Manual alignment measurement is time-consuming and dependent on observer experience [8,9,10]. The examiner identifies landmarks at the hip, knee, and ankle, constructs mechanical axes and joint-orientation lines, and calculates the resulting angles. Small differences in landmark placement can propagate into angular measurement error. Consistent landmark identification is particularly relevant in teaching settings, where trainees and early-career orthopaedic surgeons perform deformity measurements while developing their clinical expertise.
Artificial intelligence (AI) can automate landmark localization and alignment measurement on long-leg radiographs. Previous studies have reported close agreement between AI measurements and human raters for several alignment parameters [9,11,12,13,14]. Studies that assessed reading time have also reported shorter measurement times [8,10,13,14]. Pediatric evidence is also emerging: van der Lelij et al. evaluated an AI measurement assistant in patients aged 11–18 years [15]. Clinical implementation additionally requires an understanding of physician-supervised workflows, in which the clinician can review predicted landmarks and axes and adjust them before accepting the measurements. The effect of this assistance on less-experienced observers, including both measurement error and time, warrants evaluation.
Performance may vary by anatomical parameter. HKA is defined by widely separated landmarks, whereas segment-specific and joint-level angles depend on more localized reference points and may be more sensitive to landmark selection [8,16,17]. The joint line convergence angle (JLCA) depends on the definition of opposing joint lines and may also reflect intra-articular morphology and soft-tissue-related convergence. An informative evaluation should therefore assess individual angles, performance within clinically relevant subgroups, and the measurements obtained after physician review.
We developed a landmark-detection system that automatically generates lower-limb alignment measurements from standing AP full-length radiographs and displays predicted landmarks and axes for clinician review. The primary objective was to quantify agreement between fully automated AI measurements and an experienced deformity surgeon reference. Secondary objectives were to describe performance in pediatric and adult patients and across deformity-location subgroups, compare measurement error across automated, unassisted physician, and AI-assisted resident workflows, and evaluate workflow time.
2. Materials and Methods
2.1. Study Design and Ethical Approval
We conducted a single-center retrospective study of the development and internal clinical validation of an author-developed AI system for lower-limb alignment measurement. The study was approved by the Istanbul University Faculty of Medicine Clinical Research Ethics Committee (file no. 2025/1439; decision no. 17; 22 August 2025). The requirement for written informed consent was waived for the use of anonymized retrospective clinical data and radiographs, including data from minors. The study was conducted in accordance with the Declaration of Helsinki. Reporting was guided by STROBE and the CLAIM 2024 update [18,19]. The CLAIM 2024 and STROBE checklists are provided in Supplementary Materials S2 and S3, respectively.
2.2. Study Population, Radiograph Selection, and Dataset Partitioning
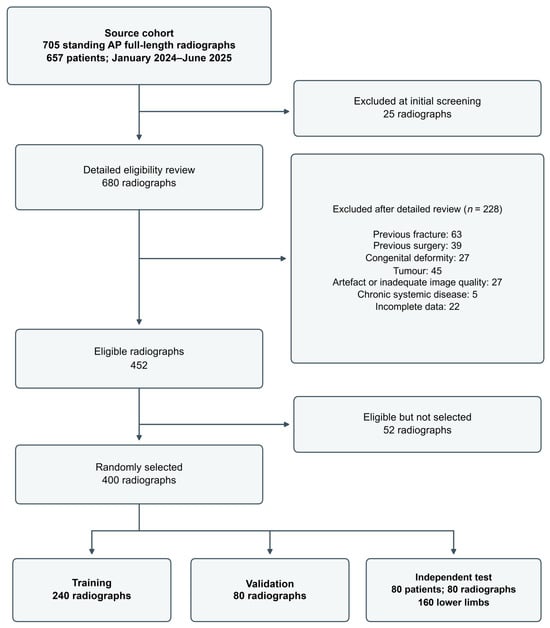
Standing AP full-length lower-limb radiographs acquired at our institution between January 2024 and June 2025 were retrospectively identified from the institutional Picture Archiving and Communication System (PACS). The source cohort comprised 657 patients with 705 radiographs. After initial image-quality screening, 25 radiographs were excluded, leaving 680 radiographs for detailed eligibility assessment. An additional 228 radiographs were excluded because of previous lower-limb fracture (n = 63), previous lower-limb surgery (n = 39), congenital deformity (n = 27), tumor (n = 45), substantial artifact or inadequate image quality (n = 27), chronic systemic disease associated with marked osseous alteration (n = 5), or incomplete clinical or radiographic data (n = 22), resulting in 452 eligible radiographs.
From the eligible cohort, 400 radiographs were randomly selected and allocated to the model-development and independent clinical test datasets. Dataset partitioning was performed at the patient level to ensure that radiographs from the same patient did not appear in more than one dataset. Of the 400 radiographs, 240 were assigned to the training set, 80 to the validation set, and 80 radiographs from 80 patients to the independent clinical test set (Figure 1). The independent test set contributed 160 lower limbs to the clinical measurement-validation analysis. The independent clinical test set remained fully isolated from AI training, validation, hyperparameter tuning, and model selection; no patient, radiograph, or lower limb from the test set was used during model development.
Figure 1.
Patient and radiograph selection for model development and independent clinical testing. The source cohort, radiographic screening, eligibility assessment, exclusions, model-development dataset, and independent clinical test set are shown. Dataset partitioning was performed at the patient level to prevent radiographs from the same patient from appearing in more than one dataset.
2.3. Eligibility Criteria
Radiographs were eligible when they were standardized standing AP full-length lower-limb images that included the femoral heads, knees, and ankles and permitted reliable mechanical-axis and joint-orientation measurements. Radiographs were excluded in the presence of previous lower-limb fracture or surgery, congenital deformity, tumor, substantial imaging artifact or inadequate image quality, chronic systemic disease associated with marked osseous alteration, or incomplete clinical or radiographic data.
2.4. Radiographic Acquisition Protocol
Radiographs were obtained according to the institutional standardized full-length lower-limb radiography protocol. Patients stood with both knees extended, the patellae directed anteriorly, and the lower limbs in neutral rotation. The source-to-image distance was 274 cm, and the beam was centered at the knee. Images included the femoral heads, knees, ankles, and relevant cortices. Radiographic adequacy was assessed by confirming the required anatomical coverage, appropriate patellar orientation, and the absence of substantial artifact or rotational malposition. Exported DICOM and PNG images were numbered, and patient names, identification numbers, and clinical information were concealed before analysis.
2.5. Alignment Parameters and Landmark Definitions
Six angular measurements were evaluated: hip-knee-ankle angle (HKA), mechanical lateral proximal femoral angle (mLPFA), mechanical lateral distal femoral angle (mLDFA), mechanical medial proximal tibial angle (mMPTA), mechanical lateral distal tibial angle (mLDTA), and joint line convergence angle (JLCA). Identical anatomical landmark definitions and geometric angle-construction rules were applied to both manual and AI-based measurements. Detailed landmark definitions and angle-construction methods are provided in Supplementary Material S1.
2.6. Manual Observers and Expert Reference Comparator
Manual measurements were performed by three orthopaedic physicians representing different levels of experience in lower-limb deformity analysis. The expert reference comparator was an orthopaedic deformity and limb reconstruction surgeon with more than 20 years of experience. The mean of three repeated measurements performed by this surgeon was used as the reference value for each angular parameter. The two unassisted comparison observers were an early-career orthopaedic specialist with 3 years of post-residency experience and an orthopaedic resident with 3 years of orthopaedic training. All unassisted manual measurements were performed using the institutional PACS measurement tools.
2.7. Blinding, Randomized Reading Order, and Repeat-Measurement Protocol
All unassisted observers evaluated the radiographs independently and in randomized reading order and were blinded to the AI-generated measurements and to the measurements of the other observers. Each observer completed three independent measurement sessions separated by 1-week intervals. For each limb and angle, the mean of the three measurements obtained by each observer was used as that observer’s final measurement; the mean of the experienced deformity surgeon’s three measurements defined the expert reference. Before statistical analysis, measurements were linked using anonymized radiograph identifiers and coded observer labels.
2.8. AI-Assisted Resident Workflow
After a 6-month washout following completion of the unassisted sessions, the resident completed three AI-assisted measurement sessions. During the AI-assisted workflow, the software displayed the automatically detected anatomical landmarks, mechanical axes, joint-orientation lines, and calculated angular measurements. The resident reviewed the AI-generated output and could adjust landmark positions when considered necessary, after which the software recalculated the angles. For each limb and angle, the mean of the three AI-assisted sessions was used as the physician-supervised workflow value. The resident remained blinded to the experienced deformity surgeon and early-career specialist measurements.
The AI-assisted resident measurements were analyzed as a separate physician-supervised workflow and did not alter the locked fully automated AI results used in the primary AI-versus-expert analysis. Landmark coordinates and final measurement outputs were stored, while the unedited automated output remained separately available for comparison.
2.9. Age-Group and Deformity-Location Subgroup Analyses
Patients were categorized as pediatric (<18 years) or adult (≥18 years) at imaging. Each lower limb was classified according to recorded deformity location as no recorded deformity, deformity around the knee, proximal femoral deformity, or ankle deformity. In unilateral diagnoses, the contralateral limb was assigned to the no-recorded-deformity group. These subgroups were used for descriptive analyses of AI-versus-expert agreement; no formal between-group comparisons were performed.
2.10. AI System Development and Testing
An experienced orthopaedic surgeon annotated the anatomical regions of interest (ROIs) and landmarks using Label Studio (HumanSignal, San Francisco, CA, USA; version 1.21.0). This surgeon was different from the experienced deformity surgeon who provided the reference measurements for the independent clinical test set.
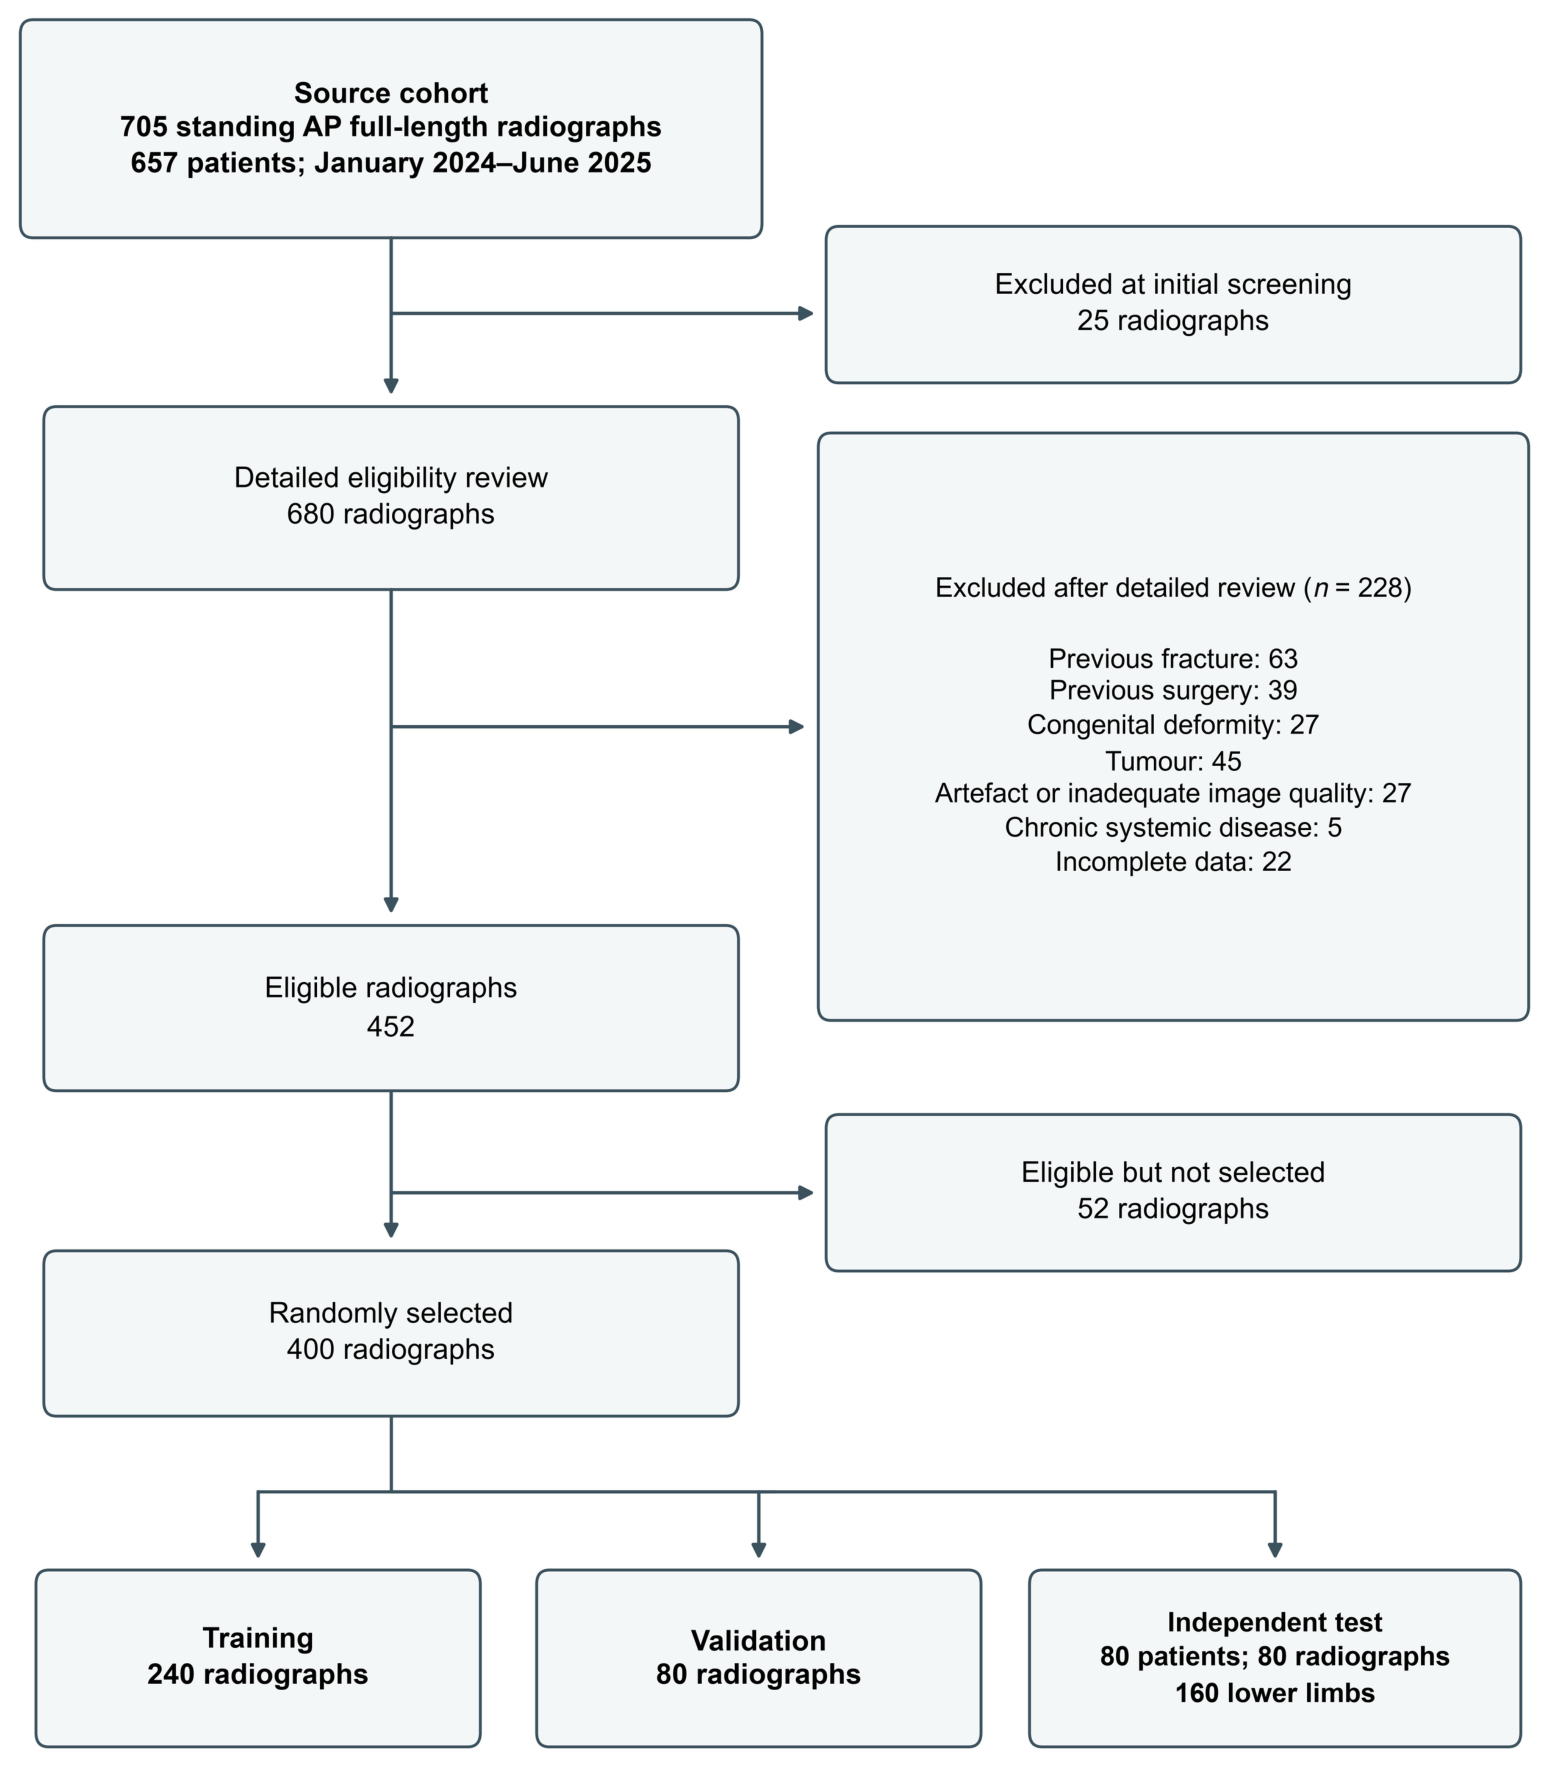
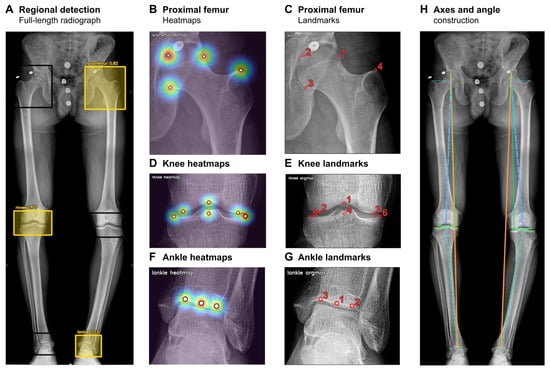
The pipeline combined anatomical region detection with region-specific landmark localization, following a landmark-based approach to full-length radiograph analysis [20] (Figure 2). A YOLOv8 detector identified the bilateral proximal femur, knee, and ankle regions [21]. These regions were cropped for landmark analysis.
Figure 2.
Automated lower-limb measurement pipeline. (A) Regional detection on a full-length anteroposterior radiograph. Landmark heatmaps and corresponding decoded coordinates are shown for the proximal femur (B,C), knee (D,E), and ankle (F,G). (H) Mechanical axes and joint-orientation lines mapped to the full-length radiograph for geometric angle calculation. Boxes indicate anatomical regions of interest (ROIs); yellow boxes highlight the ROIs selected for illustration. Warmer heatmap colors indicate higher landmark likelihood. Numbered red circles identify landmarks; solid and dashed colored lines show the measurement axes and joint-orientation lines.
Region-specific models used a ResNet34 backbone to predict landmark heatmaps [22]. Continuous landmark coordinates were obtained by integral regression [23]. The models were trained on annotated radiographs using heatmap and coordinate losses, with image augmentation during training. Landmark definitions and supplementary model results are provided in Supplementary Material S1.
For each test radiograph, the locked pipeline mapped the predicted landmarks back to the original image and geometrically calculated the six alignment angles. The resulting report displayed the landmarks, mechanical axes, joint-orientation lines, and angular measurements for physician review.
The primary analysis used the locked, fully automated AI output without manual landmark correction. AI failure was predefined as failure to generate one or more of the six required angular measurements. The AI system was evaluated as a radiographic measurement-support tool and was not used to guide clinical treatment decisions in the study.
Source code, trained model weights and detailed implementation files are not publicly available. Confidential access may be considered upon request from the journal editors, subject to institutional approval and applicable confidentiality and data-protection restrictions.
2.11. Study Outcomes
The primary outcome was agreement between the locked fully automated AI measurements and the experienced deformity surgeon reference for each of the six angular parameters. Secondary outcomes included agreement and absolute error for the early-career specialist, unassisted resident, and AI-assisted resident workflows; measurement time; and descriptive performance within pediatric/adult and deformity-location subgroups. Technical failure was defined as failure to generate any required angle on a test radiograph. Technical performance of ROI detection and landmark localization was evaluated separately.
2.12. Measurement Time
One workflow duration was recorded per radiograph for each method (80 observations per method). For manual workflows, time was measured from opening the radiograph to recording the final bilateral six-angle measurement set. Fully automated AI time was measured from initiation of analysis to generation of the automated report. AI-assisted resident time was measured from initiation of automated analysis through resident review, any necessary correction, and recording of the final physician-reviewed measurements.
2.13. Study Size
An ICC-based sample-size calculation using the reliability-study method described by Walter et al. for two measurement methods [24] indicated a requirement of 133 independent lower limbs, with a two-sided alpha of 0.05, 90% power, a minimum acceptable ICC of 0.75, and an expected ICC of 0.85. The calculation treated limbs as independent. The clinical test cohort included 160 lower limbs from 80 patients; because each patient contributed two limbs, this calculation does not establish 90% power for the clustered cohort.
2.14. Statistical Analysis
Statistical analyses were performed using IBM SPSS Statistics (version 31.0.1.0; IBM Corp., Armonk, NY, USA). The lower limb was the primary unit of analysis because the study endpoint was radiographic measurement agreement for each limb rather than a patient-level clinical outcome. Continuous variables were summarized as mean ± standard deviation (SD), and categorical variables as counts and percentages.
Agreement with the experienced deformity surgeon reference was quantified using two-way absolute-agreement ICCs [25]. Pooled workflow and deformity-location subgroup estimates are reported as single-measure ICC(A,1). Age-specific HKA, mLPFA, mLDFA, mMPTA, and mLDTA estimates correspond to average-measure ICC(A,2), whereas age-specific JLCA estimates correspond to ICC(A,1). ICC(A,2) concerns the two compared methods, not repeated reading sessions; estimates obtained using different formulations were not compared directly. Automated ICCs are reported with parametric 95% confidence intervals (CIs). Measurement error was characterized using MAE, signed bias, SD of paired differences, and the proportions of automated measurements within 1°, 2°, and 3° of the expert reference. Bland–Altman limits of agreement were calculated as bias ± 1.96 SD of the signed differences.
Percentile 95% CIs for AI-assisted resident ICCs were calculated using 5000 patient-cluster bootstrap resamples. Each resample drew 80 patients with replacement while retaining both limbs and all matched workflow measurements for each selected patient. Intervals were pointwise and were not adjusted for multiple comparisons.
Descriptive subgroup analyses were performed for pediatric (<18 years) versus adult (≥18 years) patients and for deformity-location categories. All six angles were reported for age subgroups and limbs without recorded deformity. Regional analyses included HKA, mLDFA, mMPTA, and JLCA for knee deformity, mLPFA for proximal femoral deformity, and mLDTA for ankle deformity. In unilateral diagnoses, the contralateral limb was assigned to the no-recorded-deformity group. Technical model performance was summarized using precision, recall, mean average precision at an intersection-over-union threshold of 0.50 (mAP@50), mean average precision across thresholds from 0.50 to 0.95 (mAP@50-95), percentage of correct keypoints (PCK), and pixel-based landmark localization error. Missing measurements were not imputed.
3. Results
3.1. Study Cohort and Technical Success
The independent clinical test cohort included 80 patients and 160 lower limbs. Of the 80 patients, 41 were male and 39 were female, and the mean age was 29.8 ± 13.8 years. Twenty-two patients were pediatric (5–17 years), contributing 44 lower limbs, and 58 were adults, contributing 116 lower limbs. Based on the deformity-location classification, 93 lower limbs were classified as having no recorded deformity, 40 as having deformity around the knee, 19 as having proximal femoral deformity, and 8 as having ankle deformity (Table 1).
Table 1.
Demographic and radiographic characteristics of the independent clinical test cohort.
The automated system generated all six angular measurements for both limbs on all 80 test radiographs; no missing-output failure occurred (0/80).
3.2. Fully Automated AI Versus Expert Reference
Agreement between the locked fully automated AI measurements and the experienced deformity surgeon reference was assessed for all 160 lower limbs. The ICCs were 0.966 for HKA, 0.944 for mLPFA, 0.952 for mLDFA, 0.964 for mMPTA, 0.930 for mLDTA, and 0.728 for JLCA (Table 2). The corresponding MAEs were 0.74 ± 0.56° for HKA, 1.26 ± 0.94° for mLPFA, 0.61 ± 0.48° for mLDFA, 0.52 ± 0.47° for mMPTA, 1.08 ± 0.82° for mLDTA, and 0.61 ± 0.48° for JLCA. Expert-reference JLCA values ranged from 0° to 5° (SD 1.06°).
Table 2.
Agreement between fully automated AI and the experienced deformity surgeon reference in the independent clinical test set.
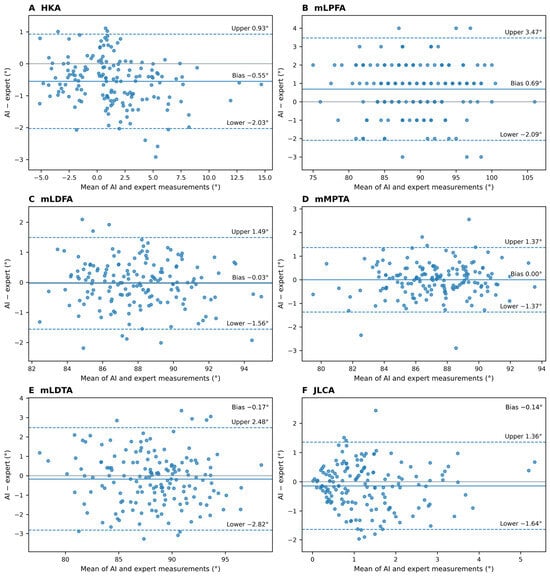
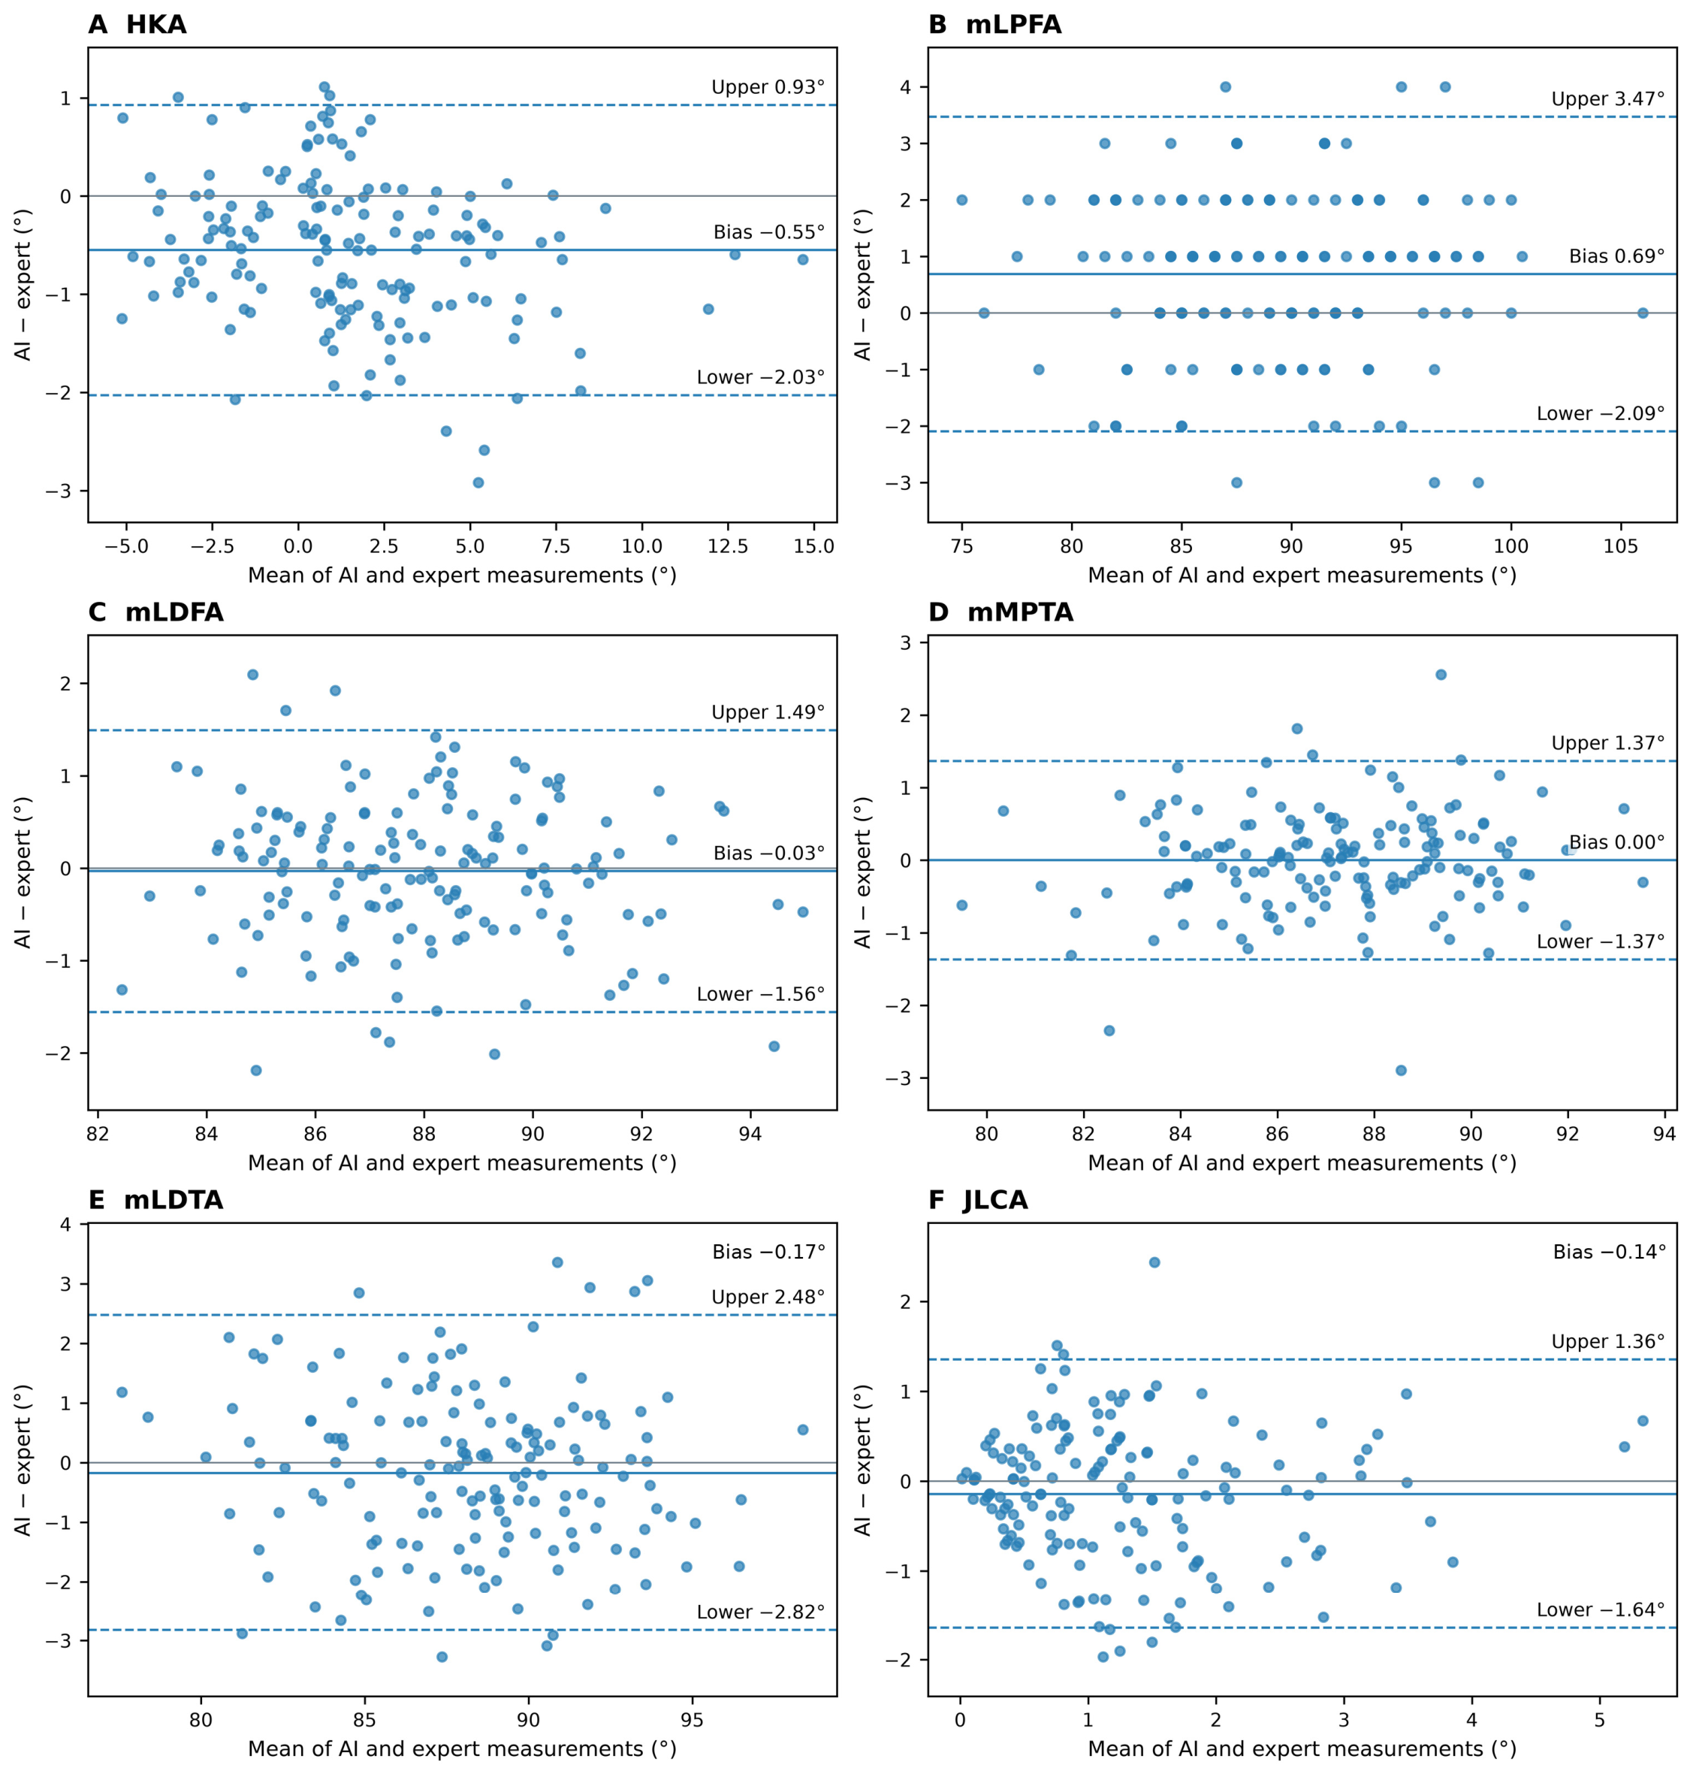
The proportions of automated measurements within 2° of the expert reference were 96.3% for HKA, 90.6% for mLPFA, 98.1% for mLDFA, 98.1% for mMPTA, 85.6% for mLDTA, and 99.4% for JLCA. Within 3°, the corresponding proportions were 100.0%, 98.1%, 100.0%, 100.0%, 97.5%, and 100.0%. Mean signed differences were −0.55° for HKA, 0.69° for mLPFA, −0.03° for mLDFA, 0.00° for mMPTA, −0.17° for mLDTA, and −0.14° for JLCA. Results within 1°, 2°, and 3° and the 95% limits of agreement are reported in Table 2; Bland–Altman plots are shown in Figure 3.
Figure 3.
Bland–Altman analyses of fully automated AI measurements versus the experienced deformity surgeon reference. Panels show (A) HKA, (B) mLPFA, (C) mLDFA, (D) mMPTA, (E) mLDTA, and (F) JLCA. Each panel includes 160 lower limbs. The horizontal axis is the mean of the automated measurement and the expert three-session mean; the vertical axis is automated minus expert. Each point represents a single lower limb. The solid blue line denotes the mean paired difference (bias; AI minus expert reference). The gray horizontal line indicates zero difference, and the dashed blue lines denote the 95% limits of agreement.
3.3. Observer and AI-Assisted Workflow Agreement
For the unassisted resident, ICCs ranged from 0.110 to 0.808 and MAEs from 1.22° to 6.83° (Table 3).
Table 3.
Agreement of automated and human measurement workflows with the experienced deformity surgeon reference.
For the AI-assisted resident workflow, ICCs ranged from 0.492 to 0.967 and MAEs from 0.57° to 1.41°. MAE was lower than with unassisted measurement for all six angles, with the largest absolute reduction for mLPFA, from 6.83° to 1.41°.
For the early-career orthopaedic specialist, ICCs ranged from 0.659 to 0.923 and MAEs from 0.40° to 2.41°. Angle-specific results for all workflows are reported in Table 3; AI-assisted resident ICC confidence intervals are provided in Supplementary Material S1.
3.4. Measurement Time Assessment
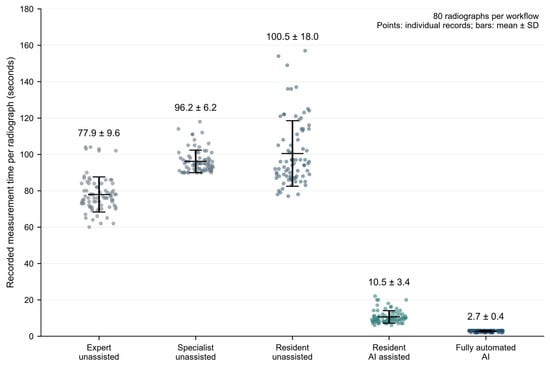
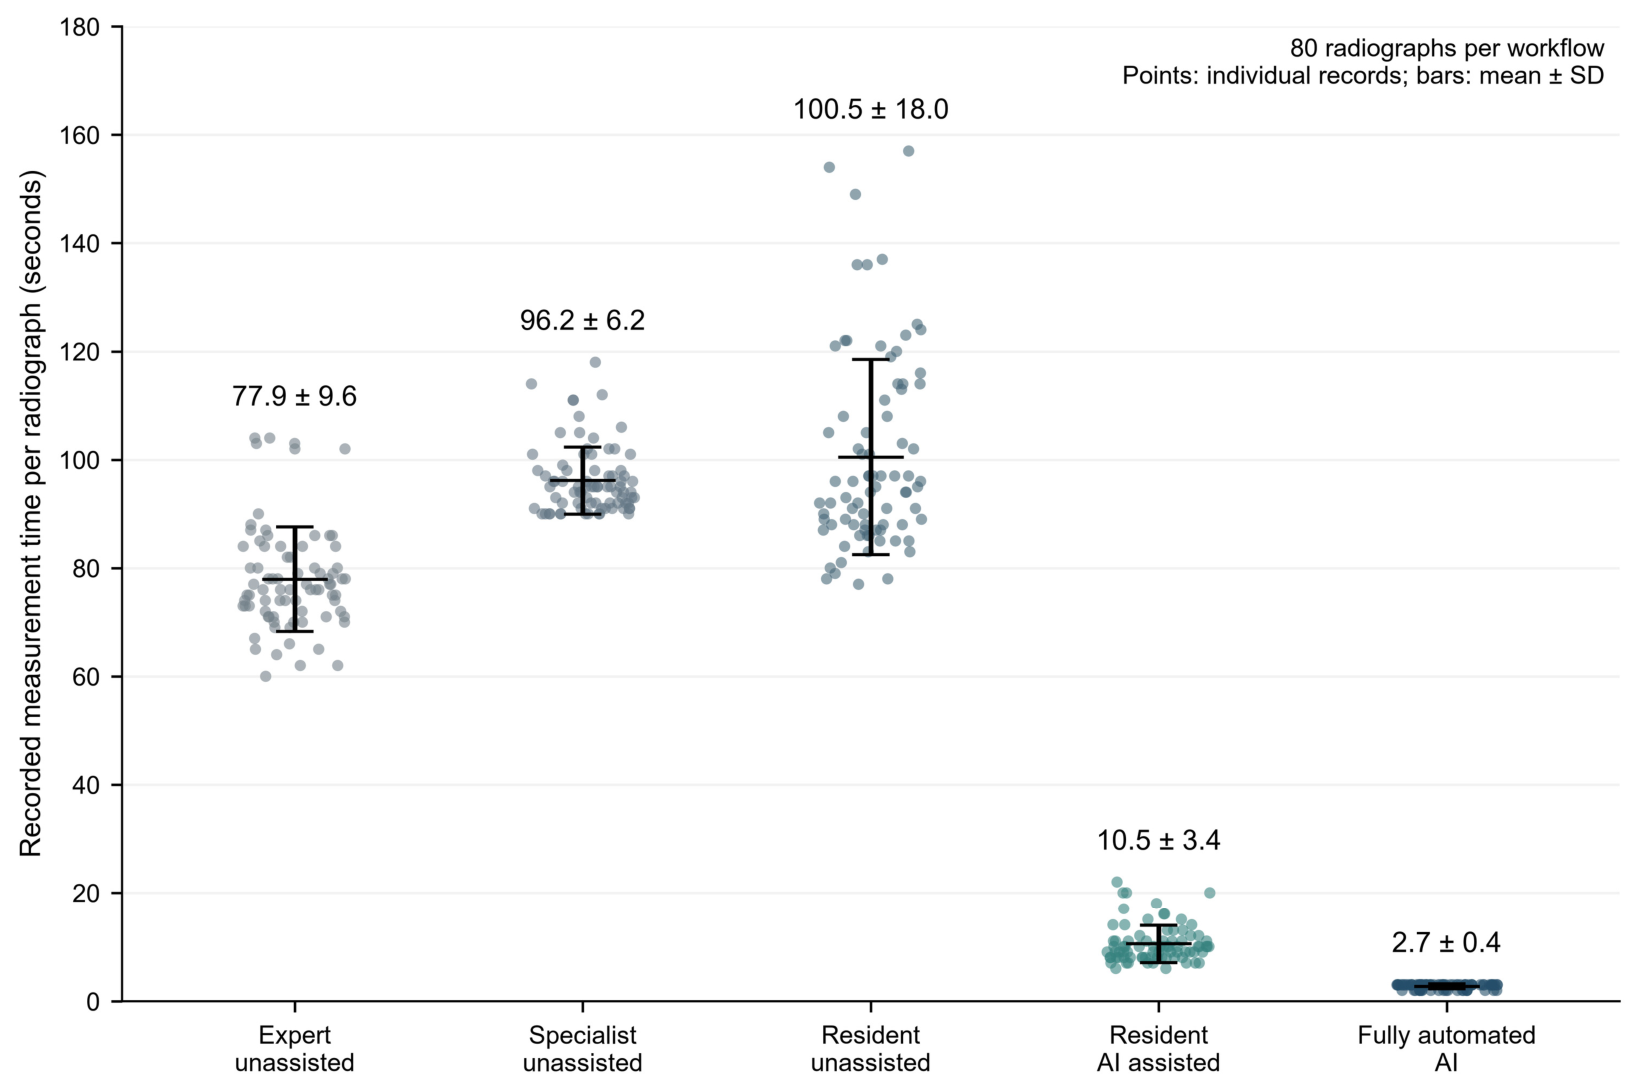
Mean measurement time per radiograph was 77.9 ± 9.6 s for the experienced deformity surgeon, 96.2 ± 6.2 s for the early-career orthopaedic specialist, 100.5 ± 18.0 s for the unassisted resident, 10.5 ± 3.4 s for the AI-assisted resident, and 2.7 ± 0.4 s for the fully automated AI workflow. Both AI workflows had lower mean times than the unassisted physician workflows for the bilateral six-angle measurement set. The resident’s AI-assisted measurement time was 89.6% shorter than the unassisted measurement time (Figure 4).
Figure 4.
Measurement time by workflow. Points represent 80 radiograph-level observations per workflow; horizontal bars and error bars show the mean and SD. Manual time covers the bilateral six-angle set. AI-assisted time includes automated processing, resident review, any correction, and recording of the final measurements. Fully automated AI time covers processing through report generation. Gray shades indicate manual measurements performed by observers with different levels of experience, teal indicates the AI-assisted resident workflow, and dark blue indicates fully automated AI.
3.5. Pediatric and Adult Subgroup Analysis
In the pediatric subgroup (44 lower limbs), the ICCs between fully automated AI and the experienced deformity surgeon reference were 0.975 for HKA, 0.967 for mLPFA, 0.973 for mLDFA, 0.969 for mMPTA, 0.936 for mLDTA, and 0.825 for JLCA. In the adult subgroup (116 lower limbs), the corresponding ICCs were 0.983, 0.965, 0.976, 0.984, 0.971, and 0.637. These subgroup estimates were descriptive and are summarized in Table 4. The first five age-specific estimates use average-measure ICC(A,2), whereas JLCA uses single-measure ICC(A,1). Consequently, the first five age-specific ICCs should not be compared numerically with the pooled ICC(A,1) estimates.
Table 4.
Fully automated AI agreement with the experienced deformity surgeon reference according to age group and deformity location.
3.6. Deformity-Location Subgroup Analysis
Among lower limbs classified as having no recorded deformity (n = 93), the ICCs between fully automated AI and the experienced deformity surgeon reference were 0.966 for HKA, 0.961 for mLPFA, 0.952 for mLDFA, 0.967 for mMPTA, 0.937 for mLDTA, and 0.726 for JLCA. Among lower limbs with knee deformity (n = 40), the ICCs were 0.978 for HKA, 0.954 for mLDFA, 0.947 for mMPTA, and 0.601 for JLCA.
In the proximal-femoral-deformity subgroup (n = 19), the mLPFA ICC was 0.816. In the ankle-deformity subgroup (n = 8), the mLDTA ICC was 0.805. Regional analyses were descriptive (Table 4).
3.7. Technical Model Performance
The region-of-interest detector achieved a precision of 0.980, recall of 0.963, mAP@50 of 0.988, and mAP@50-95 of 0.663. Across the six anatomical regions, landmark localization yielded PCK@32 values of at least 0.995. Mean landmark localization errors ranged from 5.65 to 7.85 pixels. The exact evaluation partition, denominator, and pixel coordinate system for these technical metrics were not documented; detailed results are therefore reported separately in Supplementary Material S1 and are not attributed specifically to the 80-patient clinical test set.
4. Discussion
4.1. Principal Findings
This study evaluated automated and physician-supervised AI measurement on standing full-length lower-limb radiographs from pediatric and adult patients. Fully automated AI showed close agreement with the experienced deformity surgeon reference for HKA, mLPFA, mLDFA, mMPTA, and mLDTA. JLCA had a lower ICC despite a small absolute error. The age-specific average-measure ICCs for the five major alignment angles were 0.936–0.975 in pediatric limbs and 0.965–0.984 in adult limbs; these use a different formulation from the pooled single-measure ICCs.
Time efficiency was evident across the AI workflows: fully automated analysis took a mean of 2.7 s per radiograph and physician-reviewed AI measurement took 10.5 s, compared with 77.9–100.5 s for unassisted physician workflows. AI assistance was also associated with lower resident MAE for all six angles, with the largest absolute reduction for mLPFA.
Together, the findings suggest potential utility as a physician-reviewed measurement aid. Its visible landmarks and axes provide an anatomical basis for physician review before measurements are recorded.
4.2. Comparison with Previous AI-Based Lower-Limb Alignment Studies
Previous studies of automated full-length radiograph analysis have reported close agreement with manual measurements for global alignment and major femoral and tibial orientation parameters [8,9,11,12,13,14]. Our results are consistent with these reports, particularly for HKA, mLDFA, and mMPTA. They also support evaluating each angle separately, as earlier studies have found greater variability for some joint-level and localized measurements [10,13,16,17].
Pediatric-specific validation remains less extensive. Van der Lelij et al. reported ICCs of 0.73–1.00 for pediatric cases with correct AI landmark placement [15]. In our study, automated measurements were generated for all 44 pediatric lower limbs, and all were included in the subgroup analysis. Differences in case selection, reference measurements, and ICC formulation should be considered when interpreting results across studies.
The present study contributes an evaluation of the same pipeline in pediatric and adult radiographs, descriptive results by deformity location, and a separate assessment of physician-supervised measurement. Including both unedited AI output and resident-reviewed measurements distinguishes automated measurement performance from the performance of the assisted clinical workflow.
4.3. Interpretation of JLCA Agreement
JLCA differed from the other angles in that its ICC was lower despite a small absolute error. Fully automated AI had a JLCA ICC of 0.728, an MAE of 0.61 ± 0.48°, and 99.4% of measurements within 2° of the expert reference. ICC depends on variation between cases as well as measurement error, whereas MAE expresses the size of the angular difference directly. Expert-reference JLCA values occupied a relatively narrow range of 0–5° (SD 1.06°). This limited variation may help explain why the lower ICC coexisted with a small absolute error.
JLCA may also be sensitive to small differences in the placement of the landmarks used to construct the joint lines [16]. Joint morphology and soft-tissue-related convergence can influence this intra-articular measurement [4]. These anatomical features provide a plausible explanation for its distinct agreement pattern, although the present analysis cannot isolate their individual effects.
The lower JLCA ICC should therefore be interpreted alongside the small MAE (0.61°), low bias (−0.14°), and 95% limits of agreement (−1.64° to 1.36°). Limited between-case variability may partly explain why the ICC was lower despite small average measurement differences. Together, these findings provide a more informative basis for interpreting JLCA and its relevance to correction planning than ICC alone.
4.4. Physician-Supervised Workflow and Observer Experience
AI assistance was associated with lower resident MAE for all six angles, with the largest absolute change for mLPFA, from 6.83° to 1.41° (Table 3).
Compared with unedited automated output, resident review did not consistently reduce absolute error (Table 3). Thus, the improvement relative to unassisted resident measurement does not establish an additional accuracy benefit from editing the automated output.
These comparisons describe the final recorded measurements. Without landmark-edit logs, changes cannot be attributed to specific corrections. The AI-assisted workflow was associated with lower measurement error and shorter measurement time for the resident evaluated. As the assisted workflow was assessed in one resident, the magnitude of these gains may vary among trainees and practicing surgeons with different experience levels. Further evaluation across multiple observers is needed to establish the consistency of these benefits.
The repeated sessions assessed measurement performance; they did not establish whether AI assistance improves long-term learning or deformity-analysis expertise.
4.5. Pediatric and Adult Subgroups and Deformity-Location Findings
The same locked pipeline generated all six measurements in pediatric and adult radiographs. This is relevant to clinical settings that assess patients at different stages of skeletal development. The first five age-specific estimates use ICC(A,2), whereas JLCA uses ICC(A,1); the magnitudes of these coefficients are therefore not directly comparable.
The pediatric subgroup showed favorable agreement with the expert reference for the major alignment angles, suggesting potential utility as a measurement aid in pediatric practice. As this subgroup included 22 patients (44 limbs) and was analyzed descriptively, validation in larger, independent pediatric cohorts is needed to confirm the consistency of these findings.
Age-related changes in ossification and epiphyseal morphology may influence the appearance of anatomical landmarks on pediatric radiographs [5]. The present pediatric cohort included patients aged 5–17 years, with identical anatomical landmark definitions used for manual and automated measurements. Further evaluation across age groups and skeletal maturity stages would help establish the consistency of performance throughout growth.
Deformity-location analyses provide complementary information about the anatomical regions relevant to each measurement. Agreement was favorable for HKA, mLDFA, and mMPTA in limbs with knee deformity, while JLCA had a lower ICC. These results describe the observed groups and do not establish formal between-group differences.
The mLPFA ICC of 0.816 in the proximal femoral deformity subgroup and the mLDTA ICC of 0.805 in the ankle deformity subgroup provide preliminary evidence beyond knee-level deformity. The small subgroup sizes limit precision and support further evaluation of individual angles within the deformity patterns for which they are clinically relevant.
4.6. Clinical and Workflow Implications
Lower-limb deformity assessment requires measurements of both global alignment and the anatomical level contributing to malalignment. These measurements inform pediatric and adult radiographic assessment before corrective procedures. Automating landmark localization, axis construction, and angle calculation can reduce the time required for this analysis while retaining the anatomical constructions for physician review.
In the pooled pediatric and adult cohort, fully automated measurements showed MAEs of 0.52–1.26°, reflecting small average angular differences from the expert reference. In pediatric deformity-correction planning, the clinical relevance of a measurement difference depends on the parameter involved and whether it would alter deformity localization or the intended correction. Angle-specific limits of agreement and review of the underlying anatomical landmarks should therefore complement average error estimates when interpreting individual measurements.
The time advantage extended to both AI workflows. Fully automated AI produced the report in a mean of 2.7 s per radiograph, and the complete physician-reviewed workflow required 10.5 s, compared with 77.9–100.5 s for unassisted physicians. The assisted time included automated processing, review, any landmark correction, and recording of the final measurements. These findings demonstrate that the observed time saving was retained when physician review formed part of the workflow.
Linking each angle to visible landmarks and geometric constructions may facilitate consistent documentation in pediatric and adult deformity clinics, serial radiographic assessment, and research datasets.
The present results concern radiographic measurement and workflow time. Whether these measurements improve treatment selection, osteotomy planning, surgical correction, or patient outcomes requires prospective evaluation within clinical care.
4.7. Strengths and Limitations
Strengths include patient-level dataset partitioning, complete separation of the clinical test cohort from model development, and use of different surgeons for development annotations and the clinical reference measurements. The expert reference and human comparison workflows each used three measurement sessions. Patient-cluster bootstrap resampling retained both limbs and matched workflow measurements when estimating uncertainty for AI-assisted ICCs.
The standardized radiographic acquisition protocol provided consistent imaging conditions within this single-center retrospective study. Differences in acquisition protocols, patient positioning, and image quality across institutions may influence landmark appearance and localization. External multicenter validation is needed to confirm the consistency of performance across clinical settings and support broader implementation.
The reference was based on the mean of three measurements by a deformity surgeon with more than 20 years of experience. This provided a common expert reference for all comparisons. A multi-expert consensus reference could further strengthen future validation by reducing the influence of observer-specific measurement differences. One resident completed the assisted workflow. A fixed workflow order permits learning or order effects despite the 6-month washout.
The proximal-femoral and ankle deformity subgroups were small, and differing ICC formulations limit some comparisons across analyses. The technical model metrics lack complete evaluation details and should be interpreted separately from the clinical measurement results (Supplementary Material S1). The study assessed measurement agreement and workflow time; its effects on treatment decisions and patient outcomes remain to be evaluated.
5. Conclusions
The AI system generated all six lower-limb alignment measurements for every test radiograph and showed angle-specific agreement with an experienced deformity surgeon reference. Fully automated and physician-reviewed workflows were substantially faster than unassisted measurement, and AI assistance was associated with lower MAE for the resident evaluated. The findings suggest potential utility as a physician-reviewed measurement aid. Pediatric results are encouraging and should be interpreted as descriptive evidence within the evaluated age range. External validation across institutions, imaging protocols, and clinicians is needed to establish broader applicability.
Supplementary Materials
The following supporting information can be downloaded at: https://www.mdpi.com/article/10.3390/children13111601/s1. Supplementary Material S1: Model specifications and supplementary results, including landmark definitions, angle construction, technical-performance tables, and AI-assisted resident ICC confidence intervals; Supplementary Material S2: CLAIM 2024 reporting checklist; Supplementary Material S3: STROBE reporting checklist.
Author Contributions
Conceptualization, O.G.; methodology, O.G., C.Ş. and H.İ.B.; validation, O.G. and İ.T.A.; data curation, O.G., İ.T.A., C.Ş. and N.E.A.; formal analysis, O.G. and İ.T.A.; investigation, A.Ş.K., N.E.A. and H.İ.B.; visualization, İ.T.A.; supervision, C.Ş., Y.S. and H.İ.B.; project administration, O.G.; writing—original draft preparation, O.G.; writing—review and editing, O.G., İ.T.A., C.Ş., A.Ş.K., N.E.A., Y.S. and H.İ.B., O.G. and İ.T.A. contributed to AI model development and technical validation. A.Ş.K. performed the early-career orthopaedic specialist measurements, N.E.A. performed the unassisted and AI-assisted resident measurements, and H.İ.B. performed the repeated expert reference measurements. All authors have read and agreed to the published version of the manuscript.
Funding
This research received no external funding.
Institutional Review Board Statement
The study was conducted in accordance with the Declaration of Helsinki and approved by the Istanbul University Istanbul Faculty of Medicine Clinical Research Ethics Committee (file no. 2025/1439; decision no. 17; 22 August 2025).
Informed Consent Statement
The requirement for written informed consent was waived because the study used anonymized retrospective clinical data and radiographs.
Data Availability Statement
The deidentified numerical measurements, recorded workflow times, participant characteristics, and data dictionary are available from the corresponding author on reasonable request, subject to institutional approval and applicable privacy requirements. Source radiographs cannot be made publicly available because institutional privacy restrictions apply. Source code, trained model weights and detailed implementation files are not publicly available. Confidential access may be considered upon request from the journal editors, subject to institutional approval and applicable confidentiality and data-protection restrictions.
Acknowledgments
This study formed part of Oğuzhan Günbatar’s 2026 medical specialty thesis at Istanbul University, Istanbul Faculty of Medicine, entitled “Alt ekstremite deformitesi olan hastalarda yapay zeka yardımı ile deformite analizi ve ameliyat öncesi planlama”. An earlier version was presented orally in award-candidate sessions at LLRS 2026 and ASAMI 2026.
Conflicts of Interest
The authors declare no conflicts of interest.
Abbreviations
AI, artificial intelligence; AP, anteroposterior; CI, confidence interval; CLAIM, Checklist for Artificial Intelligence in Medical Imaging; HKA, hip-knee-ankle angle; ICC, intraclass correlation coefficient; JLCA, joint line convergence angle; MAE, mean absolute error; mLDFA, mechanical lateral distal femoral angle; mLDTA, mechanical lateral distal tibial angle; mLPFA, mechanical lateral proximal femoral angle; mMPTA, mechanical medial proximal tibial angle; PACS, Picture Archiving and Communication System; PCK, percentage of correct keypoints; ROI, region of interest; SD, standard deviation; STROBE, Strengthening the Reporting of Observational Studies in Epidemiology.
References
- Marques Luís, N.; Varatojo, R. Radiological assessment of lower limb alignment. EFORT Open Rev. 2021, 6, 487–494. [Google Scholar] [CrossRef] [Scilit] [PubMed]
- Moreland, J.R.; Bassett, L.W.; Hanker, G.J. Radiographic analysis of the axial alignment of the lower extremity. J. Bone Jt. Surg. Am. 1987, 69, 745–749. [Google Scholar] [CrossRef] [Scilit]
- Cooke, T.D.V.; Sled, E.A.; Scudamore, R.A. Frontal plane knee alignment: A call for standardized measurement. J. Rheumatol. 2007, 34, 1796–1801. [Google Scholar] [PubMed]
- Pratobevera, A.; Seil, R.; Menetrey, J. Joint line and knee osteotomy. EFORT Open Rev. 2024, 9, 375–386. [Google Scholar] [CrossRef] [Scilit] [PubMed]
- Ranade, A.S.; Oka, G.A.; Ardawatia, G.; Goyal, N. Lower Limb Alignment in Indian Children: A Radiographic Analysis of Coronal Plane Parameters. Indian J. Orthop. 2022, 56, 639–645. [Google Scholar] [CrossRef] [Scilit] [PubMed]
- Tetsworth, K.; Paley, D. Malalignment and degenerative arthropathy. Orthop. Clin. N. Am. 1994, 25, 367–377. [Google Scholar] [CrossRef] [Scilit]
- Paley, D. Principles of Deformity Correction; Springer: Berlin/Heidelberg, Germany, 2002. [Google Scholar] [CrossRef] [Scilit]
- Archer, H.; Reine, S.; Xia, S.; Vazquez, L.C.; Ashikyan, O.; Pezeshk, P.; Kohli, A.; Xi, Y.; Wells, J.E.; Hummer, A.; et al. Reliability assessment of leg length and angular alignment on manual reads versus artificial intelligence-generated lower extremity radiographic measurements. Clin. Imaging 2024, 113, 110233. [Google Scholar] [CrossRef] [Scilit] [PubMed]
- Jo, C.; Hwang, D.; Ko, S.; Yang, M.H.; Lee, M.C.; Han, H.-S.; Ro, D.H. Deep learning-based landmark recognition and angle measurement of full-leg plain radiographs can be adopted to assess lower extremity alignment. Knee Surg. Sports Traumatol. Arthrosc. 2023, 31, 1388–1397. [Google Scholar] [CrossRef] [Scilit] [PubMed]
- Simon, S.; Schwarz, G.M.; Aichmair, A.; Frank, B.J.H.; Hummer, A.; DiFranco, M.D.; Dominkus, M.; Hofstaetter, J.G. Fully automated deep learning for knee alignment assessment in lower extremity radiographs: A cross-sectional diagnostic study. Skelet. Radiol. 2022, 51, 1249–1259. [Google Scholar] [CrossRef] [Scilit] [PubMed]
- Lassalle, L.; Regnard, N.-E.; Durteste, M.; Ventre, J.; Marty, V.; Clovis, L.; Zhang, Z.; Nitche, N.; Ducarouge, A.; Laredo, J.-D.; et al. Evaluation of a deep learning software for automated measurements on full-leg standing radiographs. Knee Surg. Relat. Res. 2024, 36, 40. [Google Scholar] [CrossRef] [Scilit] [PubMed]
- Moon, K.-R.; Lee, B.-D.; Lee, M.S. A deep learning approach for fully automated measurements of lower extremity alignment in radiographic images. Sci. Rep. 2023, 13, 14692. [Google Scholar] [CrossRef] [Scilit] [PubMed]
- Salzmann, M.; Hassan Tarek, H.; Prill, R.; Becker, R.; Schreyer, A.G.; Hable, R.; Ostojic, M.; Ramadanov, N. Artificial intelligence-based assessment of leg axis parameters shows excellent agreement with human raters: A systematic review and meta-analysis. Knee Surg. Sports Traumatol. Arthrosc. 2025, 33, 177–190. [Google Scholar] [CrossRef] [Scilit] [PubMed]
- Schock, J.; Truhn, D.; Abrar, D.B.; Merhof, D.; Conrad, S.; Post, M.; Mittelstrass, F.; Kuhl, C.; Nebelung, S. Automated analysis of alignment in long-leg radiographs by using a fully automated support system based on artificial intelligence. Radiol. Artif. Intell. 2021, 3, e200198. [Google Scholar] [CrossRef] [Scilit] [PubMed]
- van der Lelij, T.J.N.; Grootjans, W.; Braamhaar, K.J.; de Witte, P.B. Automated measurements of long leg radiographs in pediatric patients: A pilot study to evaluate an artificial intelligence-based algorithm. Children 2024, 11, 1182. [Google Scholar] [CrossRef] [Scilit] [PubMed]
- Hoffmann, C.; Göksu, F.; Klöpfer-Krämer, I.; Watrinet, J.; Blum, P.; Hungerer, S.; Schröter, S.; Stuby, F.; Augat, P.; Fürmetz, J. High accuracy in lower limb alignment analysis using convolutional neural networks, with improvements needed for joint-level metrics. Knee Surg. Sports Traumatol. Arthrosc. 2025, 33, 1975–1981. [Google Scholar] [CrossRef] [Scilit] [PubMed]
- Stotter, C.; Klestil, T.; Chen, K.; Hummer, A.; Salzlechner, C.; Angele, P.; Nehrer, S. Artificial intelligence-based analyses of varus leg alignment and after high tibial osteotomy show high accuracy and reproducibility. Knee Surg. Sports Traumatol. Arthrosc. 2023, 31, 5885–5895. [Google Scholar] [CrossRef] [Scilit] [PubMed]
- von Elm, E.; Altman, D.G.; Egger, M.; Pocock, S.J.; Gøtzsche, P.C.; Vandenbroucke, J.P.; STROBE Initiative. The Strengthening the Reporting of Observational Studies in Epidemiology (STROBE) statement: Guidelines for reporting observational studies. J. Clin. Epidemiol. 2008, 61, 344–349. [Google Scholar] [CrossRef] [Scilit] [PubMed]
- Tejani, A.S.; Klontzas, M.E.; Gatti, A.A.; Mongan, J.T.; Moy, L.; Park, S.H.; Kahn, C.E., Jr.; CLAIM 2024 Update Panel. Checklist for Artificial Intelligence in Medical Imaging (CLAIM): 2024 update. Radiol. Artif. Intell. 2024, 6, e240300. [Google Scholar] [CrossRef] [Scilit] [PubMed]
- Tack, A.; Preim, B.; Zachow, S. Fully automated assessment of knee alignment from full-leg X-rays employing a “YOLOv4 and ResNet landmark regression algorithm” (YARLA): Data from the Osteoarthritis Initiative. Comput. Methods Programs Biomed. 2021, 205, 106080. [Google Scholar] [CrossRef] [Scilit] [PubMed]
- Jocher, G.; Chaurasia, A.; Qiu, J. Ultralytics YOLOv8 [Computer software]; Ultralytics. 2023. Available online: https://github.com/ultralytics/ultralytics (accessed on 1 October 2026).
- He, K.; Zhang, X.; Ren, S.; Sun, J. Deep residual learning for image recognition. In Proceedings of the 2016 IEEE Conference on Computer Vision and Pattern Recognition (CVPR), Las Vegas, NV, USA, 27–30 June 2016; pp. 770–778. [Google Scholar] [CrossRef] [Scilit]
- Sun, X.; Xiao, B.; Wei, F.; Liang, S.; Wei, Y. Integral human pose regression. In Computer Vision—ECCV 2018; Ferrari, V., Hebert, M., Sminchisescu, C., Weiss, Y., Eds.; Springer: Cham, Switzerland, 2018; pp. 536–553. [Google Scholar] [CrossRef] [Scilit]
- Walter, S.D.; Eliasziw, M.; Donner, A. Sample size and optimal designs for reliability studies. Stat. Med. 1998, 17, 101–110. [Google Scholar] [CrossRef]
- Koo, T.K.; Li, M.Y. A guideline of selecting and reporting intraclass correlation coefficients for reliability research. J. Chiropr. Med. 2016, 15, 155–163, Correction in J. Chiropr. Med. 2017, 16, 346. https://doi.org/10.1016/j.jcm.2017.10.001. [Google Scholar] [CrossRef] [Scilit]

Disclaimer/Publisher’s Note: The statements, opinions and data contained in all publications are solely those of the individual author(s) and contributor(s) and not of MDPI and/or the editor(s). MDPI and/or the editor(s) disclaim responsibility for any injury to people or property resulting from any ideas, methods, instructions or products referred to in the content. |
© 2026 by the authors. Licensee MDPI, Basel, Switzerland. This article is an open access article distributed under the terms and conditions of the Creative Commons Attribution (CC BY) license.