


Highlights
What are the main findings?
- Calculated fractional blood pressure derived from pediatric reference tables declined during early childhood and remained relatively stable through adolescence despite increases in absolute blood pressure. In contrast, pulse pressure increased during adolescence, particularly in boys. Calculated FBP was lower in the reference-table stage 2 hypertension threshold scenario than in the reference-table normotensive scenario across all ages studied.
What are the implications of the main findings?
- The contrasting age-related patterns of FBP and pulse pressure support further investigation using paired, individual-level pediatric data to establish normative distributions and evaluate potential relevance to pediatric hypertension.
Abstract
Background/Objectives: Fractional blood pressure (FBP), calculated as pulse pressure divided by systolic blood pressure × 100, is mathematically equivalent to the pulse pressure index expressed as a percentage. This study characterized age-related patterns in calculated FBP and pulse pressure (PP) across childhood and adolescence. Methods: FBP and PP were calculated using values derived from published pediatric blood pressure reference tables for children aged 1–17 years. Calculations were performed for the reference-table normotensive scenario and reference-table stage 2 hypertension threshold scenario and analyzed by age and sex. Results: During early childhood, FBP declined from 52% to 41% in boys and from 50% to 40% in girls; corresponding calculated FBP values in the reference-table stage 2 hypertension threshold scenario declined from 42% to 33% and from 37% to 32%, respectively. Thereafter, FBP remained relatively stable, ranging from 38% to 42% in boys and from 39% to 41% in girls. Corresponding calculated FBP values in the reference-table stage 2 hypertension threshold scenario remained lower, ranging from 30% to 35% in boys and from 31% to 33% in girls. PP declined modestly during early childhood and increased during adolescence, particularly in boys. Conclusions: FBP declined during early childhood and remained relatively stable thereafter despite increases in absolute blood pressure, whereas PP increased during adolescence. Calculated FBP was lower in the reference-table stage 2 hypertension threshold scenario than in the reference-table normotensive scenario across all ages studied. These descriptive findings require validation using paired, individual-level pediatric blood pressure data.
1. Introduction
Proportional blood pressure was first described by Peng-Lin and Yue-Chun in 2009 [1]. Fractional blood pressure (FBP) operationalizes this concept by expressing pulse pressure (PP) as a proportion of systolic blood pressure (SBP). Pulse pressure is calculated as the difference between systolic and diastolic blood pressure (DBP): PP = SBP − DBP. Fractional blood pressure is calculated as FBP(%) = [(SBP − DBP)/SBP] × 100. Because blood pressure changes substantially during growth, this proportional measure may reveal age-related patterns that are not evident from absolute blood pressure values alone.
In older adults, proportional blood pressure has demonstrated prognostic value for adverse cardiovascular outcomes. In an analysis of 10,796 elderly participants from the National Health and Nutrition Examination Survey, Fang et al. reported that the Pulse Pressure Index (PPI), defined as pulse pressure divided by systolic blood pressure, was independently associated with increased all-cause mortality, increased cardiovascular mortality, and a higher likelihood of coronary heart disease, with the highest PPI category showing greater cardiovascular risk [2]. These observations indicate that proportional blood pressure indices may provide clinically relevant information beyond conventional blood pressure measurements. Recent studies have demonstrated clinical utility for proportional blood pressure measures in adults. Jin et al., analyzing hypertensive participants from NHANES 1999–2018, found a U-shaped relationship between pulse pressure index and both all-cause and cardiovascular mortality with mortality increasing at both low and high PPI values, with PPI outperforming pulse pressure alone as a predictor of long-term outcomes [3]. Higher PPI values have been linked to increased carotid intima-media thickness, an established marker of subclinical atherosclerosis, adverse cardiovascular and renal outcomes in chronic kidney disease, altered hemodynamics in heart failure, and an increased risk of prediabetes and other metabolic disorders [4,5,6,7,8]. Given its derivation from routine blood pressure measurements, FBP may provide a simple, cost-effective measure for age-related blood pressure comparisons and longitudinal investigation in pediatric populations. Nonetheless, the natural progression of proportional systemic blood pressure remains poorly defined in pediatric populations. Because PP is the numerator of the FBP calculation, examining its age-related pattern alongside FBP may help distinguish changes in absolute pulsatile pressure from changes in the proportional measure. Therefore, the objective of this study was to characterize age-related patterns in calculated fractional blood pressure and pulse pressure across childhood and adolescence and to examine differences by sex and between the reference-table normotensive scenario and reference-table stage 2 hypertension threshold scenario.
2. Materials and Methods
Fractional blood pressure (FBP) was calculated as FBP (%) = [(SBP − DBP)/SBP] × 100, where systolic blood pressure (SBP) and diastolic blood pressure (DBP) were expressed in mm Hg. Pulse pressure was defined as SBP − DBP. Calculated FBP values were rounded to the nearest whole percentage point for reporting. Age- and sex-specific blood pressure values for children aged 1–17 years were obtained from Tables 4 and 5 of the American Academy of Pediatrics clinical practice guideline [9]. Table 4 provides values for boys, and Table 5 provides values for girls. Blood pressure values at the 50th height percentile and the 50th blood pressure percentile for both SBP and DBP were used as the reference-table normotensive scenario. Values corresponding to the “95th percentile + 12 mm Hg” rows in Tables 4 and 5 were selected separately for SBP and DBP to construct a reference-table stage 2 hypertension threshold scenario. These tabulated SBP and DBP values do not represent paired measurements from individual children; therefore, the constructed scenario should not be interpreted as observed clinical blood pressure data or as a diagnostic classification of individual participants.
Age-specific FBP values were calculated for each year of age. Visual inspection of the resulting age trends suggested three phases: an early childhood decline (1–6 years), relative stability during later childhood (7–12 years), and continued stability throughout adolescence (13–17 years). Results are presented according to these descriptive age groupings. For descriptive continuity across ages 1–17 years, the reference-table stage 2 hypertension threshold scenario retained the age- and sex-specific “95th percentile + 12 mm Hg” table values. This analytic convention is distinct from the AAP clinical diagnostic criteria for adolescents aged 13 years and older, to whom fixed blood pressure thresholds apply [9]. Age-specific SBP and DBP input values, pulse pressure values, and calculated FBP values are provided in Supplementary Tables S1–S3. Calculations of pulse pressure and fractional blood pressure were performed using Microsoft Excel for Microsoft 365 (Microsoft Corporation, Redmond, WA, USA). Excel was also used to prepare the figures. No inferential statistical analyses were performed.
3. Results
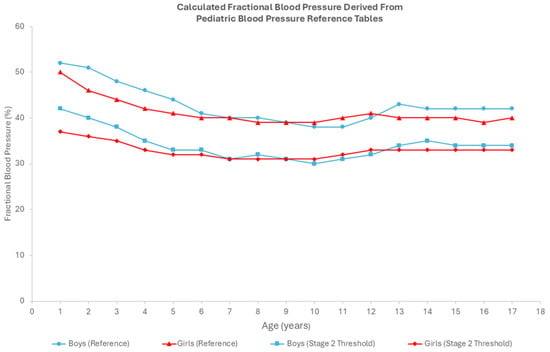
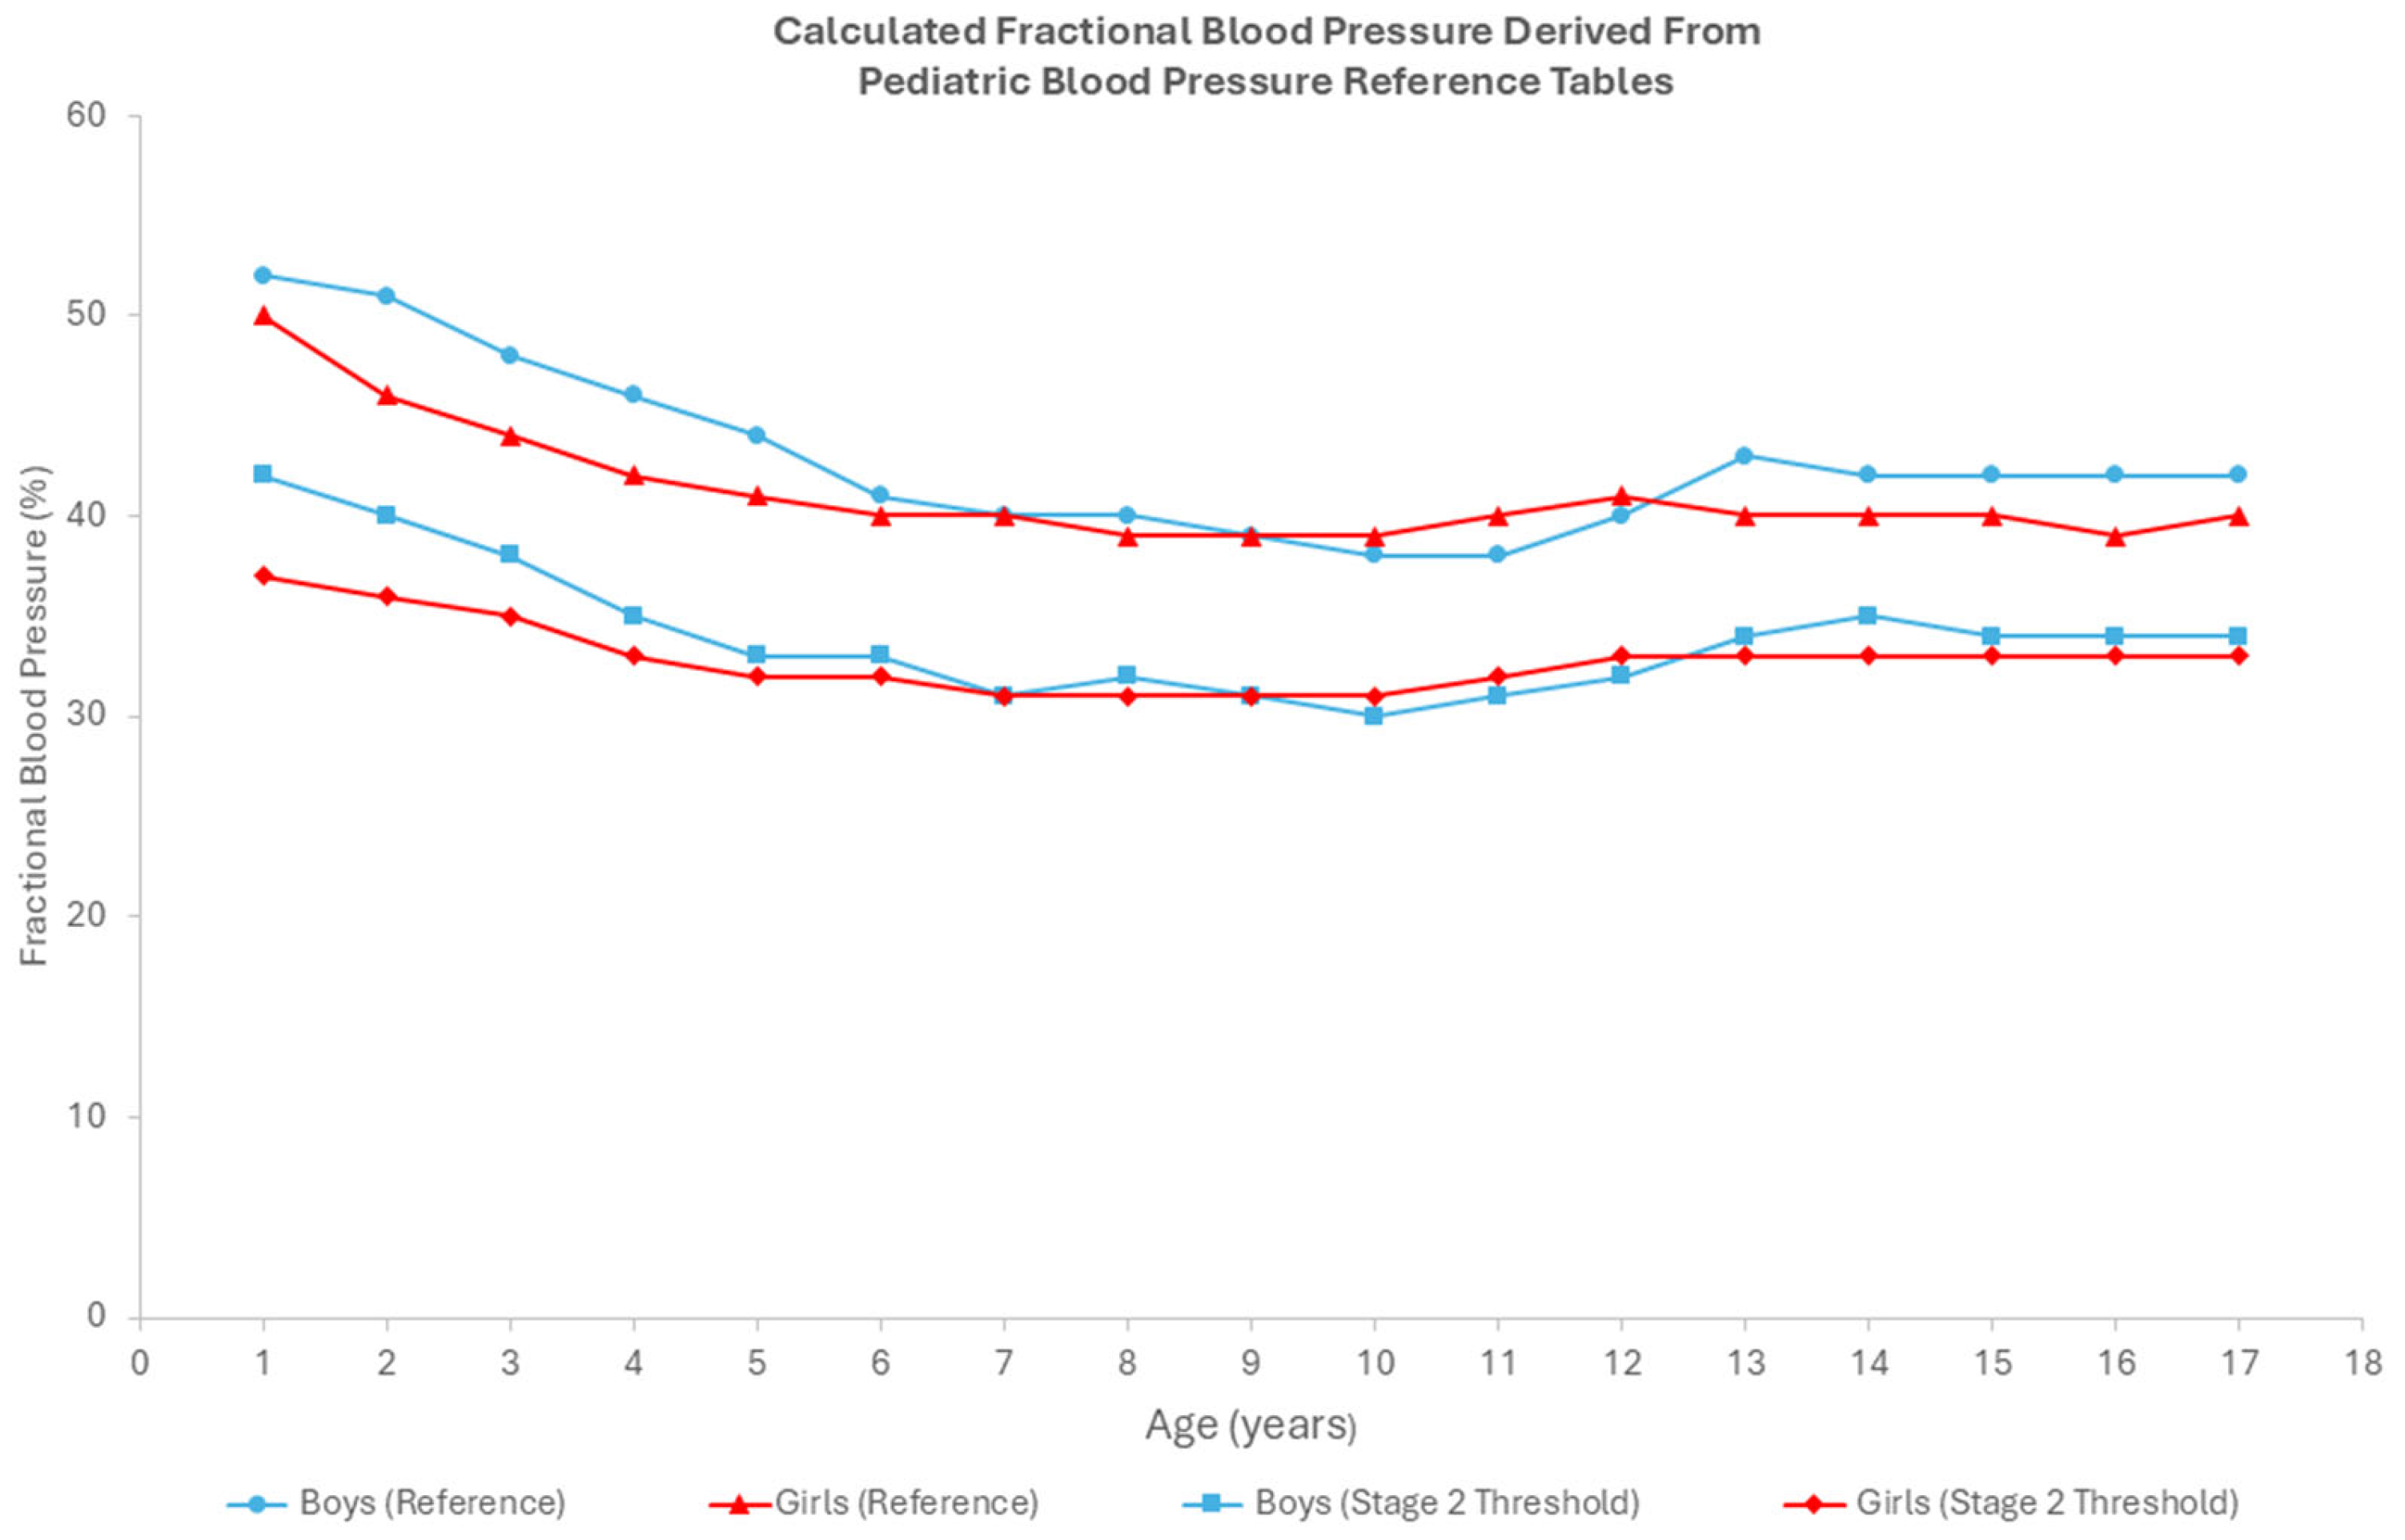
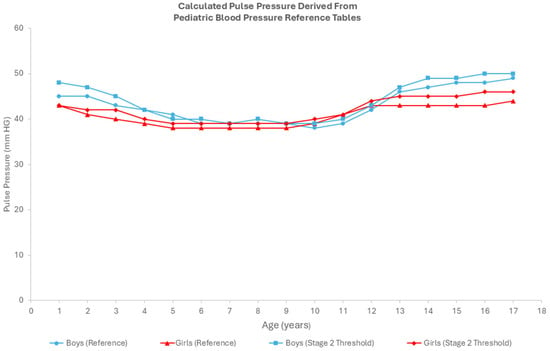
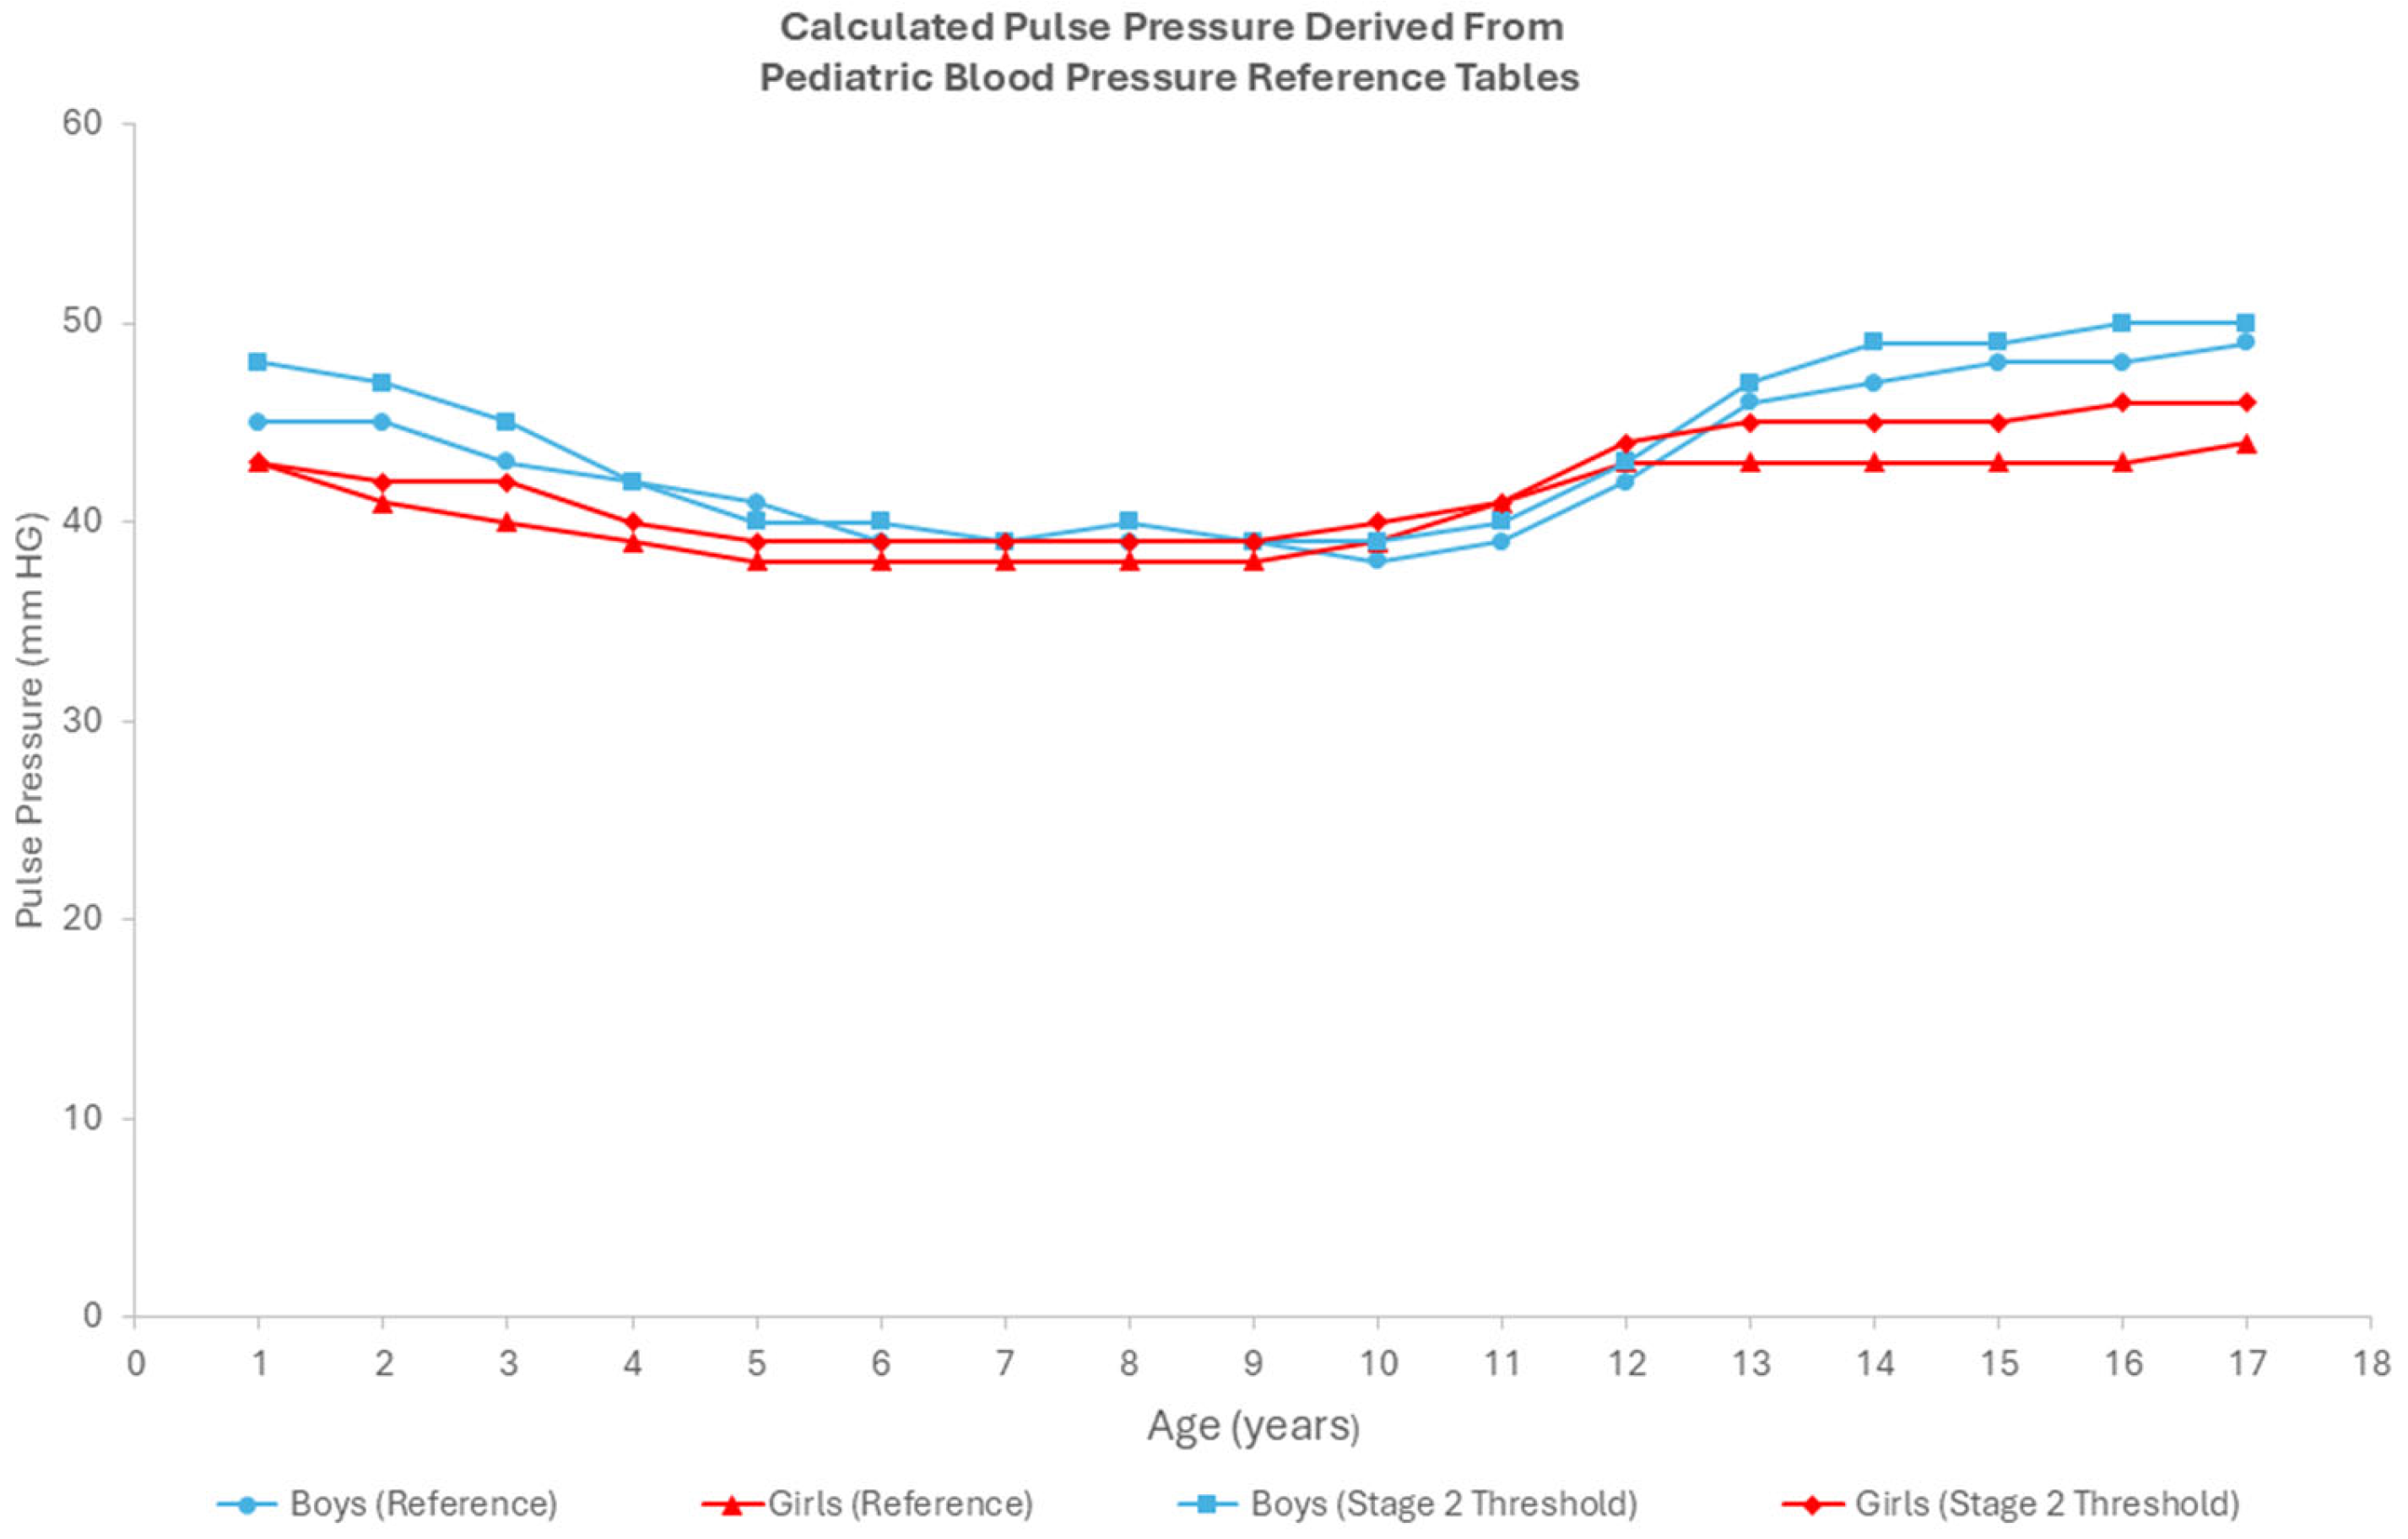
Calculated fractional blood pressure demonstrated an age-related pattern across childhood and adolescence. In children aged 1–6 years, FBP decreased from 52% to 41% in boys and from 50% to 40% in girls. Over the same age range, calculated FBP in the reference-table stage 2 hypertension threshold scenario declined from 42% to 33% in boys and from 37% to 32% in girls. From ages 7 to 12 years, FBP ranged from 38% to 40% in boys and from 39% to 41% in girls, while corresponding values in the reference-table stage 2 hypertension threshold scenario ranged from 30% to 32% in boys and from 31% to 33% in girls. During adolescence (13–17 years), FBP remained relatively stable, ranging from 42% to 43% in boys and from 39% to 41% in girls, while corresponding values in the reference-table stage 2 hypertension threshold scenario ranged from 34% to 35% in boys and remained at 33% in girls. Reference-table normotensive scenario PP declined modestly during early childhood, decreasing from 45 to 39 mm Hg in boys and from 43 to 38 mm Hg in girls between ages 1 and 6 years. Thereafter, PP remained relatively stable during later childhood and increased during adolescence, particularly in boys, reaching 49 mm Hg in boys and 44 mm Hg in girls by age 17. In contrast to the marked separation between the FBP scenarios, PP values in the reference-table normotensive scenario and reference-table stage 2 hypertension threshold scenario were generally similar across ages.
Calculated FBP and age-group summary values are shown in Figure 1 and Table 1, respectively, and calculated PP values are shown in Figure 2. Complete age-specific FBP values, the SBP and DBP inputs, and calculated PP values are provided in Supplementary Tables S1, S2, and S3, respectively.
Figure 1.
Age-related changes in fractional blood pressure (FBP), calculated as pulse pressure/systolic blood pressure × 100, across childhood and adolescence (1–17 years). Values were derived from published pediatric blood pressure reference tables and are shown for boys and girls in the reference-table normotensive scenario and the reference-table stage 2 hypertension threshold scenario. Age-specific calculated values are shown for each year of age. FBP declined in early childhood and remained relatively stable thereafter, while values calculated in the reference-table stage 2 hypertension threshold scenario were consistently lower than corresponding reference-table normotensive values across all ages studied.
Table 1.
Calculated fractional blood pressure (FBP) by age group, sex, and blood pressure scenario in children aged 1–17 years.
Figure 2.
Age-related changes in pulse pressure, calculated as systolic blood pressure (SBP)—diastolic blood pressure (DBP) across childhood and adolescence (1–17 years). Values were derived from published pediatric blood pressure reference tables and are shown for boys and girls in the reference-table normotensive scenario and reference-table stage 2 hypertension threshold scenario. Age-specific calculated values are shown for each year of age. Pulse pressure declined modestly during early childhood and increased during adolescence, particularly in boys. Compared with calculated FBP values, pulse pressure values in the reference-table normotensive scenario and reference-table stage 2 hypertension threshold scenario were relatively similar across ages.
4. Discussion
This study applies the established pulse pressure index (PPI) to pediatric blood pressure reference values and expresses the same proportional relationship as fractional blood pressure (FBP), calculated as pulse pressure divided by systolic blood pressure × 100. FBP is mathematically equivalent to PPI and differs only in its expression as a percentage rather than a unitless ratio. This presentation provides a readily interpretable framework for comparisons across age and sex. Age-specific reference values offer a baseline against which increases or decreases may be described. Because FBP is derived directly from routine blood pressure measurements, it may provide a practical approach for serial investigation in pediatric populations.
Across childhood and adolescence, FBP showed an early decline followed by relative stability. FBP values calculated in the reference-table stage 2 hypertension threshold scenario were consistently lower across age groups. FBP declined in early childhood to a male–female convergence around age 7. A subtle male–female crossover was observed in early adolescence, after which values in both the reference-table normotensive scenario and the reference-table stage 2 hypertension threshold scenario remained relatively stable.
In contrast to FBP, pulse pressure demonstrated a different age-related pattern. PP declined modestly during early childhood and increased during adolescence, particularly in boys. This divergence suggests that changes in absolute pulsatile pressure and proportional blood pressure may not occur in parallel during growth. Because FBP is calculated as pulse pressure divided by systolic blood pressure, increases in both pulse pressure and systolic pressure during adolescence may result in relatively stable proportional values despite rising absolute pressures. This divergence underscores that absolute and proportional blood pressure measures may provide complementary information during childhood and adolescence.
The lower calculated FBP values in the reference-table stage 2 hypertension threshold scenario may reflect the mathematical relationship between pulse pressure and systolic blood pressure. In the reference tables, systolic blood pressure increased proportionally more than pulse pressure, resulting in lower FBP values. Whether this pattern reflects underlying physiology, characteristics of the reference distributions, or both cannot be determined in the current study. Importantly, both lower and higher proportional blood pressure values have been associated with adverse cardiovascular outcomes in adults [3], supporting further evaluation using paired individual-level pediatric data.
Beyond this mathematical explanation, developmental vascular factors may also contribute to the observed pattern. The presence of lower FBP values in the reference-table stage 2 hypertension threshold scenario from the youngest age examined suggests that mechanisms operating before puberty may be relevant. Early-life influences on vascular structure and function, including fetal growth, neonatal hemodynamics, arterial remodeling, and developmental programming of cardiovascular regulation, have been associated with subsequent differences in arterial stiffness and vascular function [10,11]. In addition, pediatric vascular physiology differs substantially from that of adults. Studies of infants and young children have demonstrated age-related reductions in arterial impedance during growth, reflecting developmental changes in arterial structure, vessel geometry, and wave reflection [12]. Because pulse pressure is determined by interactions among ventricular output, arterial compliance, vascular impedance, wave reflection and neurohormonal factors, developmental changes in these determinants may influence proportional blood pressure measures throughout childhood. These developmental influences may help explain the lower calculated FBP values observed from the earliest ages examined.
An important observation is that, in contrast to adult populations in which higher proportional blood pressure indices are associated with hypertension and adverse outcomes [2,3,4], calculated values in the reference-table stage 2 hypertension threshold scenario were lower than corresponding reference-table normotensive scenario values. In adults, hypertension is strongly associated with arterial stiffening, producing disproportionate increases in pulse pressure and thus higher proportional indices. This established adult pattern contrasts with the lower calculated values observed in the reference-table stage 2 hypertension threshold scenario in the present study and warrants further investigation using individual-level pediatric data.
Arterial impedance is the resistance of the arterial system to pulsatile blood flow and incorporates vascular stiffness, vessel geometry, and wave reflection. Pediatric studies have demonstrated age-related changes in arterial impedance. Sharp et al. measured aortic input impedance in infants and young children and reported values substantially higher than those in adults, with values decreasing toward adult levels early in life as arteries lengthened with growth [12].
Gender-related differences in large-artery properties have also been reported; Ahimastos et al. found comparable arterial impedance-related measures in adolescents across sexes [13]. Collectively, these findings provide background regarding arterial and hemodynamic development during childhood and adolescence.
Similar to arterial impedance, measurements of arterial stiffness are recommended in adults with hypertension and may be assessed by carotid-femoral pulse wave velocity (cfPWV), pulse wave analysis, and ambulatory arterial stiffness index derived from 24-h ambulatory blood pressure monitoring. In children, these measurements may be challenging because of patient movement, the need for specialized equipment, and the requirement for highly trained technicians. Despite these limitations, cfPWV is increasingly recognized as an important marker of cardiovascular risk in children and adolescents and has been shown to increase in association with pediatric hypertension, obesity, diabetes, and chronic kidney disease [14]. Because pulse pressure is influenced by arterial stiffness, wave reflection, and vascular impedance, future studies could examine whether age-related patterns in calculated FBP are associated with these vascular properties.
Childhood obesity and overweight affect up to one-third of children worldwide and are increasingly recognized as important contributors to early vascular aging. Pathological studies have demonstrated that atherosclerotic changes begin in childhood, with fatty streaks and early fibrous lesions present in the aorta and coronary arteries of children and young adults. These lesions have been associated with obesity, hypertension, dyslipidemia, and other cardiovascular risk factors, suggesting that adverse vascular remodeling may begin decades before the clinical manifestation of cardiovascular disease [15].
Although obesity and other cardiovascular risk factors may influence vascular health during childhood, vascular differences may originate earlier in development. Increased arterial stiffness and pulse wave velocity have been reported in children born prematurely or small for gestational age, suggesting that adverse fetal and neonatal conditions can influence vascular development [10,16]. Proposed mechanisms include altered elastin deposition, endothelial dysfunction, changes in arterial geometry, and increased vascular impedance [10]. The present study did not include calculated values from the first year of life. Future studies examining FBP patterns in preterm and term neonates and infants may provide additional insight into early cardiovascular development and disease trajectories.
This study is limited by reliance on previously published, publicly available reference data rather than individual-level measurements. Consequently, variability estimates, longitudinal trajectories, and measures of dispersion were unavailable, and statistical comparisons between groups could not be performed. A further limitation is that FBP is mathematically equivalent to the previously described pulse pressure index (PPI), representing an alternative presentation of an established proportional blood pressure measure. The reference-table stage 2 hypertension threshold scenario was constructed from separately selected SBP and DBP values rather than paired clinical measurements and therefore represents a mathematical comparison scenario, not an observed hypertensive cohort. In addition, the percentile-based reference-table values retained through age 17 for descriptive continuity should not be interpreted as clinical diagnostic thresholds for adolescents aged 13 years and older, for whom the AAP guideline applies fixed thresholds. Finally, the lower calculated FBP values observed in this constructed scenario may reflect the mathematical relationship between pulse pressure and systolic blood pressure. Pulse pressure values were generally similar across the reference-table normotensive scenario and reference-table stage 2 hypertension threshold scenario, whereas systolic blood pressure increased proportionally more in the reference-table stage 2 hypertension threshold scenario, resulting in lower FBP values. It cannot be determined from this reference-table analysis whether the observed differences reflect underlying physiology, characteristics of the reference distributions, or a combination of both.
Further work using individual-level and longitudinal pediatric datasets is needed to establish normative distributions and evaluate clinical utility. These findings provide descriptive reference patterns for an established proportional blood pressure measure and support further investigation using individual-level pediatric data. Potential applications in physiologic stress testing or altered loading conditions, including valvular heart disease, remain speculative and require further study.
5. Conclusions
Calculated fractional blood pressure declined during early childhood and remained relatively stable thereafter despite increases in absolute blood pressure, whereas pulse pressure increased during adolescence. Calculated FBP was lower in the reference-table stage 2 hypertension threshold scenario than in the reference-table normotensive scenario across all ages studied. These descriptive findings require validation using paired, individual-level pediatric blood pressure data.
Supplementary Materials
The following supporting information can be downloaded at: https://www.mdpi.com/article/10.3390/children13111506/s1, Table S1: Age-specific fractional blood pressure (FBP) values derived from pediatric blood pressure reference tables for boys and girls aged 1–17 years in the reference-table normotensive scenario and reference-table stage 2 hypertension threshold scenario; Table S2: Age- and sex-specific blood pressure inputs for calculating fractional blood pressure and pulse pressure in the reference-table normotensive scenario and reference-table stage 2 hypertension threshold scenario; Table S3: Age- and sex-specific calculated pulse pressure for the reference-table normotensive scenario and reference-table stage 2 hypertension threshold scenario.
Author Contributions
Conceptualization, J.L., J.G. and S.G.; formal analysis, J.L.; writing—original draft preparation, J.L.; writing—review and editing, J.G. and S.G. All authors have read and agreed to the published version of the manuscript.
Funding
This research received no external funding.
Institutional Review Board Statement
Not applicable. Under United States federal human-subjects regulations, Institutional Review Board approval was not required because this work does not meet the definition of research involving “human subjects” under 45 CFR § 46.102(e).
Informed Consent Statement
Not applicable. The study did not involve intervention or interaction with living individuals and did not involve obtaining, using, studying, analyzing, or generating identifiable private information or identifiable biospecimens. All analyses were based solely on previously published, publicly available aggregate pediatric blood pressure reference tables. Therefore, informed consent was not applicable.
Data Availability Statement
Data were derived from previously published, publicly available pediatric blood pressure reference tables.
Acknowledgments
The authors acknowledge the use of publicly available pediatric blood pressure reference data. The authors are grateful to Thomas G. Di Sessa for his mentorship, guidance, and valuable contributions to the development of this manuscript. The authors used OpenAI ChatGPT (GPT-5) solely to assist with language refinement, grammar correction, and editorial improvements. All AI-generated suggestions were carefully reviewed by the authors, who independently evaluated, accepted or rejected proposed modifications, and assume full responsibility for the final content of the manuscript.
Conflicts of Interest
The authors declare no conflicts of interest.
References
- Yang, P.-L.; Li, Y.-C. Pulse pressure index (pulse pressure/systolic pressure) may be better than pulse pressure for assessment of cardiovascular outcomes. Med. Hypotheses 2009, 72, 729–731. [Google Scholar] [CrossRef] [Scilit]
- Fang, L.X.; Wu, Y.H.; Yao, T.; Wang, Z.N.; Qian, S.; Jiang, T.; Xu, J.; Lin, Y.N.; Li, Y.C. Use of pulse pressure index for cardiovascular outcomes assessment and development of a coronary heart disease model for the elderly. BMC Cardiovasc. Disord. 2025, 25, 297. [Google Scholar] [CrossRef] [Scilit]
- Jin, H.; Fang, S.; An, S.; Ding, Y. Association of pulse pressure index with mortality in patients with hypertension: Results from NHANES 1999–2018. J. Clin. Hypertens. 2025, 27, e70004. [Google Scholar] [CrossRef] [Scilit]
- Cai, A.; Mo, Y.; Zhang, Y.; Li, J.; Chen, J.; Zhou, Y.; Feng, Y. Relationship of pulse pressure index and carotid intima–media thickness in hypertensive adults. Clin. Exp. Hypertens. 2015, 37, 267–270. [Google Scholar] [CrossRef] [Scilit]
- Raina, R.; Polaconda, S.; Nair, N.; Chakraborty, R.; Sethi, S.; Krishnappa, V.; Kapur, G.; Mhanna, M.; Kusumi, K. Association of pulse pressure, pulse pressure index, and ambulatory arterial stiffness index with kidney function in a cross-sectional pediatric chronic kidney disease cohort from the CKiD study. J. Clin. Hypertens. 2020, 22, 1059–1069. [Google Scholar] [CrossRef] [Scilit]
- Petrie, C.J.; Ponikowski, P.; Metra, M.; Mitrovic, V.; Ruda, M.; Fernandez, A.; Vishnevsky, A.; Cotter, G.; Milo, O.; Laessing, U.; et al. Proportional pulse pressure relates to cardiac index in stabilized acute heart failure patients. Clin. Exp. Hypertens. 2018, 40, 637–643. [Google Scholar] [CrossRef] [Scilit]
- Namasivayam, M.; Lau, E.S.; Zern, E.K.; Schoenike, M.W.; Hardin, K.M.; Sbarbaro, J.A.; Cunningham, T.F.; Farrell, R.M.; Rouvina, J.; Kowal, A.; et al. Exercise blood pressure in heart failure with preserved and reduced ejection fraction. JACC Heart Fail. 2022, 10, 278–286. [Google Scholar] [CrossRef] [Scilit]
- Pan, Y.; Meng, H.; Guo, L.; Kong, B.; Shuai, W.; Huang, H. Examination of nonlinear associations between pulse pressure index and incident prediabetes susceptibility: A five-year retrospective cohort investigation. Sci. Rep. 2024, 14, 17948. [Google Scholar] [CrossRef] [Scilit]
- Flynn, J.T.; Kaelber, D.C.; Baker-Smith, C.M.; Blowey, D.; Carroll, A.E.; Daniels, S.R. Clinical practice guideline for screening and management of high blood pressure in children and adolescents. Pediatrics 2017, 140, e20171904. [Google Scholar] [CrossRef] [Scilit]
- Varley, B.J.; Nasir, R.F.; Craig, M.E.; Gow, M.L. Early life determinants of arterial stiffness in neonates, infants, children and adolescents: A systematic review and meta-analysis. Atherosclerosis 2022, 355, 1–7. [Google Scholar] [CrossRef] [Scilit]
- Lurbe, E.; Redon, J. Neurohumoral and autonomic regulation of blood pressure. In Pediatric Hypertension; Flynn, J.T., Ingelfinger, J.R., Brady, T.M., Eds.; Springer: Cham, Switzerland, 2022. [Google Scholar] [CrossRef] [Scilit]
- Sharp, M.K.; Pantalos, G.M.; Minich, L.; Tani, L.Y.; McGough, E.C.; Hawkins, J.A. Aortic input impedance in infants and children. J. Appl. Physiol. 2000, 88, 2227–2239. [Google Scholar] [CrossRef] [Scilit]
- Ahimastos, A.A.; Formosa, M.; Dart, A.M.; Kingwell, B.A. Gender differences in large artery stiffness pre- and post-puberty. J. Clin. Endocrinol. Metab. 2003, 88, 5375–5380. [Google Scholar] [CrossRef] [Scilit]
- Savant, J.D.; Furth, S.L.; Meyers, K.E.C. Arterial stiffness in children: Pediatric measurement and considerations. Pulse 2014, 2, 69–80. [Google Scholar] [CrossRef] [Scilit]
- Strong, J.P.; Malcom, G.T.; McMahan, C.A.; Tracy, R.E.; Newman, W.P.; Herderick, E.E.; Cornhill, J.F. Prevalence and extent of atherosclerosis in adolescents and young adults: Implications for prevention from the Pathobiological Determinants of Atherosclerosis in Youth (PDAY) Study. Jama 1999, 281, 727–735. [Google Scholar] [CrossRef] [Scilit]
- Muñiz Fontán, M.; Oulego Erroz, I.; Revilla Orias, D.; Muñoz Lozón, A.; Rodriguez Núñez, A.; Lurbe I Ferrer, E. Thoracic aortic intima-media thickness in preschool children born small for gestational age. J. Pediatr. 2019, 208, 81–88.e2. [Google Scholar] [CrossRef] [Scilit]

Disclaimer/Publisher’s Note: The statements, opinions and data contained in all publications are solely those of the individual author(s) and contributor(s) and not of MDPI and/or the editor(s). MDPI and/or the editor(s) disclaim responsibility for any injury to people or property resulting from any ideas, methods, instructions or products referred to in the content. |
© 2026 by the authors. Licensee MDPI, Basel, Switzerland. This article is an open access article distributed under the terms and conditions of the Creative Commons Attribution (CC BY) license.