


Abstract
Background: Chronic insomnia is an important global health concern, but its molecular heterogeneity remains incompletely understood. Objective biomarkers may help characterize chronic insomnia and its traditional Chinese medicine (TCM) syndrome patterns. Methods: We applied a Public Evidence-informed Prioritization–Multi-omics Discovery–Targeted Validation (PMT) framework integrating public transcriptomic datasets with serum profiles from healthy controls and patients with chronic insomnia classified as excess (Shi) or deficiency (Xu) syndrome. Analyses included transcriptomic data processing and machine learning-based gene prioritization, serum metabolomics and lipidomics, targeted neurotransmitter quantification, bile acid profiling, and pathway-level comparison across omics datasets. Results: Transcriptomic analysis and weighted gene co-expression network analysis identified a phenotype-associated module containing 178 differentially expressed genes (DEGs), and three machine learning methods prioritized 11 candidate genes. Compared with controls, the Shi group had 53 differential metabolites and 87 differential lipids, whereas the Xu group had 49 differential metabolites and 80 differential lipids. Serum analyses revealed syndrome-associated differences in N-acetylated amino acids, lipid species, neurotransmitter-related metabolites, and bile acids. Kyoto Encyclopedia of Genes and Genomes (KEGG)-based integrative analysis identified shared pathways linking transcriptomic alterations with serum metabolomic and lipidomic changes, highlighting pathway-level convergence across the three omics layers. Cross-validated receiver operating characteristic analyses showed variable discriminatory performance, generally stronger for insomnia identification than for differentiation between Shi and Xu syndromes. Conclusions: Using the PMT framework, this study delineated distinct gene–metabolite–lipid signatures of chronic insomnia and its major TCM syndromes, providing a molecular basis for objective diagnosis, syndrome differentiation, and precision intervention.
1. Introduction
Insomnia disorder is among the most common sleep disorders in clinical practice. People with the condition often struggle to fall asleep, stay asleep, or avoid waking too early, and it is often associated with daytime impairments, such as fatigue, impaired attention, and emotional dysregulation [1]. According to the International Classification of Sleep Disorders, Third Edition (ICSD-3), classifies insomnia disorder into short-term insomnia, chronic insomnia, and others [2]. Epidemiological studies suggest that insomnia affects 10–20% of the general population, with about half of these cases becoming chronic [3]. Over time, insomnia can take a heavy toll on quality of life. It has also been associated with higher risks of hypertension, coronary heart disease, stroke, depression, and anxiety and can contribute to broader public health and social costs, such as traffic accidents and reduced productivity. Understanding the biological basis of insomnia is therefore crucial for earlier detection, more accurate risk assessment, and more precise intervention.
Although the hyperarousal hypothesis, cognitive-behavioural models, and the 3P model have been widely used to explain the onset and persistence of insomnia, these frameworks do not fully capture its complex biological heterogeneity [4]. In clinical practice, insomnia is still diagnosed largely on the basis of medical history and subjective questionnaire-based assessments. Objective, stable, and reproducible biomarkers remain scarce, limiting early identification, subtype classification, and individualized treatment. Against this background, traditional medical systems such as traditional Chinese medicine (TCM) offer a complementary perspective by focusing on the overall functional state of the individual. TCM broadly classifies insomnia-related manifestations into deficiency (Xu) and excess (Shi) syndrome [5]. Patients with predominantly Shi-pattern insomnia often present with features of heightened excitability, such as restlessness and irritability. By contrast, those with predominantly Xu-pattern insomnia more commonly show signs of functional insufficiency, including fatigue and palpitations. This Xu-Shi distinction broadly parallels observations in modern medicine that patients with insomnia may exhibit heterogeneous neuroendocrine, immune-inflammatory, and metabolic states. These syndromes may reflect distinct forms of systemic functional imbalance and are conceptually compatible with the principles of systems medicine and individualized care. TCM has accordingly developed different therapeutic strategies for these functional states. Shumian Capsule has been used for insomnia with predominantly Shi syndrome [6], whereas the Zaoren Anshen formula has been used for insomnia with predominantly Xu syndrome [7]. Both interventions have been evaluated in randomized, double-blind, placebo-controlled clinical trials and have shown therapeutic benefits. A functional-state-based classification may therefore provide an additional framework for investigating the pathological basis of insomnia and developing subtype-oriented interventions.
The rapid expansion of public omics resources and advances in bioinformatics have created new opportunities for biomarker research by enabling systematic interrogation of disease-associated molecular features. The Gene Expression Omnibus (GEO), for example, contains extensive microarray and high-throughput sequencing datasets that can be reanalysed to identify disease-associated transcriptional changes and explore potential regulatory pathways [8,9]. Metabolomics provides a complementary layer of biological information by capturing dynamic changes in endogenous metabolites and linking gene regulation and environmental influences to disease phenotypes. Previous studies have associated insomnia and insufficient sleep with disturbances in amino acid, energy, and lipid metabolism, as well as with circadian disruption. These conditions may also involve impaired glucose metabolism, altered fatty acid oxidation, and increased oxidative stress [10,11,12]. Sleep deprivation has been reported to perturb tryptophan, taurine, glycerophospholipid, carnitine, and fatty acid metabolism. Sleep restriction may further disrupt cholesterol transport, alter the expression of lipid-metabolism-related genes, and contribute to changes in bile acid metabolism [13,14,15]. Neurotransmitters provide an additional link between sleep regulation and metabolic homeostasis. Serotonin, γ-aminobutyric acid (GABA), and dopamine are directly involved in sleep–wake regulation and are also closely related to metabolic processes. Integrating metabolomics, lipidomics, bile acid profiling, and neurotransmitter analysis may therefore provide a more comprehensive view of the metabolic networks underlying insomnia and help characterize molecular differences among its TCM patterns.
Artificial intelligence approaches, particularly machine learning, can efficiently extract informative molecular features from large-scale omics datasets. These methods can improve disease classification and prediction and help prioritize candidate genes and regulatory pathways [16,17]. Integrating public transcriptomic, metabolomic, and lipidomic data with machine learning analysis may therefore provide molecular evidence for subsequent biomarker screening and evaluation in clinical samples. Despite these advances, important gaps remain. Previous studies have provided valuable insights into metabolic abnormalities associated with insomnia, but multi-omics integration remains limited. The relationships among molecular alterations, sleep phenotypes, and TCM pattern classification also remain unclear. To address these gaps, we proposed and initially applied a PMT (Public Evidence informed Prioritization–Multi-omics Discovery–Targeted Validation) framework for biomarker research. The framework consists of three sequential stages. First, publicly available resources, including GEO and UK Biobank, together with high-quality published studies, are used to identify and prioritize metabolic pathways associated with insomnia. Second, untargeted or broadly targeted omics approaches are used to map core metabolic networks and assess perturbations within the prioritized pathways. Third, targeted absolute quantification methods, such as multiple reaction monitoring (MRM), are used to validate key metabolites within these pathways, while metabolic flux analysis may be employed to investigate key metabolic nodes. Exploratory receiver operating characteristic (ROC) analysis is also performed to assess the potential discriminatory performance of individual metabolites or their combinations. Guided by this framework, the present study integrated public transcriptomic data from GEO with serum multi-omics profiles obtained from clinical samples to systematically characterize the molecular features of chronic insomnia and its Shi and Xu patterns. Specifically, machine learning was used to prioritize candidate genes and pathways associated with insomnia. Serum metabolomics, lipidomics, neurotransmitter analysis, and targeted bile acid profiling were then combined to characterize metabolic differences among the study groups. Gene–metabolite–lipid association networks were subsequently constructed to identify potential molecular hubs and candidate biomarkers. Together, these analyses were designed to clarify the biological basis of distinct functional states or subtypes, deepen our understanding of biological heterogeneity in chronic insomnia, and provide a scientific basis for subtype classification and individualized intervention.
2. Materials and Methods
2.1. Instrumentation, Chemicals and Reagents
The high-performance liquid chromatography–tandem mass spectrometry (HPLC-MS/MS) system comprised an ExionLC-20AC HPLC system, an IonDrive™ Turbo V ion source, and a SCIEX Triple Quad 6500+ mass spectrometer (AB Sciex LLC, Framingham, MA, USA). Data acquisition was performed using Analyst software (version 1.7; AB Sciex LLC, Framingham, MA, USA), and data processing was performed using MultiQuant software (version 3.0.3; AB Sciex LLC, Framingham, MA, USA). The Acquity UPLC system was purchased from Waters Corporation (Milford, MA, USA); the Targin VX-III multi-tube vortexer was acquired from Beijing Targin Technology Co., Ltd. (Beijing, China); the Forma 88,000 Series −86 °C ultra-low temperature freezer was obtained from Thermo Scientific (Waltham, MA, USA); the Rotanta 460R high-speed refrigerated centrifuge was purchased from Hettich (Tuttlingen, Germany); and the MC-8 integrated cryogenic centrifuge concentrator was acquired from Beijing JM Technology Co., Ltd. (Beijing, China).
Experimental water was purified using a Milli-Q Integral 5 water purification system (Merck Millipore, Burlington, MA, USA). LC/MS-grade methanol, acetonitrile, isopropanol, ammonium formate, ammonium acetate, and formic acid were purchased from Beijing Dikma Technologies Inc. (Beijing, China). Mass spectrometry library kits and reference standards for the creation of a metabolomics analysis platform, including glucose metabolism reference standards, were procured from Sigma-Aldrich (St. Louis, MO, USA). Internal standards, comprising d-3-norepinephrine, d-4-dopamine, d-5-serotonin, and the MSK-QReSS-Kit (contains 17 isotopically labeled compounds), were obtained from Cambridge Isotope Laboratories (Andover, MA, USA). Internal standards CA-D4 and TCA-D4 were acquired from Shanghai Zhenzhun Biotechnology Co., Ltd. (Shanghai, China). Relevant lipid reference standards, including Cer/Sph Mixture I, SPLASH™ LIPIDOMIX™ mass spectrometry standards (containing 14 isotopically labeled compounds), and reference standards for metabolic pathways, sodium borate, benzoyl chloride, d-5-benzoyl chloride, and methyl tert-butyl ether, were acquired from Avanti Research and Sigma-Aldrich (St. Louis, MO, USA). All standards used had a purity greater than 99%.
2.2. GEO Data Processing and Machine Learning Analysis
2.2.1. Data Collection and Data Preprocessing
Given the limited availability of insomnia-related transcriptomic datasets, sleep deprivation (SD) datasets were also included because of their similarities to insomnia in clinical manifestations and experimental models. The GEO database was searched using “insomnia” and “sleep deprivation” as keywords. Untreated clinical datasets containing at least 10 samples were retained. Four datasets (GSE208668, GSE98564, GSE98565, and GSE98566) were integrated. The GEO accession numbers, platform identifiers, platform descriptions, and group-specific sample-record counts for these four datasets are summarized in Supplementary Table S1. Genes with more than 50% missing values were removed, remaining missing values were imputed, and batch effects were corrected using the R package “limma”.
2.2.2. Identification of Differentially Expressed Genes
Samples were classified into the control group and insomnia/SD group according to annotation information. Differential expression analysis was performed using the R package “limma” [18], with |log2FC| ≥ 0.1 and False Discovery Rate (FDR) ≤ 0.05 as thresholds. The resulting differentially expressed genes (DEGs) were used for volcano plot visualization and weighted gene co-expression network analysis (WGCNA).
2.2.3. WGCNA
WGCNA was performed based on the identified DEGs to construct a gene co-expression network. The optimal soft-thresholding power was determined by scale-free topology analysis, and the minimum module size was set to 50 genes. Modules significantly associated with the insomnia/SD phenotype were identified and selected for downstream enrichment analysis.
2.2.4. Functional Enrichment Analysis
Gene Ontology (GO) and Kyoto Encyclopedia of Genes and Genomes (KEGG) enrichment analyses were conducted using the OmicShare platform. For machine learning-based feature selection, the data were stratified by outcome and randomly divided into discovery and validation sets at a 7:3 ratio using a fixed random seed (123) in R. Least absolute shrinkage and selection operator (LASSO), support vector machine recursive feature elimination (SVM-RFE), and random forest (RF) were used to prioritize candidate genes. ROC analysis was used to evaluate discrimination. Details of the machine learning procedures and model evaluation are provided in the relevant analysis workflow.
2.3. Study Participants and Inclusion/Exclusion Criteria
From November 2019 to January 2022, patients with chronic insomnia were recruited from outpatient clinics of institutions affiliated with the China Academy of Chinese Medical Sciences, including the TCM Clinic, Acupuncture and Moxibustion Hospital, Xiyuan Hospital, and Guang’anmen Hospital. Initial screening was conducted using the Pittsburgh Sleep Quality Index (PSQI), followed by objective sleep assessment using polysomnography (PSG). Healthy volunteers were recruited separately from the community to serve as controls. Based on clinical evaluation, participants were assigned to three groups: the healthy control group (Control group, n = 22), consisting of individuals without insomnia or other sleep disorders; the Shi syndrome group (Shi group, n = 28), consisting of patients with chronic insomnia classified as Shi syndrome; and the Xu syndrome group (Xu group, n = 8), consisting of patients with chronic insomnia classified as Xu syndrome. The Shi group included Liver Qi Stagnation transforming into Fire and Phlegm-Heat Obstructing the Mind, whereas the Xu group included Yin Xu with Hyperactive Fire, Heart–Spleen Xu, and Heart Xu with Fear. The study was approved by the Ethics Committee of the Medical Experimental Center of the China Academy of Chinese Medical Sciences (Approval No.: 2018 No.7, on 27 September 2018).
Participants in the Shi and Xu groups were required to meet the diagnostic criteria for chronic insomnia disorder according to the ICSD-3, with a PSQI score ≥ 16, and fulfill the TCM syndrome diagnostic criteria specified in the Standards for Diagnosis and Efficacy Evaluation of Traditional Chinese Medicine Diseases and Syndromes [19]. Healthy controls had no history of insomnia, other sleep disorders, or major medical conditions.
The exclusion criteria included the existence of severe psychiatric disorders; prolonged use of antipsychotics or sedative-hypnotics that could not be ceased during the study; comorbidity with severe cardiovascular, cerebrovascular, respiratory, or immune system diseases, or notable hepatic or renal dysfunction; comorbidity with other sleep disorders; and inadequate compliance, characterized by an inability to adhere to medical directives, thus obstructing the completion of the trial, symptom monitoring, and evaluations of efficacy and safety.
2.4. Diagnostic Criteria for Chronic Insomnia Disorder
The diagnosis of chronic insomnia disorder in the Shi and Xu groups followed the ICSD-3 criteria [2]. TCM syndrome differentiation followed the classification of insomnia syndromes in the Standards for Diagnosis and Efficacy Evaluation of TCM Diseases and Syndromes [19]. General demographic information and medical history were collected (Supplementary Table S2). TCM syndrome differentiation was based on the four diagnostic methods, including observation of complexion and tongue, listening and smelling, inquiry about chief complaints and accompanying symptoms, and pulse examination. The information was recorded using a dedicated TCM four-diagnostic collection form (Supplementary Table S3). The diagnostic process was supervised and evaluated by two senior clinical physicians holding the title of associate chief physician or higher.
2.5. Information Collection
This study systematically gathered participants’ basic information, including age, gender, and body mass index (BMI); medical history characteristics; clinical symptoms and signs; TCM four-diagnostic syndrome differentiation data; general clinical indicators; and various assessment measures, including the PSQI, Insomnia Severity Index (ISI). Objective sleep data collected through PSG included total sleep time (TST), sleep efficiency (SE), wake after sleep onset (WASO), sleep onset latency (SOL), rapid eye movement sleep latency (REML), wake periods (W), percentage of time spent in rapid eye movement (R%) and non-rapid eye movement (N1%, N2%, N3%) stages, and the apnea-hypopnea index (AHI). The methods for PSG data collection and analysis were based on previously published research [20].
2.6. Clinical Sample Collection
Fasting venous blood samples were collected from participants in the morning during the same time period. Blood was drawn using a vacuum blood collection system and placed in a coagulation-promoting tube. The sample was left to clot at room temperature for 1 h and centrifuged at 3000 rpm for 10 min to separate the supernatant. The supernatant was aliquoted and stored at temperatures below −80 °C.
2.7. Metabolomics Analysis
2.7.1. Processing and Preparation of Samples
Metabolomics analysis followed previously established laboratory methods [21]. The sample preparation procedure was as follows: 50 µL of serum sample was mixed with 450 µL of pre-cooled extraction solvent (methanol: acetonitrile: water = 2:2:1) containing an internal standard (MSK-QReSS-KIT, 2.5 mM). Mixtures were vortexed at 8000 rpm for 3 min and incubated at −20 °C for 2 h. The concentrated residue was redissolved with 100 µL of extraction solvent without an internal standard, followed by centrifugation at 20,000× g for 15 min at 4 °C. Finally, 80 µL of the supernatant was collected for analysis. Additionally, 10 µL of each sample solution was mixed to prepare a quality control (QC) sample.
2.7.2. Chromatographic and Mass Spectrometric Conditions
The ACQUITY UPLC BEH Amide column (2.1 × 50 mm, 1.7 μm; Waters Corporation, Milford, MA, USA) and pre-column (2.1 × 5 mm, 1.7 μm; Waters, USA) were used for chromatographic separation. The mobile phase consisted of Solvent A (95% water: 5% acetonitrile, containing 5 mM of ammonium formate and 0.01% formic acid) and Solvent B (95% acetonitrile: 5% water, containing 5 mM of ammonium formate and 0.01% formic acid). The gradient elution program was as follows: 0–2 min, 95% B; 2–4 min, 95–90% B; 4–6 min, 90% B; 6–9 min, 90–85% B; 9–12 min, 85% B; 12–15 min, 85–75% B; 15–16 min, 75% B; 16–18 min, 75–50% B; 18–20 min, 50% B; 20–22 min, 50–25% B; 22–24 min, 25% B; 24–25 min, 25–95% B; 25–30 min, 95% B. Flow rate: 0.3 mL·min−1, column temperature: 35 °C; autosampler temperature: 4 °C; and injection volume: 5 μL.
Electrospray ionization (ESI) was used as the ionization source in both positive and negative ion modes, under multiple reaction monitoring (MRM). The curtain gas (N2) pressure was set to 40 psi, and the collision gas (N2) pressure was maintained at 9 psi. The spray voltage in positive and negative modes was set at +5500 V and −4500 V, respectively. The nebulizer temperature was set to 550 °C, with ion source gas (Gas1, N2) and auxiliary gas (Gas2, N2) both maintained at 55 psi. A comprehensive targeted analysis was conducted on over 500 metabolites in the serum samples, including organic acids, amino acids, biogenic amines, polyamines, nucleotides, coenzymes, sugars, steroids, and other categories. Metabolite identification was based on the custom-built database of the research team, and a list of relevant ion pairs is provided in Supplementary Table S4.
2.8. Lipidomics Analysis
2.8.1. Processing and Preparation of Samples
Lipidomic analysis followed previously established laboratory methods [22]. The sample preparation procedure was as follows: 40 µL serum sample was mixed with 300 µL of pre-cooled methanol containing internal standards (SPLASH™ LIPIDOMIX™, 1.8–329.1 µg·mL−1) and vortexed at 8000 rpm for 1 min. Subsequently, 1 mL of methyl tert-butyl ether was added, and the mixture was shaken at 8000 rpm for 15 min, followed by the addition of 300 μL of water and vortexing at 3000 rpm for 30 s. After standing at 4 °C for 10 min, the mixture was centrifuged at 20,000× g for 15 min at 10 °C. Two 400 μL aliquots of the supernatant were collected and vacuum-concentrated at 1500 rpm for 90 min at 10 °C.
For analysis in positive ion mode, the resulting residue was reconstituted in 80 μL of reconstitution solvent (methanol: dichloromethane = 1:2) by vortexing at 8000 rpm for 5 min, followed by the addition of 640 μL of diluent (acetonitrile: isopropanol: water = 65:30:5, containing 5 mM ammonium acetate). For negative ion mode analysis, the residue was reconstituted in 40 μL of reconstitution solvent, followed by the addition of 120 μL of diluent. The reconstituted samples were centrifuged at 20,000× g for 15 min at 10 °C, and 80 µL of the supernatant was collected for instrumental analysis. A QC sample was prepared by combining 10 µL of each processed sample solution.
2.8.2. Chromatographic and Mass Spectrometric Conditions
The BEH C8 reversed-phase column (2.1 × 100 mm, 1.7 µm, Waters, USA) was used for chromatographic separation. The mobile phase consisted of Solvent A (60% acetonitrile: 40% water containing 10 mM ammonium acetate) and Solvent B (90% isopropanol:10% acetonitrile, containing 10 mM ammonium acetate). The gradient elution program was as follows: 0–1.5 min, 50% B; 1.5–9 min, 50–85% B; 9–13 min, 85% B; 13–13.1 min, 83–50% B; 13.1–17.4 min, 50% B. Flow rate: 0.3 mL·min−1, column temperature: 60 °C; autosampler temperature: 10 °C; and injection volume: 1 μL.
ESI was used as the ionization source in both positive and negative ion modes under MRM. The curtain gas (N2) pressure was set to 35 psi, and the collision gas (N2) pressure was maintained at 9 psi. For positive ion mode, the spray voltage was +5500 V, the nebulizer temperature was 550 °C, and both the ion source gas (Gas1, N2) and auxiliary gas (Gas2, N2) were set to 50 psi. For negative ion mode, the spray voltage was −4500 V, the nebulizer temperature was 550 °C, and both Gas1 and Gas2 were set to 40 psi. A comprehensive targeted lipidomics analysis was performed, encompassing over 1100 lipids across 13 categories, including free fatty acids (FA), ceramides (Cer), hexosylceramides (HexCer), dihexosylceramides (Hex2Cer), diacylglycerols (DG), sphingomyelins (SM), phosphatidylcholines (PC), alkyl and alkenyl substituted PCs (PC-O), phosphatidylethanolamines (PE), alkyl and alkenyl substituted PEs (PE-O), triacylglycerols (TG), cholesteryl esters (CE), and phosphatidylinositols (PI). The list of relevant ion pairs is provided in Supplementary Table S5.
2.9. Quantitative Analysis of Neurotransmitters
2.9.1. Processing and Preparation of Samples
Neurotransmitter analysis followed previously established laboratory methods [21]. The sample preparation procedure was as follows: 50 µL of the sample was mixed with 150 µL of acetonitrile. The mixtures were vortexed at 8000 rpm for 5 min and then centrifuged at 20,000× g for 10 min at 4 °C. Subsequently, 10 µL of the supernatant was transferred and mixed with 10 µL of 100 mM sodium borate and 10 µL of 1% benzoyl chloride, vortexed at 8000 rpm for 5 min, and incubated at 25 °C for 5 min. The solution was subsequently centrifuged at 20,000× g for 10 min at 4 °C. Finally, 24 µL of the resulting supernatant was mixed with 6 µL of an internal standard solution (a mixture of deuterated neurotransmitters reacted with d5-benzoyl chloride) and vortexed at 8000 rpm for 5 min before instrumental analysis.
2.9.2. Chromatographic and Mass Spectrometric Conditions
The PFP C18 column (2.1 × 50 mm, 1.8 μm; Waters, USA) was used for chromatographic separation. The mobile phase consisted of Solvent A (95% water: 5% acetonitrile, with 5 mM of ammonium formate and 0.01% formic acid) and Solvent B (95% acetonitrile: 5% water, containing 5 mM of ammonium formate and 0.01% formic acid) The gradient system comprised water with 5 mM ammonium formate and 0.1% formic acid in mobile phase A, and acetonitrile in mobile phase B. The gradient elution program was as follows: 0–1.0 min, 20% B; 1.0–2.0 min, 20–50% B; 2.0–6.0 min, 50–70% B; 6.0–6.5 min, 70–95% B; 6.5–8.0 min, 95% B; 8.0–8.1 min, 95–20% B; 8.1–10.0 min, 20% B. Flow rate: 0.3 mL·min−1; column temperature: 35 °C; autosampler temperature: 4 °C; and injection volume of 2 μL.
ESI was used as the ionization source in positive ion mode under MRM. The curtain gas (N2) pressure was set to 35 psi, and the collision gas (N2) pressure was maintained at 9 psi. The spray voltage was set to +5500 V, with a nebulizer temperature of 550 °C. Both the ion source gas (Gas1, N2) and the auxiliary gas (Gas2, N2) were maintained at 55 psi. Quantitative analysis was conducted on 44 metabolites involved in critical NT pathways, including the tryptophan-serotonin/kynurenine/indole pathway, the phenylalanine-tyrosine-dopamine/norepinephrine pathway, the glutamine-glutamate-GABA pathway, and choline-acetylcholine metabolism. The list of relevant metabolites and internal standard ion pairs is in Supplementary Table S6.
2.10. Targeted Bile Acid Profiling
2.10.1. Processing and Preparation of Samples
Bile acid profiling was performed based on the previously established method from the research team [23]. The sample preparation procedure was as follows: 100 µL of the sample was mixed with 400 µL of pre-cooled methanol and vortexed at 8000 rpm for 5 min. The mixture was vortexed at 8000 rpm for 5 min and then centrifuged at 20,000× g for 10 min at 4 °C. Subsequently, 180 µL of the supernatant was mixed with 20 µL of an internal standard solution (CA-D4 and TCA-D4, 10 µg·mL−1) and vortexed at 8000 rpm for 5 min before instrumental analysis.
2.10.2. Chromatographic and Mass Spectrometric Conditions
The BEH C18 column (2.1 × 100 mm, 2.5 μm; Waters, USA) was used for chromatographic separation. The gradient system comprised water with 0.1% formic acid in mobile phase A, and acetonitrile with 0.1% formic acid in mobile phase B. The gradient elution program was as follows: 0–1.0 min, 20–25% B; 1.0–5.0 min, 25% B; 5.0–7.0 min, 25–30% B; 7.0–8.0 min, 30% B; 8.0–11.0 min, 30–40% B; 11.0–13.0 min, 40% B; 13.0–19.0 min, 40–70% B; 19.0–20.0 min, 70–95% B; 20.0–22.5 min, 95% B; 22.50–22.51 min, 95–20% B; 22.51–25 min, 20% B. Flow rate: 0.3 mL·min−1; column temperature: 50 °C; autosampler temperature: 4 °C; and injection volume of 5 μL.
ESI was used as the ionization source in negative ionization mode under MRM. The curtain gas (N2) pressure was set to 35 psi, and the collision gas (N2) pressure was maintained at 9 psi. The spray voltage was set at −4500 V, the nebulizer temperature was 550 °C, and both the ion source gas (Gas1, N2) and auxiliary gas (Gas2, N2) were set to 50 psi. A total of 46 free and conjugated bile acids in serum were profiled, with 27 being quantitatively analyzed. The corresponding MRM transitions are listed in Supplementary Table S7.
2.11. Data Analysis
All LC-MS data were meticulously preprocessed using MultiQuant 3.0.3 software, which included chromatographic peak identification and peak area integration. Multivariate statistical analysis was performed using SIMCA 14.1 software (Umetrics AB, Umeå, Sweden), the Metware Cloud platform (Metware Biotechnology Co., Ltd., Wuhan, China; https://cloud.metware.cn, accessed on 2 May 2026), and MetaboAnalyst 6.0 (McGill University, Montreal, QC, Canada; https://www.metaboanalyst.ca, accessed on 3 May 2026). Principal component analysis (PCA) was conducted to observe the overall separation trend among the sample groups. Orthogonal partial least squares discriminant analysis (OPLS-DA) was used to identify differential metabolites with significant contributions to classification, based on variable importance in projection (VIP) values, fold change (FC) values, and p-values. Differential compounds were identified using databases such as HMDB, LIPID MAPS, and KEGG, supplemented by relevant literature. Metabolic pathway enrichment analysis was conducted on the final set of identified differential compounds. Sensitivity analyses were conducted using four linear regression models: M0 (unadjusted), M1 (adjusted for age), M2 (adjusted for age and sex), and M3 (adjusted for age, sex, and BMI), with Benjamini–Hochberg FDR correction applied across all eligible metabolites and lipids. ROC analysis was performed using 10 repetitions of stratified five-fold cross-validation. Metabolite and lipid candidates were ranked by selection frequency, and held-out ROC curves from the test folds were aggregated. Fixed-member panels were evaluated using ridge logistic regression, with regularization parameters selected by inner stratified three-fold cross-validation. Mean out-of-fold (OOF) ROC curves were generated from the average OOF predictions for each participant, and 95% confidence intervals (CIs) were estimated using 500 stratified subject-level bootstrap resamples.
Statistical analyses were performed using SPSS 20.0 and GraphPad Prism 8.0. All data are presented as the mean ± standard error of the mean (SEM). Comparisons between two groups conforming to normal distribution and homogeneity of variance were analyzed using an independent samples t-test; otherwise, the Mann–Whitney U test was applied. For comparisons among multiple groups that met the assumptions of normality and homogeneity of variance, one-way ANOVA was employed; otherwise, non-parametric tests were used. All statistical analyses were two-sided, and a p-value < 0.05 was considered statistically significant.
3. Results
3.1. GEO Transcriptomic and Machine Learning Analyses
After integration of four GEO datasets, 597 samples were retained, including 238 controls and 359 insomnia/SD samples. The batch-corrected expression matrix comprised 7135 genes. Differential expression analysis identified 1932 DEGs, including 1225 upregulated and 707 downregulated genes (Figure 1A). WGCNA was subsequently performed using these 1932 DEGs across the 597 samples. A soft-thresholding power of 4 was selected, and five co-expression modules were identified, with unassigned genes grouped into the grey module (Figure 1B,C). Among these, the yellow module exhibited the strongest association with the insomnia/SD phenotype (r = 0.41, p < 0.001) and contained 178 DEGs, suggesting its potential relevance to insomnia/SD associated molecular alterations.
Figure 1.
Screening of differentially expressed genes associated with insomnia based on GEO database and machine learning. (A) Volcano plot of DEGs; (B) Heatmap of WGCNA module-trait correlations; (C) WGCNA clustering dendrogram. The heatmap colors represent the topological overlap between genes, with darker red indicating higher topological overlap and lighter colors indicating lower overlap. The colored bars along the top and left sides indicate different gene co-expression modules; (D) KEGG enrichment of DEGs; (E) GO enrichment of DEGs; (F) ROC analysis of LASSO, SVM-RFE, and random forest models; (G) Venn diagram of overlapping genes; (H) ROC analysis of the intersecting gene panel.
KEGG enrichment analysis indicated that the 178 genes were mainly involved in riboflavin metabolism, porphyrin metabolism, nucleotide metabolism, glycine/serine/threonine metabolism, biosynthesis of cofactors, sulfur metabolism, arachidonic acid metabolism, thiamine metabolism, purine metabolism, glycerophospholipid metabolism, ether lipid metabolism, oxidative phosphorylation, cysteine and methionine metabolism, glutathione metabolism, and glycolysis/gluconeogenesis (Figure 1D,E). These pathways point to abnormalities in energy metabolism, oxidative stress, lipid remodelling, and amino acid metabolism.
Based on the 178 DEGs, three machine learning methods, including LASSO, SVM-RFE, and RF, were applied for feature selection. The results showed that LASSO, SVM-RFE, and RF selected 48, 60, and 30 feature genes, respectively. ROC analysis showed that the LASSO model exhibited the highest AUC (0.993), followed by RF (0.970) and SVM-RFE (0.964) (Figure 1F). Further intersection analysis identified 11 candidate genes selected by all three methods, including GPR146, CA1, OR2W3, CHID1, CHPT1, TREML1, GP6, LINC00268, BMP2K, IL5RA, and PRSS33 (Figure 1G). A combined diagnostic model constructed using these 11 genes achieved an AUC of 0.854 (95% CI: 0.798–0.910) (Figure 1H), suggesting potential discriminatory value for distinguishing insomnia/SD samples from controls.
3.2. General Information
This study initially recruited 74 participants, of whom 58 were eligible for final analysis. The cohort included 22 healthy controls without insomnia (7 males, 15 females), 28 patients diagnosed with Shi syndrome (8 males, 20 females), and 8 patients diagnosed with Xu syndrome (4 males, 4 females). The mean ages of both the Shi and Xu groups were higher than that of the Control group, and the age difference between the Xu and Control groups reached statistical significance. This suggests that age may be a potential contributing factor to the development of chronic insomnia. Although there was an age difference, it was treated as a covariate for consideration in the subsequent analysis (Table 1).
Table 1.
Demographic and anthropometric characteristics of healthy controls and chronic insomnia patients with Shi and Xu syndromes.
3.3. Sleep Scale Scores and PSG Parameters
The results of this study indicate that the PSQI scores were significantly higher in both the Shi and Xu groups than in the Control group (p < 0.001), with a significantly higher score in the Xu group than in the Shi group (p < 0.001). Both insomnia groups had ISI scores consistent with moderate insomnia. PSG analysis showed lower mean TST and SE values in both insomnia groups than in the Control group. The Xu group exhibited significantly higher WASO and W values than the Shi group (p < 0.05), while the Shi group showed a significantly lower N2 percentage than the Control group (p < 0.05). These findings suggest differences in sleep duration, sleep maintenance, and sleep-stage distribution among the groups (Table 2).
Table 2.
Sleep scales and PSG parameters in chronic insomnia patients with different TCM syndromes.
3.4. Serum Metabolomic Analysis
This study employed a broad-targeted metabolomics strategy and detected 596 metabolites across positive and negative ionization modes, generating a peak matrix of 58 samples × 596 variables. Following data preprocessing, features with a coefficient of variation (CV) < 0.5 in QC samples were retained, resulting in a final dataset of 58 samples × 379 metabolites for multivariate statistical analysis (Supplementary Table S8). QC overlay plots demonstrated excellent analytical stability (Supplementary Figure S1A,B), and PCA revealed tight clustering of QC samples (Supplementary Figure S2A), confirming robust system performance and ensuring data suitability for metabolomics interpretation. OPLS-DA models were constructed to compare the Shi vs. Control, Xu vs. Control, and Xu vs. Shi groups. For the Shi vs. Control groups, the R2Y and Q2 values were 0.970 and 0.88; for the Xu vs. Control groups, the R2Y and Q2 values were 0.967 and 0.87; and for the Xu vs. Shi groups, the R2Y and Q2 values were 0.92 and 0.594, respectively. All models passed 200-permutation validation (Supplementary Figure S3), indicating minimal overfitting and supporting the reliability of the observed metabolic distinctions.
Differential metabolites were selected using VIP > 1, adjusted p-value < 0.05, and FC ≥ 2 or ≤0.5. Compared with Controls, the Shi and Xu groups exhibited 53 (20 upregulated and 33 downregulated) and 49 (22 upregulated and 27 downregulated) differential metabolites, respectively. 18 (15 upregulated and 3 downregulated) differential metabolites were identified between the Xu and Shi groups. Heat maps and volcano plots (Figure 2) and Supplementary Table S9 provide detailed metabolite distributions. To evaluate the robustness of the metabolomic findings, sensitivity analyses were performed using sequential linear regression models (M0–M3). After adjustment for age, sex, and BMI (M3), 51, 49, and 18 of the originally identified differential metabolites remained nominally significant (p < 0.05) in the Shi vs. Control, Xu vs. Control, and Xu vs. Shi comparisons, respectively. Notably, THDCA and TUDCA were no longer nominally significant in the Shi vs. Control comparison after full adjustment. Overall, most metabolite associations retained nominal statistical significance after adjustment for demographic covariates (Supplementary Table S10). Both the Shi and Xu groups showed substantial upregulation of amino acids, amino-acid derivatives, and acetylated/methylated amino acids. Notably elevated metabolites included serine, 5-hydroxytryptophan, cysteine, taurine, N6,N6,N6-trimethyl-L-lysine, N,N-dimethyl-arginine, N-acetylleucine, N-acetylserine, N-acetylphenylalanine, and O-acetylserine. These alterations were more pronounced in the Xu group, who also showed marked elevation of 4-acetamidobutyric acid, N-acetylasparagine, N-acetylmethionine, N-acetylglutamic acid, β-alanine, glycerophosphocholine, galactose-1-phosphate, and pantothenate. Conversely, the Shi group displayed stronger elevations in conjugated bile acids such as taurochenodeoxycholic acid and tauroursodeoxycholic acid. Downregulated metabolites in both the Shi and Xu groups included multiple carbohydrate metabolism intermediates and nucleotide derivatives. More pronounced decreases in glucuronic acid, 2-phosphoglyceric acid, uridylic acid, and adenosine 3′,5′-diphosphate were observed in the Xu group, whereas guanine, urate, homogentisate, and several nucleotide-related metabolites were more significantly reduced in the Shi group. Medium and long-chain fatty acids also showed subtype-specific reductions, such as oleate, nonanoate, and sebacate were lower in Xu syndrome, while suberate and azelate displayed more substantial decreases in the Shi group. Additional metabolites such as lactate, glycodeoxycholic acid, adenine, histamine, normetanephrine, arachidate, biliverdin, benzoate, and kyotorphin were extensively downregulated in the Xu group. In contrast, energy-associated metabolites including adenine, succinate semialdehyde, fructose-6-phosphate, β-glycerophosphate, phosphocreatine, and N-acetylneuraminate, were more suppressed in the Shi group. These findings indicate notable differences between the Shi and Xu groups across various levels, including amino acids and their modifications, oxidation products of medium- and long-chain fatty acids, intermediates in carbohydrate metabolism, and bile acid metabolism.
Figure 2.
Heatmap and volcano plot of differential serum metabolites in chronic insomnia patients with different TCM syndromes. (A) Heatmap of differentially expressed metabolites across all groups; (B) Volcano plot of differential metabolites in the Shi vs. Control groups; (C) Volcano plot of differential metabolites in the Xu vs. Control groups; (D) Volcano plot of differential metabolites in the Xu vs. Shi groups.
To further analyze the metabolomics data, differentially expressed metabolites were subjected to KEGG functional enrichment analysis to identify their potential functional significance (Figure 3). The differentially expressed metabolites in both insomnia syndromes were enriched in 12 metabolic pathways, with the five most significant being pantothenate and CoA biosynthesis, ether lipid metabolism, cysteine and methionine metabolism, amino sugar and nucleotide sugar metabolism, and nucleotide sugar biosynthesis. These pathways represent the common metabolic dysregulation underlying insomnia. However, distinct metabolic profiles were observed between the all groups. The Shi group exhibited specific enrichment in pathways related to pentose and glucuronic acid interconversion, the folate one-carbon pool, carbon metabolism, fructose and mannose metabolism, glycerophospholipid metabolism, glycerolipid metabolism, and histidine metabolism. In contrast, the Xu group showed specific enrichment in pathways associated with propionate metabolism, lysine degradation, unsaturated fatty acid biosynthesis, cytochrome P450-mediated xenobiotic metabolism, fatty acid biosynthesis, pyruvate metabolism, and D-amino acid metabolism.
Figure 3.
Pathway enrichment analysis of serum differential metabolites in chronic insomnia patients with different TCM syndromes. (A) Bar chart of metabolic pathway enrichment in the Shi vs. Control groups; (B) Bar chart of metabolic pathway enrichment in the Xu vs. Control groups; (C) Bar chart of metabolic pathway enrichment in the Xu vs. Shi groups; (D) Bubble chart of the top 20 enriched metabolic pathways in the Shi vs. Control groups; (E) Bubble chart of the top 20 enriched metabolic pathways in the Xu vs. Control groups; (F) Bubble chart of the top 20 enriched metabolic pathways in the Xu vs. Shi groups.
3.5. Serum Lipidomic Analysis
The lipidomics analysis identified 1136 lipid species across positive and negative ionization modes, generating an initial data matrix of 58 samples × 1136 variables. Following data preprocessing, lipid species with a CV < 0.5 in QC samples were re-tained, resulting in a final dataset of 58 samples × 481 variables for multivariate statis-tical analysis (Supplementary Table S11). Internal standards showed relatively stable peak areas, and PCA revealed clustering of QC samples (Supplementary Figure S2B), supporting the analytical reproducibility of the lipidomics data. OPLS-DA models were constructed to compare the Shi vs. Control, Xu vs. Control, and Xu vs. Shi groups. The R2Y and Q2 values were 0.632 and 0.422 for Shi vs. Control, 0.877 and 0.299 for Xu vs. Control, and 0.558 and 0.221 for Xu vs. Shi, respectively. The results of the 200-permutation tests are presented in Supplementary Figure S4. The relatively low Q2 values suggested limited predictive performance, and the OPLS-DA findings were therefore interpreted as exploratory. Differential lipids were selected using VIP > 1, p < 0.05, and FC ≥ 1.2 or ≤0.83. Compared to Controls, the Shi group displayed 87 differential lipids (82 upregulated and 5 downregulated) and the Xu group 80 (79 upregulated and 1 downregulated). Forty-four differential lipids (22 upregulated and 22 downregulated) distinguished Xu from Shi syndrome patients. The major differential lipids are presented in the heatmap and volcano plot (Figure 4), with the detailed list provided in Supplementary Table S12. To evaluate the robustness of the lipidomic findings, sensitivity analyses were performed using sequential linear regression models (M0–M3). After adjustment for age, sex, and BMI (M3), 65, 11, and 28 lipid species showed nominal significance (p < 0.05) in the Shi vs. Control, Xu vs. Control, and Xu vs. Shi comparisons, respectively. Following Benjamini–Hochberg FDR correction, 11 lipids met the significance threshold (FDR < 0.05) in the Shi vs. Control comparison, whereas none did so in the other two comparisons. Notably, the Xu vs. Control comparison showed a marked reduction in nominally significant associations after covariate adjustment. These findings highlight the varying sensitivity of lipidomic associations to demographic covariates, particularly in comparisons involving the small Xu subgroup (Supplementary Table S13). In both Shi and Xu groups, major shared features included pronounced increases in phospholipids (PC, PE, PI), including species such as PC 16:0_20:4, PC 18:0_20:4, PC 18:1_20:4, PE 18:0_20:4, and PI 38:4. Shi group exhibited broader elevations in free fatty acids (FA 17:0, FA 18:0, FA 19:0, FA 19:1) and ether-linked phospholipids (PC-O 16:0_18:1, PC-O 18:1_16:0, PC-O 18:1_20:4), along with decreased levels of specific lysophospholipids (LPC 15:0, LPC 18:3, LPC-O 16:0). These patterns indicate phospholipid remodeling and fatty-acid accumulation. In comparison to the Shi group, the Xu group showed greater upregulation of long-chain unsaturated triglycerides (TG 16:0_38:6, TG 20:4_32:0, TG 22:6_34:2), sphingolipids (SM 40:3, SM 40:6, SM 42:6), and free fatty acids (FA 15:1, FA 18:4, FA 20:5), consistent with enhanced lipid storage and altered energy metabolism.
Figure 4.
Heatmap and volcano plot of serum differential lipids in chronic insomnia patients with different TCM syndromes. (A) Heatmap of differential expression patterns across all groups; (B) Volcano plot of differential lipids in the Shi vs. Control groups; (C) Volcano plot of differential lipids in the Xu vs. Control groups; (D) Volcano plot of differential lipids in the Xu vs. Shi groups.
To further characterize the lipidomic alterations, differential lipids identified from the three pairwise comparisons were subjected to KEGG pathway annotation and enrichment analysis (Figure 5). Several lipid related metabolic pathways were identified across all three comparisons, including alpha-linolenic acid metabolism, linoleic acid metabolism, arachidonic acid metabolism, biosynthesis of unsaturated fatty acids, and glycerophospholipid metabolism. However, differences in pathway representation were also observed among the comparisons. Fatty acid biosynthesis was additionally identified in both the Shi vs. Control and Shi vs. Xu comparisons but was absent from the Xu vs. Control comparison. In contrast, steroid hormone biosynthesis was identified exclusively in the Shi vs. Control comparison. Collectively, these results revealed shared lipid-related metabolic pathway annotations across the three comparisons, together with distinct patterns of pathway representation associated with the Shi and Xu insomnia syndromes.
Figure 5.
Pathway enrichment analysis of serum differential lipids in chronic insomnia patients with different TCM syndromes. (A) Bar chart of lipid metabolic pathway enrichment in the Shi vs. Control groups; (B) Bar chart of lipid metabolic pathway enrichment in the Xu vs. Control groups; (C) Bar chart of lipid metabolic pathway enrichment in the Xu vs. Shi groups; (D) Bubble chart of lipid metabolic pathway enrichment in the Shi vs. Control groups; (E) Bubble chart of lipid metabolic pathway enrichment in the Xu vs. Control groups; (F) Bubble chart of lipid metabolic pathway enrichment in the Xu vs. Shi groups.
3.6. Quantitative Analysis of Serum Neurotransmitters
Targeted quantification of 44 neurotransmitters and their derivatives (Figure 6) revealed significant alterations across multiple neurochemical pathways. In the Shi group, melatonin, kynurenine, glutamine, and histidine were elevated, whereas 5-hydroxytryptophol, tryptophanamide, norepinephrine, 3-methoxytyramine, N-acetylserotonin, tryptamine, kynurenic acid, quinolinic acid, xanthurenic acid, 4-aminobenzoic acid, choline, GABA, and histamine were decreased. These perturbations involve tryptophan–melatonin/indole metabolism, catecholamine metabolism, glutamine–glutamate cycling, choline–acetylcholine metabolism, and histidine–histamine pathways. The Xu group showed increases in melatonin, glutamine, glutamate, glycine, asparagine, aspartate, kynurenine, histidine, and phenylalanine, accompanied by reduced norepinephrine and tryptamine. These changes reflect disruptions in pathways including tryptophan–melatonin/kynurenine metabolism, phenylalanine–norepinephrine metabolism, glutamine–glutamate cycling, asparagine–aspartate metabolism, and glycine–histidine metabolism. Compared with the Shi group, Xu group was characterized by higher levels of glutamine, glutamate, asparagine, aspartate, tryptophan, and phenylalanine, and by significantly lower histamine levels. Although choline and GABA were higher in Xu than in Shi group, both remained below the Control group. These findings collectively demonstrate widespread neurotransmitter dysregulation in chronic insomnia.
Figure 6.
Quantitative analysis of neurotransmitters in serum. Compared to the Control group, # p < 0.05, ## p < 0.01, ### p < 0.001. Compared to the Shi group, * p < 0.05. Error bars represent the SEM.
3.7. Quantitative Analysis of Serum Bile Acids
Serum bile acid profiles were analyzed to characterize differences among the Control, Shi, and Xu groups. Glycochenodeoxycholic acid (GCDCA, 23.14–29.20%), chenodeoxycholic acid (CDCA, 22.20–27.58%), glycocholic acid (GCA, 3.88–13.18%), and cholic acid (CA, 6.81–12.39%) accounted for substantial proportions of the bile acid profiles across the three groups (Figure 7A–C). Quantitative analysis of 27 bile acids revealed lower total bile acid concentrations in both the Shi and Xu groups than in the Control group, with a more pronounced reduction in the Xu group (Figure 7D,E). Bile acids were further classified as unconjugated, glycine-conjugated, or taurine-conjugated. Both the Shi and Xu groups showed lower total concentrations of glycine-conjugated bile acids than the Control group. In contrast, the Shi group showed higher total concentrations of unconjugated and taurine-conjugated bile acids, whereas both categories were lower in the Xu group (Figure 7E). Analysis of individual bile acids revealed distinct patterns among the groups (Figure 7F). Compared with the Control group, the Shi group showed a lower concentration of LCA and a higher concentration of UDCA. The Xu group showed lower concentrations of UCA and DHCA. In addition, TCDCA, TDCA, and THDCA showed higher mean concentrations in the Shi group than in the Control and Xu groups. GHDCA also showed a higher concentration in the Shi group than in the other groups. Together, these findings indicate differences in serum bile acid profiles among the groups, particularly in the distributions of unconjugated and conjugated bile acid species.
Figure 7.
Quantitative analysis of bile acid compounds in serum. (A–C) Proportional distribution of various bile acids among the Control, Shi, and Xu groups; (D) Serum concentrations of different bile acids; (E) Serum concentrations of unconjugated, tauro-conjugated, and glycine-conjugated bile acids; (F) Bile acids showing significant differences across all groups. Compared to the Control group, # p < 0.05, ## p < 0.01. Compared to the Shi group, * p < 0.05.
3.8. Construction of the Regulatory Network for Key Metabolic Pathways
To compare public transcriptomic findings with clinical serum multi-omics results, we assessed pathway overlap using standardized KEGG pathway identifiers. We examined pathways shared across the transcriptomic, metabolomic, and lipidomic datasets, as well as those shared between the transcriptomic dataset and the combined metabolomic and lipidomic datasets (Supplementary Figure S5 and Supplementary Table S14). These comparisons revealed pathway-level overlap across independently generated datasets. However, direct molecular correspondence could not be established because the datasets were derived from different participants and biological materials.
The integrated pathway analysis indicated that chronic insomnia was associated with alterations in amino acid, purine, carbohydrate, fatty acid, triglyceride, phospholipid, lysophospholipid, phosphatidylcholine, and sphingomyelin metabolism (Figure 8). To further explore relationships across omics layers, we mapped machine learning-selected genes, differential metabolites, and differential lipids to related metabolic pathways (Figure 9). The resulting network highlighted CA1 and CHPT1 as candidate nodes and implicated glycerophospholipid and ether lipid metabolism. Given the different participant populations represented in the transcriptomic and clinical serum datasets, these findings reflect pathway-level associations and literature-informed hypotheses rather than direct molecular interactions demonstrated in the same individuals.
Figure 8.
Serum differential metabolites and lipid regulatory network in chronic insomnia patients with different TCM syndromes.
Figure 9.
Gene–metabolite–lipid interaction networks and pathway-associated molecular relationships. (A) Glutamate/glycine, serine and threonine metabolism-associated network. (B) Glycerophospholipid metabolism-associated network. (C) Purine metabolism-associated network. (D) Tryptophan/histidine metabolism-associated network. (E) Glycerophospholipid and ether lipid metabolism-associated network. (F) Integrated network illustrating the associations among machine learning-selected genes, differential metabolites, differential lipids, and related metabolic pathways.
3.9. Correlations of Differential Metabolites and Differential Lipids with Sleep Phenotypes and Associations Between Lipid Structural Characteristics and Disease Risk
This study systematically examined the associations of differentially metabolites and lipids with sleep phenotypes, including PSQI and ISI scores and multiple sleep parameters (Figure 10). Among metabolites involved in amino acid metabolism, both PSQI and ISI were positively correlated with cysteine, N-acetylphenylalanine, taurine, N-acetylserine, O-acetylserine, N6,N6-trimethyl-L-lysine, N-acetylmethionine, β-alanine, N,N-dimethylarginine, N-acetylglutamate, cis-4-hydroxy-D-proline, homoserine, 5-hydroxytryptophan, and pantothenic acid. In contrast, they were negatively correlated with azelaic acid, suberic acid, homogentisic acid, glycerol 3-phosphate, and adenosine 3′,5′-diphosphate. These findings suggest that disturbances in amino acid and energy metabolism may be broadly involved in the deterioration of sleep quality. Among PSG parameters, WASO was positively correlated with N6,N6-trimethyl-L-lysine, O-acetylserine, β-alanine, and N,N-dimethylarginine, whereas TST and SE were negatively correlated with β-alanine. SOL was positively correlated with cysteine. AHI was positively correlated with pantothenic acid and 5-hydroxytryptophan, and N1% was also positively correlated with pantothenic acid. These results suggest that pantothenic acid and tryptophan metabolism may be closely related to sleep architecture and respiratory events. In addition, R% was negatively correlated with multiple amino acid metabolites but positively correlated with energy metabolism related intermediates, including succinic acid, azelaic acid, suberic acid, and homogentisic acid. This further supports a close link between sleep architecture and the remodeling of amino acid and energy metabolism.
Figure 10.
Associations of metabolomic and lipidomic profiles with subjective and objective sleep phenotypes and analysis of lipid structural characteristics related to disease risk. (A) Correlation analysis of differentially abundant metabolites with PSQI and ISI scores and PSG derived sleep parameters. (B) Correlation analysis of differentially abundant lipids with PSQI and ISI scores and PSG derived sleep parameters. (C–E) Structural risk scatter plot analysis of PC-O, PE, and TG lipids in patients with insomnia and control participants based on ln(OR), carbon number, and double bond number. In the structural risk scatter plots, the x and y axes represent lipid structural characteristics, while the z axis represents the log transformed odds ratio ln(OR). Blue dots represent individual lipid molecules, and the semi transparent surface represents the fitted trend across lipid structural dimensions. “+” and “−” indicate positive and negative correlations, respectively, between lipid structural characteristics and ln(OR). Statistical significance is indicated as follows: * p < 0.05, ** p < 0.01, and *** p < 0.001.
In the lipidomics analysis, PSQI and ISI were positively correlated with several phospholipids and triglycerides, including PC 16:1_18:1, PC-O 36:1, PC-O 40:4, PC 16:0_16:1, TG 16:0_34:0, and PE 40:7. They were negatively correlated with LCA. These findings indicate that lipid metabolic disturbances are closely associated with poor sleep quality. Among PSG parameters, WASO was positively correlated with TG 16:0_34:0, TG 16:0_38:6, and TG 16:0_40:7, whereas TST and SE were negatively correlated with TG 16:0_34:0 and TG 16:0_40:7. This suggests that increased triglyceride levels may impair sleep maintenance. SOL was positively correlated with UDCA, DHCA, LPC 22:6, and LPC 20:4. AHI was positively correlated with several TGs, PEs, and bile acids, including TCDCA and TDCA, suggesting that abnormalities in lipid and bile acid metabolism may contribute to increased respiratory events. With respect to sleep architecture, N1% was positively correlated with several TGs and PEs, such as TG 16:0_38:6, TG 16:0_40:7, TG 38:5, and PE 40:4. N3% was negatively correlated with TG 16:0_40:7. R% was negatively correlated with PC 16:1_18:1 but positively correlated with LCA. Together, these results suggest that lipid metabolic imbalance, particularly abnormalities involving phospholipids, triglycerides, and bile acids, may play an important role in disrupted sleep architecture and respiratory dysfunction.
To further clarify the relationship between lipid molecular structure and insomnia risk, OR values obtained from comparisons between the insomnia and control groups were transformed using the natural logarithm. The resulting ln(OR) values were used to represent the direction and strength of the association between each lipid molecule and insomnia status. The relationships among lipid carbon number, double bond number, and ln(OR) were then analyzed. Different lipid classes showed distinct patterns related to molecular structure, suggesting that lipid chain length and degree of unsaturation may influence their associations with insomnia phenotypes. Among PC-O lipids, the number of double bonds was negatively correlated with ln(OR). In other words, as the degree of unsaturation increased, the positive association between PC-O molecules and insomnia risk became weaker, and some highly unsaturated PC-O molecules showed lower risk associations. PE lipids showed a different pattern. Their double bond number was positively correlated with ln(OR), whereas carbon number was negatively correlated with ln(OR). This indicates that the association between PE molecules and insomnia may be influenced by both fatty acid chain length and degree of unsaturation. Specifically, highly unsaturated PEs tended to be positively associated with insomnia status, whereas PEs with longer carbon chains showed relatively weaker risk associations. TG lipids showed similar structure dependent changes. These findings suggest that insomnia related lipid abnormalities may have a degree of structural selectivity, rather than simply reflecting changes in individual lipid molecules.
3.10. ROC Curve Analysis
ROC analyses were performed to assess the discriminatory potential of serum molecular features for chronic insomnia identification (Insomnia vs. Control; 36 vs. 22) and TCM syndrome differentiation (Xu vs. Shi; 8 vs. 28) (Figure 11). For metabolomics and lipidomics, the five candidates with the highest selection frequencies during repeated cross-validation were evaluated using held-out ROC curves. Held-out AUCs for metabolites ranged from 0.946 to 0.973 for Insomnia vs. Control and from 0.948 to 1.000 for Xu vs. Shi (Figure 11A), whereas those for lipids ranged from 0.785 to 0.895 and from 0.739 to 0.898, respectively (Figure 11B).
Figure 11.
ROC curve analysis of serum molecular features for insomnia identification and TCM syndrome differentiation. (A) ROC curves for the five metabolites with the highest selection frequencies during repeated cross validation. (B) ROC curves for the five lipids with the highest selection frequencies during repeated cross validation. (C) Mean OOF ROC curves for N-acetylserine, N-acetylphenylalanine, N-acetylleucine, and their combined Ridge logistic regression model. (D) Mean OOF ROC curves for the TrpA + Mel and Trn + XA neurotransmitter panels in Insomnia vs. Control, and the KA + QA panel and Mel alone in Xu vs. Shi. (E) Mean OOF ROC curves for the five-bile-acid panel comprising UDCA, LCA, TCA, TCDCA, and GHDCA.
For acetylation-related metabolites, the Ridge logistic regression model combining N-acetylserine, N-acetylphenylalanine, and N-acetylleucine yielded mean OOF AUCs of 0.924 (95% CI, 0.835–0.991) for Insomnia vs. Control and 0.848 (95% CI, 0.594–1.000) for Xu vs. Shi (Figure 11C). N-acetylphenylalanine alone yielded mean OOF AUCs of 0.929 (95% CI, 0.857–0.979) and 0.911 (95% CI, 0.781–0.991), respectively. For neurotransmitter-related metabolites, the TrpA + Mel and Trn + XA panels achieved mean OOF AUCs of 0.937 (95% CI, 0.867–0.984) and 0.837 (95% CI, 0.715–0.944), respectively, for Insomnia vs. Control. In Xu vs. Shi, the KA + QA panel and Mel alone yielded mean OOF AUCs of 0.688 (95% CI, 0.435–0.879) and 0.549 (95% CI, 0.306–0.777), respectively (Figure 11D). The five-bile-acid panel comprising UDCA, LCA, TCA, TCDCA, and GHDCA yielded mean OOF AUCs of 0.672 (95% CI, 0.537–0.812) and 0.607 (95% CI, 0.402–0.828) for the two comparisons, respectively (Figure 11E). Overall, the evaluated models showed varying discriminatory performance, with generally stronger results for Insomnia vs. Control than for Xu vs. Shi. The performance estimates for Xu vs. Shi should be interpreted cautiously given the small sample size (n = 8).
4. Discussion
Using the PMT biomarker discovery framework, this study integrated public transcriptomic data with clinical serum multi-omics profiles to screen for potential metabolic biomarkers in individuals with insomnia. The PMT framework starts with public data integration and centers on metabolomic and lipidomic discovery. It is further supported by targeted bile acid profiling and neurotransmitter analysis. This stepwise strategy moves from public data-based screening to metabolic network enrichment and disturbance assessment and finally to targeted absolute quantification for validation. Based on this framework, we characterized the molecular features of chronic insomnia and its TCM syndrome subtypes, Shi and Xu. The analysis focused on three levels: gene expression, metabolite alterations, and lipid metabolic disturbances. Public transcriptomic analysis combined with machine learning suggested that insomnia associated gene expression changes may involve energy metabolism, oxidative stress, amino acid metabolism, and lipid remodeling. Serum multi-omics analysis further revealed relatively consistent alterations in purine metabolism, glycine, serine and threonine metabolism, cysteine and methionine metabolism, glutathione metabolism, glycerophospholipid metabolism, and ether lipid metabolism. CA1 and CHPT1 emerged as key nodes in the integrated multi-omics network. These genes may be linked to energy metabolism, oxidative stress, and phospholipid remodeling. These findings suggest that chronic insomnia may involve molecular abnormalities across multiple pathways and biological levels, thereby broadening our understanding of its biological heterogeneity and providing a scientific basis for subtype classification and individualized intervention.
4.1. Disruption of Neurotransmitter-Related Metabolic Pathways
Tryptophan metabolism was one of the most significantly disturbed pathways. Tryptophan is a precursor of 5-hydroxytryptamine (5-HT), which can be converted into melatonin, linking tryptophan metabolism to sleep–wake and mood regulation [24,25]. Targeted neurotransmitter profiling showed that melatonin and kynurenine were significantly increased in both the Shi and Xu groups, whereas tryptamine decreased in both groups. In the Shi group, 5-Hydroxytryptophol, N-Acetylserotonin, kynurenic scid, xanthurenic acid, and quinolinic acid were also decreased. Although serum 5-HT and 5-HIAA levels were unchanged, several related metabolites were clearly altered, indicating that tryptophan metabolism in chronic insomnia may not be globally activated or suppressed but redistributed among competing metabolic branches. The positive correlation between 5-hydroxytryptophan and PSQI scores further indicates its potential association with impaired subjective sleep quality. Given the role of melatonin rhythms in sleep–wake regulation and the metabolic competition between the kynurenine pathway and 5-HT synthesis [26,27], the observed changes may reflect altered partitioning of tryptophan metabolism. Chu et al. [28] reported alterations in gut microbiota composition, hypothalamic monoamine neurotransmitters, and 5-HT receptor expression in mice with insomnia, suggesting potential associations between gut microbial alterations and neuroendocrine and serotonergic processes. To explore the discriminatory relevance of these metabolic alterations, cross-validated ROC analysis, the TrpA + Mel and Trn + XA panels yielded mean OOF AUCs of 0.937 (95% CI, 0.867–0.984) and 0.837 (95% CI, 0.715–0.944), respectively, for insomnia identification. In contrast, for syndrome differentiation, the KA + QA panel and melatonin alone yielded mean OOF AUCs of 0.688 (95% CI, 0.435–0.879) and 0.549 (95% CI, 0.306–0.777), respectively. These findings suggest that the evaluated panels showed stronger internal discriminatory performance for insomnia identification than for syndrome differentiation.
Purine metabolism may also contribute to sleep pressure regulation. Adenosine, a purine nucleoside and homeostatic sleep-promoting molecule, was enriched in transcriptomic and metabolomic analyses. Decreased cAMP-related signaling in Shi suggested impaired intracellular adenosine transduction. Adenosine coordinates neuronal activity, astrocyte metabolism, and sleep homeostasis [29]. Purine metabolism abnormalities may impair sleep pressure accumulation, particularly in Shi-type insomnia. However, serum metabolites may not directly reflect central adenosine, requiring further validation.
The glutamate–GABA pathway also exhibited prominent abnormalities. Glutamate is the principal excitatory neurotransmitter and precursor to GABA, a major inhibitory neurotransmitter. This pathway maintains excitatory–inhibitory balance and is closely linked to insomnia [30,31]. In this study, both the Shi and Xu groups exhibited disturbances in this pathway, with broader abnormalities observed in the Xu group. Serum levels of taurine, N-acetylglutamate, and homoserine were elevated, suggesting alterations in amino acid metabolism potentially related to excitatory–inhibitory regulation. Taurine can modulate inhibitory neurotransmission through GABAergic and glycinergic receptors [32,33]. However, the relevance of serum N-acetylglutamate has been associated with altered mitochondrial function in the brain [34], while central GABAergic and glutamatergic circuits and amino acid metabolism have been implicated in sleep regulation [35,36]. However, whether serum N-acetylglutamate and homoserine reflect these central processes remains unclear. Both groups also exhibited increased cysteine, particularly the Xu group, accompanied by increased O-acetylserine. Cysteine contributes to glutathione synthesis, and L-cysteine has been reported to modulate GABA_A receptor function [37,38]. The concurrent increase in O-acetylserine may reflect altered sulfur amino acid metabolism, although its functional significance in this cohort remains uncertain [39]. Targeted neurotransmitter analysis showed increased glutamine and decreased GABA in the Shi group. In the Xu group, glutamate and glutamine increased, whereas GABA decreased but remained higher than in the Shi group. Correlation analysis further showed that taurine, N-acetylglutamate, homoserine, beta-alanine, N,N-dimethylarginine, and cysteine were associated with PSQI, ISI, WASO, SOL, TST, and SE. Collectively, these findings suggest that peripheral alterations in amino acid and neurotransmitter-related metabolism are associated with subjective sleep quality and objective sleep parameters. Nevertheless, serum metabolic profiles alone cannot establish central excitatory–inhibitory dysfunction. Phenylalanine–tyrosine–norepinephrine metabolism may also contribute to insomnia-related monoaminergic dysregulation. Phenylalanine can be converted into tyrosine and participate in the synthesis of dopamine and norepinephrine, both of which are involved in sleep–wake regulation [40]. Metabolomics showed increased N-acetylphenylalanine in both insomnia groups, especially in the Xu group. Targeted analysis further showed decreased Norepinephrine in both groups, decreased 3-Methoxytyramine in the Shi group, and increased Phenylalanine in the Xu group. N-acetylphenylalanine was positively correlated with PSQI, ISI, and N1%, and negatively correlated with R%. N-acetylphenylalanine was positively correlated with PSQI, ISI, and N1%, and negatively correlated with R%. In cross-validated ROC analysis, N-acetylphenylalanine alone yielded mean OOF AUCs of 0.929 (95% CI, 0.857–0.979) for insomnia identification and 0.911 (95% CI, 0.781–0.991) for syndrome differentiation. These results suggest that phenylalanine-related metabolic abnormalities may be associated with both subjective and objective sleep impairment, particularly in patients with Xu syndrome.
Histidine metabolism may provide another potential link to hyperarousal. Histidine is the precursor of histamine, a wake-promoting neurotransmitter produced by histaminergic neurons in the ascending arousal system [41,42]. Therefore, the involvement of histidine metabolism suggests that abnormal histidine–histamine metabolism may contribute to the hyperarousal state of chronic insomnia. However, because this inference is based on serum metabolic data, it should be interpreted as hypothesis-generating rather than conclusive evidence of central histaminergic dysfunction.
4.2. Increased Acetylation of Amino Acids and Their Derivatives
Amino acid metabolism was another major area in which transcriptomic and metabolomic results converged. Transcriptomic KEGG analysis showed enrichment in glycine/serine/threonine metabolism, cysteine and methionine metabolism, beta-alanine metabolism, and arginine and proline metabolism. Serum metabolomics identified abnormalities in N-acetylated amino acids, including N-acetylleucine, N-acetylserine, N-acetylphenylalanine, N-acetylasparagine, N-acetylmethionine, and N-acetylglutamate.
Both Shi and Xu groups showed increased N-acetylated amino acids, but the Xu group exhibited a broader pattern. The Shi group was mainly characterized by increased N-acetylleucine, N-acetylserine, and N-acetylphenylalanine, whereas the Xu group additionally showed increased N-acetylasparagine, N-acetylmethionine, and N-acetylglutamate. Several N-acetylated amino acids, such as N-acetylserine, were positively correlated with PSQI and ISI scores and negatively correlated with R%. In cross-validated ROC analysis, the Ridge logistic regression model combining N-acetylserine, N-acetylphenylalanine, and N-acetylleucine yielded mean OOF AUCs of 0.924 (95% CI, 0.835–0.991) for insomnia identification and 0.848 (95% CI, 0.594–1.000) for syndrome differentiation. N-acetylphenylalanine alone yielded corresponding mean OOF AUCs of 0.929 and 0.911, respectively. Thus, the combined model did not outperform N-acetylphenylalanine alone, suggesting that the discriminatory value of these N-acetylated amino acids requires further validation.
N-acetylated amino acids are formed through acetylation of the α-amino group of amino acids and are widely distributed in biological systems. Previous studies have reported antioxidant, anti-inflammatory, metabolic regulatory, and neuroprotective functions of some N-acetyl amino acids and their derivatives. For example, N-acetyl-L-tryptophan can act as an antioxidant stabilizer of human serum albumin and may protect proteins against free radical-induced damage [43,44]. N-acetylcysteine, a precursor of glutathione, has also been investigated for its protective effects against toxin-induced oxidative injury and hepatic prefibrotic changes [45,46]. In addition, changes in N-acetylated metabolite levels have been observed in neuropsychiatric and metabolic disorders, indicating their potential as disease-associated biomarkers and warranting further investigation into their relationship with disease progression [47,48]. Although there is currently no direct evidence proving a causal relationship between the acetylated amino acids identified here and insomnia, their biological relevance suggests that acetylation modification may represent an important metabolic feature of chronic insomnia. N-acetylserine may participate in serine–glycine metabolism and influence glycine synthesis, slow-wave sleep regulation, glutathione synthesis, one-carbon metabolism, and energy homeostasis [49,50]. N-acetylglutamate may indirectly affect the glutamate–GABA axis, while N-acetylphenylalanine may influence tyrosine metabolism and monoamine neurotransmitter synthesis. Therefore, these acetylated amino acids may serve as promising candidate biomarkers for objective diagnosis, subtype classification, and future targeted intervention studies in chronic insomnia.
4.3. Oxidative Stress, Energy Metabolism, Lipid Remodeling, and Bile Acid Imbalance
Oxidative stress, energy metabolic disturbance, and lipid metabolic imbalance were also core alterations supported by multi-omics evidence. Transcriptomic enrichment analysis showed significant involvement of oxidative phosphorylation, glycolysis/gluconeogenesis, cysteine and methionine metabolism, glutathione metabolism, glycerophospholipid metabolism, and ether lipid metabolism. Metabolomics and lipidomics further revealed abnormalities in energy substrates, antioxidant-related amino acids, and lipid subclasses such as PC, PC-O, PE, LPC, and LPC-O. These results indicate that oxidative stress, mitochondrial energy metabolism, and membrane lipid remodeling may be jointly driven by transcriptional dysregulation and serum metabolic alterations.
In the Shi group, pantothenic acid was increased, whereas azelaic acid, suberic acid, and glycerol-3-phosphate were decreased. Pantothenic acid is a precursor of coenzyme A and is essential for fatty acid oxidation and energy metabolism [51,52,53], while reduced glycerol-3-phosphate may affect NADH transport, phospholipid synthesis, and mitochondrial energy production [54,55]. In the Xu group, N6,N6,N6-trimethyl-L-lysine, triglycerides, and fatty acids were generally increased, suggesting enhanced lipid mobilization and abnormal mitochondrial β-oxidation. Excessive fatty acid oxidation may increase mitochondrial oxidative burden, consistent with increased Cysteine and O-acetylserine, especially in the Xu group. Since cysteine and methionine metabolism provides substrates for glutathione synthesis, these changes may reflect compensatory antioxidant responses under chronic oxidative stress.
Lipid metabolism was another important component of the multi-omics network. Glycerophospholipid metabolism and ether lipid metabolism were enriched in transcriptomic analysis and supported by lipidomic abnormalities, indicating that they are shared pathways across omics layers. Abnormal PC, PC-O, PE, LPC, and LPC-O levels may affect cell membrane structure, membrane fluidity, mitochondrial function, and signal transduction [56]. Previous studies have shown that sleep deprivation and sleep restriction can alter circulating lipid species, including phospholipids, diacylglycerols, triglycerides, and cholesterol-related pathways [57]. This study further suggests that lipid metabolic abnormalities may differ between TCM syndrome types.
Bile acid metabolism also showed clear alterations and syndrome-specific differences. In the Shi group, UDCA and GHDCA increased, whereas LCA decreased. In the Xu group, UCA and DHCA decreased, and taurine-conjugated bile acids, including TCA, TCDCA, and THDCA, were lower than in both the Shi and control groups. Correlation analysis showed that LCA was negatively correlated with PSQI scores, THDCA and GHDCA were positively correlated with AHI, and UCA was positively correlated with ISI scores. These associations suggest that bile acid alterations may be related to subjective sleep quality and sleep-related respiratory parameters. Bile acids act as signaling molecules in the gut–liver axis through FXR and GPBAR1/TGR5 [58,59], while gut microbiota contribute to bile acid biotransformation and shape the bile acid pool [60]. However, as gut microbiota composition and microbial bile acid-transforming activity were not assessed in this study, their potential contributions to the observed bile acid alterations remain speculative. In cross-validated ROC analysis, the five-bile-acid panel comprising UDCA, LCA, TCA, TCDCA, and GHDCA yielded mean out-of-fold (OOF) AUCs of 0.672 (95% CI, 0.537–0.812) for insomnia identification and 0.607 (95% CI, 0.402–0.828) for syndrome differentiation. These findings suggest that bile acid profiles may be associated with insomnia related phenotypes, although further studies are required to establish their potential utility in differentiating Shi and Xu syndromes.
Network analysis identified CHPT1 and CA1 as candidate genes potentially linking transcriptomic changes with metabolic and lipid alterations. CHPT1 encodes choline phosphotransferase 1, a key enzyme in phosphatidylcholine biosynthesis [61,62], and may be relevant to the observed changes in membrane lipid metabolism. The concurrent involvement of glycerophospholipid and ether lipid metabolism in transcriptomic and lipidomic analyses further supports its potential relevance to lipid metabolic disturbances. CA1, which contributes to carbon dioxide hydration and bicarbonate buffering, may be related to acid–base homeostasis and metabolic adaptation. Previous studies have associated carbonic anhydrase activity with sleep-disordered breathing and hypoxia [63], providing a possible context for its identification in the network, although the specific role of CA1 in chronic insomnia remains unclear. Neither gene was directly measured in the clinical serum samples; therefore, their proposed roles remain exploratory and require further validation at the protein and functional levels. In addition, integrating chronic insomnia and sleep-deprivation datasets may introduce biological heterogeneity, as these conditions are not equivalent, warranting further validation of the candidate genes in independent clinical cohorts.
Overall, chronic insomnia appears to involve multi-system metabolic dysregulation, including neurotransmitter imbalance, amino acid acetylation, oxidative stress, mitochondrial energy disturbances, lipid remodeling, and bile acid metabolism. The Xu group exhibited broader alterations in amino acid and N-acetylated amino acid profiles, long-chain unsaturated lipids, sphingolipids, and taurine-conjugated bile acids, whereas the Shi group showed distinct changes in cAMP, GABA, and related metabolic pathways, suggesting different peripheral metabolic profiles between the two syndromes. Cross-omics analysis highlighted glycerophospholipid and ether lipid metabolism and identified CHPT1 and CA1 as candidate network genes, although the proposed gene–metabolite–lipid relationships remain unvalidated in the clinical cohort. Sensitivity analyses showed that most metabolite associations retained nominal significance after adjustment for age, sex, and BMI, whereas lipidomic associations were less robust, with 11 lipids remaining significant after FDR correction in the Shi vs. Control comparison and none in comparisons involving the Xu subgroup.
Given the small Xu sample size and cross-sectional design, these findings require cautious interpretation and cannot establish causality or distinguish reversible metabolic changes from indicators of long-term health risks. This study provides an integrated view of the metabolic features associated with chronic insomnia and TCM syndrome differentiation. Future studies should validate these candidate biomarkers in larger, geographically diverse independent cohorts and assess their reproducibility through repeated polysomnography (PSG), longitudinal multi-omics profiling, and validated biological ageing measures. Integrating paired fecal metagenomic and metabolomic analyses with serum multi-omics profiling, alongside pharmacological or genetic interventions, animal models, and cellular functional assays, may help clarify the relationships among metabolic alterations, sleep changes, gut microbiota, and long-term health trajectories, as well as the potential roles of key signaling pathways. These efforts may further establish the clinical relevance of the candidate biomarkers and their potential applications in objective TCM syndrome differentiation.
5. Conclusions
This study systematically characterized the molecular landscape of chronic insomnia and its TCM Shi and Xu syndromes by integrating public transcriptomic data with serum multi-omics profiling, including metabolomics, lipidomics, targeted neurotransmitter analysis, and bile acid metabolomics. Machine learning and integrative analyses identified key genes and gene–metabolite–lipid networks, highlighting the molecular mechanisms underlying insomnia and TCM syndrome differentiation. These findings provide a multi-omics PMT framework for objective classification of TCM syndromes, enhance understanding of the biological basis of chronic insomnia, and offer potential targets for precision interventions.
Supplementary Materials
The following supporting information can be downloaded at: https://www.mdpi.com/article/10.3390/biomedicines14112513/s1, Figure S1: Total Ion Chromatogram Overlays of Quality Control (QC) Samples; Figure S2: Principal Component Analysis (PCA) Score Plots; Figure S3: Orthogonal Partial Least Squares Discriminant Analysis (OPLS-DA) and Permutation Tests of Metabolomic Data; Figure S4: Orthogonal Partial Least Squares Discriminant Analysis (OPLS-DA) and Permutation Tests of Lipidomic Data; Figure S5: KEGG Pathway Overlap Across Transcriptomic, Metabolomic, and Lipidomic Data; Figure S6: Enlarged Views of Pathway-Associated Molecular Networks; Figure S7: Enlarged Views of Lipid Metabolism-Associated Molecular Networks; Table S1: Sample Sizes and Platform Information for the Four GEO Datasets; Table S2: General Information and Medical History; Table S3: Traditional Chinese Medicine Four Diagnosis Information Collection Form; Table S4: Ion Pairs of MRM600 Metabolomics (* Denotes Internal Standard); Table S5: Ion Pairs of Lipidomics (* Denotes Internal Standard); Table S6: Ion Pairs for Neurotransmitter and Related Metabolite Detection (* Denotes Internal Standard); Table S7: Ion Pairs for Bile Acid Detection (* Denotes Internal Standard); Table S8: Metabolomics Data; Table S9: Data of Differential Metabolites; Table S10: Covariate-Adjusted Sensitivity Analysis of Serum Metabolites Across the Three Group Comparisons; Table S11: Lip-idomics Data; Table S12: Data of Differential Lipids; Table S13: Covariate-Adjusted Sensitivity Analysis of Serum Lipids Across the Three Group Comparisons; Table S14: Shared KEGG Pathways Between Transcriptomic Data and the Union of Metabolomic and Lipidomic Data.
Author Contributions
Data curation, X.Z. (Xiaoliang Zhao), Y.L., Z.Y., R.B., Z.W., W.G., Z.Z., X.W. and X.Z. (Xiaosen Zhao); formal analysis, C.G., Y.J. and X.Z. (Xiaosen Zhao); funding acquisition, H.L. and T.L.; investigation, C.G. and Y.J.; methodology, Y.J.; project administration, H.L. and T.L.; resources, C.G. and Y.J.; supervision, H.L. and T.L.; validation, X.Z. (Xiaoliang Zhao); visualization, C.G. and Y.J.; writing—original draft preparation, C.G. and Y.J.; writing—review and editing, C.G., Y.J., H.L. and T.L. All authors have read and agreed to the published version of the manuscript.
Funding
The research was funded by Fundamental Research Funds for the Central Public Welfare Research Institutes, China (Grant Nos.: JBGS2023004; ZZ2018015), the Scientific and Technological Innovation Project of China Academy of Chinese Medical Sciences (Grant Nos.: CI2026A05009; CZTXSJ2026005; CZTXMX2026004; CI2026A04501).
Institutional Review Board Statement
The study was conducted in accordance with the Declaration of Helsinki. and was conducted in accordance with the Measures for the Ethical Review of Biomedical Research Involving Humans issued by the Ministry of Health of the People’s Republic of China and approved by the Ethics Committee of the Medical Experimental Center of the China Academy of Chinese Medical Sciences (Approval No. 2018NO.7, approved on 27 September 2018).
Informed Consent Statement
Informed consent was obtained from all subjects involved in the study.
Data Availability Statement
The data reported in this paper have been deposited in the OMIX, China National Center for Bioinformation/Beijing Institute of Genomics, Chinese Academy of Sciences (https://ngdc.cncb.ac.cn/omix (accessed on 25 October 2026): accession No. OMIX012960).
Acknowledgments
We are grateful to all the patients who participated in the study and to the staff who helped recruit, collect, manage and process the samples. Graphical abstract was created with BioRender.com.
Conflicts of Interest
The authors declare no conflicts of interest.
Abbreviations
| 5-HIAA | 5-Hydroxyindoleacetic Acid |
| 5-HT | 5-Hydroxytryptamine |
| AHI | Apnea–Hypopnea Index |
| ANOVA | Analysis of Variance |
| AUC | Area Under the Receiver Operating Characteristic Curve |
| BMI | Body Mass Index |
| CA | Cholic Acid |
| CDCA | Chenodeoxycholic Acid |
| CE | Cholesteryl Ester |
| Cer | Ceramide |
| CI | Confidence Interval |
| CV | Coefficient of Variation |
| DEGs | Differentially Expressed Genes |
| DG | Diacylglycerol |
| DHCA | Dehydrocholic Acid |
| ESI | Electrospray Ionization |
| FA | Fatty Acid |
| FC | Fold Change |
| FDR | False Discovery Rate |
| GABA | Gamma-Aminobutyric Acid |
| GABA_A | Gamma-Aminobutyric Acid Type A Receptor |
| GCA | Glycocholic Acid |
| GCDCA | Glycochenodeoxycholic Acid |
| GEO | Gene Expression Omnibus |
| GHDCA | Glycohyodeoxycholic Acid |
| GO | Gene Ontology |
| Hex2Cer | Dihexosylceramide |
| HexCer | Hexosylceramide |
| HMDB | Human Metabolome Database |
| HPLC | High-Performance Liquid Chromatography |
| HPLC–MS/MS | High-Performance Liquid Chromatography–Tandem Mass Spectrometry |
| ICSD-3 | International Classification of Sleep Disorders, Third Edition |
| ISI | Insomnia Severity Index |
| KA | Kynurenic Acid |
| KEGG | Kyoto Encyclopedia of Genes and Genomes |
| LASSO | Least Absolute Shrinkage and Selection Operator |
| LCA | Lithocholic Acid |
| LC–MS | Liquid Chromatography–Mass Spectrometry |
| LPC | Lysophosphatidylcholine |
| LPC-O | Ether-Linked Lysophosphatidylcholine |
| Mel | Melatonin |
| MRM | Multiple Reaction Monitoring |
| N1%, N2%, N3% | Percentages of Total Sleep Time Spent in N1, N2, and N3 Sleep Stages, Respectively |
| OOF | Out-of-Fold |
| OPLS-DA | Orthogonal Partial Least Squares Discriminant Analysis |
| OR | Odds Ratio |
| PC | Phosphatidylcholine |
| PC-O | Ether-Linked Phosphatidylcholine |
| PCA | Principal Component Analysis |
| PE | Phosphatidylethanolamine |
| PE-O | Ether-Linked Phosphatidylethanolamine |
| PI | Phosphatidylinositol |
| PMT | Public Evidence-Informed Prioritization–Multi-Omics Discovery–Targeted Validation |
| PSG | Polysomnography |
| PSQI | Pittsburgh Sleep Quality Index |
| QA | Quinolinic Acid |
| QC | Quality Control |
| R% | Percentage of Total Sleep Time Spent in Rapid Eye Movement Sleep |
| REM | Rapid Eye Movement |
| REML | Rapid Eye Movement Sleep Latency |
| RF | Random Forest |
| ROC | Receiver Operating Characteristic |
| SD | Sleep Deprivation |
| SE | Sleep Efficiency |
| SEM | Standard Error of the Mean |
| SM | Sphingomyelin |
| SOL | Sleep Onset Latency |
| SVM-RFE | Support Vector Machine Recursive Feature Elimination |
| TCA | Taurocholic Acid |
| TCDCA | Taurochenodeoxycholic Acid |
| TCM | Traditional Chinese Medicine |
| TDCA | Taurodeoxycholic Acid |
| TG | Triacylglycerol |
| THDCA | Taurohyodeoxycholic Acid |
| Trn | Tryptophan |
| TrpA | Tryptamine |
| TST | Total Sleep Time |
| UCA | Ursocholic Acid |
| UDCA | Ursodeoxycholic Acid |
| VIP | Variable Importance in Projection |
| W | Wake Time |
| WASO | Wake After Sleep Onset |
| WGCNA | Weighted Gene Co-Expression Network Analysis |
| XA | Xanthurenic Acid |
References
- Chinese Sleep Research Society. Guidelines for the diagnosis and treatment of insomnia, 2025 edition. Chin. Med. J. 2025, 105, 2960–2981. [Google Scholar] [CrossRef] [Scilit] [PubMed]
- American Academy of Sleep Medicine. International Classification of Sleep Disorders, 3rd ed.; American Academy of Sleep Medicine: Darien, IL, USA, 2014. [Google Scholar]
- Buysse, D.J. Insomnia. JAMA 2013, 309, 706–716. [Google Scholar] [PubMed]
- Blanken, T.F.; Benjamins, J.S.; Borsboom, D.; Vermunt, J.K.; Paquola, C.; Ramautar, J.; Dekker, K.; Stoffers, D.; Wassing, R.; Wei, Y.; et al. Insomnia disorder subtypes derived from life history and traits of affect and personality. Lancet Psychiatry 2019, 6, 151–163. [Google Scholar] [CrossRef] [Scilit] [PubMed]
- Poon, M.M.-K.; Chung, K.-F.; Yeung, W.F.; Yau, V.H.-K.; Zhang, S.-P. Classification of insomnia using the traditional Chinese medicine system: A systematic review. Evid.-Based Complement. Altern. Med. 2012, 2012, 735078. [Google Scholar] [CrossRef] [Scilit] [PubMed]
- Chen, S.; Xu, Z.; Li, Y.; Wang, T.; Yue, Y.; Hou, Z.; You, L.; Lu, N.; Yin, Y.; Liu, X.; et al. Clinical efficacy of the Chinese herbal medicine Shumian Capsule for insomnia: A randomized, double-blind, placebo-controlled trial. Neuropsychiatr. Dis. Treat. 2022, 18, 669–679. [Google Scholar] [CrossRef] [Scilit] [PubMed]
- Birling, Y.; Zhu, X.; Avard, N.; Tannous, C.; Fahey, P.P.; Sarris, J.; Bensoussan, A. Zao Ren An Shen capsule for insomnia: A double-blind, randomized, placebo-controlled trial. Sleep 2022, 45, zsab266. [Google Scholar] [CrossRef] [Scilit] [PubMed]
- Edgar, R.; Domrachev, M.; Lash, A.E. Gene Expression Omnibus: NCBI gene expression and hybridization array data repository. Nucleic Acids Res. 2002, 30, 207–210. [Google Scholar] [CrossRef] [Scilit] [PubMed]
- Clough, E.; Barrett, T.; Wilhite, S.E.; Ledoux, P.; Evangelista, C.; Kim, I.F.; Tomashevsky, M.; Marshall, K.A.; Phillippy, K.H.; Sherman, P.M.; et al. NCBI GEO: Archive for gene expression and epigenomics data sets: 23-year update. Nucleic Acids Res. 2024, 52, D138–D144. [Google Scholar] [CrossRef] [Scilit] [PubMed]
- Humer, E.; Pieh, C.; Brandmayr, G. Metabolomics in sleep, insomnia and sleep apnea. Int. J. Mol. Sci. 2020, 21, 7244. [Google Scholar] [CrossRef] [Scilit] [PubMed]
- Gehrman, P.; Sengupta, A.; Harders, E.; Ubeydullah, E.; Pack, A.I.; Weljie, A. Altered diurnal states in insomnia reflect peripheral hyperarousal and metabolic desynchrony: A preliminary study. Sleep 2018, 41, zsy043. [Google Scholar] [CrossRef] [Scilit] [PubMed]
- Grant, L.K.; Ftouni, S.; Nijagal, B.; De Souza, D.P.; Tull, D.; McConville, M.J.; Rajaratnam, S.M.W.; Lockley, S.W.; Anderson, C. Circadian and wake-dependent changes in human plasma polar metabolites during prolonged wakefulness: A preliminary analysis. Sci. Rep. 2019, 9, 4428. [Google Scholar] [CrossRef] [Scilit] [PubMed]
- Giskeødegård, G.F.; Davies, S.K.; Revell, V.L.; Keun, H.; Skene, D.J. Diurnal rhythms in the human urine metabolome during sleep and total sleep deprivation. Sci. Rep. 2015, 5, 14843. [Google Scholar] [CrossRef] [Scilit] [PubMed]
- Aho, V.; Ollila, H.M.; Kronholm, E.; Bondia-Pons, I.; Soininen, P.; Kangas, A.J.; Hilvo, M.; Seppälä, I.; Kettunen, J.; Oikonen, M.; et al. Prolonged sleep restriction induces changes in pathways involved in cholesterol metabolism and inflammatory responses. Sci. Rep. 2016, 6, 24828. [Google Scholar] [CrossRef] [Scilit] [PubMed]
- Bell, L.N.; Kilkus, J.M.; Booth, J.N.; Bromley, L.E.; Imperial, J.G.; Penev, P.D. Effects of sleep restriction on the human plasma metabolome. Physiol. Behav. 2013, 122, 25–31. [Google Scholar] [CrossRef] [Scilit] [PubMed]
- Leclercq, M.; Vittrant, B.; Martin-Magniette, M.L.; Scott Boyer, M.P.; Perin, O.; Bergeron, A.; Fradet, Y.; Droit, A. Large-scale automatic feature selection for biomarker discovery in high-dimensional OMICs data. Front. Genet. 2019, 10, 452. [Google Scholar] [CrossRef] [Scilit] [PubMed]
- Huang, L. Opportunities and challenges of traditional Chinese medicine in the era of digitalization and intelligence. Sci. Tradit. Chin. Med. 2026, 4, 105–107. [Google Scholar] [CrossRef] [Scilit]
- Chi, H.; Yang, J.; Peng, G.; Zhang, J.; Song, G.; Xie, X.; Xia, Z.; Liu, J.; Tian, G. Circadian rhythm-related genes index: A predictor for HNSCC prognosis, immunotherapy efficacy, and chemosensitivity. Front. Immunol. 2023, 14, 1091218. [Google Scholar] [CrossRef] [Scilit] [PubMed]
- State Administration of Traditional Chinese Medicine. State Standard of Diagnosis and Therapeutic Effect for Diseases and Syndromes in Traditional Chinese Medicine; China Press of Traditional Chinese Medicine: Beijing, China, 2012. [Google Scholar]
- Yu, Y. A Study on the Correlation between Sleep EEG and Sphygmogram Characteristics and TCM Syndromes in Patients with Chronic Insomnia. Ph.D. Thesis, China Academy of Chinese Medical Sciences, Beijing, China, 2022. [Google Scholar]
- Yuan, Z.; Zhao, X.; Zhang, Y.; Jiao, Y.; Liu, Y.; Gao, C.; Zhang, J.; Ma, Y.; Wang, Z.; Li, T. Using integrated network pharmacology and metabolomics to reveal the mechanisms of the combined intervention of ligustrazine and sinomenine in CCI-induced neuropathic pain rats. Int. J. Mol. Sci. 2025, 26, 2604. [Google Scholar] [CrossRef] [Scilit] [PubMed]
- Lv, W.; Zeng, Z.; Zhang, Y.; Wang, Q.; Wang, L.; Zhang, Z.; Shi, X.; Zhao, X.; Xu, G. Comprehensive metabolite quantitative assay based on alternate metabolomics and lipidomics analyses. Anal. Chim. Acta 2022, 1215, 339979. [Google Scholar] [CrossRef] [Scilit] [PubMed]
- Liu, J.; Gao, C.; Feng, X.; Wang, D.; Liu, B.; Zhu, L.; Sun, Q.; Yang, W.-P.; Li, T.; Zhang, C.-J. Investigating therapeutic efficacy and mechanisms of Huangliantang on reflux esophagitis based on esophageal microbiota. Chin. J. Exp. Tradit. Med. Formulae 2026, 32, 38–49. [Google Scholar]
- Rondanelli, M.; Opizzi, A.; Monteferrario, F.; Antoniello, N.; Manni, R.; Klersy, C. The effect of melatonin, magnesium, and zinc on primary insomnia in long-term care facility residents in Italy: A double-blind, placebo-controlled clinical trial. J. Am. Geriatr. Soc. 2011, 59, 82–90. [Google Scholar] [CrossRef] [Scilit] [PubMed]
- Wang, H.; Gu, Y.; Khalid, R.; Chen, X.; Han, T. Herbal medicines for insomnia through regulating 5-hydroxytryptamine receptors: A systematic review. Chin. J. Nat. Med. 2023, 21, 483–498. [Google Scholar] [CrossRef] [Scilit] [PubMed]
- Zisapel, N. New perspectives on the role of melatonin in human sleep, circadian rhythms and their regulation. Br. J. Pharmacol. 2018, 175, 3190–3199. [Google Scholar] [CrossRef] [Scilit] [PubMed]
- Sun, Y.; Wang, Z.; Hou, J.; Shi, J.; Tang, Z.; Wang, C.; Zhao, H. Shuangxinfang prevents S100A9-induced macrophage/microglial inflammation to improve cardiac function and depression-like behavior in rats after acute myocardial infarction. Front. Pharmacol. 2022, 13, 832590. [Google Scholar] [CrossRef] [Scilit] [PubMed]
- Chu, L.; Lu, Q.; Chen, P.; Feng, Z.; Wu, P.; Shen, J.; Jiang, Y.; Yang, Y.; Tan, X.; Wang, X.; et al. Baihe Dihuang Tang as a therapeutic candidate for insomnia: Targeting gut dysbiosis and neuroendocrine dysfunction. iMetaOmics 2025, 2, e60. [Google Scholar] [CrossRef] [Scilit] [PubMed]
- Theparambil, S.M.; Kopach, O.; Braga, A.; Nizari, S.; Hosford, P.S.; Sagi-Kiss, V.; Hadjihambi, A.; Konstantinou, C.; Esteras, N.; Gutierrez Del Arroyo, A.; et al. Adenosine signalling to astrocytes coordinates brain metabolism and function. Nature 2024, 632, 139–146. [Google Scholar] [CrossRef] [Scilit] [PubMed]
- Scammell, T.E.; Arrigoni, E.; Lipton, J.O. Neural circuitry of wakefulness and sleep. Neuron 2017, 93, 747–765. [Google Scholar] [CrossRef] [Scilit] [PubMed]
- Dong, Z.; Zhao, R.; Zhang, Q.; Song, Z.; Zhu, H.; Liu, Y.; Tang, Z. Mechanisms of Suanzaoren decoction in the treatment of insomnia via intestinal microecology regulation. Sci. Tradit. Chin. Med. 2026, 4, 225–231. [Google Scholar] [CrossRef] [Scilit]
- Lin, F.J.; Pierce, M.M.; Sehgal, A.; Wu, T.; Skipper, D.C.; Chabba, R. Effect of taurine and caffeine on sleep-wake activity in Drosophila melanogaster. Nat. Sci. Sleep 2010, 2, 221–231. [Google Scholar] [CrossRef] [Scilit] [PubMed]
- Stahl, B.A.; Peco, E.; Davla, S.; Murakami, K.; Caicedo Moreno, N.A.; van Meyel, D.J.; Keene, A.C. The taurine transporter Eaat2 functions in ensheathing glia to modulate sleep and metabolic rate. Curr. Biol. 2018, 28, 3700–3708.e4. [Google Scholar] [CrossRef] [Scilit] [PubMed]
- Bortoluzzi, V.T.; Ribeiro, R.T.; Zemniaçak, Â.B.; Cunha, S.d.A.; Sass, J.O.; Castilho, R.F.; Amaral, A.U.; Wajner, M. Disturbance of mitochondrial functions caused by N-acetylglutamate and N-acetylmethionine in brain of adolescent rats: Potential relevance in aminoacylase 1 deficiency. Neurochem. Int. 2023, 171, 105631. [Google Scholar] [CrossRef] [Scilit] [PubMed]
- Yu, X.; Li, W.; Ma, Y.; Tossell, K.; Harris, J.J.; Harding, E.C.; Ba, W.; Miracca, G.; Wang, D.; Li, L.; et al. GABA and glutamate neurons in the VTA regulate sleep and wakefulness. Nat. Neurosci. 2019, 22, 106–119. [Google Scholar] [CrossRef] [Scilit] [PubMed]
- Ki, Y.; Lim, C. Sleep-promoting effects of threonine link amino acid metabolism in Drosophila neuron to GABAergic control of sleep drive. eLife 2019, 8, e40593. [Google Scholar] [CrossRef] [Scilit] [PubMed]
- Beltrán González, A.N.; Vicentini, F.; Calvo, D.J. Negative modulation of the GABAA ρ1 receptor function by L-cysteine. J. Neurochem. 2018, 144, 50–57. [Google Scholar] [PubMed]
- Zhu, J.; Berisa, M.; Schwörer, S.; Qin, W.; Cross, J.R.; Thompson, C.B. Transsulfuration activity can support cell growth upon extracellular cysteine limitation. Cell Metab. 2019, 30, 865–876.e5. [Google Scholar] [CrossRef] [Scilit] [PubMed]
- Watanabe, M.; Chiba, Y.; Hirai, M.Y. Metabolism and regulatory functions of O-acetylserine, S-adenosylmethionine, homocysteine, and serine in plant development and environmental responses. Front. Plant Sci. 2021, 12, 643403. [Google Scholar] [CrossRef] [Scilit] [PubMed]
- Hensel, C.; Becker, M.; Düzel, S.; Demuth, I.; Norman, K.; Steinhagen-Thiessen, E.; Gallinat, J.; Lindenberger, U.; Kühn, S. Influence of nutritional tyrosine on cognition and functional connectivity in healthy old humans. NeuroImage 2019, 193, 139–145. [Google Scholar] [CrossRef] [Scilit] [PubMed]
- Thakkar, M.M. Histamine in the regulation of wakefulness. Sleep Med. Rev. 2011, 15, 65–74. [Google Scholar] [CrossRef] [Scilit] [PubMed]
- Scammell, T.E.; Jackson, A.C.; Franks, N.P.; Wisden, W.; Dauvilliers, Y. Histamine: Neural circuits and new medications. Sleep 2019, 42, zsy183. [Google Scholar] [CrossRef] [Scilit] [PubMed]
- Anraku, M.; Tsurusaki, Y.; Watanabe, H.; Maruyama, T.; Kragh-Hansen, U.; Otagiri, M. Stabilizing mechanisms in commercial albumin preparations: Octanoate and N-acetyl-L-tryptophanate protect human serum albumin against heat and oxidative stress. Biochim. Biophys. Acta Proteins Proteom. 2004, 1702, 9–17. [Google Scholar] [CrossRef] [Scilit] [PubMed]
- Dion, M.Z.; Leiske, D.; Sharma, V.K.; Zuch de Zafra, C.L.; Salisbury, C.M. Mitigation of oxidation in therapeutic antibody formulations: A biochemical efficacy and safety evaluation of N-acetyl-tryptophan and L-methionine. Pharm. Res. 2018, 35, 222. [Google Scholar] [CrossRef] [Scilit] [PubMed]
- Shadnia, S.; Dasgar, M.; Taghikhani, S.; Mohammadirad, A.; Khorasani, R.; Abdollahi, M. Protective effects of α-tocopherol and N-acetyl-cysteine on diazinon-induced oxidative stress and acetylcholinesterase inhibition in rats. Toxicol. Mech. Methods 2007, 17, 109–115. [Google Scholar] [CrossRef] [Scilit] [PubMed]
- Nissar, A.U.; Farrukh, M.R.; Kaiser, P.J.; Rafiq, R.A.; Afnan, Q.; Bhushan, S.; Adil, H.S.; Subhash, B.C.; Tasduq, S.A. Effect of N-acetyl cysteine, an organosulfur compound from Allium plants, on experimentally induced hepatic prefibrogenic events in Wistar rat. Phytomedicine 2013, 20, 828–833. [Google Scholar] [CrossRef] [Scilit] [PubMed]
- Molina, V.; Sánchez, J.; Reig, S.; Sanz, J.; Benito, C.; Santamarta, C.; Pascau, J.; Sarramea, F.; Gispert, J.D.; Misiego, J.M.; et al. N-acetyl-aspartate levels in the dorsolateral prefrontal cortex in the early years of schizophrenia are inversely related to disease duration. Schizophr. Res. 2005, 73, 209–219. [Google Scholar] [CrossRef] [Scilit] [PubMed]
- Min, J.-Z.; Tomiyasu, Y.; Morotomi, T.; Jiang, Y.-Z.; Li, G.; Shi, Q.; Yu, H.-F.; Inoue, K.; Todoroki, K.; Toyo’oka, T. First observation of N-acetyl leucine and N-acetyl isoleucine in diabetic patient hair and quantitative analysis by UPLC-ESI-MS/MS. Clin. Chim. Acta 2015, 444, 143–148. [Google Scholar] [CrossRef] [Scilit] [PubMed]
- Winsberg, M.E.; Sachs, N.; Tate, D.L.; Adalsteinsson, E.; Spielman, D.; Ketter, T.A. Decreased dorsolateral prefrontal N-acetyl aspartate in bipolar disorder. Biol. Psychiatry 2000, 47, 475–481. [Google Scholar] [CrossRef] [Scilit] [PubMed]
- Holeček, M. Glycine as a conditionally essential amino acid and its relationship to L-serine. Metabolism 2025, 170, 156330. [Google Scholar] [CrossRef] [Scilit] [PubMed]
- Varghese, A.; Gusarov, I.; Gamallo-Lana, B.; Dolgonos, D.; Mankan, Y.; Shamovsky, I.; Phan, M.; Jones, R.; Gomez-Jenkins, M.; White, E.; et al. Unravelling cysteine-deficiency-associated rapid weight loss. Nature 2025, 643, 776–784. [Google Scholar] [CrossRef] [Scilit] [PubMed]
- Planellas, L.; Mayà, G.; Painous, C.; Santacruz, P.; Santamaria, J.; Martí, M.J. Characterization of sleep in six patients with pantothenate kinase-associated neurodegeneration. Sleep Med. 2021, 84, 389–396. [Google Scholar] [CrossRef] [Scilit] [PubMed]
- Barritt, S.A.; DuBois-Coyne, S.E.; Dibble, C.C. Coenzyme A biosynthesis: Mechanisms of regulation, function and disease. Nat. Metab. 2024, 6, 1008–1023. [Google Scholar] [CrossRef] [Scilit] [PubMed]
- Davies, S.K.; Ang, J.E.; Revell, V.L.; Holmes, B.; Mann, A.; Robertson, F.P.; Cui, N.; Middleton, B.; Ackermann, K.; Kayser, M.; et al. Effect of sleep deprivation on the human metabolome. Proc. Natl. Acad. Sci. USA 2014, 111, 10761–10766. [Google Scholar] [CrossRef] [Scilit] [PubMed]
- Guindalini, C.; Lee, K.S.; Andersen, M.L.; Santos-Silva, R.; Bittencourt, L.R.; Tufik, S. The influence of obstructive sleep apnea on the expression of glycerol-3-phosphate dehydrogenase 1 gene. Exp. Biol. Med. 2010, 235, 52–56. [Google Scholar] [CrossRef] [Scilit] [PubMed]
- Chua, E.C.P.; Shui, G.; Cazenave-Gassiot, A.; Wenk, M.R.; Gooley, J.J. Changes in plasma lipids during exposure to total sleep deprivation. Sleep 2015, 38, 1683–1691. [Google Scholar] [CrossRef] [Scilit] [PubMed]
- Weljie, A.M.; Meerlo, P.; Goel, N.; Sengupta, A.; Kayser, M.S.; Abel, T.; Birnbaum, M.J.; Dinges, D.F.; Sehgal, A. Oxalic acid and diacylglycerol 36:3 are cross-species markers of sleep debt. Proc. Natl. Acad. Sci. USA 2015, 112, 2569–2574. [Google Scholar] [CrossRef] [Scilit] [PubMed]
- Pols, T.W.H.; Noriega, L.G.; Nomura, M.; Auwerx, J.; Schoonjans, K. The bile acid membrane receptor TGR5 as an emerging target in metabolism and inflammation. J. Hepatol. 2011, 54, 1263–1272. [Google Scholar] [CrossRef] [Scilit] [PubMed]
- Matsubara, T.; Li, F.; Gonzalez, F.J. FXR signaling in the enterohepatic system. Mol. Cell. Endocrinol. 2013, 368, 17–29. [Google Scholar] [CrossRef] [Scilit] [PubMed]
- Collins, S.L.; Stine, J.G.; Bisanz, J.E.; Okafor, C.D.; Patterson, A.D. Bile acids and the gut microbiota: Metabolic interactions and impacts on disease. Nat. Rev. Microbiol. 2023, 21, 236–247. [Google Scholar] [CrossRef] [Scilit] [PubMed]
- Wang, L.; Zhou, M. Structure of a eukaryotic cholinephosphotransferase-1 reveals mechanisms of substrate recognition and catalysis. Nat. Commun. 2023, 14, 2753. [Google Scholar] [CrossRef] [Scilit] [PubMed]
- Dorighello, G.; McPhee, M.; Halliday, K.; Dellaire, G.; Ridgway, N.D. Differential contributions of phosphotransferases CEPT1 and CHPT1 to phosphatidylcholine homeostasis and lipid droplet biogenesis. J. Biol. Chem. 2023, 299, 104578. [Google Scholar] [CrossRef] [Scilit] [PubMed]
- Kiriyama, Y.; Nochi, H. The role of gut microbiota-derived lithocholic acid, deoxycholic acid and their derivatives on the function and differentiation of immune cells. Microorganisms 2023, 11, 2730. [Google Scholar] [CrossRef] [Scilit] [PubMed]
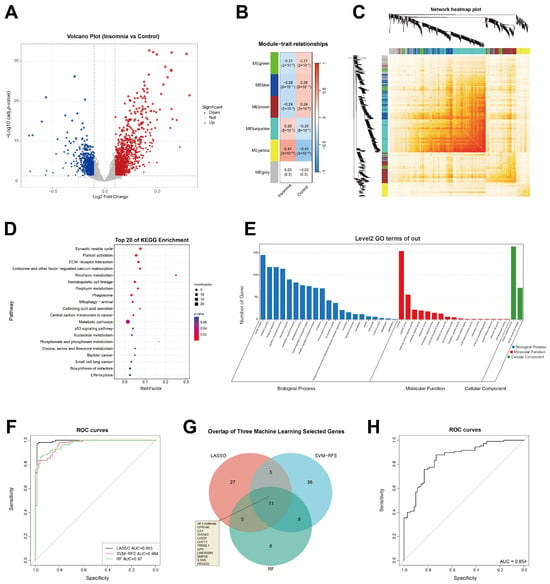
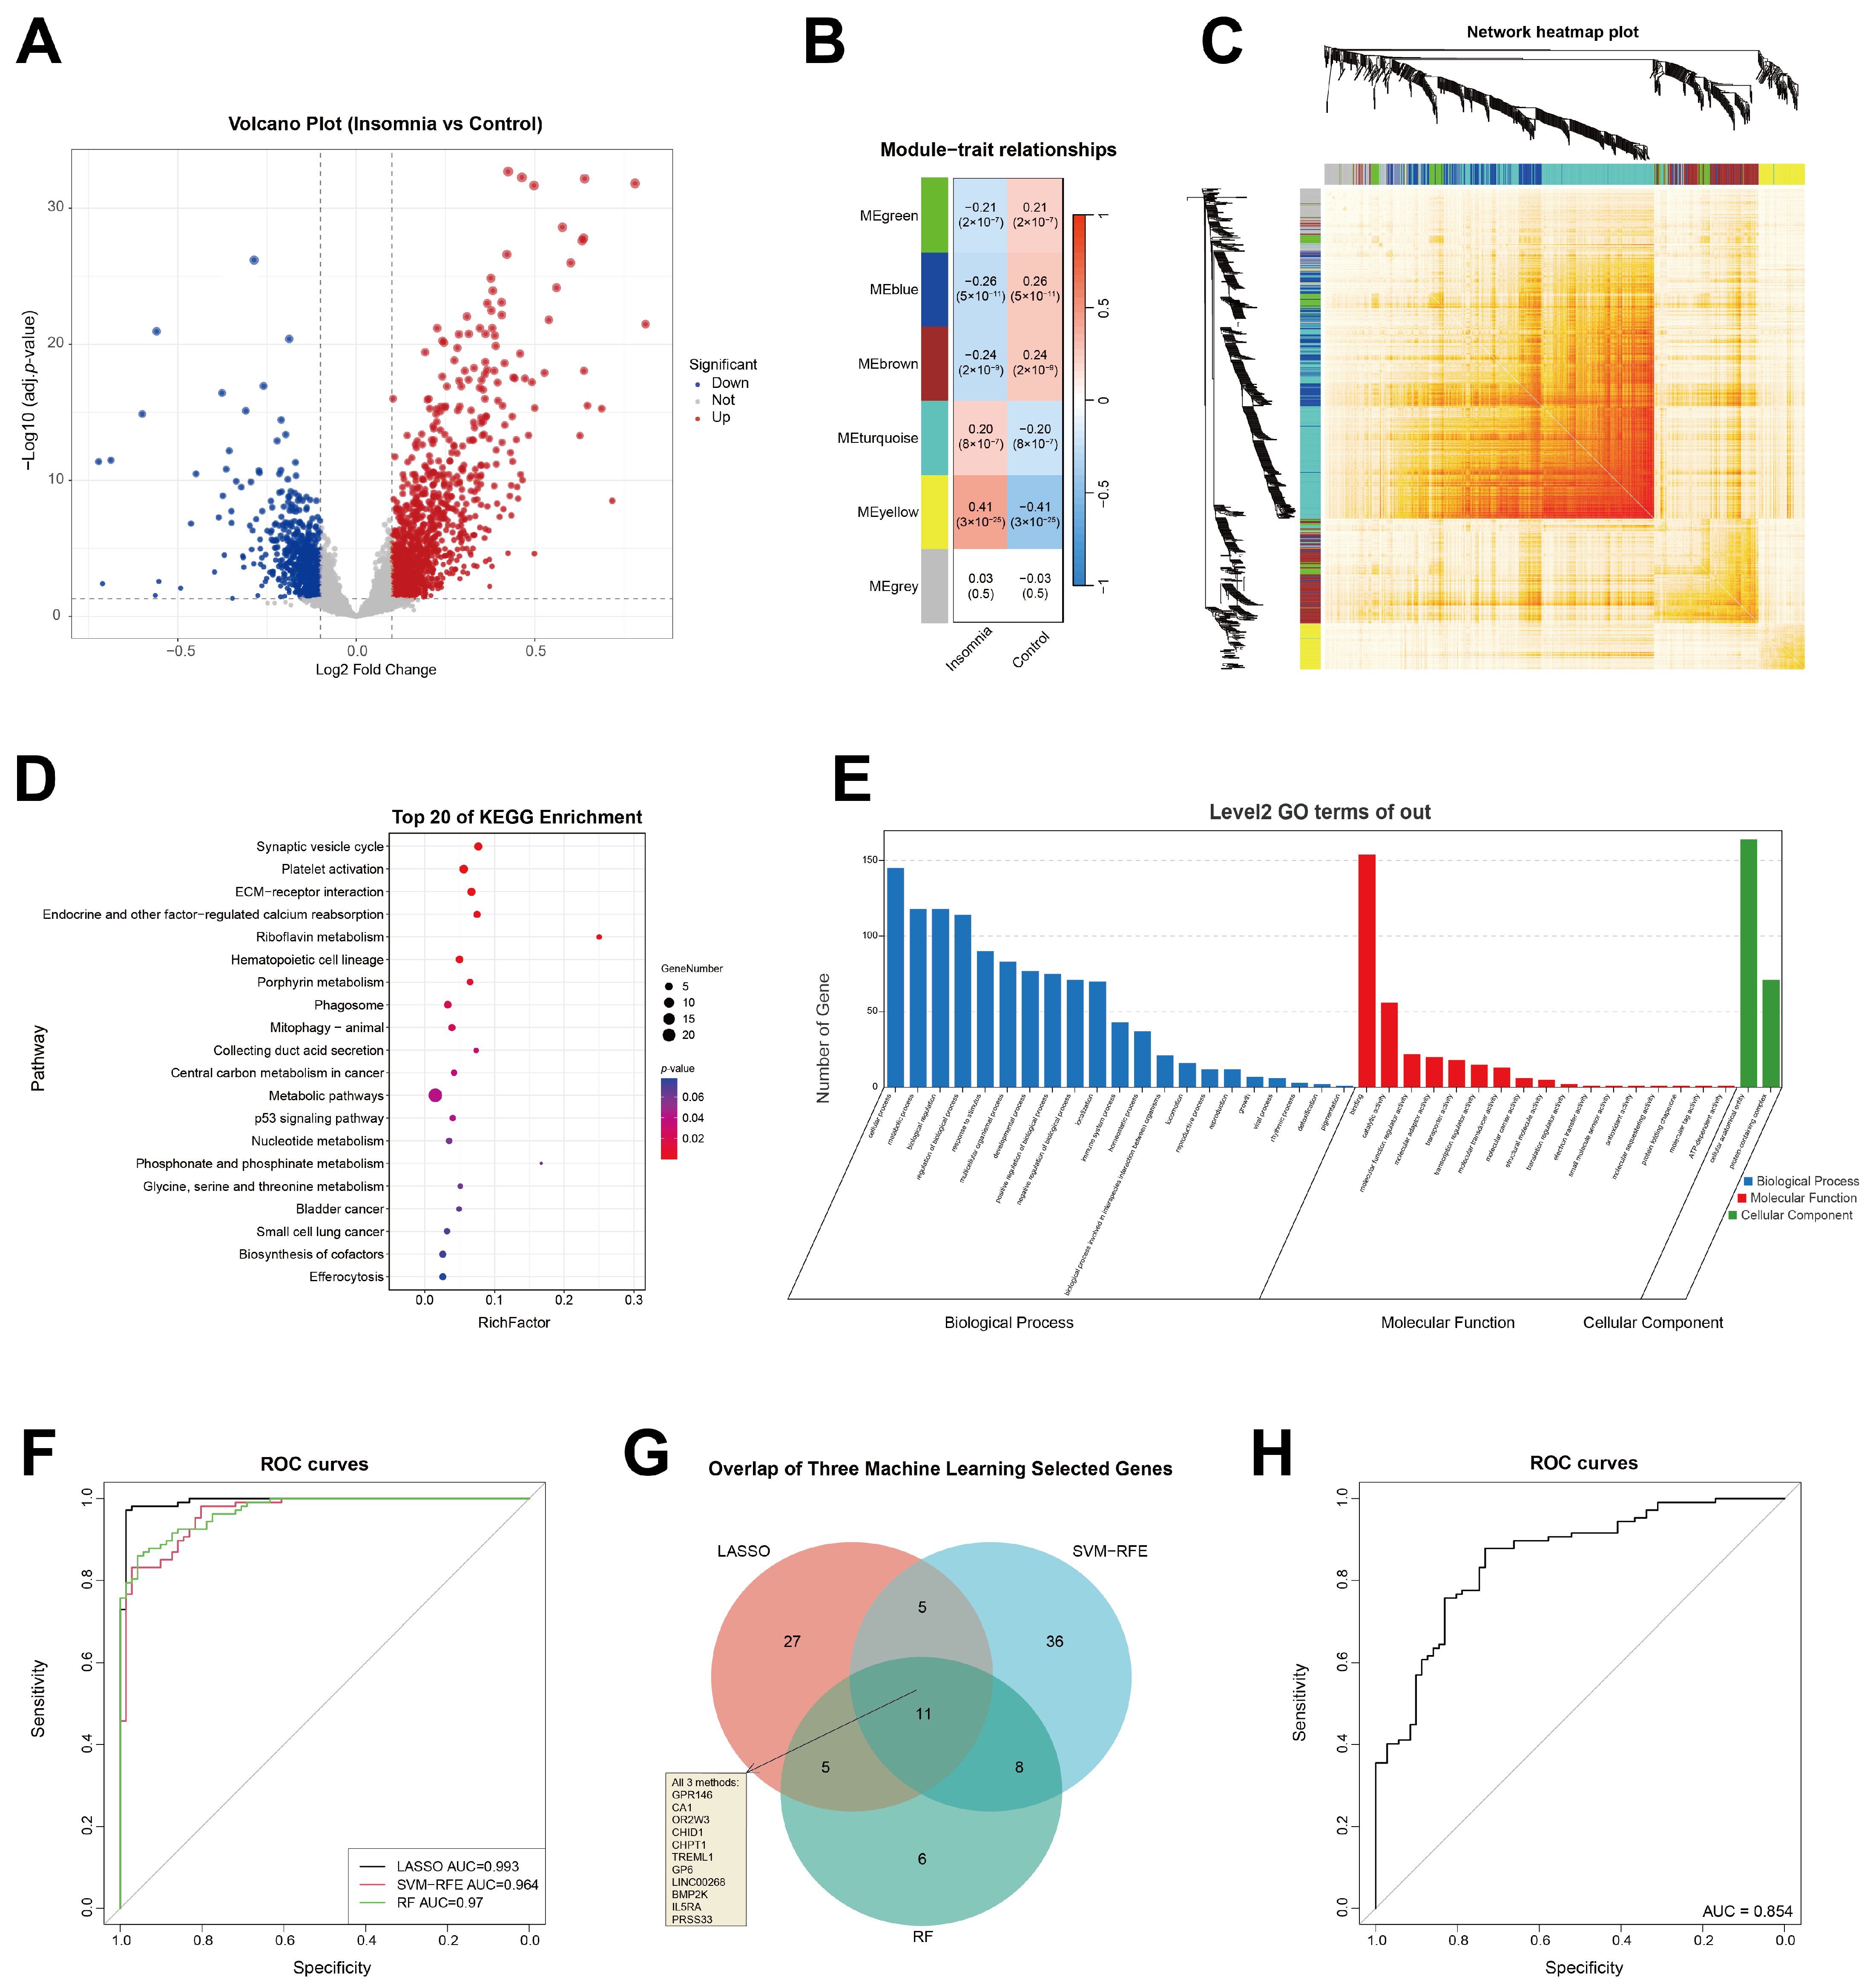
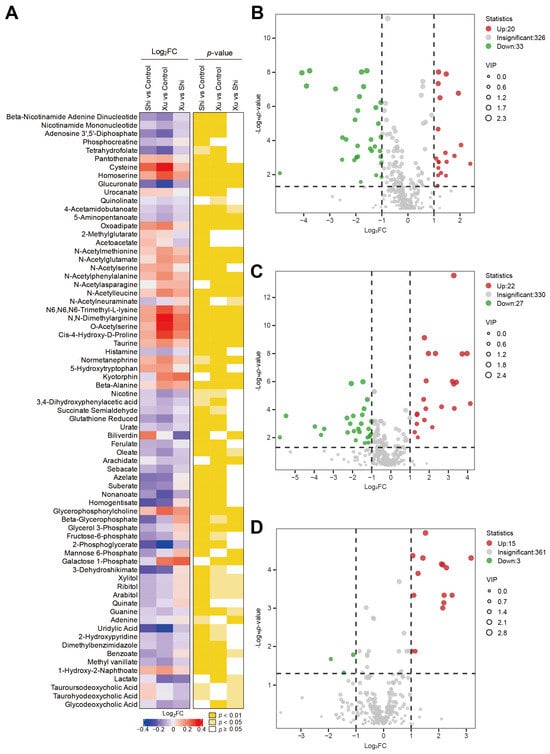
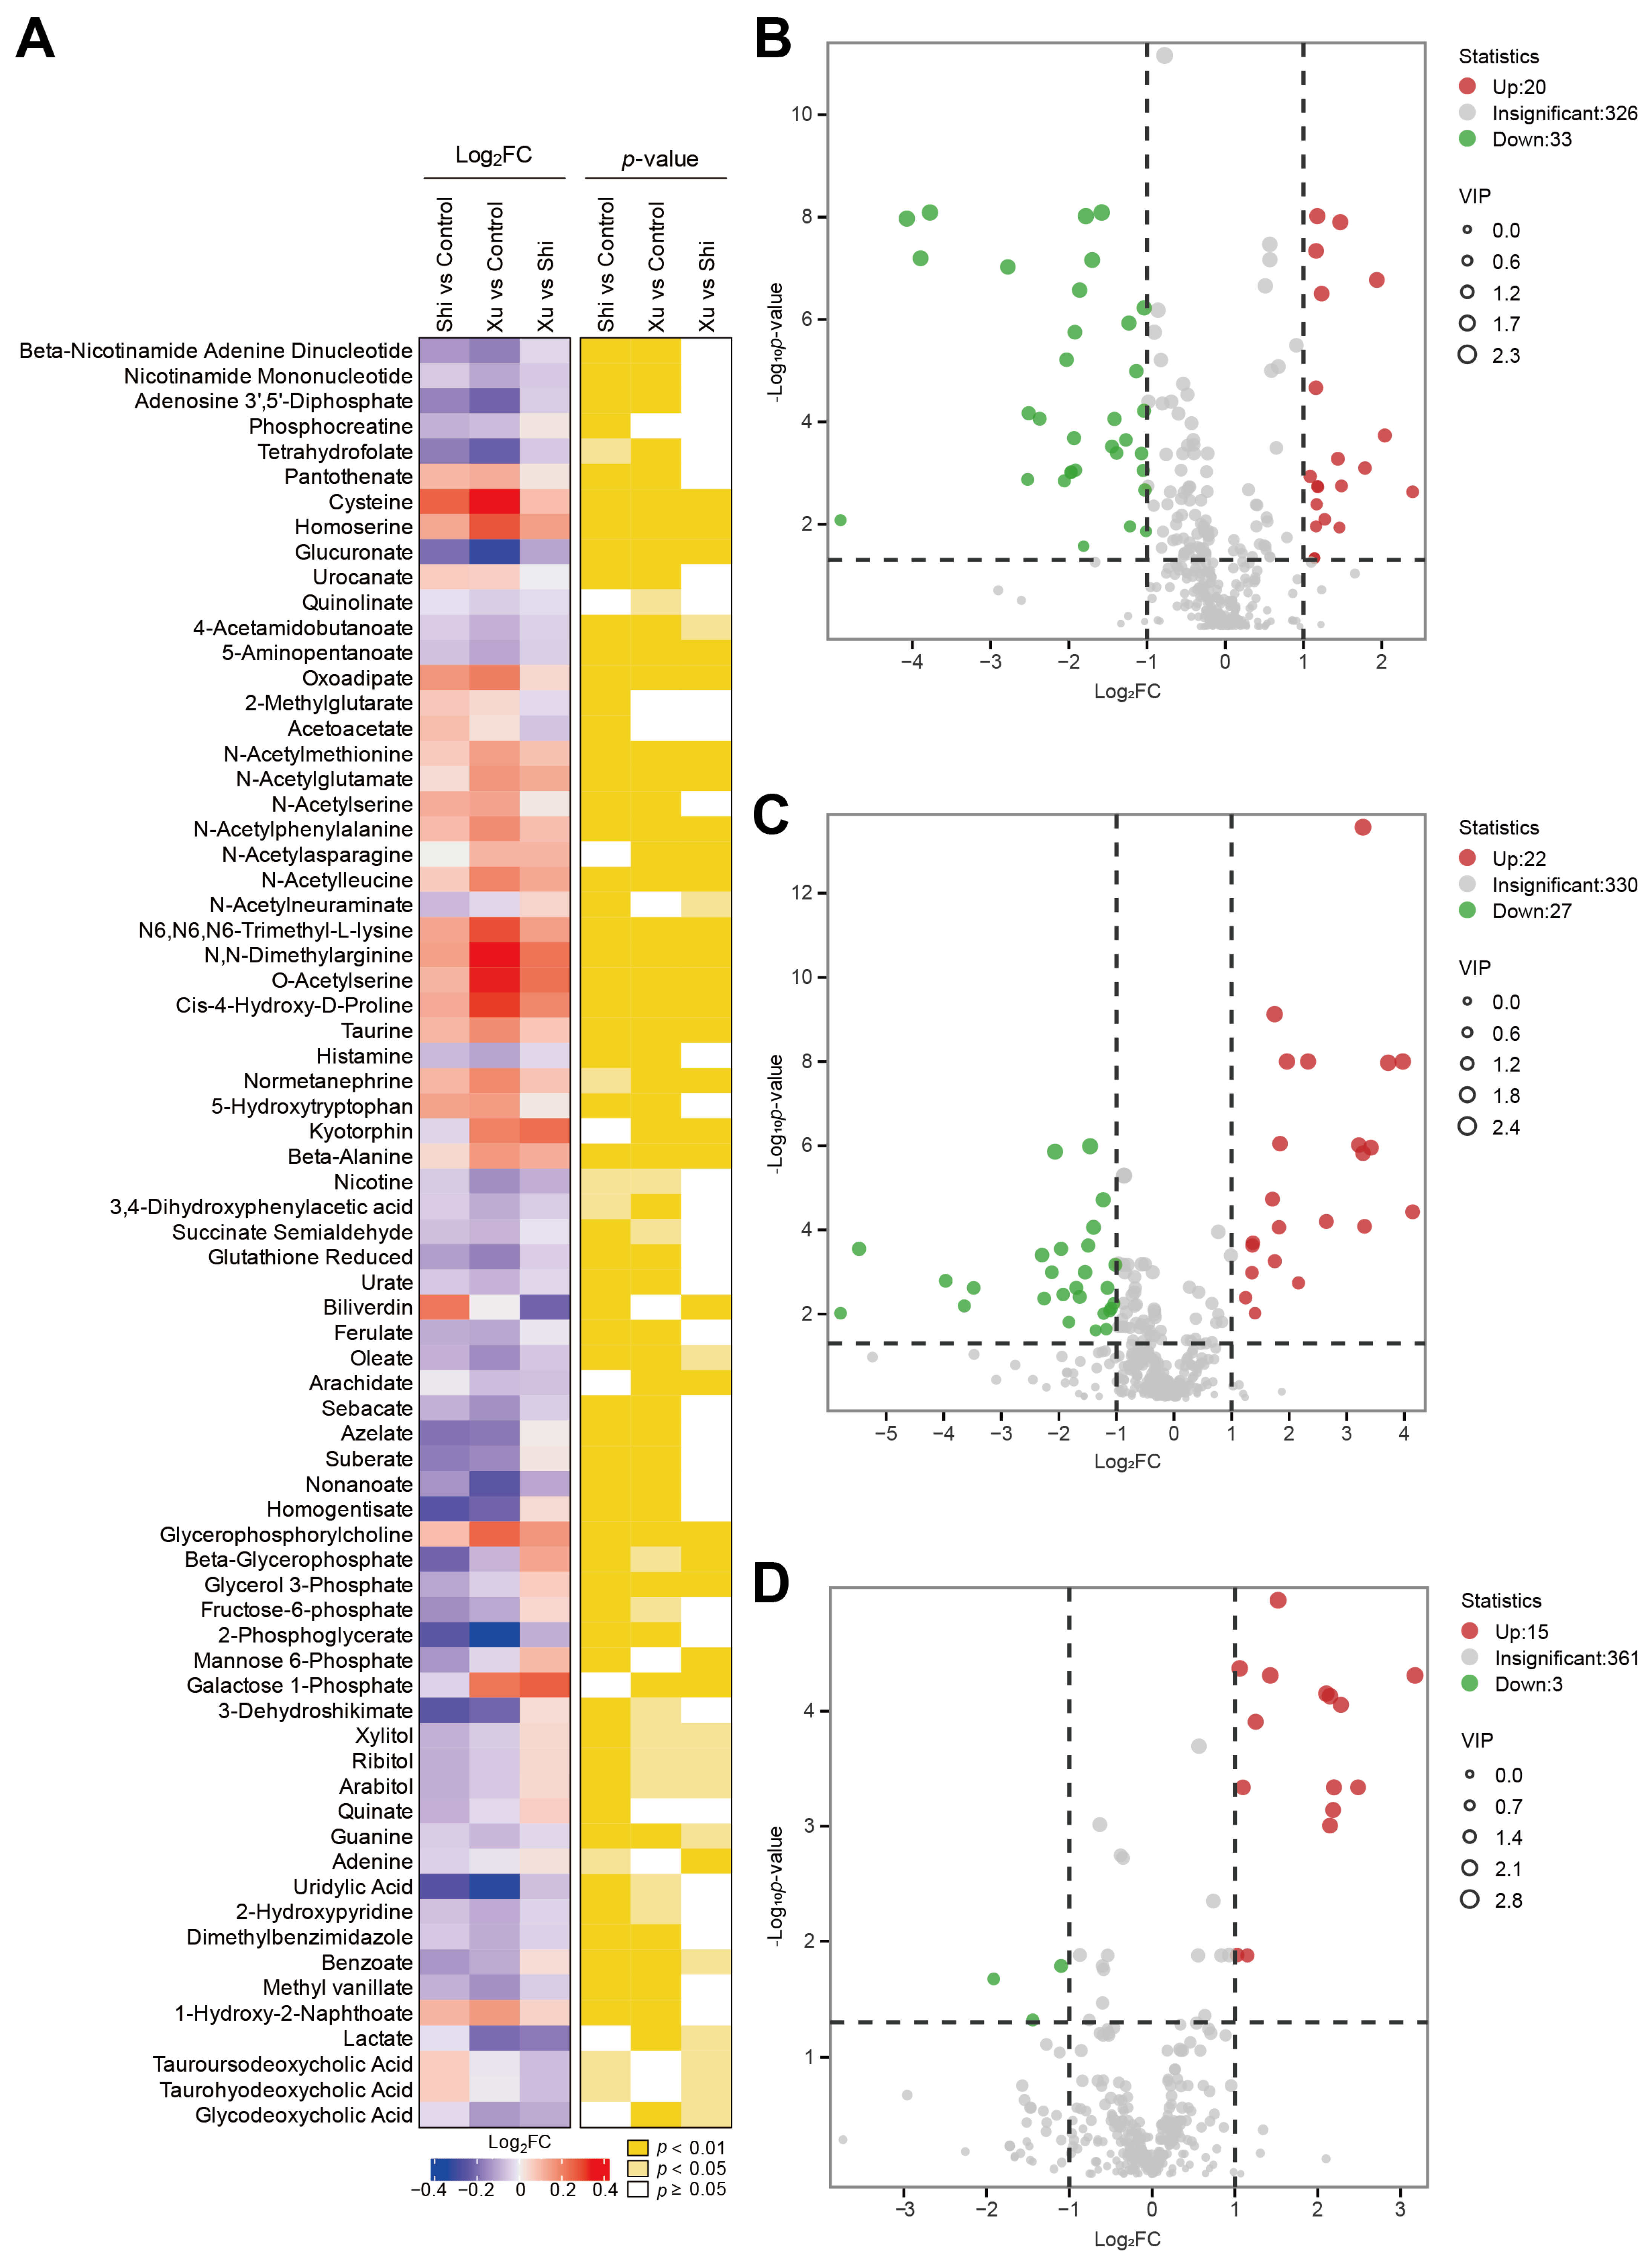
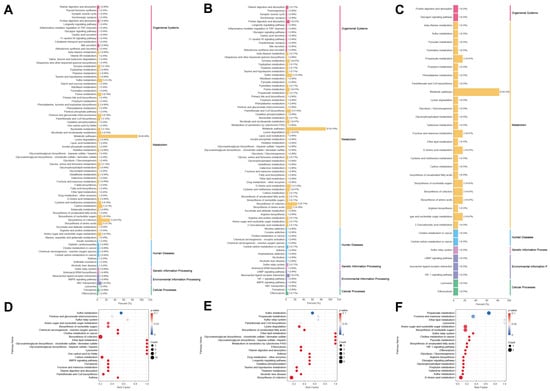
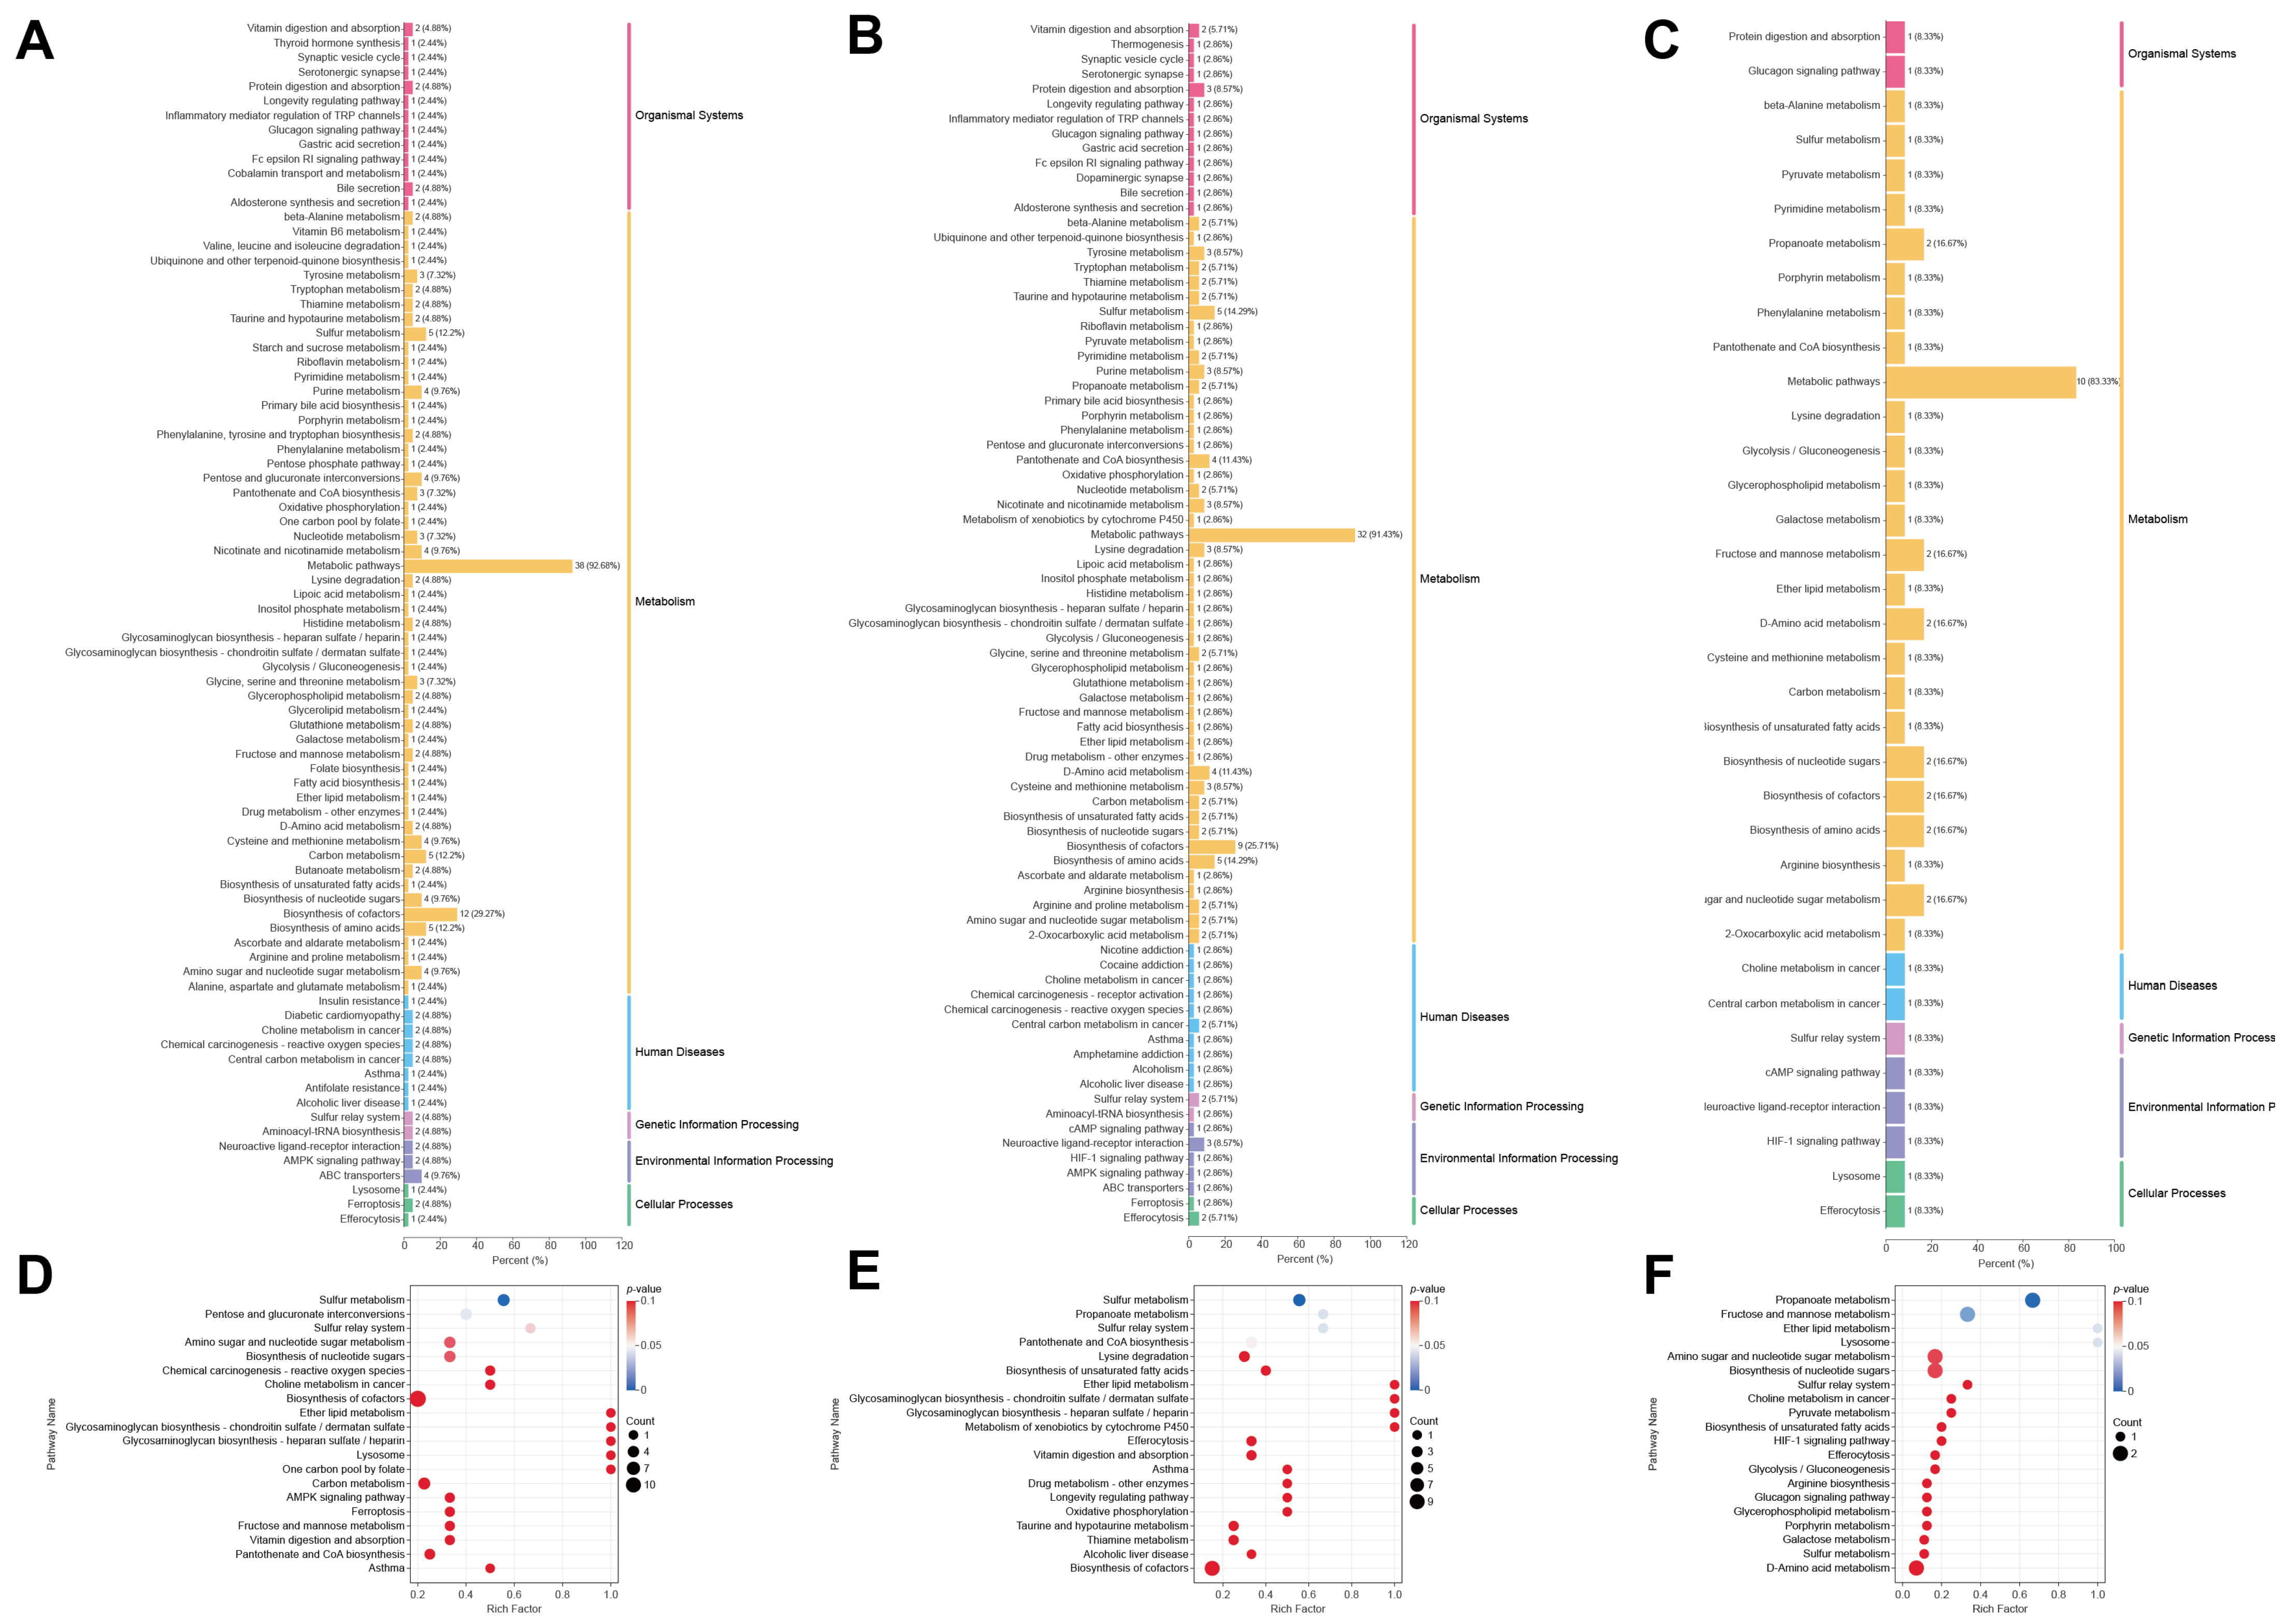
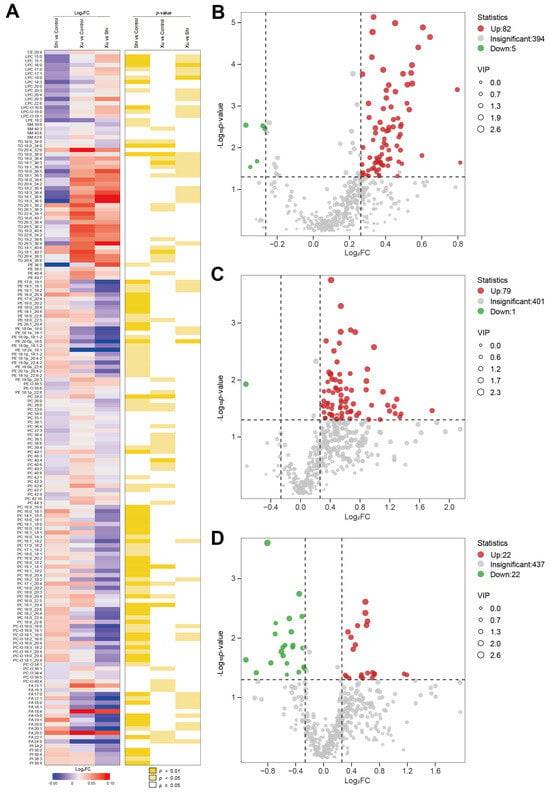
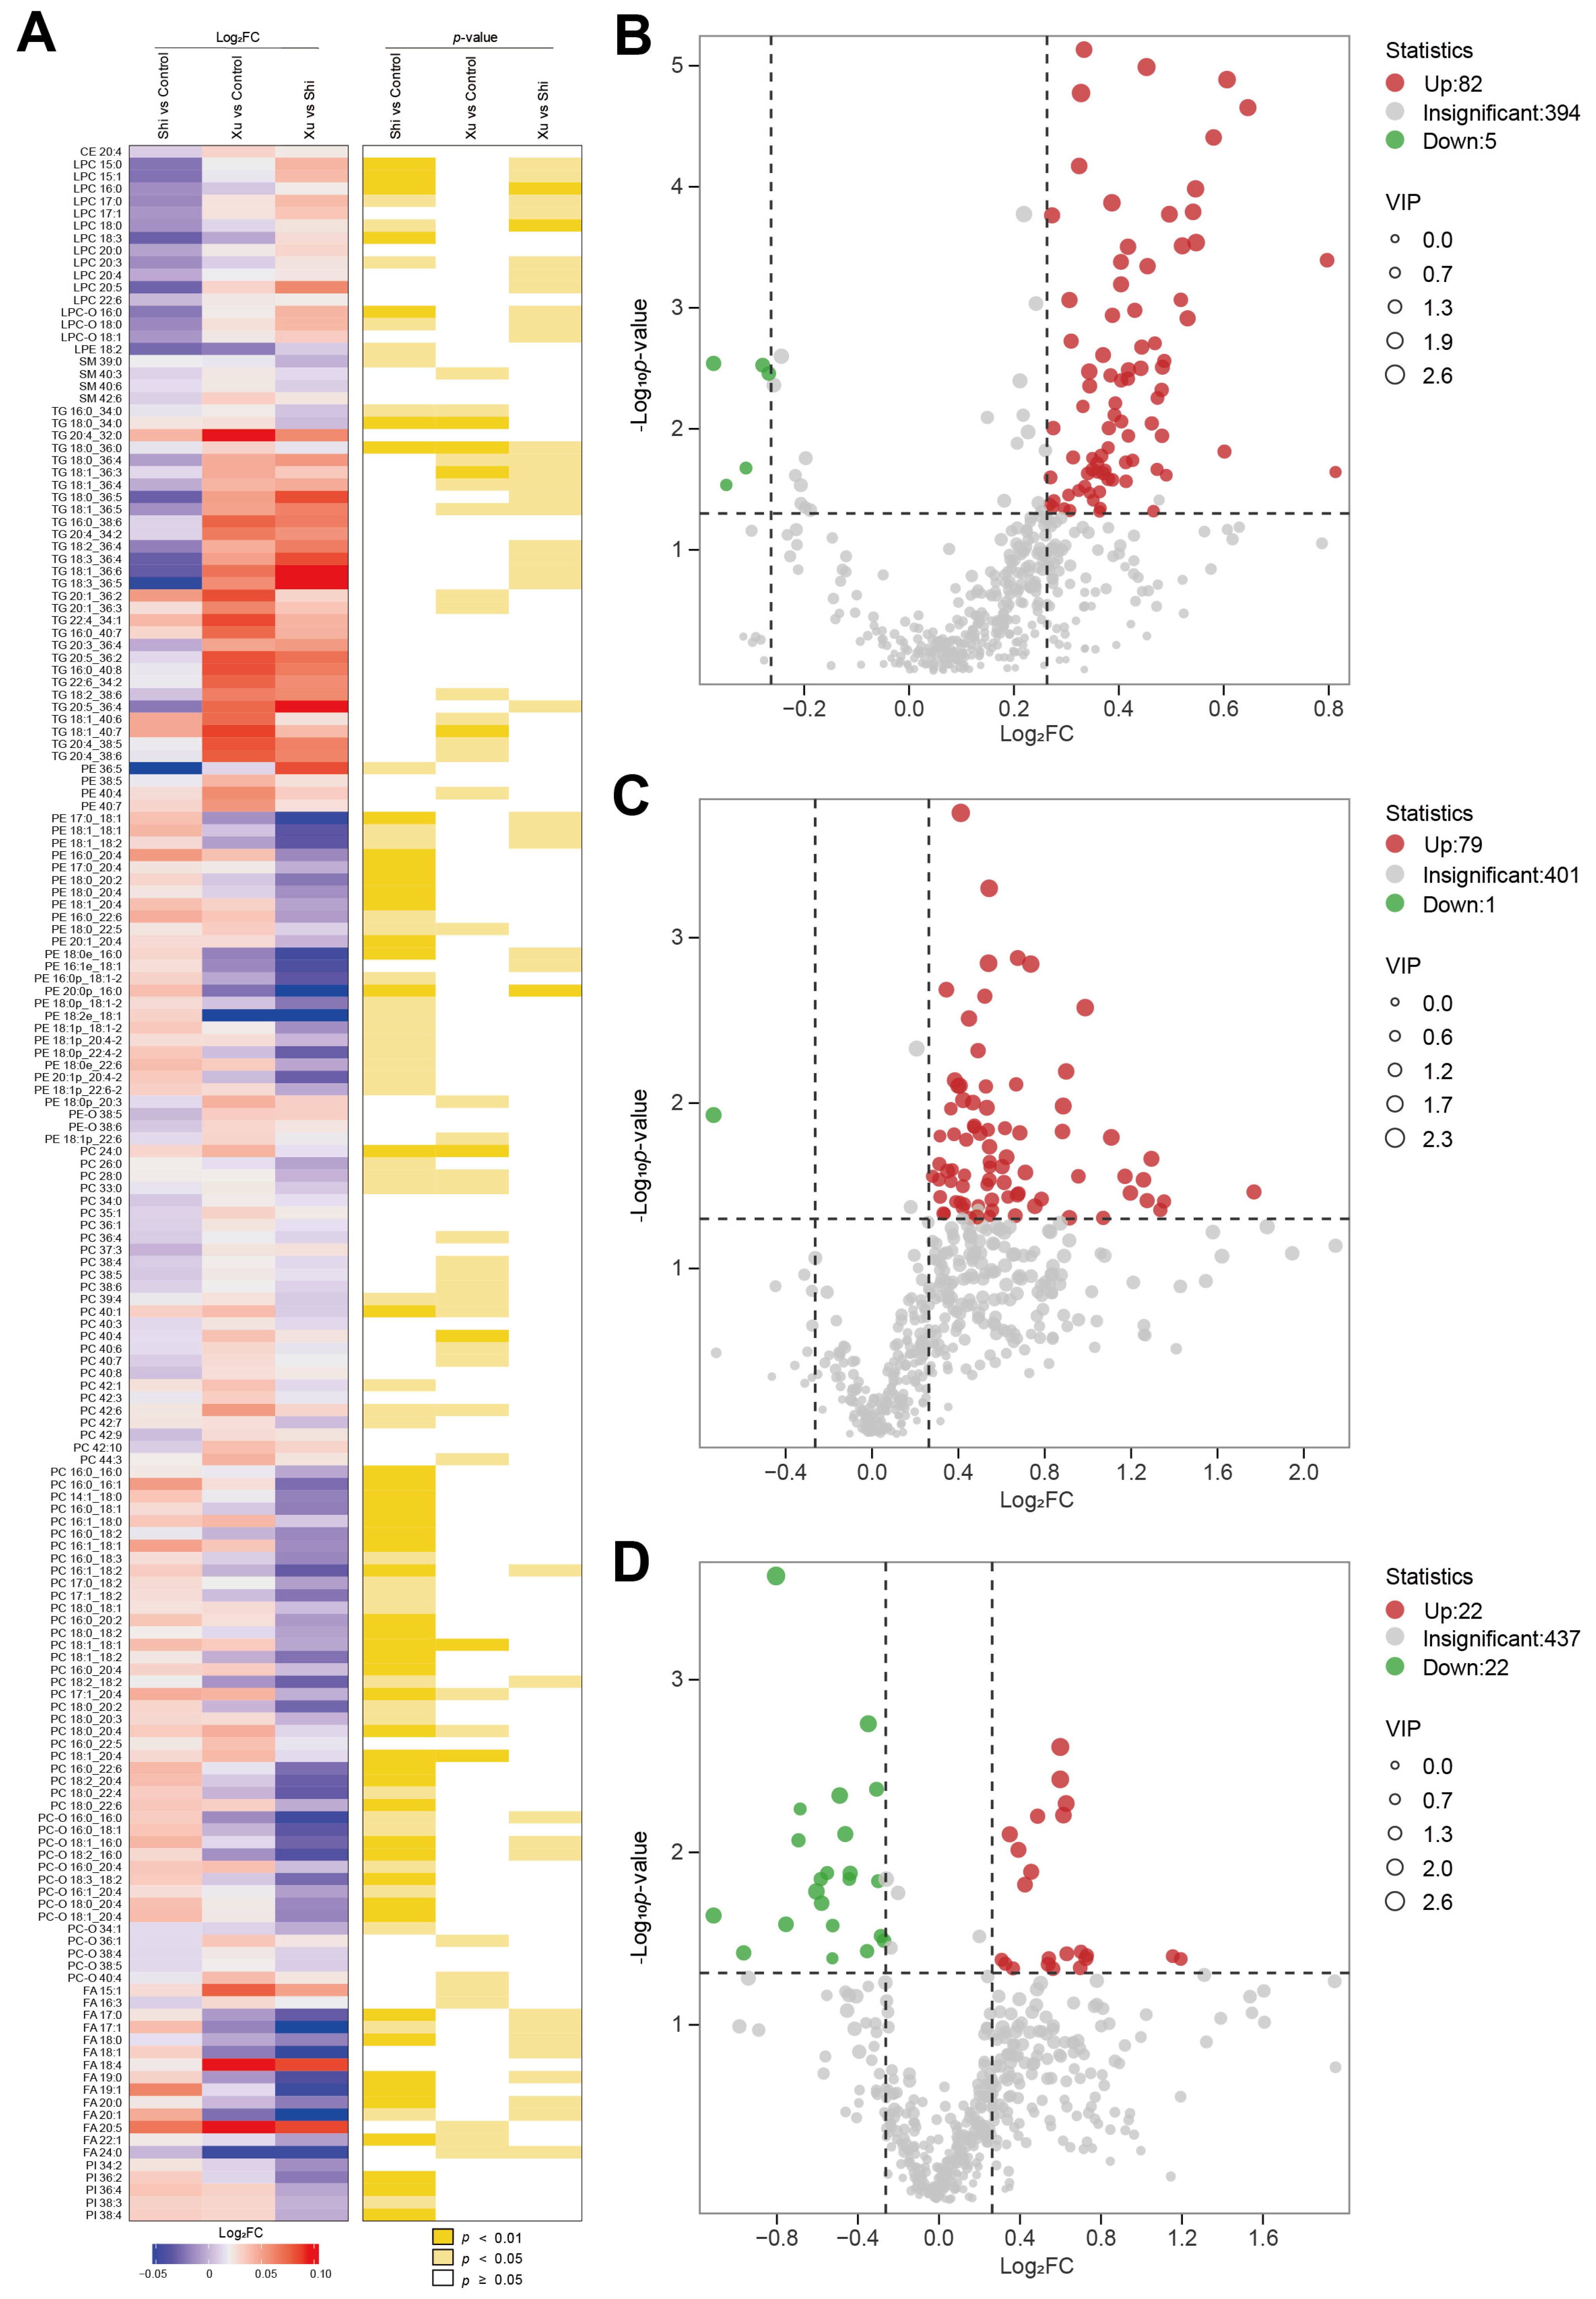
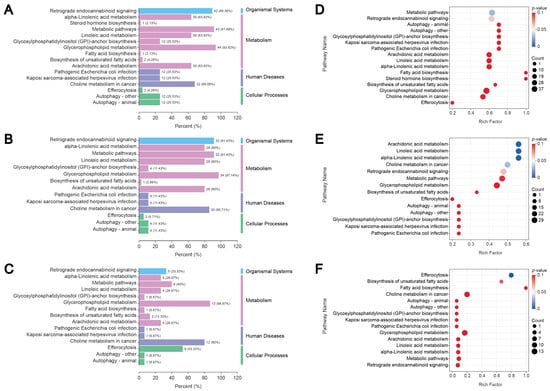
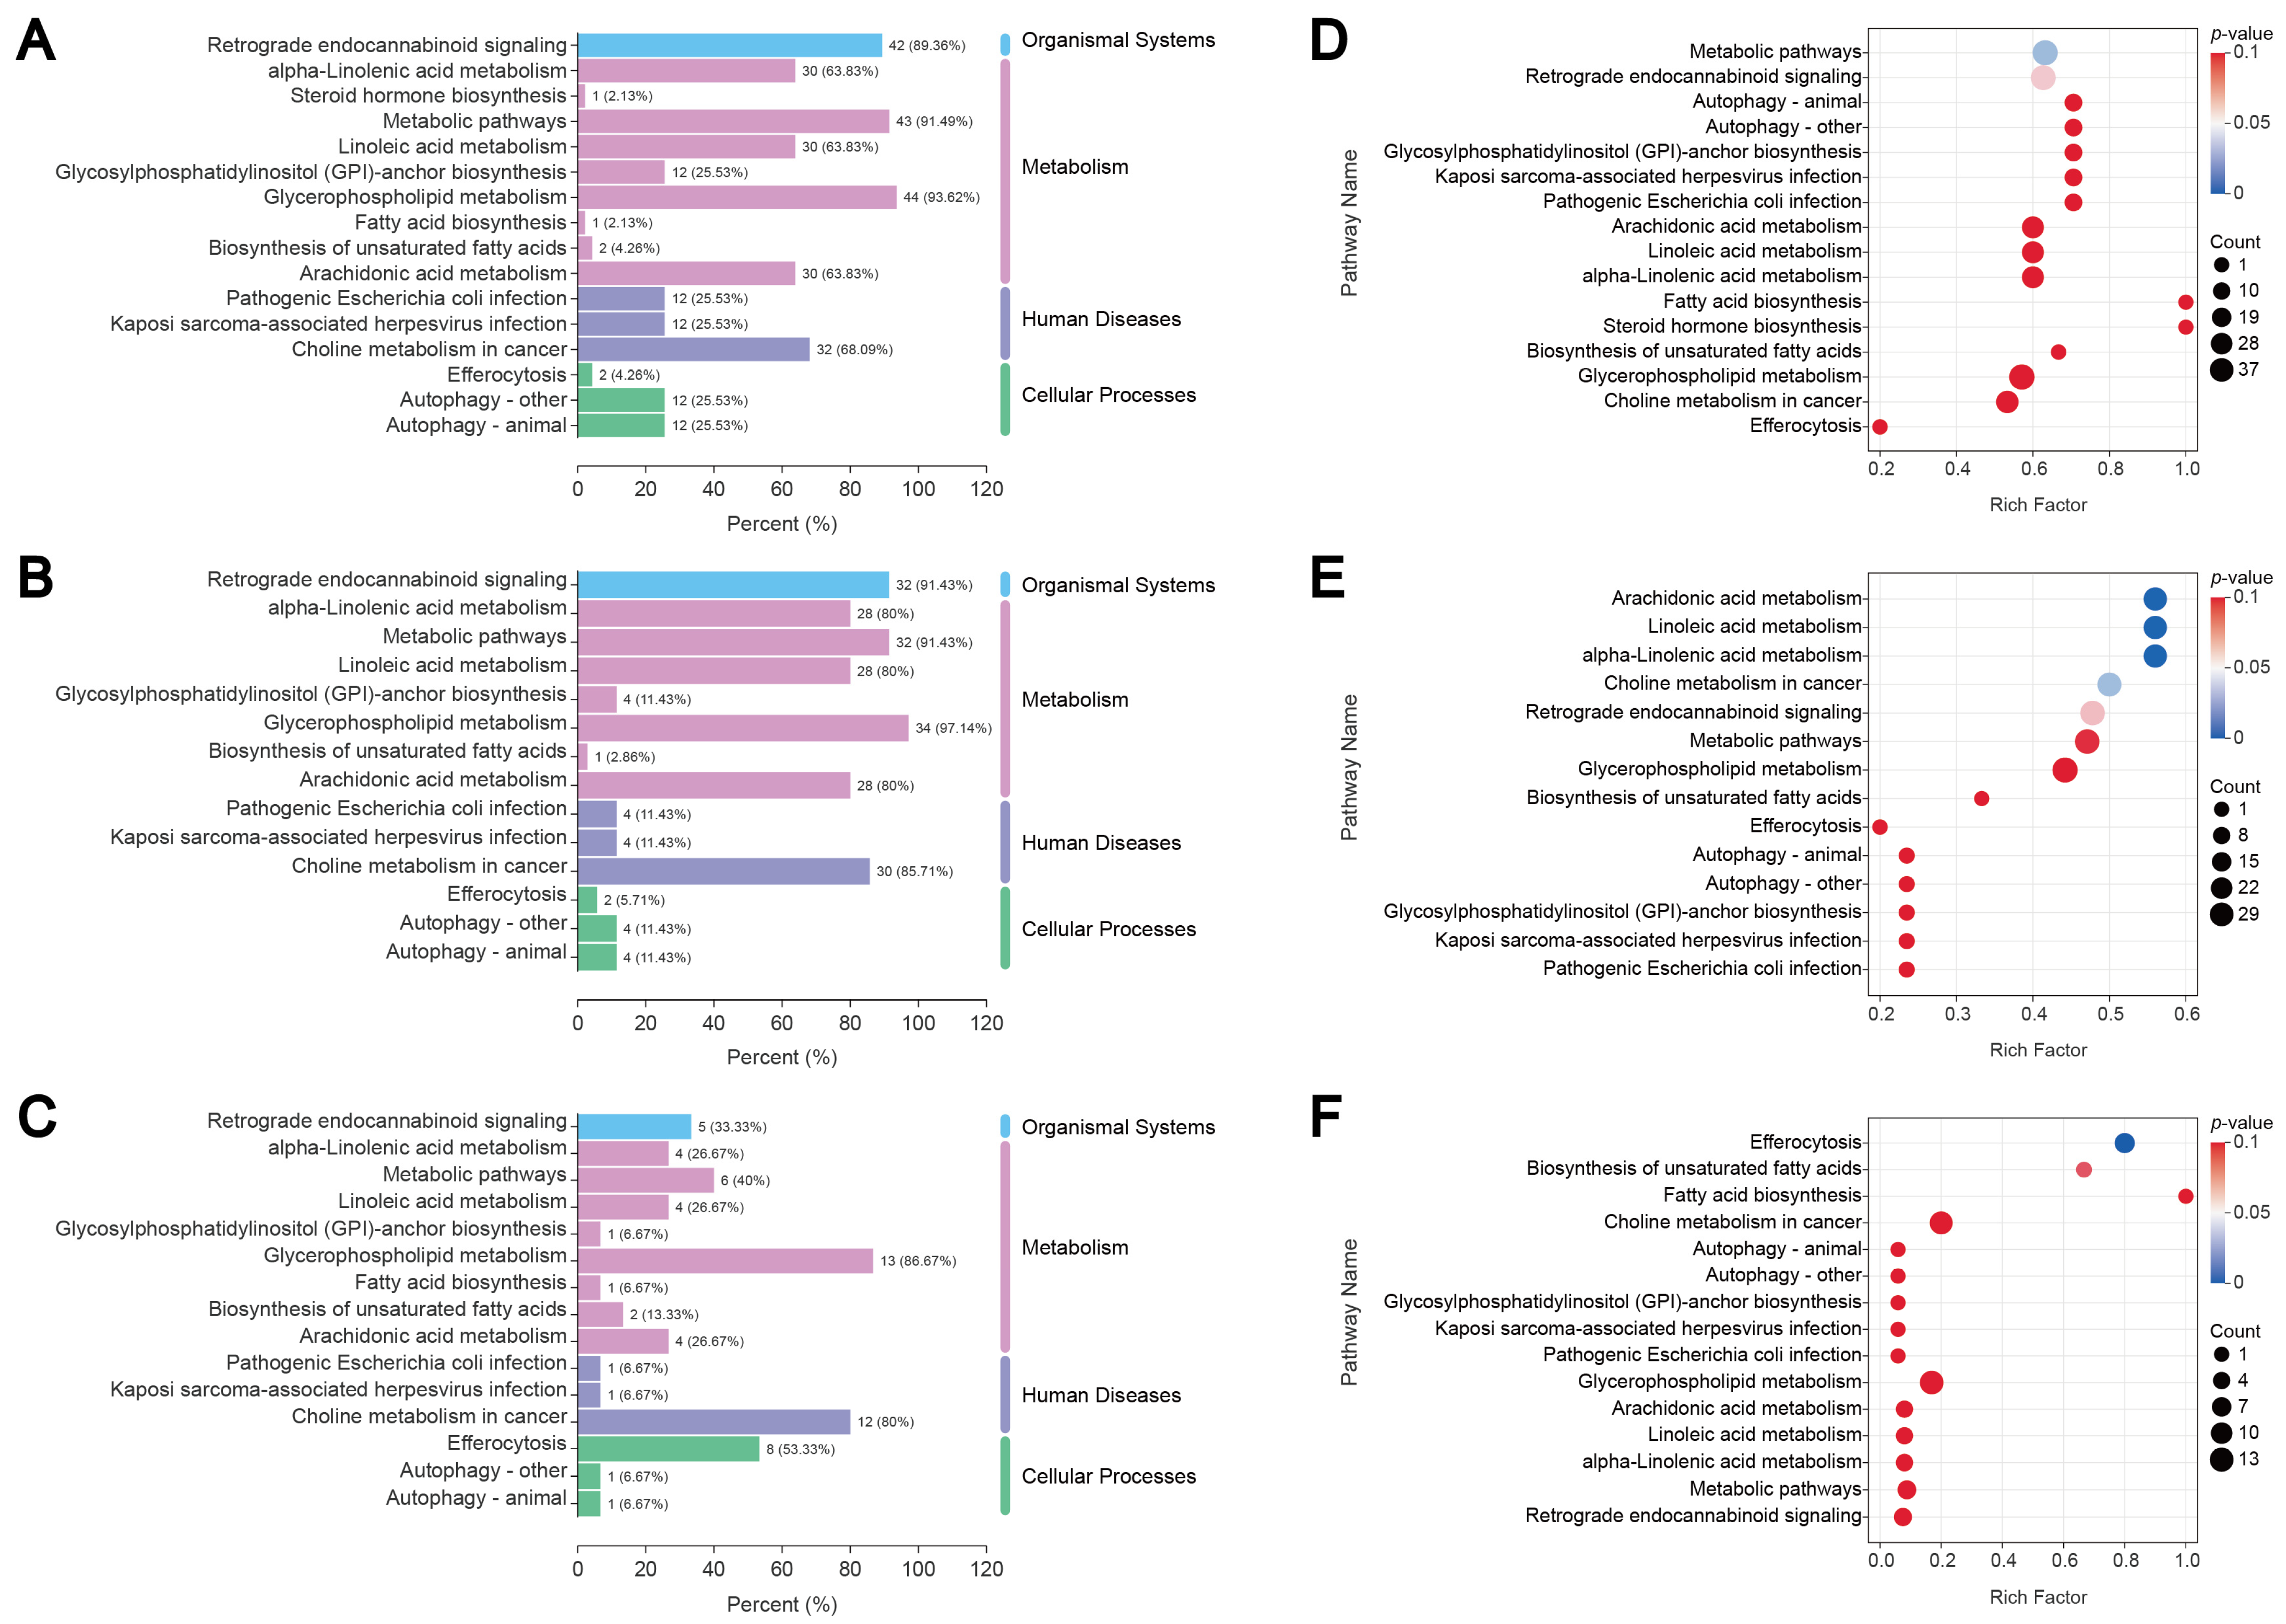
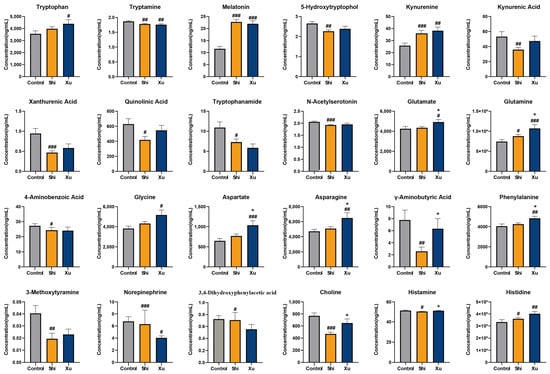
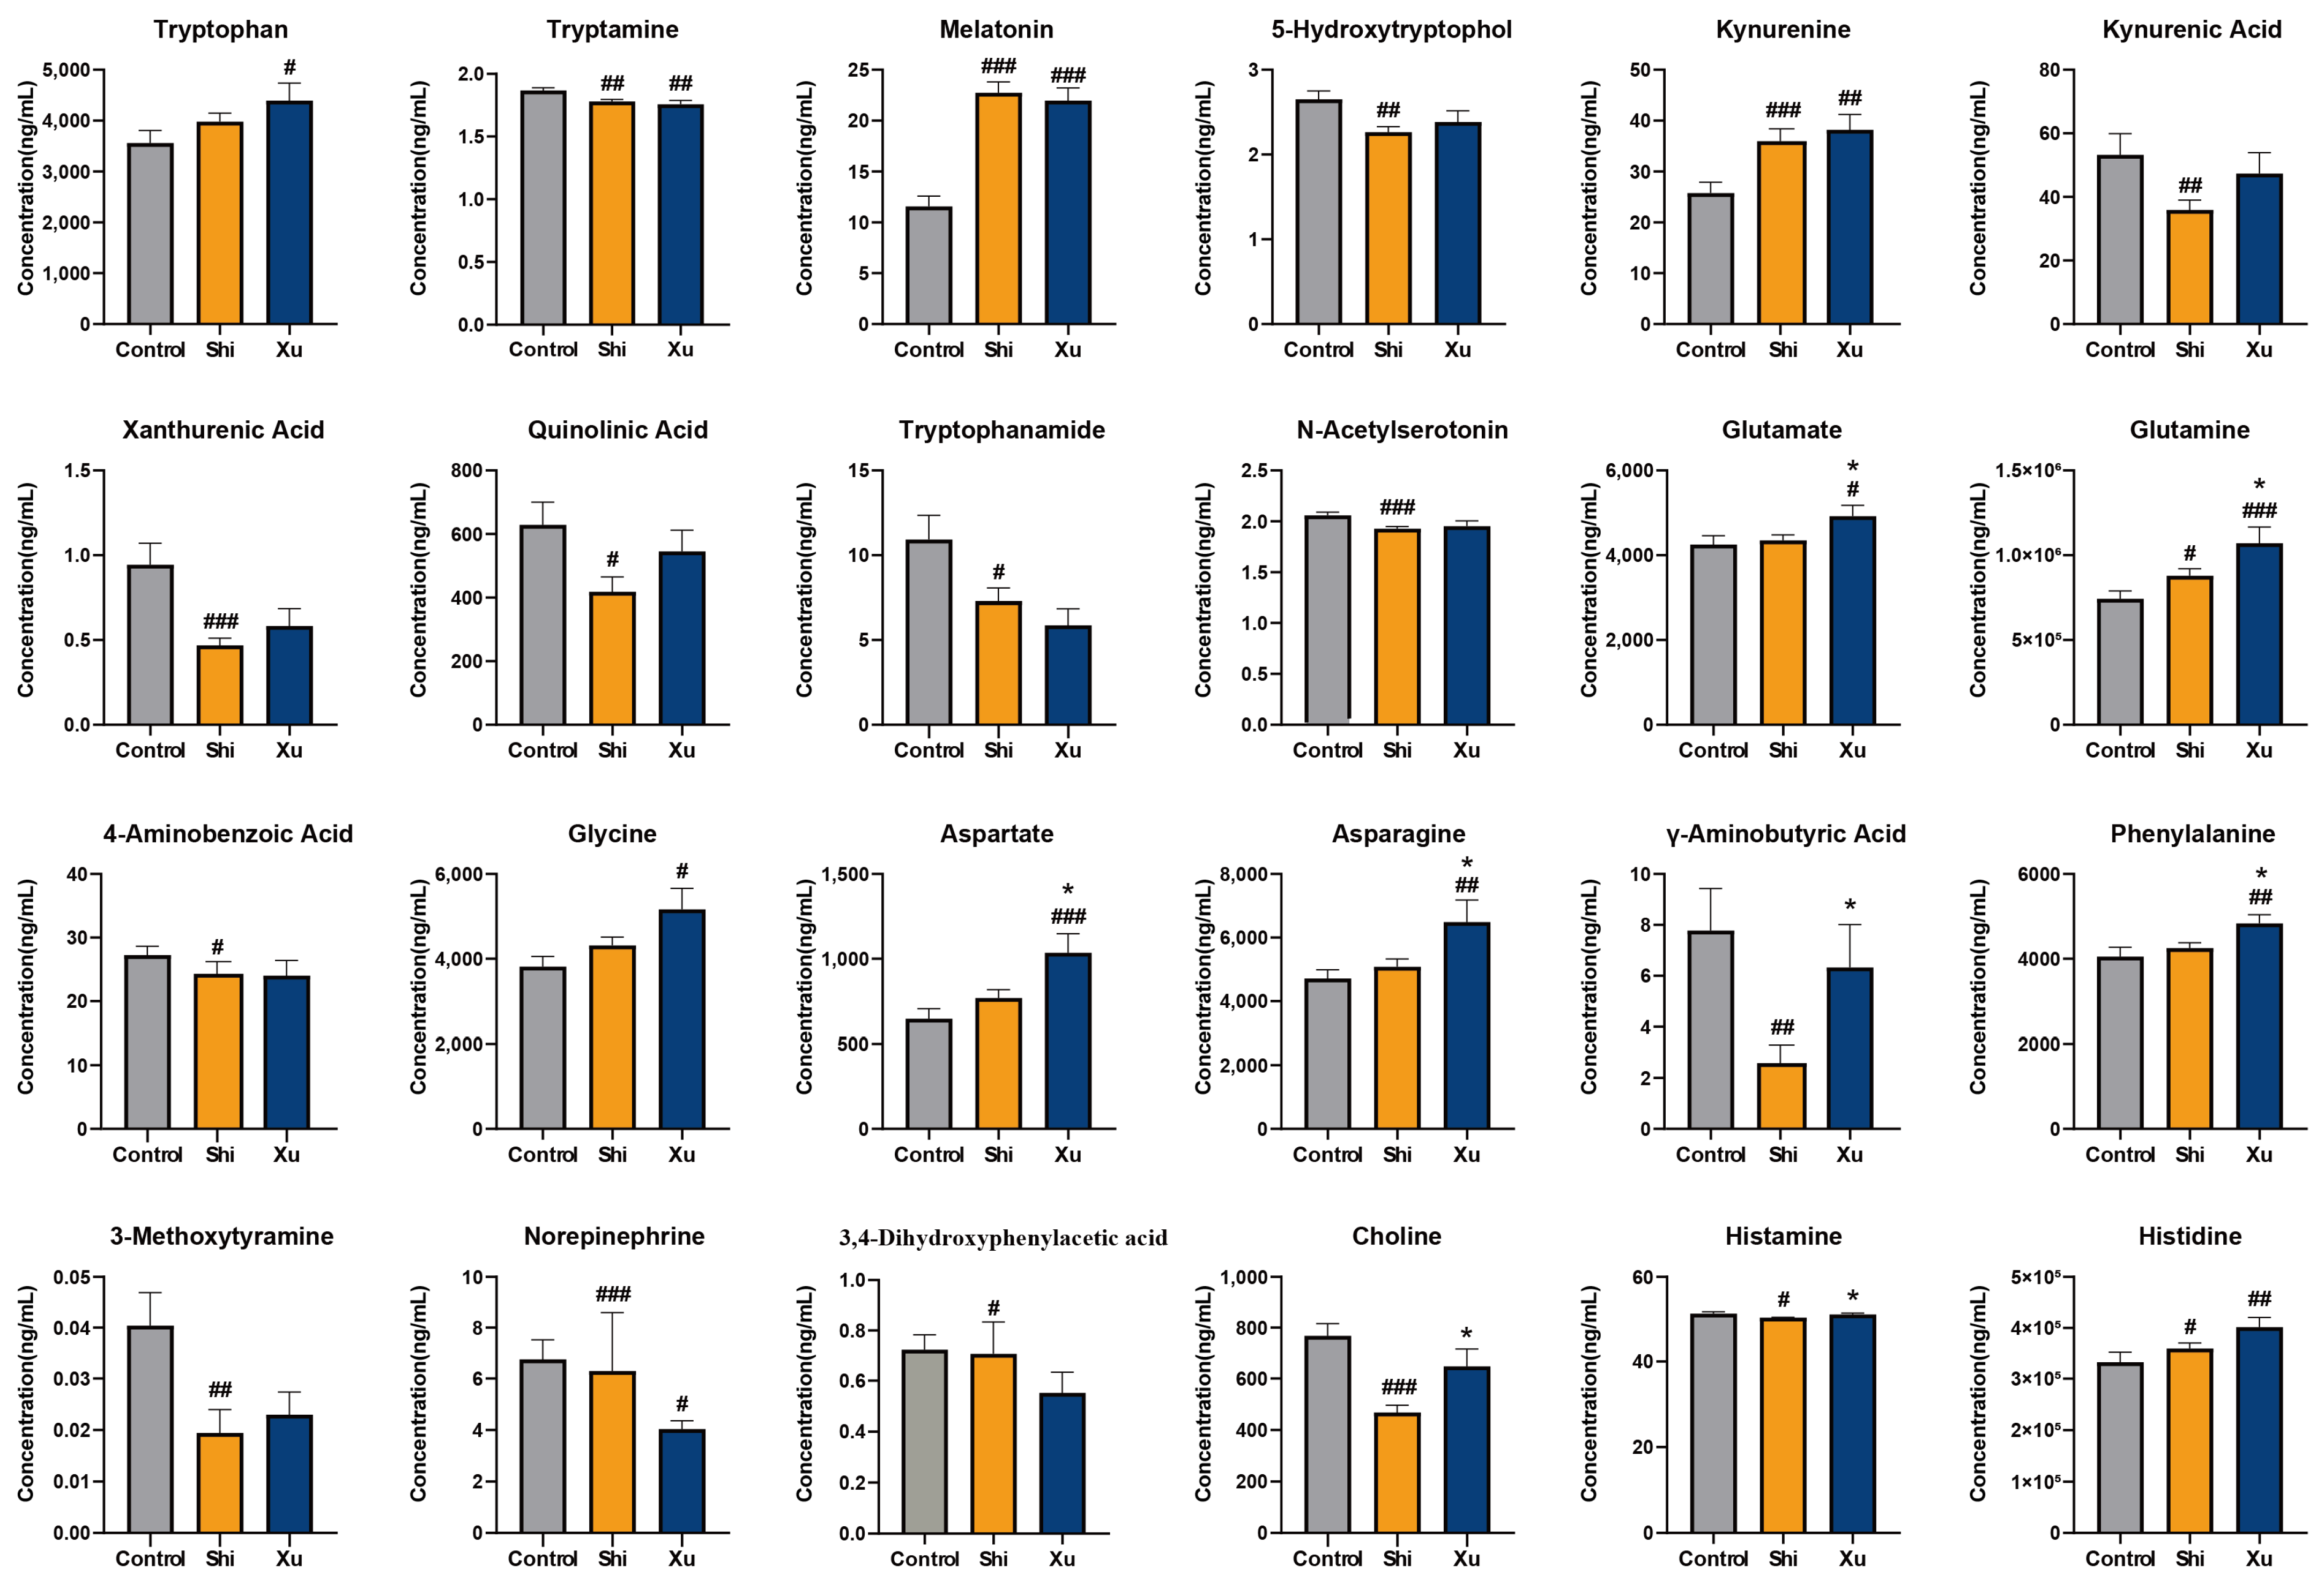
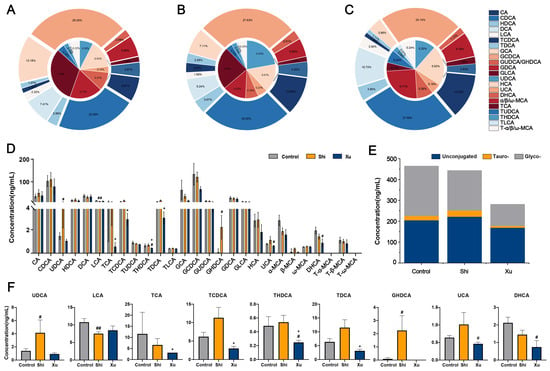
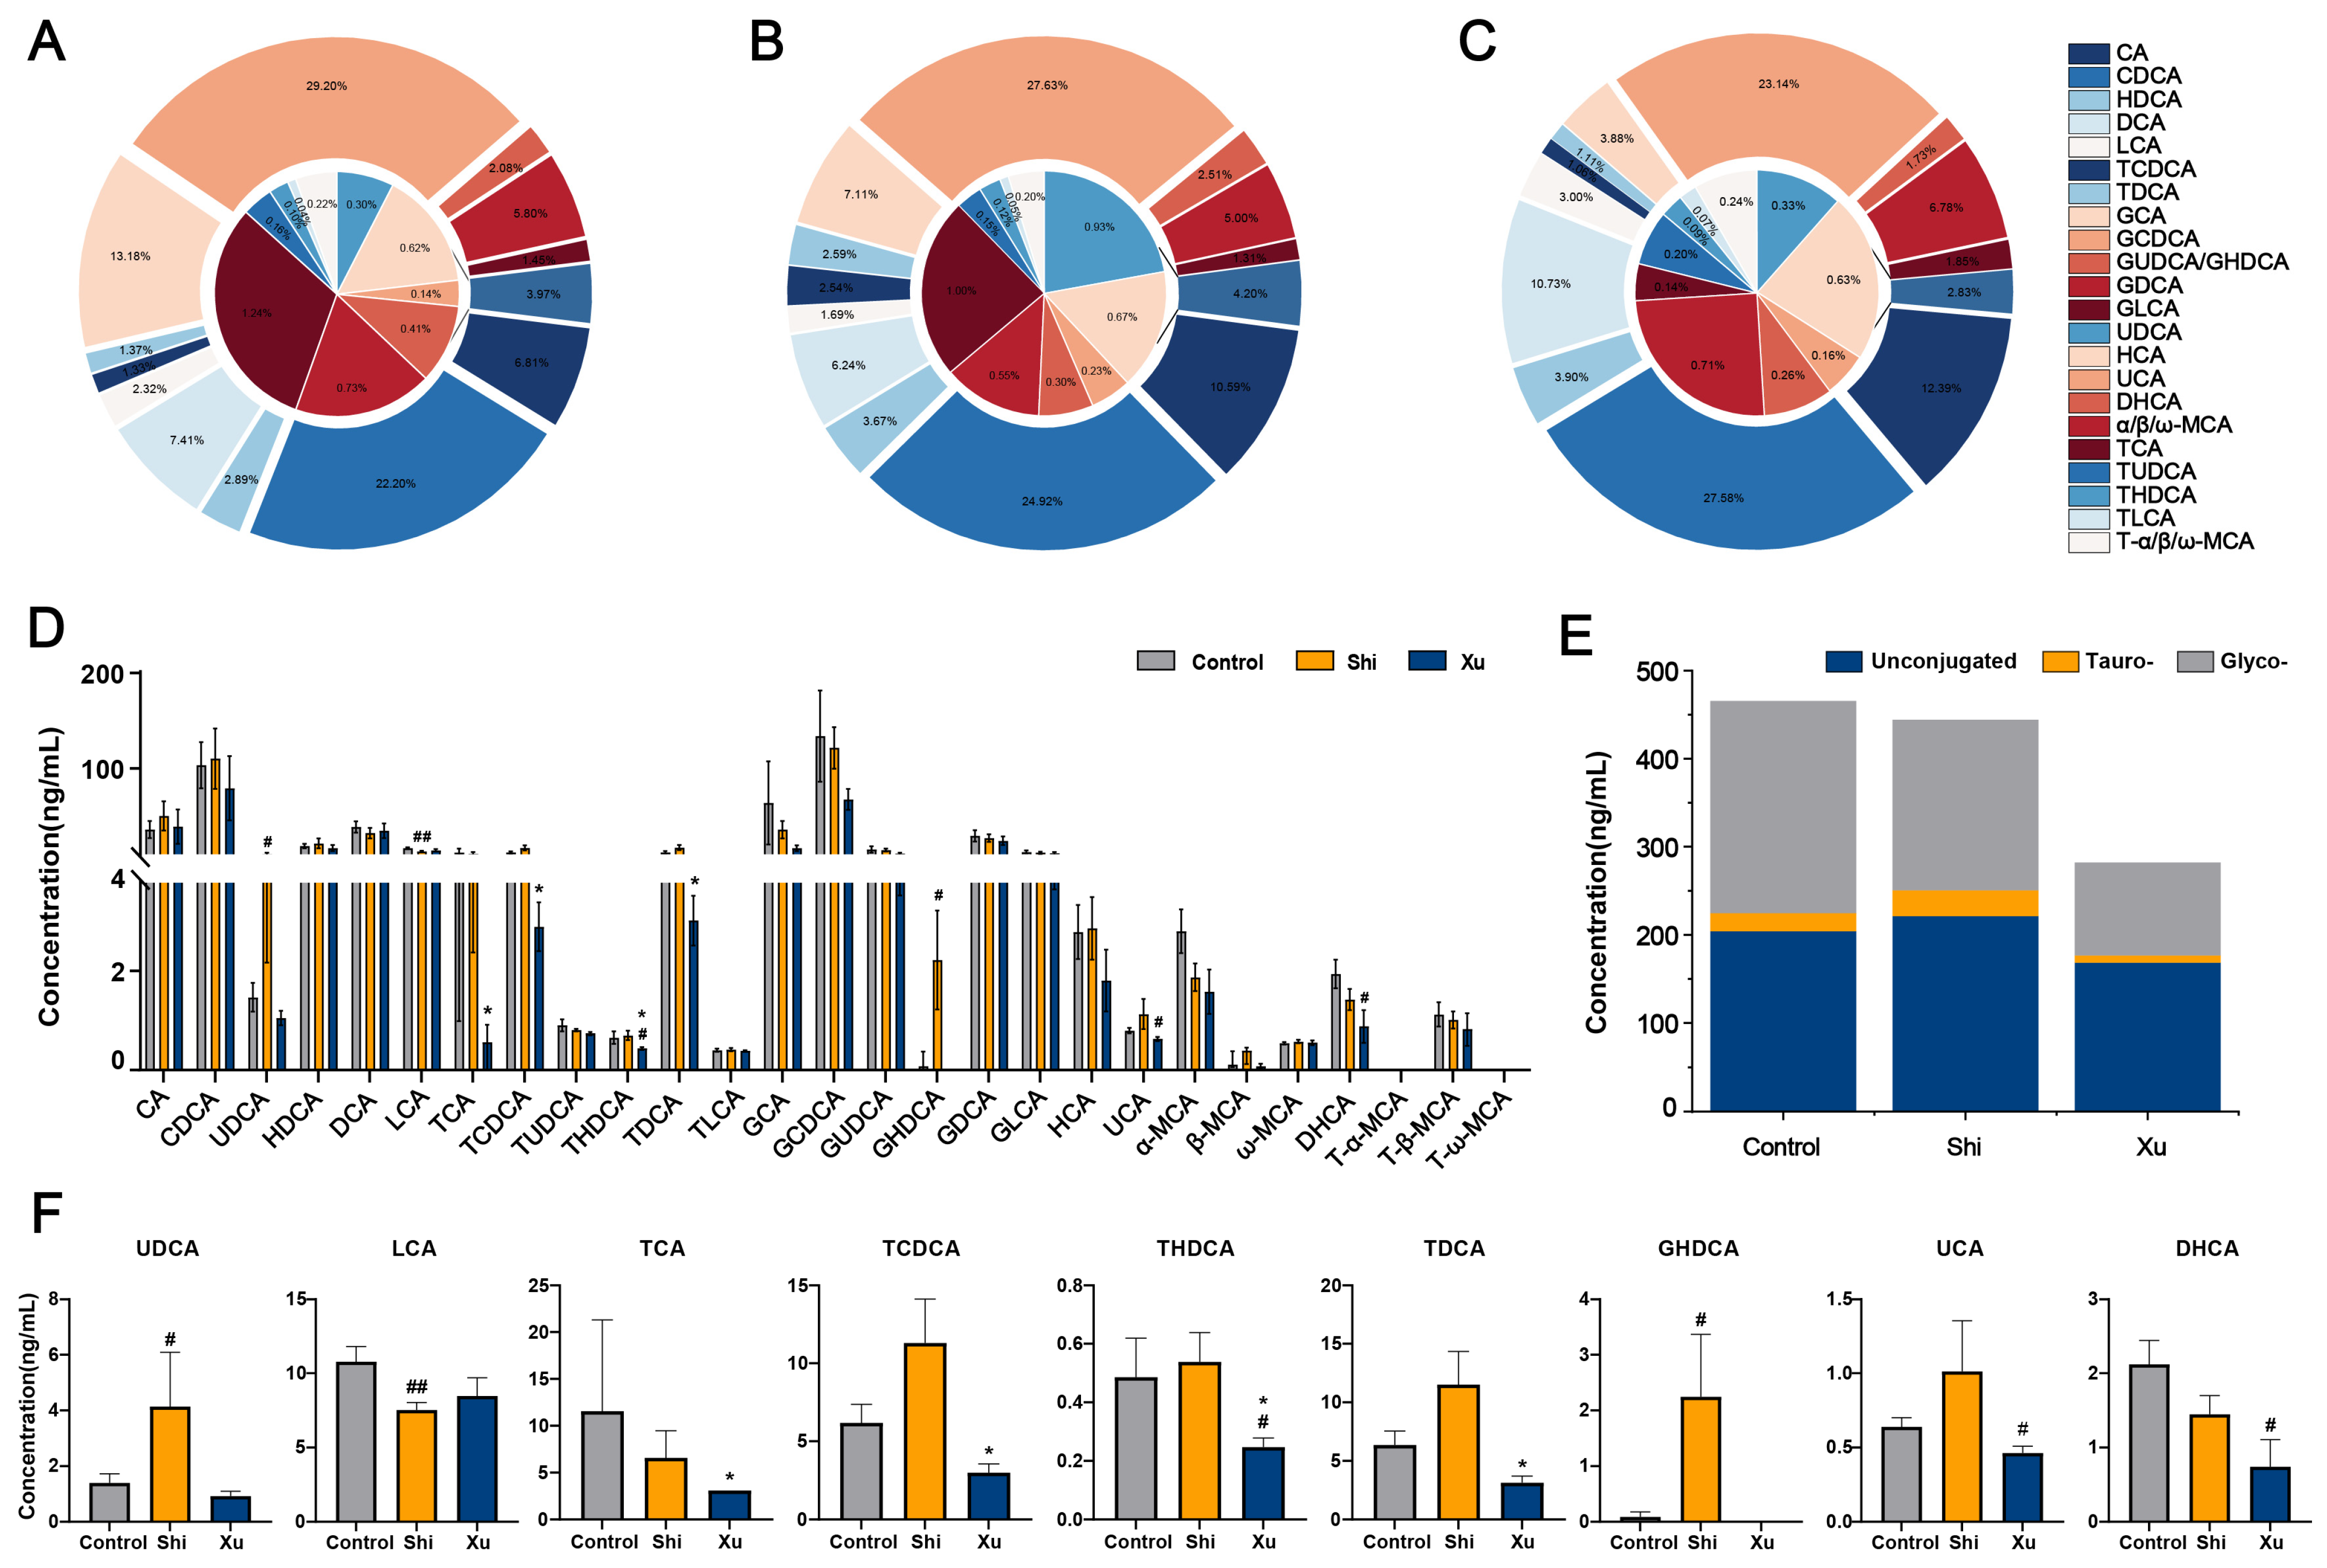
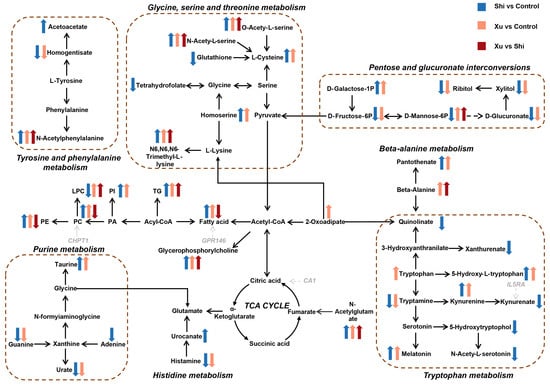
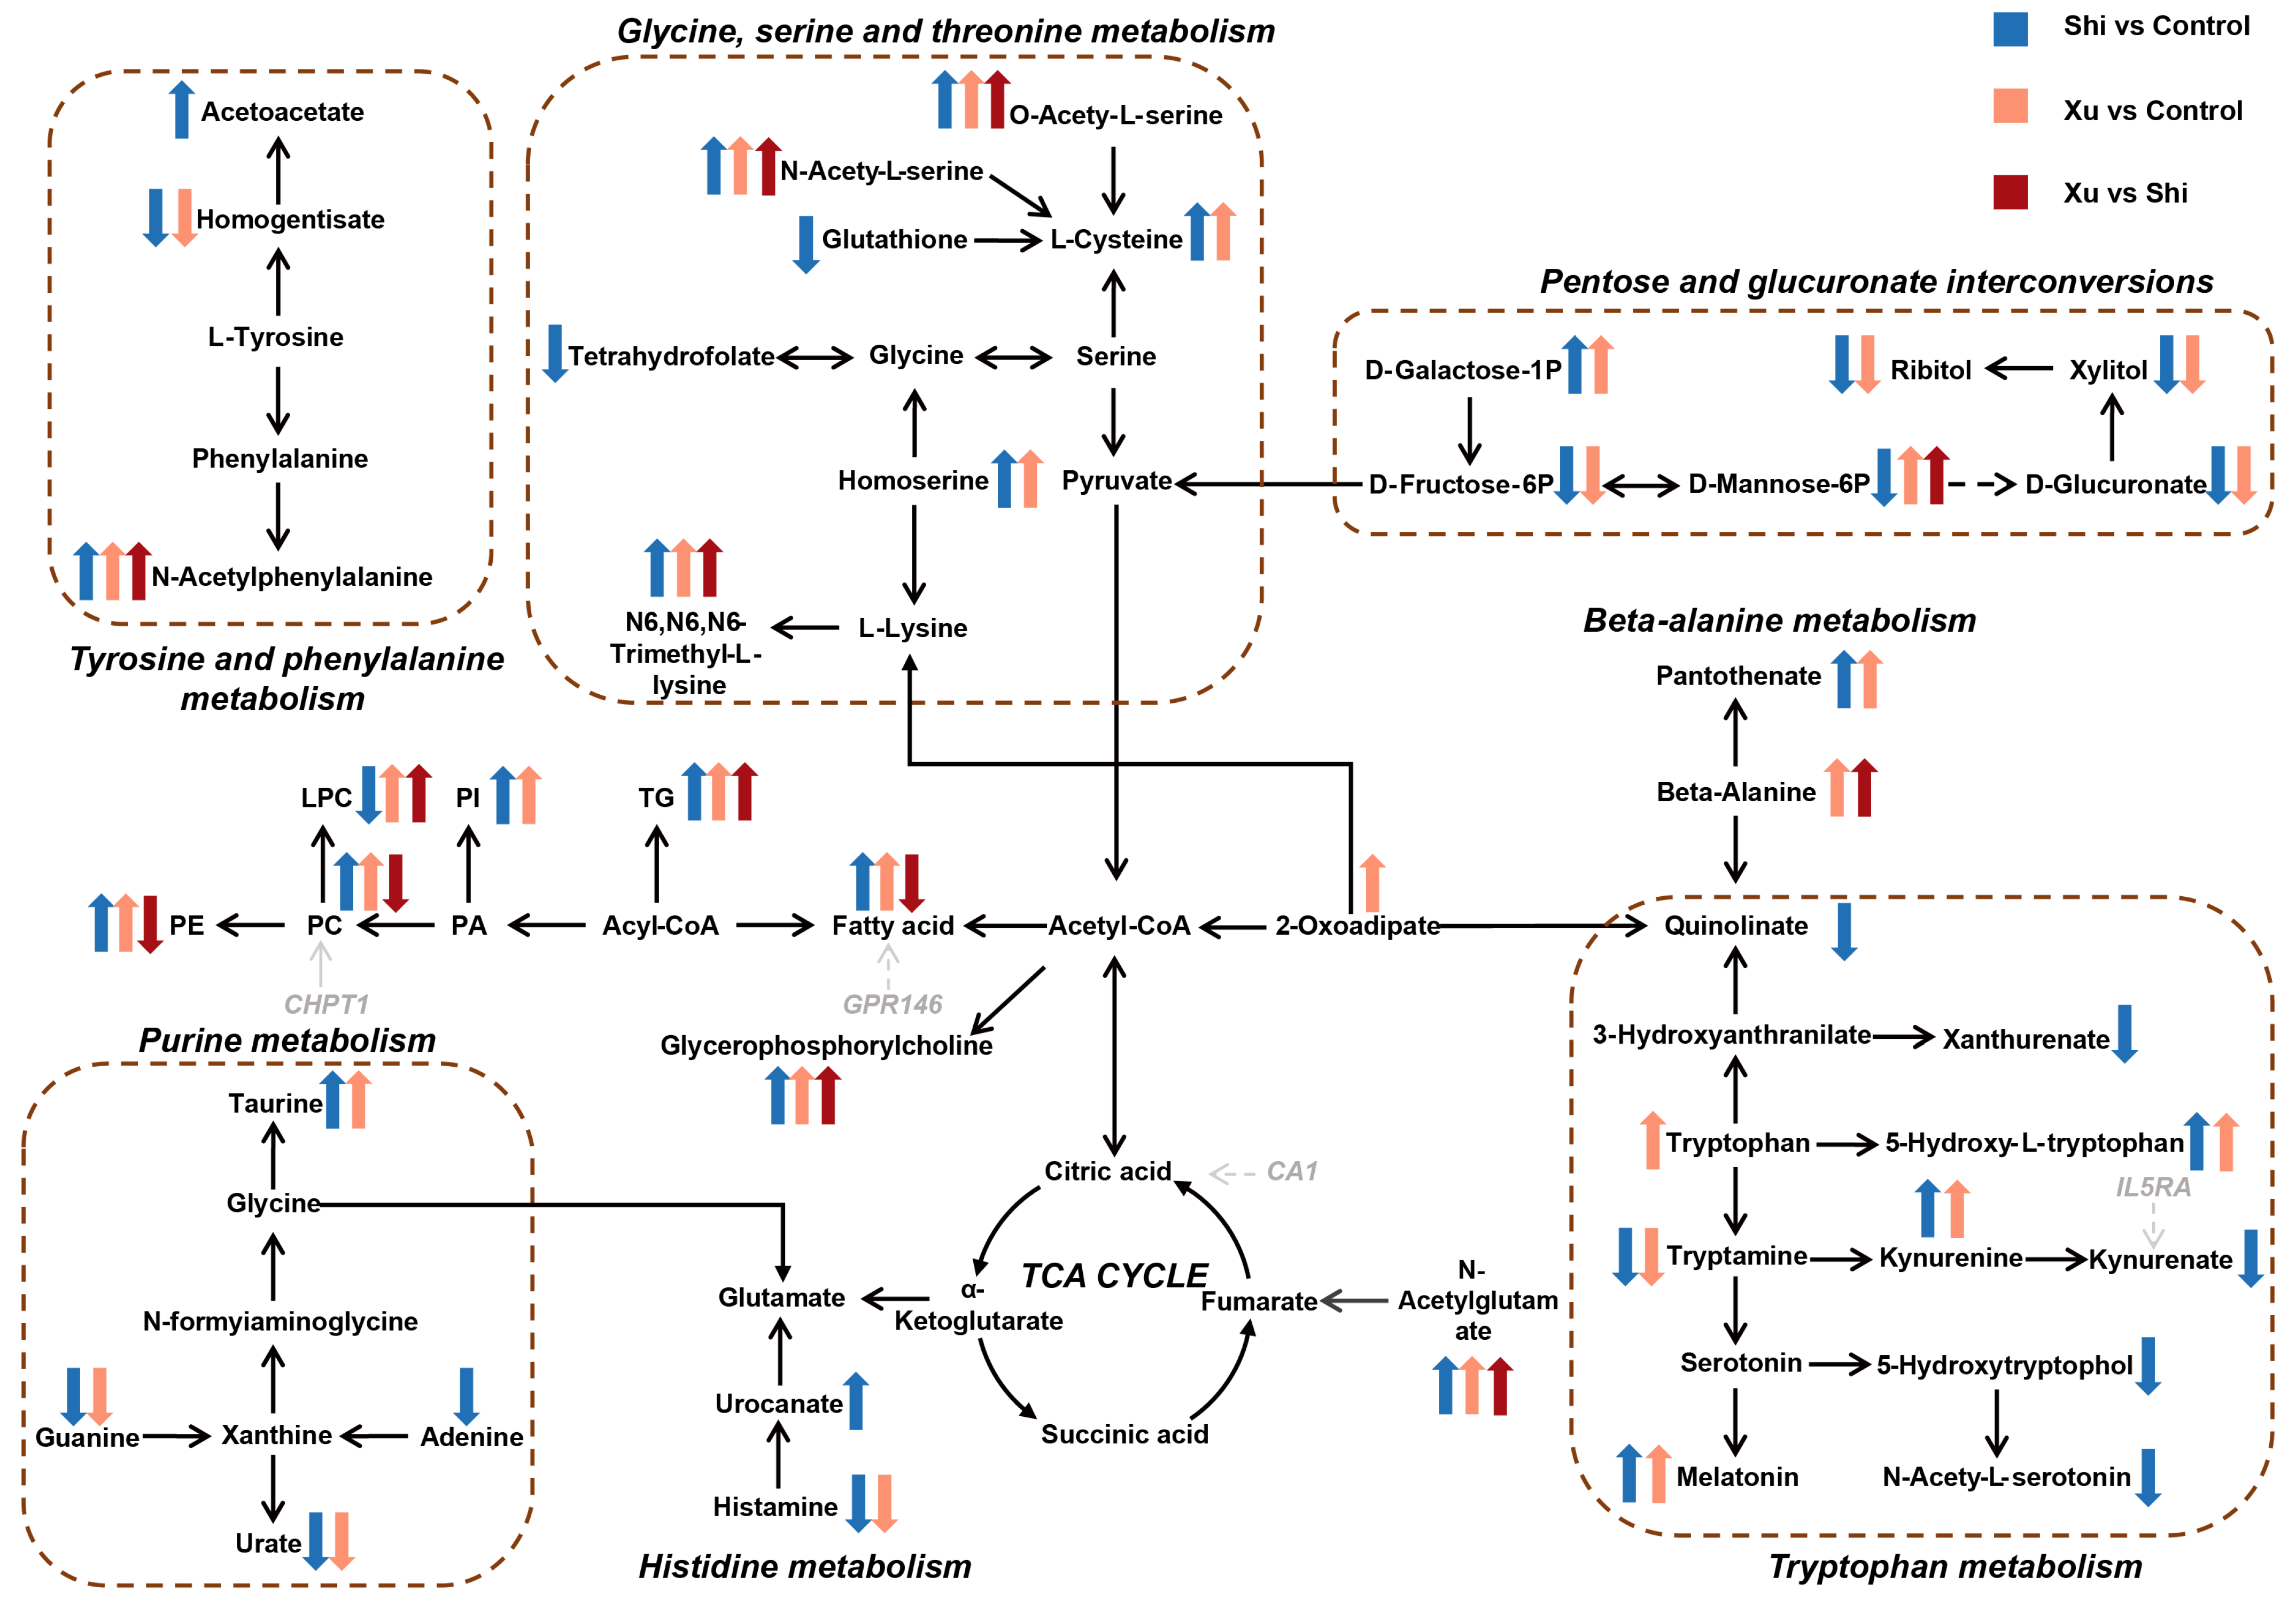
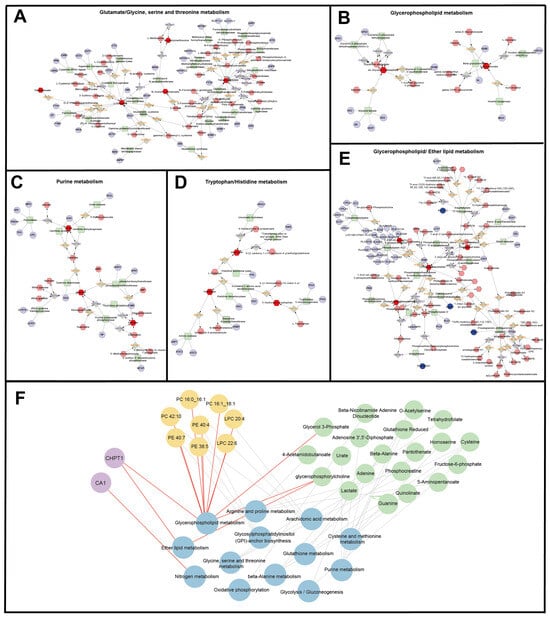
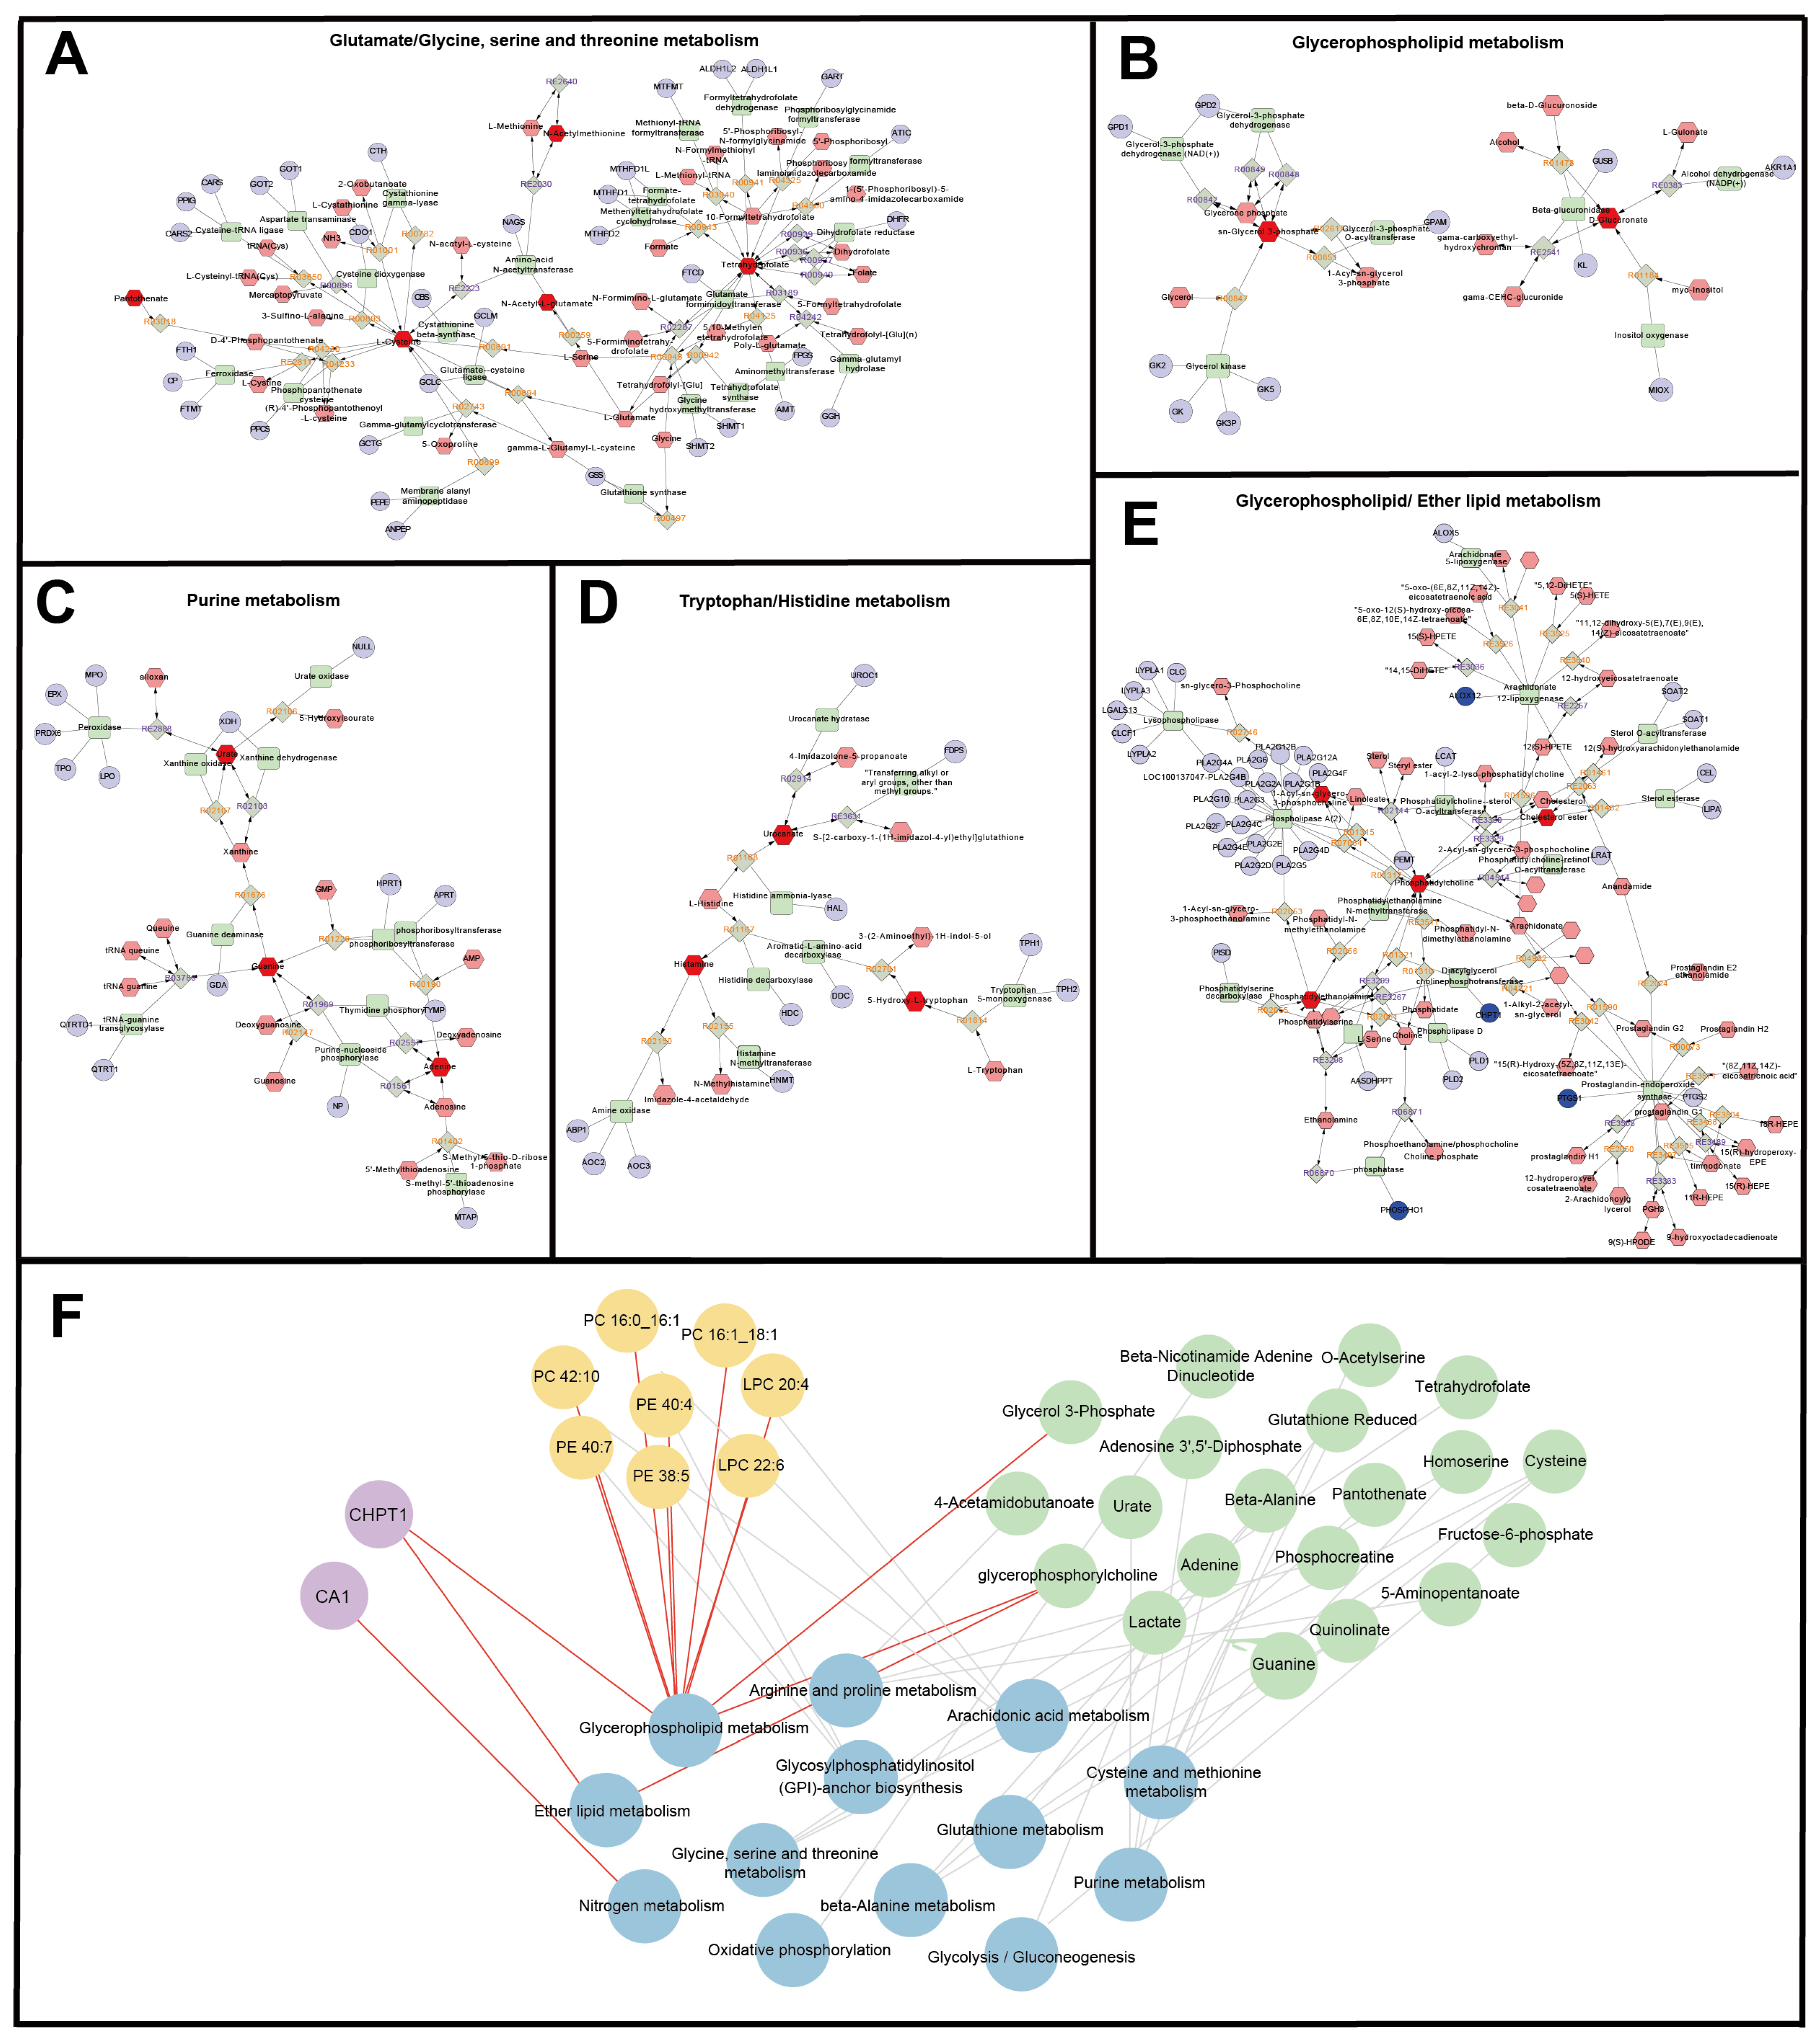
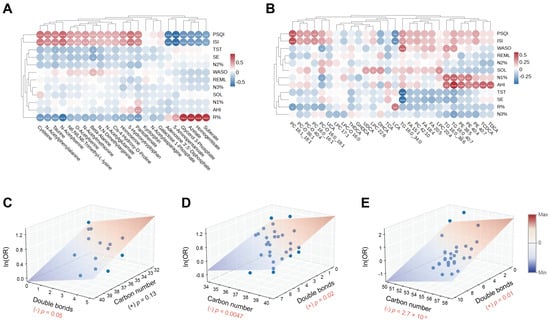
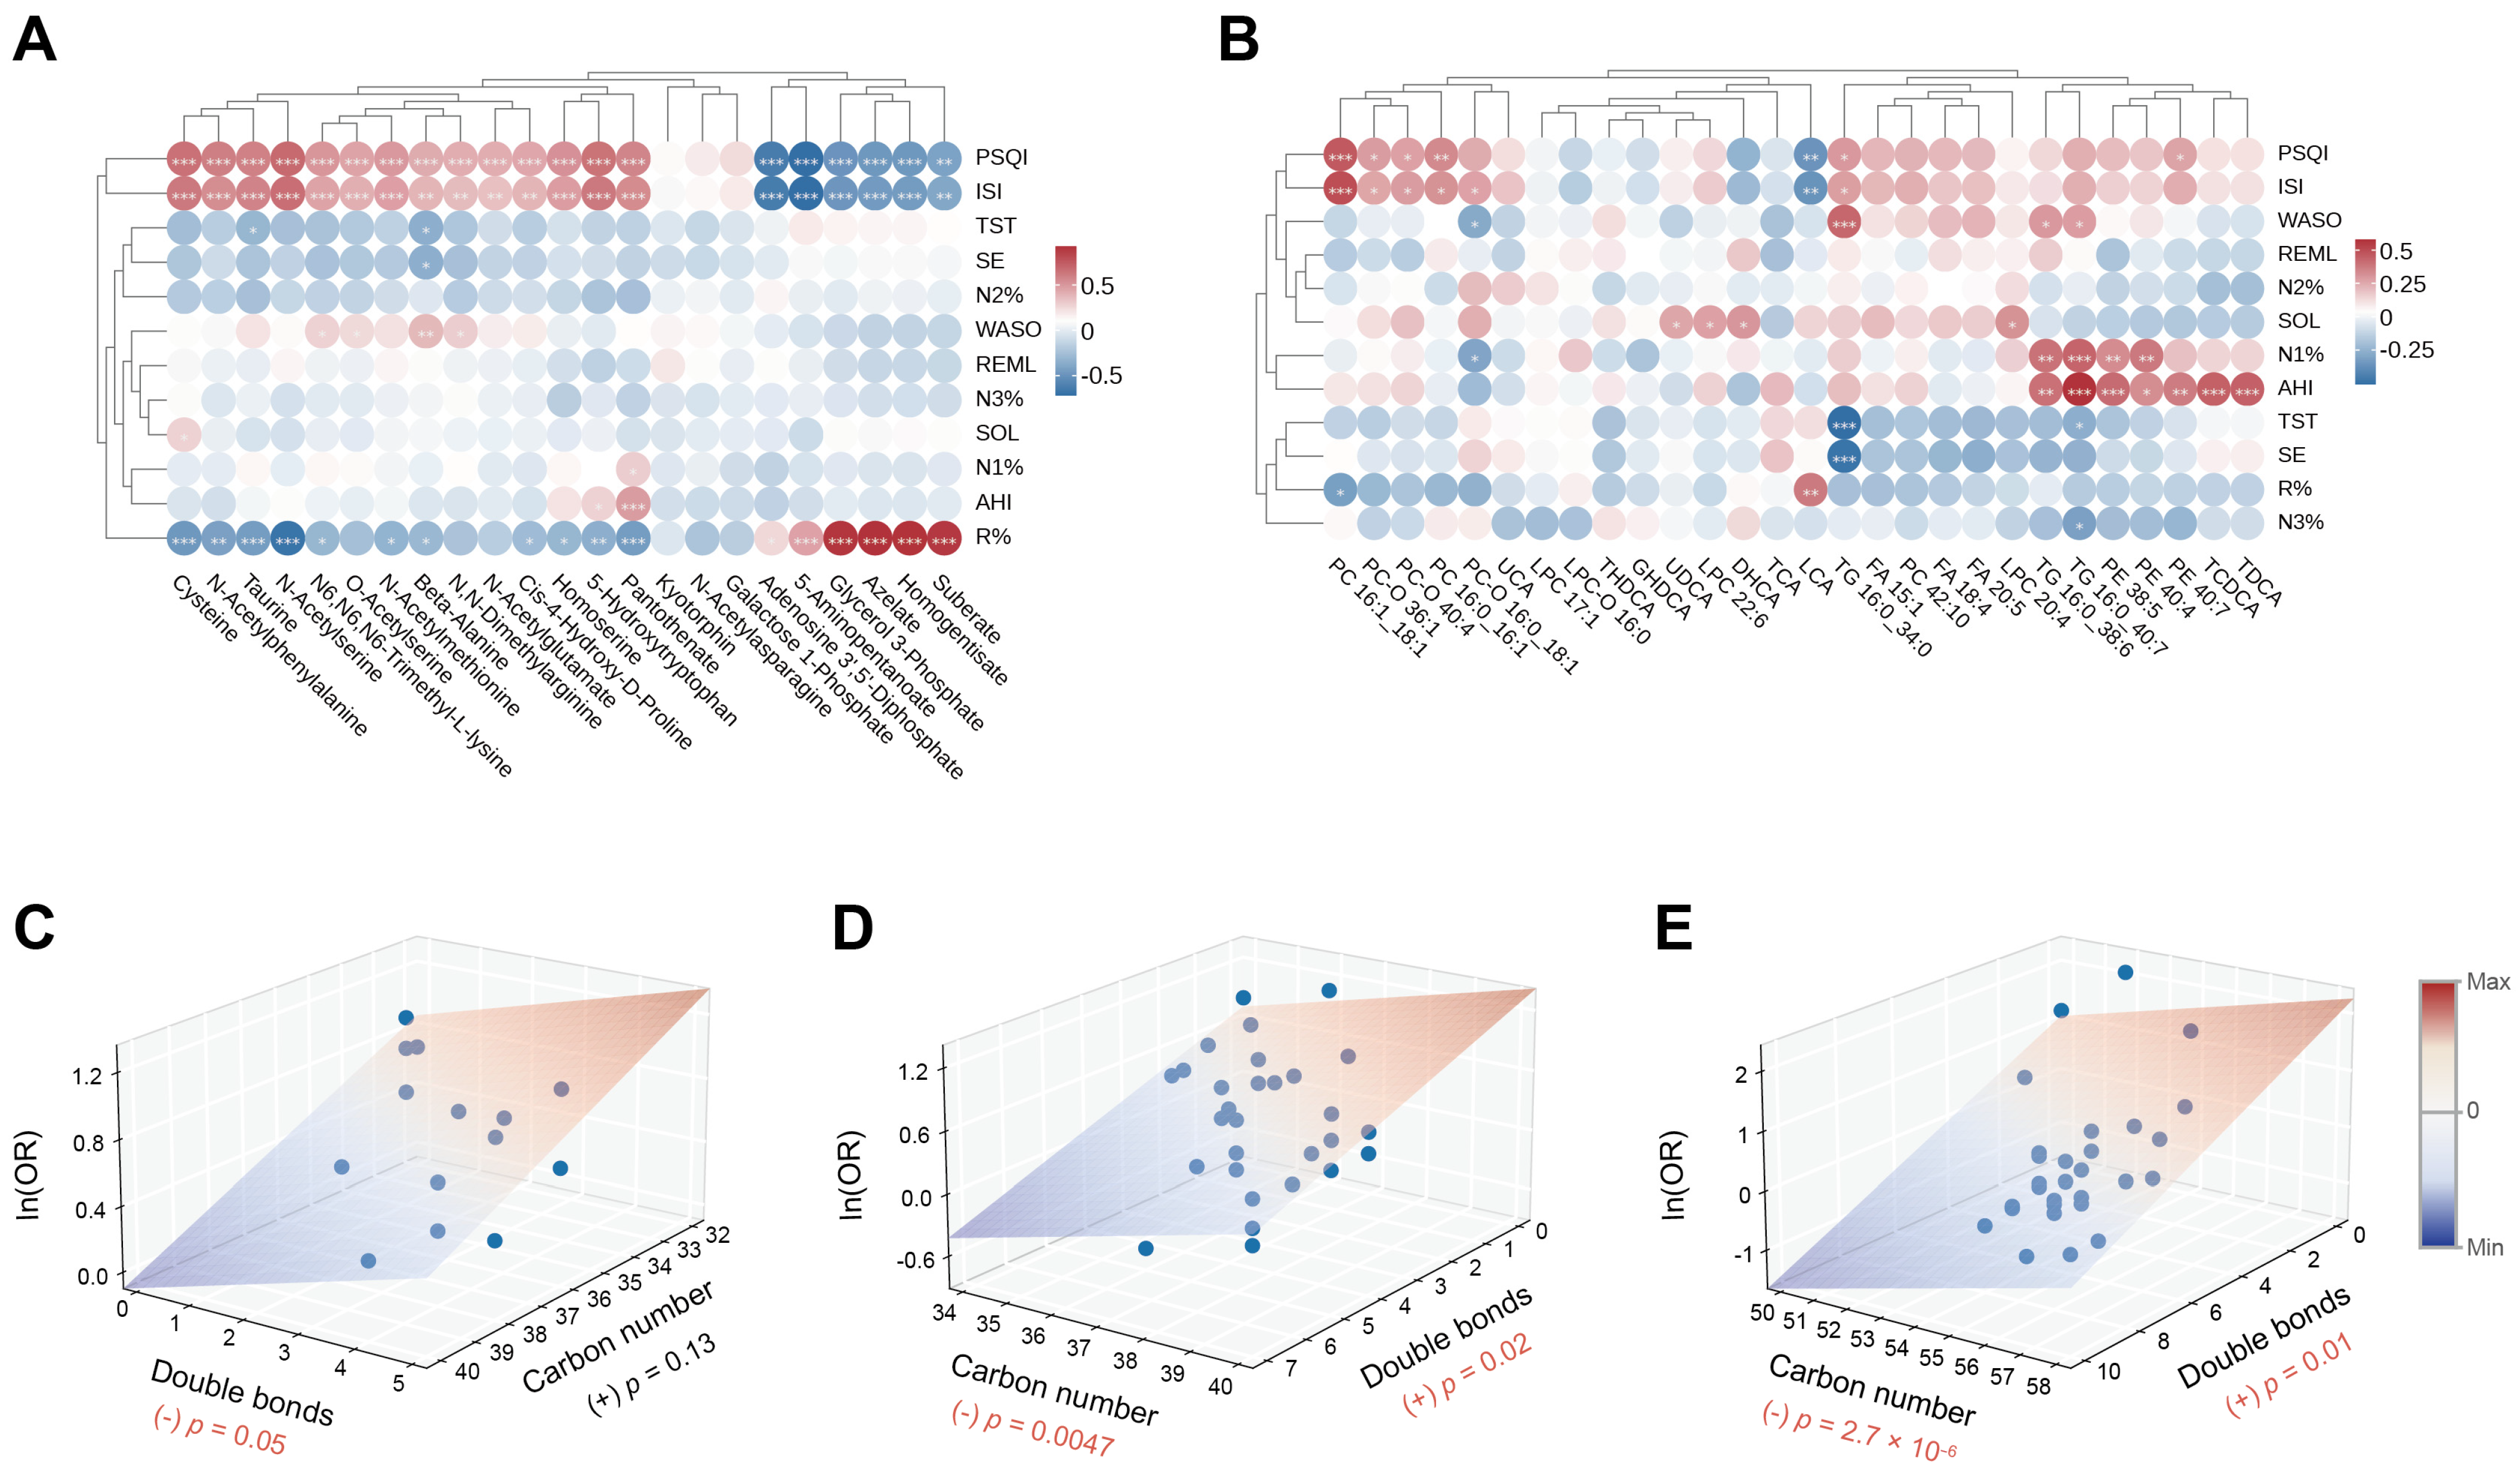
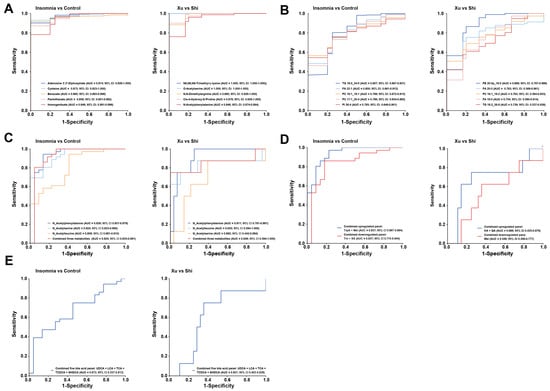
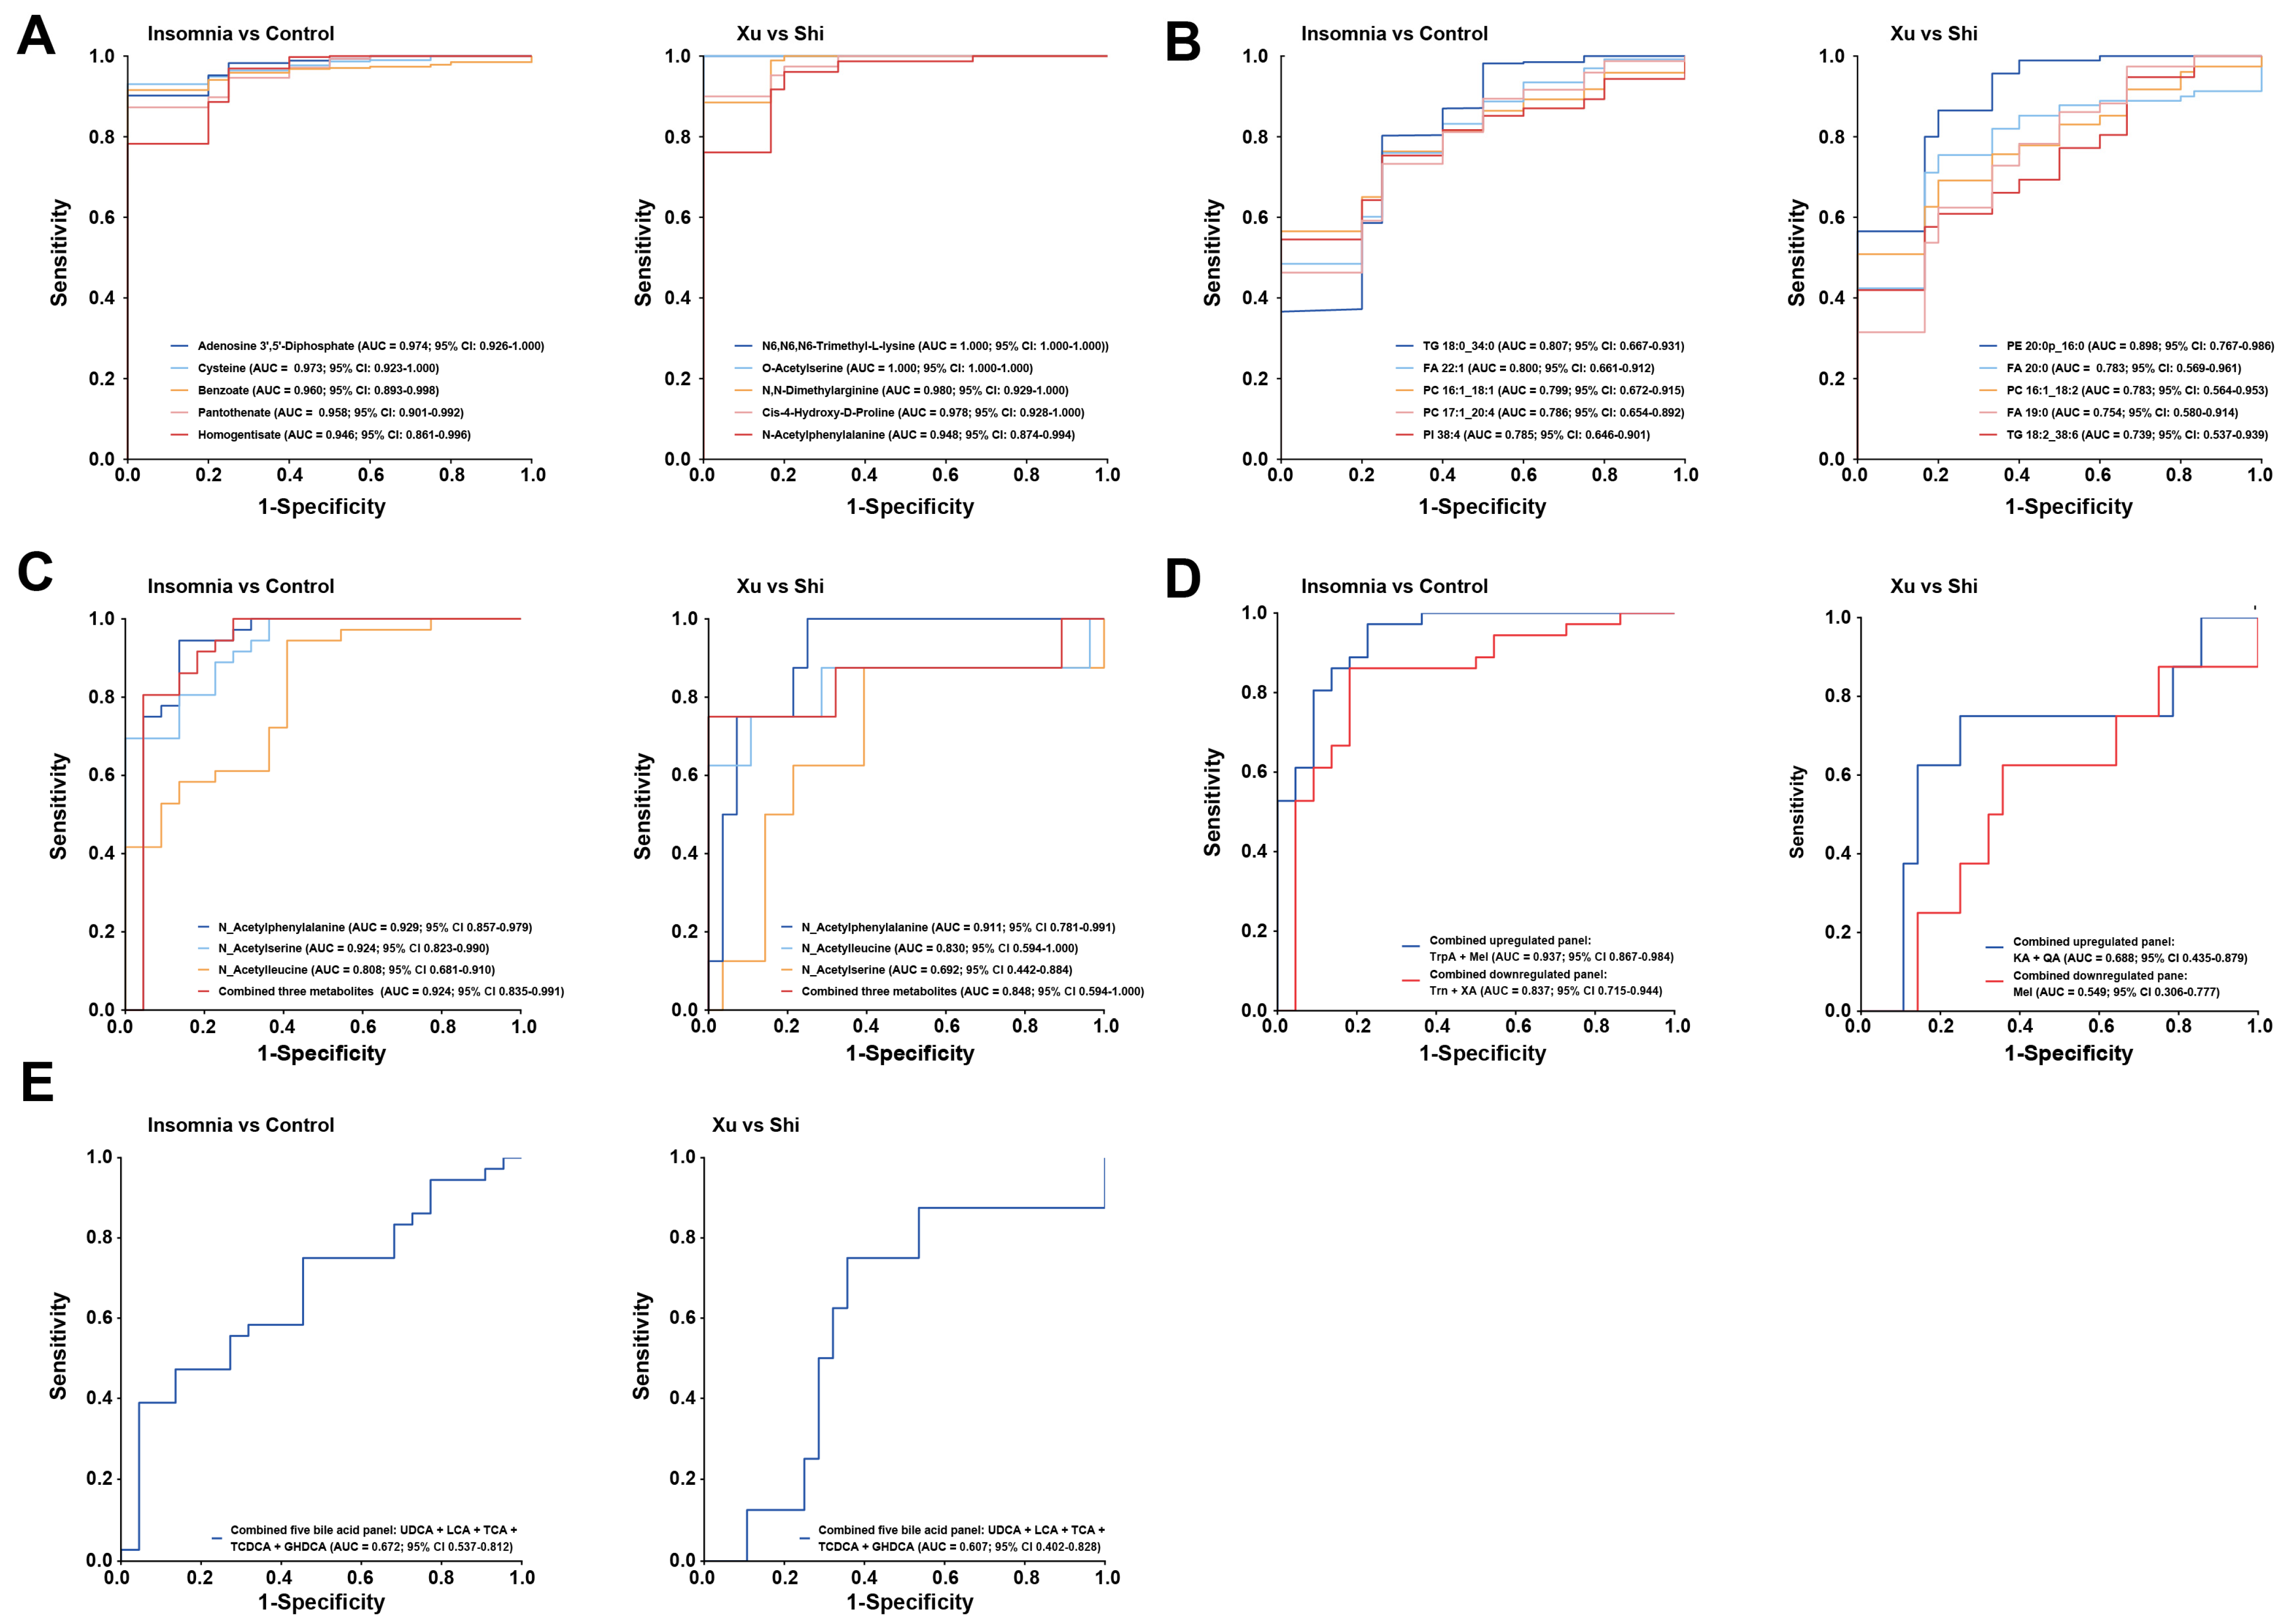

Disclaimer/Publisher’s Note: The statements, opinions and data contained in all publications are solely those of the individual author(s) and contributor(s) and not of MDPI and/or the editor(s). MDPI and/or the editor(s) disclaim responsibility for any injury to people or property resulting from any ideas, methods, instructions or products referred to in the content. |
© 2026 by the authors. Licensee MDPI, Basel, Switzerland. This article is an open access article distributed under the terms and conditions of the Creative Commons Attribution (CC BY) license.