


Abstract
Background: Head and neck squamous cell carcinoma (HNSCC) is highly aggressive and prone to local recurrence, but the underlying mechanisms remain unclear. Methods: Single-cell RNA-seq and integrative transcriptomic analyses were used to identify invasive malignant epithelial subpopulations and candidate TGFβ-responsive genes. Transwell assays and Western blotting were performed to assess migration, invasion, and EMT in HNSCC cells. Results: Single-cell analysis identified a malignant epithelial subpopulation with high EMT activity and stemness-related features. SERPINE1 was identified as a candidate TGFβ1-responsive gene. SERPINE1 knockdown reduced cell migration, invasion, and EMT-associated changes and partially attenuated the effects of TGFβ1 treatment. Conclusions: Together, these findings identify an invasive epithelial subpopulation in HNSCC and highlight the TGFβ–SERPINE1 axis as an important molecular feature of this subpopulation.
1. Introduction
Head and neck squamous cell carcinoma (HNSCC) represent a heterogeneous set of epithelial malignancies that originate from the mucosal linings of the oral cavity, pharynx, and larynx, which ranks as the sixth most prevalent cancer worldwide and poses a critical global public health challenge [1,2]. In China, the incidence of HNSCC was approximately 140,000 cases in 2022, ranking sixth among male cancer incidences and seventh in overall cancer-associated mortality [3]. The advent of immunotherapy has reshaped the landscape of cancer treatment, particularly in HNSCC. Although recent evidence from the KEYNOTE-689 trial has demonstrated improved outcomes with perioperative pembrolizumab in patients with locally advanced resectable HNSCC, postoperative recurrence remains a major clinical challenge, underscoring the need to identify novel therapeutic targets [4,5].
Tumor recurrence and metastasis are largely driven by the acquisition of aggressive phenotypes by malignant HNSCC cells, enabling basement membrane degradation and invasion into surrounding tissues and the vasculature [6,7,8]. Even after complete surgical resection with histologically negative margins, approximately 30% of patients experience disease progression, which has been associated with residual tumor cells exhibiting epithelial-to-mesenchymal transition (EMT)-related features [9]. Throughout EMT progression, epithelial cells lose polarity, tight junctions, and E-cadherin expression while acquiring mesenchymal characteristics, including spindle-like morphology and elevated expression of N-cadherin and Vimentin, thereby enhancing migratory and invasive capacities [10]. Beyond promoting invasion, EMT also contributes to stemness, therapeutic resistance, tumor plasticity, and adaptation to the tumor microenvironment [11,12]. However, it remains unclear whether these aggressive phenotypes are uniformly distributed across malignant epithelial cells or confined to specific cellular subpopulations. Therefore, defining the malignant epithelial cell states that orchestrate EMT and metastatic progression, together with their underlying molecular regulators, is critical for understanding HNSCC progression and identifying potential therapeutic targets.
Tumor heterogeneity is difficult to resolve by bulk transcriptomics, whereas single-cell RNA sequencing (scRNA-seq) enables the characterization of functionally distinct tumor cell populations. Here, we analyzed publicly available scRNA-seq data to characterize the heterogeneity of malignant epithelial cells in HNSCC and identified an aggressive epithelial subpopulation characterized by coordinated EMT activation and stem-like features. Further characterization of this invasive subpopulation highlighted TGFβ signaling, which can suppress early tumorigenesis but promote EMT and invasion in advanced cancers [13]. By integrating transcriptomic analysis, we identified SERPINE1 as a candidate TGFβ1-responsive gene. Although elevated SERPINE1 expression has been associated with poor prognosis in HNSCC [14], its functional role in TGFβ1-associated invasion remains unclear. Our functional experiments showed that SERPINE1 knockdown and pharmacological inhibition reduced migration, invasion, and EMT-related changes in FaDu cells, supporting its potential role as a downstream mediator of TGFβ1-associated invasiveness.
2. Materials and Methods
2.1. ScRNA-Seq Data Collection and Processing
For single-cell transcriptomic analysis, we used the publicly available HNSCC dataset GSE234933 from the Gene Expression Omnibus (GEO) database (https://www.ncbi.nlm.nih.gov/geo/query/acc.cgi?acc=GSE234933; accessed on 1 October 2024) [15]. The GSE234933 cohort comprises 52 HNSCC samples, including 24 primary tumors, 16 local recurrences, and 12 distant metastases. From this cohort, we selected 15 HPV-negative primary tumors for single-cell transcriptomic analysis, including 1 tumor from the oropharynx, 11 from the oral cavity, and 3 from the larynx/hypopharynx.
To maintain dataset integrity, preliminary data filtering was conducted by retaining cells exhibiting mitochondrial gene proportions below 10% and 200–5000 genes detected in each cell, with expression thresholds set between 500 and 8000 units. Following quality control, we identified the top 2000 most variable genes and normalized gene expression with ScaleData. Principal component analysis (PCA) was subsequently conducted, and the first 20 principal components (PCs) were extracted for dimensionality reduction. The Harmony integration algorithm was employed to mitigate batch effects between samples. Cell subpopulations were identified through Seurat’s neighbor-graph-based clustering method and visualized by UMAP. Cell type identities were determined based on the expression of known lineage-specific marker genes.
2.2. InferCNV and Cell Malignancy Evaluation
Epithelial cells were obtained from HNSCC tumors and subsequently analyzed according to the predefined protocol. To identify malignant epithelial cells in HNSCC samples, copy number variation (CNV) was inferred using the InferCNV R package (version 1.18.0), with endothelial cells serving as the reference population [16,17,18,19]. Cells were considered malignant epithelial cells when the CNV score exceeded 0.001 and the CNV correlation coefficient was above 0.3. These cells were then reanalyzed at a resolution of 0.2.
2.3. Tumor Stemness and EMT Score Analysis
The malignant cell populations were further stratified to investigate their potential differentiation trajectories using a combination of CytoTRACE (version 0.3.3), Monocle3 (version 1.3.4) and Slingshot (version 2.10.0) pseudotime analyses. The CytoTRACE R package was employed to estimate the stemness of malignant epithelial cells, with higher scores indicating lower differentiation and greater stem-like potential [20]. The Slingshot and Monocle3 algorithms were applied to construct pseudotime trajectories and delineate the differentiation paths of HNSCC cells at single-cell resolution [21]. To characterize the lineage commitment process, we applied the Branch Expression Analysis Modeling (BEAM) approach implemented in the Monocle2 R package (monocle2:: BEAM() function, version 2.28.0) to detect branch-point-specific genes along the inferred pseudotime trajectories.
EMT scores were determined using the expression profiles of EMT-associated genes via the AUCell method across different cell subpopulations, with higher scores indicating stronger mesenchymal features. UMAP plots were subsequently generated for dimensionality reduction.
2.4. HdWGCNA
Scale-free topological networks at single-cell resolution were established via the hdWGCNA R package (version 0.2.26) [22]. The analytical procedure first involved metacell matrix transposition using the KNN-based “MetacellsByGroups” function. The scale-free network criterion was met at a soft-thresholding power of 7 (R2 > 0.8). Co-expression networks were generated with “ConstructNetwork,” and module eigengenes were calculated using “ModuleEigengenes.” Gene connectivity (kME) was calculated using the “ModuleConnectivity” function, and genes with the highest kME values were prioritized as candidate hub genes. Finally, correlations between these modules and HNSCC epithelial traits were assessed using the “ModuleTraitCorrelation” function, with results visualized as bubble plots and heatmaps.
2.5. Gene Set Variation Analysis
To evaluate pathway activities at the cellular level, we applied Gene Set Variation Analysis (GSVA) [23] with the hallmark gene sets (h.all.v2026.1.Hs.symbols.gmt) from MSigDB (https://www.gsea-msigdb.org/gsea/msigdb/; accessed on 1 May 2026), with method = “ssgsea”, kcdf = “Gaussian”. Subsequently, we compared the GSVA enrichment scores across epithelial subsets to detect differential pathway activation. In parallel, we also used the AUCell algorithm to assign activity scores for the same MSigDB gene sets within each epithelial cluster. To identify pathways specifically associated with the selected subcluster, pre-ranked Gene Set Enrichment Analysis (GSEA) was performed using the clusterProfiler (version 4.7.1) R package. Pathways with nominal p < 0.05 were considered enriched, and FDR-adjusted p-values were reported where available.
2.6. Cell Culture
The human HNSCC cell line FaDu (Chinese Academy of Medical Sciences, Beijing, China, Cat. No. 1101HUM-PUMC000996) was used in this study. FaDu is an established human cell line originally derived from a hypopharyngeal squamous cell carcinoma [24]. FaDu cells were maintained in Minimum Essential Medium (Gibco, Thermo Fisher Scientific, Waltham, MA, USA) with 10% fetal bovine serum (ExCell Bio, Shanghai, China) at 37 °C in 5% CO2. For siRNA transfection, 75 pmol of SERPINE1 siRNA or negative control siRNA (Thermo Fisher Scientific, Waltham, MA, USA; Cat. Nos. 4390824 and AM4635, respectively) was combined with Lipofectamine 3000 (Invitrogen, Waltham, MA, USA) in 250 µL of Opti-MEM I Reduced Serum Medium (Gibco, Thermo Fisher Scientific, Waltham, MA, USA) and added to the conditioned medium. Transfected FaDu cells were cultured for 48 h before cell lysate preparation. Recombinant human TGFβ1 (PeproTech, Cranbury, NJ, USA) was dissolved in 10 mM citric acid and used to stimulate cells at an exact concentration of 10 ng/ml for 48 h.
2.7. Western Blotting
Total proteins were extracted from HNSCC cells using RIPA buffer supplemented with 1× PMSF and 1 mM protease inhibitor cocktail (Beyotime Biotechnology, Shanghai, China). Protein concentrations were determined using a BCA assay kit (Invitrogen, USA). Equal amounts of protein were denatured at 95 °C for 10 min, separated by 10% SDS-PAGE, and transferred onto 0.22 μm PVDF membranes (Millipore, Billerica, MA, USA) at 200 mA for 90 min. Membranes were blocked with 8% nonfat milk for 1 h at room temperature and incubated overnight at 4 °C with primary antibodies. After washing with TBST, membranes were incubated with HRP-conjugated goat anti-rabbit or anti-mouse secondary antibodies (Abcam, Cambridge, UK) for 1 h. Protein signals were detected using a chemiluminescence kit (Millipore, USA) and visualized with a ChemiDoc MP imaging system (Bio-Rad, Hercules, CA, USA). Primary antibodies used above were anti-ZEB1 (Proteintech, Rosemont, IL, USA), anti-Vimentin (Proteintech, Rosemont, IL, USA), anti-E-cadherin (Proteintech, Rosemont, IL, USA), anti-N-cadherin (CST, Danvers, MA, USA), anti-Snail (CST, Danvers, MA, USA), anti-GAPDH (Absin Bioscience Inc., Shanghai, China), and anti-SERPINE1 (Proteintech, USA).
2.8. Semiquantitative Real-Time PCR
Total RNA was extracted using TRIzol reagent (Sigma, St. Louis, MO, USA), and 1 μg of RNA was reverse-transcribed into cDNA using a Yeasen kit (Yeasen Biotechnology, Shanghai, China, Cat. No. 11141ES10). Quantitative real-time PCR (qRT-PCR) was performed to detect target gene expression, with GAPDH as the internal control. The primer sequences are listed below: GAPDH: forward primer: 5′-AATCCCATCACCATCTTCCA-3′, reverse primer 5′-TGGACT-CCACGACGTACTCA-3′; SERPINE1: forward primer: 5′-GCACCACAGACG-CGATCTT-3′, reverse primer 5′-ACCTCTGAAAAGTCCACTTGC-3′.
2.9. Transwell Assay
Cell migration and invasion were evaluated using Transwell chambers with 8.0 μm polycarbonate membranes (Corning, Corning, NY, USA). FaDu cells suspended in serum-free medium were seeded into the upper chambers, while medium containing 10% FBS was added to the lower chambers as a chemoattractant. After 24 h, migrated cells were fixed with ethanol, stained with crystal violet, and quantified by counting cells in 3–4 randomly selected microscopic fields per well. For invasion assays, the upper chambers were pre-coated with Matrigel (BD Biosciences, Franklin Lakes, NJ, USA).
2.10. RNA Sequencing and Bioinformatics Analysis
FaDu cells were treated with 10 ng/mL recombinant TGFβ1, and total RNA was extracted for transcriptome sequencing. RNA quality and integrity were assessed before library preparation. Poly(A)-containing mRNAs were enriched using oligo(dT) magnetic beads and used to construct cDNA libraries. After adaptor ligation and PCR amplification, libraries were subjected to paired-end 150 bp sequencing (PE150). Raw reads were filtered to remove low-quality reads and adaptor sequences, and clean reads were used for downstream analysis. Differentially expressed genes between TGFβ1-treated and control FaDu cells were identified using DESeq2, with |log2FC| > 1.5 and adjusted p < 0.05 as the significance criteria.
2.11. Statistical Analysis
ScRNA-seq datasets were processed and analyzed with R software (version 4.3.0). Statistical analyses were conducted in GraphPad Prism 9. Two-group comparisons were conducted using two-sided Student’s t-tests, while comparisons among three or more groups were performed using one-way analysis of variance (ANOVA) followed by Dunnett’s multiple-comparisons test to compare each treatment group with the control group. Data are expressed as mean ± SD. Experiments were independently repeated at least three times. Statistical significance was set at p < 0.05, with * p < 0.05, ** p < 0.01, *** p < 0.001, and **** p < 0.0001.
3. Results
3.1. Characterization of Major Cell Types in HNSCC
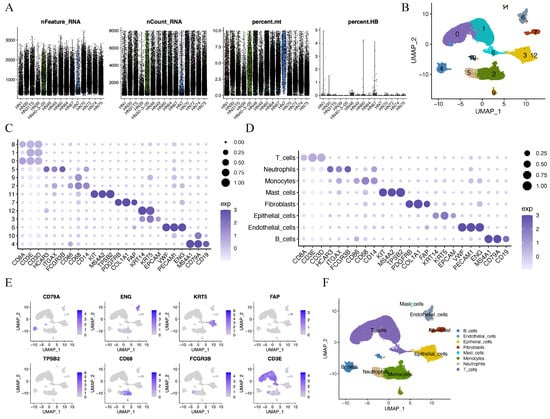
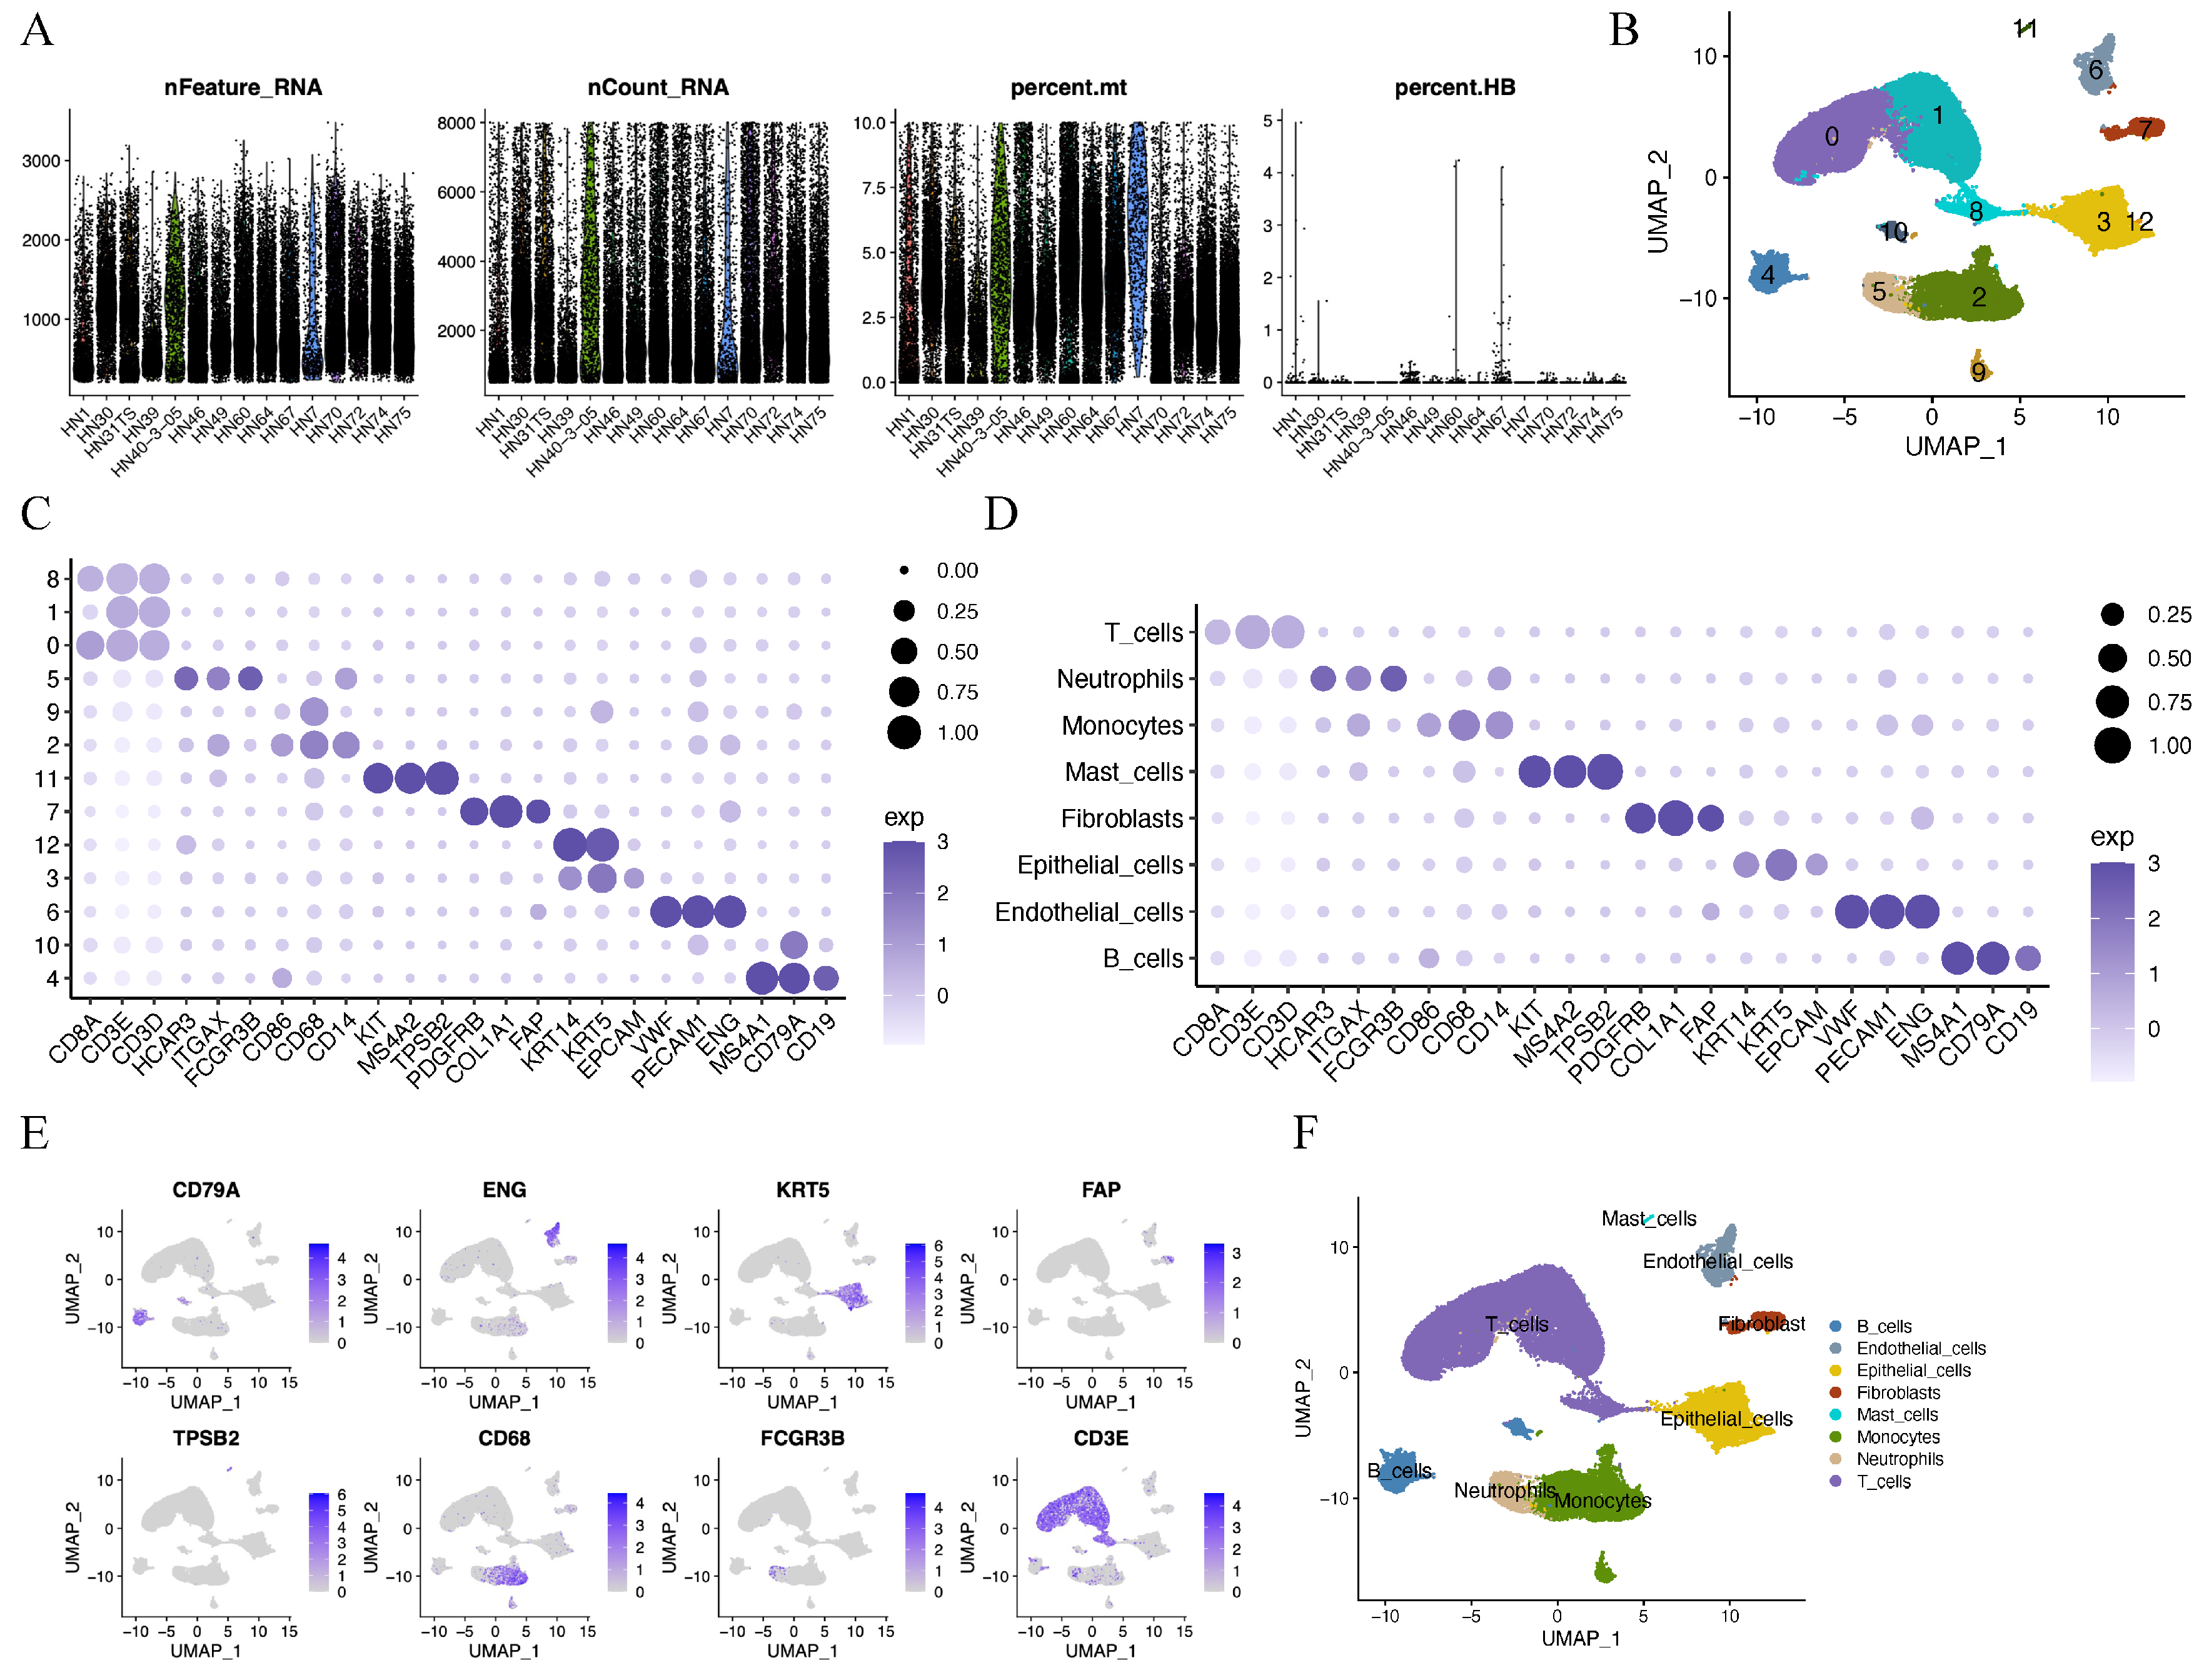
To characterize the cellular heterogeneity in HNSCC tumors, we analyzed publicly available scRNA-seq data from 15 HPV-negative primary HNSCC tumors selected from the GSE234933 cohort. Specifically, cells expressing fewer than 200 genes or more than 5000 genes, or having over 10% mitochondrial and 5% hemoglobin transcripts, were excluded from the analysis (Figure 1A). After quality control, analysis of total cells revealed 12 distinct clusters (Figure 1B). The initial 12 clusters, visualized through a dot plot highlighting cell type-specific marker genes from the CellMarker database (Figure 1C), were consolidated into 8 biologically meaningful cell types (Figure 1D). The expression of specific marker genes was further plotted across different cell types (Figure 1E). The UMAP plot of eight major cell types was presented in Figure 1F, including epithelial cells, endothelial cells, monocytes, fibroblasts, mast cells, B cells, T cells and neutrophils.
Figure 1.
Classification of HNSCC cells into large clusters. (A) High-quality single cells were selected based on thresholds for the number of detected genes (nFeature), total UMI counts (nCount), and mitochondrial transcript percentage (percent.mt) and red blood cell percentage (percent.HB). (B) UMAP demonstrating 12 discrete cell clusters. (C) Markers that identify different cell types are expressed. (D) Eight major cell types were identified by marker genes from the CellMarker database. (E) The specific gene expression patterns of different cell types. (F) Cell type annotation.
3.2. Identification of Malignant Tumor Epithelial Cells
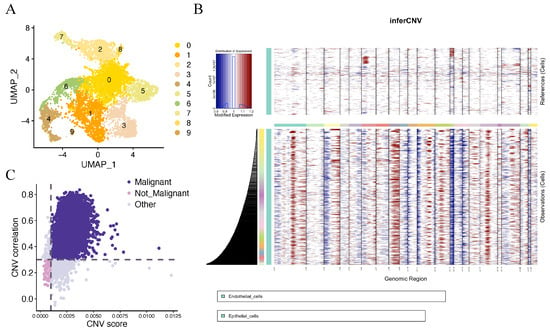
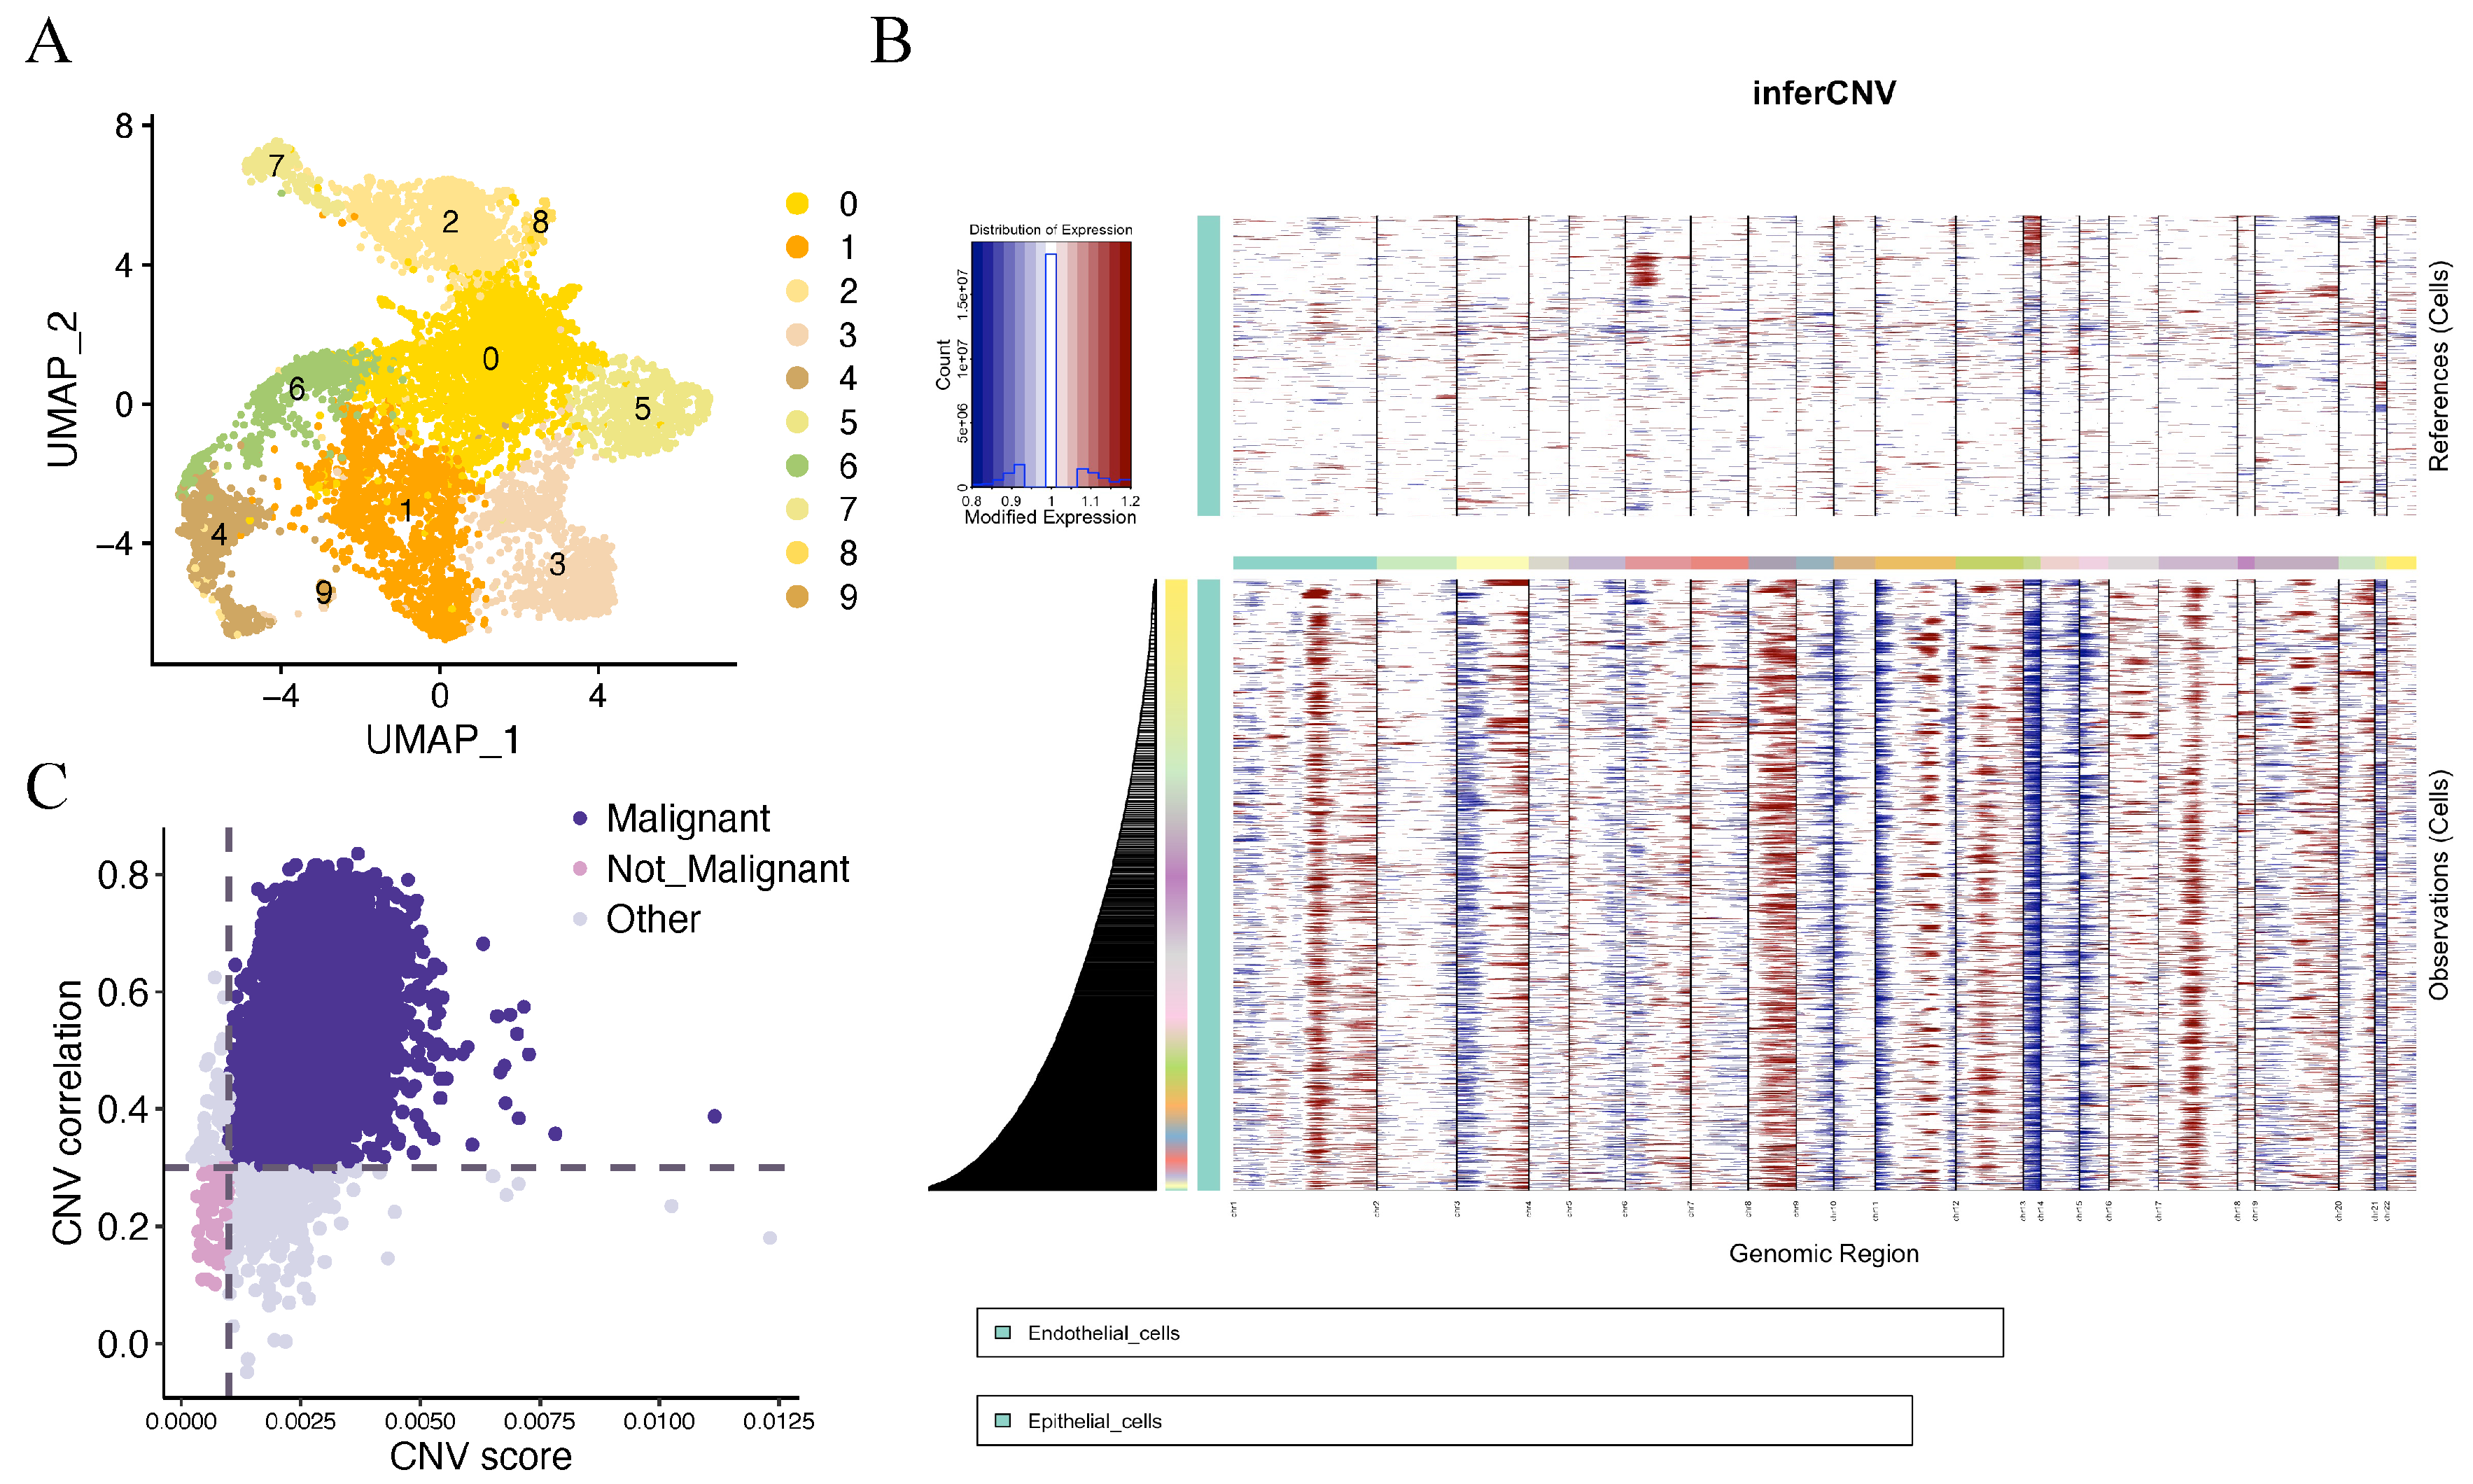
After screening and quality control, all HNSCC epithelial cells were collected and grouped into ten distinct clusters (Figure 2A). To differentiate malignant from non-malignant epithelial cells, large-scale copy number variations (CNVs) were inferred using the “inferCNV” R package, with endothelial cells serving as the reference (Figure 2B). Based on inferCNV analysis, CNV scores and their correlations were further calculated and visualized using scatter plots to quantitatively distinguish malignant from non-malignant epithelial cells, with the malignant population corresponding to the purple cell cluster in the upper right of Figure 2C.
Figure 2.
Analysis of epithelial cell malignancy based on inferCNV. (A) UMAP visualization of ten distinct epithelial subclusters. (B) Heatmap showing the CNV analysis of the scRNA-seq data. The reference (up) indicates endothelial cells, and the observations (down) indicate epithelial cells. (C) Scatter plot visualization of malignant and non-malignant cell populations based on CNV scores and CNV correlations.
3.3. Identification of C1 as an Aggressive Epithelial Subpopulation in HNSCC
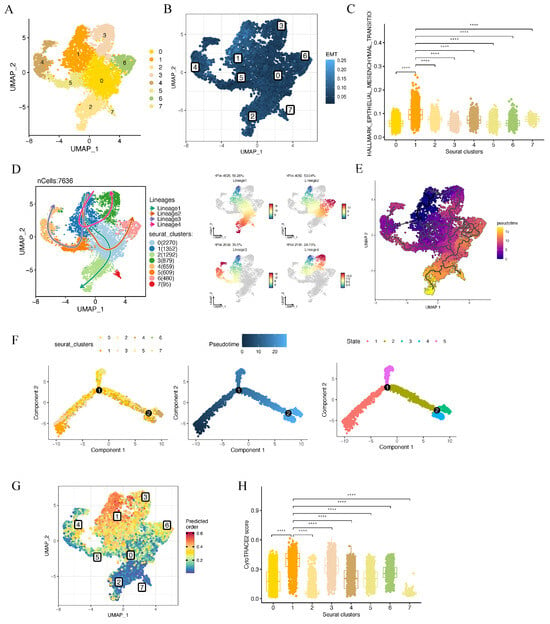
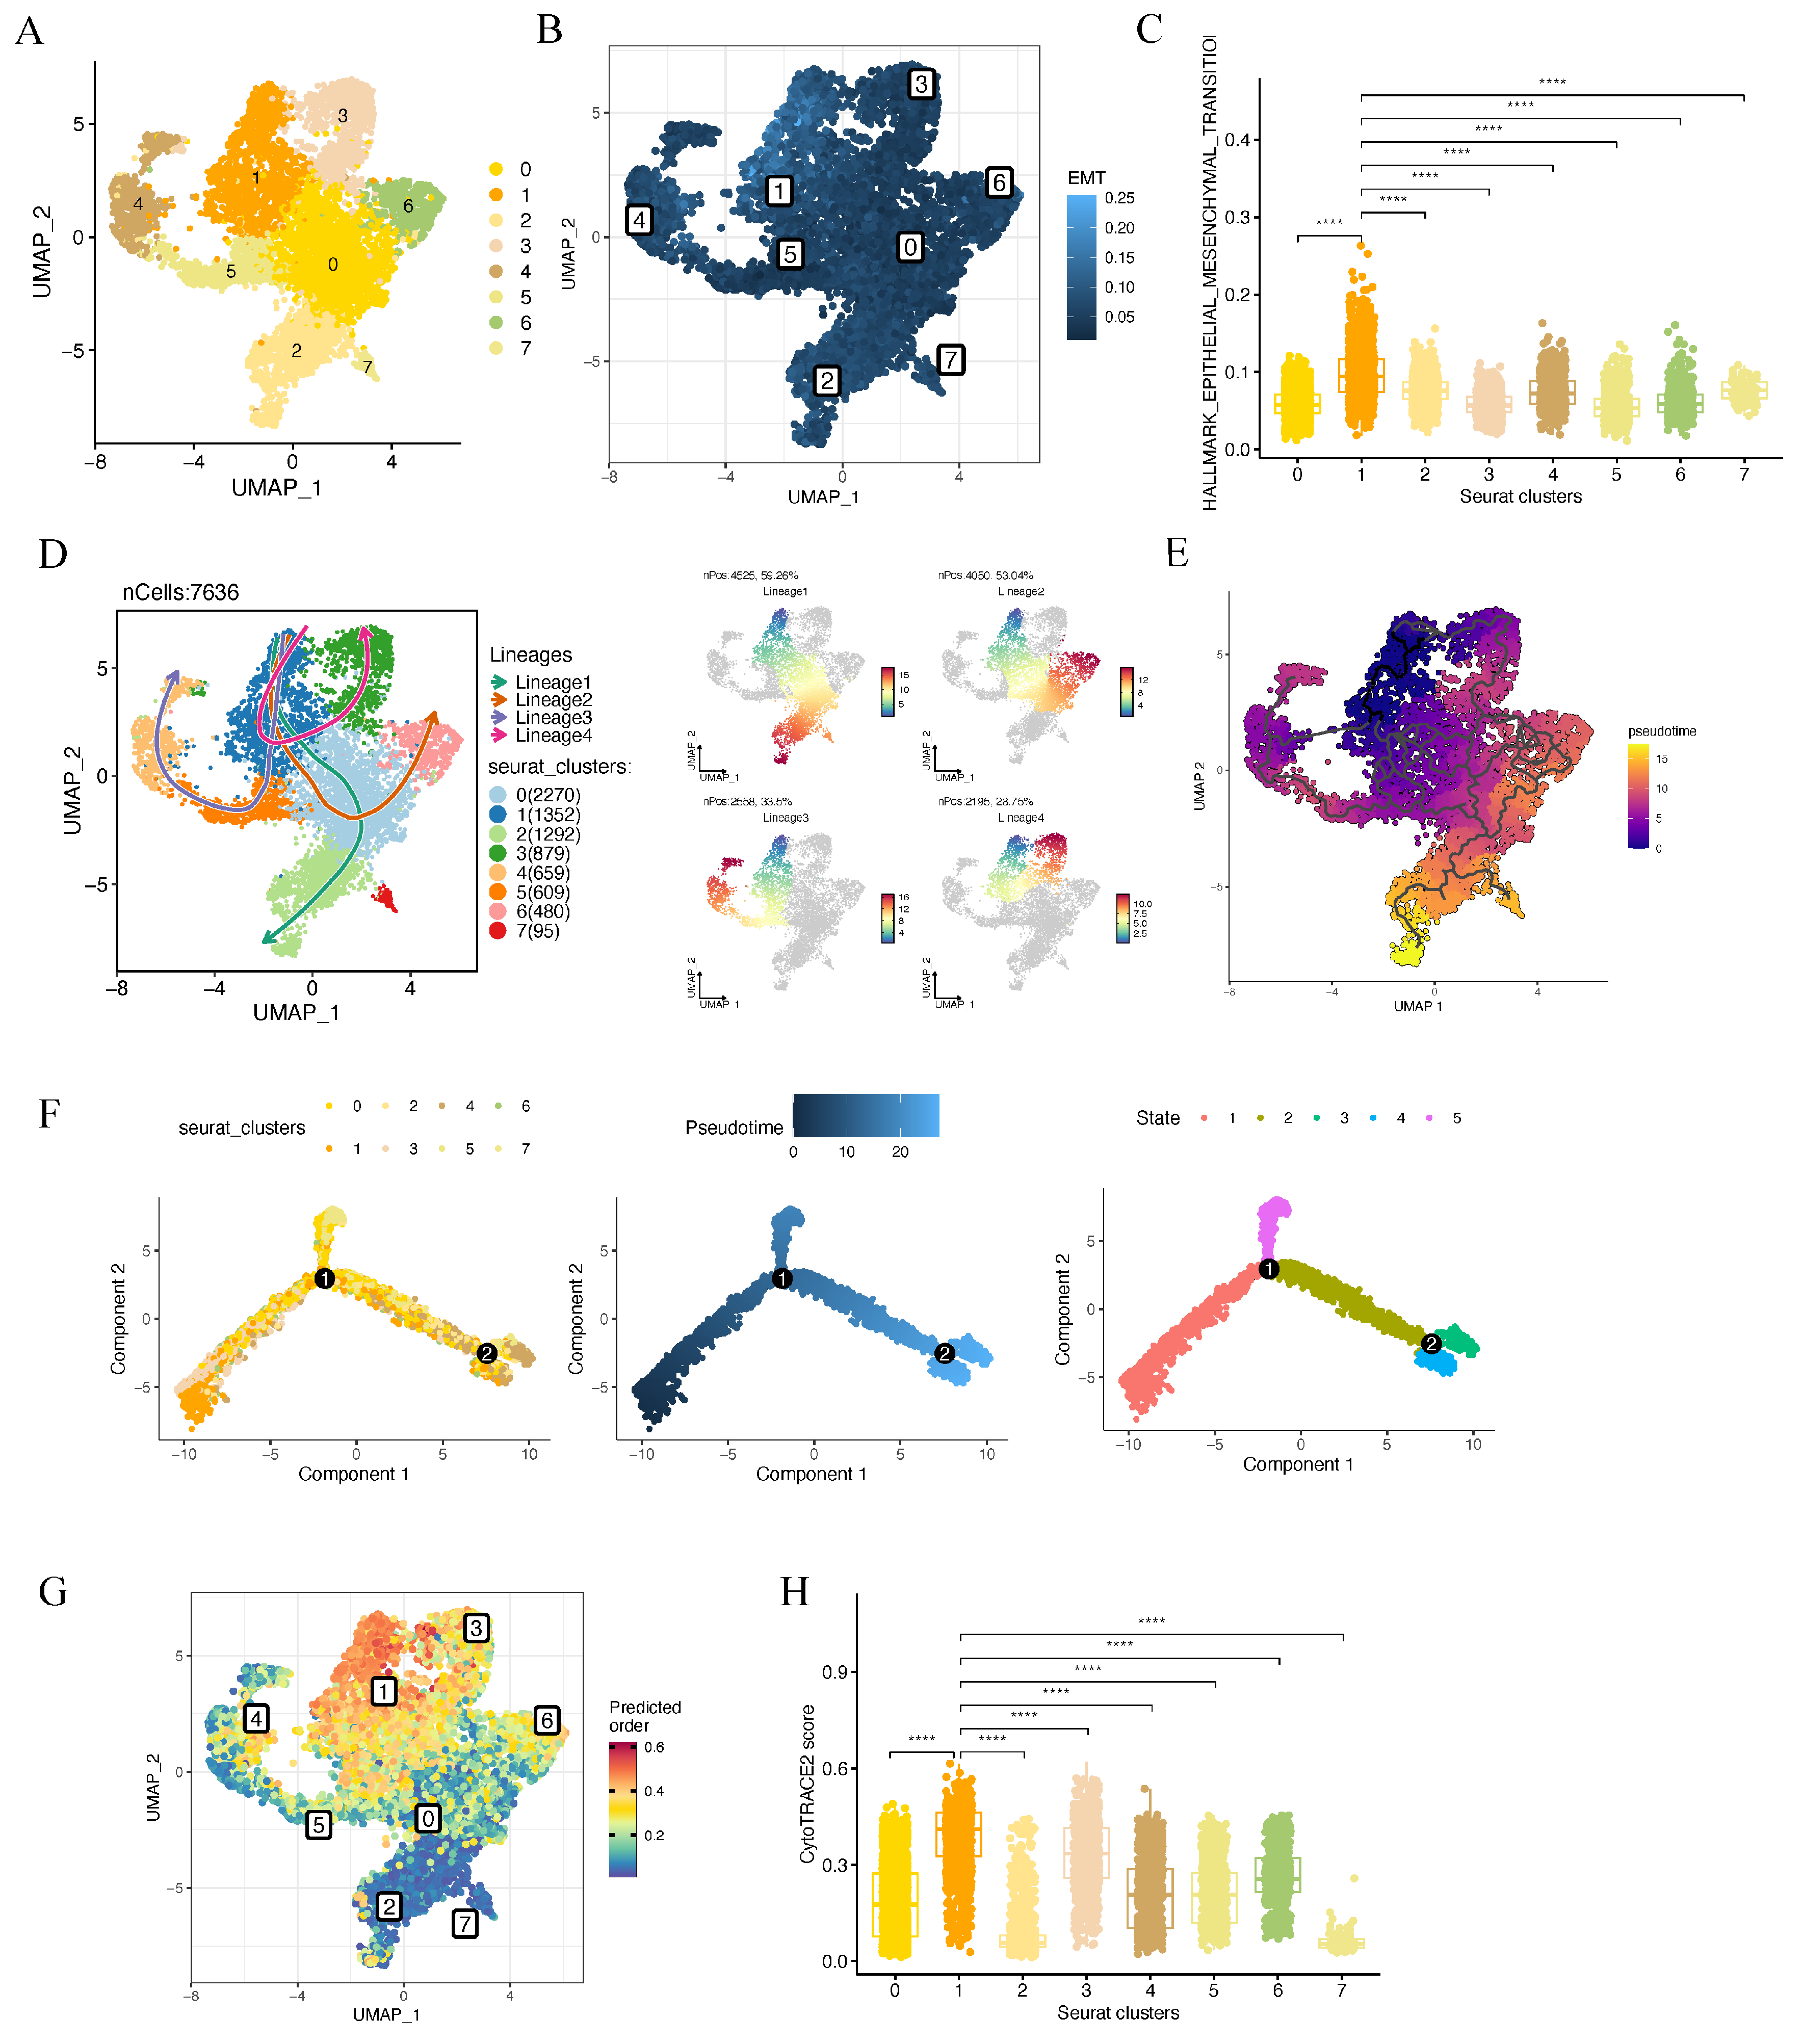
The malignant epithelial cells were initially classified into eight clusters (Figure 3A), excluding sample HN74, in which no malignant epithelial cells were identified due to the low number of epithelial cells. EMT activation is recognized as a critical process by which tumor cells acquire both metastatic potential and stemness-associated features. To identify the most aggressive epithelial subpopulation, EMT scores were calculated across all clusters (Figure 3B). Among them, cluster 1 displayed the highest EMT score, suggesting enhanced invasive and metastatic potential (Figure 3C). Cancer stem cells (CSCs) are also characterized by great invasive capabilities and a less differentiated state. Slingshot trajectory analysis placed cluster 1 toward the early end of the inferred malignant epithelial trajectory (Figure 3D), which was further supported by the pseudotemporal ordering observed in Monocle3 (Figure 3E) and Monocle2 (Figure 3F). The CytoTRACE analysis (Figure 3G) also revealed that cluster 1 exhibited the highest CytoTRACE score (Figure 3H), supporting its relatively less differentiated state. Cluster 1 cells were detected in all analyzed samples, with a median within-patient proportion of 15.4% (Figure S1). Collectively, these analyses characterized cluster 1 as an EMT-high, relatively less differentiated malignant epithelial state.
Figure 3.
Analysis of malignant epithelial clusters with EMT activation and stemness features. (A) UMAP visualization of eight malignant epithelial subclusters. (B) UMAP visualization of EMT scores across different clusters. (C) Violin plots showing the highest EMT score in cluster 1. (D) Slingshot trajectory analysis constructed four differentiation lineages of malignant epithelial cells, with cluster 1 serving as the origin of multiple branching lineages (left); the continuity of cell differentiation within each lineage was displayed in the right panel. (E) Monocle3 analysis shows a continuous differentiation trajectory, with purple and yellow indicating cells at early and late pseudotime, respectively. (F) Monocle2 trajectory analysis of malignant epithelial cells reveals distinct developmental paths and states across cellular clusters. (G) UMAP showing CytoTRACE scores across clusters, where higher scores indicate lower differentiation. (H) The boxplot quantifying CytoTRACE scores across Seurat clusters, with cluster 1 exhibiting the highest CytoTRACE score. **** p < 0.0001.
3.4. TGFβ Signaling Is Associated with the Malignant Phenotype of C1 Cells
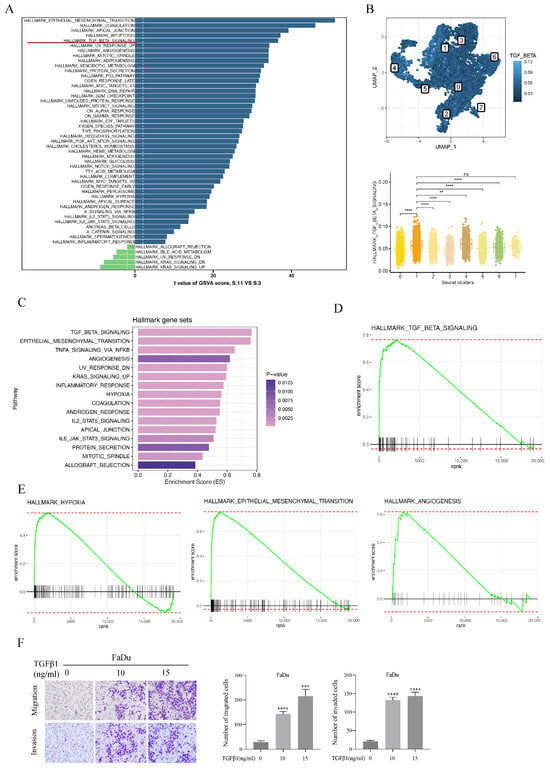
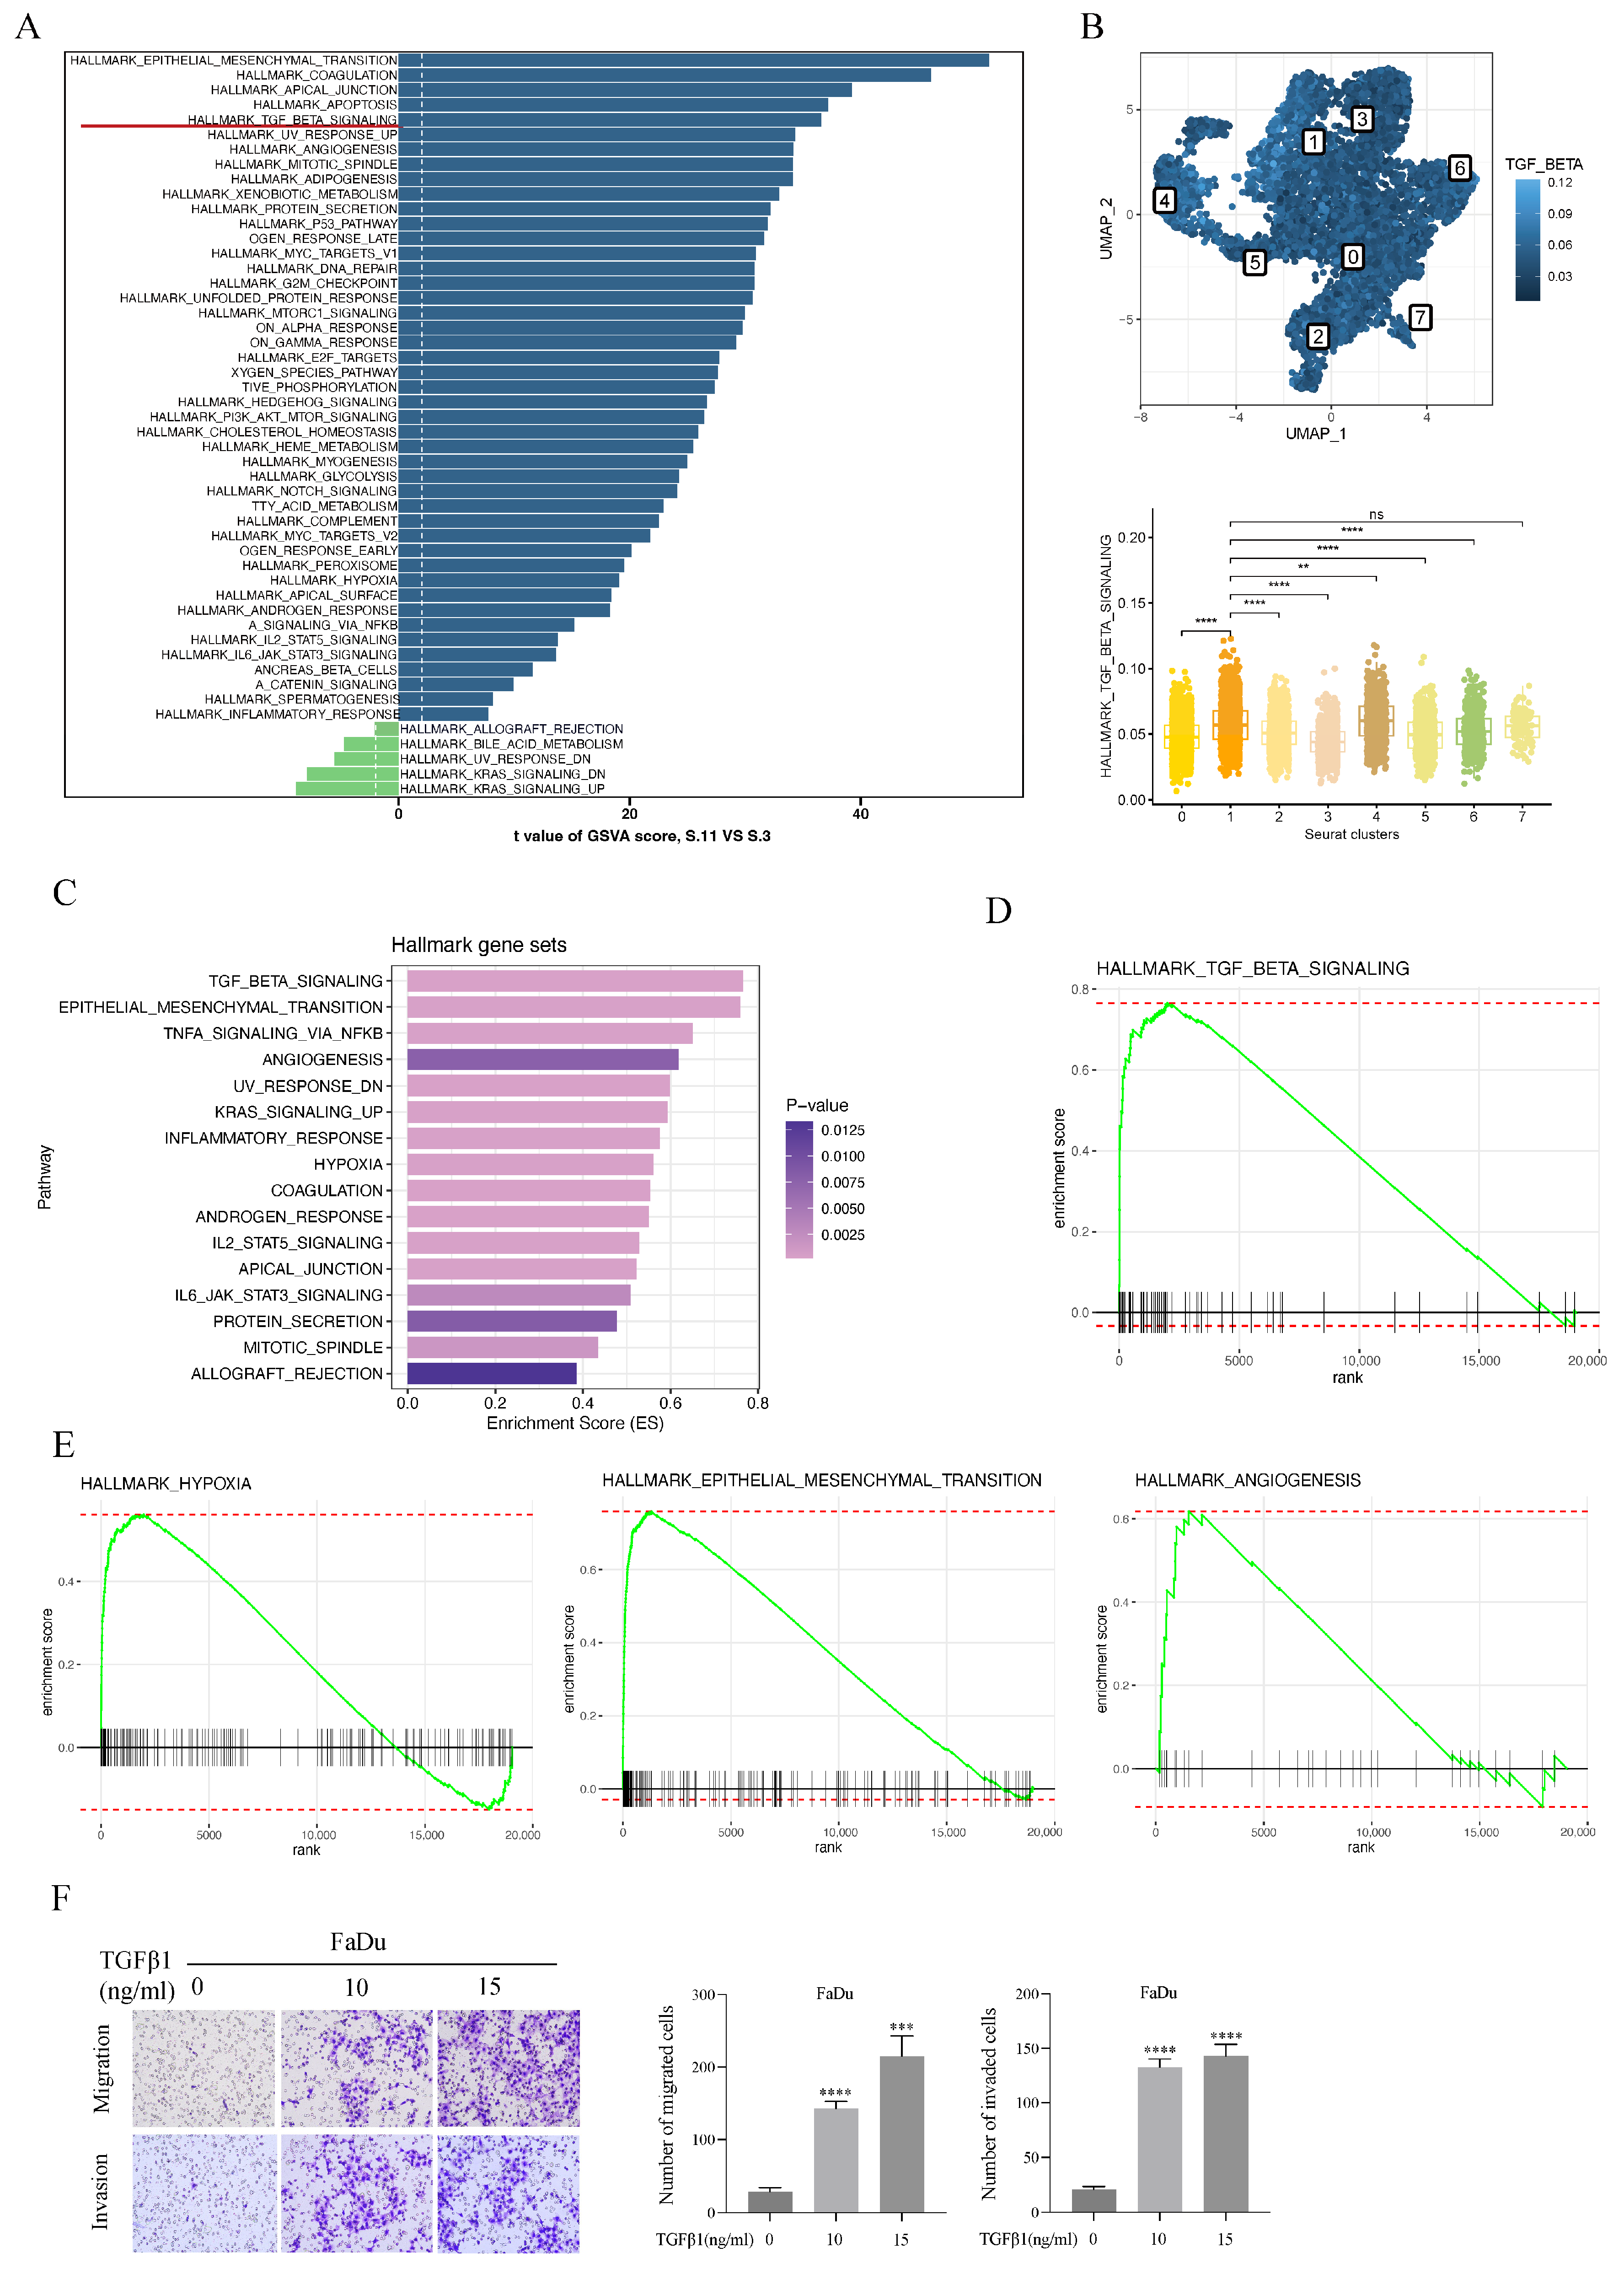
To further characterize the malignant features of C1 cells, we performed GSVA to examine the activity of cancer-related signaling pathways across malignant epithelial cell clusters. EMT-related pathways showed prominent enrichment, and the TGFβ signaling pathway was also markedly activated, indicating a potential association between TGFβ signaling and the malignant phenotype of C1 cells (Figure 4A). Consistent with the GSVA results, TGFβ signaling scores differed significantly among the malignant epithelial clusters (Figure 4B).
Figure 4.
TGFβ signaling is associated with the malignant phenotype of HNSCC C1 cells. (A) GSVA showing cancer-related signaling pathway activity across HNSCC malignant epithelial cell clusters. (B) Comparison of TGFβ signaling scores across malignant epithelial cell clusters by AUCell algorithm. (C) Hallmark pathway enrichment analysis of TGFβ1-treated FaDu cells. (D) GSEA plot showing enrichment of the TGFβ signaling gene set following TGFβ1 stimulation (NES = 2.23, adjusted p < 0.001). (E) Representative GSEA plots for hypoxia (NES = 1.96, adjusted p < 0.001), EMT (NES = 2.66, adjusted p < 0.001), and angiogenesis gene sets (NES = 1.67, adjusted p < 0.01). (F) Transwell assays evaluating FaDu cell migration and invasion following exogenous TGFβ1 stimulation. Experiments were independently repeated three times. Statistical significance was determined by one-way ANOVA followed by Dunnett’s multiple-comparisons test. ** p < 0.01, *** p < 0.001, and **** p < 0.0001. NES: Normalized enrichment scores.
To investigate the effects of TGFβ signaling in HNSCC cells, FaDu cells were stimulated with recombinant human TGFβ1 for 48 h, followed by transcriptomic profiling (Supplementary Table S1) and GSEA analysis using the Hallmark gene sets. GSEA revealed prominent enrichment of TGFβ signaling and EMT, together with hypoxia, angiogenesis, and KRAS signaling pathways (Figure 4C–E). Consistently, TGFβ1 stimulation enhanced FaDu cell migration and invasion and induced EMT (Figure 4F), as indicated by decreased E-cadherin and increased ZEB1, Vimentin, N-cadherin, and Snail expression (Figure S2A). In addition, survival analysis showed that patients with higher TGFβ signaling scores tended to have poorer overall survival (OS) and disease-specific survival (DSS) (Figure S2B). Taken together, these results indicate that enhanced TGFβ signaling is closely associated with the aggressive and EMT-related phenotype of HNSCC malignant epithelial cells, and prompted us to further explore its downstream molecular changes.
3.5. C1-Associated Gene Modules Revealed by hdWGCNA
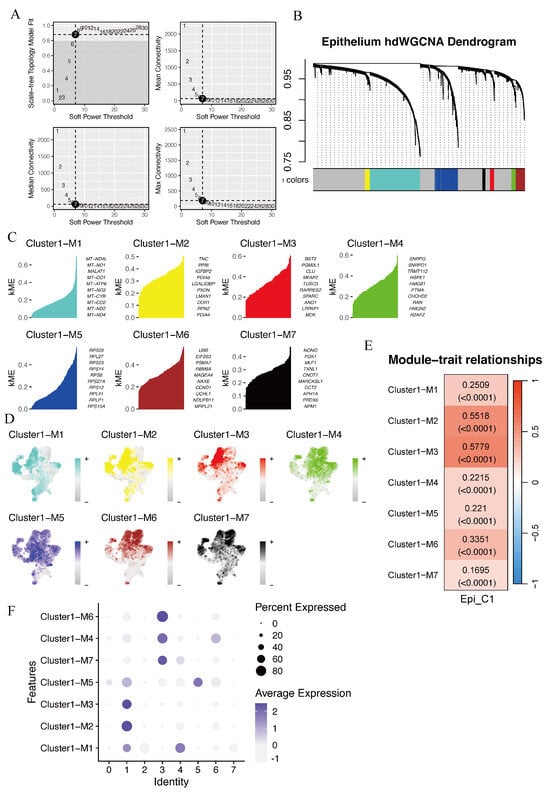
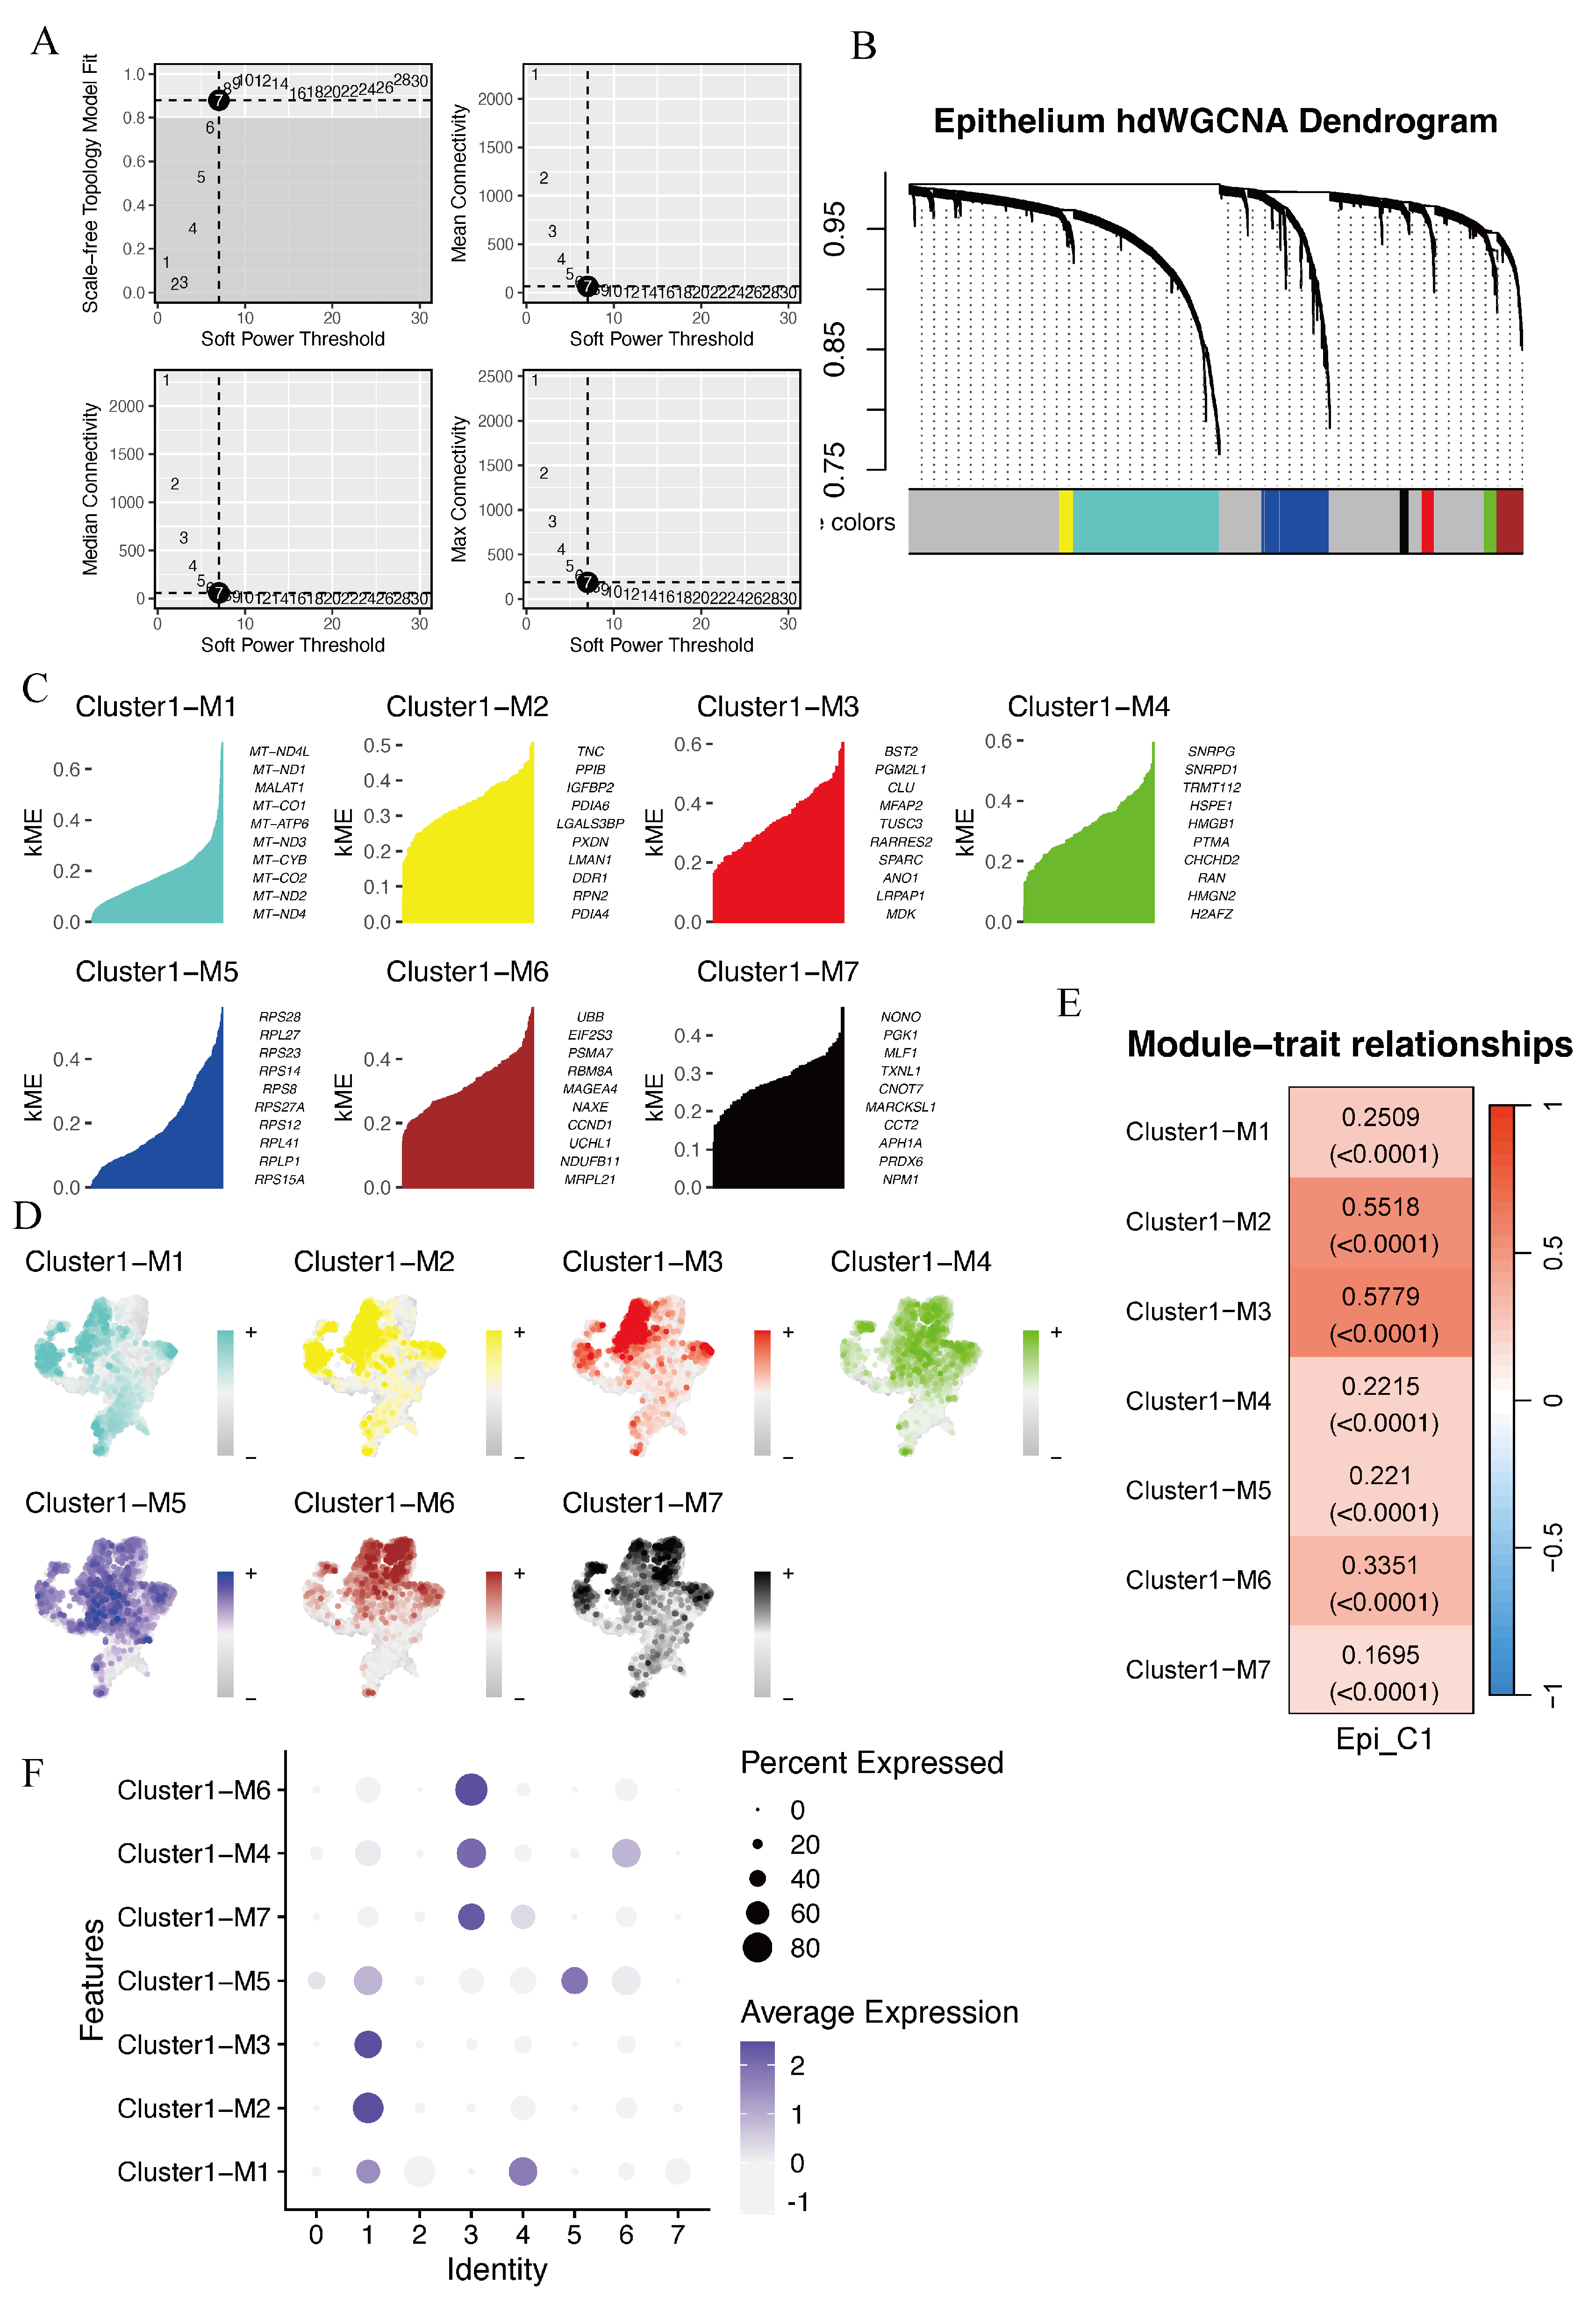
To characterize hub gene modules associated with cluster 1, we performed hdWGCNA on the scRNA-seq dataset to establish a gene co-expression network. A soft-thresholding power of β = 7 was selected based on the scale-free topology criterion. (Figure 5A). Intermodular connectivity was assessed based on gene relationships across modules, resulting in the identification of seven non-gray modules, each represented by a distinct color (Figure 5B). The kME was then determined to assess the correlation between individual genes and their respective module eigengenes (Figure 5C). We next compared module scores across malignant epithelial clusters and found distinct activity patterns among the clusters (Figure 5D). Notably, the yellow (M2) and red (M3) modules showed the strongest association with cluster 1 (Figure 5E,F).
Figure 5.
Identification of malignant epithelial gene signatures in HNSCC using hdWGCN. (A). Selection of the optimal soft-thresholding power. (B) Hierarchical clustering identified distinct gene co-expression modules. (C) kME was evaluated to identify highly connected genes within each module. (D) UMAP visualization of HNSCC malignant epithelial cells based on module scores. (E) Dot plot showing module activity across distinct cell clusters. (F) Heatmap showing the associations between module eigengenes and HNSCC malignant epithelial cell clusters.
3.6. Integrative Transcriptomic Analysis Identifies SERPINE1 as a Potential Downstream Mediator of TGFβ1 Signaling
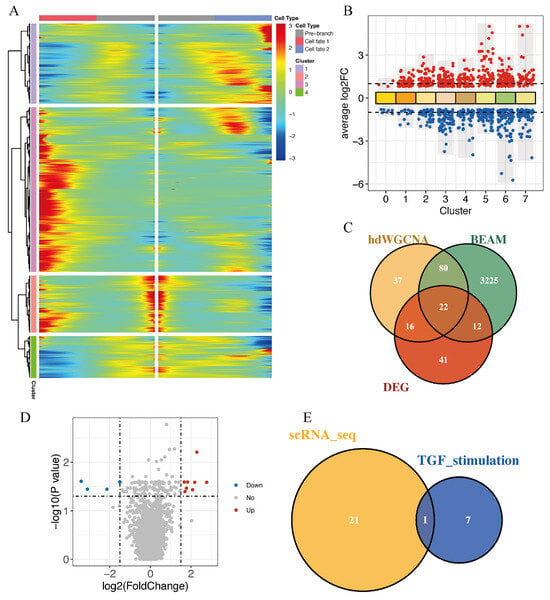
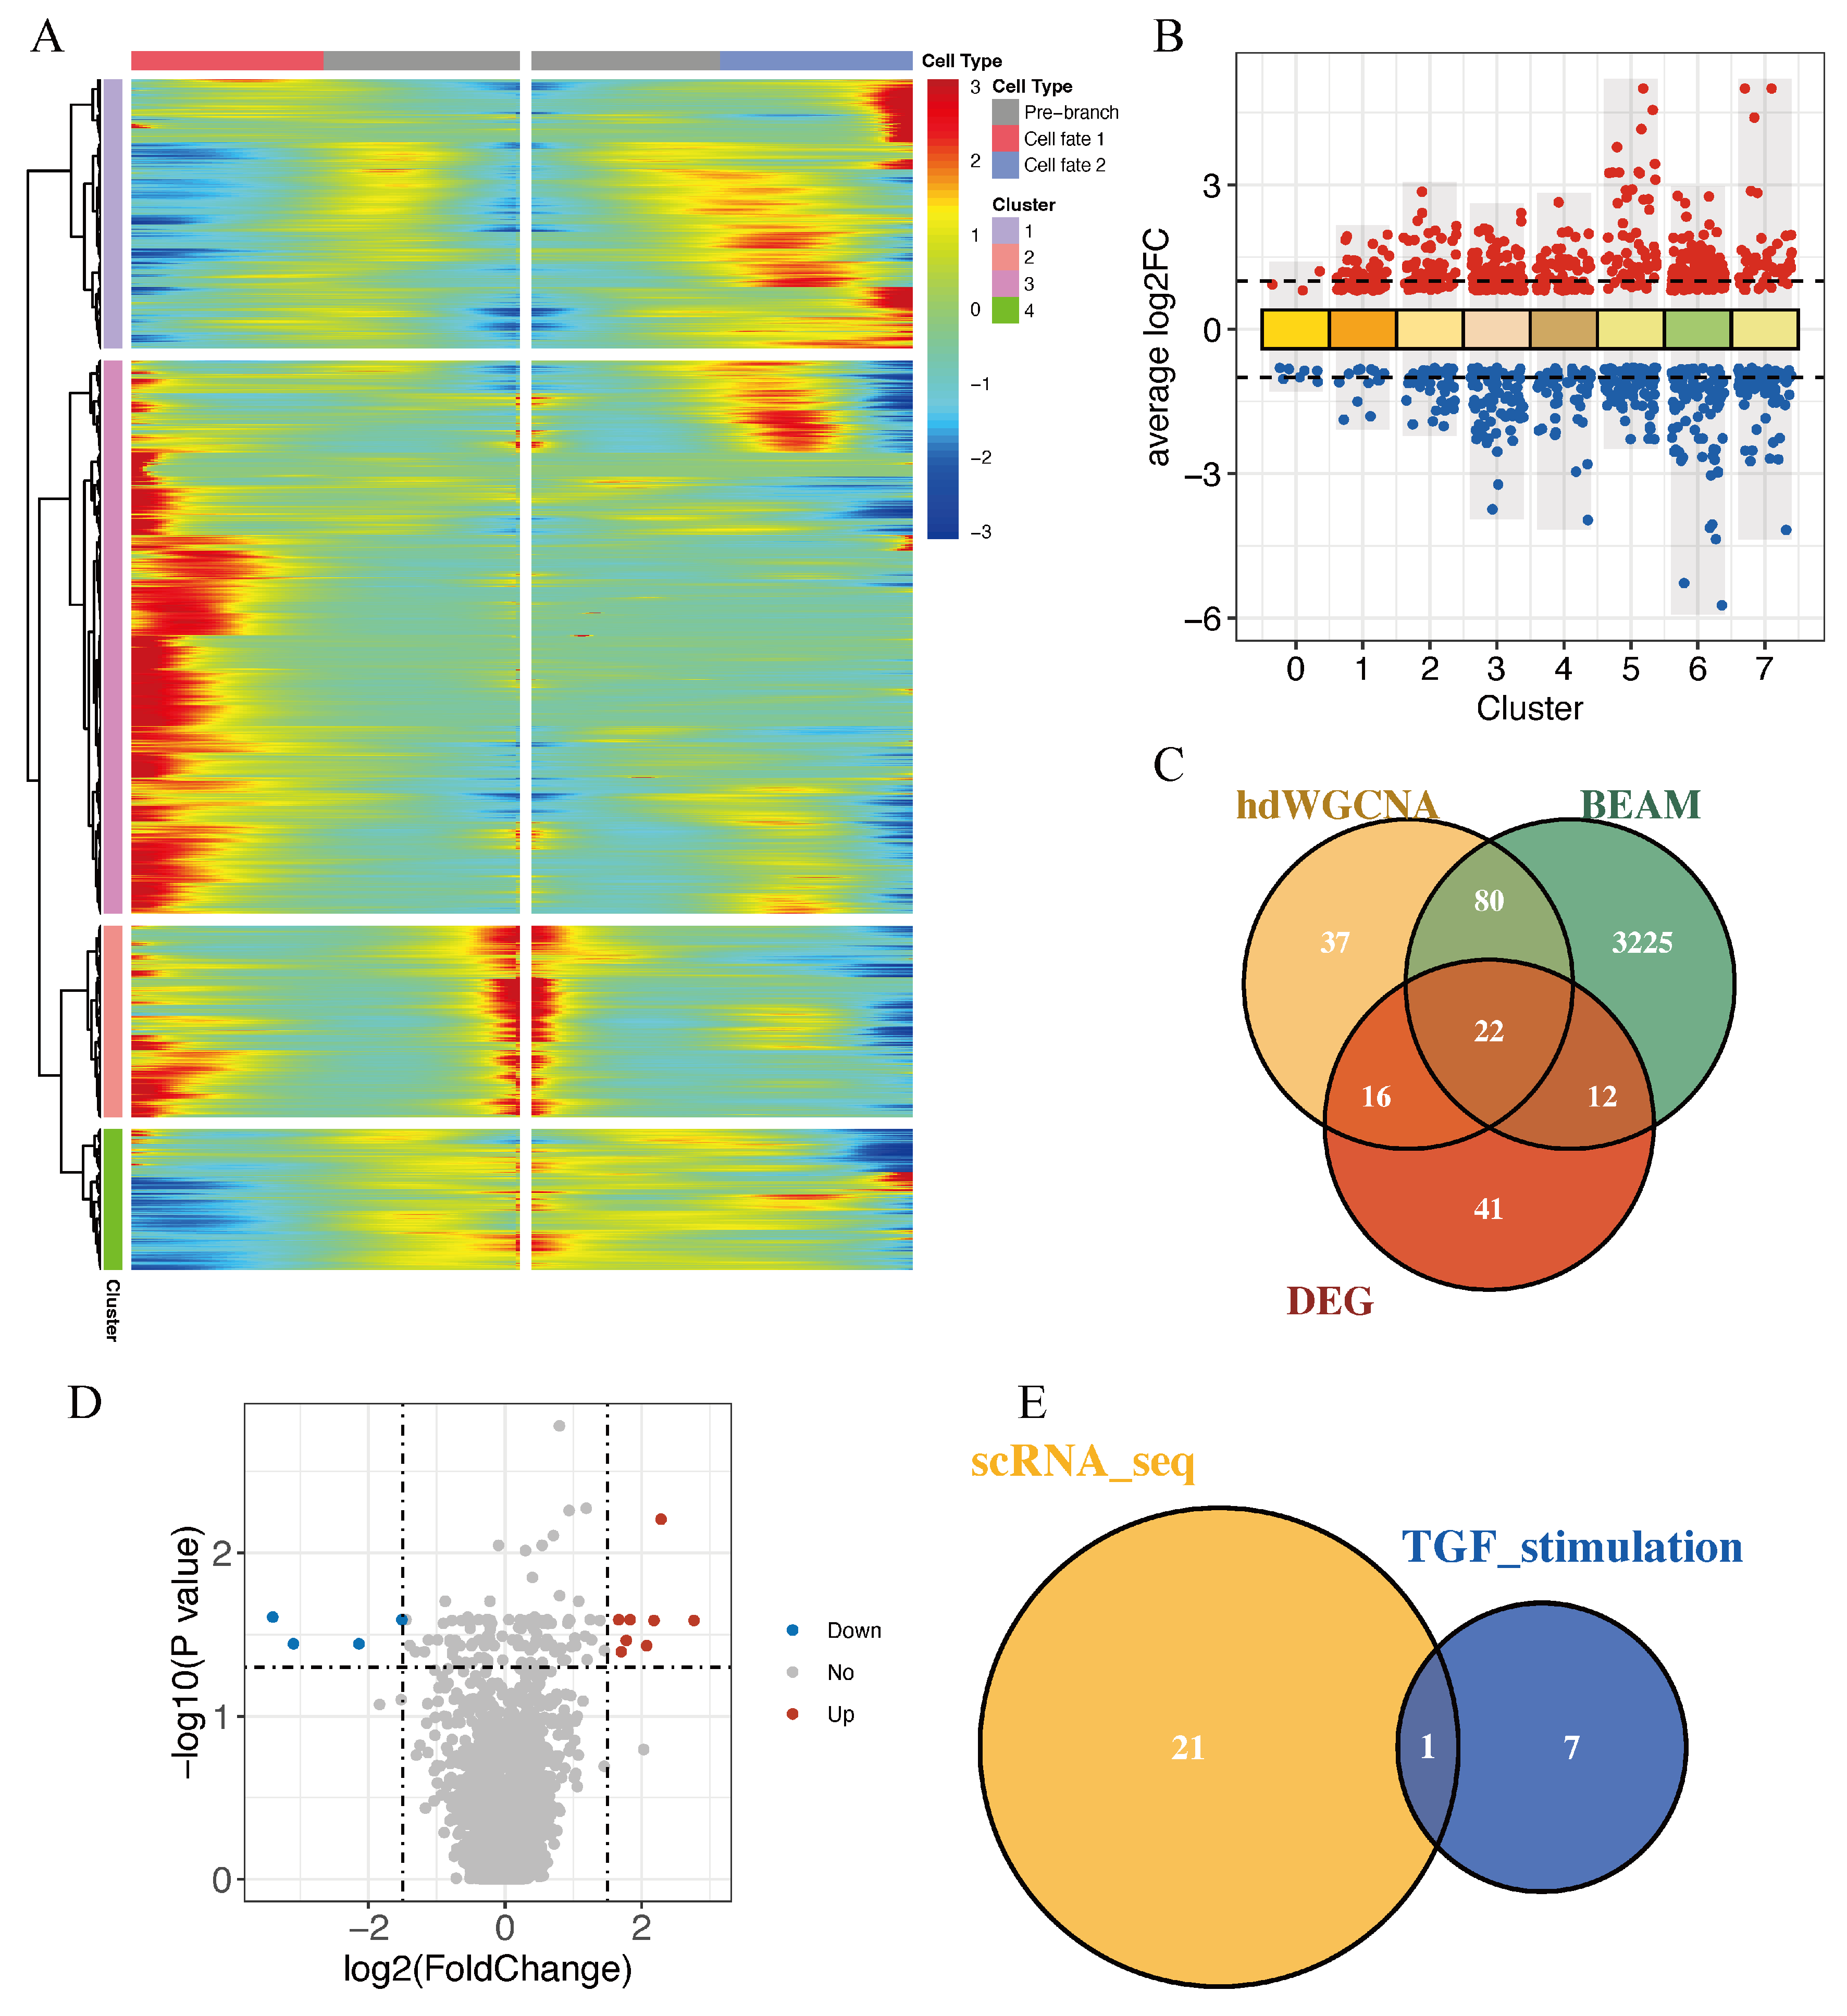
Firstly, three complementary approaches were used to identify genes associated with HNSCC malignant epithelial C1 cells. BEAM analysis based on Monocle trajectories identified 3339 genes associated with branch node 1 (q < 0.0001; Figure 6A). Differential expression analysis between C1 and the other epithelial clusters identified 91 DEGs using |log2FC| > 1 and p < 0.05 (Figure 6B). In addition, 155 hub genes were obtained from the yellow (M2) and red (M3) modules with kME > 0.2. The overlap of these three gene sets resulted in 22 candidate genes associated with the CSC-like C1 population (Figure 6C): LAMC2, LAMB3, ITGA6, IGFBP2, SERPINE1, COL7A1, IGFBP7, ITGA2, DDR1, TAPBP, PLAT, C1R, LGALS3BP, LMAN1, RRBP1, GPC1, LRPAP1, SPARC, RARRES2, TUSC3, PPFIA1, and PGM2L1. Bulk transcriptomic profiling was then performed in FaDu cells stimulated with recombinant human TGFβ1. Differentially expressed genes were identified using |log2FC| > 1.5 and adjusted p < 0.05, yielding 8 upregulated and 4 downregulated genes (Figure 6D). The 8 upregulated genes were MMP9, PMEPA1, SERPINE1, CST6, AMIGO2, ITGB6, SEMA7A, and TGFBI. Among these 8 genes, SERPINE1 was the only one shared with the 22 C1-associated candidate genes (Figure 6E).
Figure 6.
Integrated transcriptomic analysis identifies SERPINE1 as a TGFβ1-responsive gene. (A) Branched heatmap of genes involved in cell-fate decisions, with red and blue denoting high and low expression, respectively. (B) DEGs identified in each cluster compared with the remaining HNSCC malignant epithelial clusters. (C) Venn diagram showing the overlap among hub genes from BEAM-associated genes, hdWGCNA, and DEGs of the HNSCC malignant epithelial C1 cluster. (D) Volcano plot showing DEGs in FaDu cells following TGFβ1 stimulation. (E) Venn diagram depicting the intersection of TGFβ1-upregulated genes with the 22 C1 candidate genes.
3.7. SERPINE1 Mediates TGFβ1-Induced Invasiveness in HNSCC Cells
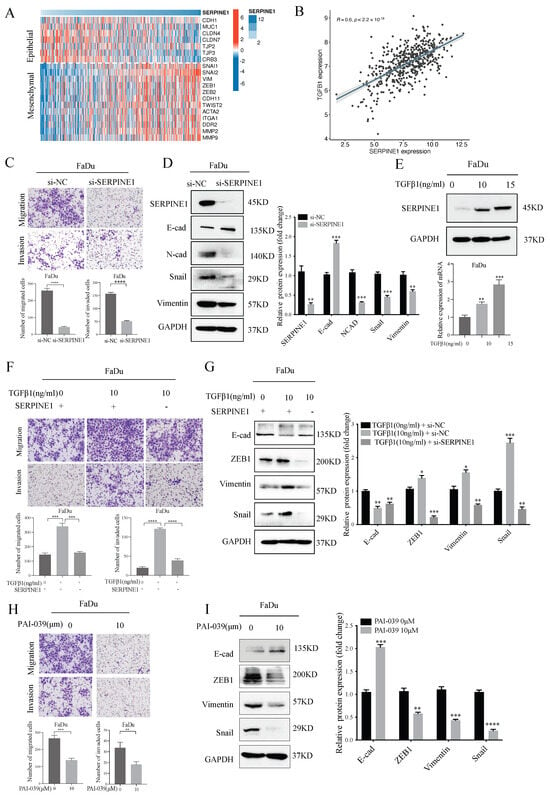
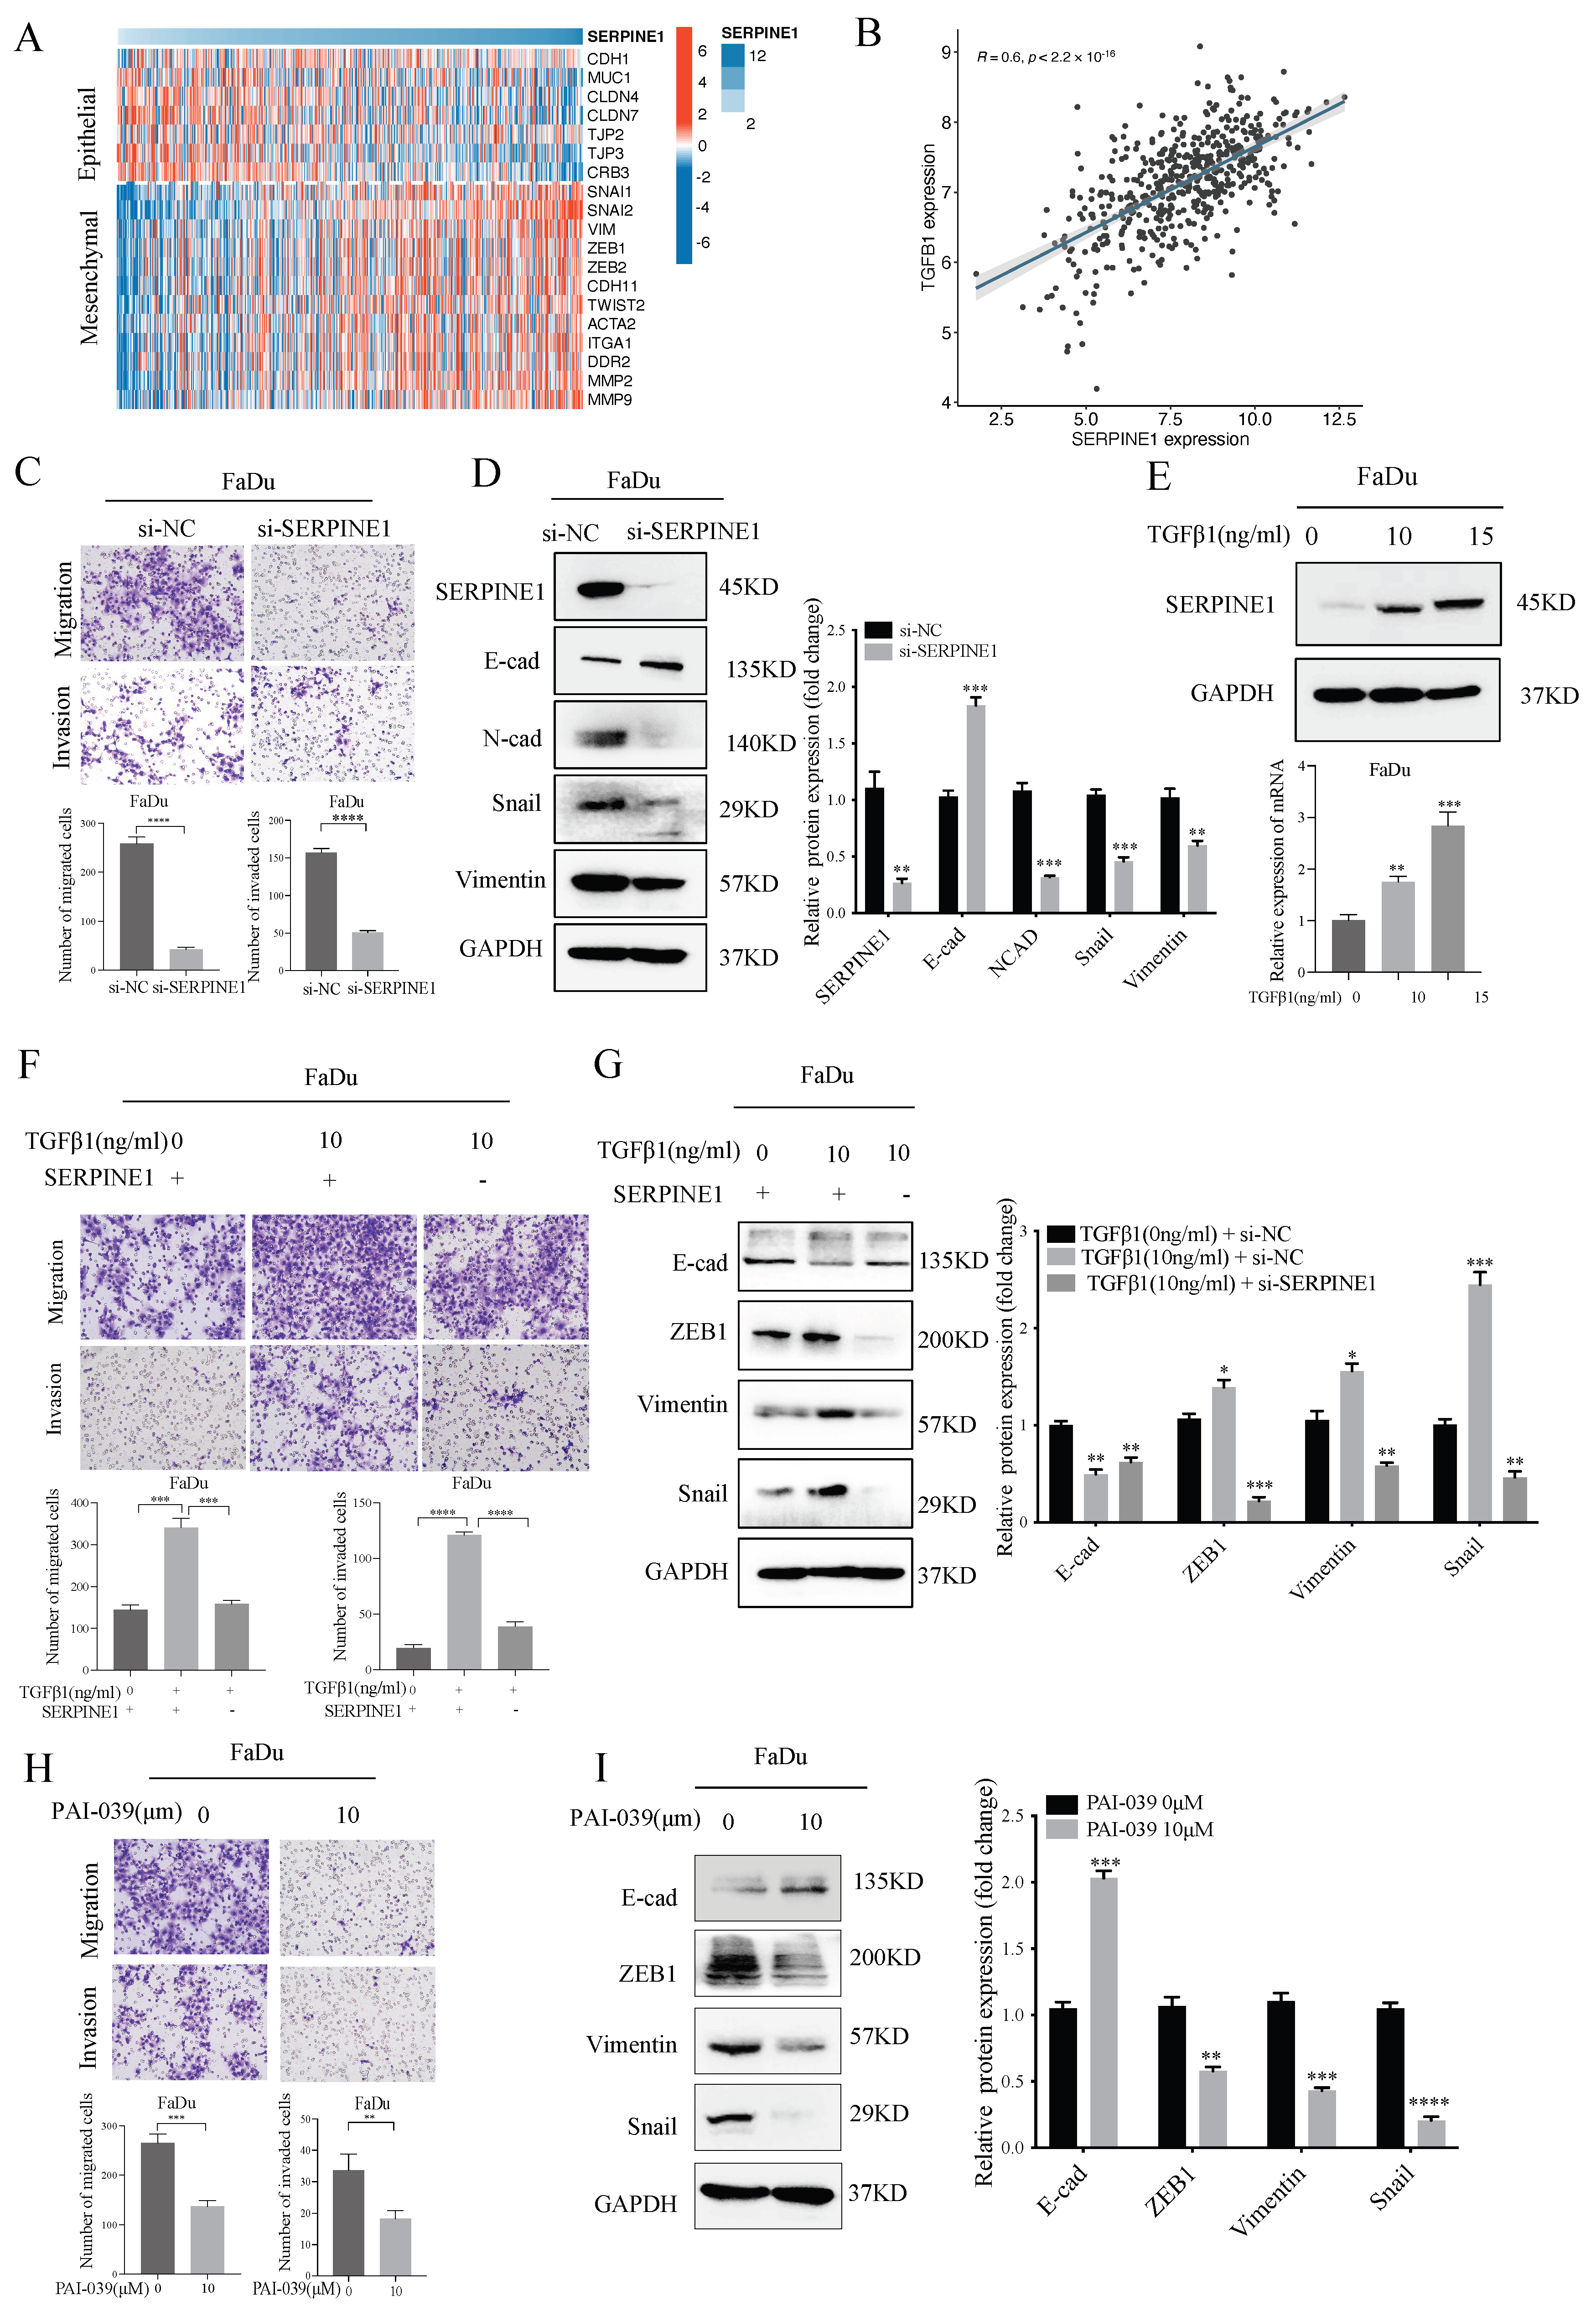
Our findings suggested that SERPINE1 may mediate TGFβ signaling, consistent with previous reports identifying SERPINE1 as a downstream effector of TGFβ [25,26,27,28]. Our previous study showed that SERPINE1 was highly expressed in HNSCC tumor tissues compared with adjacent normal tissues and was associated with worse outcomes [14]. In the TCGA-HNSCC cohort, SERPINE1 expression was associated with EMT activation (Figure 7A) and positively correlated with TGFB1 expression (Spearman r = 0.60, p < 0.0001; Figure 7B), supporting a potential association between SERPINE1 expression and TGFβ1 signaling in HNSCC, although this correlation does not establish a causal relationship. We next investigated whether SERPINE1 contributes to TGFβ1-induced invasiveness in HNSCC cells. SERPINE1 knockdown reduced FaDu cell migration and invasion and suppressed the EMT program (Figure 7C,D). Conversely, TGFβ1 stimulation increased SERPINE1 expression at both the mRNA and protein levels (Figure 7E). Importantly, SERPINE1 knockdown attenuated TGFβ1-induced migration and invasion and partially reversed the associated EMT changes (Figure 7F,G). Pharmacological inhibition of SERPINE1 with PAI-039 reduced FaDu cell migration and invasion and decreased the expression of the mesenchymal markers ZEB1, Snail, and Vimentin (Figure 7H,I). Together, these findings indicate that SERPINE1 contributes to TGFβ1-induced EMT and invasiveness in HNSCC cells.
Figure 7.
SERPINE1 contributes to TGFβ1-induced EMT and invasiveness in HNSCC cells. (A) Heatmap showing the correlation between SERPINE1 expression and EMT-related genes in the TCGA-HNSCC cohort. (B) Spearman correlation analysis showing a positive correlation between SERPINE1 and TGFβ1 expression. (C) Transwell assays showing reduced migration and invasion of SERPINE1-knockdown FaDu cells compared with control cells. (D) Western blot analysis of the effects of SERPINE1 knockdown on EMT-related markers in FaDu cells. (E) Western blot and real-time PCR analyses showing the effects of exogenous TGFβ1 on SERPINE1 expression at the protein and mRNA levels, respectively. (F) Transwell assays showing the effects of SERPINE1 knockdown on TGFβ1-induced migration and invasion. (G) Western blot analysis showing the effects of SERPINE1 knockdown on TGFβ1-induced EMT. (H) Transwell assays showing reduced migration and invasion of FaDu cells treated with the SERPINE1 inhibitor PAI-039. (I) Western blot analysis of EMT-related markers in PAI-039-treated FaDu cells. Experiments were independently repeated three times. Student’s t-test or one-way ANOVA with Dunnett’s test was used, as appropriate. * p < 0.05, ** p < 0.01, *** p < 0.001, and **** p < 0.0001.
4. Discussion
The invasiveness of HNSCC cells represents a key driver of tumor recurrence and metastasis [8,29,30]. However, the malignant epithelial populations that drive these aggressive behaviors remain incompletely characterized [31]. In this study, sc-RNA transcriptomic analysis identified C1 as a malignant epithelial subpopulation with high EMT and stemness features and enhanced TGFβ signaling. Integrative transcriptomic analysis identified SERPINE1 as a TGFβ1-responsive gene associated with C1. Functional studies further showed that SERPINE1 facilitates TGFβ1-induced EMT and invasiveness in HNSCC cells.
EMT is a well-established feature of aggressive HNSCC and has been linked to metastasis, therapeutic resistance, and tumor recurrence [32,33,34,35]. Puram et al. identified a partial EMT (p-EMT) program in HNSCC, with p-EMT cells enriched at the invasive tumor edge and associated with adverse pathological features, including lymph node metastasis [35]. Subsequent single-cell studies have further highlighted the role of EMT-associated malignant cell states in HNSCC progression [36,37]. In our scRNA-seq analysis of primary HNSCC tumors, C1 displayed the highest EMT score among malignant epithelial subpopulations, together with stemness-associated features, including a high CytoTRACE score and an early position along the inferred Slingshot and Monocle trajectories. Together, these findings suggest that C1 represents a relatively less differentiated malignant epithelial population with high EMT activity and stemness features. These features overlap conceptually with the p-EMT program described by Puram et al. However, these similarities do not establish whether C1 represents the previously described p-EMT state or a distinct malignant epithelial subgroup.
TGFβ signaling has been implicated in promoting invasiveness and distant metastasis across various malignancies [38]. In our study, C1 exhibited higher TGFβ signaling activity than the other malignant epithelial subpopulations. Consistent with the single-cell findings, exogenous TGFβ1 enhanced migration and invasion and activated EMT in FaDu cells. These results indicate the critical involvement of TGF-β signaling in promoting the aggressive features of C1 subpopulation cells. However, given the multifaceted roles of TGFβ signaling in physiological conditions, systemic blockade of this pathway may lead to adverse effects by disrupting essential homeostatic functions [38,39]. The failure of recent clinical trials targeting TGFβ signaling highlights these challenges, hinting that targeting downstream effectors may offer a safer and more effective cancer treatment [40,41,42,43,44]. SERPINE1 emerged from our integrated analysis as a potential downstream effector of TGFβ1 signaling. By combining BEAM analysis, differential expression analysis, and hdWGCNA, we first narrowed the genes associated with C1 to 22 candidates. Integration with the transcriptomic response of TGFβ1-stimulated FaDu cells identified SERPINE1 as the only overlapping upregulated gene. Our results align with prior studies demonstrating that SERPINE1 can be induced by TGFβ signaling and contributes to tumor progression in several malignancies [27,45]. Functionally, SERPINE1 knockdown inhibited FaDu cell migration, invasion, and EMT, and partially attenuated the effects of TGFβ1. Pharmacological inhibition of SERPINE1 with PAI-039 produced similar effects. Together, these findings support SERPINE1 as a potential downstream mediator of TGFβ1-induced malignant phenotypes in HNSCC cells. Given the high EMT activity in C1 and its similarities to the p-EMT program described by Puram et al., SERPINE1 may contribute to the invasive behavior of p-EMT-associated tumor cells. However, this possibility requires further investigation.
Several limitations of our study should be acknowledged. First, some single-cell analyses were performed at the cell level without accounting for the non-independence of cells from the same patient, which may have led to overestimation of statistical significance. Second, our functional experiments were performed only in FaDu cells, and the role of the TGFβ1/SERPINE1 axis in HNSCC progression has not been validated in animal models or clinical samples. Further studies are needed to validate these findings and assess the therapeutic potential of SERPINE1 in HNSCC.
In conclusion, our study identifies a malignant epithelial C1 subpopulation characterized by high EMT and stemness features and implicates TGFβ signaling in its aggressive phenotype. Integrated transcriptomic analysis further identifies SERPINE1 as a TGFβ1-responsive candidate effector. Functional studies demonstrate that SERPINE1 contributes to TGFβ1-induced EMT and invasiveness in HNSCC cells. Our findings indicate that targeting SERPINE1 might represent a potential strategy for suppressing TGFβ1-driven tumor progression in HNSCC.
Supplementary Materials
The following supporting information can be downloaded at: https://www.mdpi.com/article/10.3390/biomedicines14112514/s1. Figure S1: Patient-level distribution of malignant epithelial subpopulations in HNSCC. Stacked bar plots showing the proportion of each malignant epithelial subpopulation (clusters 0–7) in individual HPV-negative primary HNSCC samples. Each bar represents one patient sample, and different colors indicate distinct epithelial clusters. Figure S2: TGFβ signaling promotes EMT-associated changes and is associated with poor prognosis in HNSCC. A. Western blotting analysis of the effects of TGFβ1 on EMT marker proteins in FaDu cells; quantification of protein bands shown as fold change is presented on the left side of the panel; B. High TGFβ signaling score predicts reduced OS (left) and DSS (right) in HNSCC according to the TCGA-HNSCC dataset. Supplementary Table S1: Transcriptomic data of TGFβ1-treated FaDu cells. Columns represent the indicated TGFβ1 treatment conditions and individual samples.
Author Contributions
Conceptualization, W.L. and H.L.; methodology, W.L. and H.L.; software, Y.S. and L.D.; validation, C.Z. and S.Z.; formal analysis, H.L. and Y.S.; investigation, H.L., L.D., S.Z. and X.L.; resources, C.Z., W.Z. and J.Z.; data curation, H.L. and Y.S.; writing—original draft preparation, H.L.; writing—review and editing, H.L., Y.S. and W.L.; supervision, W.L.; project administration, W.L. All authors have read and agreed to the published version of the manuscript.
Funding
This research received no external funding.
Institutional Review Board Statement
Not applicable. “This study used commercially available human cell lines (FaDu, Cat. No. 1101HUM-PUMC000996, Chinese Academy of Medical Sciences) and publicly available, de-identified single-cell transcriptomic data (GSE234933 from the GEO database).” Therefore, ethical approval was not required.
Informed Consent Statement
Not applicable.
Data Availability Statement
The publicly available single-cell RNA-seq data analyzed in this study are available from the GEO database (https://www.ncbi.nlm.nih.gov/geo/query/acc.cgi?acc=GSE234933; accessed on 1 October 2024) under accession number GSE234933. The bulk RNA-seq data generated in this study are available from the corresponding author upon reasonable request. The original data presented in the study are included in the article.
Conflicts of Interest
The authors declare no conflicts of interest.
References
- Bray, F.; Laversanne, M.; Sung, H.; Ferlay, J.; Siegel, R.L.; Soerjomataram, I.; Jemal, A. Global cancer statistics 2022: GLOBOCAN estimates of incidence and mortality worldwide for 36 cancers in 185 countries. CA Cancer J. Clin. 2024, 74, 229–263. [Google Scholar] [CrossRef] [Scilit] [PubMed]
- Siegel, R.L.; Kratzer, T.B.; Giaquinto, A.N.; Sung, H.; Jemal, A. Cancer statistics, 2025. CA Cancer J. Clin. 2025, 75, 10–45. [Google Scholar] [CrossRef] [Scilit] [PubMed]
- Han, B.; Zheng, R.; Zeng, H.; Wang, S.; Sun, K.; Chen, R.; Li, L.; Wei, W.; He, J. Cancer incidence and mortality in China, 2022. J. Natl. Cancer Cent. 2024, 4, 47–53. [Google Scholar] [CrossRef] [Scilit] [PubMed]
- Uppaluri, R.; Haddad, R.I.; Tao, Y.; Le Tourneau, C.; Lee, N.Y.; Westra, W.; Chernock, R.; Tahara, M.; Harrington, K.J.; Klochikhin, A.L.; et al. Neoadjuvant and Adjuvant Pembrolizumab in Locally Advanced Head and Neck Cancer. N. Engl. J. Med. 2025, 393, 37–50. [Google Scholar] [CrossRef] [Scilit] [PubMed]
- Guo, S.B.; Hu, L.S.; Huang, W.J.; Zhou, Z.Z.; Luo, H.Y.; Tian, X.P. Comparative investigation of neoadjuvant immunotherapy versus adjuvant immunotherapy in perioperative patients with cancer: A global-scale, cross-sectional, and large-sample informatics study. Int. J. Surg. 2024, 110, 4660–4671. [Google Scholar] [CrossRef] [Scilit] [PubMed]
- Wang, X.; Guo, J.; Yu, P.; Guo, L.; Mao, X.; Wang, J.; Miao, S.; Sun, J. The roles of extracellular vesicles in the development, microenvironment, anticancer drug resistance, and therapy of head and neck squamous cell carcinoma. J. Exp. Clin. Cancer Res. 2021, 40, 35. [Google Scholar] [CrossRef] [Scilit] [PubMed]
- Zhou, J.; He, M.; Zhao, Q.; Shi, E.; Wang, H.; Ponkshe, V.; Song, J.; Wu, Z.; Ji, D.; Kranz, G.; et al. EGFR-mediated local invasiveness and response to Cetuximab in head and neck cancer. Mol. Cancer 2025, 24, 94. [Google Scholar] [CrossRef] [Scilit] [PubMed]
- Morgan, D.; Okwuone, D.D.; Berggren, K.L.; Arnold, L.; Schmidt, A.; Spiess, C.; Smith, H.; Yada, R.; Hendrikse, N.; Madan, R.; et al. MK2 promotes p16 negative head and neck cancer migration, invasion, and metastasis. Cancer Lett. 2025, 622, 217690. [Google Scholar] [CrossRef] [Scilit] [PubMed]
- Okuyama, K.; Suzuki, K.; Yanamoto, S. Relationship between Tumor Budding and Partial Epithelial-Mesenchymal Transition in Head and Neck Cancer. Cancers 2023, 15, 1111. [Google Scholar] [CrossRef] [Scilit] [PubMed]
- Brabletz, S.; Schuhwerk, H.; Brabletz, T.; Stemmler, M.P. Dynamic EMT: A multi-tool for tumor progression. EMBO J. 2021, 40, e108647. [Google Scholar] [CrossRef] [Scilit] [PubMed]
- Celià-Terrassa, T.; Kang, Y. How important is EMT for cancer metastasis? PLoS Biol. 2024, 22, e3002487. [Google Scholar] [CrossRef] [Scilit] [PubMed]
- Khan, A.Q.; Hasan, A.; Mir, S.S.; Rashid, K.; Uddin, S.; Steinhoff, M. Exploiting transcription factors to target EMT and cancer stem cells for tumor modulation and therapy. Semin. Cancer Biol. 2024, 100, 1–16. [Google Scholar] [CrossRef] [Scilit] [PubMed]
- David, C.J.; Massagué, J. Contextual determinants of TGFβ action in development, immunity and cancer. Nat. Rev. Mol. Cell Biol. 2018, 19, 419–435, Erratum in Nat. Rev. Mol. Cell Biol. 2019, 20, 381. [Google Scholar] [CrossRef] [Scilit] [PubMed]
- Zhu, C.; Liu, H.; Li, Z.; Shi, Y.; Zhao, J.; Bai, Y.; Chen, Q.; Li, W. Prognostic Significance and Therapeutic Potential of SERPINE1 in Head and Neck Squamous Cell Carcinoma. Cancer Med. 2025, 14, e70605. [Google Scholar] [CrossRef] [Scilit] [PubMed]
- Bill, R.; Wirapati, P.; Messemaker, M.; Roh, W.; Zitti, B.; Duval, F.; Kiss, M.; Park, J.C.; Saal, T.M.; Hoelzl, J.; et al. CXCL9:SPP1 macrophage polarity identifies a network of cellular programs that control human cancers. Science 2023, 381, 515–524. [Google Scholar] [CrossRef] [Scilit] [PubMed]
- Xiao, Q.; Chen, B.; Yan, J.; Li, C.; Xu, J.; Luo, M.; Wang, B.; Zhu, Y. Single-cell analysis identifies a VIM+ glioma stem-like vascular-immune state linked to myeloid OSM signaling and CEBPD activity. Front. Immunol. 2026, 17, 1863737. [Google Scholar] [CrossRef] [Scilit] [PubMed]
- Smirnov, P.; Przybilla, M.J.; Simovic-Lorenz, M.; Parra, R.G.; Susak, H.; Ratnaparkhe, M.; Wong, J.K.; Körber, V.; Mallm, J.P.; Philippos, G.; et al. Multi-omic and single-cell profiling of chromothriptic medulloblastoma reveals genomic and transcriptomic consequences of genome instability. Nat. Commun. 2024, 15, 10183, Correction in Nat. Commun. 2025, 16, 850. [Google Scholar] [CrossRef] [Scilit] [PubMed]
- Quah, H.S.; Cao, E.Y.; Suteja, L.; Li, C.H.; Leong, H.S.; Chong, F.T.; Gupta, S.; Arcinas, C.; Ouyang, J.F.; Ang, V.; et al. Single cell analysis in head and neck cancer reveals potential immune evasion mechanisms during early metastasis. Nat. Commun. 2023, 14, 1680. [Google Scholar] [CrossRef] [Scilit] [PubMed]
- Zhu, J.; Fan, Y.; Xiong, Y.; Wang, W.; Chen, J.; Xia, Y.; Lei, J.; Gong, L.; Sun, S.; Jiang, T. Delineating the dynamic evolution from preneoplasia to invasive lung adenocarcinoma by integrating single-cell RNA sequencing and spatial transcriptomics. Exp. Mol. Med. 2022, 54, 2060–2076. [Google Scholar] [CrossRef] [Scilit] [PubMed]
- Gulati, G.S.; Sikandar, S.S.; Wesche, D.J.; Manjunath, A.; Bharadwaj, A.; Berger, M.J.; Ilagan, F.; Kuo, A.H.; Hsieh, R.W.; Cai, S.; et al. Single-cell transcriptional diversity is a hallmark of developmental potential. Science 2020, 367, 405–411. [Google Scholar] [CrossRef] [Scilit] [PubMed]
- Street, K.; Risso, D.; Fletcher, R.B.; Das, D.; Ngai, J.; Yosef, N.; Purdom, E.; Dudoit, S. Slingshot: Cell lineage and pseudotime inference for single-cell transcriptomics. BMC Genom. 2018, 19, 477. [Google Scholar] [CrossRef] [Scilit] [PubMed]
- Morabito, S.; Reese, F.; Rahimzadeh, N.; Miyoshi, E.; Swarup, V. hdWGCNA identifies co-expression networks in high-dimensional transcriptomics data. Cell Rep. Methods 2023, 3, 100498. [Google Scholar] [CrossRef] [Scilit] [PubMed]
- Hänzelmann, S.; Castelo, R.; Guinney, J. GSVA: Gene set variation analysis for microarray and RNA-seq data. BMC Bioinform. 2013, 14, 7. [Google Scholar] [CrossRef] [Scilit] [PubMed]
- Rangan, S.R. A new human cell line (FaDu) from a hypopharyngeal carcinoma. Cancer 1972, 29, 117–121. [Google Scholar] [CrossRef] [Scilit] [PubMed]
- Kong, H.J.; Kwon, E.J.; Kwon, O.S.; Lee, H.; Choi, J.Y.; Kim, Y.J.; Kim, W.; Cha, H.J. Crosstalk between YAP and TGFβ regulates SERPINE1 expression in mesenchymal lung cancer cells. Int. J. Oncol. 2021, 58, 111–121. [Google Scholar] [CrossRef] [Scilit] [PubMed]
- Wang, T.; Lu, H.; Li, D.; Huang, W. TGF-β1-Mediated Activation of SERPINE1 is Involved in Hemin-Induced Apoptotic and Inflammatory Injury in HT22 Cells. Neuropsychiatr. Dis. Treat. 2021, 17, 423–433. [Google Scholar] [CrossRef] [Scilit] [PubMed]
- Jiang, Z.; Lu, L.; Liu, Y.; Zhang, S.; Li, S.; Wang, G.; Wang, P.; Chen, L. SMAD7 and SERPINE1 as novel dynamic network biomarkers detect and regulate the tipping point of TGF-beta induced EMT. Sci. Bull. 2020, 65, 842–853. [Google Scholar] [CrossRef] [Scilit] [PubMed]
- Noguchi, R.; Kaji, K.; Namisaki, T.; Moriya, K.; Kawaratani, H.; Kitade, M.; Takaya, H.; Aihara, Y.; Douhara, A.; Asada, K.; et al. Novel oral plasminogen activator inhibitor-1 inhibitor TM5275 attenuates hepatic fibrosis under metabolic syndrome via suppression of activated hepatic stellate cells in rats. Mol. Med. Rep. 2020, 22, 2948–2956. [Google Scholar] [CrossRef] [Scilit] [PubMed]
- Lin, C.W.; Yang, W.E.; Su, C.W.; Lu, H.J.; Su, S.C.; Yang, S.F. IGF2BP2 promotes cell invasion and epithelial-mesenchymal transition through Src-mediated upregulation of EREG in oral cancer. Int. J. Biol. Sci. 2024, 20, 818–830. [Google Scholar] [CrossRef] [Scilit] [PubMed]
- Lu, N.; Jiang, Q.; Xu, T.; Gao, Q.; Wang, Y.; Huang, Z.; Huang, Z.; Xu, X. LncOCMRL1 promotes oral squamous cell carcinoma growth and metastasis via the RRM2/EMT pathway. J. Exp. Clin. Cancer Res. 2024, 43, 267. [Google Scholar] [CrossRef] [Scilit] [PubMed]
- Hwang, B.; Lee, J.H.; Bang, D. Single-cell RNA sequencing technologies and bioinformatics pipelines. Exp. Mol. Med. 2018, 50, 1–14, Correction in Exp. Mol. Med. 2021, 53, 928. [Google Scholar] [CrossRef] [Scilit] [PubMed]
- Weber, P.; Künstner, A.; Hess, J.; Unger, K.; Marschner, S.; Idel, C.; Ribbat-Idel, J.; Baumeister, P.; Gires, O.; Walz, C.; et al. Therapy-Related Transcriptional Subtypes in Matched Primary and Recurrent Head and Neck Cancer. Clin. Cancer Res. 2022, 28, 1038–1052. [Google Scholar] [CrossRef] [Scilit] [PubMed]
- Broghammer, F.; Korovina, I.; Gouda, M.; Celotti, M.; van Es, J.; Lange, I.; Brunner, C.; Mircetic, J.; Coppes, R.P.; Gires, O.; et al. Resistance of HNSCC cell models to pan-FGFR inhibition depends on the EMT phenotype associating with clinical outcome. Mol. Cancer 2024, 23, 39. [Google Scholar] [CrossRef] [Scilit] [PubMed]
- Li, C.F.; Chen, J.Y.; Ho, Y.H.; Hsu, W.H.; Wu, L.C.; Lan, H.Y.; Hsu, D.S.; Tai, S.K.; Chang, Y.C.; Yang, M.H. Snail-induced claudin-11 prompts collective migration for tumour progression. Nat. Cell Biol. 2019, 21, 251–262. [Google Scholar] [CrossRef] [Scilit] [PubMed]
- Puram, S.V.; Tirosh, I.; Parikh, A.S.; Patel, A.P.; Yizhak, K.; Gillespie, S.; Rodman, C.; Luo, C.L.; Mroz, E.A.; Emerick, K.S.; et al. Single-Cell Transcriptomic Analysis of Primary and Metastatic Tumor Ecosystems in Head and Neck Cancer. Cell 2017, 171, 1611–1624.e1624. [Google Scholar] [CrossRef] [Scilit] [PubMed]
- Park, P.H.; Israel, L.E.; Alexander, M.H.; Tartaglia, G.; South, H.G.; Han, S.; Curry, J.M.; Luginbuhl, A.J.; South, A.P. Partial-EMT cell state correlates with single cell pattern of invasion in head and neck SCC keratinocytes. J. Pathol. 2025, 267, 92–104. [Google Scholar] [CrossRef] [Scilit] [PubMed]
- Wang, C.; Sarubo, M.; Chen, S.; Kudo, Y. Partial-EMT in oral squamous cell carcinoma: Molecular circuitry and clinical translation. Int. J. Oral Sci. 2026, 18, 15. [Google Scholar] [CrossRef] [Scilit] [PubMed]
- Barcellos-Hoff, M.H.; Yom, S.S. Revisiting the TGFβ paradox: Insights from HPV-driven cancer and the DNA damage response. Nat. Rev. Cancer 2025, 25, 534–544. [Google Scholar] [CrossRef] [Scilit] [PubMed]
- Liu, S.; Ren, J.; Ten Dijke, P. Targeting TGFβ signal transduction for cancer therapy. Signal Transduct. Target. Ther. 2021, 6, 8. [Google Scholar] [CrossRef] [Scilit] [PubMed]
- Yoo, C.; Javle, M.M.; Verdaguer Mata, H.; de Braud, F.; Trojan, J.; Raoul, J.L.; Kim, J.W.; Ueno, M.; Lee, C.K.; Hijioka, S.; et al. Phase 2 trial of bintrafusp alfa as second-line therapy for patients with locally advanced/metastatic biliary tract cancers. Hepatology 2023, 78, 758–770. [Google Scholar] [CrossRef] [Scilit] [PubMed]
- Metropulos, A.E.; Munshi, H.G.; Principe, D.R. The difficulty in translating the preclinical success of combined TGFβ and immune checkpoint inhibition to clinical trial. EBioMedicine 2022, 86, 104380. [Google Scholar] [CrossRef] [Scilit] [PubMed]
- Oh, D.Y.; Ikeda, M.; Lee, C.K.; Rojas, C.; Hsu, C.H.; Kim, J.W.; Shen, L.; Furuse, J.; Park, J.O.; Borad, M.; et al. Bintrafusp alfa and chemotherapy as first-line treatment in biliary tract cancer: A randomized phase 2/3 trial. Hepatology 2025, 81, 823–836. [Google Scholar] [CrossRef] [Scilit] [PubMed]
- Lim, H.Y.; Heo, J.; Peguero, J.A.; Ryoo, B.Y.; Decaens, T.; Barlesi, F.; Moehler, M.H.; Jehl, G.; Eggleton, S.P.; Bajars, M.; et al. Efficacy and safety of bintrafusp alfa in 2 phase I expansion cohorts with advanced HCC. Hepatology 2025, 81, 32–43. [Google Scholar] [CrossRef] [Scilit] [PubMed]
- Cho, B.C.; Lee, J.S.; Wu, Y.L.; Cicin, I.; Dols, M.C.; Ahn, M.J.; Cuppens, K.; Veillon, R.; Nadal, E.; Dias, J.M.; et al. Bintrafusp Alfa Versus Pembrolizumab in Patients With Treatment-Naive, Programmed Death-Ligand 1-High Advanced NSCLC: A Randomized, Open-Label, Phase 3 Trial. J. Thorac. Oncol. 2023, 18, 1731–1742. [Google Scholar] [CrossRef] [Scilit] [PubMed]
- Habibzadeh, G.; Mokhtari, K.; Heshmati, M.; Salimy, S.; Mei, Z.; Entezari, M.; Hashemi, M.; Fu, J.; Maghsoudloo, M. Identification of lncRNA associated with the SERPINE1 gene in colorectal cancer through TGF-β pathway. Comput. Biol. Med. 2025, 190, 110037. [Google Scholar] [CrossRef] [Scilit] [PubMed]
Disclaimer/Publisher’s Note: The statements, opinions and data contained in all publications are solely those of the individual author(s) and contributor(s) and not of MDPI and/or the editor(s). MDPI and/or the editor(s) disclaim responsibility for any injury to people or property resulting from any ideas, methods, instructions or products referred to in the content. |
© 2026 by the authors. Licensee MDPI, Basel, Switzerland. This article is an open access article distributed under the terms and conditions of the Creative Commons Attribution (CC BY) license.