


Abstract
Background: Chronic post-surgical pain (CPSP) is a debilitating condition with evidence of genetic susceptibility. Most trait-associated variants identified by genome-wide association studies (GWASs) lie in non-coding regions, making functional interpretation challenging. Methods: This study systematically evaluated loci reported across five CPSP GWASs using linkage disequilibrium (LD) resolution, ENCODE4 candidate cis-regulatory element (cCRE) annotation, LD-proxy regulatory overlap analysis, CTCF motif scanning, and gene-level phenotypic association analysis. Results: Of 50 candidate lead genome-wide suggestive variants with a p-value < 10−6, four non-independent clusters were identified, yielding 45 independent loci for downstream analysis. Distal enhancer-like signatures were the most frequent nearest cCRE annotation, occurring at 29/45 loci (64.4%), but no cCRE class was significantly enriched relative to that at 500 random autosomal background positions. Lead SNPs directly overlapped a cCRE at 12/45 loci (26.7%); inclusion of high-LD proxies increased this to 19/45 loci (42.2%), identifying regulatory overlap at seven additional loci not captured by lead-SNP annotation alone. Fifteen loci had a CTCF-bound nearest cCRE, but only one contained a high-confidence canonical CTCF motif. Gene-level PheWAS classification yielded two Strong, 12 Moderate, four Indirect, and 27 None assignments; however, the Moderate-or-above rate was nearly identical to that of 500 random protein-coding genes (31.1% vs. 32.4%; Fisher’s exact p = 1.00). Conclusions: These findings indicate that currently reported CPSP loci do not show large-effect enrichment for a specific regulatory-element class or for genes previously associated with other pain phenotypes. The resulting catalog supports prioritizing individual loci for replication and functional validation, a prerequisite for any future use in preoperative risk stratification.
1. Introduction
Chronic post-surgical pain (CPSP) is a prevalent and debilitating condition that affects a substantial proportion of patients after surgical procedures. It is pain that develops or increases in intensity beyond normal healing and lasts three months or longer after surgery [1], with incidence rates ranging from 3.3% to 85% [2,3,4]. CPSP development involves multiple factors, including biological, psychological, procedural, and environmental factors [5]. There is increasing evidence that supports genetic predisposition in chronic pain susceptibility [4].
The median incidence of chronic pain at 6–12 months after surgery is 20–30% with a slight decrease over time [6,7]. It varies widely by surgical procedure, with higher rates reported after amputation, thoracotomy, and mastectomy [4,8]. Candidate-gene studies have implicated variants in genes such as COMT, OPRM1, and GCH1, but associations have been inconsistent and rarely replicated [9,10]. Genome-wide association studies (GWASs) have established polygenic architectures in other chronic pain conditions. A UK Biobank GWAS of multisite chronic pain showed SNP heritability of about 10% and 39 risk loci enriched for neurogenesis and synaptic plasticity genes [11]. A meta-analysis of 158,000 individuals identified three chronic back pain loci [12]; and a multi-ancestry GWAS of pain intensity in nearly 600,000 veterans identified 126 loci genetically correlated with other pain and psychiatric traits [13]. A systematic review of 57 pain GWASs found that genes reported in multiple studies were enriched for neuronal and immune functions [14]. However, CPSP-specific GWASs remain few and small, and their reported loci show little overlap, partly reflecting differences in surgical populations and phenotype definitions.
The role of protein-coding variants in disease is relatively clear. Loss- or gain-of-function mutations can disrupt normal protein function and are therefore able to exert potentially detrimental effects on a phenotype [15]. The role of a non-coding variant is less obvious. GWASs have found many statistical associations between both coding and non-coding variants and disease, and as most of the genome is non-coding, approximately 95% of the high-confidence, fine-mapped SNPs are in non-coding and flanking regions. This implicates a substantial role for non-coding variation in disease [16].
The Encyclopedia of DNA Elements (ENCODE) registry of candidate cis-regulatory elements (cCREs) provides a comprehensive framework for studying transcriptional regulation across biological contexts. By integrating extensive regulatory genomics data with functional assays, it enables systematic analysis of how CREs influence gene expression and offers new insights into the regulatory mechanisms that shape cellular states and disease susceptibility [17].
A decent portion of SNPs identified in initial GWAS scans are either functional or located within roughly 500 bp of ENCODE annotations, making them likely candidates for functional variants. When considering SNPs in linkage disequilibrium with these, up to 71% of GWAS SNPs may have a causative SNP overlapping a DNase I site, and 31% of loci have a candidate SNP overlapping a transcription factor binding site [18,19]. Phenome-Wide Association Studies (PheWASs) have emerged over the last decade as a research tool. One application is to validate GWAS results. Another is to better understand genetic contributions to human disease and begin identifying shared mechanisms across the human diseasome [20]. Genetic evidence for CPSP susceptibility remains fragmented. Published GWASs span different surgical populations and cohorts, with no prior study jointly re-annotating their combined lead loci against a common regulatory framework. Clarifying which reported loci carry regulatory or phenotypic support is essential for clinical translation, including genetically informed preoperative risk stratification to identify high-risk patients for preventive strategies, such as regional anesthesia [21], or through drug-target prioritization, since drug mechanisms with human genetic support are more likely to succeed in clinical development [22].
This study systematically gathered and verified loci from five published GWASs of CPSP, determined their independence using linkage disequilibrium (LD), tested cCRE overlap at both the lead-SNP and LD-proxy levels, and performed gene-level PheWAS enrichment testing against matched genomic and gene backgrounds.
2. Methods
2.1. Candidate Locus Compilation
Candidate lead variants were compiled from five published GWASs, including the authors’ own published UK Biobank GWAS, yielding 50 candidate lead variants (before LD resolution): Parisien et al. [23], a multi-cohort meta-analysis across five surgery types (~1350 participants, European ancestry) which contributed 24 loci; Li et al. [24] a UK Biobank abdominal-surgery GWAS (N = 27,603), contributed 11 loci; Li et al. [25], a broader all-surgery-types UK Biobank GWAS (N = 95,931), contributed 10 candidate lead SNPs. Warner et al. [26], a Nottingham UK cohort (N = 613), contributed one locus (rs887797, near PRKCA); and Peres et al. [27], the authors’ own UK Biobank CPSP GWAS (N = 38,268), contributed four candidate loci.
Source studies differed in surgical populations and CPSP phenotype (Supplementary Table S1). Parisien et al. analyzed six cohorts: hysterectomy (n = 325), abdominal surgery (n = 90), mastectomy (n = 450), open hernia repair (n = 182), and knee arthroplasty (n = 303). They measured highest pain in the past week (0–10) or worst pain in the past 24 h (Brief Pain Inventory) at 3 months (hysterectomy, abdominal surgery), 6 months (hernia repair, knee arthroplasty), or a mean of 38 months (mastectomy). Pain was analyzed continuously in surgery-specific GWASs and a cross-cohort meta-analysis; the mastectomy GWAS found no loci. Both Li et al. studies defined CPSP using primary-care analgesic prescriptions during the 12 months after first eligible surgery (1997–2015), excluding participants with >3 months of analgesic records in the prior year. Cases had prescriptions for >3 of 12 months after abdominal surgery (1044 cases), or ≥4 months after major or minor surgery across fields (2923 cases; white British ancestry). Warner et al. studied hip or knee replacement for osteoarthritis, defining possible neuropathic pain as painDETECT > 12 (109 cases, 504 controls). The authors’ GWAS defined cases by self-reported, physician-diagnosed CPSP (Field 120005) linked to hospital-recorded index surgery from 2000. Controls were matched by surgery type and year; participants had European genetic ancestry. As analyses used only published lead-variant results, no participant-level selection was performed. Loci were annotated as reported; source surgical populations are listed in Table 1. All retained loci meet p < 10−6, and the majority meet p < 5 × 10⁻⁷, a relaxed threshold with established precedent [28,29] for downstream functional annotation work of this kind, rather than primary discovery.
Table 1.
Complete locus annotation (45 retained loci).
2.2. Linkage Disequilibrium Resolution
Pairwise LD between candidate loci was assessed by computing pairwise r2 values for all locus pairs located on the same chromosome within 2 Mb of each other. Reference panels were matched to the reported ancestry of each source study: 1000 Genomes CEU for Parisien et al. and for the authors’ previously published GWAS, and 1000 Genomes EUR for Li et al. Where available, LD estimates derived from UK Biobank British-ancestry participants (UKBB-LD; N = 337,151) were used as a cross-check against 1000 Genomes estimates, with the larger-sample value reported as primary; otherwise, 1000 Genomes estimates were used. Clusters of non-independent loci were collapsed to a single representative variant with the strongest association p-value, and independence of the retained variants was confirmed at r2 < 0.01.
Where LD estimates were not available through a query tool, r2 was computed directly from phased 1000 Genomes genotypes. Variant coordinates were lifted over to GRCh38, genotypes were retrieved by region from EBI-hosted files using tabix, and r2 was calculated from haplotype frequencies (D = p_AB − p_A·p_B; r2 = D2/[p_A(1 − p_A)p_B(1 − p_B)]). This pipeline was validated against a pair with a published Ensembl r2 (rs6792369/rs1042779, 1000 Genomes KHV). |D′| was not interpreted for variants with minor allele frequency < 0.5%, where the statistic is numerically unstable.
2.3. ENCODE cCRE Annotation
Each of the retained loci was annotated against the ENCODE4 Registry of cCREs (SCREEN, screen.encodeproject.org) using SCREEN’s bulk-downloadable cCRE files. These files currently serve the expanded V4 registry (2,348,854 human cCREs, eight classes [17]: Promoter-Like Signature (PLS), proximal Enhancer-Like Signature (pELS), distal Enhancer-Like Signature (dELS), Chromatin-Accessible with CTCF (CA-CTCF), Chromatin-Accessible with H3K4me3 (CA-H3K4me3), Chromatin-Accessible, Transcription-Factor-bound (CA-TF), Chromatin-Accessible (CA), Transcription-Factor-bound (TF)). The nearest cCRE within a ±50 kb window was identified per locus. CTCF-bound status was assigned via membership in SCREEN’s CTCF-Bound cCREs composite file, which applies the same CTCF_maxZ ≥ 1.64 threshold used in the V3 analysis as part of ENCODE’s published cCRE classification methodology, though raw Z-scores were not independently re-extracted for this V4 pass.
2.4. LD-Proxy Regulatory Overlap
To assess whether limiting cCRE annotation to lead SNPs alone underestimates regulatory overlap due to linked variants, each lead SNP was expanded to include its high-LD proxies. Unlike the proximity-based nearest-cCRE approach above, this method directly tests overlap. All biallelic SNVs within ±500 kb of each lead SNP were identified from phased 1000 Genomes genotypes (GRCh38 liftover), using the appropriate ancestry-matched reference panel (see Section 2.2 above). Pairwise r2 values were computed from phased haplotypes using the validated method described previously. Proxies with r2 ≥ 0.8 were retained. Both the lead SNP and each retained proxy were then checked for direct overlap with a V4 cCRE (variant position within cCRE boundaries), a stricter criterion than the nearest-within-50 kb window used in the primary cCRE annotation. Non-overlapping proxies were not further annotated because this analysis was designed specifically to assess direct cCRE overlap rather than proximity.
2.5. Background Enrichment Test
To test whether the observed cCRE class distribution differs from genomic background, 500 random autosomal positions (≥5 Mb from chromosome ends, ENCODE-blacklist-excluded, ≥1 Mb from any of the study loci) were annotated using an identical pipeline. Class proportions were compared using Fisher’s exact test for each of the eight ENCODE V4 cCRE classes (PLS, pELS, dELS, CA-CTCF, CA-H3K4me3, CA-TF, CA, TF), with Benjamini–Hochberg correction across the eight tests.
2.6. CTCF Motif Scanning
Loci classified as CTCF-bound were scanned for the canonical CTCF binding motif (JASPAR MA0139.1) using position-weight-matrix scoring (Biopython), applying a significance threshold of 8.45 bits (p < 1 × 10⁻⁴). This is a targeted presence/absence check against a known motif, not de novo discovery.
2.7. Gene-Level Phenotype Association Analysis
Because CPSP-associated variants are not individually cataloged in the GWAS Catalog or Open Targets Genetics, phenotype associations were assessed at the gene level. For each locus, the nearest protein-coding gene within 50 kb was identified, with the window extended to 500 kb where no gene was found; non-coding features were excluded even if they were physically closer. Loci with no protein-coding gene within 500 kb were classified as gene deserts. Each gene was queried against the Open Targets Platform (v24.06) for aggregated disease-association scores and classified as Strong, Moderate, Indirect, or None for pain-related phenotypes. This approach provides gene-level rather than variant-level evidence and does not establish that the CPSP-associated regulatory element regulates the assigned gene or acts through a pain-relevant mechanism. Nearest-gene assignment was used as a standardized, reproducible positional benchmark for the PheWAS comparison and does not capture long-range enhancer–promoter contacts identified by chromatin-conformation methods [30,31]. Because the Open Targets Platform aggregates associations from many sources and most genes therefore accumulate numerous associations, the aggregate Moderate-or-above rate across all loci was benchmarked against a random protein-coding gene background.
As a sensitivity analysis, both background enrichment tests (cCRE class distribution and gene-level PheWAS Moderate-or-above rate) were repeated while restricted to the 25 loci meeting genome-wide significance (p < 5 × 10⁻⁸) to assess whether inclusion of suggestive-threshold loci diluted a true signal present among the most robustly associated loci.
2.8. Statistical Analysis
All analyses were performed in Python 3.11.13 using pandas 2.1.4, SciPy 1.11.4, statsmodels 0.14.0, and Biopython 1.84; figures were generated with matplotlib 3.8.0. All Fisher’s exact tests were two-sided, so depletion as well as enrichment relative to background could be detected. Statistical significance was set at p < 0.05; for the eight cCRE class comparisons, Benjamini–Hochberg false discovery rate correction was applied across the eight tests. The CTCF-bound and gene-level PheWAS comparisons were each tested once and not corrected. Post hoc power for the two-sided Fisher’s exact test comparing study loci with 500 background positions or genes was estimated by exact enumeration of binomial outcomes in both groups, using the observed background proportion as the null frequency. The minimum detectable odds ratio (MDOR) was the smallest odds ratio yielding 80% power at α = 0.05. Exploratory, non-prespecified analyses repeated dELS, CTCF-bound, and PheWAS Moderate-or-above comparisons by source-GWAS surgical population, cohort, and by excluding each UK Biobank source study in turn, using full background sets as comparators. Benjamini–Hochberg correction covered 30 subgroup tests; subgroup heterogeneity was assessed using a permutation chi-square test (20 K permutations).
3. Results
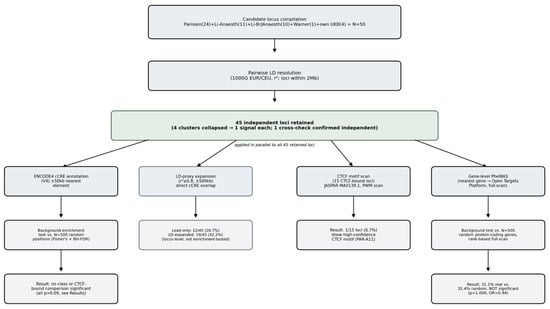
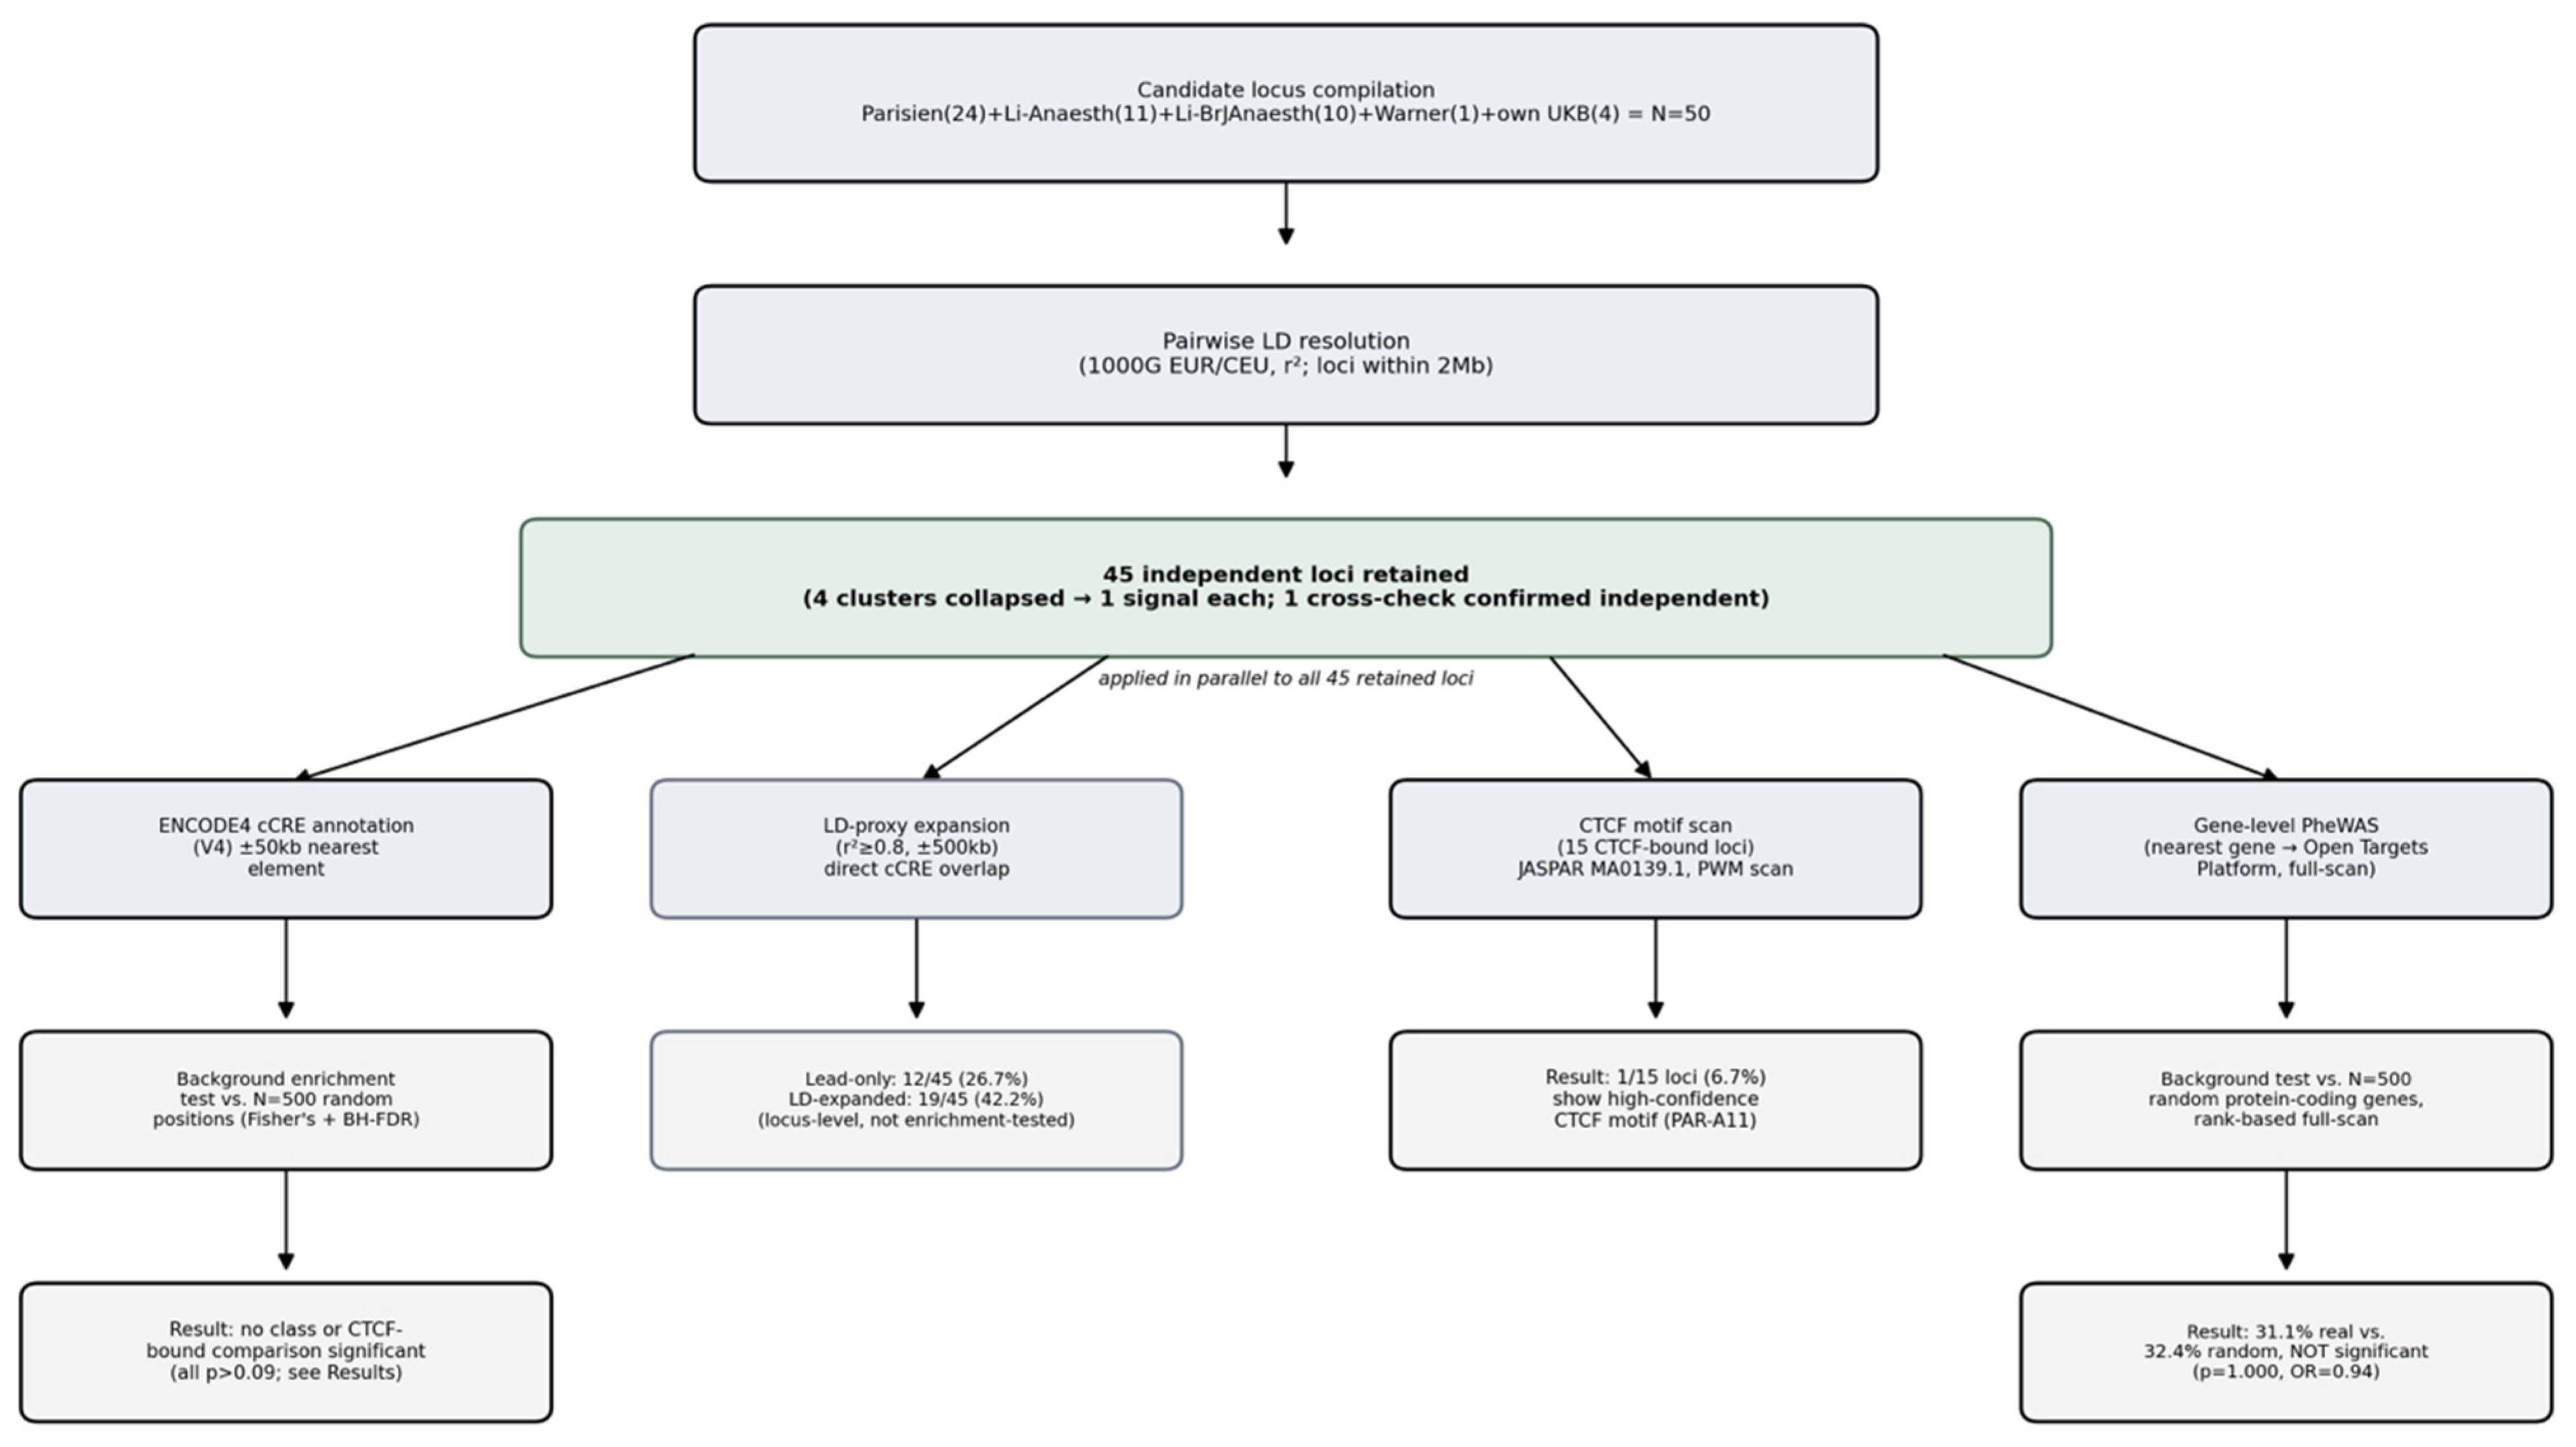
The study overview is shown in Figure 1.
Figure 1.
Analysis pipeline: candidate locus compilation (n = 50) through LD resolution to 45 independent loci, followed by nearest-cCRE annotation and genomic-background testing, LD-proxy regulatory overlap analysis, CTCF motif analysis, and gene-level PheWAS with random-gene background comparison.
3.1. Locus Compilation and Independence Resolution
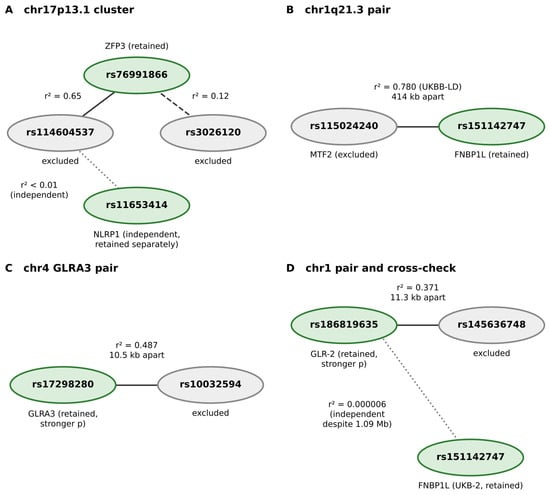
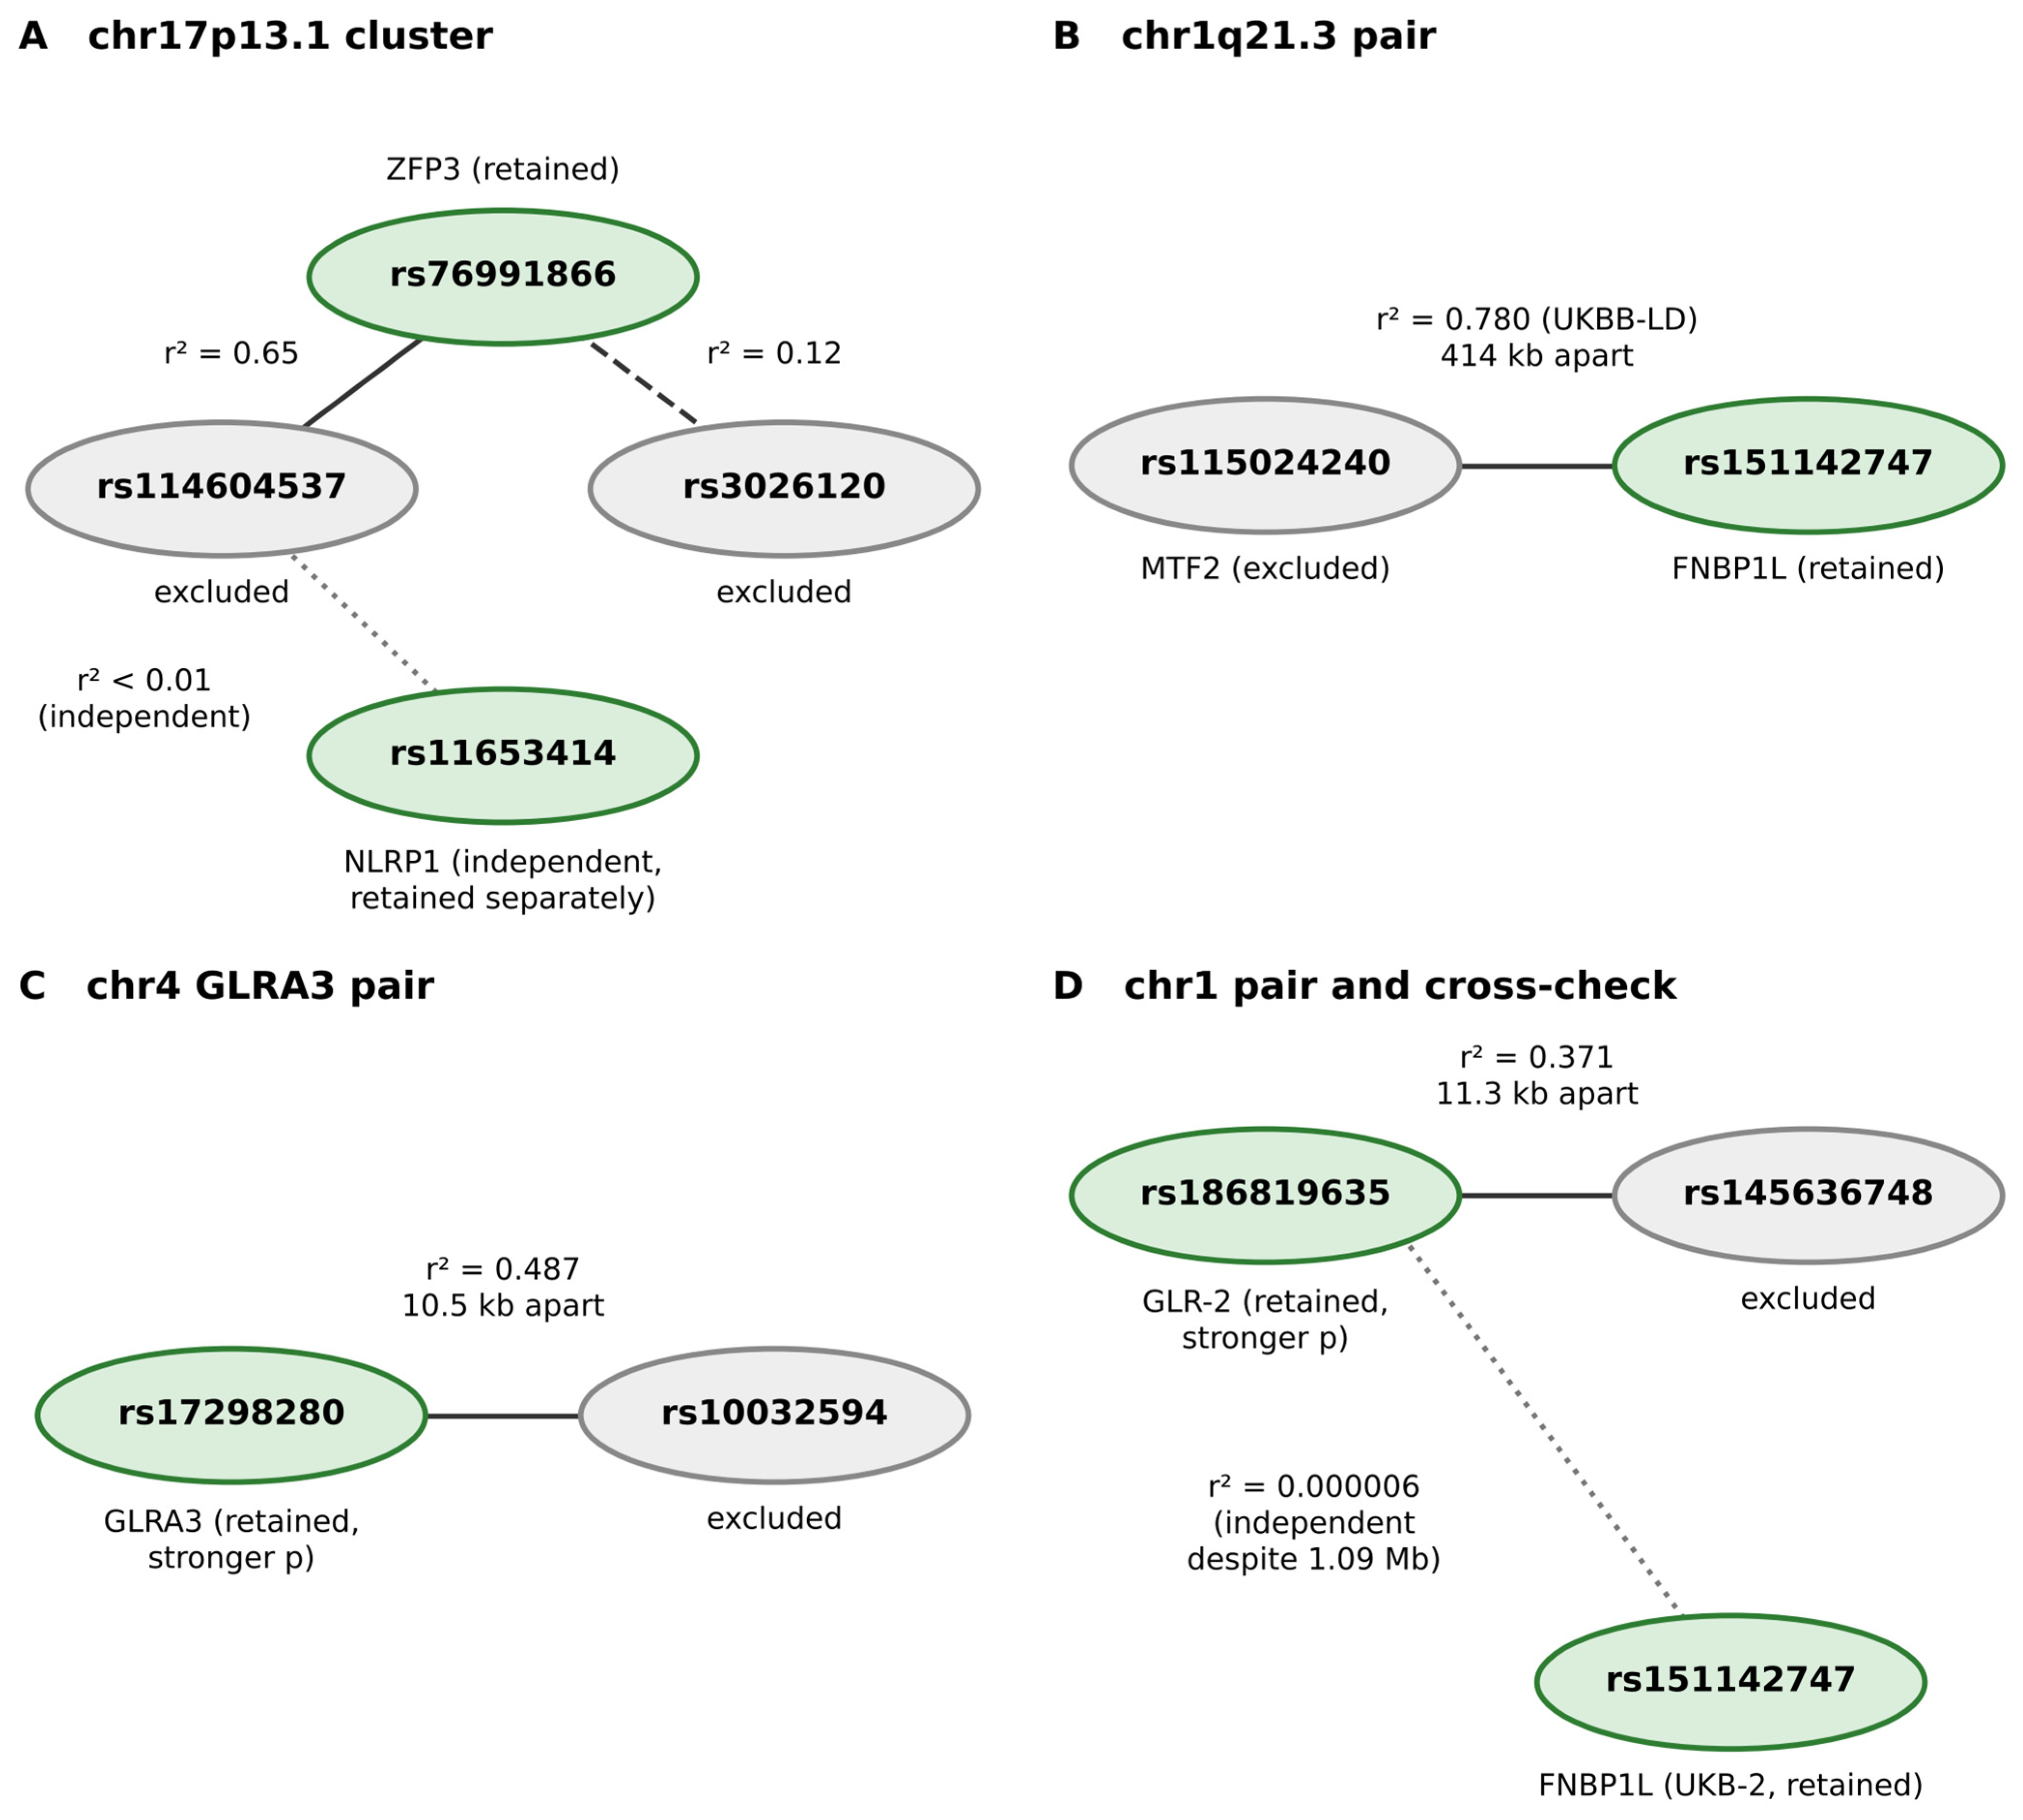
Of 50 candidate lead variants, LD analysis identified four non-independent clusters (Figure 2), yielding 45 independent loci for all downstream analyses. A three-variant chromosome 17p13.1 cluster (rs76991866, rs114604537, rs3026120; r2 = 0.12–0.65, 1000 Genomes CEU) collapsed to rs76991866 as the strongest-p-value representative, with a nearby fourth variant (rs11653414, NLRP1) confirmed independent (r2 = 0.006, computed directly from phased 1000 Genomes CEU genotypes, n = 198 haplotypes; see Section 2) and retained separately. A chromosome 1q21.3 pair (rs115024240/MTF2 and rs151142747/FNBP1L) in strong LD despite 414 kb physical separation (1000 Genomes CEU, N = 99: r2 = 1.0000; UKBB-LD, N = 337,151: r2 = 0.780, reported as primary) collapsed to FNBP1L as the representative variant. Within the chr4 GLRA3 region, rs17298280 and rs10032594 collapsed to rs17298280 (r2 = 0.487, 1000 Genomes EUR, n = 522), and within a chr1 region, rs186819635 and rs145636748 collapsed to rs186819635 (r2 = 0.371, 1000 Genomes EUR, n = 522)—the latter also confirmed to be independent of the existing FNBP1L locus despite a 1.09 Mb physical proximity: r2 = 0.000006, computed directly from phased 1000 Genomes EUR genotypes (n = 1006 haplotypes, 503 individuals; see Section 2), consistent in magnitude with two earlier third-party-tool-derived estimates (r2 = 0.000022 and r2 = 0.000024) obtained before this direct computation was available. |D’| from the direct computation was 1.0—it is an instance of the same low-minor-allele-frequency instability described above, not a contradiction of the r2 result, and it is not interpreted. This yielded 45 independent loci for downstream analysis.
Figure 2.
Resolution of the four non-independent clusters. (A) Chromosome 17p13.1 cluster: rs76991866 was retained; rs114604537 (r2 = 0.65) and rs3026120 (r2 = 0.12) were collapsed (1000 Genomes CEU); rs11653414 (NLRP1) was independent (r2 = 0.006) and retained separately. (B) Chromosome 1q21.3 pair: rs151142747 (FNBP1L) was retained, and rs115024240 (MTF2) collapsed (r2 = 0.780, UKBB-LD; 414 kb apart). (C) Chromosome 4 GLRA3 pair: rs17298280 was retained, and rs10032594 collapsed (r2 = 0.487, 1000 Genomes EUR). (D) Chromosome 1 pair: rs186819635 was retained, and rs145636748 collapsed (r2 = 0.371, 1000 Genomes EUR); rs186819635 was independent of rs151142747 (r2 = 0.000006) despite 1.09 Mb proximity. Green, retained variants; grey, excluded variants.
3.2. Nearest cCRE Classification
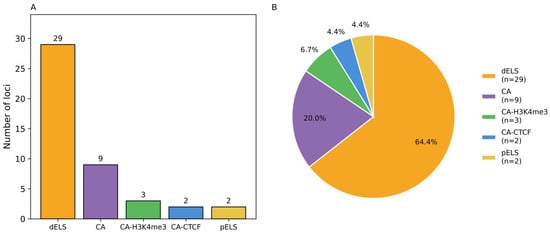
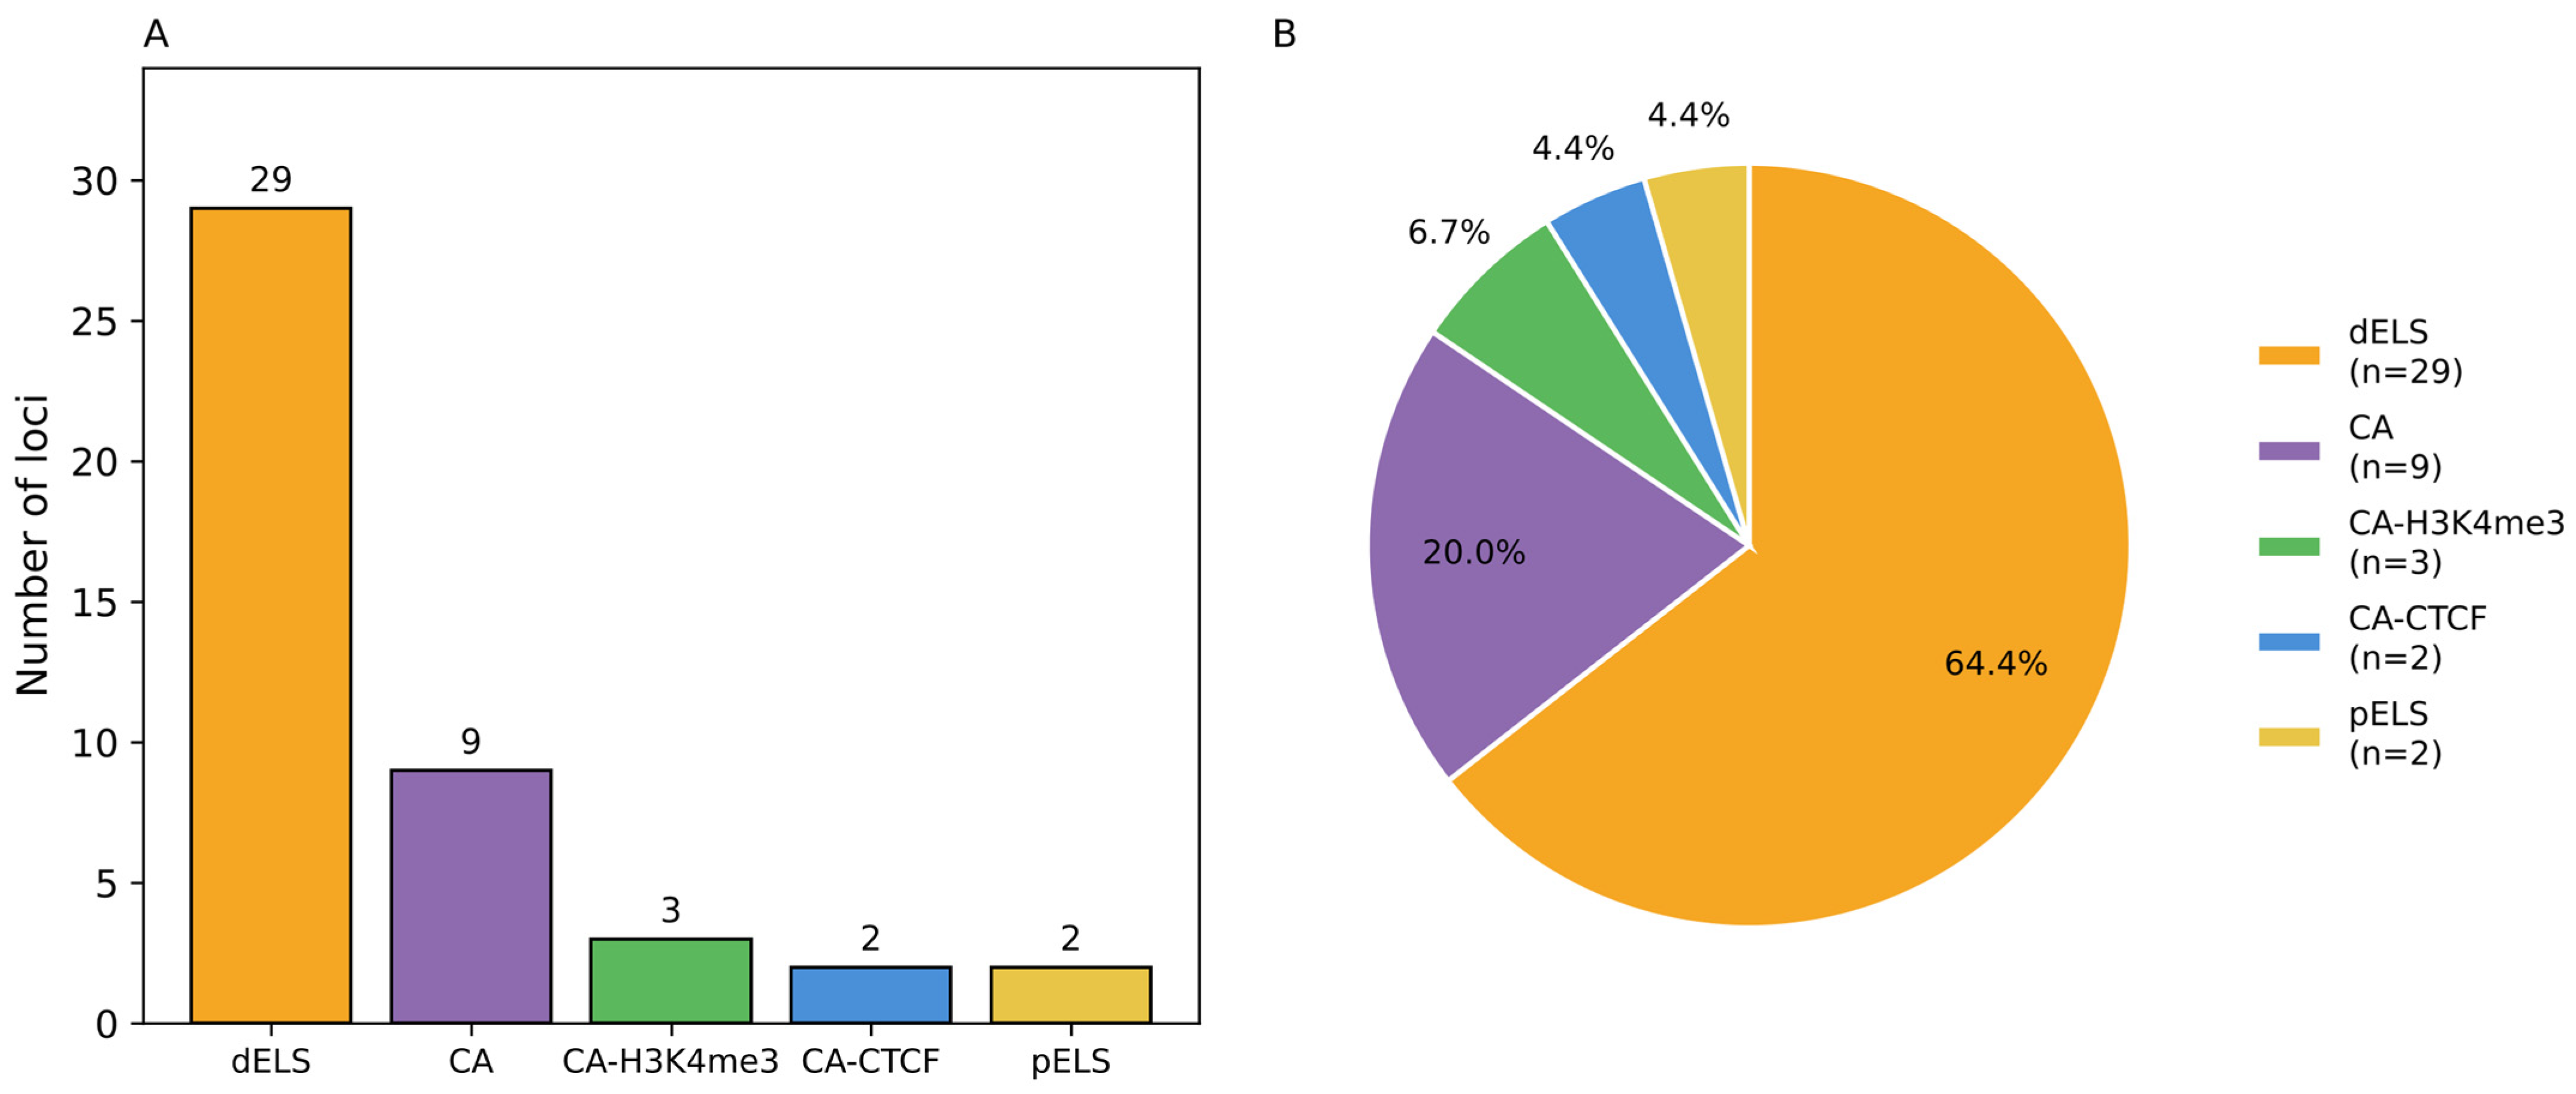
Across the 45 loci, the nearest cCRE was classified as dELS for 29 loci (64.4%), CA for 9 (20.0%), CA-H3K4me3 for 3 (6.7%), CA-CTCF for 2 (4.4%), and pELS for 2 (4.4%); no locus’s nearest element fell in the PLS, CA-TF, or TF classes (Table 1; Figure 3). Fifteen of 45 loci (33.3%) had a CTCF-bound nearest element (composite-file membership). Note that CTCF-bound status here reflects the nearest cCRE’s class, not direct variant overlap; see Section 3.3 below for the direct-overlap analysis.
Figure 3.
Nearest cCRE class distribution across the 45 retained loci. (A) Number of loci per class. (B) Percentage of loci per class; percentages do not sum to 100% because of rounding.
3.3. LD-Proxy Regulatory Overlap
Lead SNPs alone directly overlapped a cCRE at 12/45 loci (26.7%). Expanding to include high-LD proxies raised this to 19/45 (42.2%), identifying annotated regulatory overlap at seven additional loci where the lead SNP itself does not overlap any cCRE: UKB-2, PAR-A5, PAR-A7, PAR-A12, PAR-D1, PAR-E1, and GLR-8 (Table 2). At four of these seven, the overlapping proxy’s cCRE was itself CTCF-bound (PAR-A7, PAR-D1, PAR-E1, GLR-8); the other three overlapped non-CTCF-bound elements (dELS or TF class). Of the remaining 26 loci with no lead-or-proxy overlap, 12 had no proxy at r2 ≥ 0.8 within the search window at all; for these, the lead-SNP annotation already represented the complete regulatory picture available at this LD threshold, while 14 had one or more qualifying proxies, none of which overlapped a cCRE.
Table 2.
LD-Proxy Regulatory Overlap (45 Loci).
3.4. Background Enrichment Test
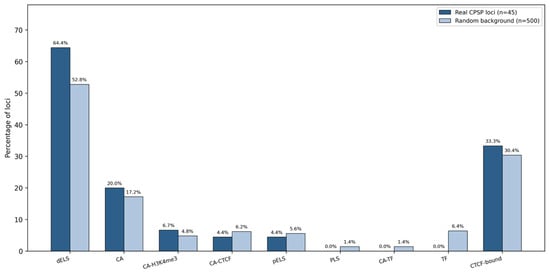
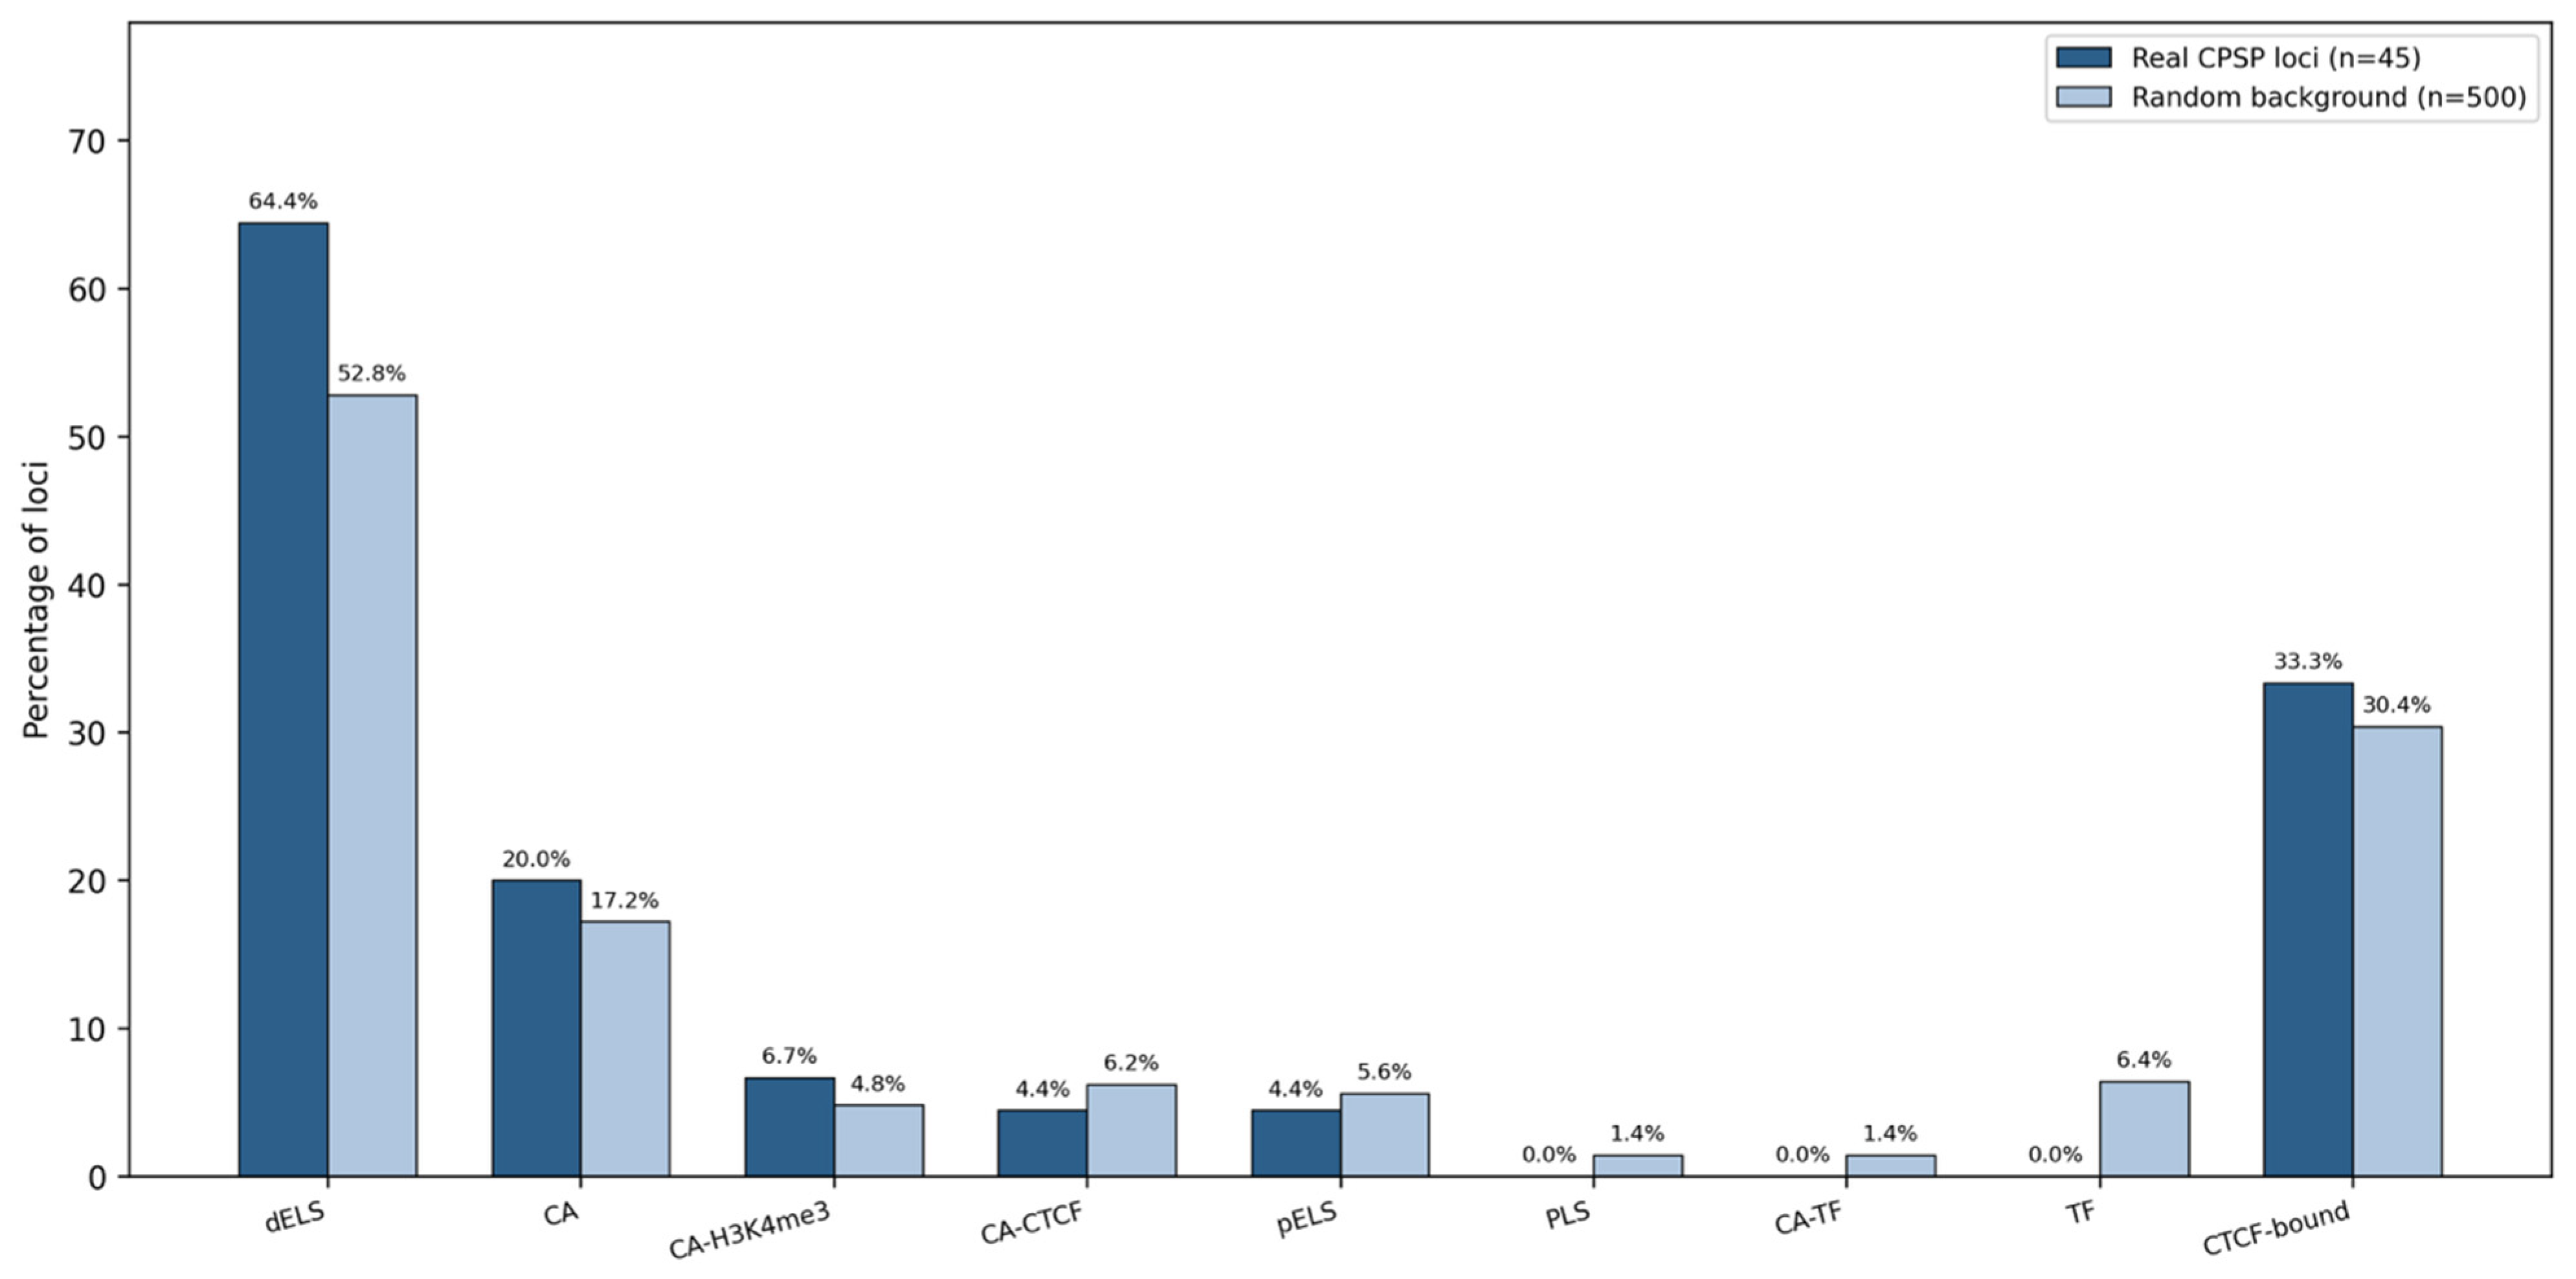
No cCRE class differed nominally between real loci and background: dELS (29/45, 64.4% vs. 264/500, 52.8%; OR = 1.62, p = 0.160), CA (9/45, 20.0% vs. 86/500, 17.2%; OR = 1.20, p = 0.681), CA-H3K4me3 (3/45, 6.7% vs. 24/500, 4.8%; OR = 1.42, p = 0.481), CA-CTCF (2/45, 4.4% vs. 31/500, 6.2%; OR = 0.70, p = 1.000), pELS (2/45, 4.4% vs. 28/500, 5.6%; OR = 0.78, p = 1.000), PLS (0/45 vs. 7/500; p = 1.000), CA-TF (0/45 vs. 7/500; p = 1.000), and TF (0/45 vs. 32/500, 6.4%; OR = 0.00, p = 0.098). The lowest p-value, for TF, did not survive false discovery rate correction across the eight classes (p_FDR = 0.641). CTCF-bound status also did not differ between real loci and background (15/45, 33.3% vs. 152/500, 30.4%; OR = 1.15, p = 0.736) (Figure 4). With 45 loci and 500 background positions, power was 80% to detect odds ratios of 2.58 for dELS (74.3% vs. 52.8%), 2.45 for CTCF-bound status, and 2.44 for PheWAS Moderate-or-above rate. Power to detect the observed dELS odds ratio (1.62; 95% CI 0.86–3.06) was 30%.
Figure 4.
cCRE class distribution (ENCODE4 V4 registry): real loci (n = 45) vs. random genomic background (n = 500). No class or CTCF-bound comparison reached nominal significance.
3.5. CTCF Motif Validation
Of the 45 loci, 15 had a CTCF-bound nearest cCRE (Table 1) and were evaluated for the canonical CTCF motif to assess whether binding was likely motif-directed. One locus (1/15, 6.7%) contained a high-confidence match: rs79423608 (PAR-A11, near LCMT1), with a score of 14.19 bits, well above the 8.45-bit threshold. No other locus reached this threshold. The two closest near-misses were rs11653414 (PAR-D5, near NLRP1; 8.07 bits) and rs138470454 (GLR-5, near FRMD4A; 7.88 bits), both falling below the threshold by less than 0.6 bits. The remaining 12 CTCF-bound loci scored between −2.09 and 5.15 bits: rs117920312 (LI-10, near RAD51B; 5.15 bits), rs1596479 (PAR-E1, near CDH7; 3.21 bits), rs76985919 (PAR-A9, near SERPINA1; 3.20 bits), rs182762077 (LI-5, near EPB41L4A; 2.95 bits), rs78134813 (LI-9, near FUT8; 0.34 bits), rs151142747 (UKB-2, near FNBP1L; 0.23 bits), rs78326996 (PAR-A7, near PRXL2C; −0.81 bits), rs112030385 (PAR-B2, near DSC3; −1.12 bits), rs143994530 (PAR-A1, near DDX18; −1.60 bits), rs4347600 (PAR-A10, near CRTC3; −1.78 bits), rs76991866 (PAR-D3, near ZFP3; −1.79 bits), and rs17298280 (GLR-4, near GLRA3; −2.09 bits).
3.6. Gene-Level Phenotype Associations
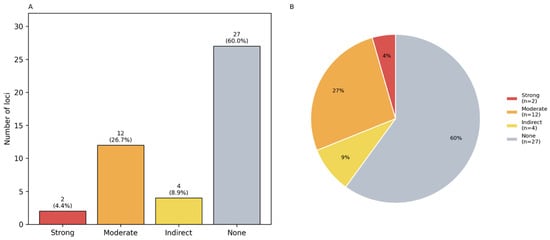
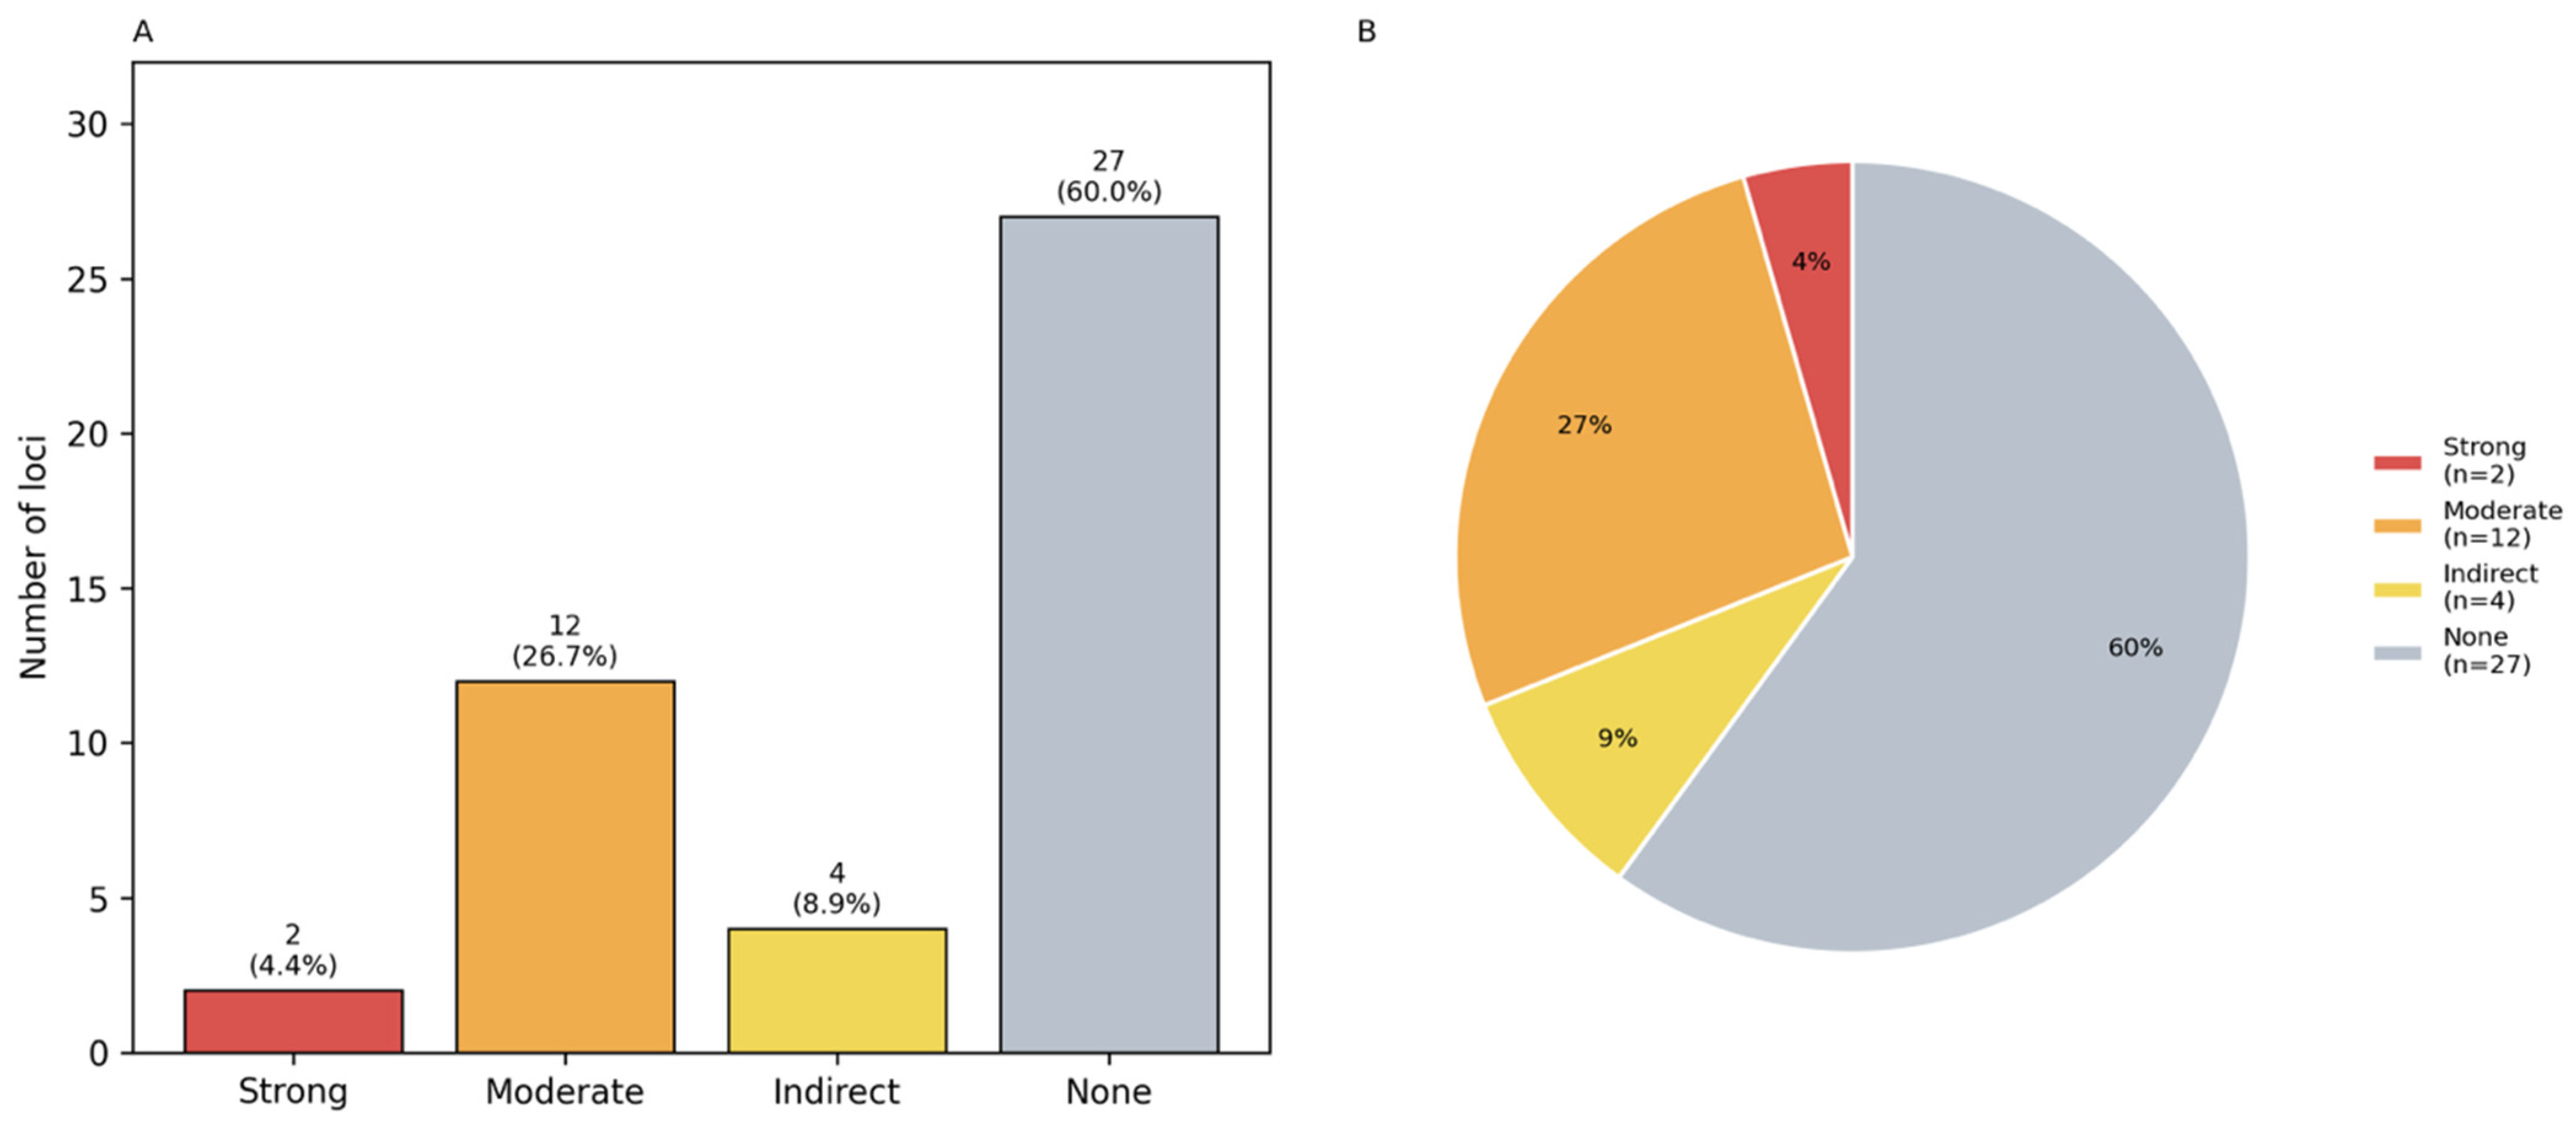
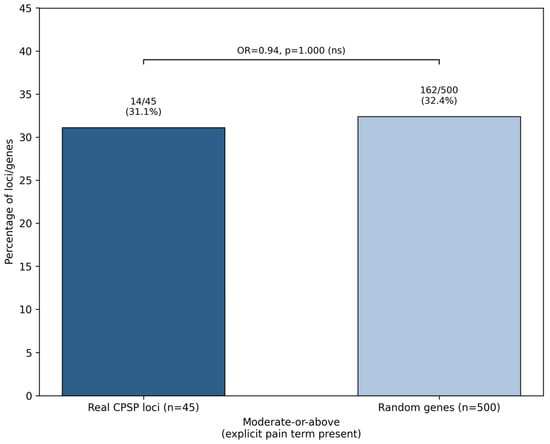
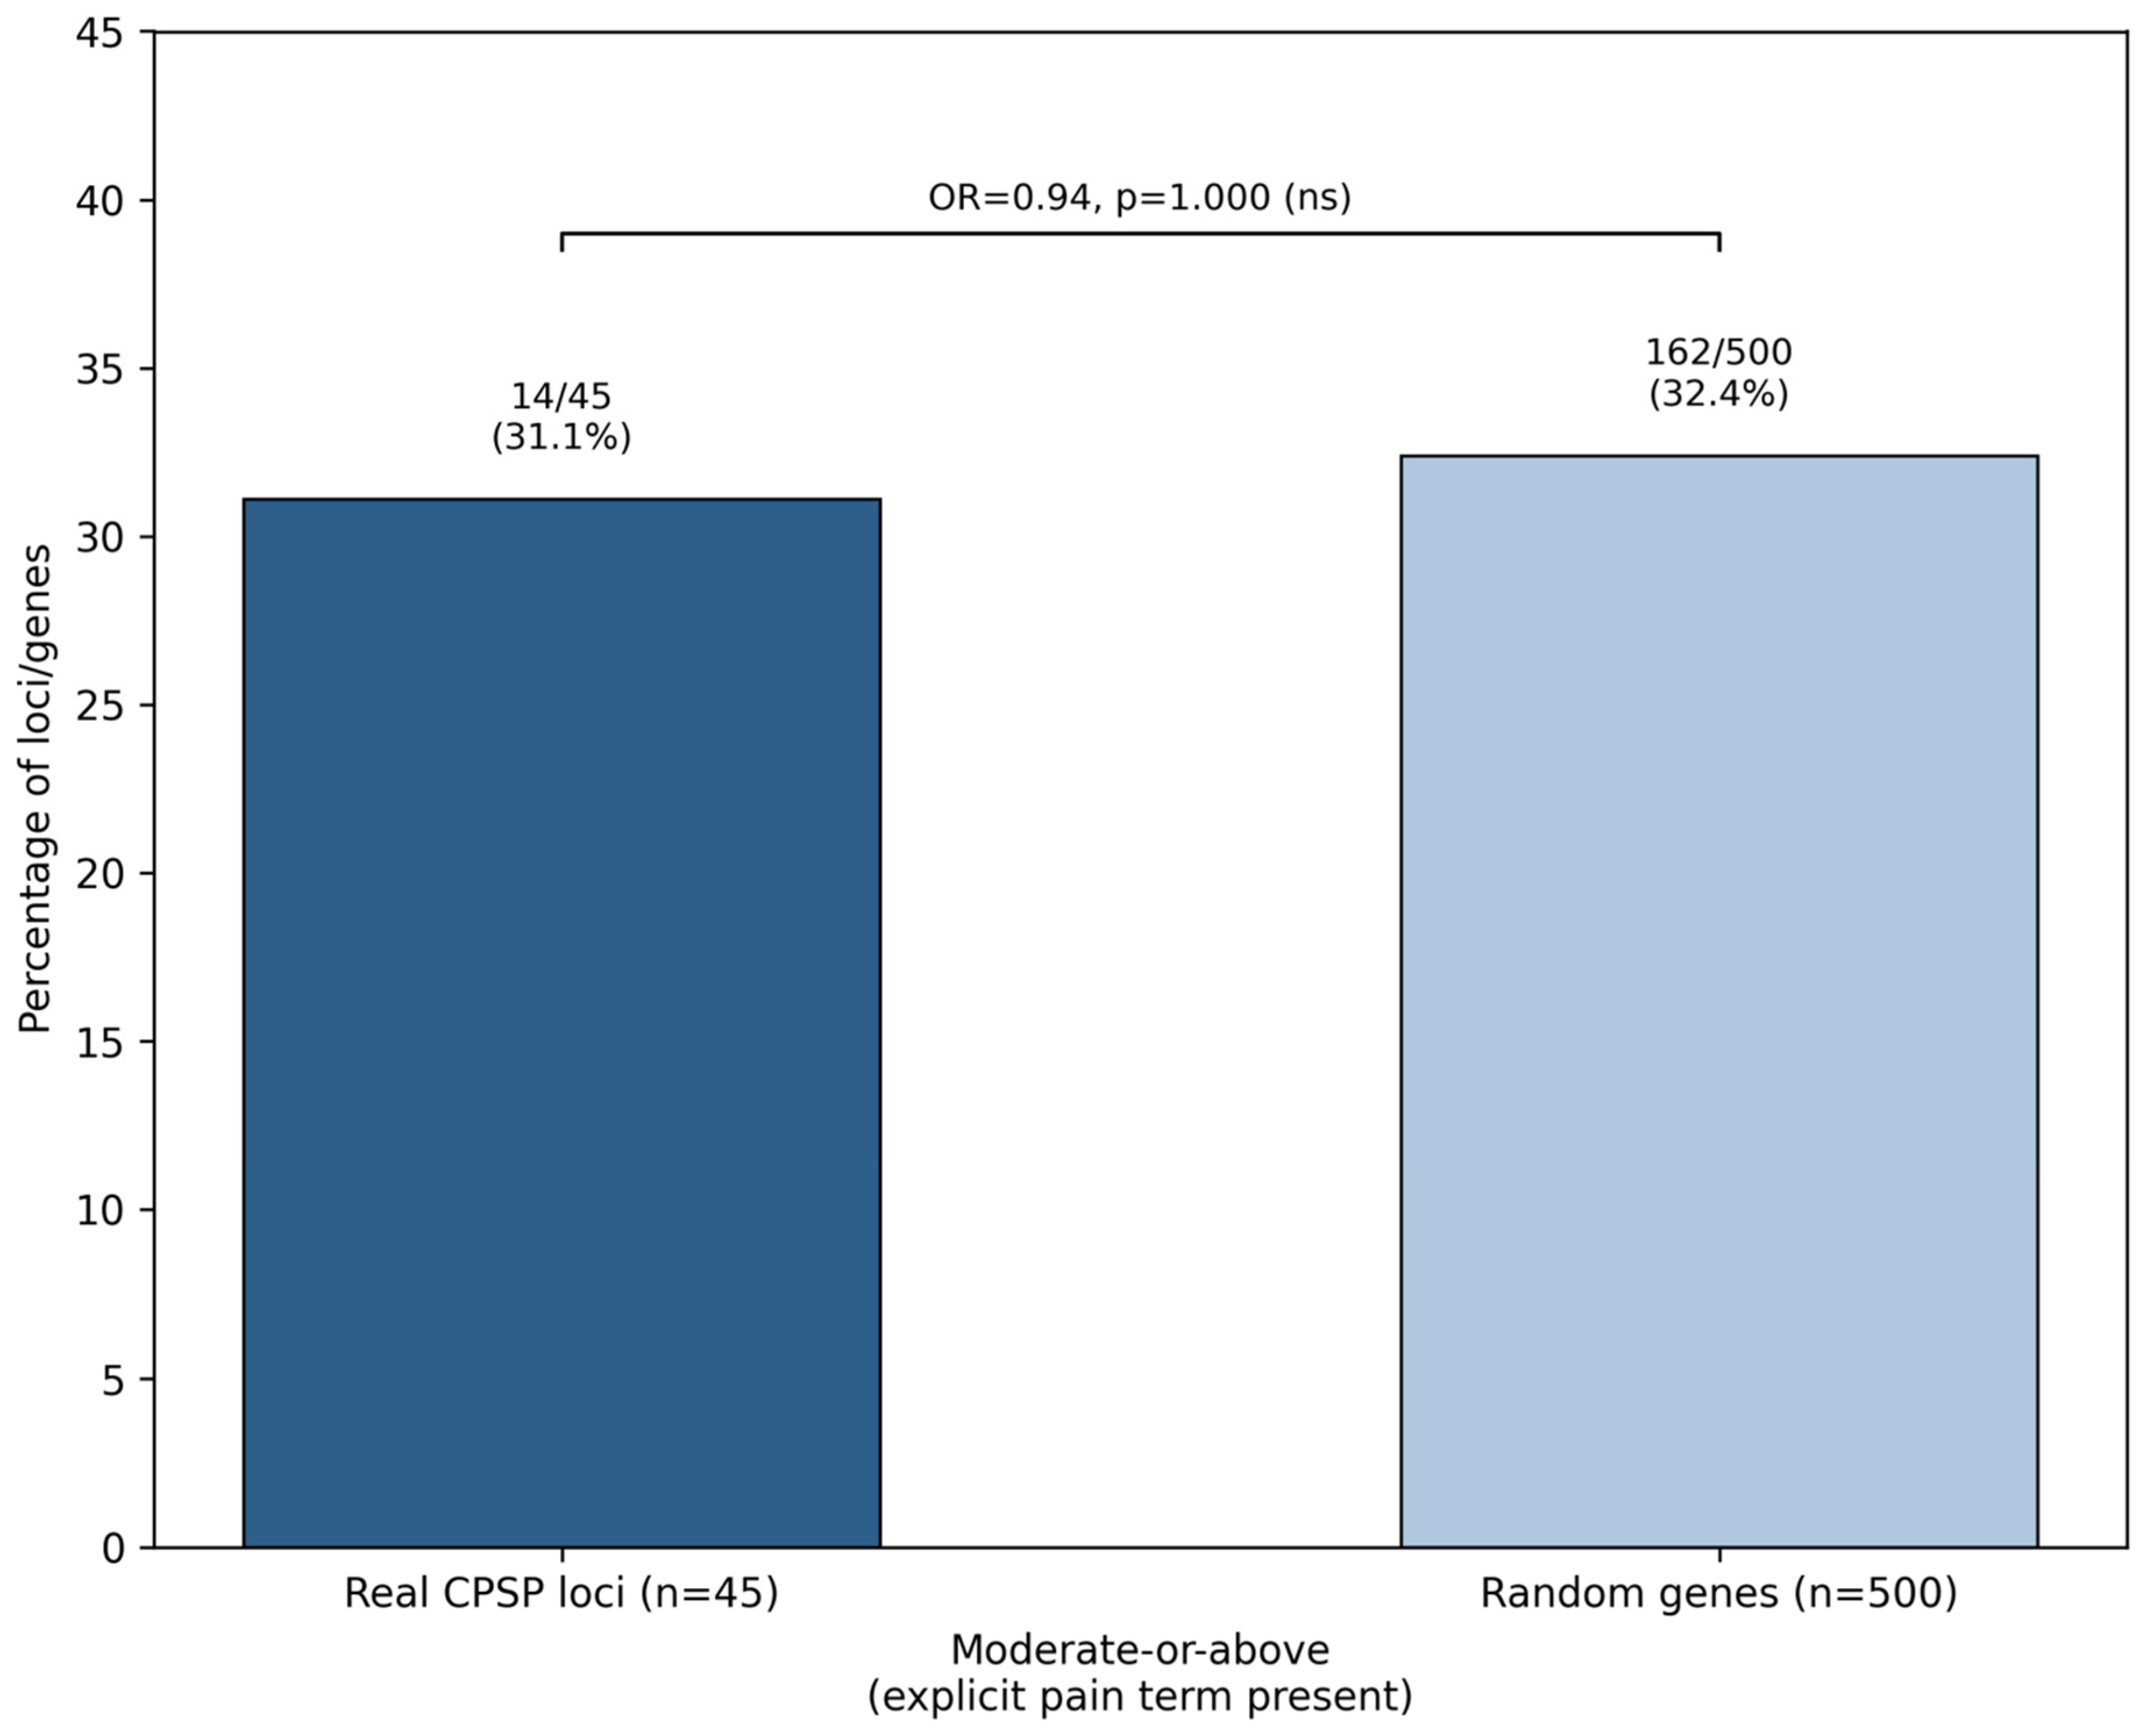
Across the 45 loci, gene-level PheWAS classification yielded two Strong (4.4%), 12 Moderate (26.7%), four Indirect (8.9%), and 27 None (60.0%) assignments (Table 1; Figure 5). The Moderate-or-above rate among real loci (14/45, 31.1%) was indistinguishable from that of a random protein-coding gene background (162/500, 32.4%; Fisher’s exact test, OR = 0.94, p = 1.000) (Figure 6).
Figure 5.
Gene-level PheWAS classification across all 45 loci, all individually coordinate-verified. (A) Number and percentage of loci per class. (B) Proportion of loci per class. The Moderate-or-above rate is not distinguishable from random genomic background.
Figure 6.
Gene-level PheWAS Moderate-or-above rate at the 45 CPSP loci versus 500 random protein-coding genes, both classified via the identical rank-based full-scan protocol. No significant difference from background (Fisher’s exact p = 1.000); the two rates are similar.
Nearest-gene assignments were verified at the coordinate level (dbSNP/Ensembl) for all 45 loci and differed from the source-study label at 11 loci (Supplementary Table S2): six positional corrections, three dual-label resolutions, one HGNC nomenclature update, and one exclusion of the reported gene without replacement (PAR-A6). For example, rs117244643 (chr6q16) lies within GPR63 (None) rather than near FHL5, the gene reported for this migraine-associated region, which lies 187 kb distal. One further locus with no reported gene (LI-8) was assigned to NKX2-6 (28.2 kb; no pain-related associations). Six loci had no protein-coding gene within 500 kb and were classified as gene deserts: UKB-3, LI-6, PAR-A2, PAR-A6, PAR-B1, and PAR-D6. Independent of source-label accuracy, the extended search window assigned a gene more than 50 kb from the lead SNP at nine loci: GLR-2 (F3, 63.8 kb), LI-5 (EPB41L4A, 77.8 kb), LI-1 (RRP15, 82.1 kb), PAR-B2 (DSC3, 103.4 kb), LI-11 (IRF8, 152.0 kb), PAR-E1 (CDH7, 228.0 kb), PAR-A1 (DDX18, 235.6 kb), PAR-A3 (FOXQ1, 295.2 kb), and LI-2 (RAD51AP2, 416.2 kb). DDX18 showed no pain-related associations in a full Open Targets scan (None), whereas FOXQ1 showed one association, complex regional pain syndrome at rank 281, and F3 showed migraine disorder at rank 216 (both Moderate). Among individual genes, PRKCA (rs887797) showed three pain-related associations outside the top five: migraine disorder (rank 283; score 0.035), neuropathic pain (rank 656; score 0.003), and fibromyalgia (rank 760; score 0.002), yielding a Moderate classification; PRKCA is also the locus originally reported by Warner et al. [26] NXPH2 (rs184832856) showed a rank-1 association with low back pain (score 0.215; Strong), EPB41L4A (rs182762077) showed migraine disorder at rank 4 (Strong), and GLRA3 (rs17298280) showed associations with familial hemiplegic migraine (rank 143) and migraine disorder (rank 153), yielding a Moderate classification. Restricting both enrichment tests to the 25 genome-wide-significant loci gave the same null result as the full set of 45. No cCRE class differed from background (all p_FDR = 1.000); the CTCF-bound status did not differ (11/25, 44.0% vs. 30.4%; OR = 1.80, p = 0.183), and the PheWAS Moderate-or-above rate did not differ (7/25, 28.0% vs. 32.4%; OR = 0.81, p = 0.827). For the 25 genome-wide-significant loci, the MDOR for dELS was 3.70.
Exploratory analyses (Supplementary Table S3) found no surgical subgroup differences from background in dELS, CTCF binding, or PheWAS Moderate-or-above rates (all p ≥ 0.098); proportions also did not differ across subgroups (permutation p = 0.64, 0.86, and 0.75, respectively). UK Biobank loci (n = 22) had nominally higher dELS frequency than background (17/22, 77.3% vs. 52.8%; OR = 3.04, 95% CI 1.10–8.37, p = 0.028), unlike non-UK Biobank loci (12/23, 52.2%; OR = 0.98, p = 1.000). The difference was nonsignificant after correction for 30 subgroup tests (p_FDR = 0.85), and dELS frequency did not differ significantly between UK Biobank and non-UK Biobank loci (permutation p = 0.12). Excluding UK Biobank source studies one at a time did not change results (all p ≥ 0.26).
4. Discussion
In this study, the loci reported across five GWASs of CPSP were systematically re-evaluated and integrated with LD resolution, ENCODE cCRE annotation, CTCF motif analysis, and gene-level phenotypic association data. After resolving non-independent signals, 45 independent loci were retained for analysis. Although enhancer-like and other accessible elements were frequently the nearest annotated cCREs, their overall regulatory-element distribution did not differ significantly from that expected at matched genomic background positions. Similarly, although several nearby genes demonstrated pain-related phenotypic associations, the proportion with Moderate-or-above pain associations was essentially identical to that observed among randomly selected protein-coding genes. These findings suggest that the presently reported CPSP loci do not converge on a single regulatory-element class or show generalized enrichment for genes already implicated in pain phenotypes.
The predominance of enhancer-like annotations among the CPSP loci is nevertheless biologically plausible. Most trait-associated variants identified by GWASs occur outside protein-coding sequence [15], and regulatory variants may influence disease susceptibility by altering transcription in specific cellular states or tissues. In the present study, distal enhancer-like elements represented the most frequent regulatory annotation among CPSP-associated loci. However, their comparable frequency in the genomic background shows the importance of placing apparently compelling regulatory annotations in an appropriate reference context. Proximity to a regulatory element alone should therefore not be interpreted as evidence that the associated variant has a causal regulatory function.
The CTCF analysis provides a similar example. A subset of loci had CTCF-bound elements as their nearest annotated cCRE, yet CTCF-bound status itself was not enriched relative to background. Moreover, only one of the CTCF-bound loci contained a high-confidence match to the canonical CTCF motif. The absence of a strong canonical CTCF motif at most CTCF-bound loci is not necessarily inconsistent with experimentally observed CTCF occupancy, because sequence motif strength alone does not fully determine CTCF binding, which can also be influenced by local sequence and chromatin context and interactions with other regulatory proteins [32]. The motif analysis therefore provides an additional prioritization layer rather than definitive evidence for or against CTCF-mediated regulation.
The gene-level phenotype analysis likewise identified several loci with potentially relevant biological connections. For example, NXPH2 showed a strong association with low back pain, while GLRA3 and PRKCA demonstrated associations with migraine, neuropathic pain, or other pain-related phenotypes. Such observations may help prioritize loci for further functional investigation. Importantly, however, the aggregate prevalence of pain-related associations among genes assigned to CPSP loci was indistinguishable from the random-gene background. These findings should not be interpreted as evidence that CPSP-associated loci are globally concentrated near established pain genes. Rather, they identify individual loci with potentially relevant prior phenotypic evidence within a broader set in which most genes do not have an established pain phenotype.
An observation from the present analysis was how locus interpretation changed after coordinate-level verification. Several genes assigned in the source studies were not the nearest protein-coding genes to the reported variants, and some loci lay within gene-poor regions. This illustrates a broader challenge in post-GWAS interpretation: the gene associated with a locus in an original publication may reflect proximity, biological plausibility, eQTL evidence, or historical annotation rather than a directly demonstrated target gene. Our analysis applies a positional framework, but positional assignment itself does not establish regulatory targeting. Enhancers may act over substantial genomic distances and can bypass the nearest gene.
Nearest-gene assignment in the present study therefore served as a standardized benchmark for the PheWAS comparison rather than as evidence of the effector gene; chromatin-conformation data and enhancer–gene linking models [30] would be required to nominate target genes.
Expanding lead SNPs to high-LD proxies increased the proportion of loci with direct cCRE overlap from 26.7% to 42.2%, identifying regulatory overlap at seven loci that would have been missed by analyzing the lead variant alone. This illustrates an important limitation of lead-SNP-centered functional annotation, as the reported GWAS lead variant may primarily serve as a marker for a linked functional allele. However, because cCREs cover a substantial fraction of the genome, testing additional variants per locus raises the chance of overlap even for randomly chosen loci, and because the LD-expanded analysis was designed for locus-level annotation rather than enrichment testing against matched LD-expanded background loci, the increased overlap should be interpreted as improved functional coverage rather than evidence of regulatory enrichment.
Several limitations should be considered. The loci analyzed here were derived from heterogeneous surgical populations, phenotypic definitions, and study sizes, including two GWASs that were small by contemporary standards. Three of the five source studies use UK Biobank, so participant overlap is possible, most likely between the two studies by Li et al., which share a prescription-based phenotype. The authors’ GWAS defined cases as self-reported physician-diagnosed CPSP, with controls matched on surgery type and year, so its case and control sets differ from Li et al.’s. After LD resolution, no locus was shared between UK Biobank studies, all four collapsed clusters arose within a single source study, and excluding each UK Biobank study in turn did not alter the results. Because the principal findings are null, overlap is unlikely to have produced a spurious significant result. The nominally higher dELS frequency among UK Biobank-derived loci did not survive correction and should be interpreted in light of this possible non-independence. Pooling these loci assumes, at least in part, a shared genetic architecture across CPSP phenotypes and surgical procedures, an assumption that has not been independently established. This heterogeneity, together with only 45 loci, may reduce the ability to detect a common regulatory signature. Post hoc analysis showed 80% power only for odds ratios of approximately 2.4 to 2.6 across the dELS, CTCF-bound, and PheWAS comparisons (3.2 to 3.7 for the 25 genome-wide-significant loci); modest enrichment therefore cannot be excluded. A sensitivity analysis restricted to the 25 genome-wide-significant loci also found no signal, suggesting the overall null result was not simply due to pooling suggestive-threshold loci with stronger signals. Larger GWASs with more standardized CPSP phenotyping and procedure-specific analyses may reveal regulatory patterns that are obscured in the currently available data. Associations between individual loci and CPSP severity could not be examined because only reported lead variants were available, and the source studies modeled different outcomes. Harmonized individual-level data would be required to relate these loci to pain intensity, duration, or neuropathic features.
In addition, gene-level PheWAS evidence is inherently indirect and does not establish that a regulatory element influences the assigned gene or that either participates in CPSP pathogenesis.
Finally, cCRE class proportions reported here reflect the eight-class V4 registry and are not directly comparable to annotations based on earlier ENCODE registry versions, because class definitions and element annotations differ between versions.
These results also highlight the distinction between annotation and functional validation. ENCODE cCRE overlap, nearby-gene assignment, CTCF occupancy, motif presence, and PheWAS associations can generate biologically informed hypotheses, but none establishes that a CPSP-associated variant alters enhancer activity, regulates the assigned gene, or contributes directly to chronic pain. The absence of enrichment against the cell-type-agnostic ENCODE4 registry does not rule out enrichment in pain-relevant tissues, as many enhancers are cell-type-specific. Human dorsal root ganglion transcriptomic atlases [33] and GTEx tibial nerve and brain eQTL data [34] are the clearest next steps for testing tissue-specific enrichment.
Future studies should integrate fine-mapping with tissue- and cell-type-specific chromatin accessibility, eQTL and chromatin-interaction data, ideally focusing on biologically relevant tissues such as sensory neurons, dorsal root ganglia, immune cells, and tissues involved in wound healing. Experimental approaches including reporter assays, allele-specific regulatory assays, CRISPR perturbation, and functional studies in pain-relevant cellular models will ultimately be required to distinguish causal regulatory variants from loci that merely lie near annotated regulatory elements.
For clinical importance, these findings argue against using the currently reported loci, individually or pooled, for preoperative genetic testing; their current value is to prioritize candidates for further study. Loci with prior pain-related evidence, such as GLRA3, which encodes the glycine receptor α3 subunit that mediates spinal inflammatory pain sensitization [35], PDE4D, which showed higher expression in adhesion tissue from patients with CPSP, although the difference was only a trend, merits functional validation and, if confirmed, evaluation as a drug target [22]. A replicated, functionally supported set of variants could also inform more targeted polygenic risk models. Such models could weight functionally confirmed loci rather than statistical associations alone, to identify high-risk patients for targeted prevention, including regional anesthesia, multimodal analgesia, and modifications to surgical technique [8,21].
5. Conclusions
The study provides a reproducible framework for interpreting the fragmented CPSP GWAS literature. By resolving linkage disequilibrium, re-annotating loci using a common contemporary regulatory reference, verifying gene assignments at the coordinate level, and benchmarking both regulatory and phenotypic observations against appropriate backgrounds, the analysis distinguishes descriptive functional annotations from evidence of enrichment. The resulting catalog provides a curated foundation for prioritizing CPSP loci for future mechanistic investigation while emphasizing that apparently biologically plausible annotations require appropriate genomic controls before causal interpretation.
Supplementary Materials
The following supporting information can be downloaded at: https://www.mdpi.com/article/10.3390/biomedicines14112483/s1, Supplementary Table S1. Characteristics of the source GWAS, Supplementary Table S2. Source-Study Gene Labels That Differ from the Assigned Nearest Gene, Supplementary Table S3. Exploratory subgroup and leave-one-study-out analyses.
Author Contributions
Conceptualization, A.P. and M.S.-D.; methodology, A.P.; software, A.P.; validation, A.P.; formal analysis, A.P.; investigation, A.P. and M.S.-D.; data curation, A.P.; writing—original draft preparation, A.P.; writing—review and editing, A.P. and M.S.-D.; visualization, A.P.; supervision, M.S.-D.; project administration, A.P. and M.S.-D. All authors have read and agreed to the published version of the manuscript.
Funding
This research received no external funding.
Institutional Review Board Statement
Ethical review was not required for this secondary analysis of published summary results and public data, which involved no new recruitment or data collection. The original studies received ethical approval from their local committees and written informed consent from participants; details appear in their publications.
Informed Consent Statement
Not applicable for this secondary analysis. Informed consent was obtained from all participants in the original studies and by UK Biobank.
Data Availability Statement
Reference implementation code enabling independent replication of each annotation and enrichment step (ENCODE4 cCRE annotation, CTCF motif scanning, gene-level PheWAS querying, background enrichment testing, and direct genotype-level LD computation for long-range variant pairs) is available at https://github.com/alexpe85/cpsp_ccre (accessed on 25 October 2026). All queries use public APIs (Ensembl REST, SCREEN, Open Targets Platform, JASPAR) or, for long-range LD, phased genotypes from the 1000 Genomes Project (GRCh38 liftover), requiring no proprietary or third-party query intermediary.
Acknowledgments
The authors thank the investigators of the source genome-wide association studies [23,24,25,26] for publishing the results on which this analysis is based, and the participants of all contributing cohorts. Three of the source studies, including the authors’ previously published GWAS, used data from the UK Biobank Resource (Application Numbers 64102 [24,25] and 164591 [27]); the authors are grateful to UK Biobank and its participants. During the preparation of this work, the authors used ‘Claude.AI’ and ‘Grammarly’ for text and grammar correction, and used ‘Claude.AI’ to draft, optimize, and debug portions of the Python scripts. After using these tools, the authors reviewed and edited the content as needed, and independently reviewed, tested, and verified the generated code for correctness and logic, taking full responsibility for the publication’s content and for the integrity of the final implementation.
Conflicts of Interest
The authors declare no conflicts of interest relevant to this work.
References
- Stamer, U.M.; Lavand’homme, P.; Hofer, D.M.; Barke, A.; Korwisi, B. Definition of chronic postsurgical pain in the ICD-11: A narrative review of implications for anaesthesiology and pain medicine. Br. J. Anaesth. 2026, 136, 1319–1329. [Google Scholar] [CrossRef] [Scilit]
- Martinez, V.; Lehman, T.; Lavand, P.; Harkouk, H.; Kalso, E.; Pogatzki-Zahn, E.M.; Komann, M.; Meissner, W.; Weinmann, C.; Fletcher, D. Chronic postsurgical pain A European survey. Eur. J. Anaesthesiol. 2024, 41, 351–362. [Google Scholar]
- Khan, J.S.; Sessler, D.I.; Chan, M.T.V.; Wang, C.Y.; Garutti, I.; Szczeklik, W.; Turan, A.; Busse, J.W.; Buckley, D.N.; Paul, J.; et al. Persistent Incisional Pain after Noncardiac Surgery: An International Prospective Cohort Study. Anesthesiology 2021, 135, 711–723. [Google Scholar] [CrossRef] [Scilit]
- Rosenberger, D.C.; Pogatzki-Zahn, E.M. Chronic post-surgical pain—Update on incidence, risk factors and preventive treatment options. BJA Educ. 2022, 22, 190–196. [Google Scholar] [CrossRef] [Scilit]
- Papadomanolakis-Pakis, N.; Munch, P.V.; Carlé, N.; Uhrbrand, C.G.; Haroutounian, S.; Nikolajsen, L. Prognostic clinical prediction models for acute post-surgical pain in adults: A systematic review. Anaesthesia 2024, 79, 1335–1347. [Google Scholar] [CrossRef] [Scilit]
- Fletcher, D.; Stamer, U.M.; Pogatzki-Zahn, E.; Zaslansky, R.; Tanase, N.V.; Perruchoud, C.; Kranke, P.; Komann, M.; Lehman, T.; Meissner, W.; et al. Chronic postsurgical pain in Europe: An observational study. Eur. J. Anaesthesiol. 2015, 32, 725–734. [Google Scholar]
- Schug, S.A.; Lavand’HOmme, P.; Barke, A.; Korwisi, B.; Rief, W.; Treede, R.-D.; IASP Taskforce for the Classification of Chronic Pain. The IASP classification of chronic pain for ICD-11: Chronic postsurgical or posttraumatic pain. Pain 2019, 160, 45–52. [Google Scholar] [CrossRef] [Scilit]
- Glare, P.; Aubrey, K.R.; Myles, P.S. Transition from acute to chronic pain after surgery. Lancet 2019, 393, 1537–1546. [Google Scholar] [CrossRef] [Scilit]
- Clarke, H.; Katz, J.; Flor, H.; Rietschel, M.; Diehl, S.R.; Seltzer, Z. Genetics of chronic post-surgical pain: A crucial step toward personal pain medicine. Can. J. Anesth. Can. Anesth. 2015, 62, 294–303. [Google Scholar] [CrossRef] [Scilit]
- Montes, A.; Roca, G.; Sabate, S.; Lao, J.I.; Navarro, A.; Cantillo, J.; Canet, J.; GENDOLCAT Study Group. Genetic and Clinical Factors Associated with Chronic Postsurgical Pain after Hernia Repair, Hysterectomy, and Thoracotomy: A Two-year Multicenter Cohort Study. Anesthesiology 2015, 122, 1123–1141. [Google Scholar]
- Johnston, K.J.A.; Adams, M.J.; Nicholl, B.I.; Ward, J.; Strawbridge, R.J.; Ferguson, A.; McIntosh, A.M.; Bailey, M.E.S.; Smith, D.J. Genome-wide association study of multisite chronic pain in UK Biobank. PLoS Genet. 2019, 15, e1008164. [Google Scholar] [CrossRef] [Scilit]
- Suri, P.; Palmer, M.R.; Tsepilov, Y.A.; Freidin, M.B.; Boer, C.G.; Yau, M.S.; Evans, D.S.; Gelemanovic, A.; Bartz, T.M.; Nethander, M.; et al. Genome-wide meta-analysis of 158,000 individuals of European ancestry identifies three loci associated with chronic back pain. PLoS Genet. 2018, 14, e1007601. [Google Scholar] [CrossRef] [Scilit]
- Toikumo, S.; Vickers-Smith, R.; Jinwala, Z.; Xu, H.; Saini, D.; Hartwell, E.E.; Pavicic, M.; Sullivan, K.A.; Xu, K.; Jacobson, D.A.; et al. A multi-ancestry genetic study of pain intensity in 598,339 veterans. Nat. Med. 2024, 30, 1075–1084. [Google Scholar] [CrossRef] [Scilit]
- Li, S.; Brimmers, A.; van Boekel, R.L.M.; Vissers, K.C.P.; Coenen, M.J.H. A systematic review of genome-wide association studies for pain, nociception, neuropathy, and pain treatment responses. Pain 2023, 164, 1891–1911. [Google Scholar] [CrossRef] [Scilit]
- Claussnitzer, M.; Cho, J.H.; Collins, R.; Cox, N.J.; Dermitzakis, E.T.; Hurles, M.E.; Kathiresan, S.; Kenny, E.E.; Lindgren, C.M.; MacArthur, D.G.; et al. A brief history of human disease genetics. Nature 2020, 577, 179–189. [Google Scholar] [CrossRef] [Scilit]
- Schipper, M.; Posthuma, D. Demystifying non-coding GWAS variants: An overview of computational tools and methods. Hum. Mol. Genet. 2022, 31, R73–R83. [Google Scholar] [CrossRef] [Scilit]
- Moore, J.E.; Pratt, H.E.; Fan, K.; Phalke, N.; Fisher, J.; Elhajjajy, S.I.; Andrews, G.; Gao, M.; Shedd, N.; Fu, Y.; et al. An expanded registry of candidate cis-regulatory elements. Nature 2026, 1–10. [Google Scholar] [CrossRef] [Scilit]
- Schaub, M.A.; Boyle, A.P.; Kundaje, A.; Batzoglou, S.; Snyder, M. Linking disease associations with regulatory information in the human genome. Genome Res. 2012, 22, 1748–1759. [Google Scholar] [CrossRef] [Scilit]
- Boyle, A.P.; Hong, E.L.; Hariharan, M.; Cheng, Y.; Schaub, M.A.; Kasowski, M.; Karczewski, K.J.; Park, J.; Hitz, B.C.; Weng, S.; et al. Annotation of functional variation in personal genomes using RegulomeDB. Genome Res. 2012, 22, 1790–1797. [Google Scholar] [CrossRef] [Scilit]
- Bastarache, L.; Denny, J.C.; Roden, D.M. Phenome-Wide Association Studies. JAMA 2022, 327, 75–76. [Google Scholar] [CrossRef] [Scilit]
- Weinstein, E.J.; Levene, J.L.; Cohen, M.S.; Andreae, D.A.; Chao, J.Y.; Johnson, M.; Hall, C.B.; Andreae, M.H. Local anaesthetics and regional anaesthesia versus conventional analgesia for preventing persistent postoperative pain in adults and children. Cochrane Database Syst. Rev. 2018, 4, CD007105. [Google Scholar] [CrossRef] [Scilit]
- Minikel, E.V.; Painter, J.L.; Dong, C.C.; Nelson, M.R. Refining the impact of genetic evidence on clinical success. Nature 2024, 629, 624–629. [Google Scholar] [CrossRef] [Scilit]
- Parisien, M.; van Reij, R.R.; Khoury, S.; Koseli, E.; Karaky, M.; Silva, J.R.; Taheri, G.; Hoogen, N.J.; Peng, G.; Allegri, M.; et al. Genome-wide association studies with experimental validation identify a protective role for B lymphocytes against chronic post-surgical pain. Br. J. Anaesth. 2024, 133, 360–370. [Google Scholar] [CrossRef] [Scilit]
- Li, S.; Toneman, M.K.; Mangnus, J.P.M.; Strocchi, S.; van Boekel, R.L.M.; Vissers, K.C.P.; Broek, R.P.G.T.; Coenen, M.J.H. Genome-wide association study on chronic postsurgical pain after abdominal surgeries in the UK Biobank. Anaesthesia 2025, 80, 499–510. [Google Scholar] [CrossRef] [Scilit]
- Li, S.; Toneman, M.K.; Diatchenko, L.; Parisien, M.; Vissers, K.C.; Broek, R.P.T.; van Boekel, R.L.; Coenen, M.J. Genome-wide association study on chronic postsurgical pain in the UK Biobank. Br. J. Anaesth. 2025, 134, 783–792. [Google Scholar] [CrossRef] [Scilit]
- Warner, S.C.; van Meurs, J.B.; Schiphof, D.; Bierma-Zeinstra, S.M.; Hofman, A.; Uitterlinden, A.G.; Richardson, H.; Jenkins, W.; Doherty, M.; Valdes, A.M. Genome-wide association scan of neuropathic pain symptoms post total joint replacement highlights a variant in the protein-kinase C gene. Eur. J. Hum. Genet. 2017, 25, 446–451. [Google Scholar] [CrossRef] [Scilit]
- Peres, A.; Unger, R.; Mangoubi, E.; Salmon-Divon, M. Genome-wide association, polygenic risk scores, and machine learning for chronic post-surgical pain risk stratification: A UK biobank study. J. Pain 2026, 49, 106402. [Google Scholar] [CrossRef] [Scilit]
- Wellcome Trust Case Control Consortium. Genome-wide association study of 14,000 cases of seven common diseases and 3000 shared controls. Nature 2007, 447, 661–678. [Google Scholar] [CrossRef] [Scilit]
- Hammond, R.K.; Pahl, M.C.; Su, C.; Cousminer, D.L.; Leonard, M.E.; Lu, S.; Doege, C.A.; Wagley, Y.; Hodge, K.M.; Lasconi, C.; et al. Biological constraints on GWAS SNPs at suggestive significance thresholds reveal additional BMI loci. Elife 2021, 10, e62206. [Google Scholar] [CrossRef] [Scilit]
- Nasser, J.; Bergman, D.T.; Fulco, C.P.; Guckelberger, P.; Doughty, B.R.; Patwardhan, T.A.; Jones, T.R.; Nguyen, T.H.; Ulirsch, J.C.; Lekschas, F.; et al. Genome-wide enhancer maps link risk variants to disease genes. Nature 2021, 593, 238–243. [Google Scholar] [CrossRef] [Scilit]
- Schoenfelder, S.; Fraser, P. Long-range enhancer-promoter contacts in gene expression control. Nat. Rev. Genet. 2019, 20, 437–455. [Google Scholar] [CrossRef] [Scilit]
- Ong, C.-T.; Corces, V.G. CTCF: An architectural protein bridging genome topology and function. Nat. Rev. Genet. 2014, 15, 234–246. [Google Scholar] [CrossRef] [Scilit]
- Tavares-Ferreira, D.; Shiers, S.; Ray, P.R.; Wangzhou, A.; Jeevakumar, V.; Sankaranarayanan, I.; Cervantes, A.M.; Reese, J.C.; Chamessian, A.; Copits, B.A.; et al. Spatial transcriptomics of dorsal root ganglia identifies molecular signatures of human nociceptors. Sci. Transl. Med. 2022, 14, eabj8186. [Google Scholar] [CrossRef] [Scilit]
- GTEx Consortium. The GTEx Consortium atlas of genetic regulatory effects across human tissues. Science 2020, 369, 1318–1330. [Google Scholar] [CrossRef] [Scilit]
- Harvey, R.J.; Depner, U.B.; Wässle, H.; Ahmadi, S.; Heindl, C.; Reinold, H.; Smart, T.G.; Harvey, K.; Schütz, B.; Abo-Salem, O.M.; et al. GlyR alpha3: An essential target for spinal PGE2-mediated inflammatory pain sensitization. Science 2004, 304, 884–887. [Google Scholar] [CrossRef] [Scilit]

Disclaimer/Publisher’s Note: The statements, opinions and data contained in all publications are solely those of the individual author(s) and contributor(s) and not of MDPI and/or the editor(s). MDPI and/or the editor(s) disclaim responsibility for any injury to people or property resulting from any ideas, methods, instructions or products referred to in the content. |
© 2026 by the authors. Licensee MDPI, Basel, Switzerland. This article is an open access article distributed under the terms and conditions of the Creative Commons Attribution (CC BY) license.