


Abstract
Background/Objectives: Type 2 diabetes mellitus (T2DM) is a complex metabolic disorder associated with substantial morbidity and mortality. Peripheral blood mononuclear cells (PBMCs) represent an accessible cellular source for investigating systemic molecular alterations in T2DM. This study aimed to characterize senescence-associated transcriptional alterations in PBMCs and to evaluate their potential relevance to the molecular characterization and diagnosis of T2DM. Methods: Publicly available PBMC RNA-sequencing datasets were integrated following normalization and batch-effect correction. Differentially expressed genes were intersected with curated senescence-associated gene sets and subjected to functional enrichment analyses. Weighted gene co-expression network analysis was used to identify T2DM-associated gene modules, and immune deconvolution was performed to characterize alterations in immune-cell composition. LASSO regression, random forest, and support vector machine analyses were integrated to identify candidate diagnostic genes. The resulting gene signature was evaluated in independent cohorts and further validated by RT-qPCR in clinical PBMC samples. Consensus clustering was additionally performed to investigate molecular heterogeneity among patients with T2DM. Results: Senescence-associated transcriptional alterations were enriched in pathways related to RNA processing, cell-cycle regulation, and metabolism. A three-gene signature comprising ICE2, NHLRC2, and RPS24 was identified and showed reproducible diagnostic performance across independent cohorts. A nomogram incorporating these genes achieved an area under the receiver operating characteristic curve of 0.882. RT-qPCR analysis of clinical PBMC samples confirmed expression patterns consistent with the transcriptomic analyses. Furthermore, consensus clustering identified distinct T2DM molecular subtypes characterized by differential immune and inflammatory profiles. Conclusions: These findings identify a senescence-associated PBMC transcriptional signature with potential diagnostic relevance in T2DM and reveal molecular heterogeneity associated with distinct immune and inflammatory features. The results provide a transcriptomic framework for further investigation of senescence-related immune–metabolic alterations in T2DM.
1. Introduction
Type 2 diabetes mellitus (T2DM) is characterized by chronic hyperglycemia and progressive cardiometabolic complications. In 2024, diabetes affected 11.11% of the global adult population. The burden was disproportionately heavy among older adults, reaching 23.72% in those aged 65 and above and peaking at 24.79% in the 75–79 age group [1]. This disease imposes substantial clinical and socioeconomic burdens worldwide [2,3]. Despite advances in glucose-lowering therapies, many patients still develop vascular complications and immune-related comorbidities. This highlights the heterogeneous pathophysiology of T2DM and the limitations of current risk stratification strategies [4,5]. Clinical diagnosis and monitoring rely primarily on glycemic markers, such as fasting plasma glucose and HbA1c. These markers reflect metabolic status but offer limited insight into the molecular drivers of disease progression, immune dysregulation, and variable treatment responses [6,7].
Peripheral blood mononuclear cells (PBMCs) provide an accessible source for studying systemic immune–metabolic changes in T2DM [8]. PBMC transcriptomes combine signals from various circulating immune cells and their activation states, allowing discovery of molecular signatures that reveal disease mechanisms through minimally invasive sampling. Therefore, transcriptomic analysis of PBMCs can identify differentially expressed genes between patients with T2DM and healthy controls [9,10]. These genes may reflect changes associated with insulin resistance, systemic inflammation, oxidative stress, and mitochondrial dysfunction [10,11,12], providing insights into the immune and metabolic alterations associated with T2DM and potential candidate biomarkers.
However, PBMC-derived gene signatures for T2DM are not well defined, and clinically useful diagnostic models with clear biological interpretation are still lacking. Senescence-associated processes have been implicated in the links between metabolic stress, chronic inflammation, and tissue dysfunction in T2DM [13]. Cellular senescence is commonly characterized by stable cell-cycle arrest and extensive transcriptional and epigenetic changes [14]. A senescence-associated secretory phenotype (SASP), which includes pro-inflammatory cytokines, chemokines, and proteases, may contribute to immune activation and chronic inflammation [15]. These inflammatory factors may also impair insulin signaling and contribute to insulin resistance, potentially disrupting metabolic homeostasis [16].
In T2DM, hyperglycemia, oxidative stress, mitochondrial dysfunction, and lipotoxicity promote senescence-like programs in classic tissues such as adipose, liver, and islets. These programs also occur in circulating immune cells, impairing immune surveillance and fueling low-grade inflammation [17]. Senescence-related transcriptional changes in PBMCs likely reflect immune aging and disease-driven immunometabolic stress. However, these signatures and their potential as diagnostic markers for immune composition and pathway activity remain underexplored, especially through integrative frameworks.
Here, we sought to characterize senescence-associated transcriptional alterations in PBMCs from patients with T2DM and to evaluate their potential diagnostic and molecular relevance. To this end, we integrated publicly available PBMC RNA-sequencing datasets and combined differential expression analysis with curated senescence-associated gene sets, weighted gene co-expression network analysis, and functional enrichment analyses to identify T2DM-related senescence-associated transcriptional features. Immune deconvolution was further used to characterize alterations in immune-cell composition and their associations with the identified transcriptional signature. We subsequently integrated multiple machine-learning approaches to derive a senescence-associated gene signature and constructed a diagnostic model, whose performance was evaluated across internal and independent external cohorts and further examined in clinical PBMC samples. In addition, consensus clustering and gene set enrichment analyses were performed to investigate molecular heterogeneity within T2DM and to characterize subtype-associated immune and inflammatory features.
Collectively, this study aimed to characterize senescence-associated transcriptional alterations in PBMCs from individuals with T2DM, identify a candidate gene signature, assess its diagnostic potential, and explore the associations between senescence-related transcriptional heterogeneity and immune and inflammatory profiles. These findings may provide a basis for further investigation of molecular heterogeneity in T2DM.
2. Methods
2.1. Data Sources and Preprocessing
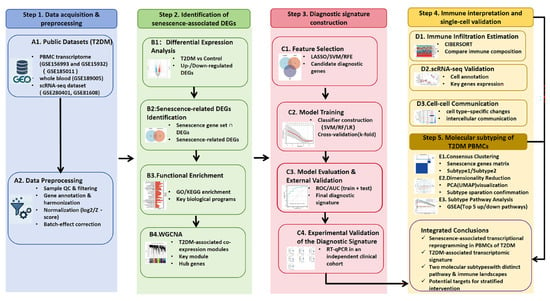
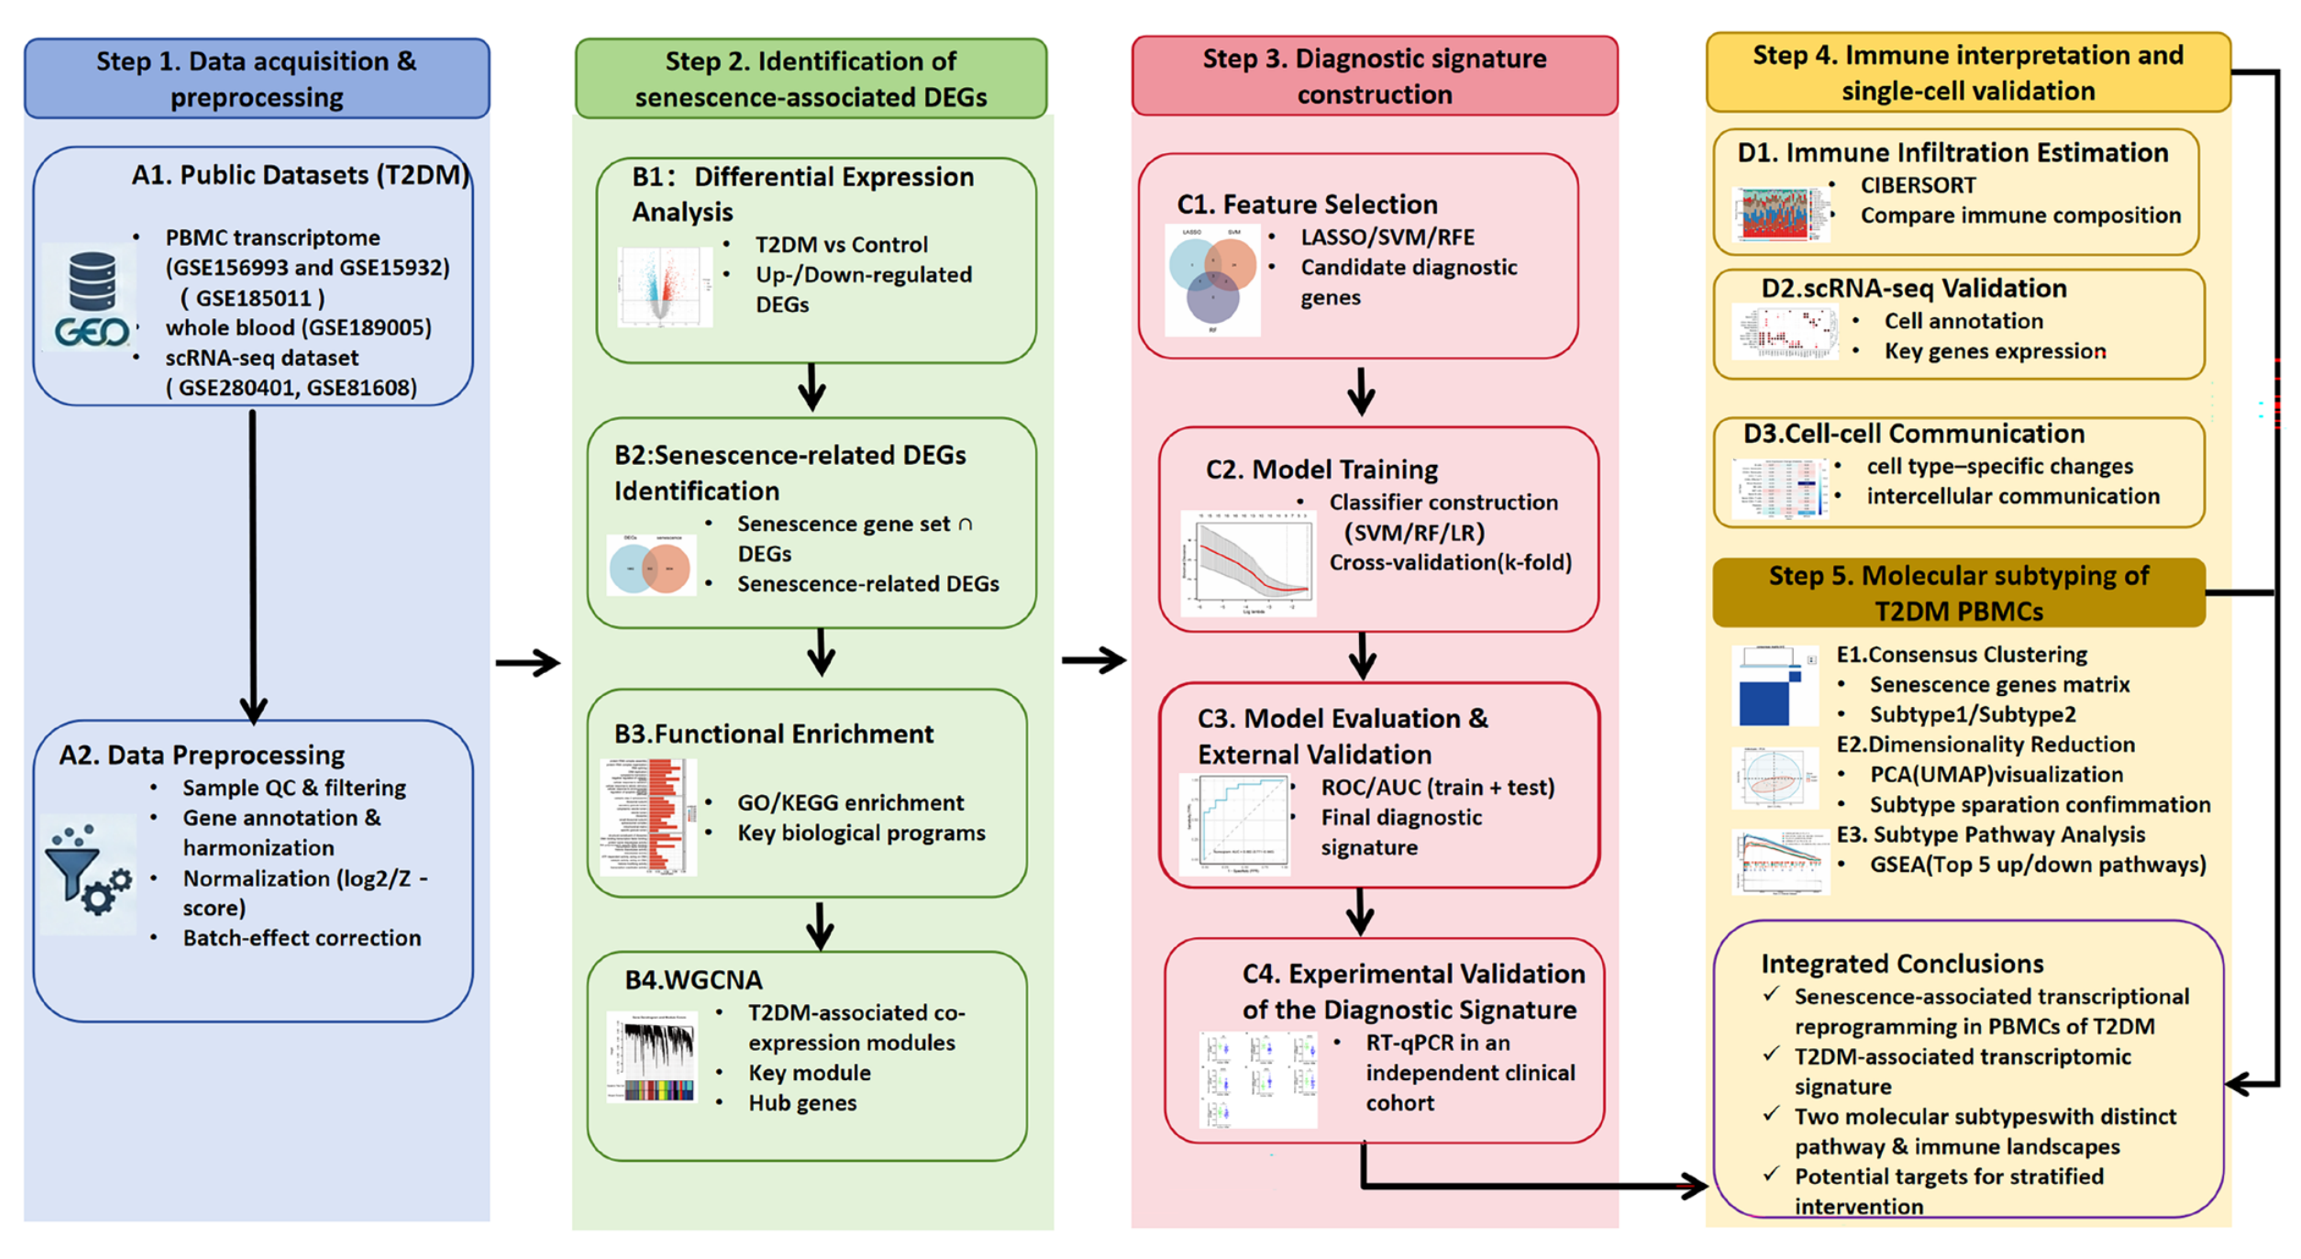
Public PBMC transcriptomic datasets for T2DM and non-diabetic controls were obtained from the Gene Expression Omnibus (GEO) [18]; the datasets used in this study are presented in Table S1. GSE156993 and GSE15932 were integrated as the primary cohort for differential expression, co-expression network analysis, immune deconvolution, and machine-learning feature selection. GSE185011 (PBMC; healthy controls and uncomplicated T2DM) and GSE189005 (whole blood) were used as independent external validation cohorts. Neither dataset was used for feature selection or model development. All analyses were performed in R (version 4.3.1). Raw expression matrices were imported using GEOquery (version 2.70.0) [19], and probe identifiers were mapped to official gene symbols with platform annotation packages. When multiple probes mapped to the same gene, probe-level values were collapsed by taking the mean expression. Expression values were log2-transformed when required and normalized to improve comparability across studies. Batch effects were corrected using ComBat [20] from the sva package [21]. The effectiveness of normalization and batch correction was evaluated by inspecting expression distribution boxplots before and after correction. An overview of the study workflow is summarized in Figure 1.
Figure 1.
Overview of the study design. Arrows between the four modules indicate the overall workflow direction, and arrows within each module indicate the sequential data-processing steps.
2.2. Differential Expression Analysis
Differential expression between T2DM and control samples was evaluated on the batch-corrected integrated matrix using limma with empirical Bayes moderation [22]. p values were obtained from the moderated t-statistics, and genes with p value < 0.05 were considered significant. Significant genes were categorized as upregulated (logFC > 0) or downregulated (logFC < 0) based on the direction of logFC. Results were visualized using volcano plots and heatmaps of representative differentially expressed genes (DEGs) generated with ggplot2 (version 3.4.2) and pheatmap (version 1.0.13).
Given that differential expression analysis was used as an exploratory pre-screening step prior to integration with WGCNA rather than as a definitive genome-wide significance test, genes with a nominal p < 0.05 were retained for subsequent integrative analysis.
2.3. Senescence-Associated DEG Identification and Functional Enrichment
Senescence-related candidate genes were retrieved from GeneCards (https://www.genecards.org/, accessed 21 November 2025) using the term “senescence” [23]. Genes with a relevance score ≥20 were retained, duplicates were removed, and 4337 genes were used for subsequent analyses. Senescence-associated differentially expressed genes (DEGs) were defined as the intersection between PBMC DEGs and curated senescence-associated genes. Functional enrichment analyses were performed using clusterProfiler (version 4.10.1) [24] with org.Hs.eg.db, following conversion of gene symbols to Entrez Gene IDs. Gene Ontology (GO) [25] enrichment was conducted for biological process (BP), cellular component (CC), and molecular function (MF) categories, and KEGG [26] pathway enrichment was performed using the same framework. Multiple testing correction was applied using the Benjamini–Hochberg method, and terms with FDR <0.05 were considered significant. Enrichment results were visualized as bar plots and dot plots ranked by gene ratio and adjusted significance. Protein–protein interaction (PPI) networks for senescence-associated DEGs were retrieved from STRING [27] using a medium confidence score >0.7 and visualized as undirected interaction graphs.
2.4. Weighted Gene Co-Expression Network Analysis (WGCNA)
Weighted gene co-expression network analysis (WGCNA) [28] was conducted using the WGCNA package (version 1.73) on the normalized PBMC expression matrix. Genes with low expression (bottom 25% median absolute deviation) were filtered prior to analysis. Soft-thresholding power (β) was selected (β = 4) based on scale-free topology fit index (R2 > 0.8) and mean connectivity. A signed co-expression similarity matrix was transformed into an adjacency matrix and topological overlap matrix (TOM), followed by hierarchical clustering with dynamic tree cutting (minimum module size = 50) and module merging (cut height = 0.4). Module eigengenes were correlated with T2DM status (binary trait) using Pearson correlation, with significance determined by p < 0.05. Module–trait relationships, eigengene dendrograms, and intramodular connectivity (kME) versus gene significance plots were generated using built-in WGCNA functions.
2.5. Feature Selection and Construction of a Diagnostic Signature
Three machine-learning algorithms were used in R to identify a robust diagnostic molecular signature that distinguished T2DM from controls. LASSO logistic regression (glmnet version 4.1-8) optimized the penalty parameter (λ) via 10-fold cross-validation, selecting sparse predictors [29]. A random forest classifier (randomForest; ntree = 1000) was trained with out-of-bag estimation enabled, and feature importance was assessed by mean decrease in node impurity (IncNodePurity) to identify informative genes [30]. Support vector machine–recursive feature elimination (SVM-RFE) (radial basis function kernel; e1071 v1.7-16) with 10-fold cross-validation was used to select the gene subset that minimized the cross-validated misclassification error [31]. The final three-gene signature, comprising ICE2 (interactor of little elongation complex ELL subunit 2), NHLRC2 (NHL repeat-containing protein 2), and RPS24 (ribosomal protein S24), was defined by the intersection of candidate features identified by multiple feature-selection methods, with cross-validated performance reported as accuracy, sensitivity, specificity, and area under the receiver operating characteristic curve (AUC). Feature-selection stability was evaluated using 25 repeats of stratified four-fold cross-validation. Within each training fold, differential expression analysis, WGCNA, and candidate gene selection using LASSO, RF, and SVM-RFE were repeated, with hyperparameters tuned by inner cross-validation. Held-out samples were excluded from feature selection and tuning. Selection frequencies were calculated across successfully completed folds.
2.6. Diagnostic Model Validation and Nomogram Development
A three-gene signature (ICE2, NHLRC2, RPS24) was used to develop a diagnostic model for T2DM. A multivariable logistic regression model was fitted using the rms package and visualized as a nomogram for individualized risk estimation. Model discrimination was evaluated by receiver operating characteristic (ROC) analysis using Proc [32], with performance quantified by the area under the curve (AUC) and corresponding 95% confidence intervals. The nomogram-based model [33] was further assessed in independent external validation datasets (GSE185011 and GSE189005) using the same ROC/AUC framework. The nomogram was generated based on the multivariable logistic regression model incorporating ICE2, NHLRC2, and RPS24 expression levels.
2.7. Immune Cell Deconvolution and Gene-Immune Correlations
Immune cell fractions in PBMC samples were inferred from the merged expression matrix using CIBERSORT with the LM22 signature matrix (permutations = 100; quantile normalization enabled) [34]. Immune cell types with zero estimated abundance across all samples were removed, and relative fractions were compared between control and T2DM using two-sided unpaired Student’s t-tests. Within the T2DM group, Spearman correlation was used to evaluate immune–immune relationships and to assess associations between biomarker expression (ICE2, NHLRC2, and RPS24) and inferred immune cell fractions, with p values adjusted by the Benjamini–Hochberg method. Results were visualized as stacked bar plots, boxplots, correlation heatmaps, and lollipop plots using ggplot2 [35] and related R packages.
2.8. Single-Cell RNA-Seq Analysis (PBMCs and Pancreatic Islets)
Single-cell RNA-seq datasets from GSE280401 (PBMCs) and GSE81608 [36] (pancreatic islets) were analyzed to characterize the cell type-specific expression patterns of the diagnostic genes (ICE2, NHLRC2, and RPS24) and to evaluate diabetes-associated cellular programs at single-cell resolution. All analyses were performed in R using the Seurat package (version 5.3.0) [37,38]. Briefly, cells were subjected to standard quality control filtering to remove low-quality profiles, followed by library-size normalization and log-transformation. Highly variable genes were identified for principal component analysis (PCA), and a shared nearest-neighbor (SNN) graph was constructed for graph-based clustering. Low-dimensional embeddings were generated using UMAP for visualization. Major immune cell subsets (PBMCs) and endocrine lineages (alpha, beta, delta, and PP cells) were annotated based on canonical marker genes. The expression distributions of ICE2, NHLRC2, and RPS24 were visualized using UMAP feature plots and summarized across annotated cell types and disease conditions (T2D vs. control/non-diabetic) using dot plots and split violin plots. For the PBMC dataset, intercellular communication changes between T2D and controls were further inferred using a ligand–receptor interaction framework to quantify sender–receiver signaling strength alterations across immune populations [39,40].
2.9. Isolation of Peripheral Blood Mononuclear Cells
Peripheral blood mononuclear cells (PBMCs) were isolated by density gradient centrifugation using isotonic Percoll separation medium (Cytiva, Marlborough, MA, USA). Peripheral blood samples were obtained from 32 outpatients with type 2 diabetes mellitus and 19 healthy controls recruited from either outpatient clinics or routine health examinations at Wuhan No. 1 Hospital. Blood samples were collected into EDTA anticoagulant tubes, diluted 1:1 with phosphate-buffered saline (PBS), and gently layered onto the Percoll medium. After centrifugation at 600× g for 30 min at room temperature without brake, the PBMC layer at the plasma–Percoll interface was collected. The cells were washed twice with PBS by centrifugation at 450× g for 8 min to remove residual plasma and Percoll, and then used for subsequent experiments. This study was approved by the Ethics Committee of Wuhan NO. 1 Hospital (approval number: Scientific Ethics [2026] No. 86), and a waiver of informed consent was granted. All methods were performed in accordance with the relevant guidelines and regulations and with the Declaration of Helsinki. Participant demographic characteristics are shown in Table S2. Normally distributed continuous data were summarized as mean ± SD and compared using Student’s t-test; otherwise, data were presented as median (interquartile range, IQR) and analyzed with the Mann–Whitney U test. Categorical variables were expressed as frequencies (percentages) and examined by χ2 test.
2.10. Reverse Transcription-Quantitative PCR Analysis
Total RNA was extracted from PBMCs using TRIzol reagent (Thermo Fisher Scientific, Waltham, MA, USA) according to the manufacturer’s instructions. Subsequently, 1 μg of total RNA was reverse-transcribed into cDNA using the HyScriptTM IV RT All-in-One SuperMix (HYCEZMBIO, Wuhan, China). Quantitative real-time PCR was performed using SYBR Green qPCR Mix (Tsingke Biotechnology, Beijing, China) on a Molarray MA-6000 Real-Time PCR System (Molarray, Suzhou, China). β-actin was used as the internal reference gene. Each experiment was performed with three replicates. Data were analyzed by the 2−ΔΔCT method. p < 0.05 was considered statistically significant. The primer sequences used for amplification are listed in Table S3.
2.11. Consensus Clustering, Subtype Characterization, and Pathway Analysis
Consensus clustering was conducted in T2DM samples using ConsensusClusterPlus [41] (version 1.66.0) on the expression matrix of selected genes. Hierarchical clustering with average linkage and a Spearman correlation-based distance was applied, evaluating up to K = 5 clusters. Cluster stability was assessed over 100 resampling iterations by subsampling 80% of samples per iteration while retaining all features. The optimal number of clusters was determined by inspection of consensus matrices and cumulative distribution function (CDF) curves, and samples were assigned to consensus-derived clusters. Principal component analysis (PCA) was performed using FactoMineR (version 2.11) [42] and visualized with factoextra (version 1.0.7) to confirm subtype separation. Differential expression between T2DM subtypes was analyzed using limma [22] with empirical Bayes moderation, and genes were ranked by log2 fold change. Gene set enrichment analysis (GSEA) was performed on the ranked gene list using clusterProfiler [27] (version 4.10.1) against MSigDB C2 curated gene sets, with significance assessed by Benjamini–Hochberg-adjusted p values [24].
3. Results
3.1. Identification of Differentially Expressed Genes (DEGs) in T2DM Patients
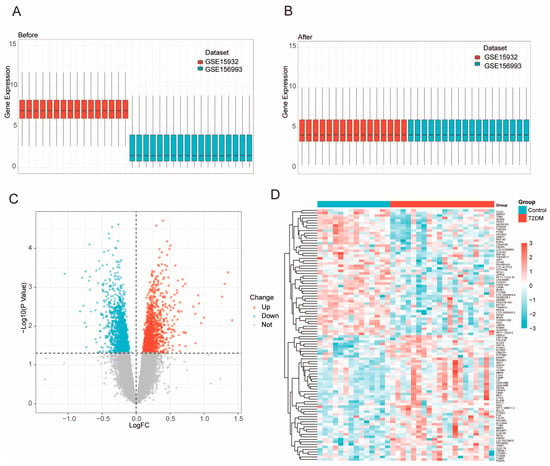
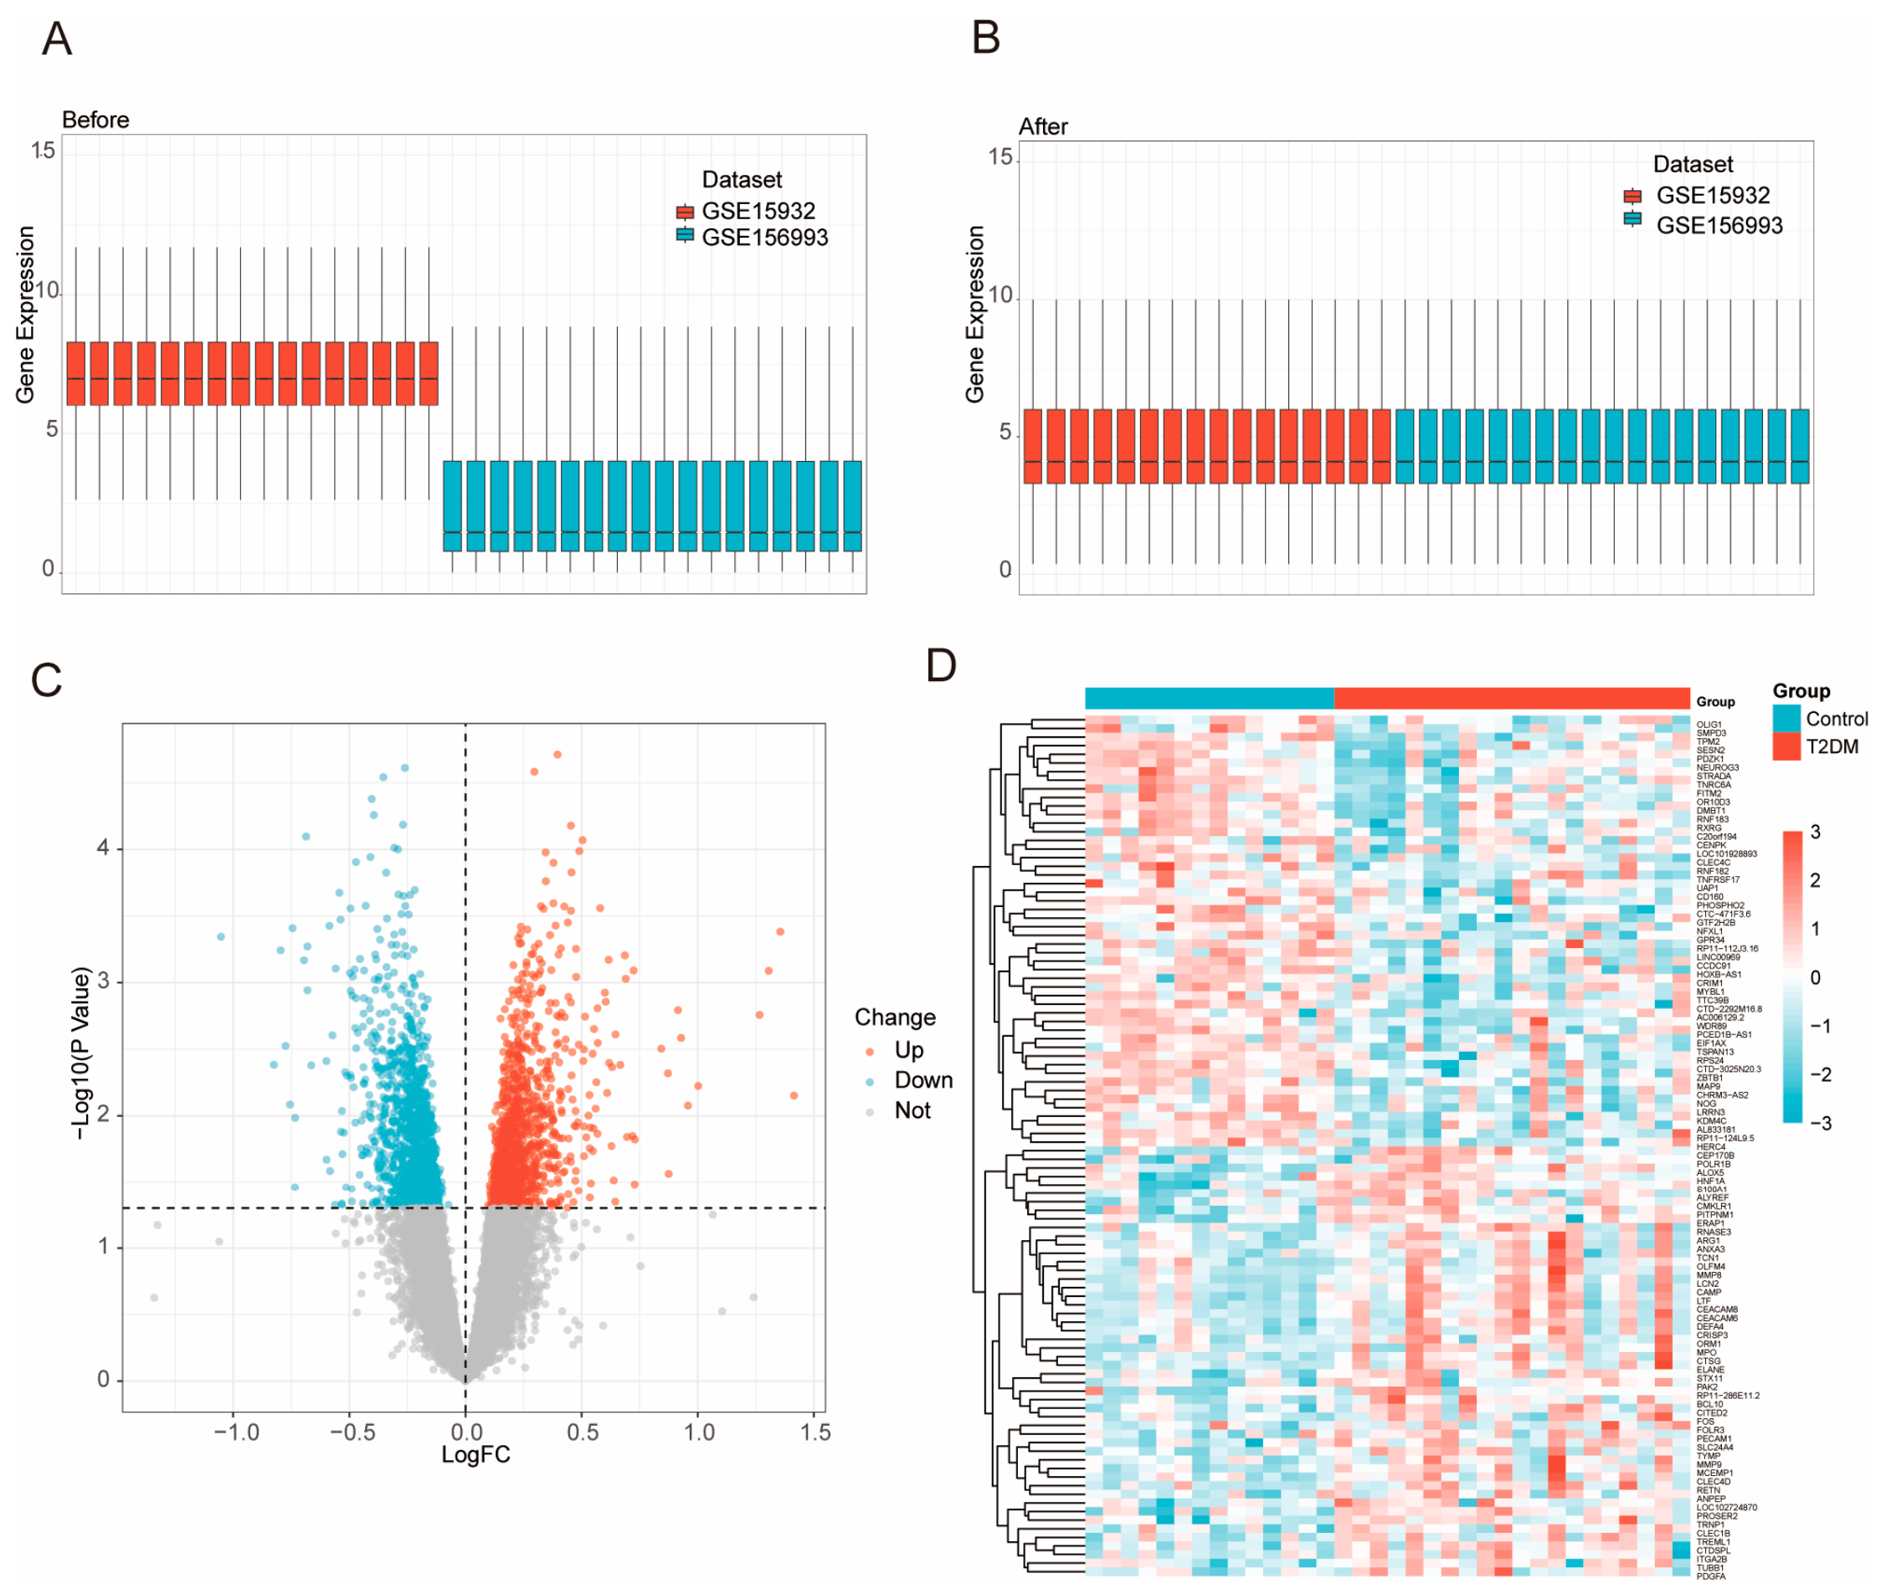
We integrated two public PBMC transcriptomic cohorts (GSE156993 and GSE15932) to build a T2DM diagnostic framework. Prior to integration, the overall expression distributions differed markedly between datasets, indicating substantial batch effects; after normalization and batch-effect correction, the distributions became well aligned across samples, supporting improved cross-cohort comparability (Figure 2A,B and Figure S1). Differential expression analysis on the corrected matrix identified a set of genes significantly upregulated or downregulated in T2DM relative to controls, consistent with broad transcriptional remodeling in PBMCs (Figure 2C). Unsupervised clustering of representative DEGs further showed clear separation between T2DM and control samples, along with consistent expression patterns within each group (Figure 2D), providing a robust pool of candidate features for biomarker selection and model building.
Figure 2.
Transcriptomic analysis of PBMC samples from T2DM patients and healthy controls. (A,B) Evaluation of transcriptomic data harmonization before and after normalization. Boxplots show the genome-wide expression distributions of individual PBMC samples from two independent datasets (GSE15932 and GSE156993) before (A) and after (B) normalization. (C) Volcano plot of 2364 DEGs between T2DM and control groups. Red dots indicate upregulated genes, blue dots indicate downregulated genes, and grey dots indicate non-significant genes (p ≥ 0.05). Differentially expressed genes were identified using a threshold of p < 0.05. Genes with log2FC > 0 were classified as upregulated, while those with log2FC < 0 were classified as downregulated. In the volcano plot, the horizontal dashed line indicates the threshold of p = 0.05, and the vertical dashed line indicates log2FC = 0 (D) Heatmap of the top 50 DEGs based on adjusted p-value shows distinct separation between T2DM and control samples. Each row represents a gene, each column a sample, and color denotes normalized expression (Z-score).
To further examine the consistency of the three candidate genes, we evaluated their expression patterns separately across the discovery cohorts and an independent PBMC dataset (Table S4). The results varied across cohorts. Although ICE2 and NHLRC2 showed significant differential expression in GSE15932, these findings were not consistently observed in GSE156993. In the independent GSE185011 cohort, none of the three genes reached statistical significance after multiple-testing correction. These findings highlight the need for further evaluation of the reproducibility of the three candidate genes across independent datasets.
3.2. Senescence-Related Transcriptional Alterations in T2DM Patients
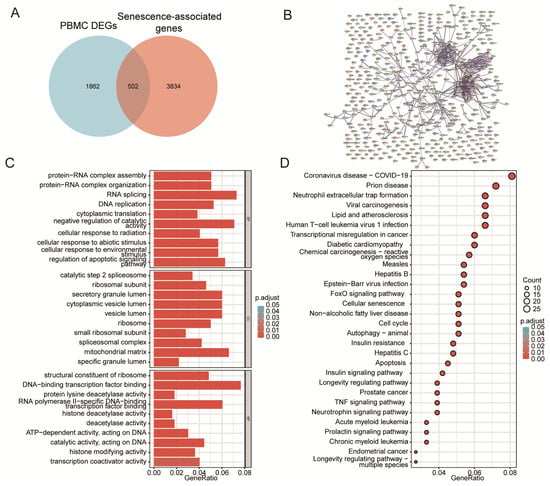
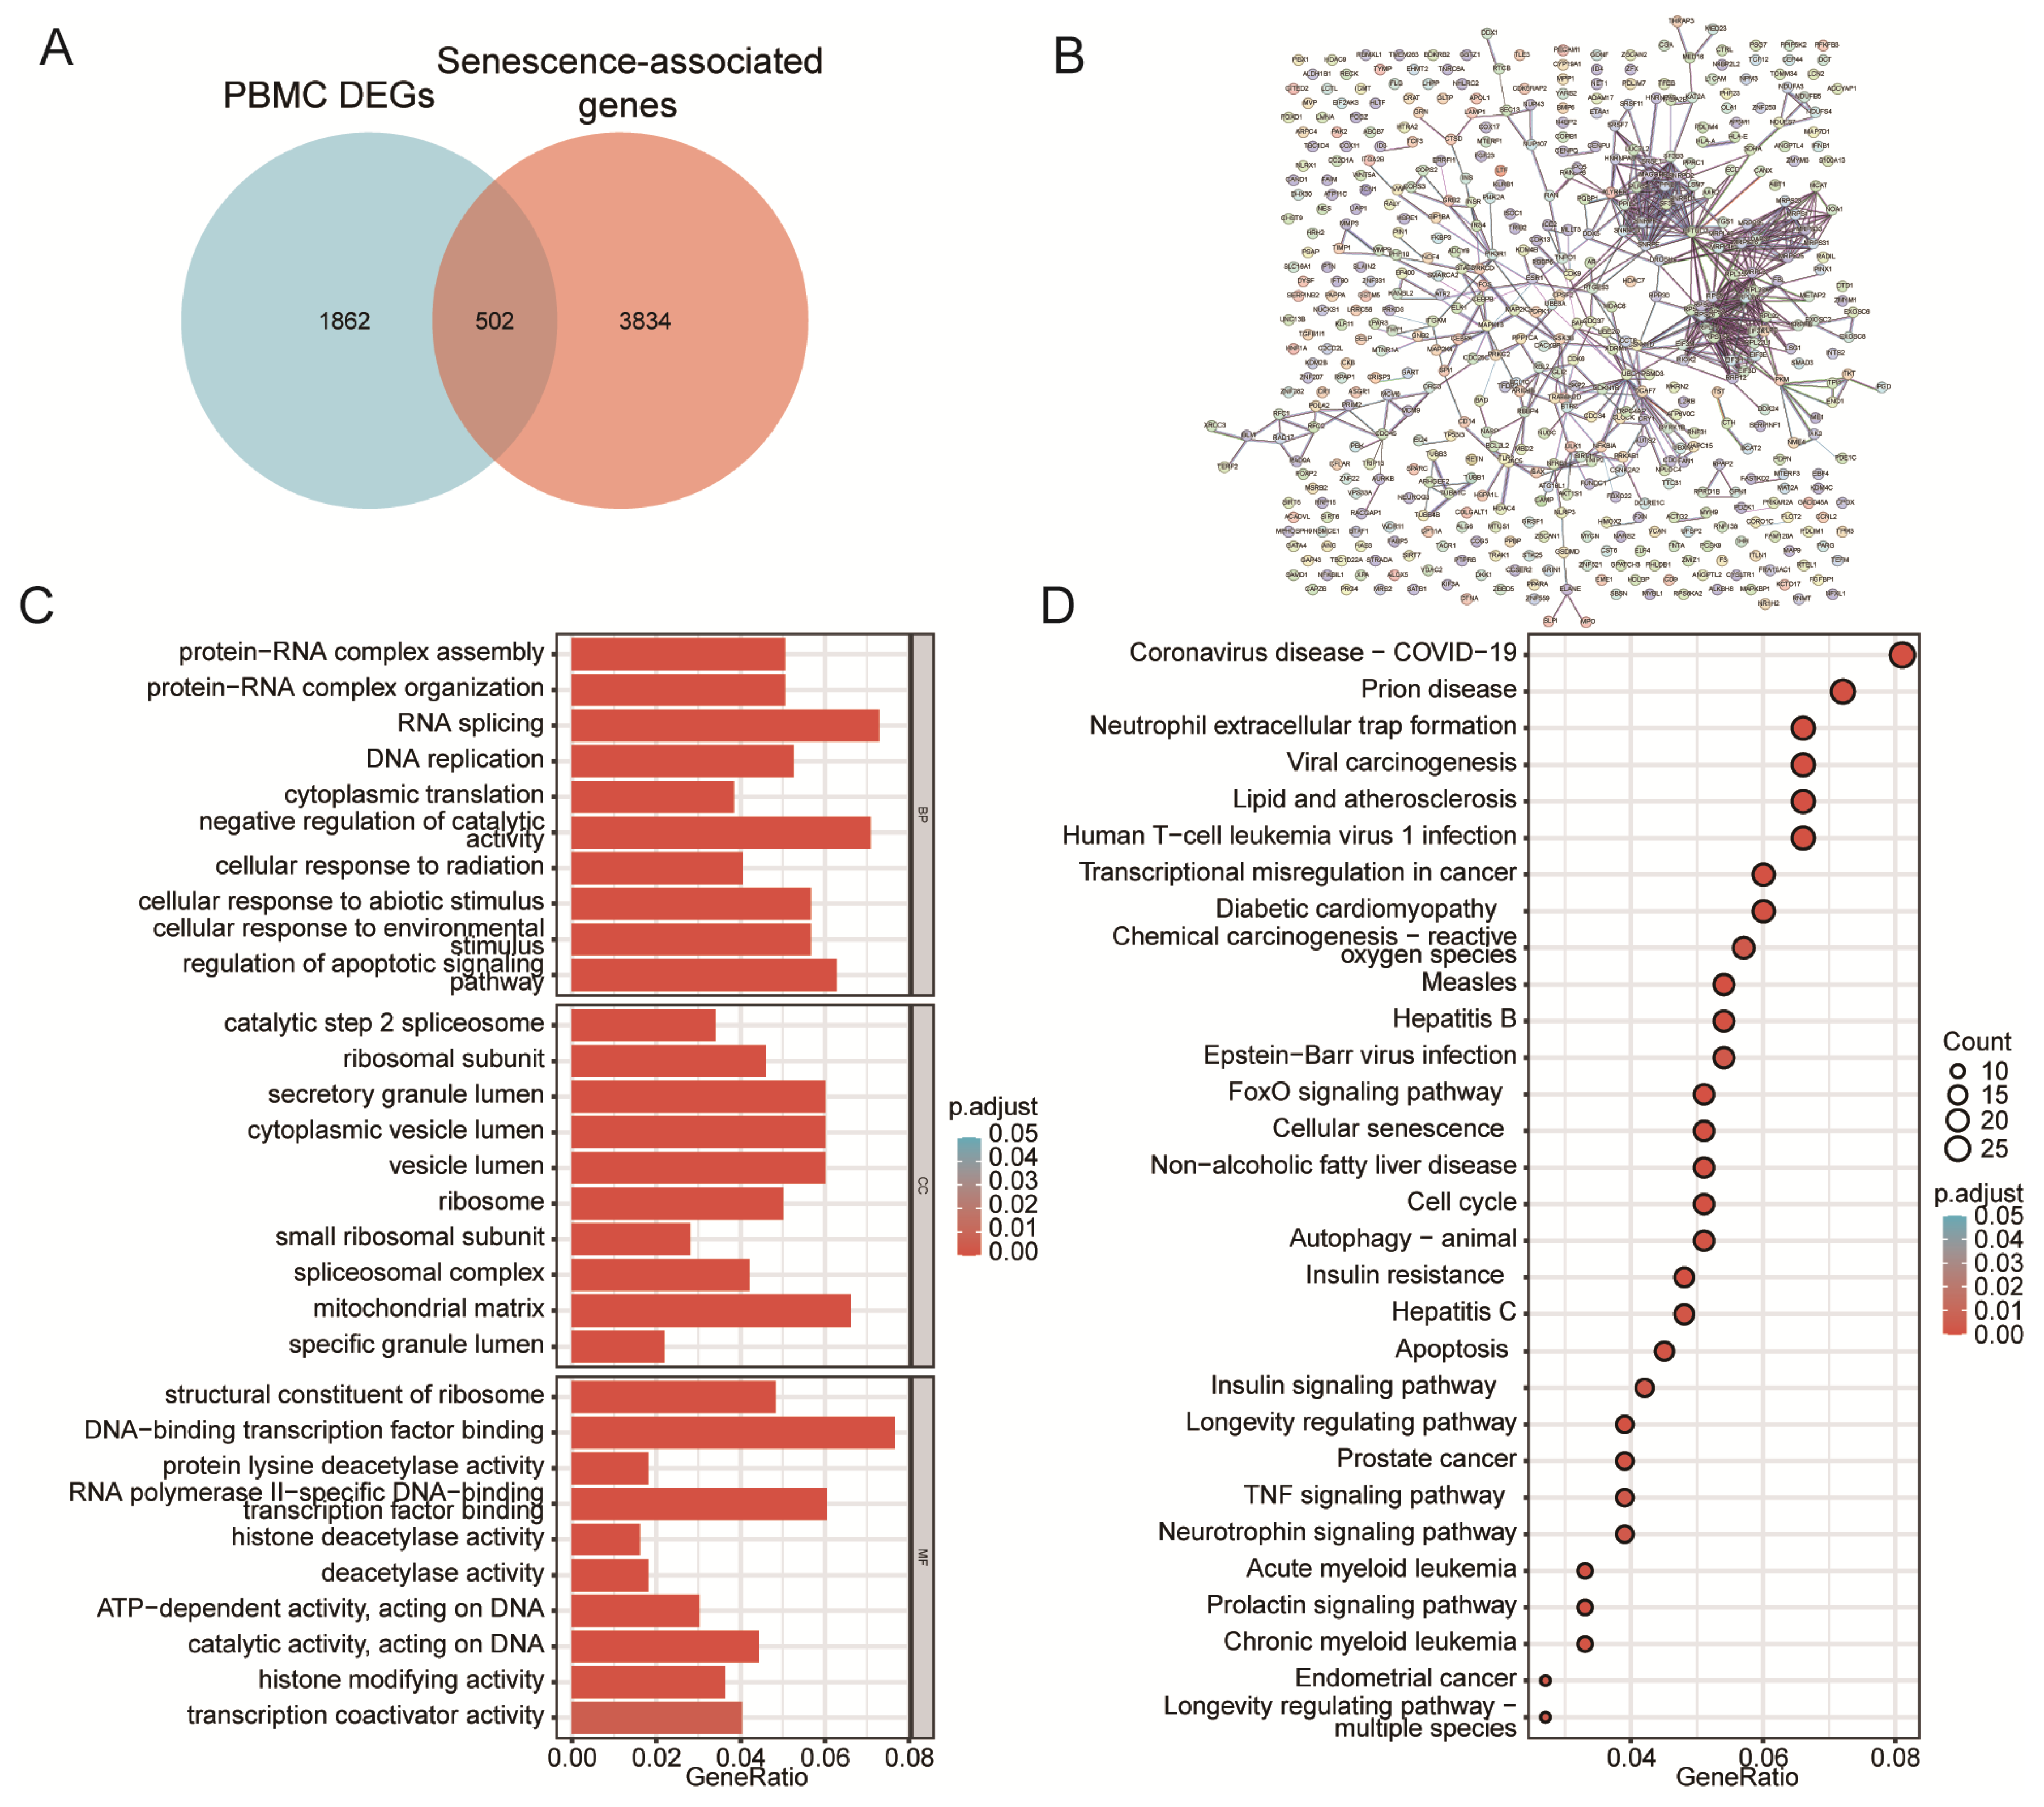
We intersected PBMC DEGs with the senescence-associated genes and identified 502 senescence-associated DEGs (Figure 3A). This result indicates that a substantial fraction of T2DM-related transcriptional changes in circulating immune cells are linked to senescence biology. GO enrichment highlighted processes such as RNA splicing, protein–RNA complex organization, DNA replication, cell-cycle functions, and translation (Figure 3C). These results suggest coordinated changes in core gene expression and cell proliferation programs. Enriched cellular components included spliceosomal and ribosomal assemblies, as well as other intracellular structures. Meanwhile, molecular functions reflected regulatory activities such as transcription factor binding and chromatin or epigenetic modulation. KEGG pathway analysis revealed enrichment of several diabetes-relevant pathways, including insulin signaling, insulin resistance, inflammatory TNF signaling, FoxO signaling, and pathways associated with cellular senescence (Figure 3D). To evaluate whether the senescence-associated differentially expressed genes represent a coordinated functional module, we constructed a STRING-based PPI network. The observed number of interactions was significantly higher than expected from a random gene set of comparable size (PPI enrichment p = 0.000619), indicating significant functional connectivity among these genes (Figure 3B). This suggests the existence of a coordinated senescence- and immune-related module that may contribute to PBMC dysfunction in T2DM.
Figure 3.
Functional characterization of senescence-related differentially expressed genes (DEGs) in PBMCs. (A) Overlap between PBMC DEGs and a curated cellular senescence-associated gene set. Among the identified DEGs, 502 genes overlapped with the senescence-associated gene set, while 1862 DEGs and 3834 senescence-associated genes were unique to each list. Senescence-related genes were retrieved from GeneCards using the keyword “senescence” (accessed 21 November 2025). After filtering for a relevance score ≥ 20 and removing duplicates, 4337 genes were retained for analysis [23]. (B) STRING-based protein–protein interaction (PPI) network of senescence-associated differentially expressed genes. The network was constructed using STRING interactions with a minimum confidence score of 0.7. The observed connectivity was significantly higher than expected by chance (PPI enrichment p = 0.000619). Colors are for visualization only (C) Gene Ontology (GO) over-representation analysis (Biological Process, Cellular Component, and Molecular Function) of the 502 genes. Each bar represents one significantly enriched GO term (FDR < 0.05), grouped into Biological Process, Cellular Component, and Molecular Function; bar length denotes the GeneRatio (the proportion of the 502 genes annotated to that term), and color indicates the FDR-adjusted p value. (D) KEGG pathway enrichment of the 502 genes displayed as a dot plot; dot size reflects the number of genes mapped to each pathway (Count) and dot color indicates the FDR-adjusted p value.
3.3. Co-Expression Network Analysis Reveals T2DM-Associated Modules
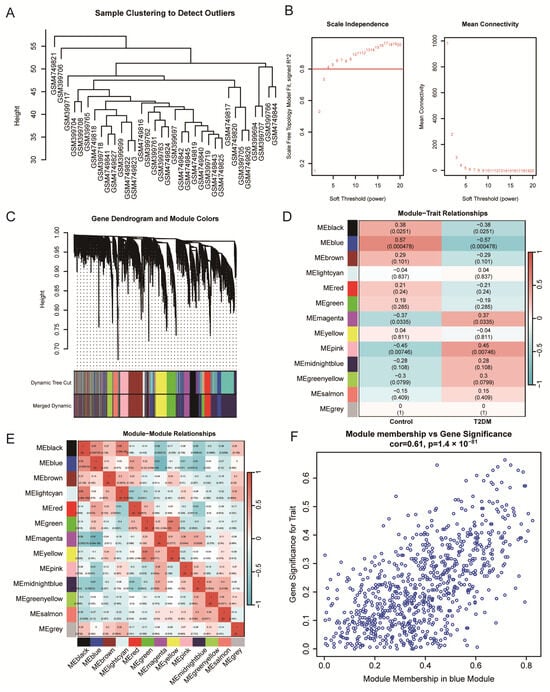
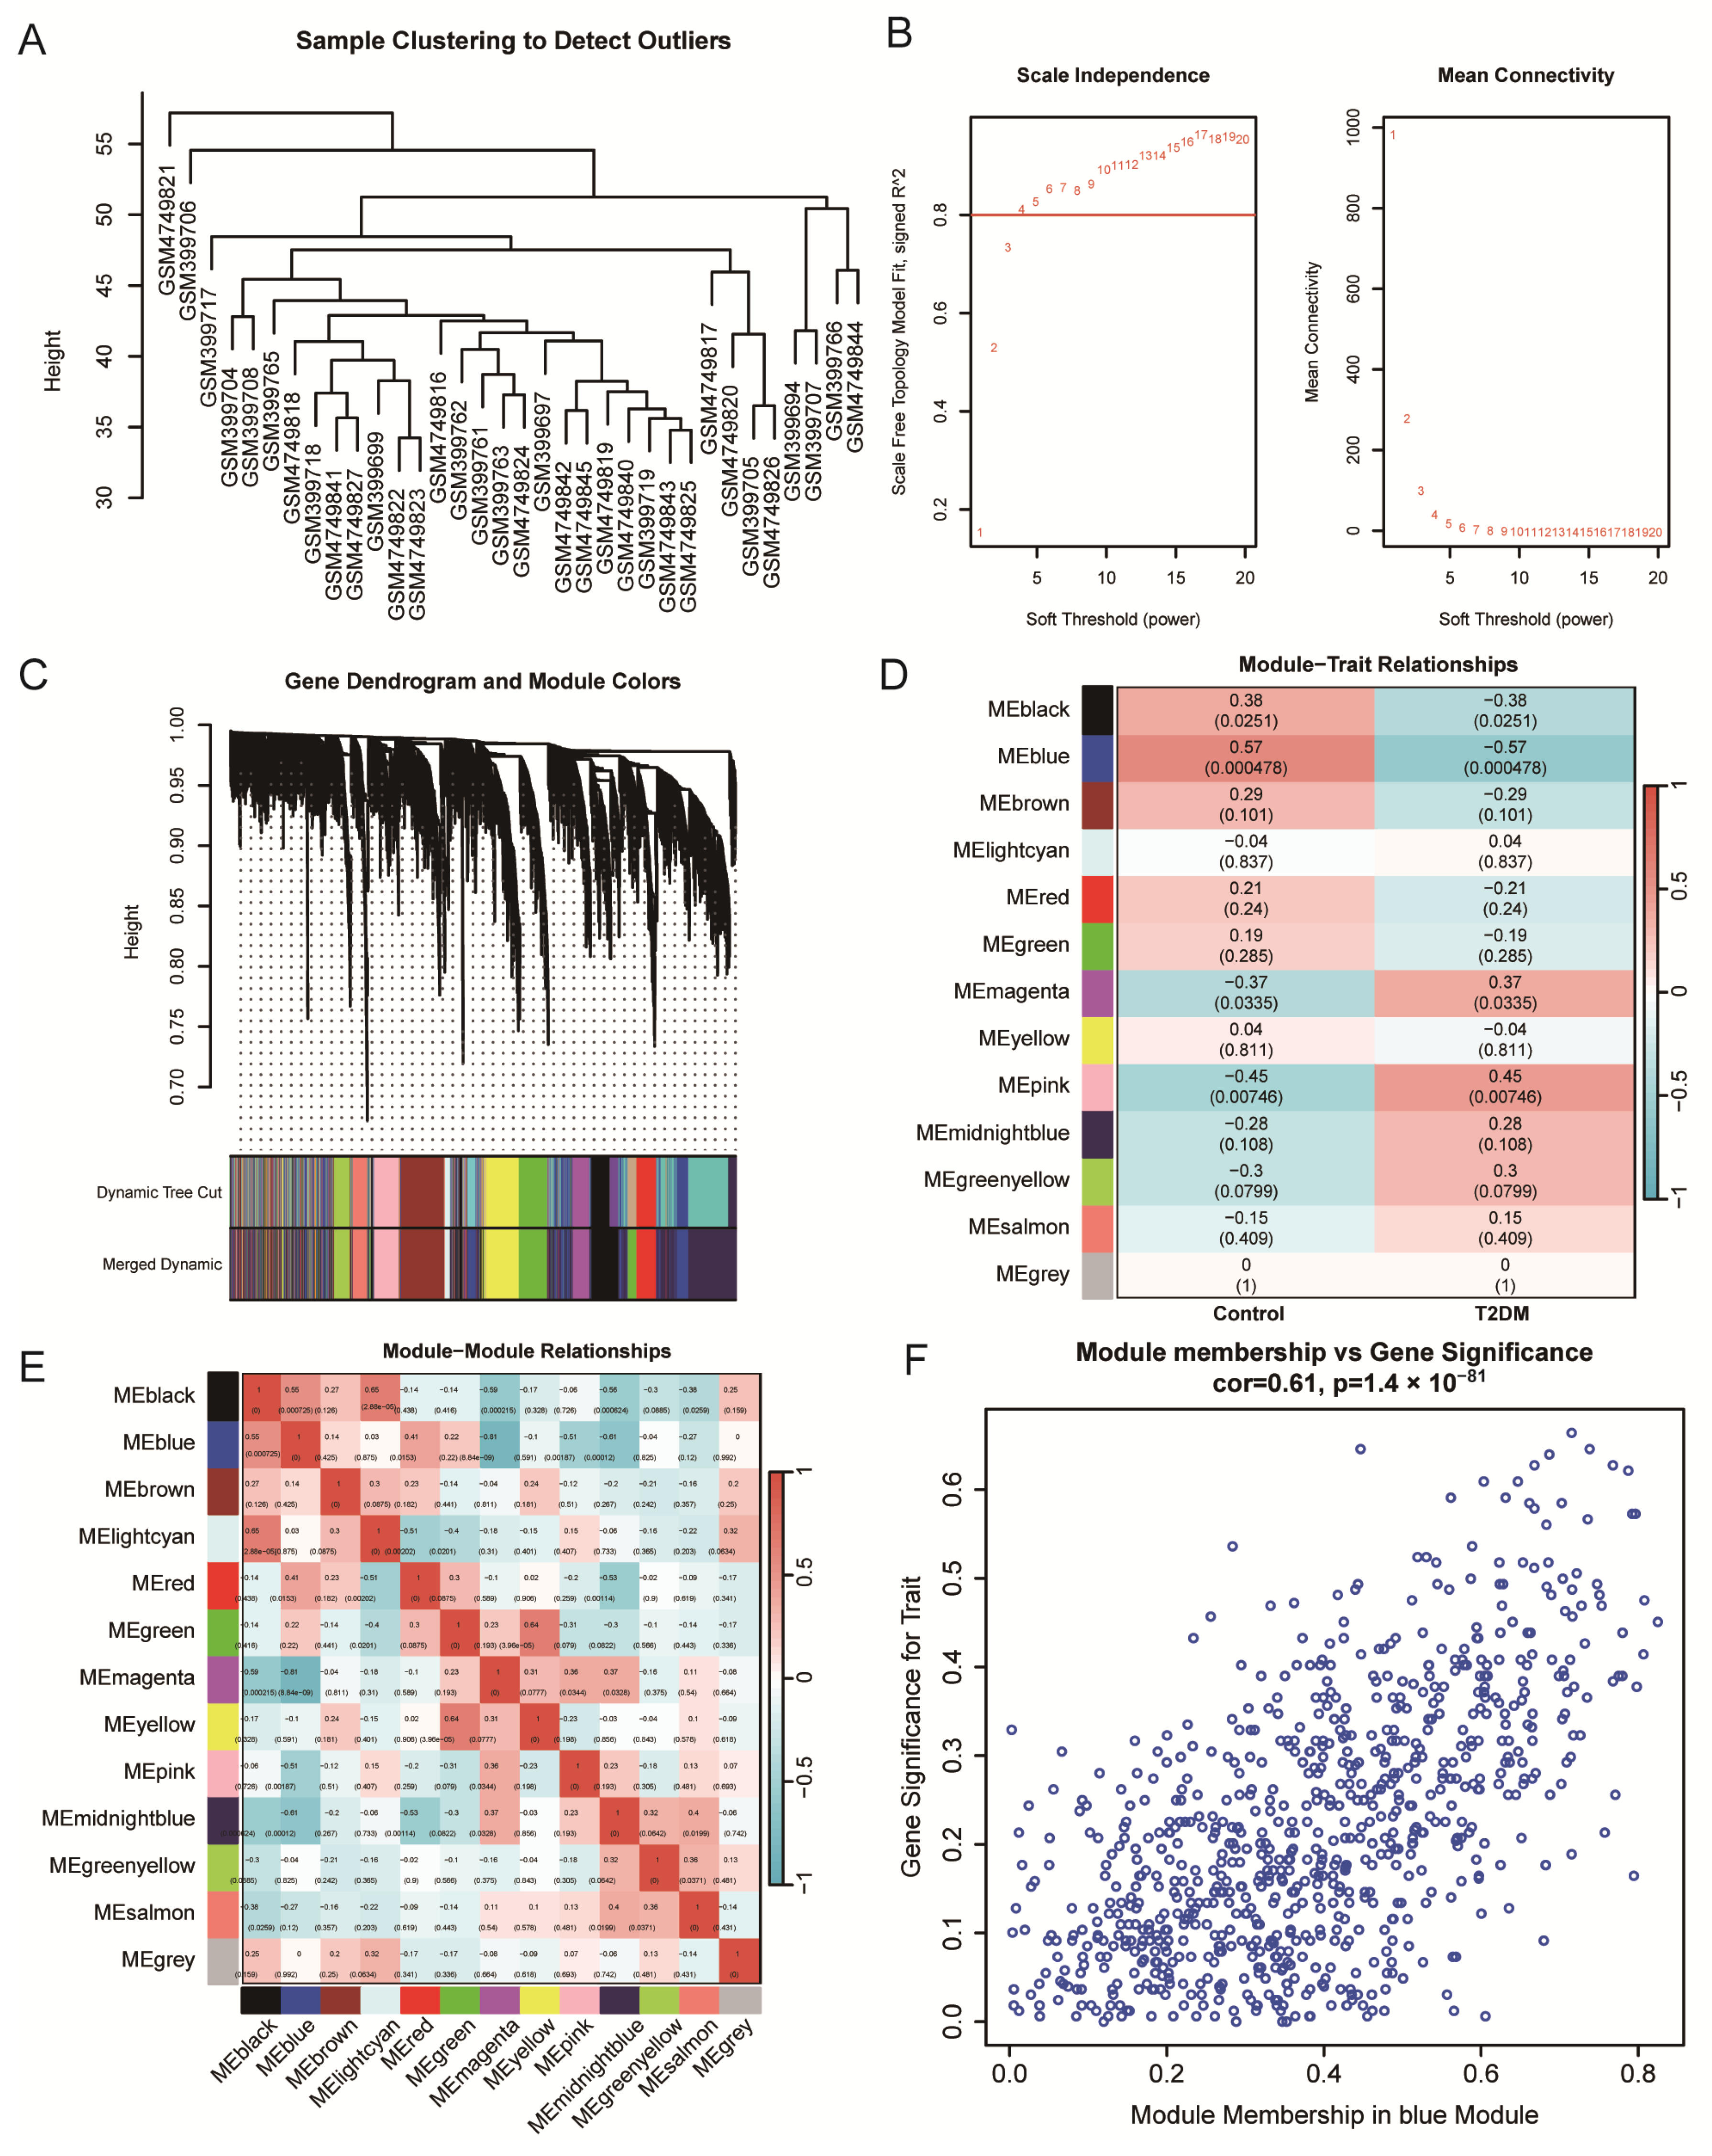
We applied WGCNA on the integrated PBMC expression matrix. Hierarchical clustering of samples did not identify obvious outliers, supporting the robustness of downstream network construction (Figure 4A). A soft-thresholding power was then selected to approximate scale-free topology, achieving a high scale-free fit while maintaining acceptable mean connectivity (Figure 4B). Gene co-expression analysis yielded multiple distinct modules, illustrated by the gene dendrogram and module color assignments before and after merging (Figure 4C). Module–trait correlation analysis identified several modules significantly linked to disease status. The blue module showed the strongest association with the phenotype (|r| ≈ 0.57, p ≈ 0.0048), with other modules, such as pink and magenta, also related to traits (Figure 4D). Inter-module relationship analysis further demonstrated structured correlations among module eigengenes, indicating non-random organization of the co-expression network (Figure 4E). Finally, within the key module, module membership was strongly correlated with gene significance (cor = 0.61, p = 1.4 × 10−81). This supports the presence of biologically meaningful hub genes that closely link to the clinical trait and are suitable for downstream feature prioritization (Figure 4F). The genes within the T2DM-associated module were subsequently considered as candidates for downstream integration with senescence-associated signatures and biomarker development.
Figure 4.
WGCNA identifies T2DM-associated transcriptional modules and hub genes in PBMCs. Weighted gene co-expression network analysis was performed to identify coordinated transcriptional programs associated with T2DM. (A) Hierarchical clustering of samples showing no apparent outliers before network construction. (B) Selection of the soft-thresholding power based on scale-free topology criteria. The red numbers indicate the candidate soft-thresholding powers (β) evaluated in the analysis. The red horizontal line marks the reference threshold of the scale-free topology fit index (signed R2 = 0.80) (C) Identification of co-expression modules based on gene clustering and module merging. Gene clustering dendrogram with module assignments. The “Dynamic Tree Cut” and “Merged Dynamic” color bands show initial and merged modules, respectively; each color denotes a module and grey denotes unassigned genes. Module colors are arbitrary and do not encode ex-pression direction or statistical significance (D) Module–trait correlation analysis identifying modules associated with T2DM status. The blue module showed the strongest association with disease status. (E) Module eigengene correlation analysis demonstrating relationships among identified modules. (F) Correlation between module membership and gene significance within the key module, supporting the identification of phenotype-associated hub genes.
3.4. Feature Selection and Diagnostic Model Construction
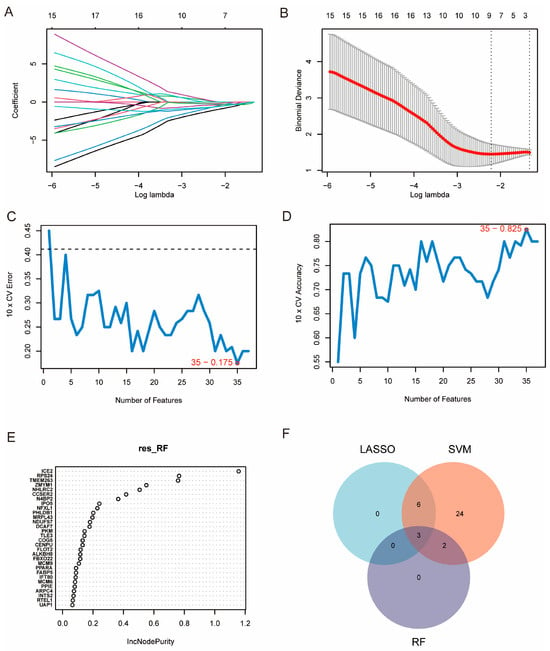
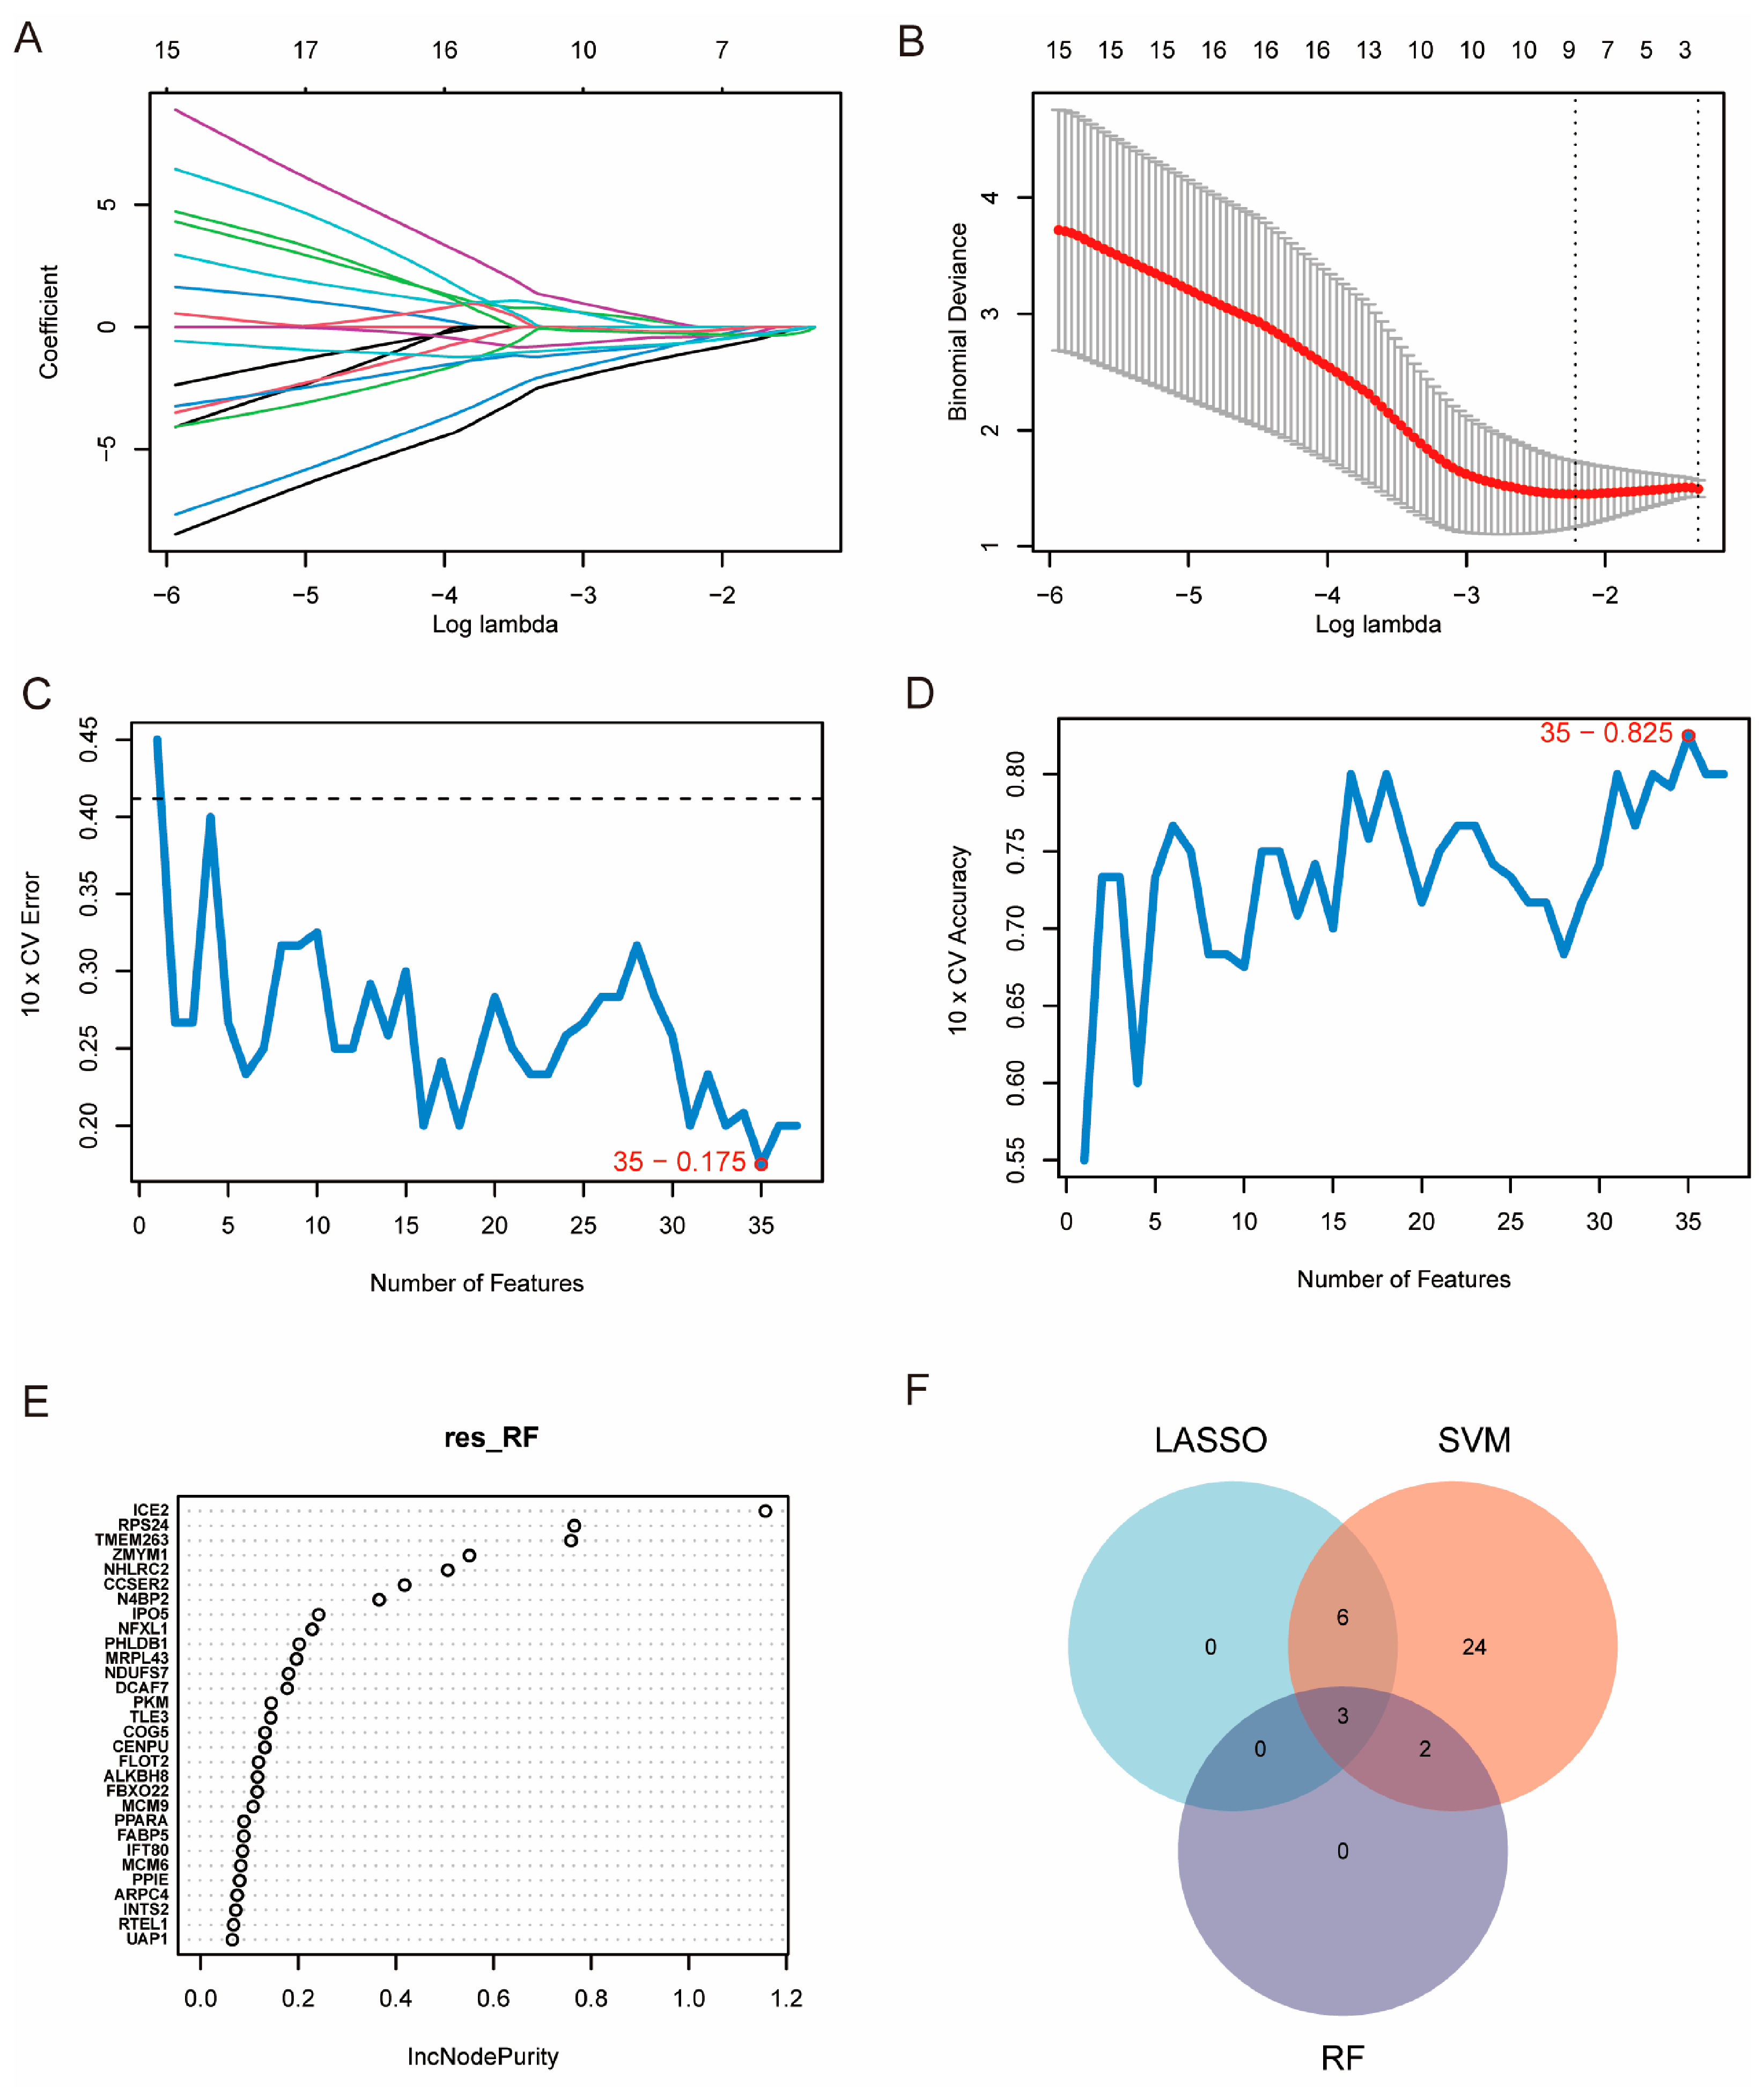
During feature selection, we applied three complementary machine-learning approaches: LASSO regression, SVM–recursive feature elimination (SVM-RFE), and random forest (RF). These methods were used to identify robust diagnostic markers (Figure 5). In the LASSO model, regression coefficients decreased toward zero as the penalty increased, and the optimal λ from cross-validation retained nine non-zero features (Figure 5A,B). SVM-RFE further evaluated model performance across different feature set sizes. The lowest 10-fold cross-validation error and highest accuracy were achieved at 35 features (CV error = 0.175; accuracy = 0.825) (Figure 5C,D). RF analysis ranked candidate genes by importance (IncNodePurity) and identified a subset of highly informative predictors (Figure 5E). A Venn diagram summarizing overlaps across methods showed that SVM identified 35 features, including six shared with LASSO, two shared with RF, and three genes consistently selected by all three algorithms (Figure 5F), which were then prioritized as high-confidence candidates for subsequent diagnostic model construction and biological interpretation.
Figure 5.
Feature selection and model construction using LASSO, Random Forest, and Support Vector Machine. (A) LASSO coefficient profiles of candidate genes across log (λ). Each colored line represents the coefficient trajectory of an individual gene as the reg-ularization parameter (λ) changes. (B) Ten-fold cross-validation curve for the LASSO model. The dotted lines indicate the minimum cross-validation error (λ.min) and the one-standard-error criterion (λ.1se). (C) Ten-fold cross-validation (CV) error as a function of the number of features for the Random Forest (RF) classifier. The dashed line indicates the cross-validation error using all features. (D) Ten-fold CV accuracy versus the number of features for the RF classifier. (E) Variable importance ranking from RF based on mean decrease in node impurity, highlighting top contributing genes. (F) Venn diagram showing overlap among features selected by LASSO, SVM-based selection, and RF.
3.5. Validation of the Three-Gene Diagnostic Model in Test and Validation Cohorts
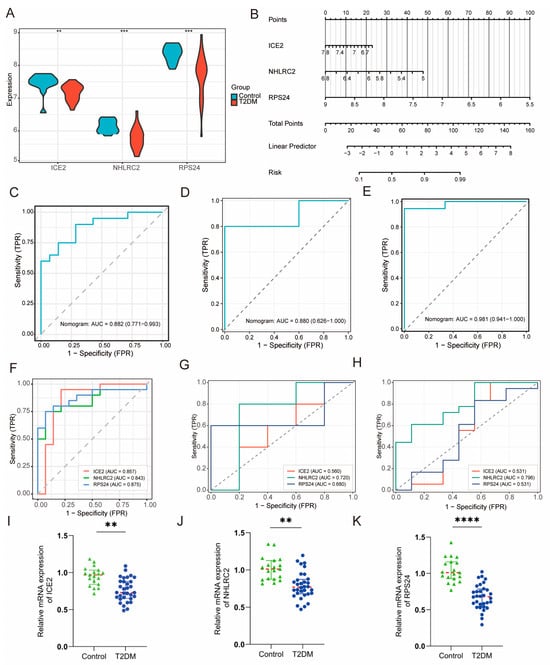
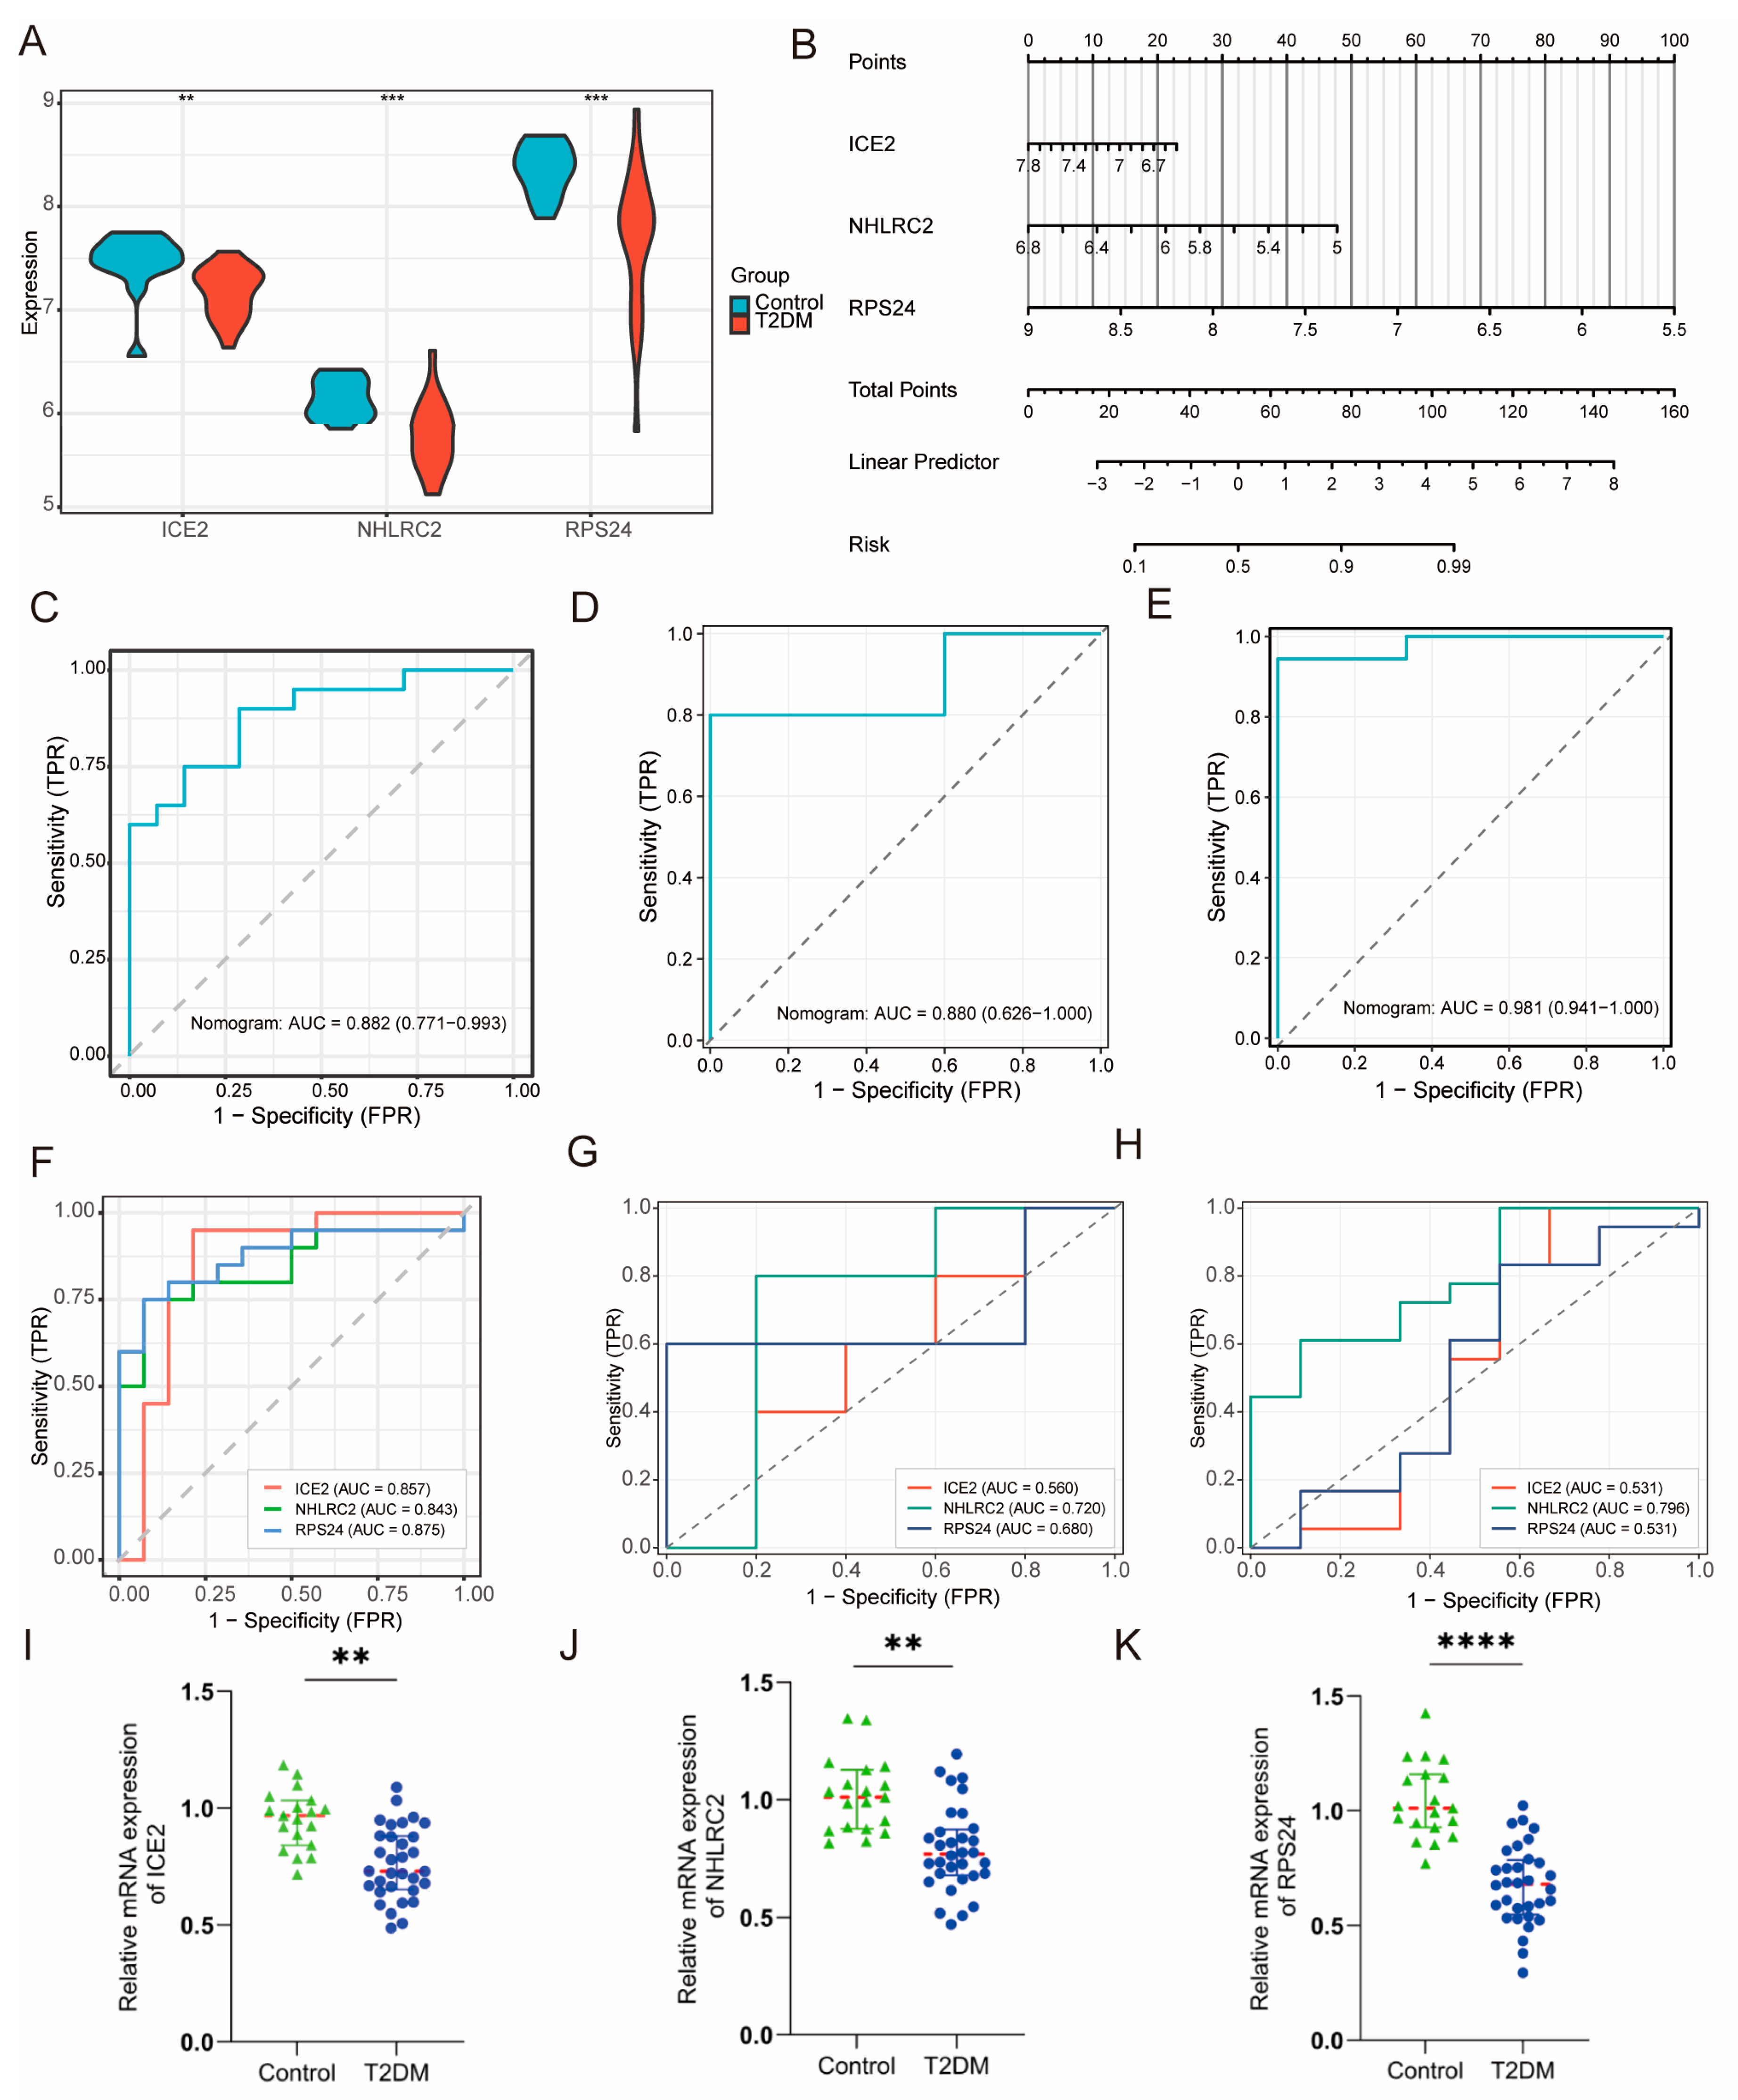
Figure 5 shows how a three-gene diagnostic signature (ICE2, NHLRC2, and RPS24) was developed and validated. In the integrated test dataset, all three genes were differentially expressed between controls and T2DM (Figure 6A), and were combined into an interpretable nomogram for individual risk estimation (Figure 6B). A nomogram was constructed based on the three-gene logistic regression model to provide an individualized estimation of T2DM probability. The expression values of ICE2, NHLRC2, and RPS24 were transformed into corresponding point scores, and the total points were used to calculate the predicted probability of T2DM. The nomogram showed good discrimination in the integrated test set (AUC = 0.882, 95% CI 0.771–0.993; Figure 6C). It also remained predictive in two independent cohorts: GSE185011 (AUC = 0.880, 95% CI 0.626–1.000; Figure 6D) and GSE189005 (AUC = 0.981, 95% CI 0.941–1.000; Figure 6E). ROC analyses of individual markers further supported the diagnostic utility of each gene across datasets (Figure 6F–H). This indicates that the combined model offers robust and generalizable performance for T2DM classification.
Figure 6.
Validation of diagnostic genes and development of a nomogram model for T2DM classification. (A) Violin plots showing expression differences in the three candidate diagnostic genes (ICE2, NHLRC2, and RPS24) between T2DM and control samples in the test cohort; significance is indicated by asterisks. (B) Nomogram based on ICE2, NHLRC2, and RPS24 expression levels for individualized T2DM risk prediction. Each gene expression value is converted into a corresponding point score according to the scale at the top of the nomogram. The sum of the individual gene scores generates the total points, which are subsequently mapped to the predicted probability of T2DM. Higher total points indicate an increased predicted probability of T2DM. (C–E) ROC curves of the integrated nomogram model combining ICE2, NHLRC2, and RPS24 in the training cohort (C) and two independent validation cohorts, GSE185011 (D) and GSE189005 (E). (F–H) ROC curves comparing the diagnostic performance of individual genes (ICE2, NHLRC2, and RPS24) in the training cohort (F), GSE185011 (G), and GSE189005 (H). (I–K) RT-qPCR analysis of the mRNA expression levels of the three diagnostic genes, ICE2 (I), NHLRC2 (J), and RPS24 (K) in control and T2DM samples. All reactions were carried out in triplicate. Statistical significance was determined using an unpaired Student’s t-test, and p values were adjusted using the Benjamini–Hochberg false discovery rate method for multiple comparisons. The red dashed horizontal lines indicate the mean expression levels of each group. ** FDR-adjusted p < 0.01. *** FDR-adjusted p < 0.001. **** FDR-adjusted p < 0.0001.
RT-qPCR was used to validate the expression of the final diagnostic genes in clinical samples. ICE2, NHLRC2, and RPS24 were significantly downregulated in T2DM samples compared with controls (Figure 6I–K), in agreement with the transcriptomic analysis. We also assessed several immune-related candidate genes identified during the screening process. IL7R and CCL5 were significantly decreased, whereas ITGAL was increased in T2DM samples; CD28 showed no significant difference between the two groups (Figure S3). These results supported the differential expression of the three diagnostic genes and provided additional evidence of immune-related transcriptional changes in T2DM.
3.6. Immune Cell Composition and Its Correlation with Diagnostic Genes
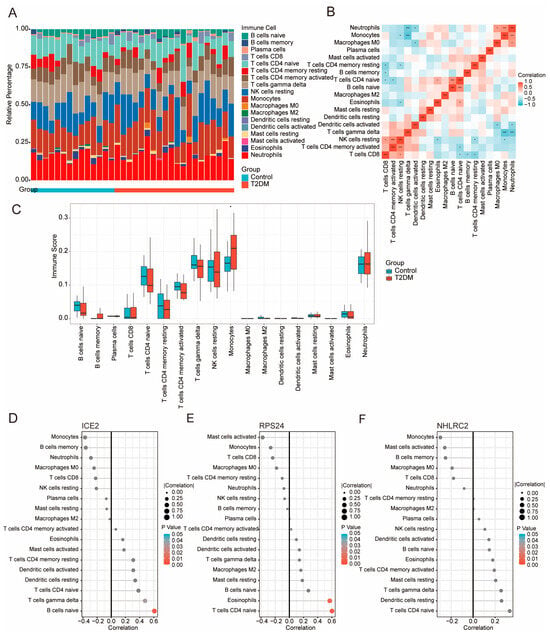
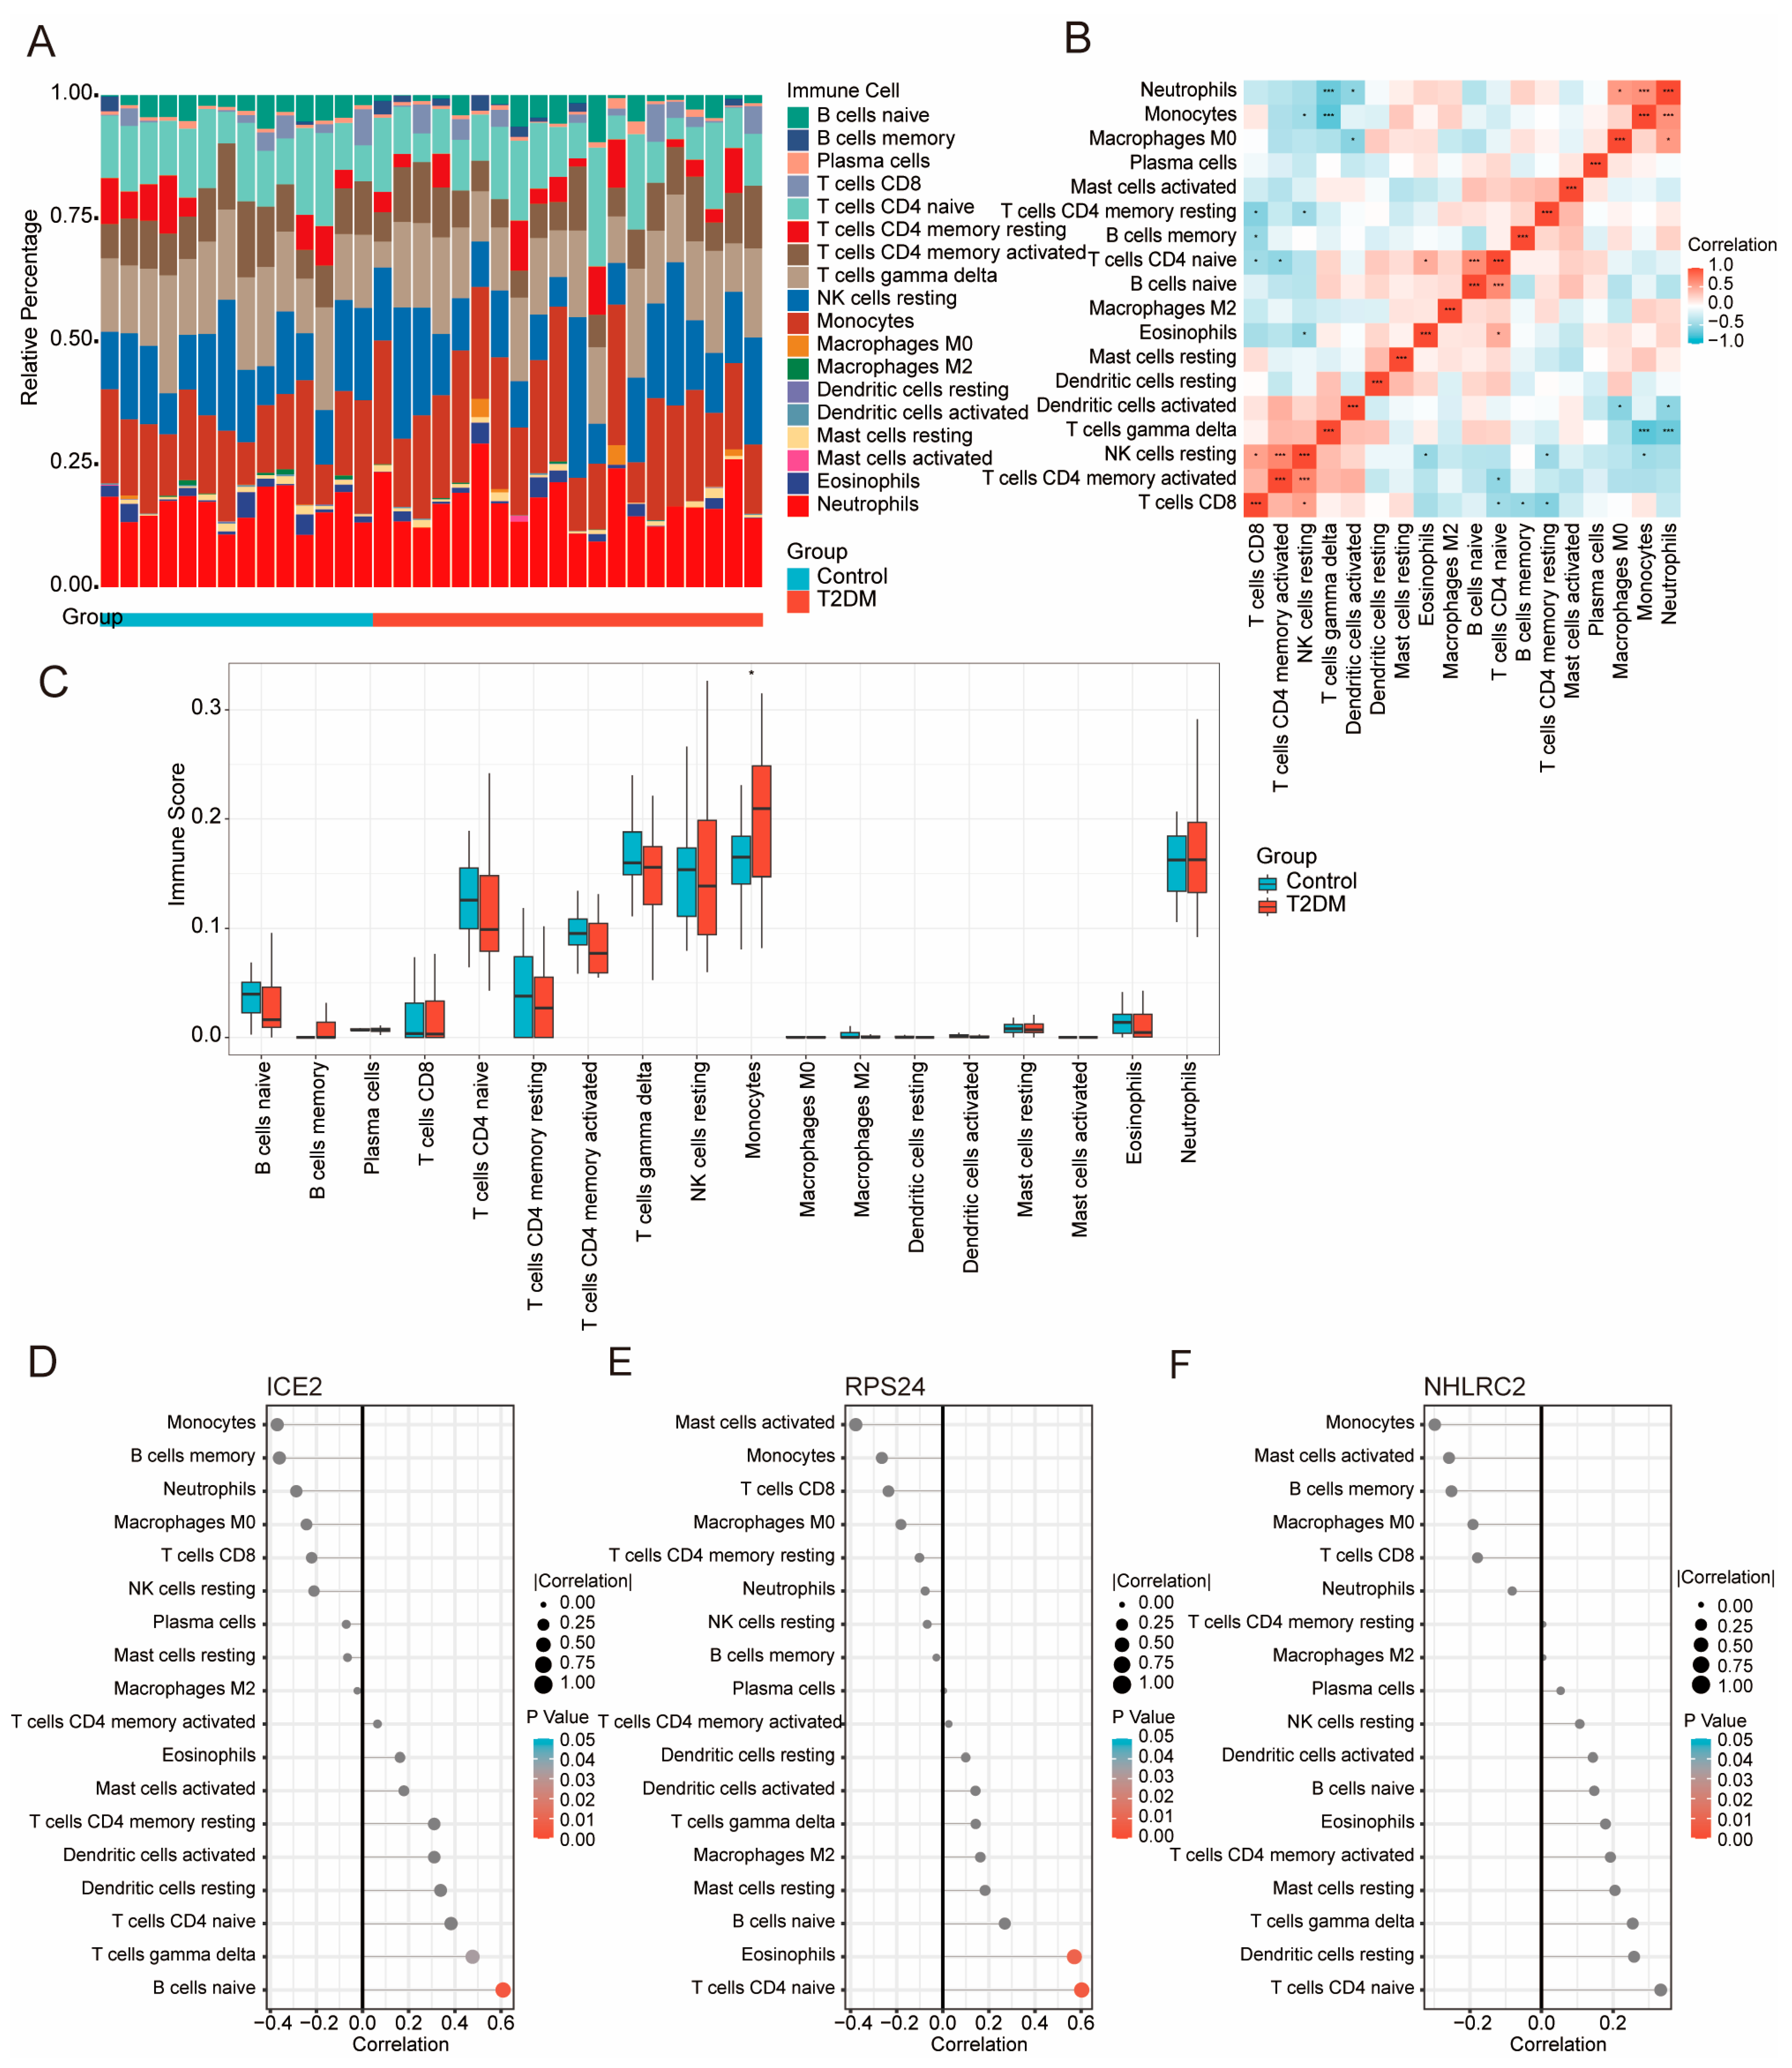
Using CIBERSORT (LM22) on the merged PBMC expression matrix, we estimated the relative fractions of 22 immune cell subsets and observed substantial inter-individual heterogeneity in immune composition across both control and T2DM samples (Figure 7A). Spearman correlation analysis of the inferred immune fractions revealed structured co-variation patterns, highlighting coordinated relationships among major lymphoid and myeloid compartments (Figure 7B). Group comparisons revealed differences in the distribution patterns of inferred immune cell fractions between T2DM and control samples, suggesting an altered immune landscape in PBMCs associated with diabetes (Figure 7C). We next assessed the associations between the three-gene signature and the immune-cell composition. ICE2 expression showed preferential correlations with lymphoid-related components, particularly B-cell-associated fractions (Figure 7D). In contrast, RPS24 exhibited stronger coupling with T-cell and granulocyte-related signals, including naïve CD4 T-cell and neutrophil-associated fractions (Figure 7E). NHLRC2 displayed modest but consistent correlations across several immune subsets, suggesting that it may reflect broader immune remodeling rather than a single lineage-specific signal (Figure 7F). Collectively, these results indicate that the diagnostic genes are embedded within distinct immune-cell programs in PBMCs and provide an immunological context for the T2DM-associated transcriptomic signature.
Figure 7.
Immune cell infiltration landscape in PBMCs and its association with diagnostic genes. (A) Stacked bar plot of the immune-cell fractions for each sample in Control and T2DM. (B) Spearman correlation heatmap of inferred immune cell fractions, illustrating coordinated co-variation patterns among immune subsets. Asterisks indicate statistically significant correlations: * p < 0.05 and *** p< 0.001. (C) Boxplots showing the distribution of inferred immune cell fractions across immune populations in Control and T2DM samples. (D–F) Correlation dot plots showing associations between ICE2 (D), RPS24 (E), or NHLRC2 (F) expression and inferred immune cell fractions. Dot size represents the absolute Spearman correlation coefficient (|ρ|), and dot color indicates the corresponding p value.
3.7. Single-Cell Analysis Links the Three-Gene Diagnostic Signature to Immune Remodeling in T2DM
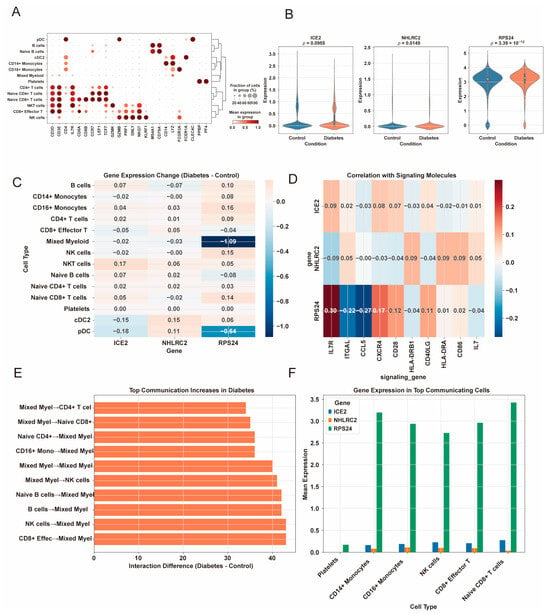
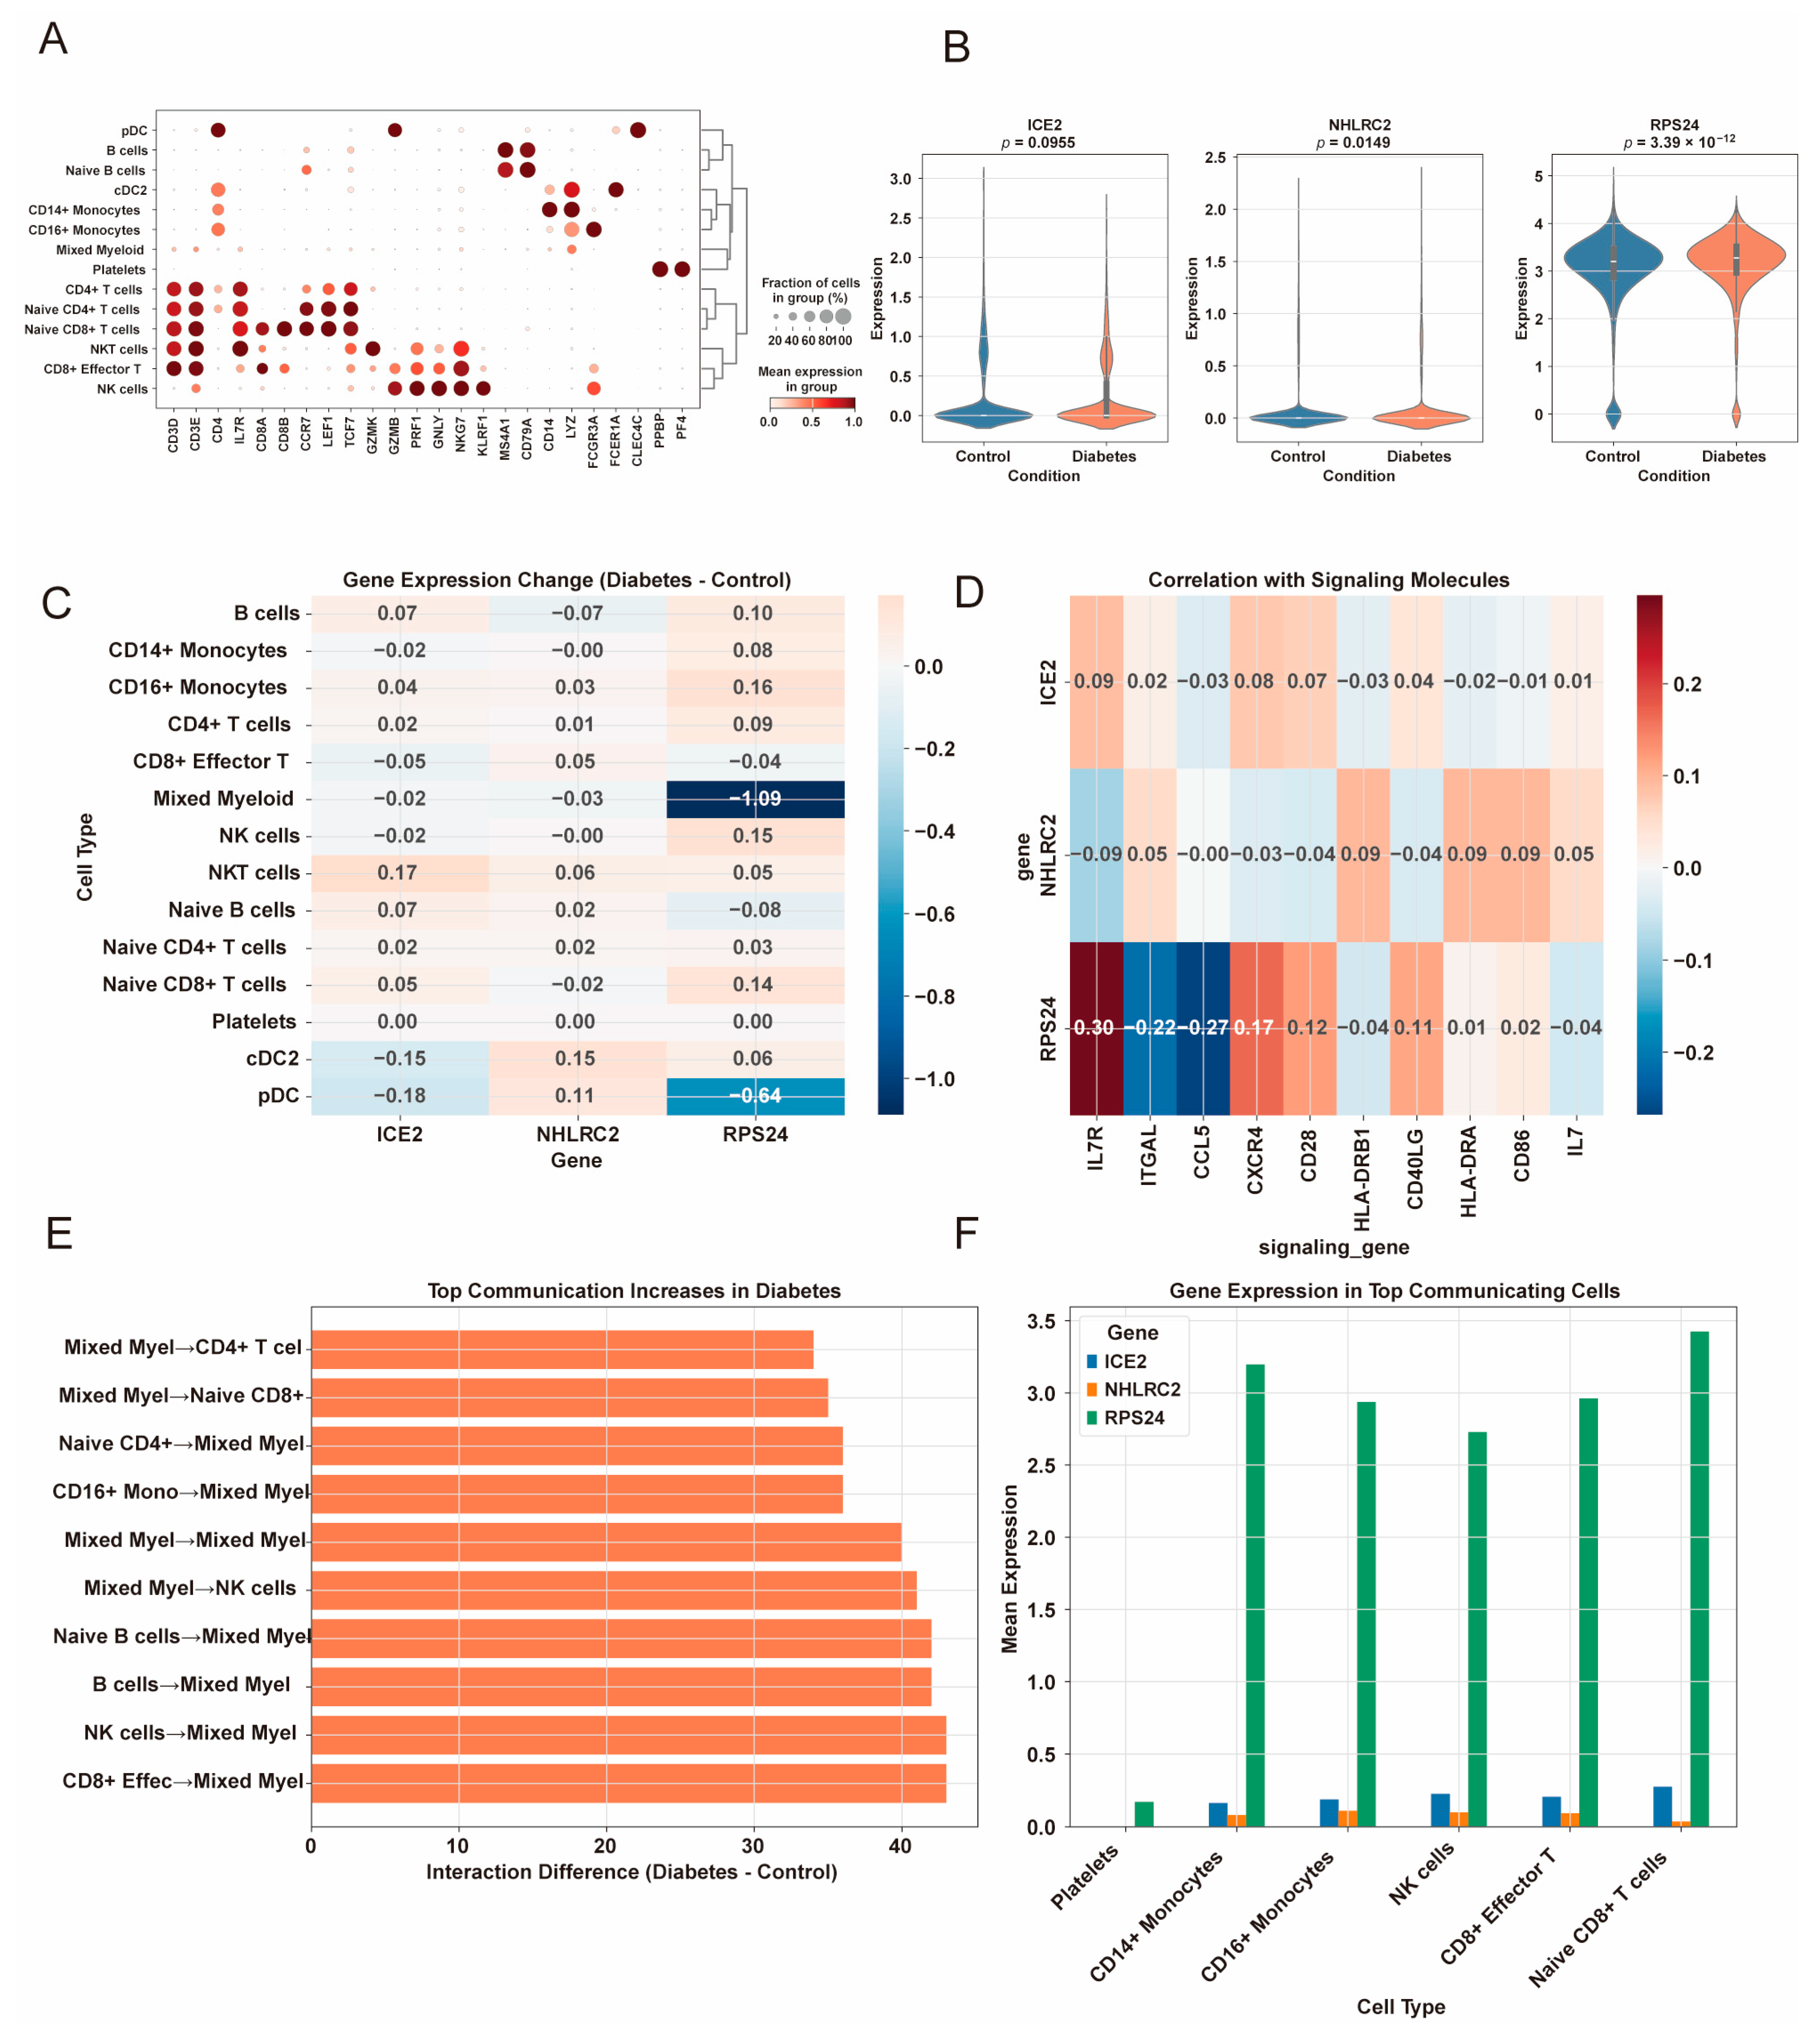
To examine the cellular distribution of the RT-qPCR-validated genes, we analyzed the PBMC single-cell dataset GSE280401. Major immune cell populations were identified using canonical marker genes (Figure 8A). ICE2, NHLRC2, and RPS24 showed distinct expression patterns across PBMC subsets. ICE2 and NHLRC2 were expressed at relatively low levels, whereas RPS24 was broadly expressed across multiple immune cell populations (Figure 8B and Figure S2C). Although RT-qPCR showed reduced RPS24 expression in bulk T2DM samples, single-cell analysis revealed cell type-dependent alterations of RPS24, with more evident changes in dendritic and myeloid-related populations (Figure 8C). Correlation analysis also showed stronger associations between RPS24 and representative immune markers than those observed for ICE2 and NHLRC2 (Figure 8D).
Figure 8.
Immune cell-specific expression of diagnostic genes and altered intercellular communication in T2DM. (A) Dot plot showing canonical marker genes used to annotate major peripheral blood mononuclear cell (PBMC) populations in the GSE280401 single-cell dataset. Dot size represents the proportion of cells expressing each marker, and dot color indicates the average normalized expression level. (B) Feature plots illustrating the single-cell expression distributions of ICE2, NHLRC2, and RPS24 across all PBMC populations. (C) Heatmap showing cell type-specific changes in the average expression of ICE2, NHLRC2, and RPS24 between T2DM and control samples. Positive values indicate upregulation in T2DM, whereas negative values indicate downregulation. (D) Pearson correlation analysis was performed between ICE2, NHLRC2, and RPS24 expression and representative immune signaling molecules. Correlation coefficients (r) are shown in the heatmap. (E) Ligand–receptor-based cell–cell communication analysis was performed between PBMC populations in T2DM and control groups. Differential communication strength was calculated as T2DM minus control, and the top increased communication pairs are displayed. (F) Expression levels of ICE2, NHLRC2, and RPS24 were evaluated in immune cell populations contributing to the altered communication networks.
IL7R, ITGAL, CCL5, and CD28 were further examined as additional immune-related candidate genes (Figure S3). These genes also showed cell type-specific expression across PBMC subsets. Cell–cell communication analysis indicated an increase in inferred intercellular inter-actions in T2DM, particularly involving myeloid–lymphoid signaling axes (Figure 8E). In the cell populations contributing to these interactions, RPS24 remained broadly expressed, whereas ICE2 and NHLRC2 were mainly detected at lower levels in selected subsets (Figure 8F). These findings suggest that the diagnostic genes, especially RPS24, are associated with cell type-specific immune alterations in T2DM.
3.8. Pancreatic Endocrine Cell-Resolved Validation of Diagnostic Genes
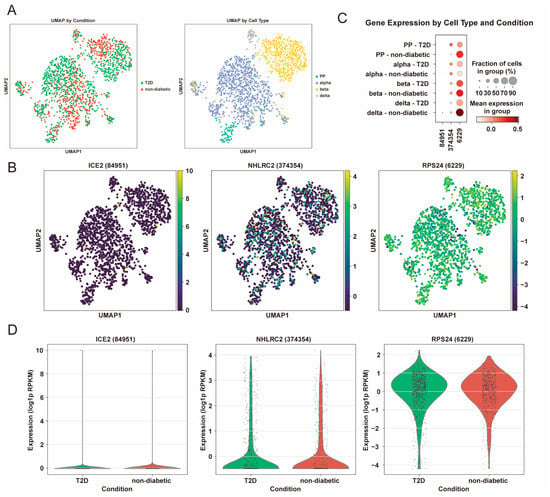
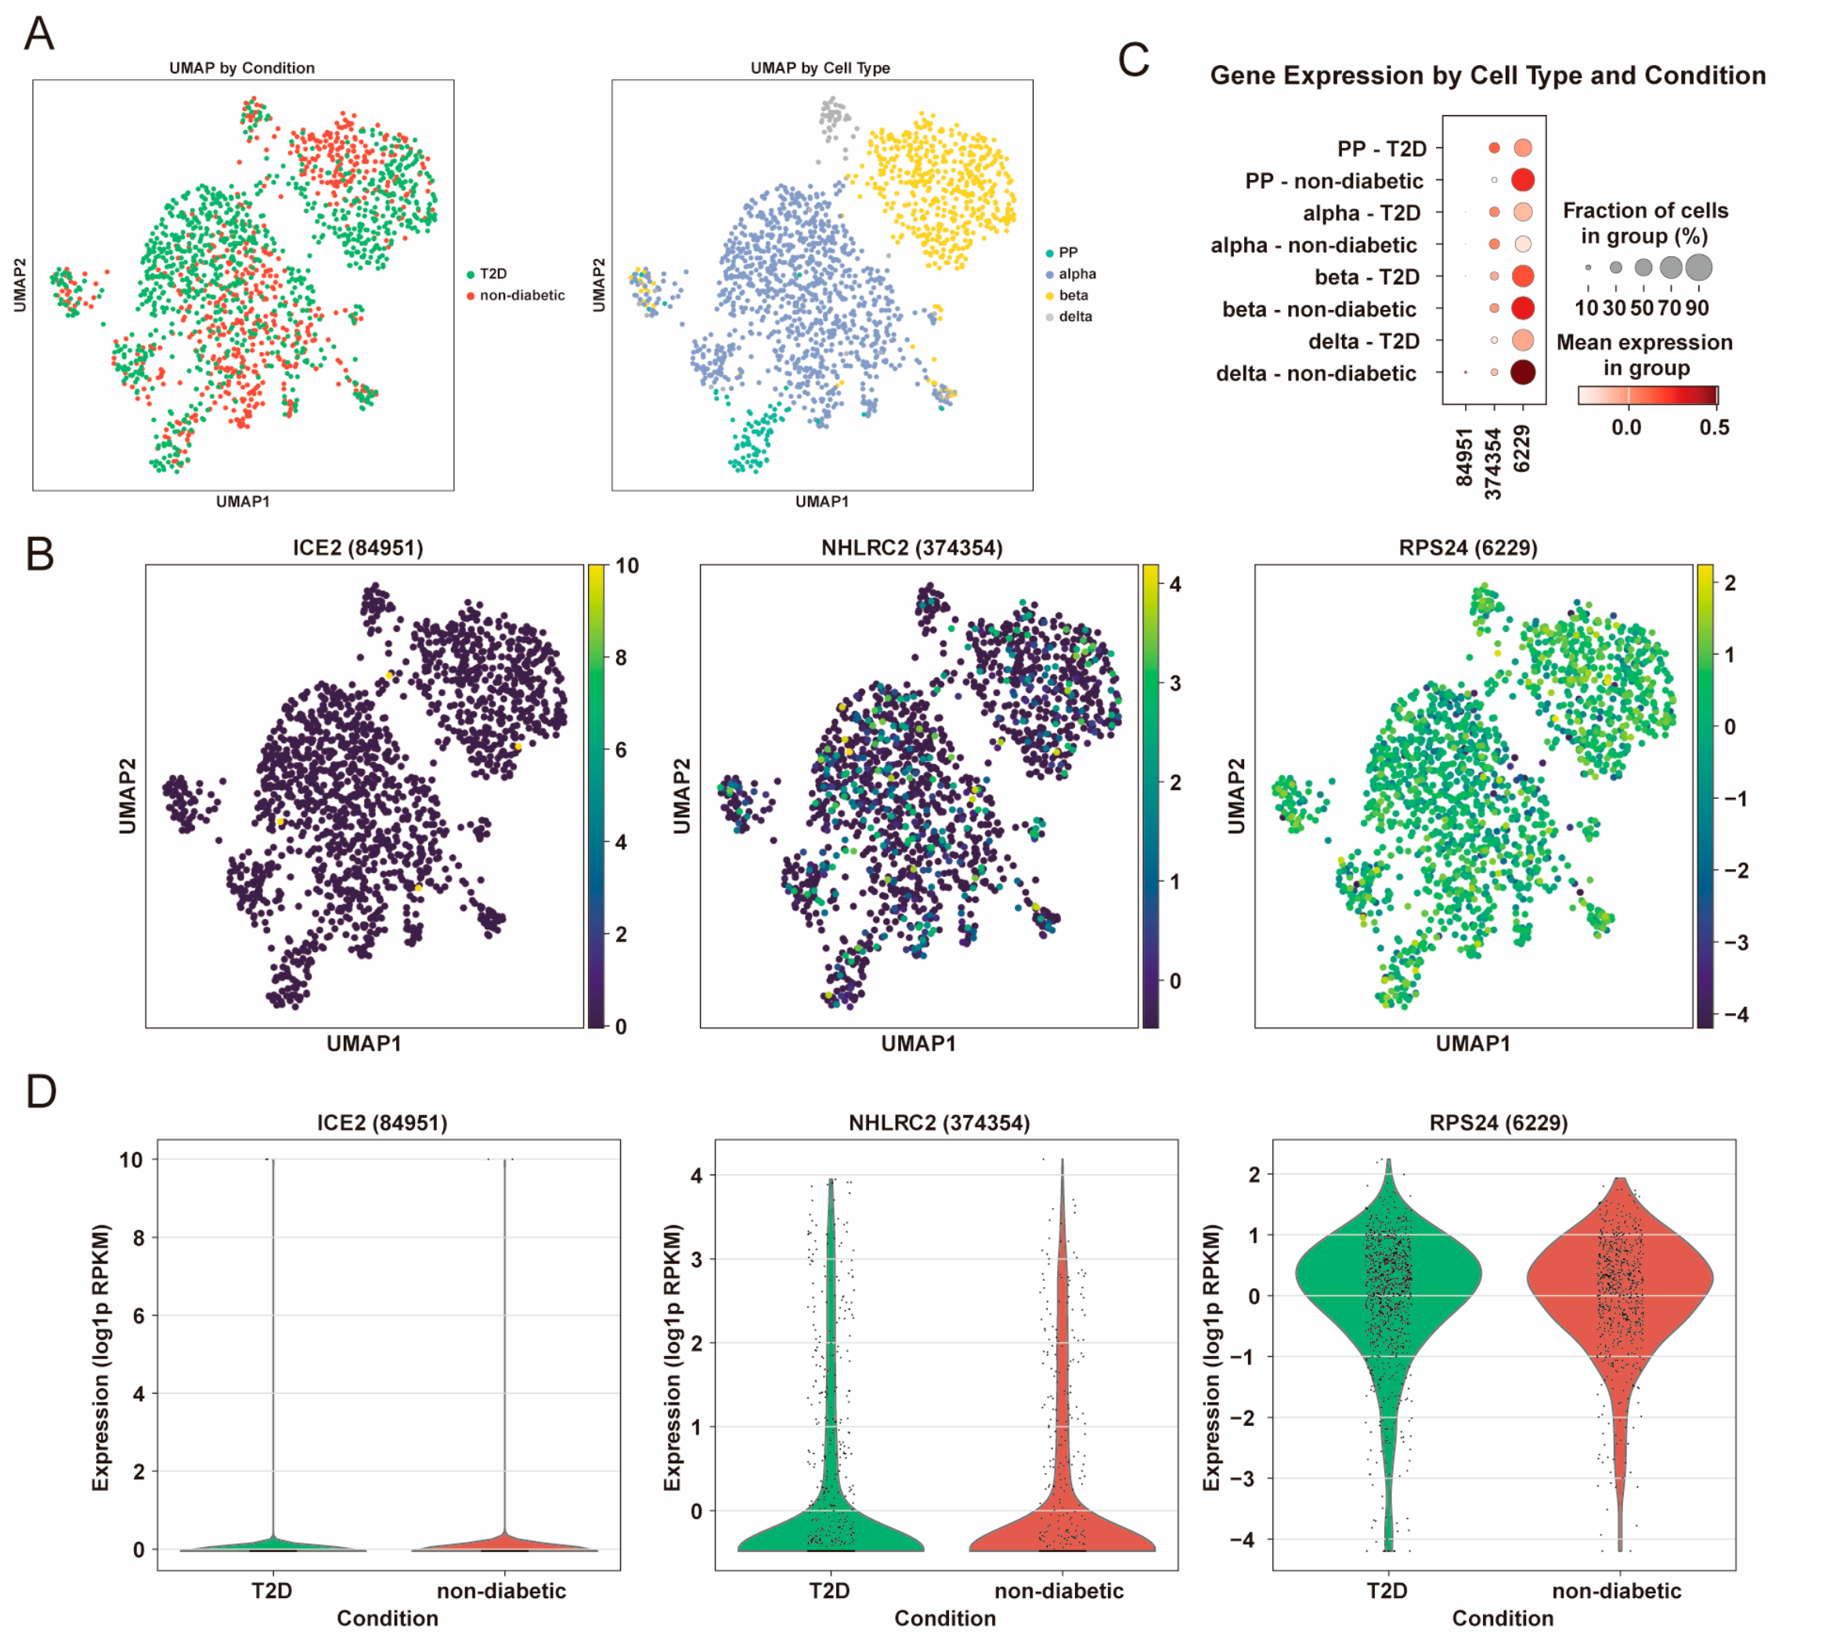
To determine whether ICE2, NHLRC2, and RPS24 also display cell type-specific patterns in pancreatic islets, we analyzed the single-cell RNA-seq dataset GSE81608 and mapped these genes across major endocrine lineages (alpha, beta, delta, and PP) under T2D and non-diabetic conditions (Figure 9). This analysis aimed to determine whether these candidate genes display cell-type-specific expression patterns and whether their expression is associated with diabetic conditions. UMAP visualization confirmed clear separation of endocrine cell identities, whereas disease labels were broadly intermingled across the embedding, suggesting that global clustering was not driven solely by diabetic status (Figure 9A). Feature plots revealed distinct endocrine lineage-associated expression patterns: ICE2 and NHLRC2 showed overall low and sparse expression with enrichment in restricted subsets, while RPS24 exhibited broader and relatively higher expression across multiple endocrine cell types (Figure 9B). Consistent with the heterogeneous immune programs inferred in PBMCs (Figure 7 and Figure 8), the dot plot summarization further highlighted lineage- and condition-dependent shifts in expression, with RPS24 showing more prominent dysregulation across endocrine populations compared with ICE2 and NHLRC2 (Figure 9C). Split violin analyses supported these observations at single-cell resolution, indicating that T2D-associated changes were not uniform across endocrine subsets and underscoring context-dependent regulation of the diagnostic genes within the islet microenvironment (Figure 9D). Collectively, these findings extend the PBMC-based immune-context evidence to pancreatic islets and suggest that the diagnostic signature reflects both systemic immune remodeling and local endocrine cell programs relevant to T2D.
Figure 9.
Single-cell characterization of ICE2, NHLRC2, and RPS24 expression in pancreatic endocrine cells from T2D and non-diabetic individuals from GSE81608. (A) UMAP visualization of pancreatic endocrine cells colored by disease condition (T2D vs. non-diabetic, left) and annotated endocrine cell types (PP, alpha, beta, and delta cells, right). (B) Feature plots showing the expression distribution of ICE2, NHLRC2, and RPS24 across pancreatic endocrine cell populations. (C) Dot plots showing mean expression levels and the fraction of expressing cells for each candidate gene across endocrine cell types and disease conditions. (D) Violin plots comparing ICE2, NHLRC2, and RPS24 expression between T2D and non-diabetic individuals within each endocrine cell population.
3.9. Transcriptomic Heterogeneity Defines Two Molecular Subtypes of T2DM PBMCs
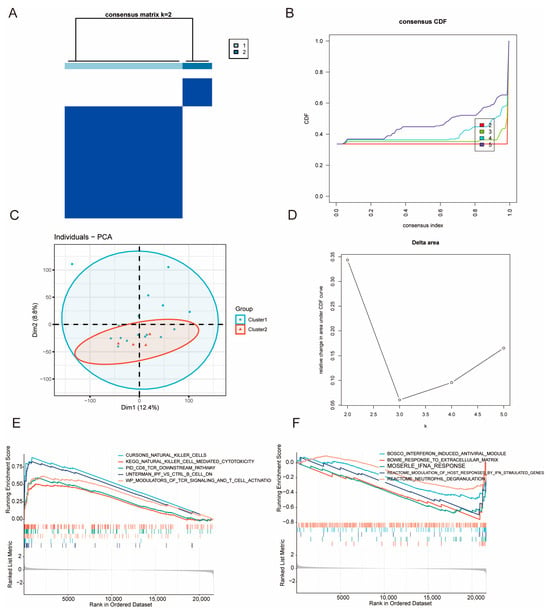
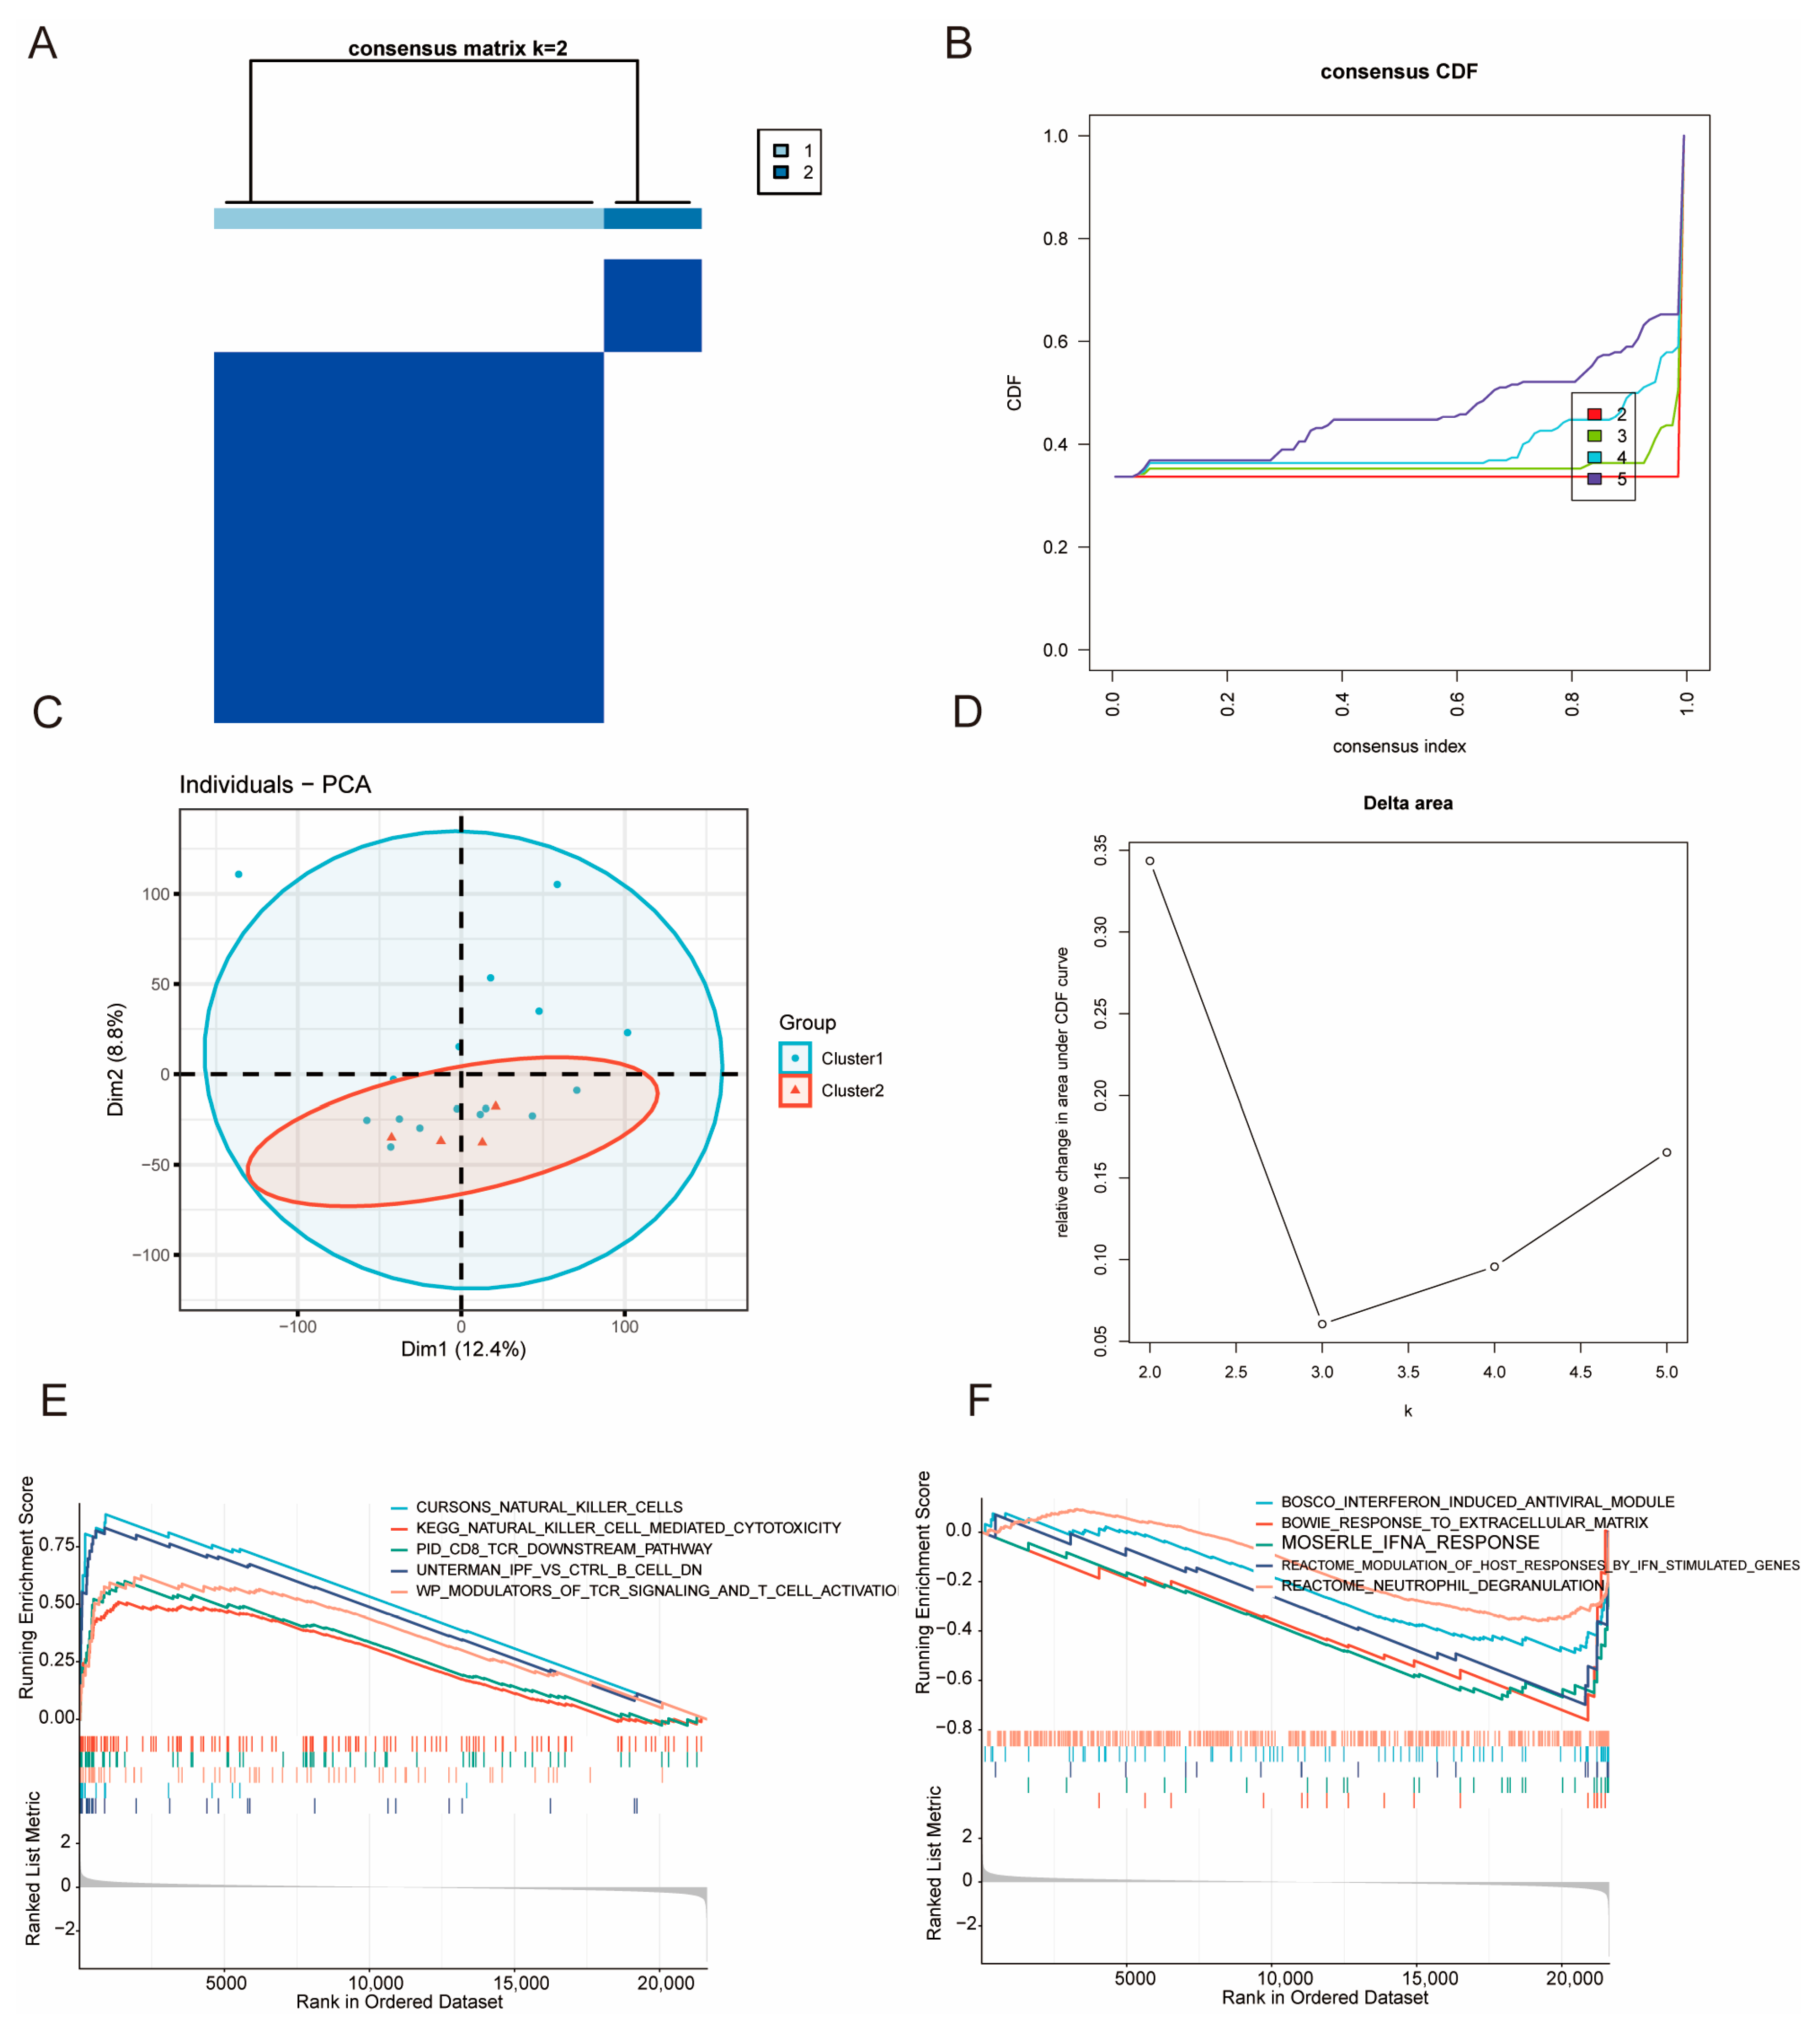
Consensus clustering of T2DM PBMC transcriptomes identified two reproducible molecular subtypes. The consensus matrix at k = 2 showed strong within-cluster co-clustering and minimal between-cluster similarity, indicating stable sample assignments (Figure 10A). Consensus CDF and delta area analyses suggested that increasing k beyond 2 provided little additional gain in stability, supporting k = 2 as the most parsimonious solution (Figure 10B,D). PCA further corroborated this stratification, with the two clusters exhibiting discernible separation despite partial overlap (Figure 10C).
Figure 10.
Transcriptomic heterogeneity defines two molecular subtypes of T2DM PBMCs with distinct immune pathway programs. (A) Consensus clustering matrix showing stable classification of T2DM PBMC samples into two molecular subtypes (k = 2). High consensus values indicate strong co-clustering stability among samples. (B) Cumulative distribution function (CDF) curves evaluating clustering stability across different numbers of clusters (k = 2–5). (C) Principal component analysis (PCA) demonstrating transcriptomic separation between the two identified molecular subtypes. (D) Delta-area analysis showing limited additional stability gain with increasing cluster numbers, supporting k = 2 as the optimal clustering solution. (E,F) Gene set enrichment analysis (GSEA) comparing biological programs between the two subtypes. Cluster 1 exhibited enrichment of adaptive and cytotoxic immune pathways, whereas Cluster 2 showed enrichment of innate inflammatory and interferon-associated programs. Normalized enrichment scores (NESs) and FDR-adjusted q values are provided. The gray line represents the ranked list metric; vertical bars indicate the positions of gene-set members in the ranked gene list.
Importantly, GSEA based on MSigDB C2 curated gene sets revealed marked functional divergence between the subtypes (Figure 10E,F). Cluster 1 showed predominant enrichment of adaptive and cytotoxic immune programs, exemplified by gene sets related to T-cell receptor signaling/CD8 T-cell downstream activation, natural killer cell signatures, and B-cell-associated modules, indicating an immune-activated PBMC phenotype. In contrast, Cluster 2 was characterized by enrichment patterns dominated by innate immune and inflammatory response programs, including interferon/IFN-stimulated gene modules, neutrophil-associated effector pathways (e.g., degranulation), and extracellular matrix-response signatures, consistent with a distinct inflammatory and remodeling-related immune state. Collectively, these results demonstrate transcriptional heterogeneity in T2DM PBMCs and provide a subtype-aware framework for downstream mechanistic analyses and biomarker development.
These findings indicate that T2DM PBMCs are not transcriptionally homogeneous but consist of distinct immune-related molecular states. The identified subtypes provide additional biological context for interpreting disease heterogeneity and may facilitate subtype-aware biomarker discovery and mechanistic investigation.
4. Discussion
T2DM is increasingly recognized as a systemic immunometabolic disorder characterized not only by chronic hyperglycemia but also by persistent low-grade inflammation, immune dysregulation, and features of accelerated biological aging [16,43]. In the present study, we integrated PBMC transcriptomic datasets from multiple independent cohorts to investigate senescence-associated molecular alterations in T2DM. We identified reproducible transcriptional changes related to senescence-associated gene programs and derived a three-gene signature comprising ICE2, NHLRC2, and RPS24, which demonstrated consistent diagnostic performance across internal testing and independent external validation cohorts. RT-qPCR analysis further confirmed the reduced expression of these genes in clinical PBMC samples from patients with T2DM, providing experimental support for the transcriptomic findings. Moreover, immune deconvolution, PBMC single-cell analyses, pancreatic islet single-cell validation, and molecular subtyping consistently linked the identified signature to distinct immune, inflammatory, and senescence-associated features. Together, these findings support the potential relevance of PBMC senescence-associated transcriptional alterations to the molecular heterogeneity and diagnostic characterization of T2DM.
One important finding of this study is the identification of senescence-associated transcriptional patterns among T2DM-related PBMC expression changes. Chronic metabolic stress, including hyperglycemia, oxidative stress, lipotoxicity, and mitochondrial dysfunction, can promote senescence-like cellular states. Senescent cells may in turn amplify inflammation through the senescence-associated secretory phenotype, thereby contributing to insulin resistance and tissue dysfunction [15,44,45]. Similar changes may also occur in circulating immune cells, where senescence-associated programs can impair immune homeostasis and sustain inflammaging [43,46]. Consistently, the senescence-related DEGs identified here were enriched in pathways associated with senescence-related processes and stress adaptation, suggesting that PBMCs may capture systemic immune aging-associated transcriptional patterns relevant to T2DM. Our enrichment analyses further pointed to RNA processing, splicing, and translation-related pathways. This finding is consistent with the functions of the diagnostic genes, especially ICE2, which participates in small nuclear RNA transcription, and RPS24, a ribosomal protein involved in protein synthesis. Given that metabolic stress in T2DM can perturb RNA homeostasis, proteostasis, and translational capacity [47,48], the enrichment of spliceosome- and ribosome-related pathways in senescence-related DEGs likely reflects an adaptive stress response in PBMCs rather than a set of unrelated downstream changes.
The three genes may be linked to the pathway-level findings through their roles in RNA metabolism, protein synthesis, and cellular stress responses. ICE2 participates in small nuclear RNA transcription through the little elongation complex, potentially linking it to RNA processing [18]. NHLRC2 has been associated with cellular homeostasis and stress-related processes, although its precise functions remain incompletely understood [49,50]. RPS24 encodes a 40S ribosomal subunit protein and is required for ribosome biogenesis and translational capacity [51]. The three genes showed moderate positive expression correlations (Pearson r = 0.401–0.564, FDR < 0.05), indicating that they are not strongly co-expressed. The distinct functions of ICE2, NHLRC2, and RPS24 suggest possible links to RNA processing and translational regulation in T2DM PBMCs, although their independent contributions to the diagnostic model and their underlying mechanisms remain unclear.
In our RT-qPCR analysis, all three genes were significantly downregulated in T2DM samples, supporting their association with T2DM in the samples examined. We also evaluated several immune-related candidate genes that were not included in the final model. IL7R and CCL5 were downregulated, ITGAL was upregulated, and CD28 showed no significant difference between T2DM and control samples. These findings suggest that T2DM-associated transcriptional changes may extend beyond the three-gene panel. However, the cohort-specific analyses showed variable expression patterns across datasets (Table S2). Although ICE2 and NHLRC2 were differentially expressed in GSE15932, these findings were not consistently observed in GSE156993 or the independent GSE185011 cohort. The relatively small sample size of the independent cohort also limited the precision of the effect estimates. Taken together, the RT-qPCR findings support further investigation of these genes, but their reproducibility across cohorts and their potential clinical relevance remain to be established. They should therefore be regarded as exploratory senescence-associated transcriptional markers rather than an established diagnostic panel. Further studies using gene knockdown or overexpression in human PBMC-derived immune cells, together with assessments of senescence markers (p16 and p21), inflammatory cytokine production, mitochondrial function, and oxidative stress, may help clarify whether these genes are functionally involved in cellular senescence or other T2DM-related processes.
The integration of WGCNA and immune deconvolution provided additional support for the immune relevance of the identified signature. T2DM-associated co-expression modules were enriched for senescence- and immune-related signals, while immune deconvolution revealed differences in PBMC immune composition. These results indicate that the bulk transcriptomic changes may reflect both altered immune cell proportions and changes in immune cell states. Thus, the diagnostic signature should not be viewed only as a statistical classifier, but also as a readout of immune stress and senescence-like remodeling in circulating immune cells.
Single-cell analysis helped place these findings in a cellular context. In PBMC scRNA-seq data, ICE2, NHLRC2, and RPS24 displayed cell type-specific expression patterns. ICE2 and NHLRC2 were generally expressed at low levels, whereas RPS24 was more broadly expressed and showed more evident changes in dendritic and myeloid-related populations. Cell–cell communication analysis also suggested an increase in inferred interactions in T2DM, particularly along myeloid–lymphoid signaling axes. Although IL7R, ITGAL, CCL5, and CD28 have well-characterized immune functions, ICE2, NHLRC2, and RPS24 were selected through our integrated feature-selection workflow. In Figure 8D, RPS24 showed modest correlations with several immune-related genes, whereas ICE2 and NHLRC2 showed generally weak correlations. These results provide additional context for the immune associations of the selected genes but do not establish that the three-gene panel is more T2DM-specific or diagnostically superior to other candidates. This cellular heterogeneity is consistent with previous PBMC single-cell studies reporting pro-inflammatory monocyte programs and altered T- and B-cell states in T2DM [8,52]. Finally, the pancreatic islet analysis was exploratory and examined the expression of the three genes in a tissue relevant to T2DM; it was not intended to validate the PBMC-based signature. Together, these observations support the idea that the three-gene signature is related to immune-cell remodeling and enhanced immune cross-talk in T2DM.
Previous PBMC transcriptomic studies have reported altered gene expression and immune-related pathways in T2DM. Shao et al. identified changes in lncRNA and mRNA expression in PBMCs from patients with newly diagnosed T2DM [53]. Other transcriptomic studies using machine learning have identified immune-related candidate markers, including LY96, CCR1, BLVRB, TCF3, LILRA2, and NCF1 [54]. In contrast, our study focused on senescence-associated transcriptional alterations and identified ICE2, NHLRC2, and RPS24 as a candidate signature. Differences in the selected genes may reflect variations in study populations, analytical methods, and transcriptomic platforms.
From a translational perspective, this three-gene signature may serve as a candidate marker of systemic immunometabolic alterations in T2DM. It may provide information on inflammatory and aging-related processes not directly captured by conventional glycemic measures, although its additional clinical value remains to be established. The association between T2DM and senescence biology may also have therapeutic implications, as senotherapeutic strategies are being investigated to reduce senescent cell burden or attenuate SASP-related inflammation [55]. Although the present study does not directly test therapeutic applications, the identified signature provides a basis for future studies evaluating immune-aging molecular signatures in T2DM progression, complications, and treatment response.
Several limitations should be noted. First, this study was mainly based on retrospective public transcriptomic datasets, and residual confounding related to age, sex, BMI, medication, disease duration, and comorbidities may remain. The senescence-associated transcriptional signatures are complex and context-dependent, and no single gene signature universally captures the diverse features of cellular senescence. Therefore, the identified senescence-associated genes should be interpreted as senescence-related transcriptional features rather than definitive markers. The use of a nominal p-value threshold in the initial differential expression screening may increase the risk of false-positive candidates, although subsequent WGCNA integration, feature selection, and external validation were used to further refine the candidate genes. Further functional studies are needed to validate their roles in T2DM. Second, although RT-qPCR provided experimental validation of the three diagnostic genes, larger prospective cohorts are required to assess their diagnostic robustness and incremental value beyond established clinical indices. Third, PBMCs are heterogeneous mixtures of immune cells. Although immune deconvolution and single-cell analysis improved interpretability, longitudinal and functional studies are still needed to distinguish immune compositional shifts from within-cell state changes. Fourth, the single-cell datasets used for validation were derived from specific cohorts and platforms, and differences in sampling, preprocessing, and disease status may influence effect sizes. Finally, direct mechanistic experiments are needed to clarify whether ICE2, NHLRC2, and RPS24 contribute causally to senescence-like immune remodeling, endocrine stress responses, β-cell dysfunction, or immune–islet crosstalk. In addition, GSE189005 was derived from whole blood rather than isolated PBMCs, and differences in cellular composition may affect gene expression patterns and limit the comparability of results across datasets.
5. Conclusions
In summary, our analysis identified senescence-associated transcriptional changes in T2DM PBMCs, particularly in pathways related to RNA processing, translation, and immune regulation. ICE2, NHLRC2, and RPS24 emerged as candidate markers, and the identified molecular subtypes suggested transcriptional heterogeneity among patients with T2DM. RT-qPCR analysis of clinical samples showed reduced expression of all three genes in the examined samples, while immune-related gene expression and pancreatic islet single-cell analyses provided further biological context. However, the small discovery cohort, inconsistent expression patterns across datasets, limited clinical information, and lack of functional validation restrict the interpretation of these findings. Larger independent cohorts with detailed clinical data and functional studies are needed to confirm these observations and assess whether the three genes offer additional value beyond established clinical and glycemic measures.
Supplementary Materials
The following supporting information can be downloaded at: https://www.mdpi.com/article/10.3390/biomedicines14112481/s1, Figure S1: Batch-effect correction improves integration of PBMC cohorts. (A) PCA of GSE15932 and GSE156993 samples before batch correction, showing dataset-driven separation. (B) PCA after normalization and batch-effect correction, showing improved cross-cohort mixing; Figure S2: Single-cell PBMC landscape in Control and T2DM. (A) UMAP of integrated PBMCs colored by refined (left) and major (right) cell types. (B) Relative cell-type proportions in Control and T2DM at refined (left) and major (right) levels. (C) Feature plots showing the expression of ICE2, NHLRC2, and RPS24; Figure S3: Immune-related candidate genes in Control and T2DM. (A–D) RT-qPCR analysis of the mRNA expression levels of the four immune-related candidate genes IL7R (A), ITGAL (B), CCL5 (C) and CD28 (D) in control and T2DM samples. Statistical significance was determined using an unpaired Student’s t-test. * p < 0.05, ** p < 0.01; Table S1: The information of GEO datasets in this study; Table S2: Participant baseline characteristics; Table S3: Primer sequences for target genes; Table S4: Cohort-specific assessment of the expression patterns of ICE2, NHLRC2, and RPS24 in T2DM.
Author Contributions
S.W. and C.Y. searched databases, collected data, drafted and revised the manuscript. H.K. and Y.H. contributed to the conception and performed analyses. X.H., L.X. and Y.Z. made suggestions about the manuscript. All authors revised and approved the final version. All authors have read and agreed to the published version of the manuscript.
Funding
This work was supported by the Health Commission of Hubei Province Scientific Research Project (grant number WJ2025M166), the Wuhan Natural Science Foundation (grant number 2026020301040116), the Hubei Provincial Health Commission Joint Fund Project (grant number WJ2019H391) and the Health Commission of Wuhan Scientific Research Project (grant number WX19Q44).
Institutional Review Board Statement
All methods were performed in accordance with the relevant guidelines and regulations and with the Declaration of Helsinki. This study was approved by the Medical Ethics Committee of Wuhan No. 1 Hospital (approval number: Scientific Ethics [2026] No. 86, date 29 April 2026).
Informed Consent Statement
The requirement for written informed consent was formally waived for the following reasons: (1) the study involved only previously collected residual/discarded clinical blood samples; (2) it was no longer practicable to re-contact the participants; and (3) all analyses were conducted using de-identified data. Therefore, the study was considered to pose no additional risk to the participants.
Data Availability Statement
The data underlying this article will be shared on reasonable request to the corresponding author.
Acknowledgments
The authors are grateful to every member and staff in the study team for their kind assistance and unfailing support.
Conflicts of Interest
The authors declare that they have no competing interests.
References
- Genitsaridi, I.; Salpea, P.; Salim, A.; Sajjadi, S.F.; Tomic, D.; James, S.; Thirunavukkarasu, S.; Issaka, A.; Chen, L.; Basit, A.; et al. 11th edition of the IDF Diabetes Atlas: Global, regional, and national diabetes prevalence estimates for 2024 and projections for 2050. Lancet Diabetes Endocrinol. 2026, 14, 149–156. [Google Scholar] [CrossRef] [Scilit] [PubMed]
- Niisato, N.; Marunaka, Y. Therapeutic potential of multifunctional myricetin for treatment of type 2 diabetes mellitus. Front. Nutr. 2023, 10, 1175660. [Google Scholar] [CrossRef] [Scilit] [PubMed]
- Singh, A.; Shadangi, S.; Gupta, P.K.; Rana, S. Type 2 Diabetes Mellitus: A Comprehensive Review of Pathophysiology, Comorbidities, and Emerging Therapies. Compr. Physiol. 2025, 15, e70003. [Google Scholar] [CrossRef] [Scilit] [PubMed]
- Scheen, A.J.; Charbonnel, B. Effects of glucose-lowering agents on vascular outcomes in type 2 diabetes: A critical reappraisal. Diabetes Metab. 2014, 40, 176–185. [Google Scholar] [CrossRef] [Scilit] [PubMed]
- Jalilvand, A.; Blaszczak, A.; Bradley, D.; Liu, J.; Wright, V.; Needleman, B.; Hsueh, W.; Noria, S. Low visceral adipose tissue regulatory T cells are associated with higher comorbidity severity in patients undergoing bariatric surgery. Surg. Endosc. 2021, 35, 3131–3138. [Google Scholar] [CrossRef] [Scilit] [PubMed]
- Berbudi, A.; Khairani, S.; Tjahjadi, A.I. Interplay Between Insulin Resistance and Immune Dysregulation in Type 2 Diabetes Mellitus: Implications for Therapeutic Interventions. Immunotargets Ther. 2025, 14, 359–382. [Google Scholar] [CrossRef] [Scilit] [PubMed]
- Girard, D.; Vandiedonck, C. How dysregulation of the immune system promotes diabetes mellitus and cardiovascular risk complications. Front. Cardiovasc. Med. 2022, 9, 991716. [Google Scholar] [CrossRef] [Scilit] [PubMed]
- Zhao, J.; Fang, Z. Single-cell RNA sequencing reveals the dysfunctional characteristics of PBMCs in patients with type 2 diabetes mellitus. Front. Immunol. 2024, 15, 1501660. [Google Scholar] [CrossRef] [Scilit] [PubMed]
- Li, H.; Zou, L.; Long, Z.; Zhan, J. Immunometabolic alterations in type 2 diabetes mellitus revealed by single-cell RNA sequencing: Insights into subtypes and therapeutic targets. Front. Immunol. 2024, 15, 1537909. [Google Scholar] [CrossRef] [Scilit] [PubMed]
- Sathishkumar, C.; Prabu, P.; Balakumar, M.; Lenin, R.; Prabhu, D.; Anjana, R.M.; Mohan, V.; Balasubramanyam, M. Augmentation of histone deacetylase 3 (HDAC3) epigenetic signature at the interface of proinflammation and insulin resistance in patients with type 2 diabetes. Clin. Epigenet. 2016, 8, 125. [Google Scholar] [CrossRef] [Scilit] [PubMed]
- Garcia-Ramirez, M.; Francisco, G.; Garcia-Arumi, E.; Hernandez, C.; Martinez, R.; Andreu, A.L.; Simo, R. Mitochondrial DNA oxidation and manganese superoxide dismutase activity in peripheral blood mononuclear cells from type 2 diabetic patients. Diabetes Metab. 2008, 34, 117–124. [Google Scholar] [CrossRef] [Scilit] [PubMed]
- Calabria, E.; Muollo, V.; Cavedon, V.; Capovin, T.; Saccenti, L.; Passarotti, F.; Ghiotto, L.; Milanese, C.; Gelati, M.; Rudi, D.; et al. Type 2 Diabetes Related Mitochondrial Defects in Peripheral Mononucleated Blood Cells from Overweight Postmenopausal Women. Biomedicines 2023, 11, 121. [Google Scholar] [CrossRef] [Scilit] [PubMed]
- Novoselova, E.G.; Lunin, S.M.; Khrenov, M.O.; Glushkova, O.V.; Novoselova, T.V.; Parfenyuk, S.B. The Possible Role of Beta-Cell Senescence in the Development of Type 2 Diabetes Mellitus. Cell Physiol. Biochem. 2023, 57, 34–48. [Google Scholar] [CrossRef] [Scilit] [PubMed]
- Palmer, A.K.; Tchkonia, T.; LeBrasseur, N.K.; Chini, E.N.; Xu, M.; Kirkland, J.L. Cellular Senescence in Type 2 Diabetes: A Therapeutic Opportunity. Diabetes 2015, 64, 2289–2298. [Google Scholar] [CrossRef] [Scilit] [PubMed]
- Gorgoulis, V.; Adams, P.D.; Alimonti, A.; Bennett, D.C.; Bischof, O.; Bishop, C.; Campisi, J.; Collado, M.; Evangelou, K.; Ferbeyre, G.; et al. Cellular Senescence: Defining a Path Forward. Cell 2019, 179, 813–827. [Google Scholar] [CrossRef] [Scilit] [PubMed]
- Hotamisligil, G.S. Inflammation and metabolic disorders. Nature 2006, 444, 860–867. [Google Scholar] [CrossRef] [Scilit] [PubMed]
- Zhang, Z.; He, X.; Sun, Y.; Li, J.; Sun, J. Type 2 Diabetes Mellitus: A Metabolic Model of Accelerated Aging-Multi-Organ Mechanisms and Intervention Approaches. Aging Dis. 2025, 17, 1399–1422. [Google Scholar] [CrossRef] [Scilit] [PubMed]
- Edgar, R.; Domrachev, M.; Lash, A.E. Gene Expression Omnibus: NCBI gene expression and hybridization array data repository. Nucleic Acids Res. 2002, 30, 207–210. [Google Scholar] [CrossRef] [Scilit] [PubMed]
- Davis, S.; Meltzer, P.S. GEOquery: A bridge between the Gene Expression Omnibus (GEO) and BioConductor. Bioinformatics 2007, 23, 1846–1847. [Google Scholar] [CrossRef] [Scilit] [PubMed]
- Johnson, W.E.; Li, C.; Rabinovic, A. Adjusting batch effects in microarray expression data using empirical Bayes methods. Biostatistics 2007, 8, 118–127. [Google Scholar] [CrossRef] [Scilit] [PubMed]
- Leek, J.T.; Johnson, W.E.; Parker, H.S.; Jaffe, A.E.; Storey, J.D. The sva package for removing batch effects and other unwanted variation in high-throughput experiments. Bioinformatics 2012, 28, 882–883. [Google Scholar] [CrossRef] [Scilit] [PubMed]
- Ritchie, M.E.; Phipson, B.; Wu, D.; Hu, Y.; Law, C.W.; Shi, W.; Smyth, G.K. limma powers differential expression analyses for RNA-sequencing and microarray studies. Nucleic Acids Res. 2015, 43, e47. [Google Scholar] [CrossRef] [Scilit] [PubMed]
- Stelzer, G.; Rosen, N.; Plaschkes, I.; Zimmerman, S.; Twik, M.; Fishilevich, S.; Stein, T.I.; Nudel, R.; Lieder, I.; Mazor, Y.; et al. The GeneCards Suite: From Gene Data Mining to Disease Genome Sequence Analyses. Curr. Protoc. Bioinform. 2016, 54, 1.30.1–1.30.33. [Google Scholar] [CrossRef] [Scilit] [PubMed]
- Subramanian, A.; Tamayo, P.; Mootha, V.K.; Mukherjee, S.; Ebert, B.L.; Gillette, M.A.; Paulovich, A.; Pomeroy, S.L.; Golub, T.R.; Lander, E.S.; et al. Gene set enrichment analysis: A knowledge-based approach for interpreting genome-wide expression profiles. Proc. Natl. Acad. Sci. USA 2005, 102, 15545–15550. [Google Scholar] [CrossRef] [Scilit] [PubMed]
- Ashburner, M.; Ball, C.A.; Blake, J.A.; Botstein, D.; Butler, H.; Cherry, J.M.; Davis, A.P.; Dolinski, K.; Dwight, S.S.; Eppig, J.T.; et al. Gene ontology: Tool for the unification of biology. The Gene Ontology Consortium. Nat. Genet. 2000, 25, 25–29. [Google Scholar] [CrossRef] [Scilit] [PubMed]
- Kanehisa, M.; Goto, S. KEGG: Kyoto encyclopedia of genes and genomes. Nucleic Acids Res. 2000, 28, 27–30. [Google Scholar] [CrossRef] [Scilit] [PubMed]
- Yu, G.; Wang, L.G.; Han, Y.; He, Q.Y. clusterProfiler: An R package for comparing biological themes among gene clusters. OMICS 2012, 16, 284–287. [Google Scholar] [CrossRef] [Scilit] [PubMed]
- Langfelder, P.; Horvath, S. WGCNA: An R package for weighted correlation network analysis. BMC Bioinform. 2008, 9, 559. [Google Scholar] [CrossRef] [Scilit] [PubMed]
- Motamedi, F.; Perez-Sanchez, H.; Mehridehnavi, A.; Fassihi, A.; Ghasemi, F. Accelerating Big Data Analysis through LASSO-Random Forest Algorithm in QSAR Studies. Bioinformatics 2022, 38, 469–475. [Google Scholar] [CrossRef] [Scilit]
- Liu, Y.; Zhao, H. Variable importance-weighted Random Forests. Quant. Biol. 2017, 5, 338–351. [Google Scholar] [CrossRef] [Scilit]
- Cao, J.; Zhang, L.; Wang, B.; Li, F.; Yang, J. A fast gene selection method for multi-cancer classification using multiple support vector data description. J. Biomed. Inf. 2015, 53, 381–389. [Google Scholar] [CrossRef] [Scilit] [PubMed]
- Robin, X.; Turck, N.; Hainard, A.; Tiberti, N.; Lisacek, F.; Sanchez, J.C.; Muller, M. pROC: An open-source package for R and S+ to analyze and compare ROC curves. BMC Bioinform. 2011, 12, 77. [Google Scholar] [CrossRef] [Scilit] [PubMed]
- Bi, G.; Li, R.; Liang, J.; Hu, Z.; Zhan, C. A nomogram with enhanced function facilitated by nomogramEx and nomogramFormula. Ann. Transl. Med. 2020, 8, 78. [Google Scholar] [CrossRef] [Scilit] [PubMed]
- Newman, A.M.; Liu, C.L.; Green, M.R.; Gentles, A.J.; Feng, W.; Xu, Y.; Hoang, C.D.; Diehn, M.; Alizadeh, A.A. Robust enumeration of cell subsets from tissue expression profiles. Nat. Methods 2015, 12, 453–457. [Google Scholar] [CrossRef] [Scilit] [PubMed]
- Wickham, H. ggplot2: Elegant Graphics for Data Analysis; Springer: New York, NY, USA, 2016. [Google Scholar]
- Xin, Y.; Kim, J.; Okamoto, H.; Ni, M.; Wei, Y.; Adler, C.; Murphy, A.J.; Yancopoulos, G.D.; Lin, C.; Gromada, J. RNA Sequencing of Single Human Islet Cells Reveals Type 2 Diabetes Genes. Cell Metab. 2016, 24, 608–615. [Google Scholar] [CrossRef] [Scilit] [PubMed]
- Satija, R.; Farrell, J.A.; Gennert, D.; Schier, A.F.; Regev, A. Spatial reconstruction of single-cell gene expression data. Nat. Biotechnol. 2015, 33, 495–502. [Google Scholar] [CrossRef] [Scilit] [PubMed]
- Stuart, T.; Butler, A.; Hoffman, P.; Hafemeister, C.; Papalexi, E.; Mauck, W.M., 3rd; Hao, Y.; Stoeckius, M.; Smibert, P.; Satija, R. Comprehensive Integration of Single-Cell Data. Cell 2019, 177, 1888–1902.e21. [Google Scholar] [CrossRef] [Scilit] [PubMed]
- Jin, S.; Guerrero-Juarez, C.F.; Zhang, L.; Chang, I.; Ramos, R.; Kuan, C.H.; Myung, P.; Plikus, M.V.; Nie, Q. Inference and analysis of cell-cell communication using CellChat. Nat. Commun. 2021, 12, 1088. [Google Scholar] [CrossRef] [Scilit]
- Efremova, M.; Vento-Tormo, M.; Teichmann, S.A.; Vento-Tormo, R. CellPhoneDB: Inferring cell-cell communication from combined expression of multi-subunit ligand-receptor complexes. Nat. Protoc. 2020, 15, 1484–1506. [Google Scholar] [CrossRef] [Scilit] [PubMed]
- Wilkerson, M.D.; Hayes, D.N. ConsensusClusterPlus: A class discovery tool with confidence assessments and item tracking. Bioinformatics 2010, 26, 1572–1573. [Google Scholar] [CrossRef] [Scilit] [PubMed]
- Lê, S.; Josse, J.; Husson, F. FactoMineR: An R Package for Multivariate Analysis. J. Stat. Softw. 2008, 25, 1–18. [Google Scholar] [CrossRef] [Scilit]
- Donath, M.Y.; Shoelson, S.E. Type 2 diabetes as an inflammatory disease. Nat. Rev. Immunol. 2011, 11, 98–107. [Google Scholar] [CrossRef] [Scilit] [PubMed]
- Narasimhan, A.; Flores, R.R.; Robbins, P.D.; Niedernhofer, L.J. Role of Cellular Senescence in Type II Diabetes. Endocrinology 2021, 162, bqab136. [Google Scholar] [CrossRef] [Scilit] [PubMed]
- He, S.; Sharpless, N.E. Senescence in Health and Disease. Cell 2017, 169, 1000–1011. [Google Scholar] [CrossRef] [Scilit] [PubMed]
- Ferrucci, L.; Fabbri, E. Inflammageing: Chronic inflammation in ageing, cardiovascular disease, and frailty. Nat. Rev. Cardiol. 2018, 15, 505–522. [Google Scholar] [CrossRef] [Scilit] [PubMed]
- So, J.S. Roles of Endoplasmic Reticulum Stress in Immune Responses. Mol. Cells 2018, 41, 705–716. [Google Scholar] [CrossRef] [Scilit] [PubMed]
- Wang, H.; Chan, T.W.; Vashisht, A.A.; Drew, B.G.; Calkin, A.C.; Harris, T.E.; Wohlschlegel, J.A.; Xiao, X.; Reue, K. Lipin 1 modulates mRNA splicing during fasting adaptation in liver. JCI Insight 2021, 6, e150114. [Google Scholar] [CrossRef] [Scilit] [PubMed]
- Uusimaa, J.; Kaarteenaho, R.; Paakkola, T.; Tuominen, H.; Karjalainen, M.K.; Nadaf, J.; Varilo, T.; Uusi-Makela, M.; Suo-Palosaari, M.; Pietila, I.; et al. NHLRC2 variants identified in patients with fibrosis, neurodegeneration, and cerebral angiomatosis (FINCA): Characterisation of a novel cerebropulmonary disease. Acta Neuropathol. 2018, 135, 727–742. [Google Scholar] [CrossRef] [Scilit] [PubMed]
- Biterova, E.; Ignatyev, A.; Uusimaa, J.; Hinttala, R.; Ruddock, L.W. Structural analysis of human NHLRC2, mutations of which are associated with FINCA disease. PLoS ONE 2018, 13, e0202391. [Google Scholar] [CrossRef] [Scilit] [PubMed]
- Gazda, H.T.; Grabowska, A.; Merida-Long, L.B.; Latawiec, E.; Schneider, H.E.; Lipton, J.M.; Vlachos, A.; Atsidaftos, E.; Ball, S.E.; Orfali, K.A.; et al. Ribosomal protein S24 gene is mutated in Diamond-Blackfan anemia. Am. J. Hum. Genet. 2006, 79, 1110–1118. [Google Scholar] [CrossRef] [Scilit] [PubMed]
- Gu, D.; Lim, J.; Han, K.Y.; Seo, I.H.; Jee, J.H.; Cho, S.J.; Choi, Y.H.; Choi, S.C.; Koh, J.H.; Lee, J.Y.; et al. Single-cell analysis of human PBMCs in healthy and type 2 diabetes populations: Dysregulated immune networks in type 2 diabetes unveiled through single-cell profiling. Front. Endocrinol. 2024, 15, 1397661. [Google Scholar] [CrossRef] [Scilit] [PubMed]
- Jiang, H.; Lou, P.; Chen, X.; Wu, C.; Shao, S. Deregulation of lncRNA HIST1H2AG-6 and AIM1-3 in peripheral blood mononuclear cells is associated with newly diagnosed type 2 diabetes. BMC Med. Genom. 2021, 14, 149. [Google Scholar] [CrossRef] [Scilit] [PubMed]
- Cui, F.; Li, L.; Hu, M.; Li, B.; Du, B.; Fang, Q.; Huang, D.; Zhang, X. Integrating machine learning and immune infiltration analysis to identify core genes and construct a diagnostic model for type 2 diabetes mellitus. Front. Endocrinol. 2026, 17, 1790356. [Google Scholar] [CrossRef] [Scilit] [PubMed]
- Hickson, L.J.; Langhi Prata, L.G.P.; Bobart, S.A.; Evans, T.K.; Giorgadze, N.; Hashmi, S.K.; Herrmann, S.M.; Jensen, M.D.; Jia, Q.; Jordan, K.L.; et al. Senolytics decrease senescent cells in humans: Preliminary report from a clinical trial of Dasatinib plus Quercetin in individuals with diabetic kidney disease. eBioMedicine 2019, 47, 446–456. [Google Scholar] [CrossRef] [Scilit]
Disclaimer/Publisher’s Note: The statements, opinions and data contained in all publications are solely those of the individual author(s) and contributor(s) and not of MDPI and/or the editor(s). MDPI and/or the editor(s) disclaim responsibility for any injury to people or property resulting from any ideas, methods, instructions or products referred to in the content. |
© 2026 by the authors. Licensee MDPI, Basel, Switzerland. This article is an open access article distributed under the terms and conditions of the Creative Commons Attribution (CC BY) license.