


Abstract
Background/Objectives: Guanine nucleotide-binding protein G(i) subunit alpha 3 (GNAI3) participates in G-protein signaling and has been linked to glioma growth, but its contribution to invasive behavior and mesenchymal plasticity remains incompletely defined. This study examined the clinical relevance and functional effects of GNAI3 in glioma and evaluated its relationship with transforming growth factor-β (TGF-β)-associated mesenchymal changes. Methods: GNAI3 expression and clinical associations were analyzed using The Cancer Genome Atlas (TCGA)/Genotype-Tissue Expression (GTEx), Chinese Glioma Genome Atlas (CGGA), and Gene Expression Omnibus (GEO) datasets and were validated in five paired glioblastoma and peritumoral non-neoplastic tissues. Stable GNAI3 knockdown and overexpression models were established in U87-MG and U251-MG cells. Cell viability, migration, and invasion were evaluated using Cell Counting Kit-8 (CCK-8), Transwell, and wound-healing assays. Candidate GNAI3-associated proteins were screened by immunoprecipitation–mass spectrometry. The association between GNAI3 and TGF-β was examined by co-immunoprecipitation, and changes in protein abundance and phosphorylation of SMAD family members 2 and 3 (SMAD2/3) were assessed by Western blotting. The effect of GNAI3 depletion on tumor growth was evaluated in a U87-MG subcutaneous xenograft model. Results: GNAI3 expression was elevated in glioma and increased with World Health Organization (WHO) grade. Higher expression was associated with shorter overall survival in unadjusted analysis, whereas the association was attenuated after adjustment for clinical factors and molecular subtype. GNAI3 depletion reduced glioma-cell viability, migration, and invasion, whereas GNAI3 overexpression produced the opposite phenotype. GNAI3 expression correlated positively with cadherin 2 (CDH2) and vimentin (VIM), and these associations persisted after adjustment for histological grade. Co-immunoprecipitation showed co-enrichment of GNAI3 and TGF-β in protein complexes, and GNAI3 manipulation was accompanied by concordant changes in TGF-β, vimentin, N-cadherin, and zonula occludens-1 (ZO-1). In U251-MG cells, GNAI3 knockdown decreased the phosphorylated SMAD2 (p-SMAD2)/SMAD2/3 and phosphorylated SMAD3 (p-SMAD3)/SMAD2/3 ratios, whereas GNAI3 overexpression increased both ratios. In vivo, GNAI3 knockdown suppressed xenograft growth and reduced Ki67 and TGF-β expression. Conclusions: GNAI3 promotes aggressive glioma phenotypes in vitro and tumor growth in vivo. Its effects are accompanied by TGF-β-related mesenchymal changes, supporting further investigation of the molecular relationship between GNAI3 and TGF-β signaling without establishing pathway dependence from the present data.
1. Introduction
Glioblastoma represents the most aggressive end of the adult diffuse-glioma spectrum and remains difficult to control despite multimodal treatment. Maximal safe resection followed by radiotherapy and temozolomide can prolong survival, but infiltrative growth limits complete resection and recurrence is common [1,2]. Defining molecular regulators that couple tumor-cell growth with motility is therefore relevant to both disease biology and therapeutic development.
One feature associated with aggressive glioma behavior is acquisition of a mesenchymal-like state. Because glioma cells are not epithelial in origin, this phenotype is better regarded as mesenchymal plasticity or an epithelial-to-mesenchymal transition (EMT)-like program rather than canonical EMT [3,4]. The phenotype includes remodeling of adhesion and cytoskeletal networks, often with increased vimentin and N-cadherin and reduced junctional proteins such as zonula occludens-1 (ZO-1). Transforming growth factor-β (TGF-β) is a major inducer of cellular plasticity and can promote migration, invasion, treatment resistance, and mesenchymal reprogramming through SMAD-dependent and non-SMAD signaling [5,6].
The G protein subunit alpha i3 gene (GNAI3) encodes the inhibitory G-protein alpha-i3 subunit, which links receptor activation to intracellular signaling and also participates in non-canonical signaling functions [7,8]. Previous work has implicated Gαi1/3 in neuronal signal-driven glioma growth, radiation resistance, and migration-related signaling [9,10]. Transcriptomic analyses have further associated GNAI-family expression, particularly GNAI3, with glioblastoma malignancy [11], while pharmacological disruption of Gαi/o signaling can markedly suppress high-grade glioma migration and invasion [12]. These observations suggest that GNAI3 may contribute to both proliferative and motile tumor phenotypes, but the molecular context of this effect has not been fully resolved. Studies of other molecular regulators in U87 glioblastoma cells have linked aquaporin-4 (AQP4) isoform organization to changes in potassium-channel activity, cell morphology, and cell-cycle distribution [13]. AQP4 aggregation state has also been shown to influence glioma-cell migration and invasiveness [14]. Pharmacological inhibition of adenosine triphosphate (ATP)-sensitive potassium channels has also reduced cell growth in diffuse intrinsic pontine glioma models [15].
The primary objective of this study was to test the hypothesis that GNAI3 contributes to aggressive glioma phenotypes by examining the effects of its depletion and overexpression on cell viability, migration, and invasion, together with the effect of GNAI3 depletion on xenograft growth. Secondary objectives were to characterize the association of GNAI3 expression with tumor grade and patient survival and to explore its relationship with TGF-β-related mesenchymal changes. The mechanistic analyses were exploratory.
2. Methods
2.1. Study Design
This study combined retrospective analyses of public molecular datasets, validation in archived paired human glioblastoma tissues, gain- and loss-of-function experiments in two glioma cell lines, protein-interaction screening, and a mouse xenograft experiment. The primary objective was to assess the functional contribution of GNAI3 to aggressive glioma phenotypes, using cell viability, migration, invasion, and xenograft growth as functional readouts. The secondary objective was to characterize GNAI3 expression and its associations with clinicopathological features and overall survival. Exploratory molecular analyses assessed candidate GNAI3-associated proteins and changes in TGF-β and mesenchymal phenotype-related markers following GNAI3 manipulation.
2.2. Public Datasets and Bioinformatic Analysis
Gene-expression and clinical data were obtained from The Cancer Genome Atlas (TCGA) lower-grade glioma (LGG) and glioblastoma (GBM) cohorts, the Genotype-Tissue Expression project (GTEx), the Chinese Glioma Genome Atlas (CGGA; mRNA-seq_325 and mRNA-seq_693), and Gene Expression Omnibus datasets GSE103224 and GSE4290. TCGA and GTEx data were accessed through University of California, Santa Cruz (UCSC) Xena. For the TCGA-LGG/GBM survival analysis, processed expression data and the corresponding overall survival times and event indicators were obtained from the existing expression and clinical data tables. Additional histological grade annotations were obtained from the TCGA GBMLGG clinical matrix, and molecular subtype annotations were obtained from cBioPortal. GNAI3 expression was standardized to one-standard-deviation units for Cox regression, as detailed in the Supplementary Methods. GNAI3 expression was compared among non-neoplastic brain, lower-grade glioma, glioblastoma, and World Health Organization (WHO) grade groups. For survival analysis in TCGA-LGG/GBM, one tumor sample per patient was retained. Kaplan–Meier analysis included 659 patients, grouped by median GNAI3 expression, with values equal to the median assigned to the low-expression group. Clinical and molecular annotations were supplemented through cBioPortal. Multivariable Cox regression included 646 patients with complete information and assessed continuous GNAI3 expression per one-standard-deviation increase, adjusting for age, sex, histological grade, and combined isocitrate dehydrogenase (IDH)/1p/19q molecular subtype. Proportional hazards assumptions were assessed using Schoenfeld residuals. Additional models stratified by grade and molecular subtype and an exploratory model allowing the GNAI3 effect to vary with log follow-up time were evaluated. Correlations between GNAI3 expression and cadherin 2 (CDH2), vimentin (VIM), and tight junction protein 1 (TJP1) expression were assessed using Spearman correlation in 659 unique TCGA-LGG/GBM patients. Grade-adjusted partial Spearman correlations were calculated by correlating residuals from regressions of ranked gene expression on histological grade, modeled as a categorical variable. Spearman correlations were also calculated separately within grades 2, 3, and 4. For differential-expression analysis, 659 unique patients in the TCGA-LGG/GBM cohort were divided into high- and low-GNAI3-expression groups using the median GNAI3 expression value (high, n = 329; low, n = 330; values equal to the median were assigned to the low-expression group). Differential expression between the groups was assessed using limma (version 3.58.1). Genes with a Benjamini–Hochberg (BH)-adjusted p value < 0.05 and an absolute log2 fold change > 1.5 were selected for enrichment analysis. Upregulated and downregulated genes were analyzed together using clusterProfiler (version 4.10.1) for Gene Ontology (GO) and Kyoto Encyclopedia of Genes and Genomes (KEGG) enrichment. Gene symbols were mapped to Entrez identifiers using org.Hs.eg.db (version 3.18.0). The background comprised all genes included in the differential-expression analysis that were successfully mapped to Entrez identifiers, restricted to those annotated in the respective database. Gene sets containing 10–500 background genes were tested. BH correction was applied separately within the GO biological process, cellular component, and molecular function categories, and across KEGG pathways. Enrichment was considered significant at BH-adjusted p < 0.05.
2.3. Human Tissue Samples
Five pairs of archived glioblastoma tissues and matched peritumoral non-neoplastic tissues were retrospectively included. The specimens had been collected from patients undergoing surgical resection in the Department of Neurosurgery at Changzhou First People’s Hospital, The Third Affiliated Hospital of Soochow University, between October 2024 and March 2026. None of the patients had received chemotherapy or radiotherapy before surgery. Glioblastoma diagnosis was confirmed by neuropathological examination. Tissue intended for protein analysis was snap-frozen in liquid nitrogen, and representative sections were prepared for immunofluorescence staining. The retrospective use of these samples was approved by the Ethics Committee of Changzhou First People’s Hospital (Approval No. 2026(教)CL023-01), and the study was conducted in accordance with the Declaration of Helsinki. Written informed consent was obtained from all participants.
2.4. Cell Culture and Stable GNAI3 Manipulation
U87-MG and U251-MG human glioma cells were obtained from the Shanghai Institute of Biochemistry and Cell Biology (Shanghai, China). Cells were maintained in high-glucose Dulbecco’s modified Eagle medium (Gibco, Grand Island, NY, USA) containing 10% fetal bovine serum (Sigma-Aldrich, St. Louis, MO, USA) and 1% penicillin-streptomycin (Gibco) at 37 °C in a humidified atmosphere with 5% CO2. Stable GNAI3 knockdown cells were generated using a lentiviral short-hairpin ribonucleic acid (RNA) targeting GNAI3 (shGNAI3; 5′-GCCCTCAGTGATTATGACCTT-3′), with control short-hairpin RNA (shCtrl) used as the negative control. GNAI3-overexpressing cells were generated using a lentiviral vector carrying full-length GNAI3, with the corresponding empty vector as control. Lentiviral infection was performed at a multiplicity of infection of 6. Cells were subsequently selected with puromycin (Beyotime Biotechnology, Shanghai, China), and successful GNAI3 depletion or overexpression was confirmed by reverse-transcription quantitative polymerase chain reaction (RT-qPCR) and Western blotting before functional experiments. The lentiviral constructs were supplied by GeneChem (Shanghai, China).
2.5. Cell Viability, Migration, and Invasion Assays
Cell viability was assessed using Cell Counting Kit-8 (CCK-8) (Beyotime Biotechnology, C0037). Equal numbers of cells from each experimental group were seeded into 96-well plates. CCK-8 measurements were performed on days 1–4 using separate wells at each time point, and absorbance was measured at 450 nm after incubation with the reagent. Because CCK-8 reports metabolically active cell number, these data were interpreted as cell viability rather than as a direct measurement of cell-cycle proliferation. Three independent biological experiments were performed, with four technical replicate wells per group at each time point in each experiment.
For Transwell (Corning, Corning, NY, USA) migration assays, equal numbers of cells were seeded in each group by adding 200 μL of serum-free cell suspension at 5 × 10⁴ cells/mL to the upper chamber, and 600 μL of medium containing 10% fetal bovine serum was added to the lower chamber as a chemoattractant. For invasion assays, the upper surface was precoated with 50 μL Matrigel (Corning) diluted 1:8 in serum-free medium and allowed to polymerize before cell seeding. After 24 h, cells remaining on the upper surface were removed; migrated or invaded cells were fixed with 4% paraformaldehyde (Beyotime Biotechnology), stained with crystal violet (Beyotime Biotechnology), imaged microscopically, and counted. Migration and invasion assays were each performed in three independent biological experiments, with one Transwell insert per group in each experiment. Cells were counted in one microscopic field per insert, yielding one count per group per experiment for statistical analysis.
For wound-healing assays, cells were cultured to more than 90% confluence in six-well plates. A linear wound was generated using a sterile 200-μL pipette tip, floating cells were removed with phosphate-buffered saline (Gibco), and cultures were maintained in serum-free medium. Images were obtained from matched fields at 0 and 24 h. Wound area was quantified with ImageJ version 1.54 (National Institutes of Health, Bethesda, MD, USA), and wound closure was calculated relative to the baseline area. Wound-healing assays were performed in three independent biological experiments, with one well per group in each experiment. One microscopic field per well was imaged at the same location at 0 and 24 h, yielding one wound-closure value per group per experiment for statistical analysis.
2.6. RNA Extraction and RT-qPCR
Total RNA was isolated from cultured cells using an RNA extraction kit (ESscience Biotech, Shanghai, China) and reverse-transcribed into complementary deoxyribonucleic acid (cDNA) using the PrimeScript RT reagent kit (Takara Bio, RR037A, Kusatsu, Japan). Quantitative polymerase chain reaction (PCR) was performed using SYBR Green chemistry (AceQ Universal SYBR qPCR Master Mix; Vazyme, Nanjing, China) on a 7500HT Real-Time PCR System (Applied Biosystems, Foster City, CA, USA). Ribosomal protein L13a (RPL13A) served as the reference gene, and relative GNAI3 expression was calculated by the 2−ΔΔCt method. Ct denotes the threshold cycle. Primer sequences were: GNAI3 forward, 5′-ATCGACCGCAACTTACGGG-3′; GNAI3 reverse, 5′-AGTCAATCTTTAGCCGTCCCA-3′; RPL13A forward, 5′-TCAAAGCCTTCGCTAGTCTCC-3′; and RPL13A reverse, 5′-GGCTCTTTTTGCCCGTATGC-3′. RT-qPCR was performed using one biological sample per group, with three technical replicate reactions per sample per gene.
2.7. Western Blotting and Tissue Immunofluorescence
Proteins from cultured cells and tissues were extracted in radioimmunoprecipitation assay (RIPA) buffer (strong formulation; Beyotime Biotechnology) and quantified by bicinchoninic acid (BCA) assay (Beyotime Biotechnology). Equal amounts of total protein (20 μg per lane) were separated by sodium dodecyl sulfate–polyacrylamide gel electrophoresis (SDS-PAGE) and transferred to polyvinylidene fluoride (PVDF) membranes (Merck Millipore, Darmstadt, Germany). Membranes were blocked with 5% non-fat milk (Beyotime Biotechnology) and incubated overnight at 4 °C with primary antibodies against N-cadherin (Cell Signaling Technology [CST], Danvers, MA, USA, #13116, 1:1000), glyceraldehyde-3-phosphate dehydrogenase (GAPDH; CST, #5174, 1:1000), ZO-1 (Abcam, Cambridge, UK, ab96587, 1:3000), vimentin (CST, #5741, 1:2000), GNAI3 (Abcam, ab173527, 1:10,000), TGF-β (CST, #3711, 1:1000), α-tubulin (CST, #3873, 1:10,000), phospho-SMAD2 (Ser465/467; CST, #3108, 1:1000), phospho-SMAD3 (Ser423/425; CST, #9520, 1:1000), and SMAD family members 2 and 3 (SMAD2/3; CST, #8685, 1:1000). After incubation with horseradish peroxidase (HRP)-conjugated secondary antibodies (anti-rabbit immunoglobulin G (IgG), CST; anti-mouse IgG, Abcam), signals were detected by enhanced chemiluminescence (New Cell & Molecular Biotech, Suzhou, China). Band intensity was quantified with ImageJ, using GAPDH or α-tubulin as the loading control. For the additional signaling analyses in U251-MG cells, phosphorylated SMAD2, phosphorylated SMAD3, and total SMAD2/3 were assessed by Western blotting. The phosphorylated SMAD2 (p-SMAD2) and phosphorylated SMAD3 (p-SMAD3) signals were normalized to the quantified SMAD2/3 signal, and each ratio was expressed relative to the corresponding control within the same biological experiment.
Cell-based Western blot analyses were performed in three independent biological experiments, and statistical analyses used one normalized protein-expression value per group from each experiment. Immunofluorescence staining of paired human tissue sections was used to compare GNAI3 expression between glioblastoma and peritumoral non-neoplastic tissue. Immunofluorescence staining was performed on five paired tissue samples, with one microscopic field imaged per tissue sample for qualitative assessment. Nuclei were counterstained with 4′,6-diamidino-2-phenylindole (DAPI; Beyotime Biotechnology).
2.8. Immunoprecipitation–Mass Spectrometry and Co-Immunoprecipitation
FLAG-tagged GNAI3-containing complexes were affinity-purified from GNAI3-overexpressing U251-MG cells using a FLAG-tag protein immunoprecipitation kit with magnetic beads (Beyotime Biotechnology) and analyzed by liquid chromatography-tandem mass spectrometry using an UltiMate 3000 RSLCnano system (Thermo Fisher Scientific, Germering, Germany) coupled to a Q Exactive HF mass spectrometer (Thermo Fisher Scientific, Bremen, Germany). Spectra were searched against the UniProt human database with MaxQuant version 2.2.0.0 and the Andromeda search engine. The false-discovery rate (FDR) was controlled at 1% at both peptide and protein levels. Immunoprecipitation–mass spectrometry (IP-MS) was performed using one anti-FLAG immunoprecipitate from a single biological experiment (n = 1). Proteins identified at a 1% protein-level FDR were considered preliminary candidates for association with the FLAG-GNAI3-containing preparation. No control IP-MS sample was analyzed; therefore, no control-based enrichment threshold or subtraction of nonspecific background proteins was applied. The association between GNAI3 and TGF-β was assessed by co-immunoprecipitation in U87-MG and U251-MG cells. Matched rabbit monoclonal immunoglobulin G (IgG) controls (CST) were included, and immunoprecipitated material was analyzed by Western blotting for GNAI3 and TGF-β. Forward and reverse co-immunoprecipitation assays were each performed once in each cell line.
2.9. Subcutaneous Xenograft Model and Tumor-Tissue Analysis
Twelve 4- to 6-week-old male athymic nude mice (BALB/c; Phenotek Biotechnologies, Shanghai, China) were allocated to shCtrl or shGNAI3 groups before cell inoculation using sequential coin tosses. Once either group reached six mice, the remaining mice were assigned to the other group (n = 6 per group). Animals and histological samples were assigned coded identifiers. Investigators performing tumor measurements and quantitative histological analyses were blinded to group allocation, and group identities were revealed after completion of these measurements and analyses. Mouse body weights ranged from 17.1 to 20.3 g on day 1 and were monitored every two days. U87-MG cells (1 × 10⁶ cells in 0.2 mL serum-free medium) were injected subcutaneously into the right dorsal flank. Tumor length and width were measured every three days, and tumor volume was calculated as length × width2/2. General condition and body weight were monitored throughout the experiment. Prespecified humane endpoints included marked clinical deterioration, body-weight loss greater than 20%, or tumor volume reaching 1500 mm3. Mice were euthanized on day 27, after which tumors were excised, weighed, photographed, and divided for paraffin embedding and protein extraction. Paraffin sections were stained for GNAI3, TGF-β, and Ki67 (CST), and tumor lysates were analyzed by Western blotting. Immunohistochemical signals were developed using a 3,3′-diaminobenzidine (DAB) chromogenic kit (Beyotime Biotechnology). Animal procedures were approved by the Experimental Animal Ethics Committee (Approval No. IA20251101).
2.10. Statistical Analysis
Statistical analyses were performed in GraphPad Prism version 10.1.2 (GraphPad Software, Boston, MA, USA) and R version 4.3.1 (R Foundation for Statistical Computing, Vienna, Austria). Unless otherwise stated, quantitative data are presented as mean ± standard deviation. Statistical analyses of Transwell assays, wound-healing assays, and cell-based Western blot quantification were based on independent biological experiments, with one value per group per experiment. RT-qPCR results are presented descriptively, with error bars indicating variation among technical replicates. IP-MS and co-immunoprecipitation results are reported qualitatively. For the SMAD phosphorylation analyses, control-normalized ratios from three independent biological experiments were tested against a reference value of 1 using two-sided one-sample t tests. Holm correction was applied across the four comparisons: p-SMAD2/SMAD2/3 and p-SMAD3/SMAD2/3 in the knockdown and overexpression experiments.
Normality of the paired differences in human-tissue GNAI3 expression was assessed using the Shapiro–Wilk test. Paired human-tissue comparisons were analyzed with paired two-tailed t tests, whereas independent two-group comparisons were analyzed with unpaired two-tailed t tests. Longitudinal measurements were analyzed by two-way repeated-measures analysis of variance followed by Šidák multiple-comparisons testing where appropriate. Overall-survival curves were compared by the log-rank test, and gene-expression associations were evaluated using Spearman correlation. For gene-expression correlation analyses, Benjamini–Hochberg correction was applied separately to the three pooled correlations, three grade-adjusted correlations, and nine grade-stratified correlations. All tests were two-sided, and p < 0.05, or BH-adjusted p < 0.05 where applicable, was considered statistically significant.
3. Results
3.1. GNAI3 Is Elevated in Glioma and Associated with Higher WHO Grade and Shorter Overall Survival
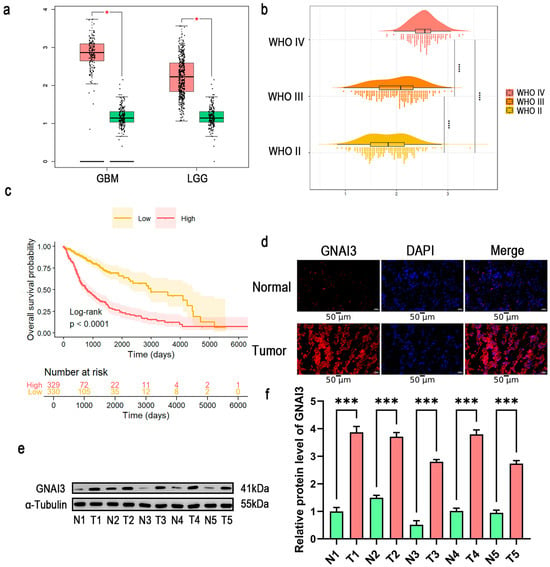
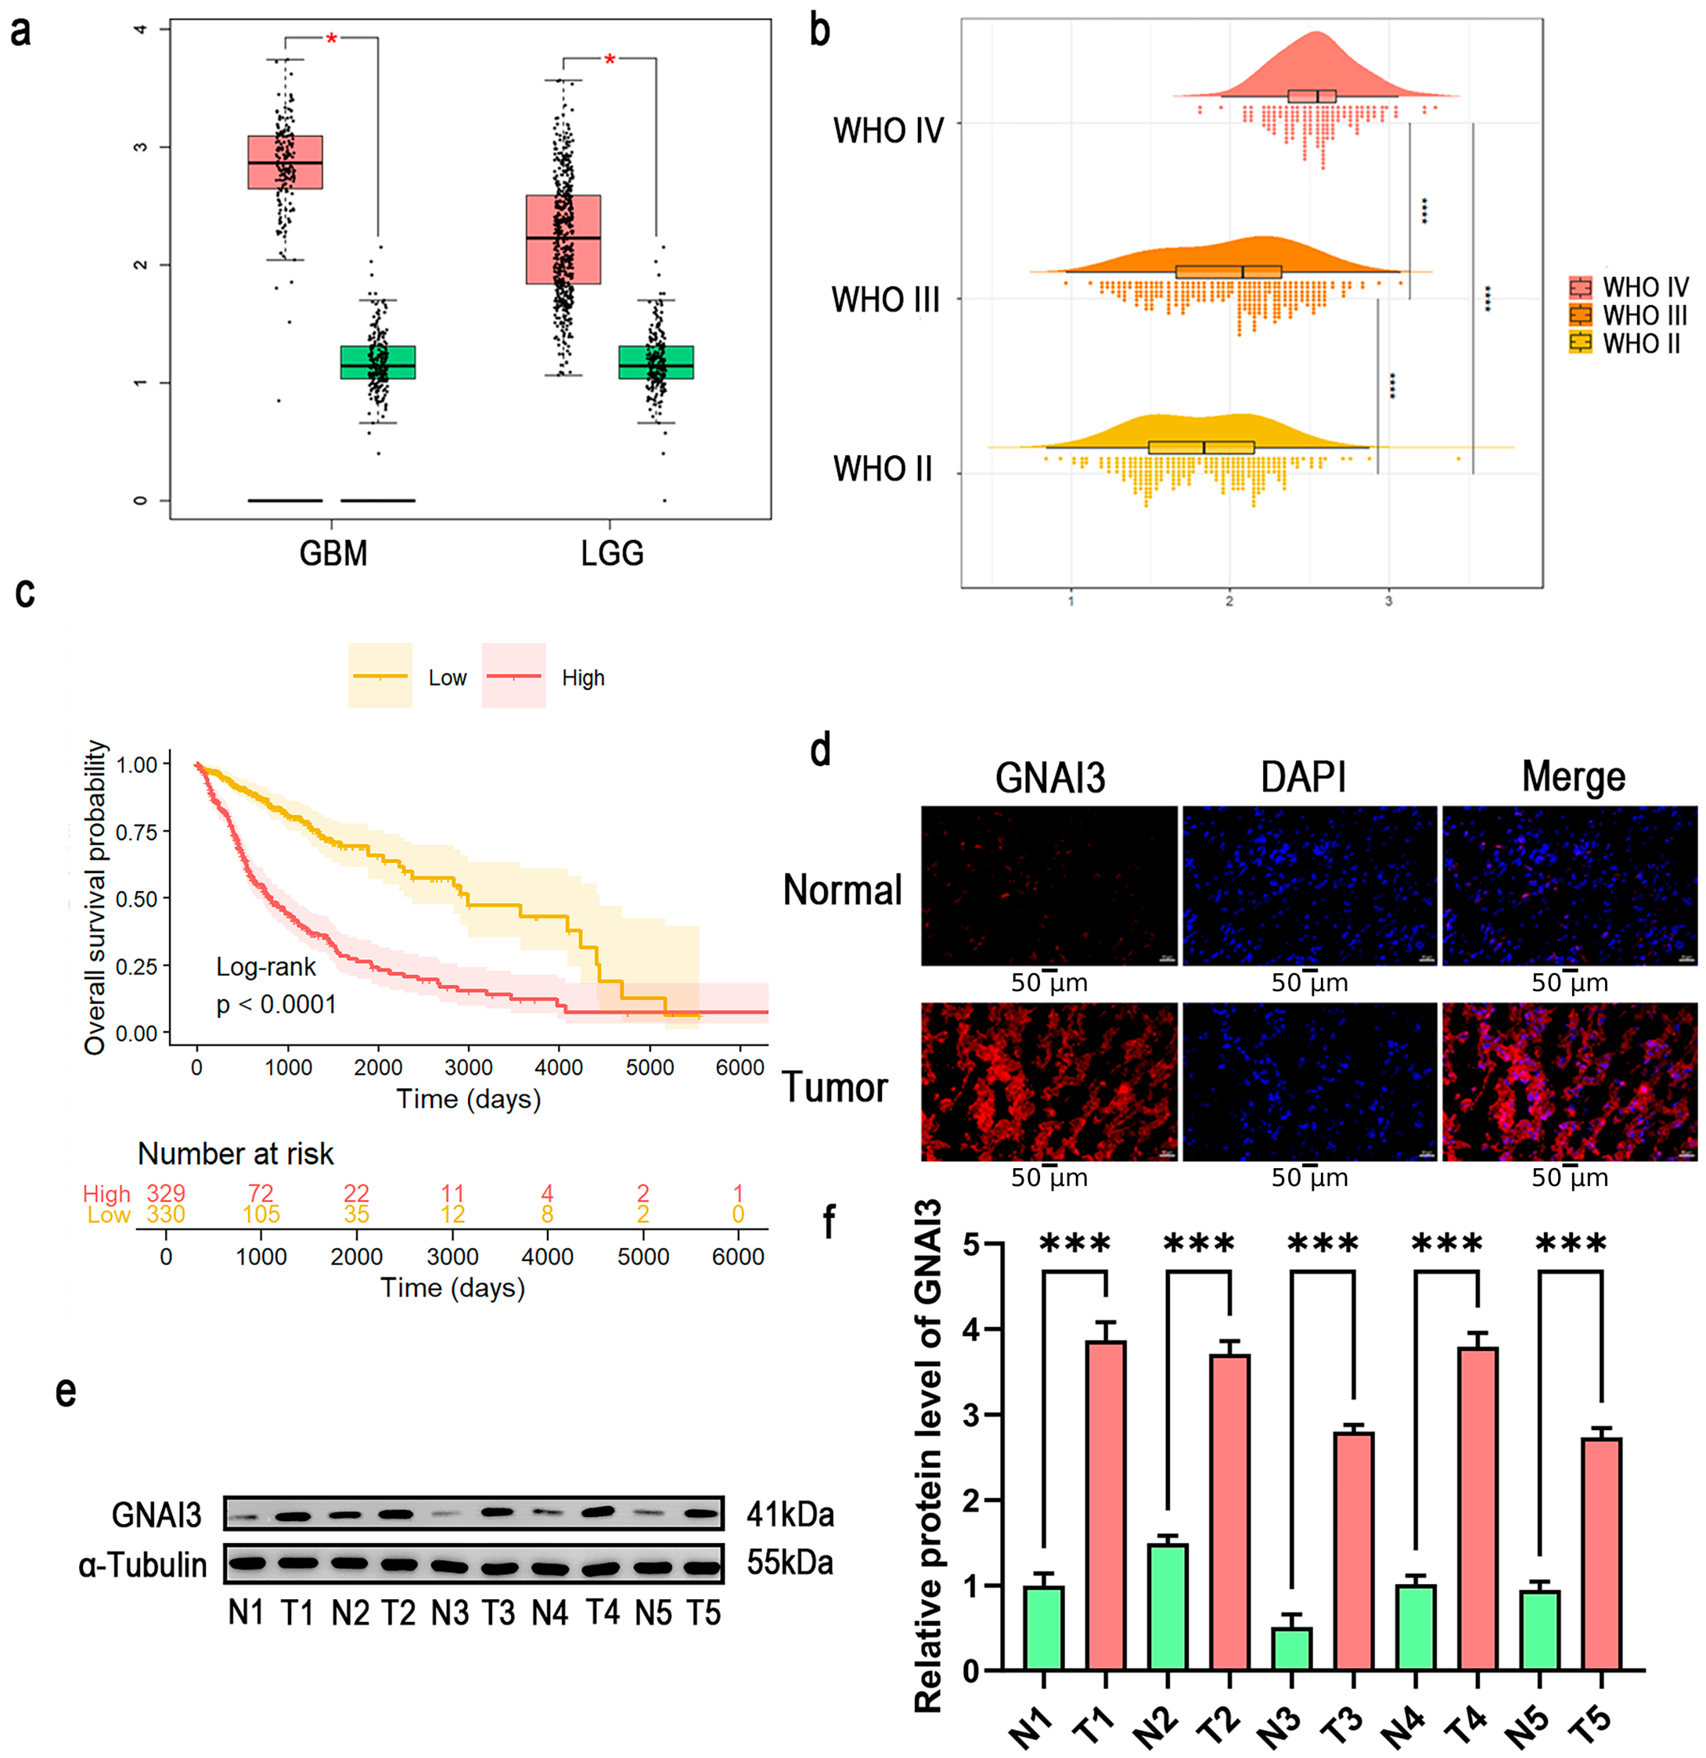
Analysis of the TCGA/GTEx cohort showed higher GNAI3 expression in glioma than in non-neoplastic brain tissue (Figure 1a). In the CGGA cohort, GNAI3 expression increased with WHO grade (Figure 1b). Kaplan–Meier analysis of 659 unique patients in the TCGA-LGG/GBM cohort showed shorter overall survival in the GNAI3-high group than in the GNAI3-low group (329 and 330 patients, respectively; log-rank p < 0.0001; Figure 1c).
Figure 1.
GNAI3 expression and clinical relevance in glioma. (a) GNAI3 expression in glioblastoma, lower-grade glioma, and non-neoplastic brain tissues in the Cancer Genome Atlas (TCGA)/Genotype-Tissue Expression (GTEx) cohort. Pink boxes represent tumor tissues, and green boxes represent normal tissues. Red asterisks indicate statistically significant differences between tumor and normal tissues (* p < 0.05) in panel (a). (b) GNAI3 expression across World Health Organization (WHO) grade groups in the Chinese Glioma Genome Atlas (CGGA) cohort. (**** indicates p < 0.0001 for the indicated pairwise comparisons between WHO grade group). (c) Kaplan–Meier analysis of overall survival in 659 unique patients from the TCGA lower-grade glioma (LGG) and glioblastoma (GBM) cohorts grouped by median GNAI3 expression (high, n = 329; low, n = 330). Values equal to the median were assigned to the low-expression group. Shaded areas indicate 95% confidence intervals, tick marks indicate censored observations, and the table shows numbers at risk. p < 0.0001 by the log-rank test. (d) Representative immunofluorescence images from five paired tissue samples, with one microscopic field imaged per tissue sample for qualitative assessment. Scale bars, 50 μm. (e) Western blot analysis of GNAI3 in five paired peritumoral non-neoplastic and glioblastoma tissues. T denotes tumor tissue, and N denotes matched peritumoral non-neoplastic tissue. Numbers 1–5 identify individual patients, with the same number indicating a matched pair. (f) Densitometric quantification of GNAI3 protein expression in five matched tissue pairs (n = 5 pairs). DAPI, 4′,6-diamidino-2-phenylindole; T, tumor tissue; N, matched peritumoral non-neoplastic tissue; SD, standard deviation. Data are presented as mean ± SD and were analyzed using a paired two-tailed t test. The Shapiro–Wilk test did not detect a significant departure from normality in the paired differences (p = 0.623). *** p < 0.001 in panel (f).
Multivariable Cox analysis was performed in 646 patients with complete clinical and molecular information. GNAI3 expression was associated with shorter overall survival after adjustment for age, sex, and grade (hazard ratio (HR) per one-standard-deviation increase, 1.411; 95% confidence interval (CI), 1.181–1.685; p < 0.001). This association was attenuated after additional adjustment for IDH/1p/19q molecular subtype (HR, 1.097; 95% CI, 0.878–1.372; p = 0.415). Proportional hazards diagnostics prompted additional stratified analyses, including an exploratory time-varying model that suggested a time-dependent association with survival (joint likelihood-ratio p = 0.0107). Detailed model results and sensitivity analyses are provided in the Supplementary Materials.
Consistent with the transcriptomic findings, immunofluorescence demonstrated stronger GNAI3 staining in glioblastoma than in matched peritumoral non-neoplastic tissue (Figure 1d). Western blotting and densitometric analysis of five matched tissue pairs confirmed higher GNAI3 protein abundance in tumor tissue (p < 0.001; Figure 1e,f). Together, these findings identify elevated GNAI3 expression as a feature of higher-grade glioma and link its expression to adverse clinical outcomes.
3.2. Bidirectional Manipulation Alters Glioma-Cell Viability
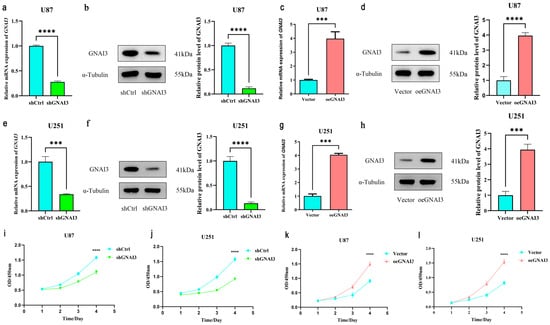
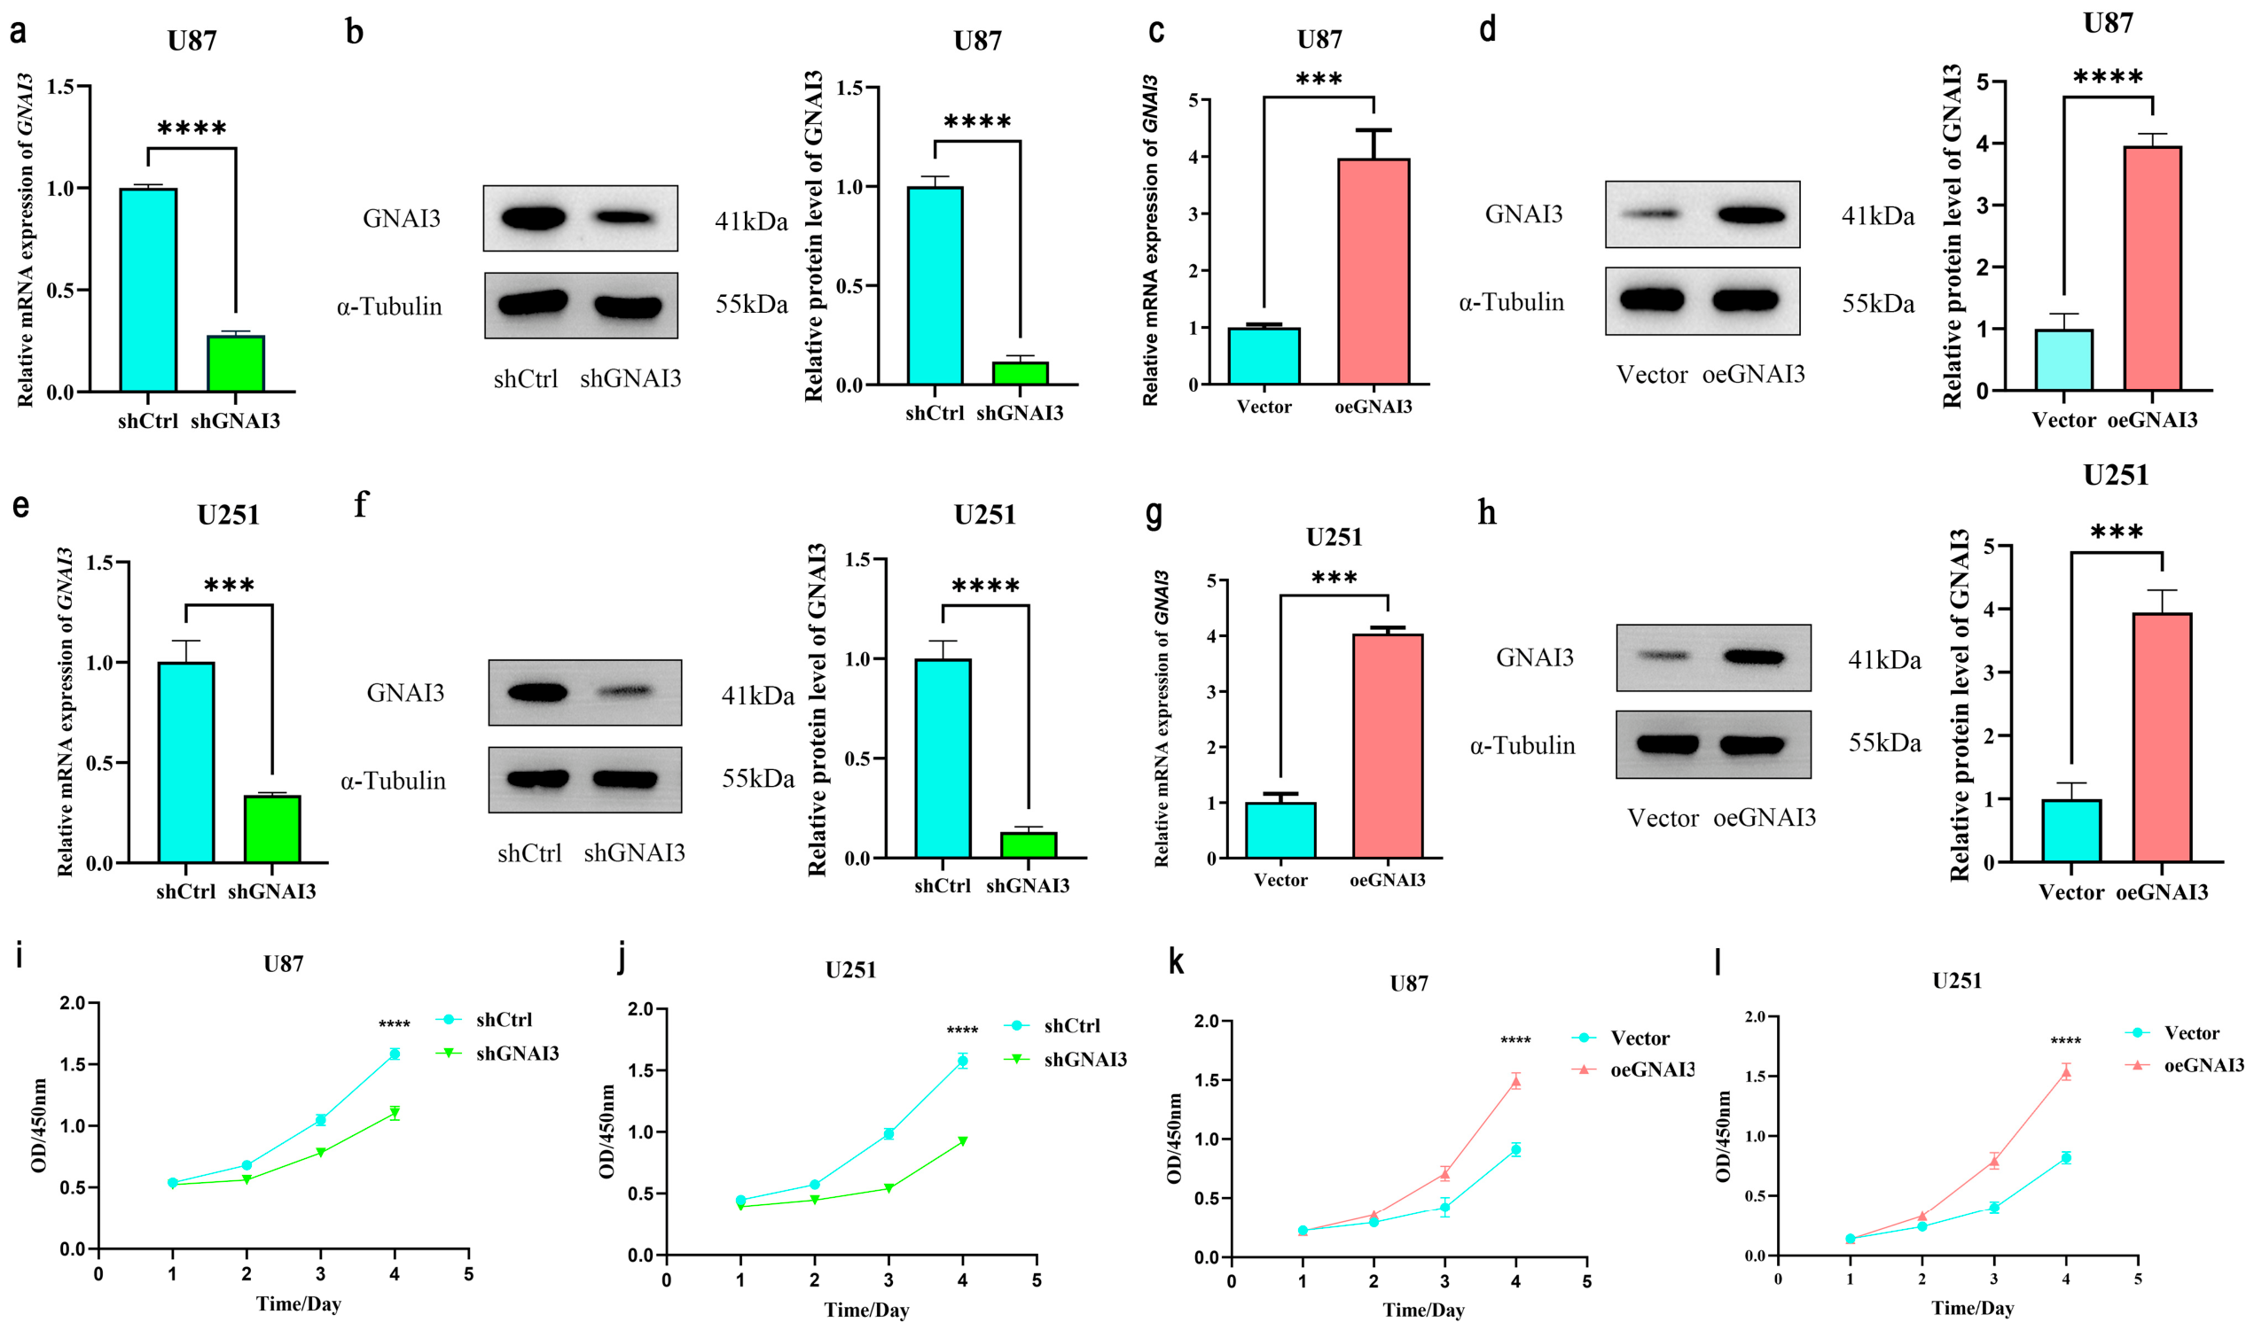
Stable GNAI3 knockdown and overexpression were confirmed at both messenger RNA (mRNA) and protein levels in U87-MG and U251-MG cells (Figure 2a–h). In U87-MG cells, GNAI3 overexpression increased GNAI3 expression by approximately fourfold, and the same direction of manipulation was achieved in U251-MG cells. In CCK-8 assays, GNAI3 depletion reduced cell viability across the time course in both cell lines, whereas GNAI3 overexpression increased cell viability, including at the final measurement (Figure 2i–l). These reciprocal effects indicate that GNAI3 contributes functionally to the maintenance of glioma-cell growth-related viability.
Figure 2.
GNAI3 regulates viability in glioma cells. (a–d) Reverse-transcription quantitative polymerase chain reaction (RT-qPCR) and Western blot validation of GNAI3 knockdown and overexpression in U87-MG cells. (e–h) RT-qPCR and Western blot validation in U251-MG cells. (i,j) Cell Counting Kit-8 (CCK-8) assays showing the effect of GNAI3 knockdown on cell viability. (k,l) CCK-8 assays showing the effect of GNAI3 overexpression on cell viability. RT-qPCR measurements used one biological sample per group, with three technical replicates per gene; error bars represent technical standard deviation (SD). Western blot quantification and CCK-8 assays were performed in three independent biological experiments (n = 3). mRNA, messenger ribonucleic acid; OD, optical density; GAPDH, glyceraldehyde-3-phosphate dehydrogenase; shCtrl, control short-hairpin ribonucleic acid (RNA); shGNAI3, GNAI3-targeting short-hairpin RNA; Vector, empty-vector control; oeGNAI3, GNAI3 overexpression. CCK-8 assays included four technical replicate wells per group per time point in each experiment. Western blot comparisons between each GNAI3-manipulated group and its corresponding control were analyzed using unpaired two-tailed t tests. *** p < 0.001, **** p < 0.0001.
3.3. GNAI3 Increases Glioma-Cell Migration and Invasion
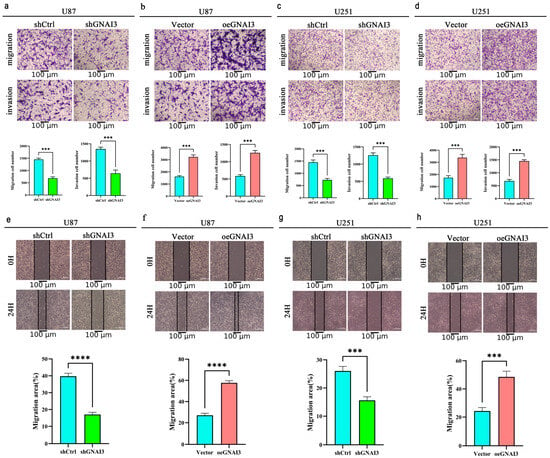
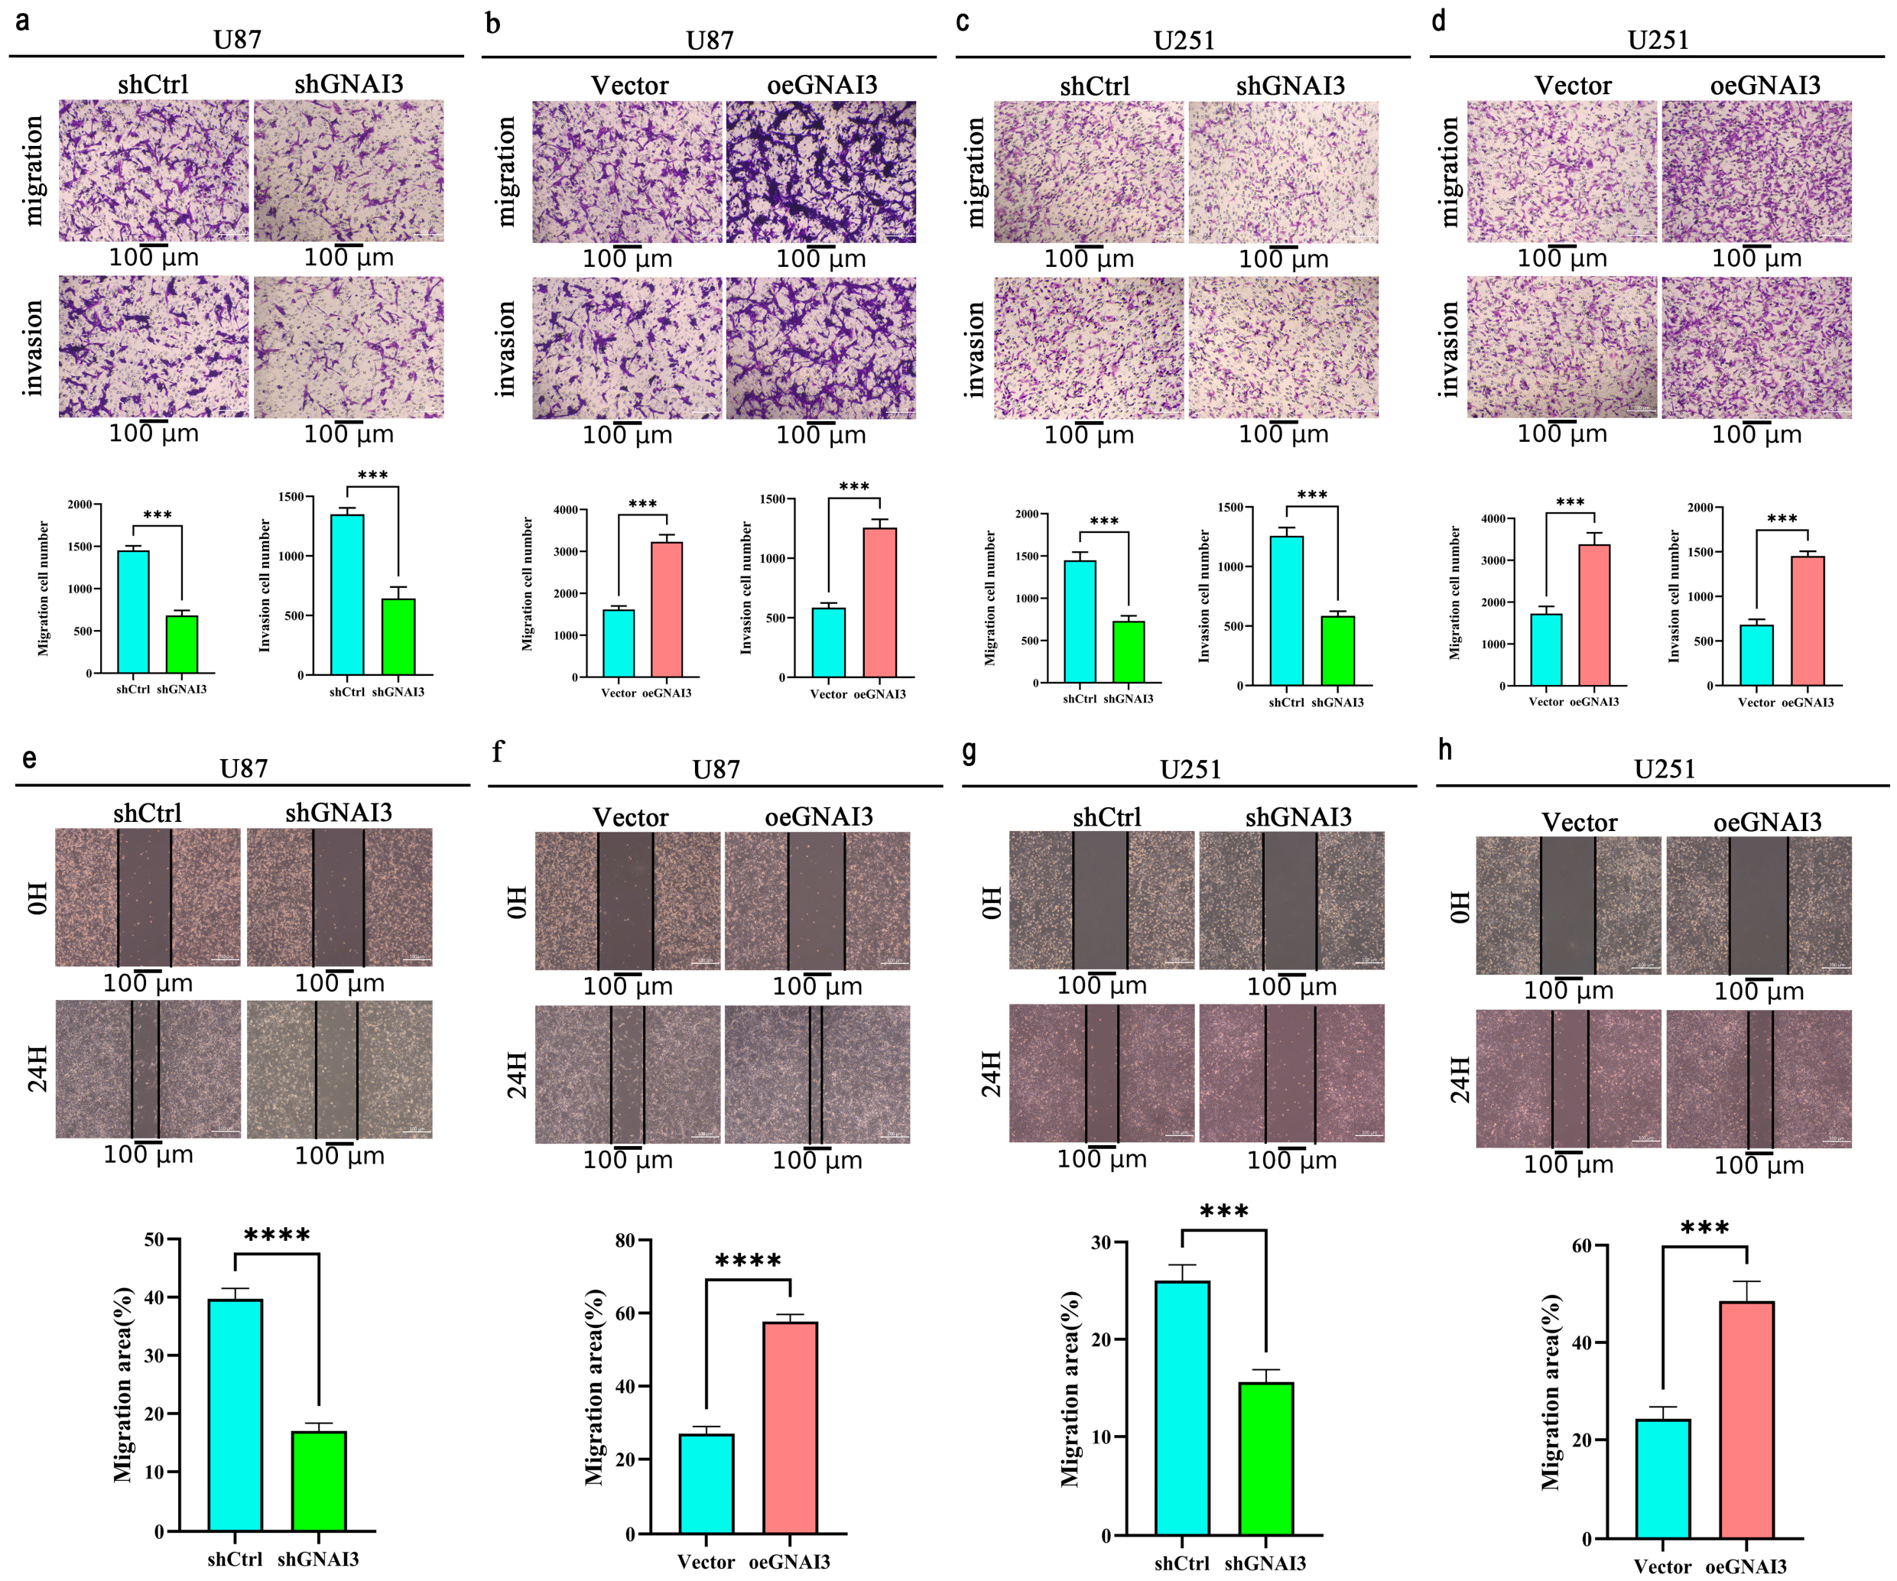
Transwell assays showed a consistent motility phenotype in both cell models. GNAI3 knockdown reduced the number of migrated and invaded U87-MG and U251-MG cells, whereas GNAI3 overexpression increased both migration and Matrigel invasion (p < 0.001 for the principal comparisons; Figure 3a–d). Wound-healing assays yielded concordant results: GNAI3 depletion delayed closure of the wound area, while GNAI3 overexpression accelerated closure at 24 h (p < 0.001; Figure 3e–h). These assays showed concordant changes in migration- and invasion-related readouts following GNAI3 manipulation in both glioma cell lines.
Figure 3.
GNAI3 promotes glioma-cell migration and invasion. (a,c) Transwell migration and invasion assays after GNAI3 knockdown in U87-MG and U251-MG cells. (b,d) Transwell assays after GNAI3 overexpression. (e,g) Wound-healing assays after GNAI3 knockdown. (f,h) Wound-healing assays after GNAI3 overexpression. All assays were performed in three independent biological experiments (n = 3). Migration and invasion assays used one Transwell insert per group per experiment, with one microscopic field counted per insert. Wound-healing assays used one well per group per experiment, with the same microscopic field imaged at 0 and 24 h. shCtrl, control short-hairpin ribonucleic acid (RNA); shGNAI3, GNAI3-targeting short-hairpin RNA; Vector, empty-vector control; oeGNAI3, GNAI3 overexpression; SD, standard deviation. Quantitative data are presented as mean ± SD across the three independent experiments. Comparisons between each GNAI3-manipulated group and its corresponding control were analyzed using unpaired two-tailed t tests. *** p < 0.001, **** p < 0.0001. Scale bars, 100 μm.
3.4. GNAI3 Is Linked to TGF-β-Related Mesenchymal Molecular Changes
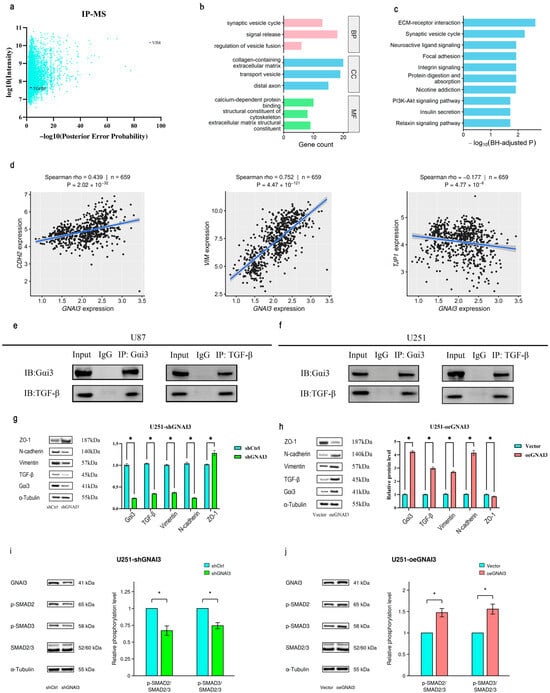
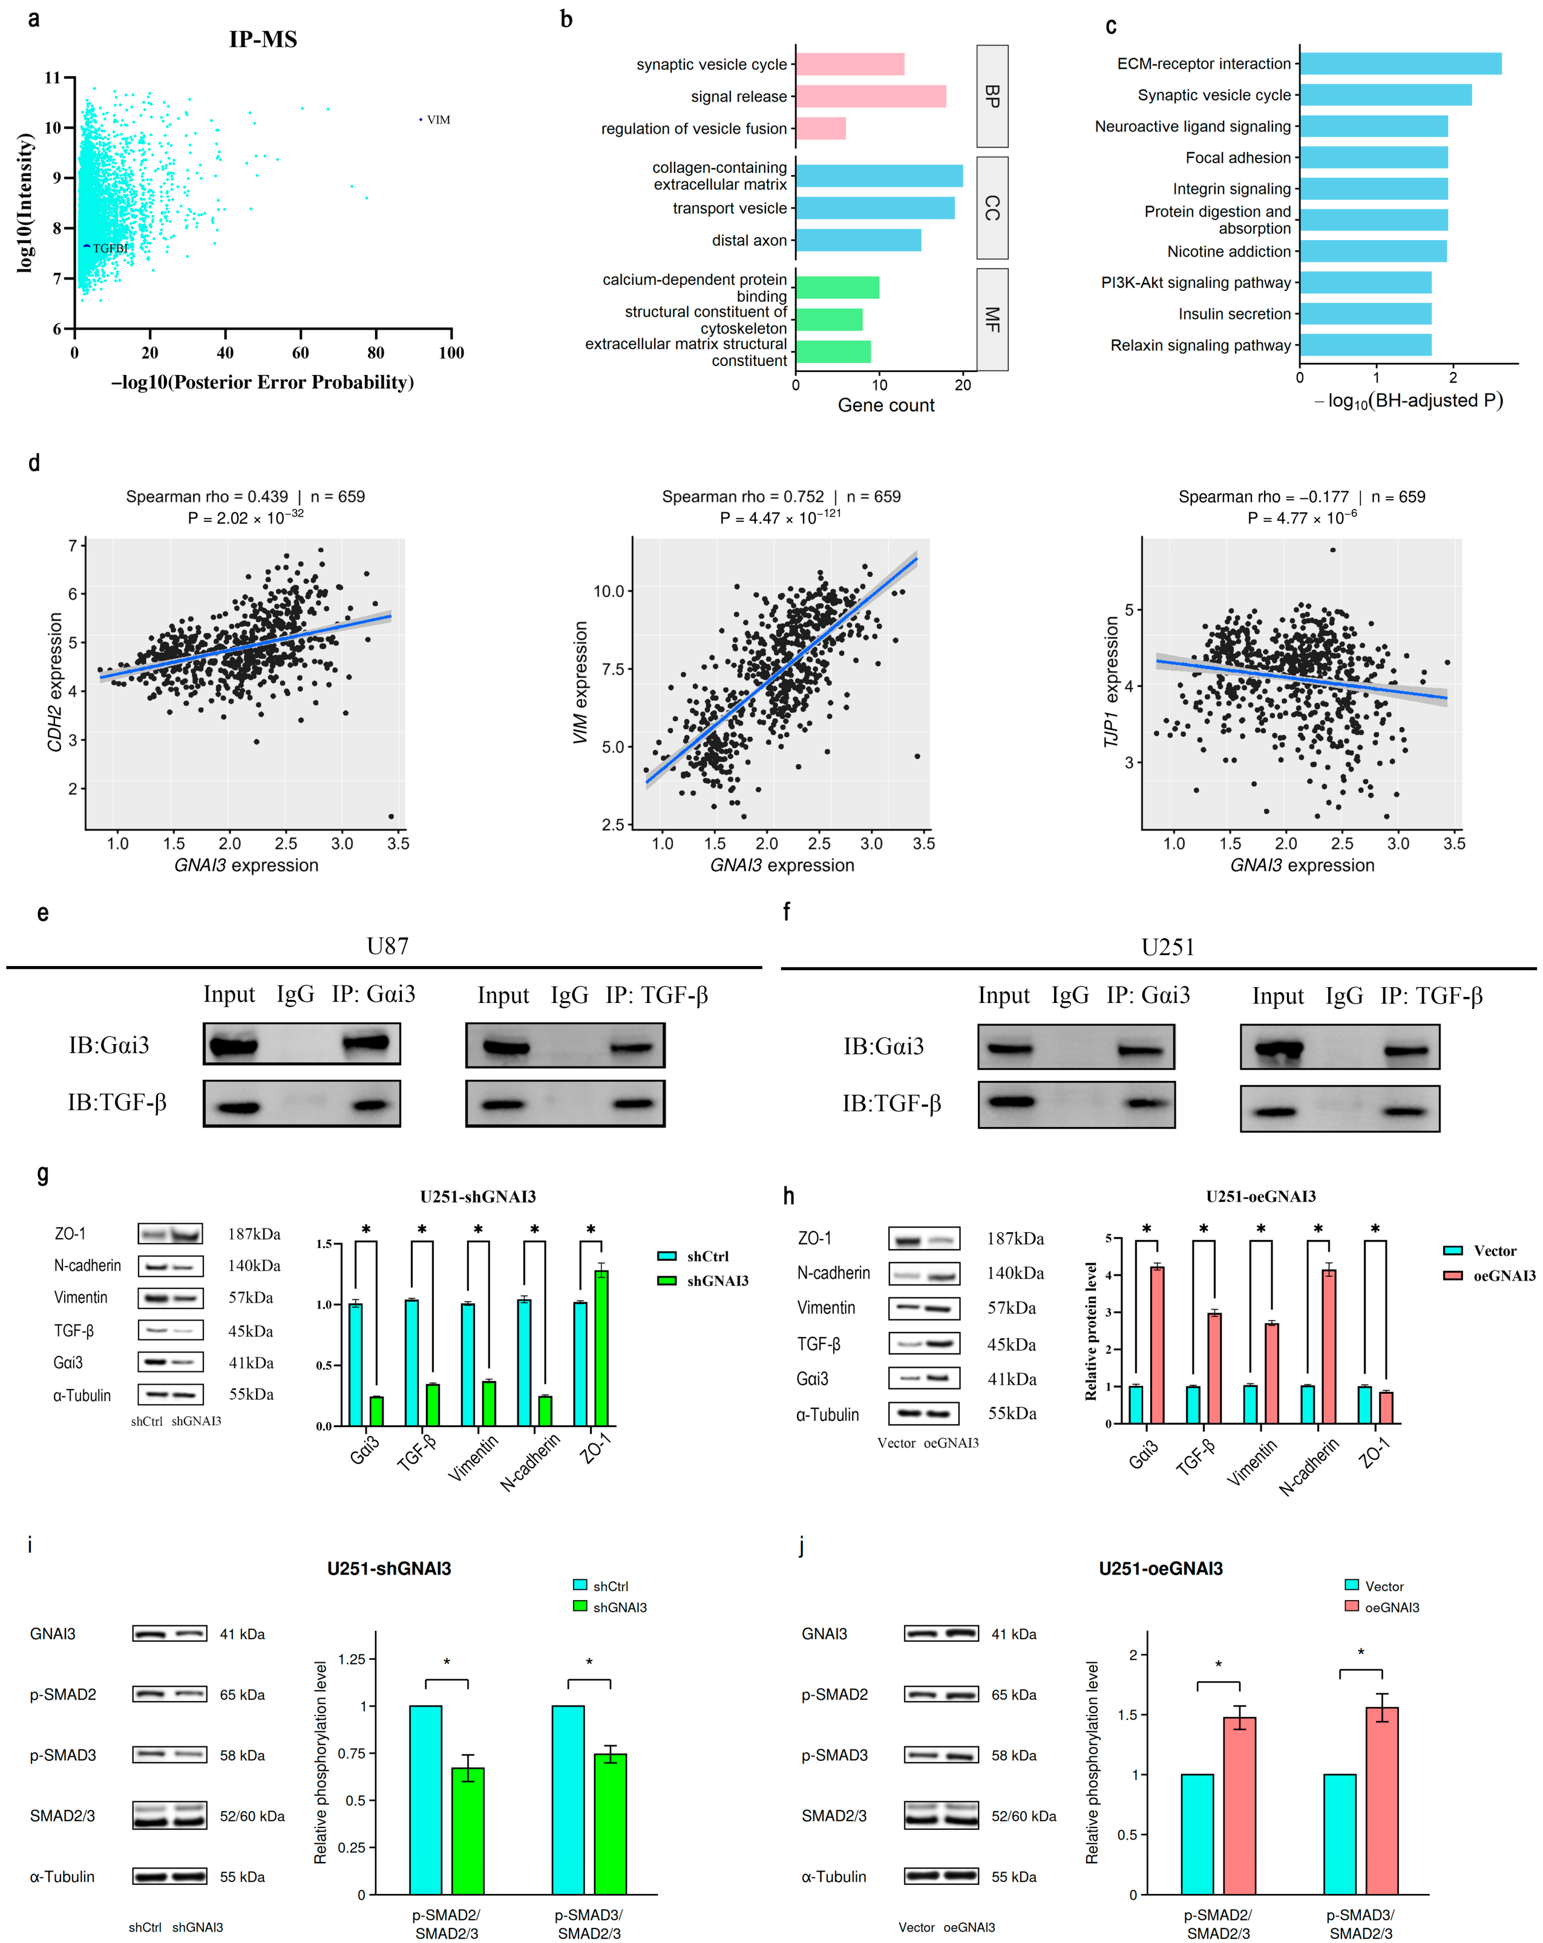
Mass spectrometry of anti-FLAG immunoprecipitates from FLAG-GNAI3-overexpressing U251-MG cells identified transforming growth factor-β-induced protein (TGFBI) and vimentin among candidate GNAI3-associated proteins (Figure 4a). Comparison of the high- and low-GNAI3-expression groups identified 148 differentially expressed genes, including 66 upregulated and 82 downregulated genes. GO analysis identified significant enrichment of synaptic vesicle cycling and neurotransmitter secretion-related processes (Figure 4b). KEGG analysis identified enrichment of extracellular matrix (ECM)–receptor interaction, focal adhesion, and integrin signaling, among other pathways (Figure 4c). The selected differentially expressed genes and complete significant GO and KEGG enrichment results are provided in Supplementary Tables S8–S10, respectively. In the pooled TCGA-LGG/GBM cohort comprising 659 unique patients, GNAI3 expression correlated positively with CDH2 and VIM and negatively with TJP1 (Spearman ρ = 0.439, 0.752, and −0.177, respectively; Figure 4d). After adjustment for histological grade, the positive associations with CDH2 and VIM persisted (partial Spearman ρ = 0.353 and 0.598, respectively; both BH-adjusted p < 0.001). Grade-stratified analyses also showed positive correlations with both genes within each of grades 2–4 (all BH-adjusted p < 0.05). In contrast, the pooled negative correlation with TJP1 reversed after grade adjustment (partial Spearman ρ = 0.162; BH-adjusted p < 0.001), indicating that its direction was sensitive to grade composition. Pooled and grade-adjusted results are provided in Supplementary Table S6, and grade-stratified results are provided in Supplementary Table S7.
Figure 4.
GNAI3 is associated with transforming growth factor-β (TGF-β)-related mesenchymal changes. (a) Immunoprecipitation–mass spectrometry (IP-MS) analysis of candidate proteins associated with FLAG-GNAI3 complexes in GNAI3-overexpressing U251-MG cells; TGFBI and vimentin are highlighted. (b) Gene Ontology (GO) enrichment analysis of 148 differentially expressed genes identified between the high- and low-GNAI3-expression groups in the combined Cancer Genome Atlas (TCGA) lower-grade glioma (LGG)/glioblastoma (GBM) cohort (n = 659). The three most significant terms ranked by Benjamini–Hochberg (BH)-adjusted p value are shown for each GO category: biological process (BP), cellular component (CC), and molecular function (MF). Bar lengths indicate the number of mapped differentially expressed genes associated with each term. (c) Kyoto Encyclopedia of Genes and Genomes (KEGG) enrichment analysis of the same gene set. The ten most significant pathways ranked by BH-adjusted p value are shown; bar lengths indicate −log10(BH-adjusted p). Differentially expressed genes were defined by BH-adjusted p < 0.05 and |log2 fold change| > 1.5. All displayed terms and pathways had BH-adjusted p < 0.05. (d) Unadjusted Spearman correlations between GNAI3 expression and CDH2, VIM, and TJP1 expression in 659 unique patients from the TCGA-LGG/GBM cohort. Blue lines indicate linear fits, with shaded areas representing 95% confidence intervals. Grade-adjusted and grade-stratified results are provided in Supplementary Tables S6 and S7. (e,f) Co-immunoprecipitation showing co-enrichment of GNAI3 and TGF-β in U87-MG and U251-MG cells. (g,h) Western blot analysis of TGF-β, vimentin, N-cadherin, and ZO-1 after GNAI3 knockdown or overexpression in U251-MG cells. (i,j) Representative Western blots and quantification of p-SMAD2/SMAD2/3 and p-SMAD3/SMAD2/3 ratios after GNAI3 knockdown (i) or overexpression (j) in U251-MG cells. Ratios were normalized to the corresponding control within each independent experiment. Data are presented as mean ± standard deviation (SD) from three independent biological experiments (n = 3). Statistical significance was assessed using two-sided one-sample t tests against 1, with Holm correction across the four comparisons; * adjusted p < 0.05. CDH2, cadherin 2; VIM, vimentin; TJP1, tight junction protein 1; IP, immunoprecipitation; IB, immunoblotting; IgG, immunoglobulin G; BP, biological process; CC, cellular component; MF, molecular function; ECM, extracellular matrix; TGFBI, transforming growth factor-β-induced protein; ZO-1, zonula occludens-1; SMAD2/3, SMAD family members 2 and 3; p-SMAD2, phosphorylated SMAD2; p-SMAD3, phosphorylated SMAD3; PI3K, phosphoinositide 3-kinase; Akt, protein kinase B; shCtrl, control short-hairpin ribonucleic acid (RNA); shGNAI3, GNAI3-targeting short-hairpin RNA; Vector, empty-vector control; oeGNAI3, GNAI3 overexpression. IP-MS used one sample from a single biological experiment. Forward and reverse co-immunoprecipitation assays were each performed once in each cell line. Western blot quantification in panels (g,h) was based on three independent biological experiments (n = 3); data are presented as mean ± SD. Comparisons in panels (g,h) were analyzed using unpaired two-tailed t tests. * p < 0.05.
Co-immunoprecipitation in both U87-MG and U251-MG cells demonstrated co-enrichment of GNAI3 and TGF-β in immunoprecipitated complexes, while matched IgG controls were negative (Figure 4e,f). In U251-MG cells, GNAI3 knockdown reduced TGF-β, vimentin, and N-cadherin and increased ZO-1; GNAI3 overexpression produced the opposite pattern (p < 0.05 for the reported comparisons; Figure 4g,h). To further examine downstream signaling, we assessed SMAD phosphorylation in U251-MG cells. GNAI3 knockdown decreased the p-SMAD2/SMAD2/3 and p-SMAD3/SMAD2/3 ratios, whereas GNAI3 overexpression increased both ratios (all Holm-adjusted p < 0.05; Figure 4i,j). Together with the changes in TGF-β abundance and mesenchymal phenotype-related proteins, these findings support an association between GNAI3 manipulation and altered SMAD phosphorylation.
3.5. GNAI3 Depletion Suppresses Xenograft Growth
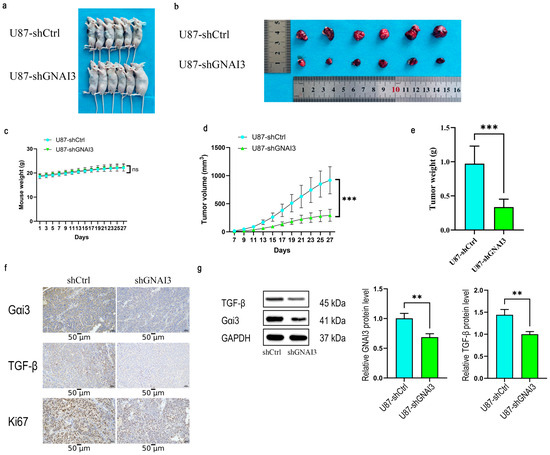
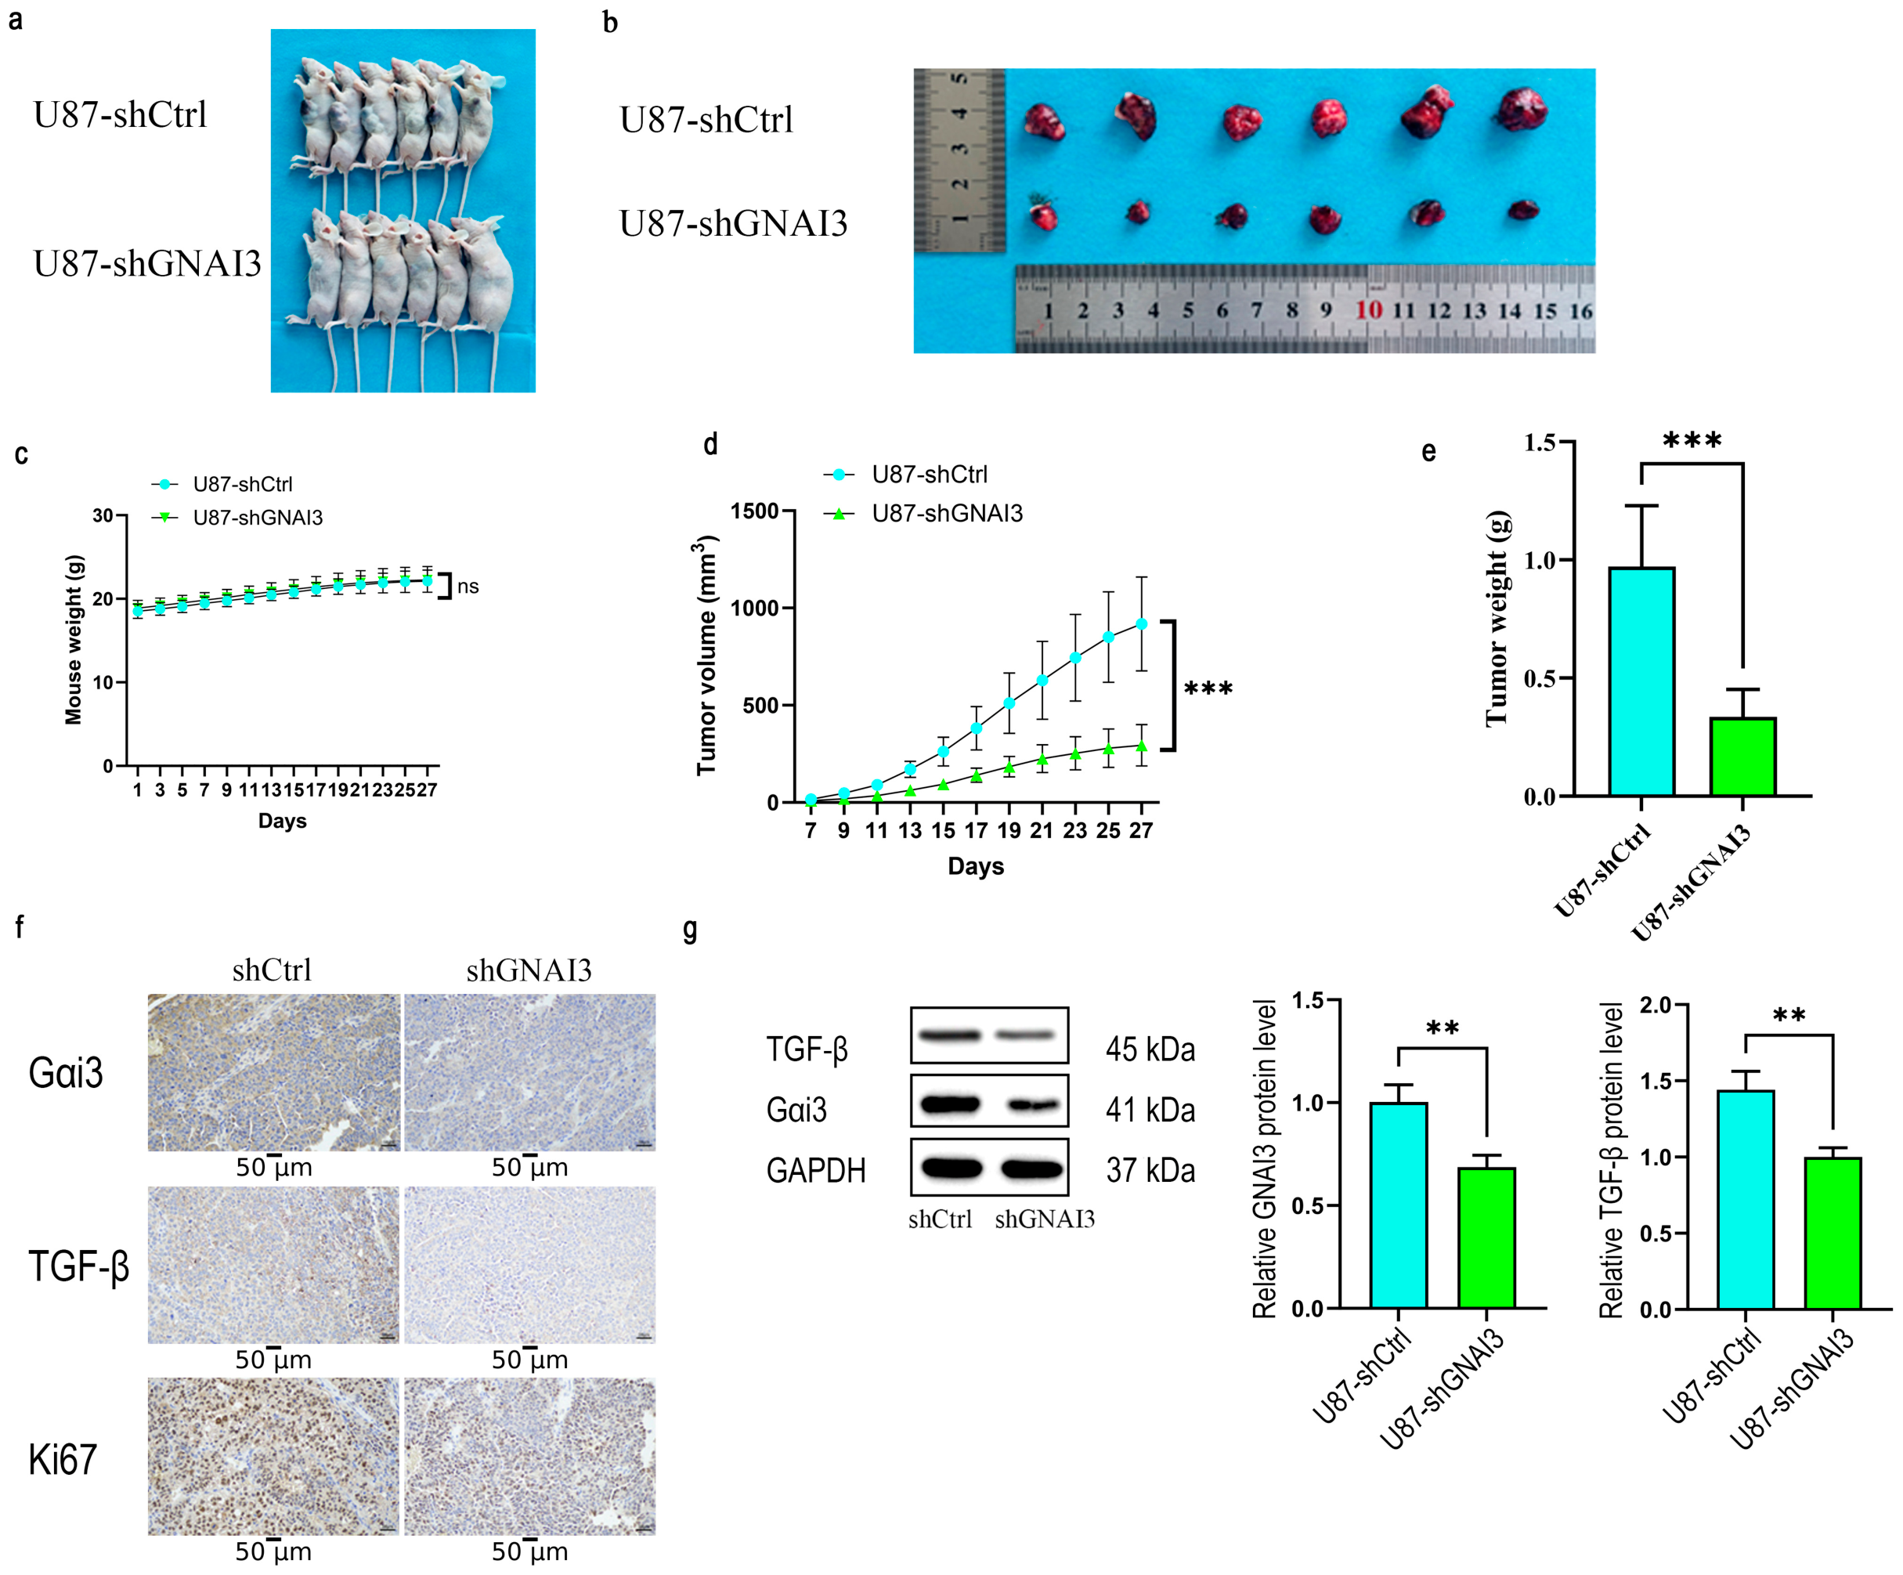
U87-MG cells with stable GNAI3 knockdown formed visibly smaller subcutaneous tumors than shCtrl cells (Figure 5a,b). Body weight did not differ significantly between the two groups at the end of the experiment (day 27; p = 0.879; Figure 5c). Tumor-volume trajectories and final tumor weight were reduced in the shGNAI3 group (p < 0.001; Figure 5d,e). Immunohistochemical staining showed weaker GNAI3, TGF-β, and Ki67 signals in GNAI3-depleted xenografts (Figure 5f), and Western blotting of tumor lysates confirmed lower GNAI3 and TGF-β protein abundance (p < 0.01; Figure 5g). These in vivo findings are consistent with a tumor-promoting role for GNAI3 and extend the in vitro association with TGF-β to xenograft tissue.
Figure 5.
GNAI3 knockdown suppresses xenograft growth. Each group included six mice (n = 6 per group). (a) Representative images of mice bearing U87-MG-shCtrl or U87-MG-shGNAI3 xenografts. (b) Excised tumors from the two groups. (c) Body-weight curves. (d) Tumor-volume curves. (e) Final tumor weight. (f) Immunohistochemical staining of GNAI3, transforming growth factor-β (TGF-β), and Ki67. (g) Western blot analysis and densitometric quantification of GNAI3 and TGF-β in xenograft lysates. Body weight, tumor volume, and final tumor weight were assessed in all six mice per group. shCtrl, control short-hairpin ribonucleic acid (RNA); shGNAI3, GNAI3-targeting short-hairpin RNA; GAPDH, glyceraldehyde-3-phosphate dehydrogenase; ns, not significant (p ≥ 0.05). ** p < 0.01, *** p < 0.001. Scale bars, 50 μm (f).
4. Discussion
This study identifies GNAI3 as a functional contributor to aggressive glioma behavior and places its activity in the context of a TGF-β-associated mesenchymal molecular state. Four lines of evidence support this conclusion. First, GNAI3 was elevated in public glioma cohorts and paired glioblastoma tissues and tracked with higher WHO grade and shorter overall survival. Second, bidirectional manipulation in two glioma cell lines showed reciprocal effects on viability, migration, and invasion. Third, transcriptomic correlation, interaction proteomics, co-immunoprecipitation, and protein-expression analyses converged on mesenchymal phenotype-related molecules and TGF-β. Fourth, GNAI3 depletion reduced xenograft growth and was accompanied by lower Ki67 and TGF-β expression in vivo. The attenuation of the survival association after molecular-subtype adjustment suggests that GNAI3 expression partly tracks established clinicomolecular differences in the pooled cohort. The exploratory time-varying findings warrant further validation. These clinical associations provide context for the experimental findings, while the functional contribution of GNAI3 to aggressive cellular phenotypes is supported by its bidirectional manipulation. The functional results are compatible with prior evidence that Gαi signaling can support glioma growth and motility. Gαi1 and Gαi3 have been shown to mediate neuroligin-3-driven protein kinase B (Akt)–mechanistic target of rapamycin complex 1 (mTORC1) and extracellular signal-regulated kinase (ERK) signaling and to support glioma growth in vitro and in intracranial xenografts [9]. Gαi3 has also been implicated in glioma-cell resistance to irradiation [10], and comparative transcriptomic analyses have associated GNAI3 with malignant glioblastoma features [11]. At the level of cell movement, pertussis toxin-mediated inhibition of Gαi/o signaling suppresses high-grade glioma migration and invasion [12]. More broadly, Gαi1/3 can participate in growth-factor receptor signaling to Akt-mTORC1 [16], regulate Rap-dependent adhesion [17], and form Gα-interacting vesicle-associated protein (GIV)-containing signaling complexes that influence the balance between migration and proliferation [18]. The reciprocal effects observed after GNAI3 knockdown and overexpression in the present study therefore fit a wider biological role for Gαi-family signaling in controlling cell growth and movement. The CCK-8 findings are interpreted here as changes in cell viability. Metabolic assays, adherent-cell staining, and clonogenic assays provide complementary readouts of cellular responses, as illustrated in a recent glioma study [19].
The mesenchymal component of the phenotype requires careful terminology. Canonical EMT describes epithelial cells that lose epithelial characteristics and acquire mesenchymal properties; glioma cells do not arise from epithelium. Accordingly, the changes observed here are more appropriately described as mesenchymal plasticity or an EMT-like state [3,4]. EMT itself is now understood as a spectrum of transitional states rather than a binary switch [20,21,22]. In glioma, EMT-related signatures have been associated with prognosis, immune context, extracellular-matrix remodeling, and invasion [23,24]. Recent work also links altered adhesion and cytoskeletal regulation, including focal adhesion kinase (FAK) membrane localization, to mesenchymal traits in glioma [25]. Intercellular communication can also influence invasive behavior: AQP4-containing extracellular vesicles released by glioma cells have been shown to alter the invasive phenotype of recipient tumor cells [26]. The positive associations of GNAI3 with CDH2 and VIM persisted after grade adjustment and within each histological grade, supporting associations beyond differences in grade composition. In contrast, the pooled negative correlation with TJP1 reversed after grade adjustment, indicating sensitivity to grade composition. The reciprocal changes in N-cadherin, vimentin, and ZO-1 following GNAI3 manipulation provide complementary experimental evidence of mesenchymal phenotype-related molecular changes.
TGF-β provides a plausible signaling context for the observed molecular changes. TGF-β is a major regulator of tumor-cell plasticity and can promote mesenchymal programs through canonical SMAD and non-SMAD pathways [5,6,27,28]. In glioblastoma models, TGF-β-related signaling has been linked to junctional remodeling, motility, and invasive behavior [29], and TGF-β/SMAD regulation of runt-related transcription factor 2 (RUNX2) has been associated with EMT-like changes and malignant progression in glioma [30]. In the present study, IP-MS identified TGFBI and vimentin among candidate GNAI3-associated proteins. Co-immunoprecipitation showed co-enrichment of GNAI3 and TGF-β, and GNAI3 manipulation altered TGF-β abundance together with mesenchymal phenotype-related proteins. The additional experiments showed reciprocal changes in p-SMAD2/SMAD2/3 and p-SMAD3/SMAD2/3 ratios following GNAI3 knockdown and overexpression, extending the evidence from protein abundance to downstream SMAD phosphorylation. These findings are consistent with involvement of TGF-β/SMAD signaling. Whether this pathway mediates the effects of GNAI3 on migration, invasion, and mesenchymal plasticity remains to be determined through pathway inhibition and rescue experiments.
The study has several limitations. The human validation series contained only five paired glioblastoma/peritumoral samples, and survival analyses were based on heterogeneous public glioma cohorts; GNAI3 therefore cannot be considered an independent prognostic biomarker on the basis of the present data. Although the additional SMAD phosphorylation analyses strengthen the signaling evidence, the absence of pathway inhibition and rescue experiments limits conclusions about whether TGF-β signaling mediates the GNAI3-associated phenotypes. Differences in cell viability may contribute to the migration and invasion readouts. The subcutaneous xenograft model demonstrated the effect of GNAI3 depletion on tumor growth. An orthotopic intracranial model would be needed to more faithfully evaluate infiltrative growth and interactions between tumor cells and the brain microenvironment. Finally, functional validation was limited to established cell lines and should be extended to patient-derived glioma stem-like models and orthotopic systems. These limitations define the experiments most likely to strengthen mechanistic and translational interpretation in subsequent work.
5. Conclusions
GNAI3 expression is associated with higher-grade glioma, and experimental manipulation supports its functional contribution to glioma-cell viability, migration, invasion, and tumor growth in a subcutaneous xenograft model. GNAI3-dependent phenotypes are accompanied by changes in TGF-β abundance, SMAD phosphorylation, and mesenchymal phenotype-related proteins. The current evidence supports GNAI3 as a regulator of glioma aggressiveness and a candidate component of TGF-β-associated mesenchymal plasticity, while additional pathway-rescue and orthotopic studies are required to establish mechanism and therapeutic relevance.
Supplementary Materials
The following supporting information can be downloaded at: https://www.mdpi.com/article/10.3390/biomedicines14112480/s1, Supplementary methods and results for the survival, correlation, differential-expression, and enrichment analyses are provided in the accompanying supplementary document. Table S1: Multivariable Cox regression results; Table S2: Proportional hazards assumption tests; Table S3: Time-specific GNAI3 hazard ratios from the exploratory stratified model; Table S4: Exploratory stratified time-varying model and joint test; Table S5: Sensitivity analyses of the exploratory time-varying model; Table S6: Pooled and grade-adjusted correlations; Table S7: Grade-stratified Spearman correlations; Table S8: Selected differentially expressed genes; Table S9: Gene Ontology (GO) enrichment results and Table S10: Kyoto Encyclopedia of Genes and Genomes (KEGG) enrichment results. Original uncropped Western blot images corresponding to the figure panels in the manuscript are also provided in separate folders labeled according to the respective figure panels.
Author Contributions
H.W., Q.W., L.C., Q.H. and T.C. performed the experimental work. H.W. and Q.H. performed the bioinformatic analyses. H.W. wrote the original manuscript draft. L.W., L.F., N.S. and P.Z. supervised the project. All authors have read and agreed to the published version of the manuscript.
Funding
This work was supported by the Changzhou Sci & Tech Program (Grant No. CJ20245008); Top Talent of Changzhou “The 14th Five-Year Plan” High-Level Health Talents Training Project (2024CZBJ002); New Technology and New Project of the First People’s Hospital of Changzhou (202603); Changzhou Sci & Tech Program (Grant No. CJ20255003); and Changzhou Sci & Tech Program (Grant No. CJ20256006).
Institutional Review Board Statement
The retrospective use of archived human tissue samples was approved by the Ethics Committee of Changzhou First People’s Hospital (Approval No. 2026(教)CL023-01, approved date 20 March 2026) and was conducted in accordance with the Declaration of Helsinki. Written informed consent was obtained from all participants. Animal procedures were reviewed and approved by the Experimental Animal Ethics Committee (approval No. IA20251101, approved date 1 November 2025).
Informed Consent Statement
Written informed consent was obtained from all participants involved in the study.
Data Availability Statement
The public datasets analyzed in this study are available from TCGA, GTEx, CGGA, and the Gene Expression Omnibus (GSE103224 and GSE4290). Full-length uncropped Western blot images, including those from co-immunoprecipitation experiments, are provided in the Supplementary Materials. Other experimental datasets supporting the findings of this study are available from the corresponding author on reasonable request.
Conflicts of Interest
The authors declare no conflicts of interest.
Abbreviations
| BCA | bicinchoninic acid |
| CCK-8 | Cell Counting Kit-8 |
| CI | confidence interval |
| CGGA | Chinese Glioma Genome Atlas |
| DMEM | Dulbecco’s modified Eagle medium |
| EMT | epithelial-to-mesenchymal transition |
| FBS | fetal bovine serum |
| GEO | Gene Expression Omnibus |
| GNAI3 | guanine nucleotide-binding protein G(i) subunit alpha 3 |
| GO | Gene Ontology |
| GTEx | Genotype-Tissue Expression |
| HR | hazard ratio |
| IP-MS | immunoprecipitation–mass spectrometry |
| KEGG | Kyoto Encyclopedia of Genes and Genomes |
| OS | overall survival |
| PVDF | polyvinylidene fluoride |
| RT-qPCR | reverse-transcription quantitative polymerase chain reaction |
| TCGA | The Cancer Genome Atlas |
| TGF-β | transforming growth factor-β |
| WHO | World Health Organization |
References
- Ostrom, Q.T.; Price, M.; Neff, C.; Cioffi, G.; Waite, K.A.; Kruchko, C.; Barnholtz-Sloan, J.S. CBTRUS statistical report: Primary brain and other central nervous system tumors diagnosed in the United States in 2016–2020. Neuro Oncol. 2023, 25, iv1–iv99. [Google Scholar] [CrossRef] [Scilit] [PubMed]
- Xu, S.; Tang, L.; Li, X.; Fan, F.; Liu, Z. Immunotherapy for glioma: Current management and future application. Cancer Lett. 2020, 476, 1–12. [Google Scholar] [CrossRef] [Scilit] [PubMed]
- Iser, I.C.; Lenz, G.; Wink, M.R. EMT-like process in glioblastomas and reactive astrocytes. Neurochem. Int. 2019, 122, 139–143. [Google Scholar] [CrossRef] [Scilit] [PubMed]
- Meel, M.H.; Schaper, S.A.; Kaspers, G.J.L.; Hulleman, E. Signaling pathways and mesenchymal transition in pediatric high-grade glioma. Cell. Mol. Life Sci. 2018, 75, 871–887. [Google Scholar] [CrossRef] [Scilit] [PubMed]
- Peng, D.; Fu, M.; Wang, M.; Wei, Y.; Wei, X. Targeting TGF-β signal transduction for fibrosis and cancer therapy. Mol. Cancer 2022, 21, 104. [Google Scholar] [CrossRef] [Scilit] [PubMed]
- Wang, X.; Eichhorn, P.J.A.; Thiery, J.P. TGF-β, EMT, and resistance to anti-cancer treatment. Semin. Cancer Biol. 2023, 97, 1–11. [Google Scholar] [CrossRef] [Scilit] [PubMed]
- Byrne, K.F.; Pal, A.; Curtin, J.F.; Stephens, J.C.; Kinsella, G.K. G-protein-coupled receptors as therapeutic targets for glioblastoma. Drug Discov. Today 2021, 26, 2858–2870. [Google Scholar] [CrossRef] [Scilit] [PubMed]
- Villaseca, S.; Romero, G.; Ruiz, M.J.; Pérez, C.; Leal, J.I.; Tovar, L.M.; Torrejón, M. Gαi protein subunit: A step toward understanding its non-canonical mechanisms. Front. Cell Dev. Biol. 2022, 10, 941870. [Google Scholar] [CrossRef] [Scilit] [PubMed]
- Wang, Y.; Liu, Y.Y.; Chen, M.B.; Cheng, K.W.; Qi, L.N.; Zhang, Z.Q.; Peng, Y.; Li, K.R.; Liu, F.; Chen, G.; et al. Neuronal-driven glioma growth requires Gαi1 and Gαi3. Theranostics 2021, 11, 8535–8549. [Google Scholar] [CrossRef] [Scilit] [PubMed]
- Cai, S.; Li, Y.; Bai, J.Y.; Zhang, Z.Q.; Wang, Y.; Qiao, Y.B.; Zhou, X.Z.; Yang, B.; Tian, Y.; Cao, C. Gαi3 nuclear translocation causes irradiation resistance in human glioma cells. Oncotarget 2017, 8, 35061–35068. [Google Scholar] [CrossRef] [Scilit] [PubMed]
- Raza, A.; Yen, M.C.; Anuraga, G.; Shahzadi, I.; Mazhar, M.W.; Ta, H.D.K.; Xuan, D.T.M.; Dey, S.; Kumar, S.; Santoso, A.W.; et al. Comparative analysis of the GNAI family genes in glioblastoma through transcriptomics and single-cell technologies. Cancers 2023, 15, 5112. [Google Scholar] [CrossRef] [Scilit] [PubMed]
- Gilder, A.S.; Wang, L.; Natali, L.; Karimi-Mostowfi, N.; Brifault, C.; Gonias, S.L. Pertussis toxin is a robust and selective inhibitor of high grade glioma cell migration and invasion. PLoS ONE 2016, 11, e0168418. [Google Scholar] [CrossRef] [Scilit] [PubMed]
- Maqoud, F.; Simone, L.; Tricarico, D.; Camerino, G.M.; Antonacci, M.; Nicchia, G.P. The Functional Interaction of KATP and BK Channels with Aquaporin-4 in the U87 Glioblastoma Cell. Biomedicines 2024, 12, 1891. [Google Scholar] [CrossRef] [Scilit] [PubMed]
- Simone, L.; Pisani, F.; Mola, M.G.; De Bellis, M.; Merla, G.; Micale, L.; Frigeri, A.; Vescovi, A.L.; Svelto, M.; Nicchia, G.P. AQP4 Aggregation State Is a Determinant for Glioma Cell Fate. Cancer Res. 2019, 79, 2182–2194. [Google Scholar] [CrossRef] [Scilit] [PubMed]
- Antonacci, M.; Maqoud, F.; Di Turi, A.; Miciaccia, M.; Perrone, M.G.; Scilimati, A.; Tricarico, D. KATP Channel Inhibitors Reduce Cell Proliferation Through Upregulation of H3K27ac in Diffuse Intrinsic Pontine Glioma: A Functional Expression Investigation. Cancers 2025, 17, 358. [Google Scholar] [CrossRef] [Scilit] [PubMed]
- Cao, C.; Huang, X.; Han, Y.; Wan, Y.; Birnbaumer, L.; Feng, G.S.; Marshall, J.; Jiang, M.; Chu, W.M. Gαi1 and Gαi3 are required for epidermal growth factor-mediated activation of the Akt-mTORC1 pathway. Sci. Signal. 2009, 2, ra17. [Google Scholar] [CrossRef] [Scilit] [PubMed]
- To, J.Y.; Smrcka, A.V. Activated heterotrimeric G protein αi subunits inhibit Rap-dependent cell adhesion and promote cell migration. J. Biol. Chem. 2018, 293, 1570–1578. [Google Scholar] [CrossRef] [Scilit] [PubMed]
- Ghosh, P.; Beas, A.O.; Bornheimer, S.J.; Garcia-Marcos, M.; Forry, E.P.; Johannson, C.; Ear, J.; Jung, B.H.; Cabrera, B.; Carethers, J.M.; et al. A Gαi-GIV molecular complex binds epidermal growth factor receptor and determines whether cells migrate or proliferate. Mol. Biol. Cell 2010, 21, 2338–2354. [Google Scholar] [CrossRef] [Scilit] [PubMed]
- Antonacci, M.; Di Turi, A.; Miciaccia, M.; Denora, M.; Maqoud, F.; Perrone, M.G.; Scilimati, A.; Tricarico, D. Actions of Midostaurin as Cation Channel and Tyrosine Kinase Inhibitor in Diffuse Intrinsic Pontine Glioma Cell Lines. Cancers 2026, 18, 1066. [Google Scholar] [CrossRef] [Scilit] [PubMed]
- Huang, Y.; Hong, W.; Wei, X. The molecular mechanisms and therapeutic strategies of EMT in tumor progression and metastasis. J. Hematol. Oncol. 2022, 15, 129. [Google Scholar] [CrossRef] [Scilit] [PubMed]
- De Craene, B.; Berx, G. Regulatory networks defining EMT during cancer initiation and progression. Nat. Rev. Cancer 2013, 13, 97–110. [Google Scholar] [CrossRef] [Scilit] [PubMed]
- Pastushenko, I.; Blanpain, C. EMT transition states during tumor progression and metastasis. Trends Cell Biol. 2019, 29, 212–226. [Google Scholar] [CrossRef] [Scilit] [PubMed]
- Ning, W.; Qiu, Z.; Ji, X.; Wang, X.; An, Y.; Wang, S.; Zhang, H. The prognostic value of EMT in glioma and its role in the glioma immune microenvironment. J. Mol. Neurosci. 2020, 70, 1501–1511. [Google Scholar] [CrossRef] [Scilit] [PubMed]
- Rajesh, Y.; Biswas, A.; Mandal, M. Glioma progression through the prism of heat shock protein-mediated extracellular matrix remodeling and epithelial-to-mesenchymal transition. Exp. Cell Res. 2017, 359, 299–311. [Google Scholar] [CrossRef] [Scilit] [PubMed]
- Wang, Y.; Shen, N.; Yang, Y.; Xia, Y.; Zhang, W.; Lu, Y.; Wang, Z.; Yang, Z.; Wang, Z. ZDHHC5-mediated S-palmitoylation of FAK promotes its membrane localization and epithelial-mesenchymal transition in glioma. Cell Commun. Signal. 2024, 22, 46. [Google Scholar] [CrossRef] [Scilit] [PubMed]
- Simone, L.; Pisani, F.; Binda, E.; Frigeri, A.; Vescovi, A.L.; Svelto, M.; Nicchia, G.P. AQP4-dependent glioma cell features affect the phenotype of surrounding cells via extracellular vesicles. Cell Biosci. 2022, 12, 150. [Google Scholar] [CrossRef] [Scilit] [PubMed]
- Hao, Y.; Baker, D.; Ten Dijke, P. TGF-β-mediated epithelial-mesenchymal transition and cancer metastasis. Int. J. Mol. Sci. 2019, 20, 2767. [Google Scholar] [CrossRef] [Scilit] [PubMed]
- Zhao, M.; Mishra, L.; Deng, C.X. The role of TGF-β/SMAD4 signaling in cancer. Int. J. Biol. Sci. 2018, 14, 111–123. [Google Scholar] [CrossRef] [Scilit] [PubMed]
- Wei, L.; Shao, N.; Peng, Y.; Zhou, P. Inhibition of cathepsin S restores TGF-β-induced epithelial-to-mesenchymal transition and tight junction turnover in glioblastoma cells. J. Cancer 2021, 12, 1592–1603. [Google Scholar] [CrossRef] [Scilit] [PubMed]
- Zhou, P.; Wei, Q.; Wang, H.; Yu, T.; Chen, L.; Huang, Q.; Wei, L.; Jiang, J. RUNX2 mediated epithelial mesenchymal transition induced by TGF beta and Smad signaling promotes malignant progression in glioma. Sci. Rep. 2025, 15, 26781. [Google Scholar] [CrossRef] [Scilit] [PubMed]
Disclaimer/Publisher’s Note: The statements, opinions and data contained in all publications are solely those of the individual author(s) and contributor(s) and not of MDPI and/or the editor(s). MDPI and/or the editor(s) disclaim responsibility for any injury to people or property resulting from any ideas, methods, instructions or products referred to in the content. |
© 2026 by the authors. Licensee MDPI, Basel, Switzerland. This article is an open access article distributed under the terms and conditions of the Creative Commons Attribution (CC BY) license.