


Abstract
Traditional tin dioxide (SnO2) gas sensors suffer from high operating temperatures and poor sensing response toward ammonia (NH3) at room temperature. Herein, flower-like CeO2/SnO2 n-n heterostructures are fabricated via a facile one-pot solvothermal route followed by high-temperature calcination for ppm-level NH3 detection at room temperature. The CeO2/SnO2 heterostructure calcined at 800 °C presents porous flower microspheres assembled by nanoparticles. Gas-sensing measurements demonstrate that the CeO2/SnO2-800 sensor delivers a high response of 6.5 toward 50 ppm NH3 at room temperature. Moreover, the sensor exhibits outstanding selectivity, reproducibility, and long-term stability over 60 days. Combined XPS, in situ FT-IR, O2-TPD, and EPR characterizations verify that the construction of n-n heterojunctions and abundant oxygen vacancies synergistically boost the concentration of surface-adsorbed oxygen species, thus improving the NH3 sensing performance. The CeO2/SnO2 heterostructure in this work offers a promising strategy for developing low-power room-temperature NH3 gas sensors.
1. Introduction
Ammonia (NH3), a colorless and toxic gas, is widely used in chemical production, agricultural nitrogen fertilization, food processing, etc. [1,2]. The leakage of NH3 not only affects production safety but also causes pollution to the environment and poses a serious threat to human health [3,4]. Exposure to more than 25 ppm of NH3 for a short period of time could irritate the eyes and respiratory mucosa [5]. High-concentration NH3 leakage can cause chemical pulmonary edema, asphyxia, and even death [6]. According to the regulations of the Occupational Safety and Health Administration (OSHA), the allowable exposure limits for chemical industry workers to 50 ppm and 100 ppm NH3 are 8 h and 4 h, respectively [7]. Therefore, the timely development of ppm-level NH3 sensors is of great significance for protecting the environment and human health.
The resistive gas sensors based on metal oxides are widely used for NH3 detection due to their low power consumption and high sensitivity [8]. Among them, SnO2 has attracted attention by virtue of its good stability and simple preparation process [9]. However, its poor inherent conductivity often requires a higher working temperature (usually above 200 °C), which leads to increased power consumption and potential explosion risks [10]. To solve the problem, constructing heterostructures has been widely studied as an effective strategy in recent years [11]. Owing to the difference in Fermi levels, the construction of heterostructures can create depletion and accumulation regions between the two materials, leading to spontaneous carrier transfer, which provides the opportunity to enhance electronic conductivity [12]. This enables the materials to adsorb more oxygen molecules, thereby improving gas-sensing performance. Moreover, there are more active sites at the heterointerface, which is conducive to the adsorption and activation of gases. For example, SnS2/SnO2 nano-heterojunctions [13], SnO2/Nb2CTx MXene composite [14], and Co3O4/SnO2 heterostructure [15] have been applied in NH3 sensing. Therefore, the rational design of heterostructures based on SnO2 is an effective strategy to enhance its room-temperature sensing performance.
CeO2 is an alkaline oxide, which possesses abundant oxygen vacancy defects, mixed valence states, and high oxygen storage capacity, making it an ideal sensing material [16]. For instance, Ma et al. reported that In/CeO2 showed excellent sensing performance for NH3 [17]. Nagar et al. synthesized ZnFe2O4/CeO2 nanostructured heterojunctions with outstanding NH3 gas-sensing properties, which benefited from the nanoscale heterojunction formation and enhanced charge-carrier transport [18]. Accordingly, the targeted synthesis of CeO2/SnO2 heterostructure is a practical strategy for greatly improving the room-temperature detection of NH3.
In this work, a flower-like CeO2/SnO2 heterostructure was successfully fabricated via a facile solvothermal method combined with subsequent calcination treatment. The microstructure and morphology of the prepared composites were systematically characterized. The room-temperature NH3 sensing behaviors of the CeO2/SnO2 sensor were comprehensively investigated, including response performance, selectivity, and long-term stability. This work aims to explore the synergistic sensing enhancement mechanism of CeO2 modification and heterojunction construction, and provide a feasible reference for the design and preparation of high-efficiency room-temperature NH3 sensors.
2. Materials and Methods
2.1. Synthesis of CeO2/SnO2 Heterostructure
The CeO2/SnO2 heterostructure was synthesized through simple solvothermal and calcination processes. Firstly, 1 mmol of SnCl2·2H2O, 0.1 mmol of Ce(NO3)3·6H2O, 3 mmol of thiourea, and 0.5 mmol of ascorbic acid were dissolved in 30 mL of ethylene glycol solution. After 90 min of magnetic stirring, a mixed solution was obtained. The above mixture was transferred to a 50 mL Teflon-lined autoclave and heated at 180 °C for 18 h. After the reaction system cooled naturally, it was centrifugally washed with deionized water and anhydrous ethanol four times, and the precipitate was dried at 70 °C for 3 h to obtain the precursor powder. Finally, the precursor was calcined in air at 600, 700, 800, and 900 °C to obtain the CeO2/SnO2 heterostructure.
2.2. Characterization
Thermogravimetric (TG) tests of the as-prepared precursor were carried out on a Perkin-Elmer TG/DTA 6300 thermal analysis instrument (Waltham, MA, USA) under ambient atmosphere. The temperature program was set from 30 °C up to 900 °C at a constant heating ramp of 5 °C per minute. A Bruker D8-Advance X-ray diffractometer (Karlsruhe, Germany) was adopted to identify the crystalline phases of all as-obtained samples. The microstructural morphologies were observed via scanning electron microscopy (SEM, Carl Zeiss SIGMA 500, Oberkochen, Germany) and transmission electron microscopy (TEM, Hitachi JEOL-JEM-2010, Tokyo, Japan). X-ray photoelectron spectroscopy (XPS) measurements were conducted on a Kratos AXIS ULTRA DLD spectrometer (Manchester, UK) to probe surface chemical states, where the C 1s peak at 284.6 eV was utilized to calibrate all binding energy values. A Bruker ER200DSRC10/12 electron paramagnetic resonance (EPR) spectrometer (Rheinstetten, Germany) was utilized to detect oxygen vacancy defects within the materials. Temperature-programmed desorption (TPD) equipment (TP-5080E, Tianjin Xianquan Company, Tianjin, China) was applied to characterize the adsorption behaviors of molecular oxygen. The optical band gaps of the synthesized materials were derived from ultraviolet-visible diffuse reflectance spectroscopy (UV-Vis DRS) data acquired on a Perkin-Elmer Lambda 750 device (Shelton, CT, USA). A Thermo Trace 1300 gas chromatography–mass spectrometry (GC-MS) (Waltham, MA, USA) system was utilized to qualitatively analyze gaseous byproducts generated from the interaction between sensing layers and target gas molecules.
2.3. Gas Sensor Measurements
A 10 mg/mL sensing material solution in anhydrous ethanol was dropped onto an Al2O3 substrate (8 × 4 mm) with gold finger electrodes (5 pairs, each pair spaced 0.2 mm apart), and then placed on a 70 °C heating plate for drying. Under environmental conditions of 25 °C and 40% relative humidity, the gas-sensing characteristics were measured using a test system (JF02E, Kunming, China). The background gas was ambient air, and the test chamber (10 L) was cleaned with a blower before use. Then, the air inside the chamber was extracted using a vacuum pump, and the target gas of the required volume was injected into the chamber with a syringe (Figure S1). After that, clean ambient air was introduced into the chamber to balance the pressure inside and outside the chamber, achieving uniform gas mixing. The stable resistance value of the sensor in the ambient air is recorded as Ra. Then, the sensor was placed in the prepared test chamber, and the resistance value Rg was recorded when the response time reached 100 s. Subsequently, the sensor was returned to the ambient air, and the resistance value was restored to the initial value. The recovery time was defined as the time taken to reach 90% of the resistance change. The sensing response value is defined as: S = Rg/Ra (for oxidizing gases) and S = Ra/Rg (for reducing gases).
The formula for calculating gas concentration is as follows:
C2 = (C1 × V1)/V2;
C1: The concentration of commercial gas (ppm = 10−6);
C2: The concentration of the gas to be tested (ppm = 10−6);
V1: The volume of the commercial gas extracted (mL = 10−3 L);
V2: The volume of the test chamber used (10 L).
In the selective measurement, CO2, C2H4, CO, H2S, and NH3 are all pure gases with a purity of 100%, and the initial concentrations of SO2, NO, and Cl2 are 1000 ppm, 2000 ppm, and 2000 ppm, respectively, with N2 used as the equilibrium gas.
In addition, the influence of relative humidity on the response characteristics of the gas sensor was also studied. By adding a certain amount of water to the test chamber and allowing it to evaporate naturally, different humidity levels (RH%) can be achieved. The specific humidity value is evaluated by the hygrometer located in the test chamber.
To obtain accurate and reliable measurement data, parallel measurements were conducted under the same conditions, and the average value was taken. Three independent sensor devices prepared using the same batch of sensing materials were used for parallel measurements.
3. Results and Discussion
3.1. Morphological and Structural Characterization
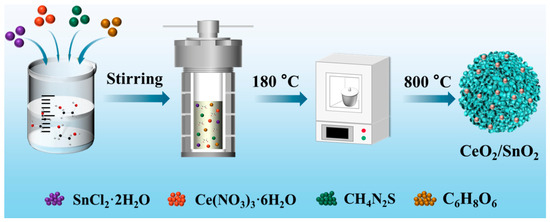
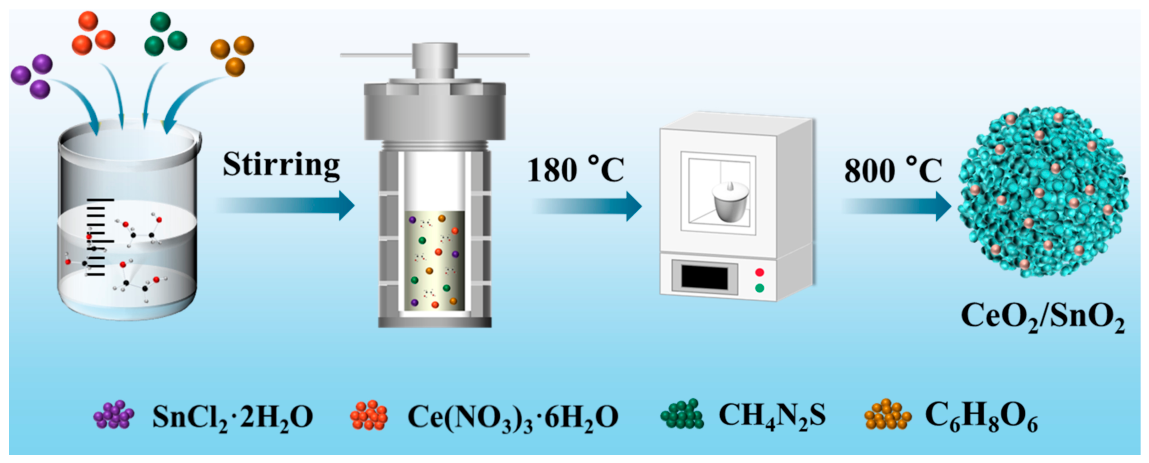
The preparation process of the CeO2/SnO2 heterostructure is shown in Figure 1. The precursor was obtained by a simple solvothermal method using SnCl2·2H2O, Ce(NO3)3·6H2O, thiourea, and ascorbic acid as raw materials, with ethylene glycol as the solvent, reacting at 180 °C for 18 h. Then, the precursor powder was placed in a tube furnace and calcined under an air atmosphere for a certain period to obtain the CeO2/SnO2 heterostructure. During the preparation process, the thiourea acts as the sulfur source and a hydrolysis-sustained-release agent to regulate the nucleation and growth of the precursor. Ascorbic acid acts as a reducing agent to regulate the valence state of Ce ions.
Figure 1.
Schematic illustration of the synthesis process of CeO2/SnO2 heterostructure.
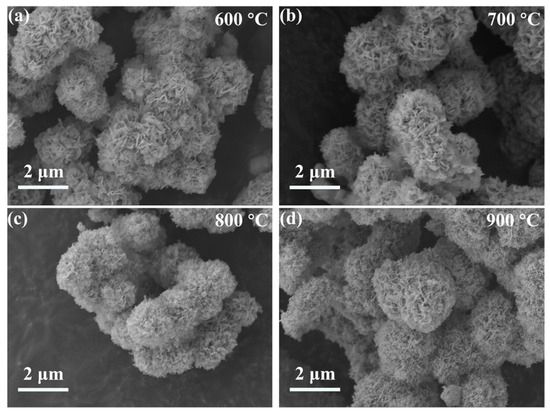
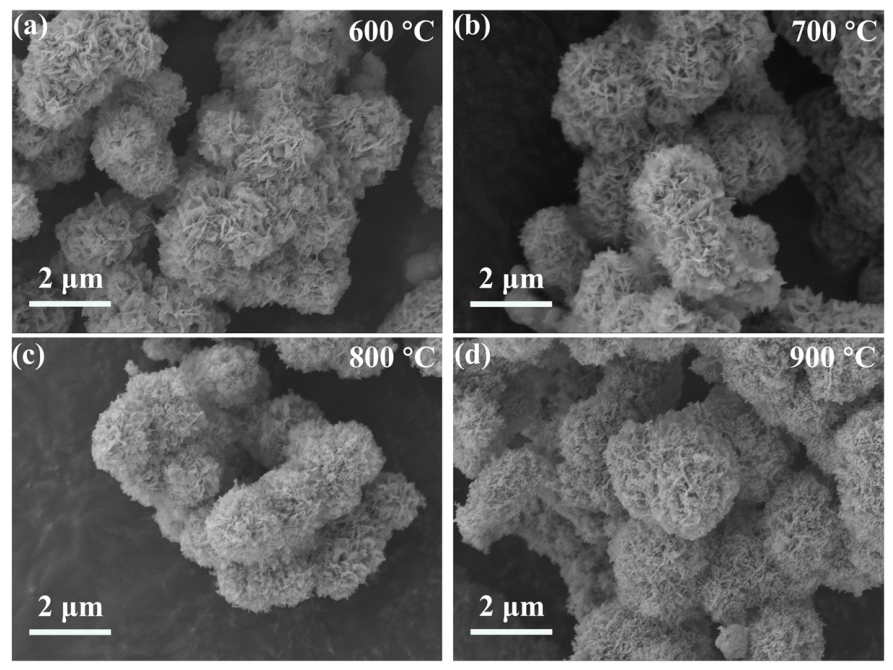
According to the TG analysis in Figure S2, the first weightlessness platform appears at 500–600 °C; then, the precursor gradually loses weight after 600 degrees, and completely loses weight from 800 to 900 °C. Therefore, 600 °C, 700 °C, 800 °C, and 900 °C were selected as the calcination temperatures, and the calcination time was 2 h. First, the effect of calcination temperature on the morphology and structure of the product was investigated. As observed from the SEM images in Figure 2, the four samples all exhibit flower-like morphology. With increasing calcination temperature, the nanosheets in the flower-like structure gradually evolve into nanoparticles, but the structure does not collapse, proving its relatively high thermal stability. The XRD patterns in Figure S3 reveal diffraction peaks corresponding to SnO2 (JCPDS No. 77-0449) and CeO2 (JCPDS No. 78-0694) for all samples. As the calcination temperature increases, the diffraction peaks become sharper, indicating improved crystallinity. Moreover, no characteristic peaks attributable to impurities are observed, suggesting that the prepared samples possess high purity.
Figure 2.
SEM images of CeO2/SnO2 samples calcined at different temperatures: (a) 600 °C, (b) 700 °C, (c) 800 °C and (d) 900 °C.
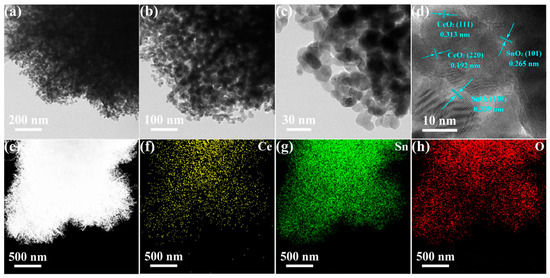
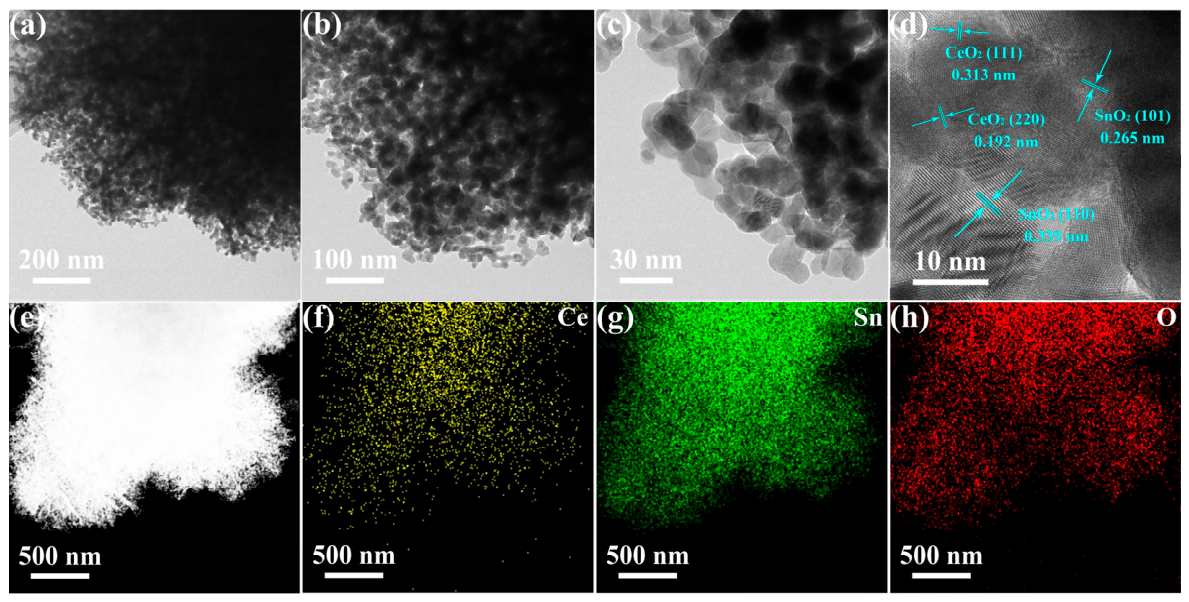
The TEM characterization was further employed to analyze the microstructure of the CeO2/SnO2-800 sample. As shown in Figure 3a–c, the flower-like structure of the sample is composed of numerous nanoparticles, which is consistent with the observation in SEM images. The pores existing between nanoparticles could facilitate gas adsorption and diffusion, thereby enhancing gas-sensing performance. Figure 3d presents the HRTEM image of the CeO2/SnO2-800 sample, where lattice fringe spacings of 0.313 nm and 0.192 nm correspond to the (111) and (220) crystal planes of CeO2, respectively, and spacings of 0.339 nm and 0.265 nm correspond to the (110) and (101) crystal planes of SnO2, respectively. Figure 3e–h demonstrate that Ce, Sn, and O elements are uniformly distributed throughout the sample.
Figure 3.
(a–c) TEM, (d) HRTEM and (e–h) EDX images of CeO2/SnO2-800 sample.
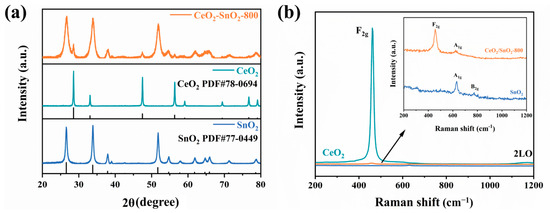
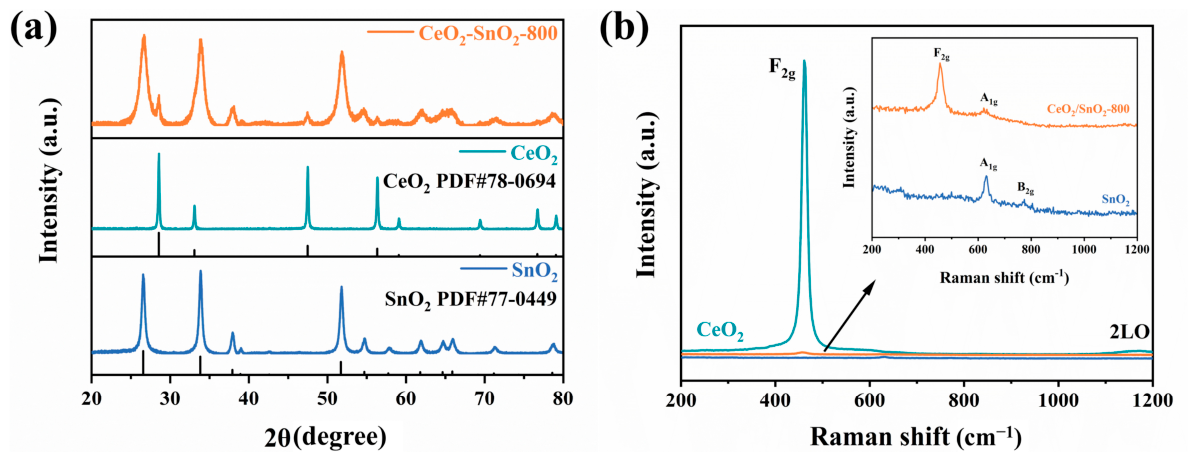
The composition and crystal structure of the heterostructure were analyzed using XRD and Raman characterization. For the convenience of subsequent comparative studies, pure SnO2 (Figure S4a) and CeO2 (Figure S4b) samples were synthesized via the solvothermal method. As shown in Figure 4a, both pure SnO2 and CeO2 exhibit sharp diffraction peaks that perfectly match those of tetragonal SnO2 (PDF#77-0449) and cubic CeO2 (PDF#78-0694), respectively. The CeO2/SnO2 heterostructure displays diffraction peaks corresponding to SnO2 and CeO2, with no additional impurity peaks observed. Figure 4b shows Raman spectra of the three samples. The SnO2 sample exhibits two vibrational modes at 632 cm−1 and 772 cm−1, assigned to the A1g and B2g modes of SnO2, respectively. The CeO2 shows two vibrational modes at 462 cm−1 and 1171 cm−1, corresponding to the F2g and 2LO modes of CeO2, respectively [19,20]. The CeO2/SnO2 sample contains the A1g mode belonging to SnO2 and the F2g mode belonging to CeO2. Moreover, the F2g and A1g modes in the CeO2/SnO2 heterostructure shift toward lower wavenumbers, which may be related to the redistribution of electrons at the heterojunction interface and the local distortion of the crystal lattice. This indicates the existence of interface electron coupling between CeO2 and SnO2.
Figure 4.
(a) XRD patterns and (b) Raman spectra of SnO2, CeO2, and CeO2/SnO2-800 samples.
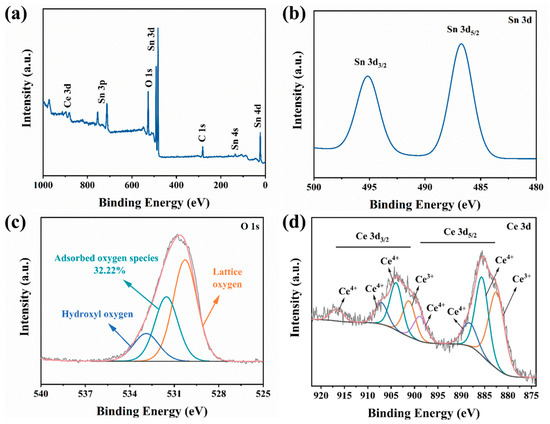
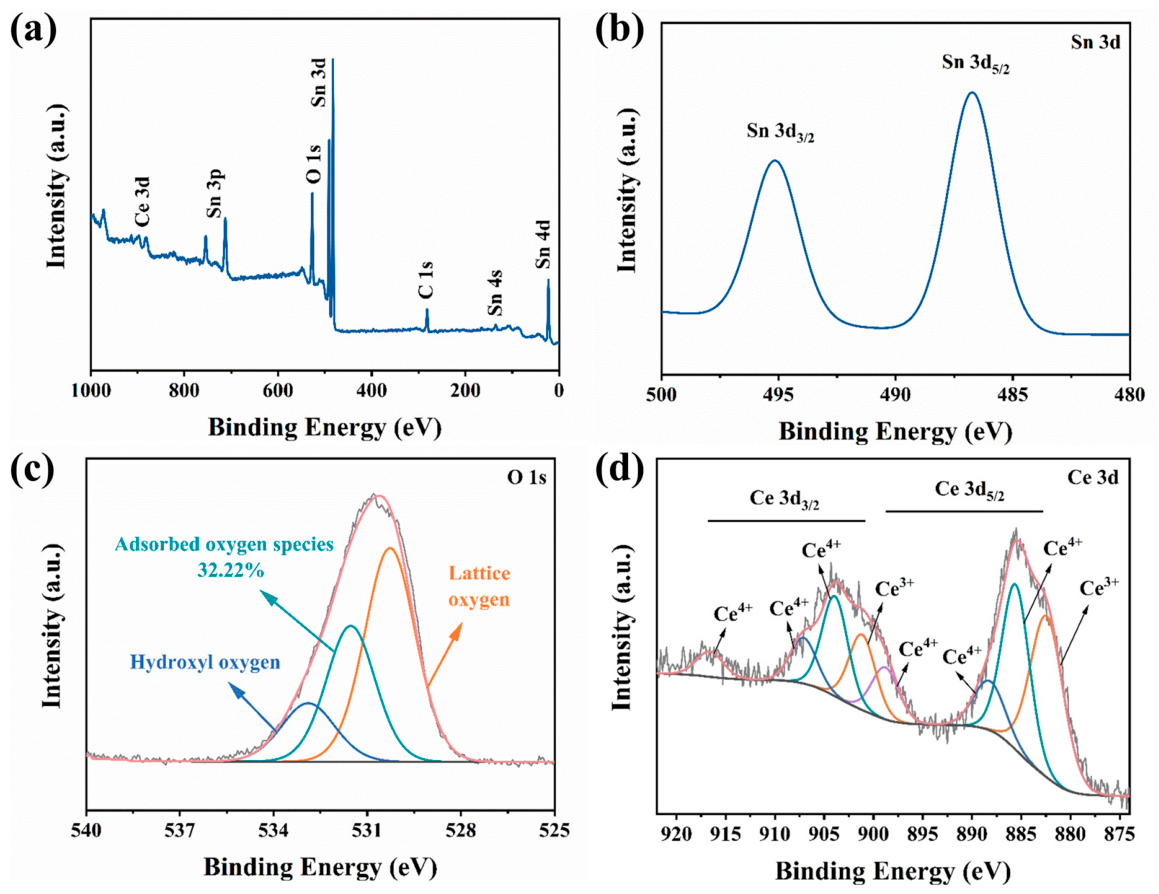
The XPS characterization was employed to investigate the chemical composition, element valence states, and bonding conditions in the heterostructure. As shown in the XPS survey spectrum (Figure 5a), signals of Sn, Ce, and O elements are clearly observed, confirming the coexistence of SnO2 and CeO2 phases within the heterostructure. Figure 5b presents the high-resolution Sn 3d spectrum, where peaks at low (486.7 eV) and high binding energy (495.1 eV) separately correspond to Sn d5/2 and Sn 3d3/2, which are typical characteristic peaks of Sn4+ in SnO2. The high-resolution O 1s spectrum (Figure 5c) reveals three distinct peaks at 530.3, 531.5, and 532.9 eV, which can be assigned to lattice oxygen, surface-adsorbed oxygen species, and hydroxyl oxygen, respectively [21,22]. Figure 5d shows the high-resolution Ce 3d spectrum, which can be fitted into eight characteristic peaks located at 882.4, 885.6, 888.2, 898.8, 901.2, 903.9, 907.1, and 916.6 eV. Among them, the peaks at 882.4 eV (Ce 3d5/2) and 901.2 eV (Ce 3d3/2) belong to Ce3+, while the remaining peaks are attributed to Ce4+, indicating the coexistence of Ce3+ and Ce4+ in the heterostructure [23,24]. The presence of Ce3+ suggests a certain level of oxygen vacancy defects in the material. Collectively, these morphological and structural characterization results confirm the successful synthesis of the CeO2/SnO2 heterostructure.
Figure 5.
XPS spectra of CeO2/SnO2-800 sample: (a) full spectra, (b) Sn 3d, (c) O 1s, and (d) Ce 3d.
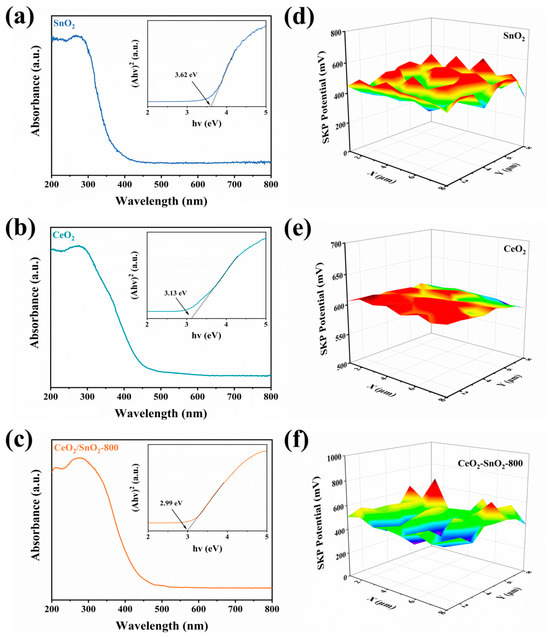
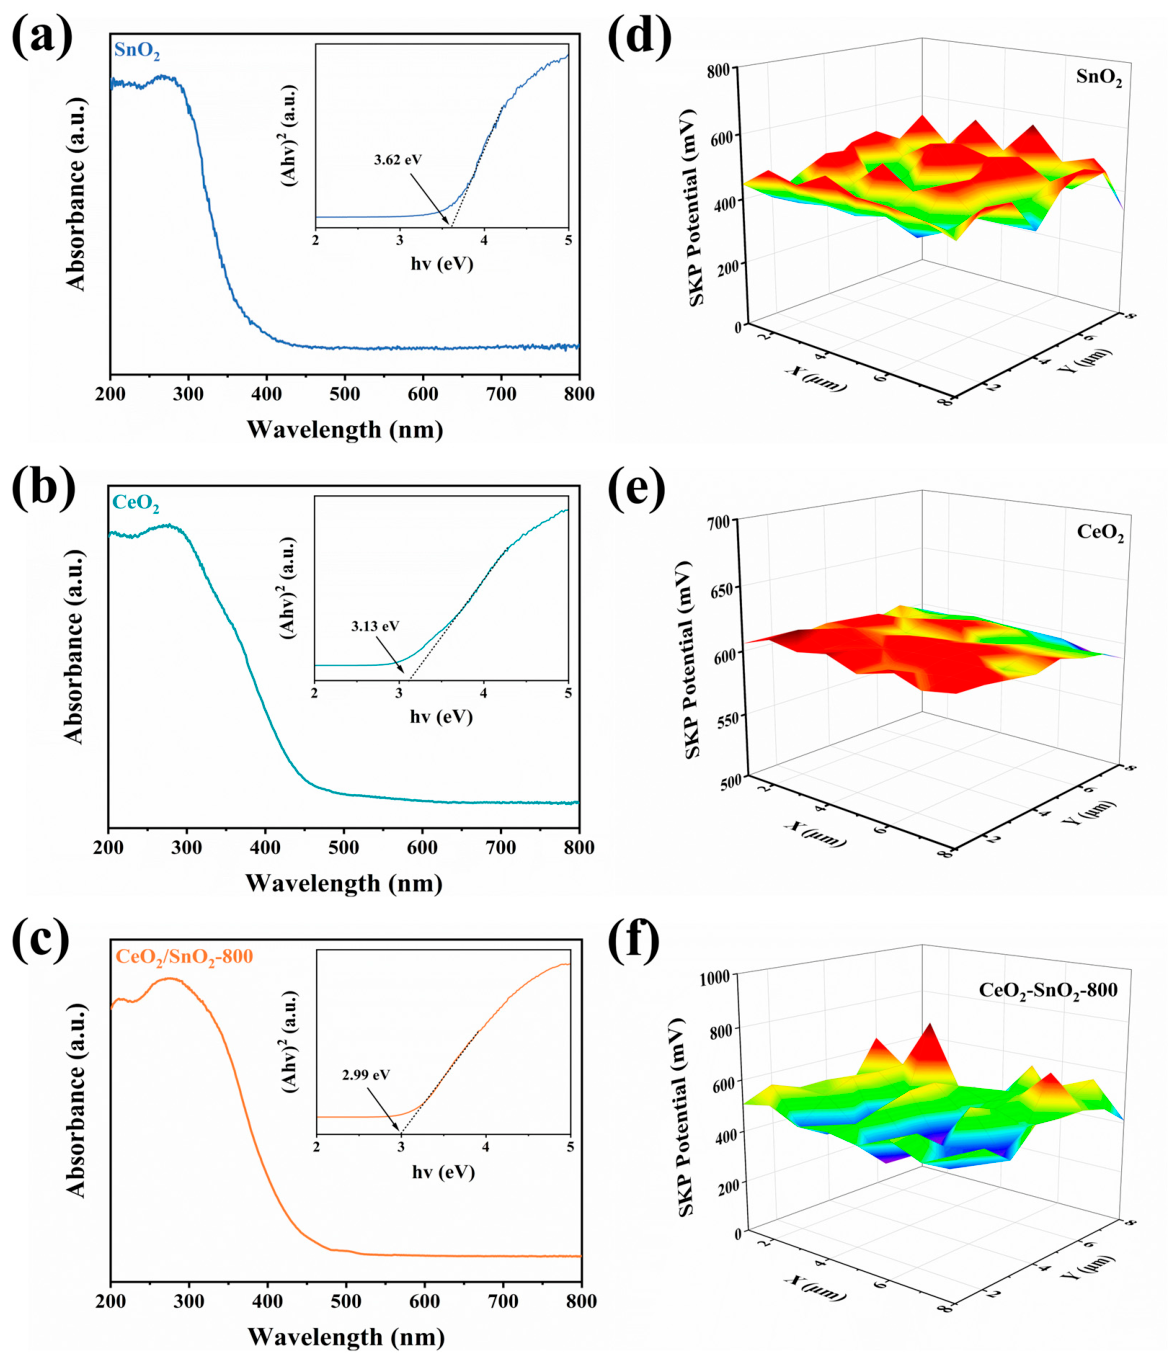
The influence of CeO2 on the electrical properties of the CeO2/SnO2 heterostructure was further investigated. Figure 6a–c show the UV absorption spectra and corresponding bandgap values of SnO2, CeO2, and CeO2/SnO2-800 samples. Based on characterization results, the calculated bandgap values for the three samples are 3.62, 3.13 and 2.99 eV, respectively. The reduced bandgap of CeO2/SnO2-800 is attributed to the formation of a heterostructure. A smaller bandgap might facilitate electron transitions from the valence band to the conduction band, thereby enhancing the electronic transport dynamics of the sensing material. Figure 6d–f presents the Kelvin probe characterization results for the three samples, with calculated work functions of 5.80, 5.94, and 5.82 eV, respectively. According to this result, when the CeO2/SnO2 heterostructure is formed, electrons will spontaneously transfer from SnO2 to CeO2 until the Fermi levels reach equilibrium. This process reduces the electron concentration of SnO2 and alters the electrical conductivity of the CeO2/SnO2 heterostructure, thereby affecting the sensing performance. The N2 adsorption–desorption isotherms and pore size distribution of SnO2, CeO2, and the CeO2/SnO2-800 sample are shown in Figure S5. The average pore diameters of the three samples are 20.3, 12.6, and 24.2 nm, respectively, indicating that all the samples have a mesoporous structure. It is worth noting that, compared to SnO2 (19.41 cm2/g) and CeO2 (10.22 cm2/g), CeO2/SnO2-800 has the largest specific surface area (38.04 cm2/g), which is conducive to the adsorption and diffusion of gas molecules, thereby enhancing the sensing response.
Figure 6.
(a–c) UV-Vis absorption spectra and (d–f) Kelvin probe contact potentials of SnO2, CeO2 and CeO2/SnO2-800 samples.
3.2. Gas-Sensing Performance
Taking SnO2, CeO2 and CeO2/SnO2 heterostructures as sensitive materials, their room-temperature NH3 sensing characteristics were first compared and evaluated to determine the optimal calcination temperature. All sensing responses in this work were recorded at a fixed 100 s gas exposure instead of the equilibrium state in order to ensure consistency in the comparison of all samples. Figure S6 shows the response/recovery curves of six sensors (SnO2, CeO2/SnO2-600, CeO2/SnO2-700, CeO2/SnO2-800, CeO2/SnO2-900, and CeO2) toward 50 ppm NH3 gas. As observed, pure SnO2 and CeO2 sensors exhibit weak responses to NH3 at room temperature. In contrast, when CeO2 is combined with SnO2, the sensing performance of the heterostructure is significantly enhanced. Among them, the CeO2/SnO2-800 sensor demonstrates the optimal performance, showing a substantially improved response of 6.5 toward 50 ppm NH3, with a response/recovery time of 70/450 s (Figure S7).
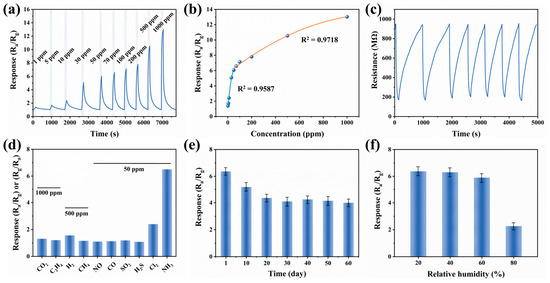
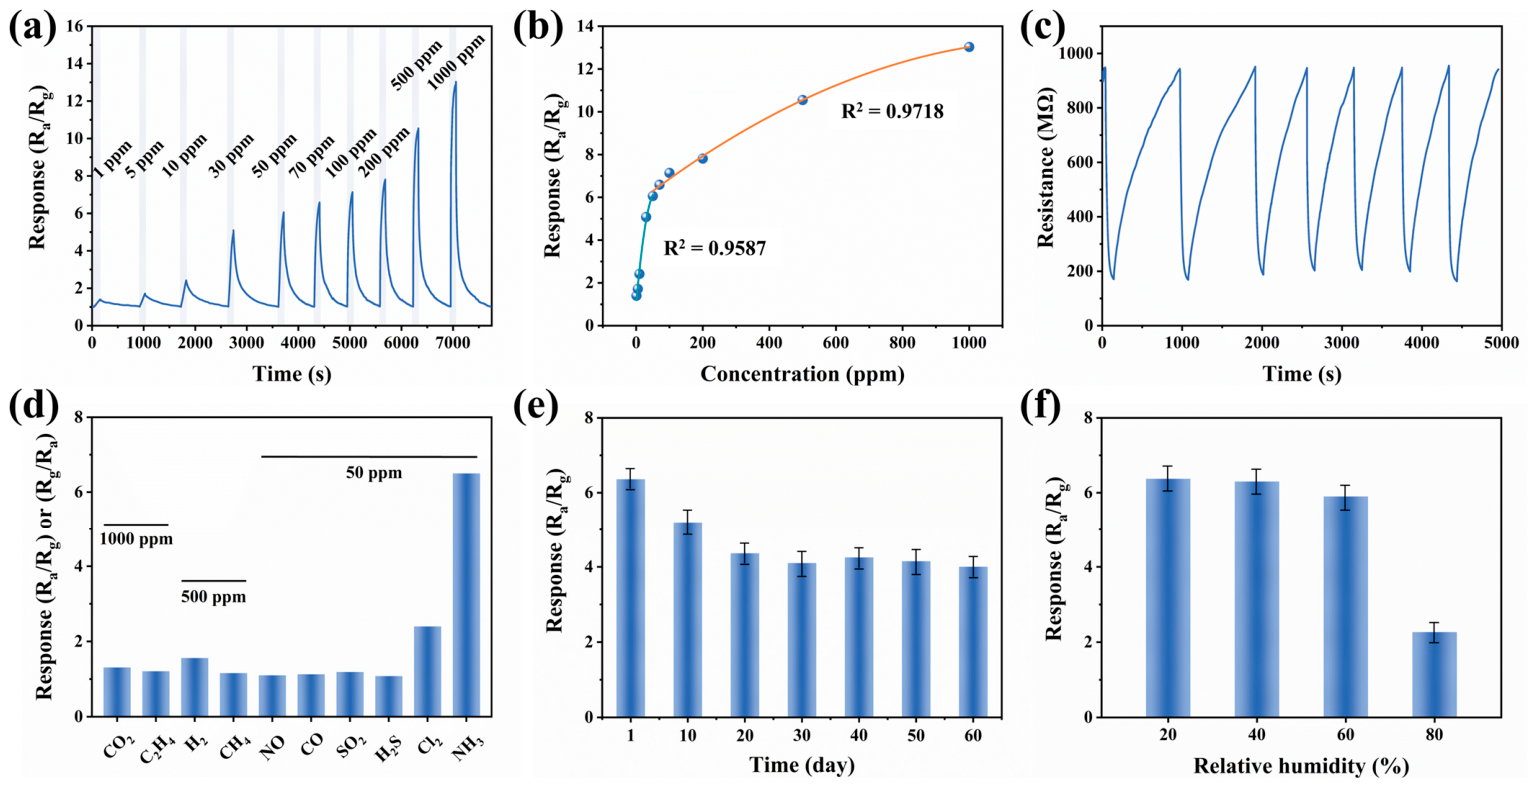
To further study the sensing characteristics of the optimal sample CeO2/SnO2-800, its dynamic response/recovery curves to 1–1000 ppm NH3 were tested. As shown in Figure 7a, with the increase in NH3 gas concentration, the response of the sensor gradually increases. Additionally, it can be observed that the resistance of the sensor could recover to the initial state after each response to NH3, and the response value to 1000 ppm NH3 reached 13, with the lowest experimentally tested concentration of 1 ppm. Figure 7b shows the linear relationship between the responses of the CeO2/SnO2-800 sensor and gas concentration. Within the range of 1–50 ppm, the linear fitting equation between the response value and the gas concentration is y = 0.101x + 1.411 (R2 = 0.9587), and for the range of 50–1000 ppm, it is y = 0.007x + 6.236 (R2 = 0.9718). The result implies that the sensor has the capability to be calibrated. Figure 7c shows the response/recovery test curves of the sensor to 50 ppm NH3 gas for seven consecutive times at room temperature. After multiple cycles of testing, the responses of the sensor do not show significant attenuation, remaining with better response/recovery characteristics.
Figure 7.
Sensing properties of CeO2/SnO2-800 sensor at room temperature: (a) response/recovery curve to 1–1000 ppm of NH3, (b) fitting relationship, (c) reproducibility, (d) selectivity, (e) long-term stability and (f) humidity resistance.
Selectivity is a crucial parameter for evaluating whether a gas sensor can operate effectively in complex environments. As shown in Figure 7d, the responses of the CeO2/SnO2-800 sensor to several test gases (1000 ppm CO2, 500 ppm CH4, 50 ppm CO, H2S, etc.) at room temperature were investigated. Obviously, the response of the sensor to 50 ppm NH3 is much higher than that of other gases, demonstrating extremely excellent selectivity. As illustrated in Figure 7e, the long-term stability of the CeO2/SnO2-800 sensor was further evaluated. The same sensor was tested every 10 days under environmental conditions of 25 °C and 40% relative humidity, and its response to 50 ppm NH3 was recorded. The response value of the sensor decreased from 6.5 to 4 in the first 30 days. This might be due to the presence of residual adsorbed species on the surface of the sensing material. After that, the surface state became stable and the response value no longer showed significant decay. In practical applications, environmental humidity constantly fluctuates, and moisture in the air may adversely affect the sensing performance of the sensor. Therefore, its humidity resistance was further assessed. Figure 7f shows the response values of the sensor to 50 ppm NH3 under different environmental humidity conditions. As illustrated, the sensor response is almost the same at 20–60% humidity, but significantly drops after the humidity reaches 80%. This is due to the fact that water molecules could occupy a large number of catalytic active sites on the surface of the sensing material at high humidity. To comprehensively estimate the NH3 sensing performance obtained herein, the sensing characteristics of CeO2/SnO2 and other reported SnO2-based sensors are summarized in Table 1. Compared to a higher working temperature, the flower-like CeO2/SnO2 heterostructures realized room-temperature ppm-level NH3 detection. In the room-temperature SnO2-based sensor, the response value is relatively high, indicating its promising application prospects.
Table 1.
Comparison of sensing performance between CeO2/SnO2 heterostructures in this work and other reported SnO2-based sensors for NH3 sensing.
3.3. Gas-Sensing Mechanism
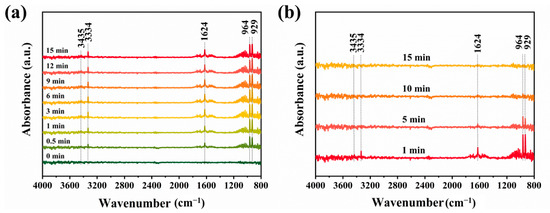
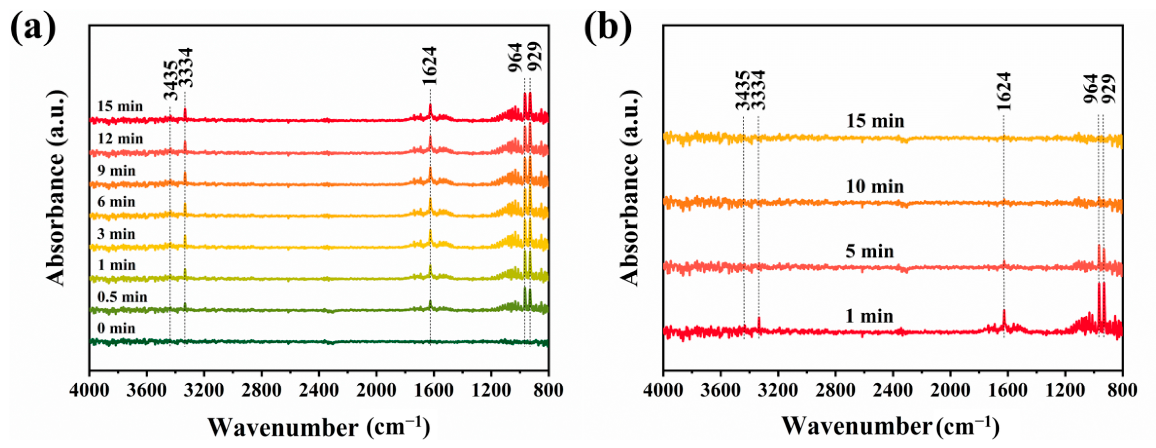
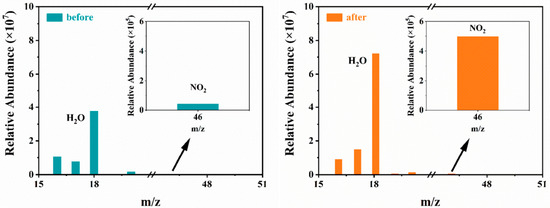
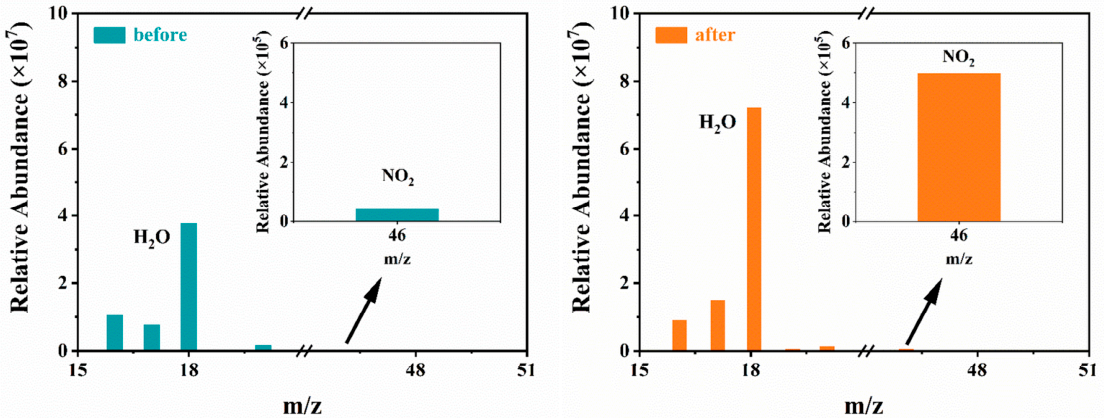
It is well known that the sensing mechanism of metal oxide semiconductors is based on changes in resistance caused by the adsorption and desorption of gas molecules on the material surface [31,32,33]. XPS analysis was employed to investigate the reaction process between the CeO2/SnO2-800 heterostructure and NH3 molecules. Figure S8 shows the high-resolution O 1s XPS spectrum of the sensing material after exposure to NH3. Compared with the spectrum before gas exposure (Figure 5c), the content of surface-adsorbed oxygen species decreases, indicating the reaction between NH3 molecules and the surface of the sensing material. In situ FT-IR characterization and GC-MS analysis were further used to explore the adsorption and interaction processes of NH3 on the material surface. As shown in Figure 8a, characteristic peaks corresponding to NH3 appear at 929 cm−1, 964 cm−1, and 3334 cm−1 after NH3 adsorption; a peak assigned to NO2 emerges at 1624 cm−1, and a weak O-H peak appears at 3435 cm−1, suggesting the formation of NO2 and H2O during the reaction [34,35]. All characteristic peaks intensify with increasing reaction time. Figure 8b reveals that the intensities of all product peaks gradually decrease and disappear as desorption time increases, indicating complete desorption of reaction products, which is consistent with the response/recovery behavior of the CeO2/SnO2-800 heterostructure toward NH3 gas. In Figure 9, compared with the blank background before the reaction, the content of H2O in the material increased after it came into contact with NH3, indicating that the material reacted with NH3 to form H2O. Additionally, the content of NO2 also increased after the reaction, suggesting that NO2 was also produced simultaneously.
Figure 8.
In situ FT-IR spectrum of CeO2/SnO2-800 sample: (a) adsorbed NH3; (b) desorbed NH3.
Figure 9.
GC-MS spectra of gases produced by the reaction between CeO2/SnO2 and NH3.
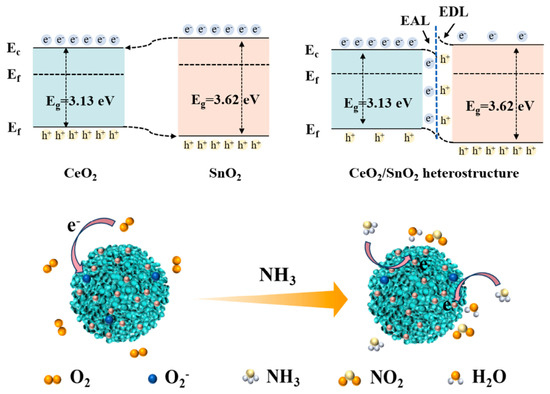
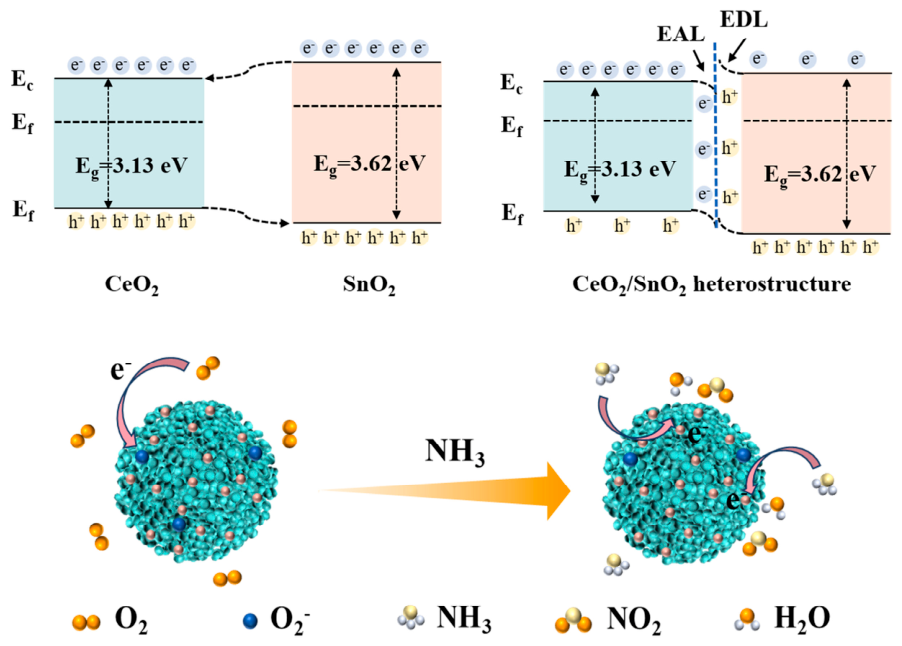
Based on the above characterization, the NH3 sensing mechanism of CeO2/SnO2 can be summarized as follows. When the material was exposed to air at room temperature, O2 molecules were adsorbed onto the surface, forming surface-adsorbed oxygen species (O2−), which capture electrons from the surface of the material. When the sensing material came into contact with the reducing gas, NH3 molecules would react with O2− species to generate NO2 and H2O. The electrons produced during this process return to the conduction band of the material, thereby reducing the sensor resistance and generating a sensing response. The reaction equation is as follows:
O2(gas) → O2(ads)
O2(ads) + e− → O2−(ads) (<100 °C)
4NH3 + 7O2− → 4NO2 + 6H2O + 7e−
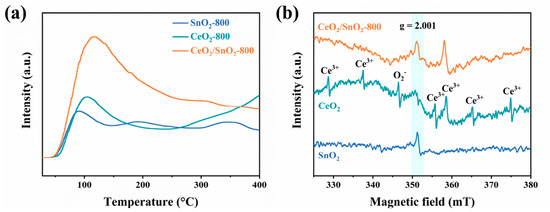
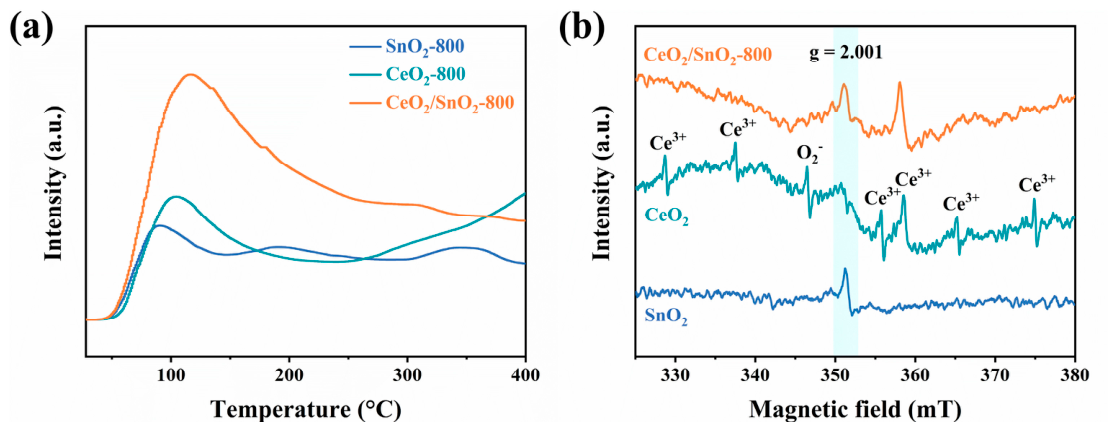
The reasons for the improvement of the NH3 sensing performance of CeO2/SnO2 s heterogeneous structures have been further investigated. The O2 adsorption/desorption behaviors of SnO2, CeO2, and CeO2/SnO2 samples were investigated using TPD. As shown in Figure 10a, the CeO2/SnO2-800 sample exhibits the strongest desorption peak at low temperatures, indicating abundant active sites and adsorbed oxygen species, which can enhance the catalytic activity of the material [36]. Generally, oxygen vacancies act as catalytic active sites, promoting oxygen adsorption and generating more reactive oxygen species, thereby improving the sensing performance. Figure 10b displays the EPR spectra of the three samples. The CeO2/SnO2-800 heterostructure exhibits a signal peak belonging to oxygen vacancies at g = 2.001 [37]. In addition, there are Ce3+ active sites related to oxygen vacancies in the heterostructure. The increase in the intensity of the signal peak is ascribed to the formation of the heterostructure, which leads to the transfer of electrons from SnO2 to CeO2, converting Ce4+ into more Ce3+, accompanied by the generation of oxygen vacancies.
Figure 10.
(a) O2-TPD curves and (b) EPR spectra of SnO2, CeO2 and CeO2/SnO2-800 samples.
The band structure and schematic of the sensing mechanism for the CeO2/SnO2 heterostructure are presented in Figure 11. According to gas-sensing performance tests, pure SnO2 exhibits almost no response to NH3 at room temperature. However, when CeO2 is introduced, the sensing performance is significantly enhanced, which can be attributed to the formation of an n-n heterojunction between CeO2 and SnO2. Based on Kelvin probe characterization results, during the formation of the heterojunction, electrons transfer from SnO2 to CeO2, creating an electron-depleted layer at the SnO2 interface and an electron-accumulated layer at the CeO2 interface. This electron transfer increases the resistance of SnO2, thereby generating a larger resistance modulation during sensing. After being in contact with the target gas, the NH3 molecules adsorbed on CeO2/SnO2 will react with the O2- species to release electrons, resulting in a significant reduction in the resistance of the heterostructure and thereby significantly improving the sensing response.
Figure 11.
Schematic diagram of energy band structure and gas-sensing mechanism of CeO2/SnO2.
4. Conclusions
In this work, flower-like CeO2/SnO2 heterostructures with different calcination temperatures are successfully synthesized via the solvothermal method combined with calcination treatment. The room-temperature gas-sensing measurements show that CeO2 modification drastically enhances the NH3 response of SnO2, and the sample calcined at 800 °C achieves optimal sensing performance. This sensor achieves actual experimental detection of 1 ppm NH3 and presents good selectivity, excellent long-term stability over 60 days, and stable sensing behavior under moderate humidity conditions. The characterization results such as XPS, O2-TPD, and EPR indicate that these improvements in sensing performance are attributed to the synergistic effect of n-n heterojunctions and abundant oxygen vacancies. The as-fabricated CeO2/SnO2 heterostructure effectively overcomes the poor room-temperature sensing limitation of pristine SnO2, showing promising application prospects in low-power NH3 leakage monitoring.
Supplementary Materials
The following supporting information can be downloaded at: https://www.mdpi.com/article/10.3390/chemosensors14090207/s1; Figure S1. The schematic diagram of sensor test platform. Figure S2. TG curve of the precursor. Figure S3. XRD patterns of CeO2/SnO2 samples. Figure S4. SEM images of (a) SnO2 and (b) CeO2 samples. Figure S5. The N2 adsorption-desorption isotherms and pore size distribution of (a) SnO2, (b) CeO2, and (c) CeO2/SnO2-800 sample. Figure S6. Response/recovery curves of SnO2, CeO2, and SnO2/CeO2 sensors toward 50 ppm NH3 at room temperature. Figure S7. The recover time of SnO2/CeO2 sensor toward 50 ppm NH3. Figure S8. XPS spectra of CeO2/SnO2-800 sample after exposure to NH3.
Author Contributions
T.W.: Data curation, formal analysis, conceptualization, writing—review and editing, and funding acquisition. B.X.: Conceptualization, data curation, investigation, and writing—original draft. Y.X.: Funding acquisition, supervision, and writing—review and editing. All authors have read and agreed to the published version of the manuscript.
Funding
This research was funded by the National Natural Science Foundation of China (52402180) and China Postdoctoral Science Foundation-funded project (2024 M750844).
Institutional Review Board Statement
Not applicable.
Informed Consent Statement
Not applicable.
Data Availability Statement
The data can be obtained from the corresponding author.
Conflicts of Interest
Author Tingting Wang is employed by Zhejiang Fomay Technology Co., Ltd. The remaining authors declare that the research was conducted in the absence of any commercial or financial relationships that could be construed as potential conflicts of interest.
References
- Timmer, B.; Olthuis, W.; Berg, A. van den Ammonia Sensors and Their Applications—A Review. Sens. Actuators B Chem. 2005, 107, 666–677. [Google Scholar]
- Zhang, Y.; Zhao, M.; Tan, C.; Zhang, Z.; Ouyang, Y.; Yang, L.; Sun, Q.; Wang, W.; Wang, Z.; Dong, M. Emerging NH3 MEMS-Sensing Techniques and Application. Adv. Mater. Technol. 2025, 10, e00474. [Google Scholar] [CrossRef] [Scilit]
- Huang, J.; Wu, H.; Su, Z. Ultra-High Performance Fibrous Ammonia Sensor with Full Degradability. ACS Sens. 2025, 10, 3921–3930. [Google Scholar] [CrossRef] [Scilit] [PubMed]
- Lakshmi, P.R.; Mohan, B.; Kang, P.; Nanjan, P.; Shanmugaraju, S. Recent Advances in Fluorescence Chemosensors for Ammonia Sensing in the Solution and Vapor Phases. Chem. Commun. 2023, 59, 1728–1743. [Google Scholar] [CrossRef] [Scilit] [PubMed]
- Zhang, L.; Lei, X.; Sun, H.; Wang, D.; Chen, B.; Ma, F.; Ai, T.; Chu, P.K. Enhanced NH3 Sensing Performance of Ti3C2Tx MXene Decorated with Flowered MoS2. J. Alloys Compd. 2025, 1037, 182542. [Google Scholar] [CrossRef] [Scilit]
- Wang, S.; Xie, G.; Tai, H.; Su, Y.; Yang, B.; Zhang, Q.; Du, X.; Jiang, Y. Ultrasensitive Flexible Self-Powered Ammonia Sensor Based on Triboelectric Nanogenerator at Room Temperature. Nano Energy 2018, 51, 231–240. [Google Scholar] [CrossRef] [Scilit]
- Paul, R.; Maity, N.; Das, B.; Rani, S.; Ghosh, K.; Lisenkov, S.; Ponomareva, I.; Ghosh, R. Controllable Oxygen Vacancy Defect Engineering of BiVO4 Porous Structures for Room Temperature NH3 Detection. Chem. Eng. J. 2025, 515, 163814. [Google Scholar] [CrossRef] [Scilit]
- Wetchakun, K.; Samerjai, T.; Tamaekong, N.; Liewhiran, C.; Siriwong, C.; Kruefu, V.; Wisitsoraat, A.; Tuantranont, A.; Phanichphant, S. Semiconducting Metal Oxides as Sensors for Environmentally Hazardous Gases. Sens. Actuators B Chem. 2011, 160, 580–591. [Google Scholar] [CrossRef] [Scilit]
- Rumyantseva, M.; Gaskov, A.; Rosman, N.; Pagnier, T.; Morante, J. Raman Surface Vibration Modes in Nanocrystalline SnO2: Correlation with Gas Sensor Performances. Chem. Mater. 2005, 17, 893–901. [Google Scholar] [CrossRef] [Scilit]
- Wang, J.; Zhang, X.; Wang, G.; Li, D.; Yuan, C.; Hussain, S.; Zhai, X. SnO2-Based Gas Sensors for Detecting Food Quality-Related Gases: A Review. Inorg. Chem. Commun. 2026, 191, 117159. [Google Scholar] [CrossRef] [Scilit]
- Li, Z.; Li, H.; Wu, Z.; Wang, M.; Luo, J.; Torun, H.; Hu, P.; Yang, C.; Grundmann, M.; Liu, X.; et al. Advances in Designs and Mechanisms of Semiconducting Metal Oxide Nanostructures for High-Precision Gas Sensors Operated at Room Temperature. Mater. Horiz. 2019, 6, 470–506. [Google Scholar] [CrossRef] [Scilit]
- Reddy, B.K.S.; Borse, P.H. Review—Recent Material Advances and Their Mechanistic Approaches for Room Temperature Chemiresistive Gas Sensors. J. Electrochem. Soc. 2021, 168, 057521. [Google Scholar] [CrossRef] [Scilit]
- Jiang, X.; Zhen, Y.; Feng, Y.; Yang, Z.; Qin, Z. Synthesis of SnS2/SnO2 Nano-Heterojunctions with Increased Reactive Sites and Charge Transfer for Ultrasensitive NH3 Detection. J. Alloys Compd. 2023, 938, 168520. [Google Scholar] [CrossRef] [Scilit]
- Zhang, J.; Li, P.; Zhu, Z.; Sun, X.; Wang, Z.; Sun, F.; Zhou, H. SnO2/Nb2CTx MXene Composite Gas Sensor for NH3 Detection at Room Temperature. Ceram. Int. 2025, 51, 49349–49358. [Google Scholar] [CrossRef] [Scilit]
- Li, Y.; Chen, P.; Zeng, W.; Li, X.; Wang, Q. MOF-Derived Co3O4 Decorated SnO2 Nanosheets for NH3 Sensor Fabricated by Carrier Gas Regulation. Chem. Eng. J. 2025, 519, 165001. [Google Scholar] [CrossRef] [Scilit]
- Torkamani Cheriani, M.; Mirzaei, A.; Kim, J.-H. Resistive-Based Nanostructured CeO2 Gas Sensors: A Review. Chemosensors 2025, 13, 298. [Google Scholar] [CrossRef] [Scilit]
- Ma, X.; Zhang, H.; Chen, C. Preparation and Freshness Detection of Tofu Based on In-Doped CeO2 Ammonia Gas Sensor. Appl. Surf. Sci. 2024, 669, 160506. [Google Scholar] [CrossRef] [Scilit]
- Nagar, V.; Rathore, L.K.; Bera, A. Unbiased ZnFe2O4/CeO2 Nanostructured Heterojunctions for Light-Assisted Room Temperature Ammonia Sensing. ACS Appl. Nano Mater. 2026, 9, 12498–12508. [Google Scholar] [CrossRef] [Scilit]
- Yu, L.; Peng, R.; Chen, L.; Fu, M.; Wu, J.; Ye, D. Ag Supported on CeO2 with Different Morphologies for the Catalytic Oxidation of HCHO. Chem. Eng. J. 2018, 334, 2480–2487. [Google Scholar] [CrossRef] [Scilit]
- Rao, F.; An, Y.; Zhu, G.; Gong, S.; Zhu, L.; Lu, H.; Shi, X.; Huang, Y.; Zhang, F.; Hojamberdiev, M. Unveiling the Effects of Facet-Dependent Oxygen Vacancy on CeO2 for Electron Structure and Surface Intermediates in CO2 Photoreduction Reaction. Sep. Purif. Technol. 2024, 333, 125951. [Google Scholar] [CrossRef] [Scilit]
- Cui, Z.-Q.; Gao, R.; Chen, G.-L.; Shen, S.-K.; Deng, Z.-P.; Xu, Y.-M.; Huo, L.-H.; Gao, S. Biotemplate Synthesis of Graphitic Carbon-Doped ZnO Tube Bundles Rich in Oxygen Vacancies for Dual-Sensing of NO2/H2S at Different Temperatures. Chem. Eng. J. 2024, 495, 153345. [Google Scholar] [CrossRef] [Scilit]
- Tan, Y.; Zhang, J. Synergistic Effects in Bimetallic (Co, Mn)-Doped SnO2 Nanobelts for Greatly Enhanced Gas-Sensing Properties. ACS Appl. Mater. Interfaces 2023, 15, 51549–51557. [Google Scholar] [CrossRef] [Scilit] [PubMed]
- Claire, L.; Daniel, J.; Florent, Y.; Martin, C.; James, A.; John, L.; Karl, P.; Neil, C. Role of Microstructure and Surface Defects on the Dissolution Kinetics of CeO2, a UO2 Fuel Analogue. ACS Appl. Mater. Interfaces 2016, 8, 10562–10571. [Google Scholar] [CrossRef] [Scilit] [PubMed]
- Wang, D.; Tan, R.; Yu, H.; Chen, H.; Ma, X.; Zhao, H.; Kang, X.; Fang, H. High Response H2S Chemiresistive Gas Sensor Based on Multidimensional CuO/CeO2: The Application for Real-Time Portable Alarm Device. Sens. Actuators B Chem. 2025, 424, 136884. [Google Scholar] [CrossRef] [Scilit]
- Nguyen, P.; Tran, N.; Luu, T.; Nguyen, V.; Chu, T.; Tran, T.; Dang, T.; Chu, M.; Nguyen, D. Enhanced ammonia sensing using Pt-decorated single-crystalline SnO2 nanowires prepared by sputtering. RSC Adv. 2026, 16, 16694. [Google Scholar] [CrossRef] [Scilit] [PubMed]
- Li, Y.; Ban, H.; Yang, M. Highly sensitive NH3 gas sensors based on novel polypyrrole-coated SnO2 nanosheet nanocomposites. Sens. Actuators B 2016, 224, 449–457. [Google Scholar] [CrossRef] [Scilit]
- Sun, Y.; Huang, L.; Yan, J.; Wang, K.; Dong, Y.; Sun, S. Mechanically reliable PAN/PANI/SnO2 heterojunction nanofiber membranes for high-performance room-temperature NH3 sensing with humidity-modulated response. Appl. Surf. Sci. 2027, 751, 168177. [Google Scholar] [CrossRef] [Scilit]
- Han, Y.; Hao, S.; Liu, L.; Li, B.; Mu, Y.; Yang, M.; Zhang, J. Fabrication of high performance NH3 flexible sensor based on PANI/SnO2 hollow nanosphere composite. Microchim. Acta 2025, 192, 565. [Google Scholar] [CrossRef] [Scilit] [PubMed]
- Xu, Y.; Xie, J.; Zhang, Y.; Tian, F.; Yang, C.; Zheng, W.; Liu, X.; Zhang, J.; Pinna, N. Edge-enriched WS2 nanosheets on carbon nanofibers boosts NO2 detection at room temperature. J. Hazard. Mater. 2021, 412, 125181. [Google Scholar] [CrossRef] [Scilit] [PubMed]
- Shahabuddin, M.; Sharma, A.; Kumar, J.; Tomar, M.; Umarand, A.; Gupta, V. Metal clusters activated SnO2 thin film for low level detection of NH3 gas. Sens. Actuators B 2014, 194, 410–418. [Google Scholar] [CrossRef] [Scilit]
- Marikutsa, A.; Rumyantseva, M.; Konstantinova, E.A.; Gaskov, A. The Key Role of Active Sites in the Development of Selective Metal Oxide Sensor Materials. Sensors 2021, 21, 2554. [Google Scholar] [CrossRef] [Scilit] [PubMed]
- Ji, H.; Zeng, W.; Li, Y. Gas Sensing Mechanisms of Metal Oxide Semiconductors: A Focus Review. Nanoscale 2019, 11, 22664–22684. [Google Scholar] [CrossRef] [Scilit] [PubMed]
- Nasriddinov, A.; Zairov, R.; Rumyantseva, M. Light-activated semiconductor gas sensors: Pathways to improve sensitivity and reduce energy consumption. Front. Chem. 2025, 13, 1538217. [Google Scholar] [CrossRef] [Scilit] [PubMed]
- Guang, Q.; Sun, S.; Huang, B.; Zhang, J.; Wang, N.; Li, X. Microjunction-Modulated Selective Ammonia Sensor with P-Type Oxides-Decorated WS2 Microflakes. ACS Appl. Mater. Interfaces 2024, 16, 7565–7575. [Google Scholar] [CrossRef] [Scilit] [PubMed]
- Wang, P.; Tang, C.; Song, H.; Zhang, L.; Lu, Y.; Huang, F. 1D/2D Heterostructured WS2@PANI Composite for Highly Sensitive, Flexible, and Room Temperature Ammonia Gas Sensor. ACS Appl. Mater. Interfaces 2024, 16, 14082–14092. [Google Scholar] [CrossRef] [Scilit] [PubMed]
- Xing, B.; Cheng, X.; Wang, T.; Zhang, X.; Huo, L.; Xu, Y. Oxygen Vacancies Enabled Hierarchical SnO2 for Highly Sensitive Cl2 Detection at Room Temperature. Sens. Actuators B Chem. 2025, 442, 138105. [Google Scholar] [CrossRef] [Scilit]
- Wu, H.; Wang, J.; Chen, R.; Yuan, C.; Zhang, J.; Zhang, Y.; Sheng, J.; Dong, F. Zn-Doping Mediated Formation of Oxygen Vacancies in SnO2 with Unique Electronic Structure for Efficient and Stable Photocatalytic Toluene Degradation. Chin. J. Catal. 2021, 42, 1195–1204. [Google Scholar] [CrossRef] [Scilit]

Disclaimer/Publisher’s Note: The statements, opinions and data contained in all publications are solely those of the individual author(s) and contributor(s) and not of MDPI and/or the editor(s). MDPI and/or the editor(s) disclaim responsibility for any injury to people or property resulting from any ideas, methods, instructions or products referred to in the content. |
© 2026 by the authors. Licensee MDPI, Basel, Switzerland. This article is an open access article distributed under the terms and conditions of the Creative Commons Attribution (CC BY) license.