


Abstract
A red-emissive, derivatization-assisted aptasensor was developed for acrylamide analysis in food. Acrylamide was first converted into the xanthydrol–acrylamide adduct (XAA), which was recognized by the DNA aptamer AptXAA. A π-conjugation-extended thioflavin T analogue, ThT-Red, was synthesized as the fluorescent signal molecule. ThT-Red exhibited an emission maximum at 600 nm and showed enhanced fluorescence upon binding to AptXAA, attributable to restricted intramolecular motion. XAA binding perturbed the ThT-Red–AptXAA interaction, producing a concentration-dependent fluorescence decrease consistent with competitive displacement. Following a 30 min xanthydrol derivatization step, the fluorescence sensing response was obtained within 3 min. Under optimized conditions, the sensor showed a linear response to XAA over 0–2.5 μM, with a limit of detection of 0.23 μM. Recoveries of 90.14–119.72% were obtained in spiked potato-chip extracts. The sensing response was also measurable using a portable fluorometer, supporting its potential for rapid on-site analysis. This work demonstrates that structural engineering of an aptamer-responsive molecular rotor can provide an effective red-fluorescence transduction strategy for derivatization-assisted detection of low-epitope food contaminants.
1. Introduction
Acrylamide is a heat-induced food-processing contaminant formed predominantly through Maillard-type reactions in carbohydrate-rich foods, including potato products, baked foods, and coffee. Its widespread occurrence and toxicological concerns have created a continuing need for analytical methods that can support both laboratory confirmation and rapid screening [1,2,3]. Chromatographic methods, particularly liquid or gas chromatography coupled with mass spectrometry, provide reliable quantification but generally require centralized instrumentation, trained personnel, and multistep sample preparation [4]. Nonchromatographic alternatives include derivatization-dependent enzyme-linked and chemiluminescence immunoassays, nanobody-based immunoassays, electrochemical formats, and optical/colorimetric sensors [5,6,7,8,9]. These approaches can reduce instrument demands, but their performance remains linked to recognition-element design, derivatization chemistry, matrix control, and readout standardization; they complement rather than replace confirmatory instrumental analysis.
Aptamers are attractive recognition elements for portable sensing because they are chemically synthesized, readily modified, and compatible with diverse optical transduction mechanisms [10,11]. Direct selection against low-epitope acrylamide is difficult: the original study reported a 4.7 mM dissociation constant for a direct acrylamide aptamer by strand displacement. Covalent reaction of acrylamide with xanthydrol generated the more structurally complex adduct XAA, and the selected XAA-1 aptamer (AptXAA) reached a 20 nM dissociation constant with a 4.2 nM adduct-detection limit [12]. Thus, that work established high-affinity recognition rather than an analytically inadequate aptamer. Other acrylamide aptasensors, including smartphone-assisted colorimetric systems and our preceding portable near-infrared platform, have also been reported [9,13].
Fluorogenic dyes that become emissive after binding structured nucleic acids offer a label-free route to couple aptamer recognition with optical readout [14,15]. Thioflavin T (ThT) is widely used as a nucleic-acid-responsive molecular rotor because its fluorescence is enhanced when intramolecular motion is restricted by a structured binding environment [16]. Nevertheless, conventional ThT emits in the blue region, whereas thermally processed foods can contain fluorescent Maillard products and suspended or co-extracted matrix components that complicate short-wavelength fluorescence measurements [17]. Extending the π-conjugated system of a ThT-like scaffold is therefore a rational strategy to obtain longer-wavelength emission while retaining environment-sensitive fluorescence. Donor–π–acceptor fluorophores and molecular rotors are particularly suitable for this purpose because their excited-state relaxation is strongly affected by conformational freedom, local polarity, and intermolecular binding [18,19,20].
In our preceding work, a molecular-library-screened near-infrared dye was combined with AptXAA and a portable fluorometer for derivatization-assisted acrylamide analysis [13]. The present study addresses a different design question: whether a π-conjugation-extended ThT analogue can serve as an effective red-emissive signal molecule for the established AptXAA/XAA recognition system. The fluorophore used here was previously synthesized and characterized by our group as ThT-π-NM in a Cu2+ aptasensing study [21]. In the present work, it is referred to as ThT-Red to emphasize its red-emissive function in the AptXAA sensing system. Structurally, the analogue contains a vinyl bridge between the dimethylaminophenyl and benzothiazolium units, extending the π-conjugated framework relative to conventional ThT. Its interaction with AptXAA, fluorescence activation mechanism, competitive response to XAA, analytical performance, selectivity, behavior in potato-chip extracts, and compatibility with a portable fluorometer were systematically evaluated. The contribution of this work therefore lies in applying and mechanistically evaluating this red-emissive ThT analogue as a signal transducer for derivatization-assisted XAA recognition and portable acrylamide analysis.
2. Experiment
2.1. Chemicals, Materials and Instruments
Acrylamide, xanthydrol, methanol, n-hexane, anhydrous dimethyl sulfoxide (DMSO), acetonitrile, 4-(dimethylamino)benzaldehyde, 2-methylbenzothiazole, methyl iodide, glycerol, HEPES, sodium chloride, magnesium chloride, glacial acetic acid, ethanol, hydrochloric acid, sodium hydroxide, DMSO-d6, glycine, L-alanine, acrylic acid, isopropyl acetate, propionic acid, sucrose, and silica gel were purchased from Sinopharm Chemical Reagent Co., Ltd. (Shanghai, China) and were used as received unless otherwise specified.. The HEPES working buffer contained 20 mM HEPES, 100 mM NaCl, and 10 mM MgCl2 and was adjusted to pH 7.4 before use. Unless otherwise specified, fluorescence and absorption measurements were conducted under these nominal buffer conditions. Fluorescence and UV–Vis absorption spectra were acquired using a Spark 10M multimode microplate reader (Tecan Group Ltd., Männedorf, Switzerland). Portable fluorescence measurements were performed using a Fluo-200 fluorometer (Hangzhou Allsheng Instruments Co., Ltd., Hangzhou, China). 1H and 13C NMR spectra were recorded on a Bruker AVANCE NEO 400 MHz NMR spectrometer (Bruker BioSpin GmbH & Co. KG, Ettlingen, Germany).
2.2. Aptamer Preparation and XAA Formation
The XAA-binding DNA aptamer AptXAA (XAA-1) was synthesized and purified by Sangon Biotech (Shanghai) Co., Ltd. (Shanghai, China). The full sequence reported in the original aptamer study was 5′-GACGACGTAGGTGTGGATGGCTTTGAAAAAGGGCTAGTCGTC-3′. The lyophilized oligonucleotide was dissolved in ultrapure water to 100 µM, heated at 95 °C for 10 min, and slowly cooled to room temperature before storage at 4 °C.
For preparation of an XAA reference standard, acrylamide (2 mmol, 142.16 mg) and xanthydrol (1 mmol, 198.22 mg) were dissolved in glacial acetic acid and reacted at 40 °C for 30 min. The product was isolated via crystallization, filtration, washing with water, and vacuum drying. For food analysis, acrylamide was derivatized with xanthydrol in the diluted sample extract before aptasensor measurement. The identity of the isolated XAA reference standard was characterized by 1H NMR, 13C NMR, and high-resolution mass spectrometry (Figures S3–S5). High-resolution mass spectra were acquired using an Agilent quadrupole time-of-flight mass spectrometer (Agilent Technologies, Santa Clara, CA, USA) equipped with an electrospray ionization source.
2.3. Synthesis of ThT-Red
4-(Dimethylamino)benzaldehyde (1.49 g, 10.0 mmol) and 2-methylbenzothiazole (2.24 g, 15.0 mmol) were dissolved in ethanol (50 mL) and refluxed for 24 h. After cooling to room temperature, the precipitated product was collected by filtration, washed with ice-cold ethanol, and dried under vacuum to afford the deep-red intermediate NM-1, which was used without further purification (Figure S1).
NM-1 (1.40 g, 5.0 mmol) and methyl iodide (14.19 g, 100.0 mmol) were dissolved in acetonitrile (50 mL) and refluxed at 80 °C for 12 h. After removal of the solvent under reduced pressure, the crude product was purified via silica-gel column chromatography to yield ThT-Red as a deep-red solid (1.14 g, 54%) (Figure S2). 1H NMR (400 MHz, DMSO-d6) δ 8.29–8.24 (m, 1H), 8.09–8.02 (m, 1H), 7.99 (s, 1H), 7.87 (d, J = 9.0 Hz, 2H), 7.74 (ddd, J = 8.5, 7.3, 1.2 Hz, 1H), 7.68–7.54 (m, 2H), 6.78 (d, J = 9.0 Hz, 2H), 4.18 (s, 3H), 3.06 (s, 6H). 13C NMR (101 MHz, DMSO-d6) δ 171.84, 153.98, 150.62, 142.47, 133.36, 129.38, 127.95, 127.34, 124.34, 121.98, 116.47, 112.46, 106.79, 40.30, 40.14, 36.13. The structural characterization of ThT-Red was further supported by its 1H and 13C NMR spectra (Figures S6 and S7).
2.4. Fluorescence Binding Assay and Aptasensor Operation
ThT-Red was dissolved in anhydrous DMSO to prepare a 100 µM stock solution and stored at 4 °C in the dark. To evaluate the interaction between ThT-Red and AptXAA, ThT-Red (2.0 µM) was mixed with AptXAA at concentrations from 0 to 12 µM in HEPES buffer. After incubation at room temperature for 3 min, fluorescence spectra were recorded with excitation at 500 nm and emission monitored around 600 nm. The apparent dissociation constant (Kd) for the interaction between ThT-Red and AptXAA was obtained by nonlinear regression using a one-site saturation-binding model:
where is the fluorescence intensity at 600 nm, is the fluorescence intensity in the absence of AptXAA, is the AptXAA concentration, and represents the maximum fluorescence increase at saturation.
For XAA detection, ThT-Red (2.0 µM), AptXAA (1.5 µM), and XAA (0–100 µM) were mixed in HEPES buffer to a final volume of 200 µL. Following incubation, the fluorescence spectrum was recorded. The normalized response was expressed as F/F0, where F and F0 represent the fluorescence intensity at 600 nm in the presence and absence of XAA, respectively. Each condition was measured in triplicate.
2.5. UV–Vis Absorption and Viscosity-Response Measurements
For aptamer-binding absorption measurements, ThT-Red (6 µL, 100 µM) was mixed with AptXAA (0–12 µM) in HEPES buffer and incubated for 3 min at room temperature. An aliquot (90 µL) was transferred to a transparent 96-well plate and the UV–Vis spectrum was recorded. For competitive absorption measurements, XAA (0–70 µM) was added to a 300 µL mixture containing AptXAA (4.5 µL, 100 µM) and ThT-Red (6 µL, 100 µM), and spectra were collected from 350 to 800 nm.
The effect of molecular-motion restriction was examined by recording the fluorescence of ThT-Red in glycerol/HEPES mixtures containing 10, 20, 30, 40, 50, 60, and 70% (v/v) glycerol. The excitation wavelength was 500 nm, and the emission intensity at 600 nm was used for comparison. The excitation wavelength was 500 nm and the emission intensity at 600 nm was used for comparison.
2.6. Selectivity Evaluation
Selectivity was evaluated under the optimized sensing conditions using XAA and potential interferents at 40 µM. The interferents included glycine, L-alanine, acrylic acid, isopropyl acetate, propionic acid, and sucrose. All interferents were tested at a uniform concentration of 40 μM as a standardized selectivity challenge to enable direct comparison of the sensing responses. This concentration was not intended to represent their actual endogenous levels in potato-chip extracts. The response of the ThT-Red/AptXAA mixture without analyte was used as the blank control. All measurements were performed in triplicate.
2.7. Potato-Chip Sample Analysis
Potato chips obtained from a local supermarket in Zhengzhou, China, were finely ground. A 2.0 g portion of the sample was mixed with 10 mL methanol and 5 mL n-hexane and ultrasonicated for 3 min. The mixture was then centrifuged using an Eppendorf benchtop centrifuge (Eppendorf SE, Hamburg, Germany) at approximately 2350× g for 10 min. After phase separation, the upper n-hexane layer containing lipids was carefully discarded, whereas the lower methanolic layer containing acrylamide was collected. The supernatant was collected, passed through a 0.22 µm membrane filter, and diluted 20-fold with HEPES buffer.
The derivatization procedure followed the previously reported XAA-forming protocol [12]. Briefly, 600 μL of the aqueous sample solution containing acrylamide was mixed with 400 μL of xanthydrol solution (4 mg/mL in acetonitrile), followed by the addition of 100 μL HCl (1.5 M). The mixture was allowed to react for 30 min at room temperature, and the reaction was terminated by adding 100 μL NaOH (1.5 M) to neutralize the solution.
After derivatization and neutralization, the derivatized sample was introduced into the fluorescence sensing system at the designated XAA-equivalent concentration. ThT-Red and AptXAA were then added at the working concentrations selected in this study, and the final assay volume was adjusted to 200 μL with HEPES buffer, giving final concentrations of 2.0 μM ThT-Red and 1.5 μM AptXAA. Because acrylamide reacts with xanthydrol to form XAA with a 1:1 stoichiometric relationship, the XAA-equivalent concentration used in the sensing experiments was calculated from the initial acrylamide concentration after accounting for the corresponding dilution steps.
2.8. Portable Fluorescence Measurement and Data Analysis
Portable fluorescence measurements were performed using a Fluo-200 fluorometer (Hangzhou Allsheng Instruments Co., Ltd., Hangzhou, China) in fluorescence mode using the Blue&Red channel. The sensing mixture had a final volume of 200 μL and contained 2.0 μM ThT-Red and 1.5 μM AptXAA in HEPES buffer. After a 3 min sensing reaction, the fluorescence signal was recorded using the instrument’s preset acquisition parameters. The instrument-reported fluorescence intensity (RFU) was exported and used for concentration-response analysis. All samples were measured using the same instrument settings. All data processing, curve fitting, statistical analyses, and graph preparation were performed using Origin 2026b (version 10.35; OriginLab Corporation, Northampton, MA, USA).
3. Results and Discussion
3.1. Molecular Design and Spectral Properties of ThT-Red
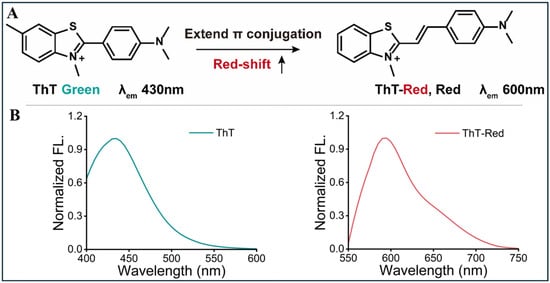
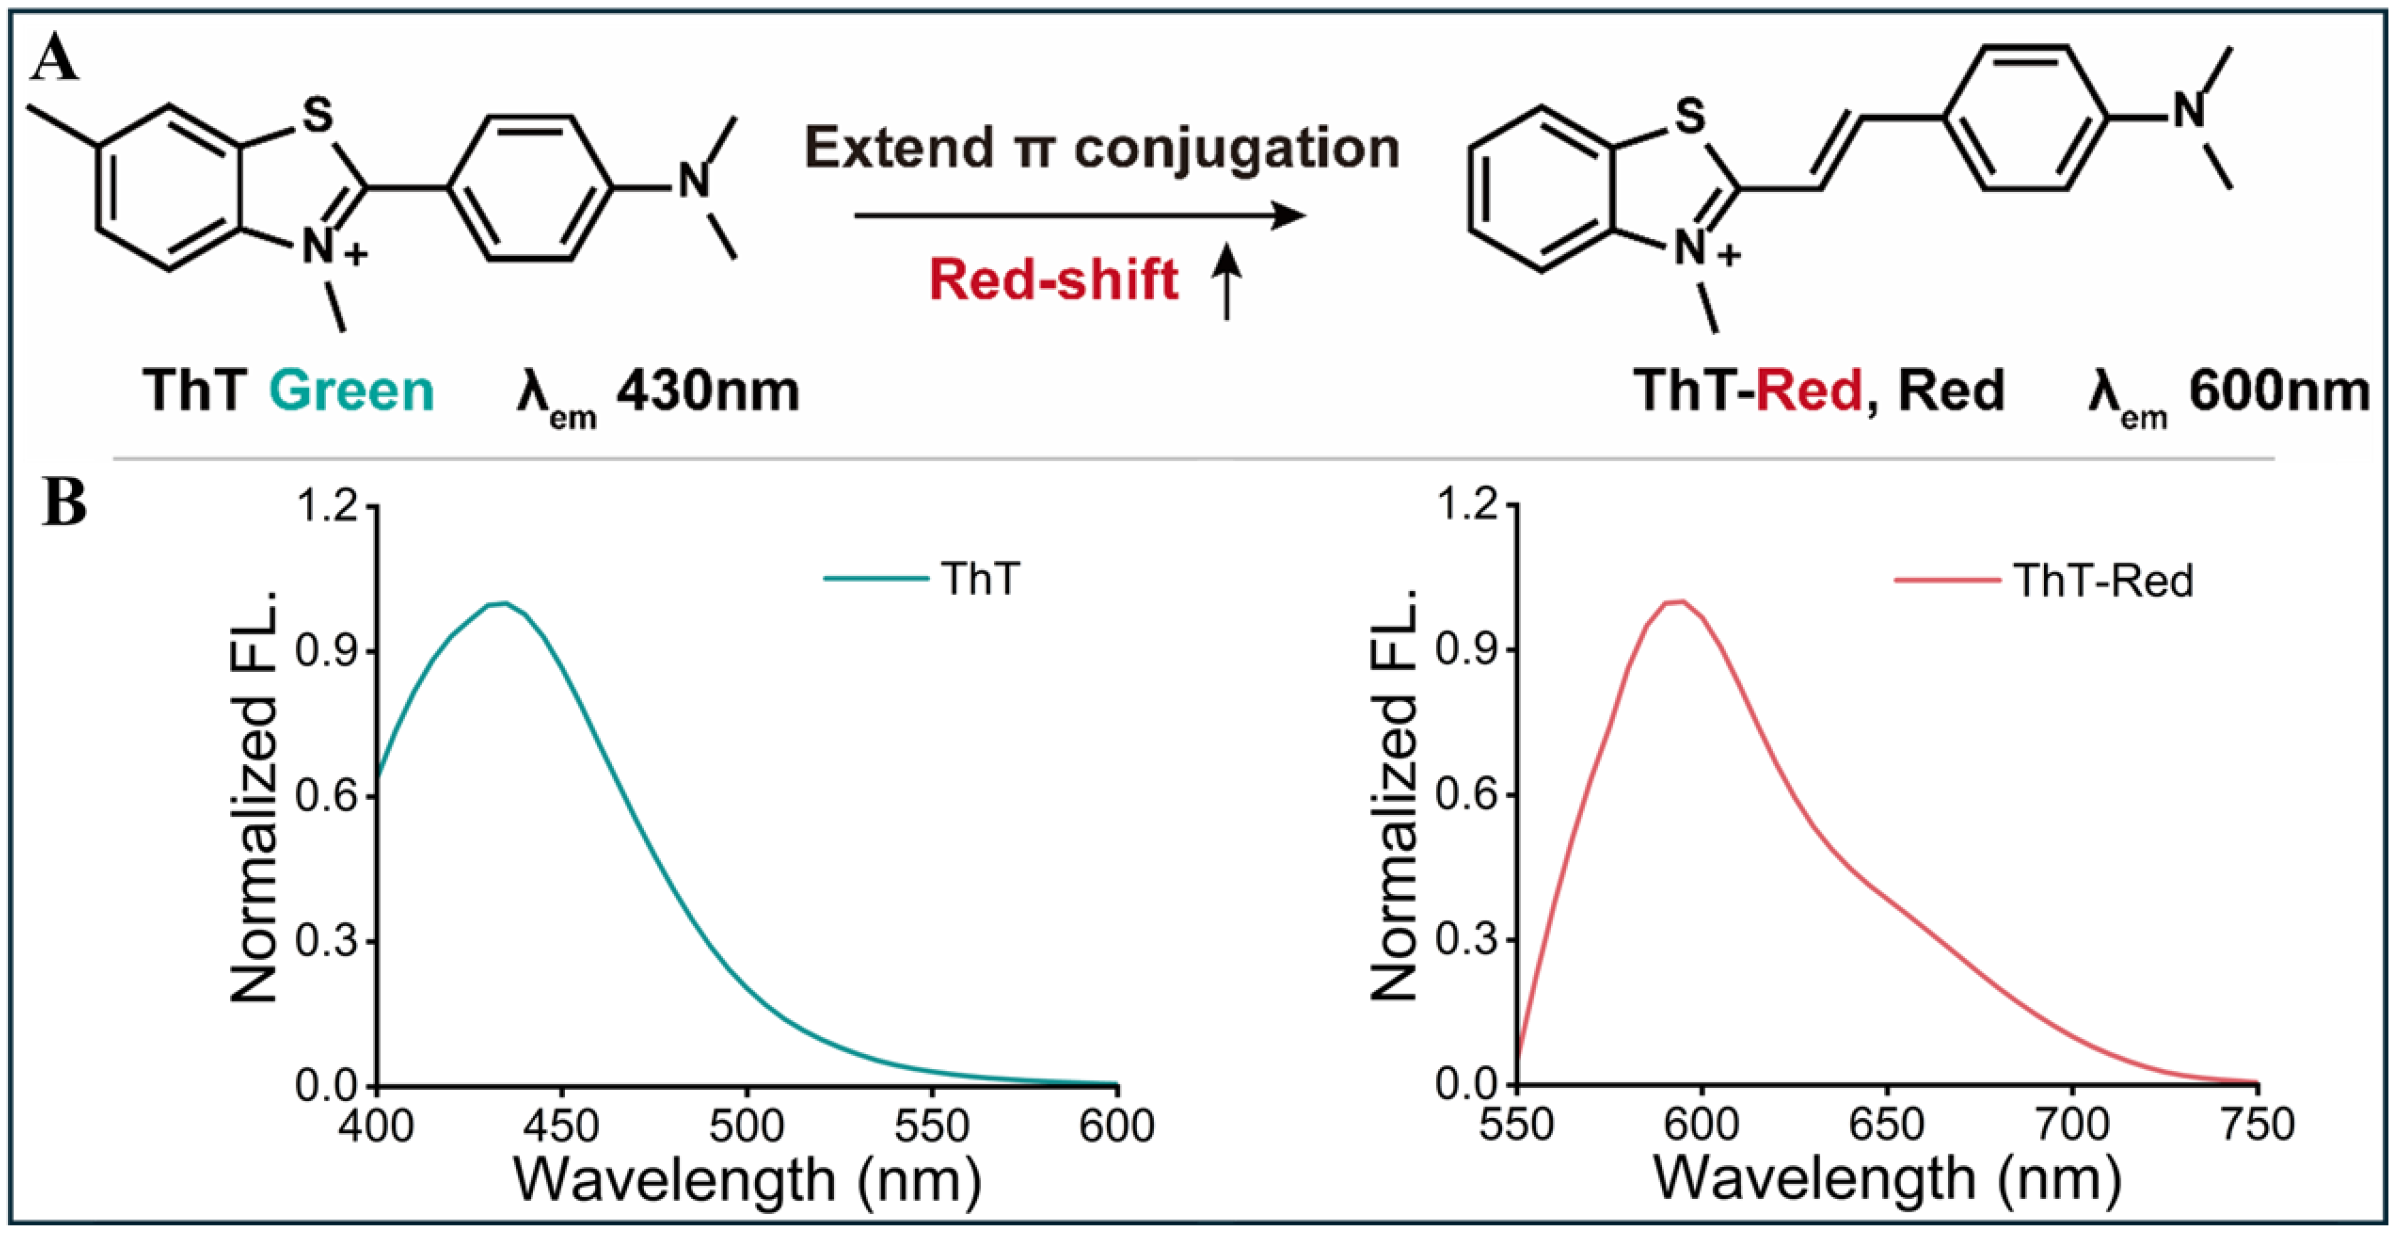
Conventional ThT contains a rotatable linkage between the benzothiazolium and aminophenyl units [22]. Rotation about this linkage in low-viscosity media facilitates nonradiative excited-state deactivation, whereas conformational restriction in a structured nucleic-acid environment can enhance fluorescence [23,24]. In the previously reported ThT-π-NM design, insertion of a vinylene bridge between the electron-donating aminophenyl unit and the cationic benzothiazolium acceptor extended the D–π–A conjugation and replaced the direct aryl–aryl linkage with a more extended conjugated pathway, providing a structural basis for bathochromic spectral tuning [18,19,20,21]. The present study does not introduce this molecule as a newly designed fluorophore; rather, the previously reported compound is referred to here as ThT-Red and is evaluated as an AptXAA-compatible red-emissive signal transducer (Figure 1A). Its environment-sensitive fluorescence behavior in the present sensing system was subsequently evaluated through aptamer-binding and viscosity-dependent fluorescence measurements.
Figure 1.
Molecular design and characterization of ThT-Red. (A) Previously reported π-conjugation-extension strategy and synthetic route to ThT-π-NM (referred to as ThT-Red in this work) from 4-(dimethylamino)benzaldehyde and 2-methylbenzothiazole. (The arrow indicates the conceptual extension of the π-conjugated system from ThT to ThT-Red and the associated red shift in emission.) (B) Independently normalized fluorescence emission spectra of ThT and ThT-Red in ethanol (ThT: λex = 350 nm; ThT-Red: λex = 500 nm).
Under the measurement conditions, conventional ThT emitted at approximately 430 nm, whereas ThT-Red exhibited an emission maximum at 600 nm (Figure 1B), corresponding to a 175 nm bathochromic shift. Because the two spectra were independently normalized to their respective emission maxima, the comparison primarily highlights the differences in spectral position and band shape, while absolute fluorescence intensity was not directly compared in this figure. The single dominant red-emission band of ThT-Red also facilitates subsequent single-wavelength intensity readout at 600 nm.
3.2. Aptamer-Induced Fluorescence Activation and Motion-Restriction Mechanism
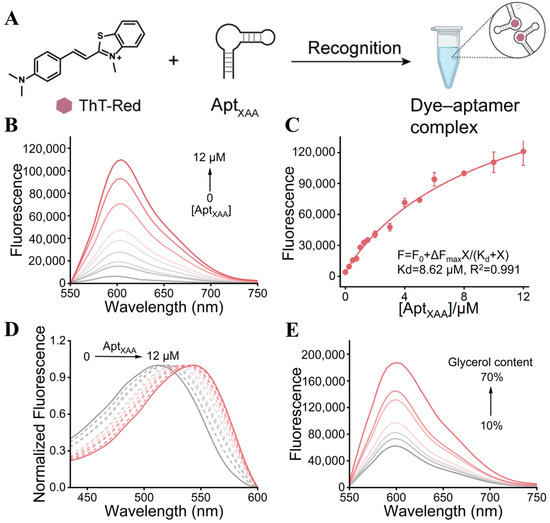
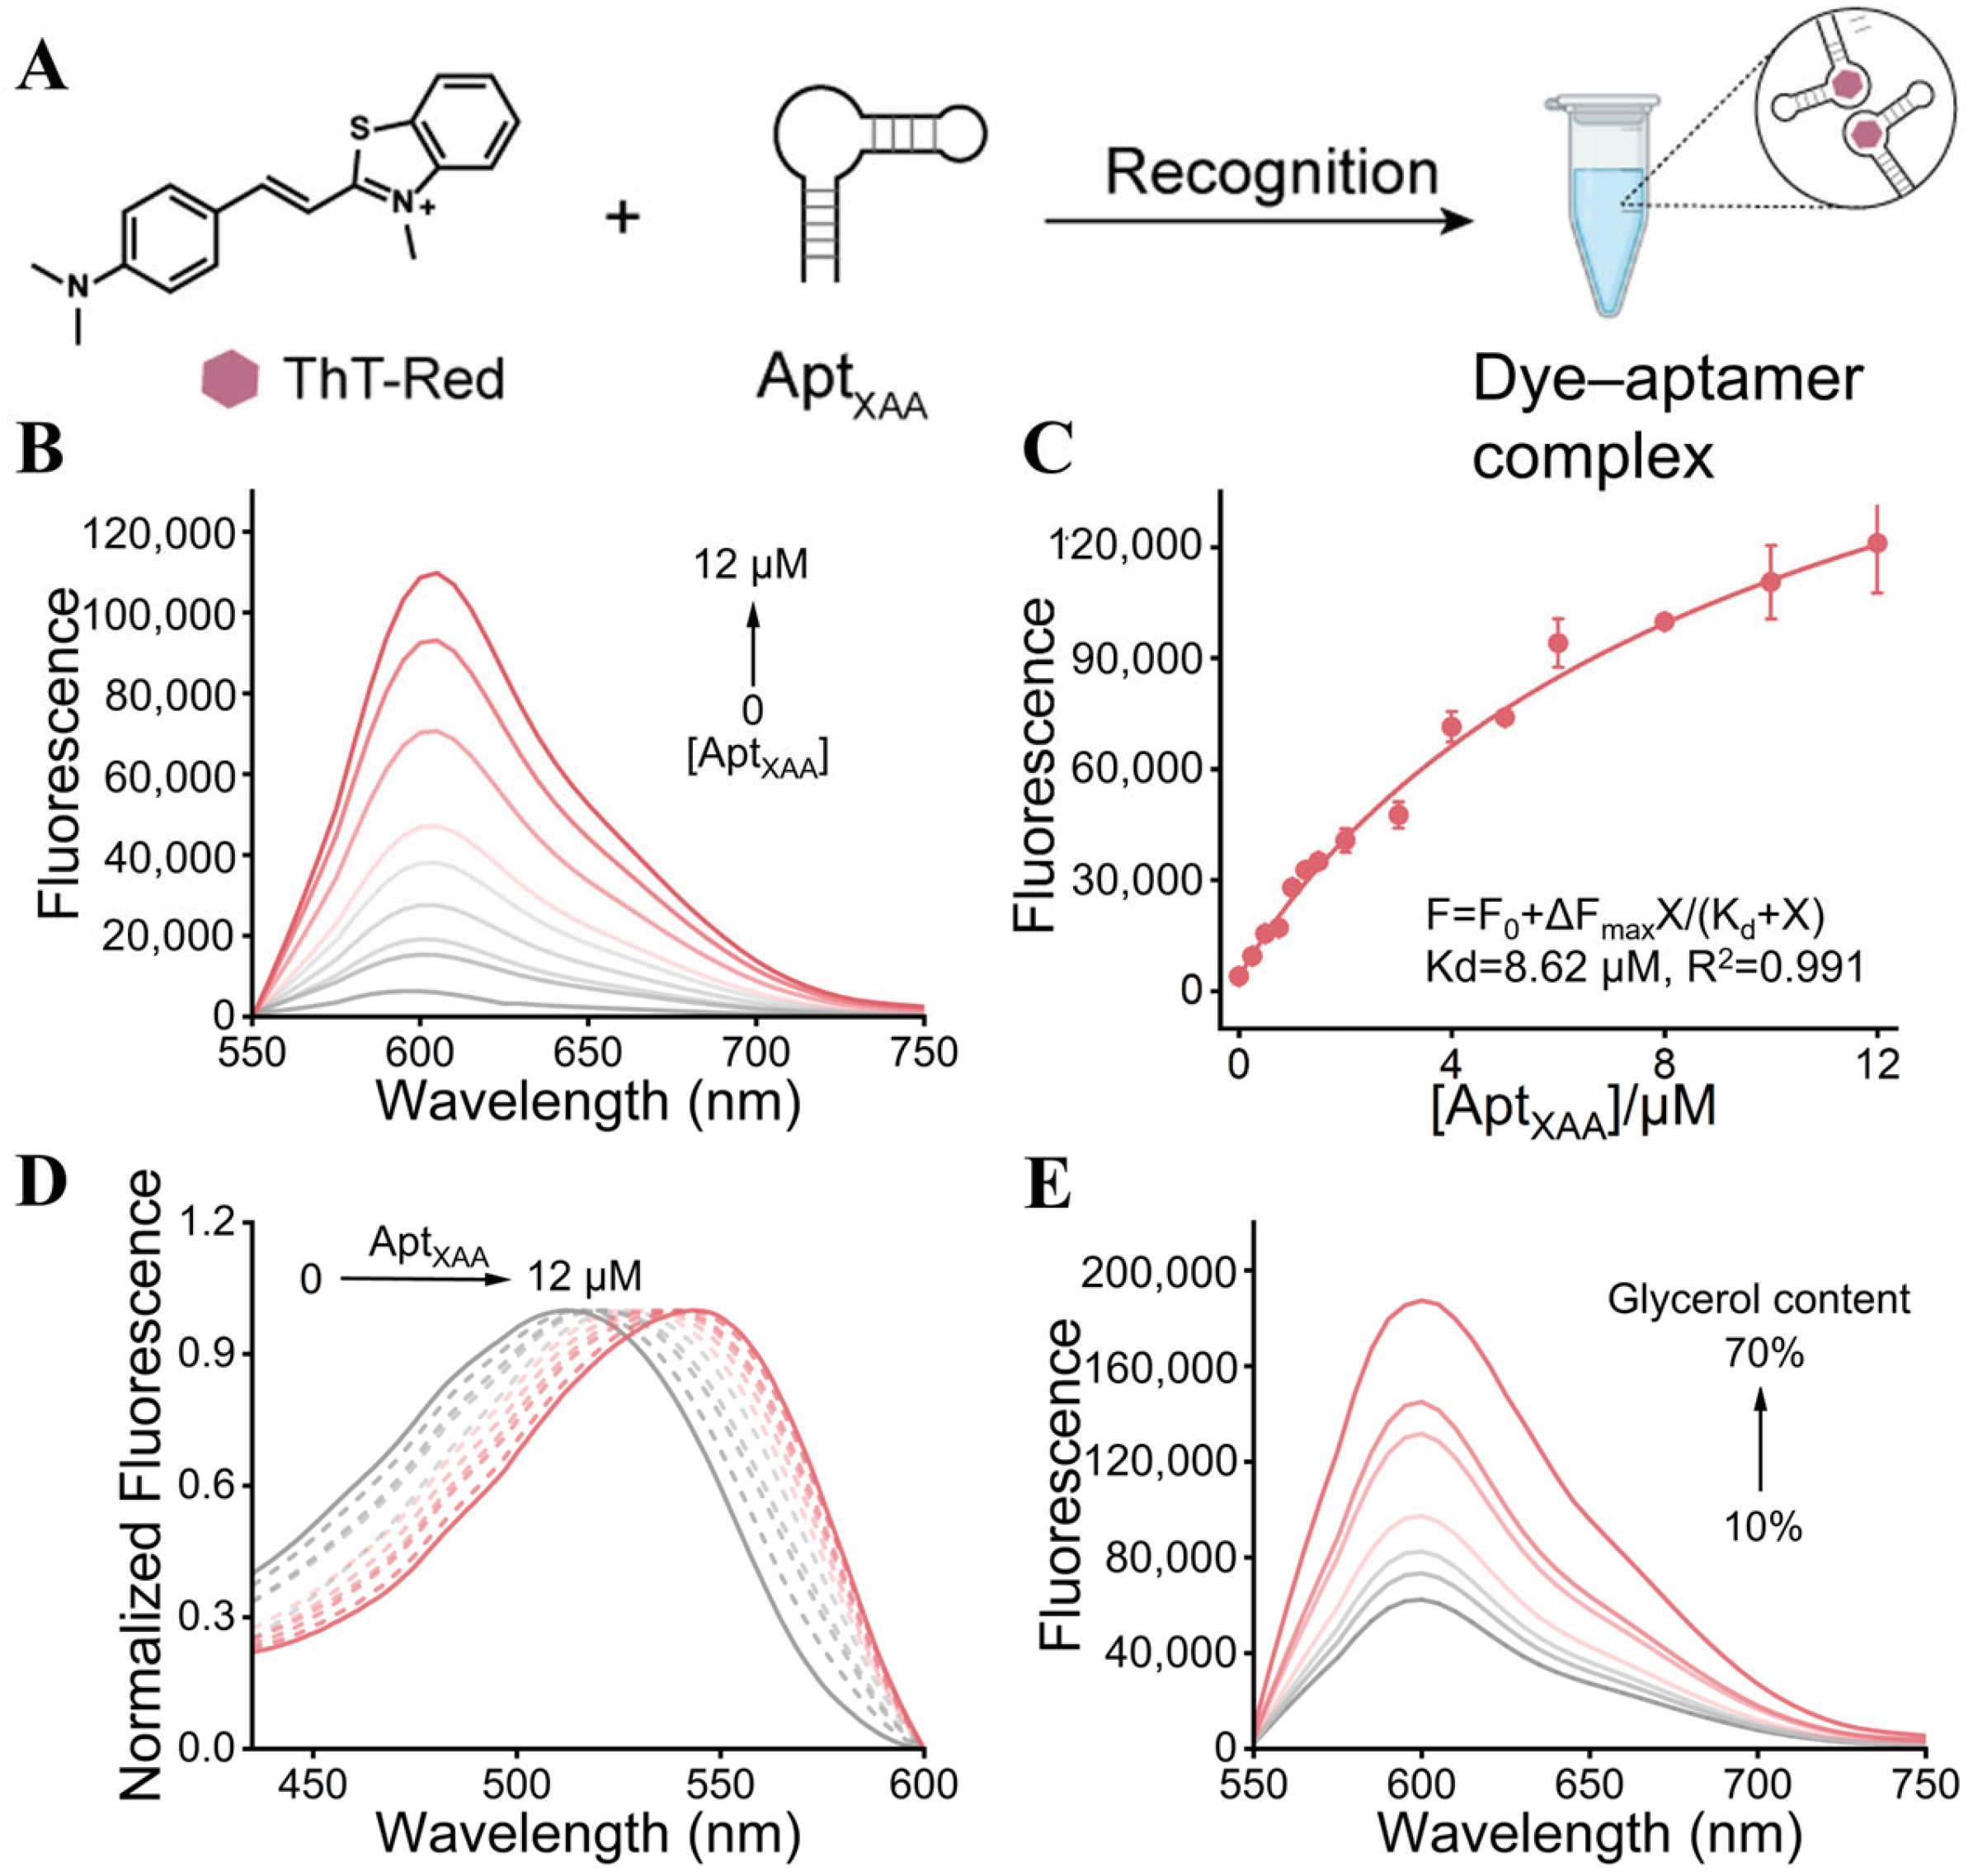
ThT-Red spontaneously associates with AptXAA to form a dye–aptamer complex, thereby enabling effective coupling between the signal transduction unit and the molecular recognition element (Figure 2A). To elucidate the origin of the ThT-Red fluorescence signal, we investigated its binding interaction with AptXAA. The fluorescence response of ThT-Red to AptXAA was first evaluated to determine whether the red-emissive analogue could serve as a label-free aptamer-responsive dye. Increasing the AptXAA concentration from 0 to 12 µM produced a progressive enhancement of the 600 nm emission (Figure 2B). Fitting the titration data to a one-site binding model gave an apparent Kd of 8.62 µM (Figure 2C), indicating micromolar interaction between the dye and AptXAA. This affinity is sufficient to form a fluorescent dye–aptamer complex while still allowing XAA to perturb the equilibrium.
Figure 2.
(A) Interaction of ThT-Red with AptXAA and mechanism-related characterization. (B) Fluorescence spectra of 2 µM ThT-Red with 0–12 µM AptXAA. (C) Fluorescence titration curve of ThT-Red with increasing AptXAA concentrations and nonlinear fitting using a one-site saturation-binding model. The fitted apparent dissociation constant was Kd = 8.65 μM. Error bars represent the standard deviation of three independently prepared samples. (D) Visible absorption spectral changes in ThT-Red induced by increasing AptXAA concentrations. (E) Viscosity-dependent fluorescence spectra of ThT-Red in glycerol/HEPES mixtures containing 10, 20, 30, 40, 50, 60, and 70% (v/v) glycerol (λex = 500 nm). The arrow indicates increasing glycerol content.
AptXAA addition also caused a 32 nm bathochromic shift in the visible absorption band of ThT-Red (Figure 2D). The spectral change is consistent with an altered ground-state microenvironment or dye organization upon aptamer association. Because the absorption profile also changed in the vicinity of the 500 nm excitation wavelength, a contribution from altered excitation absorbance to the observed fluorescence enhancement cannot be excluded. Accordingly, the fluorescence increase should not be attributed solely to restricted intramolecular motion. The viscosity experiment therefore provided complementary evidence for the role of molecular-motion restriction. In a low-viscosity medium, ThT-Red undergoes relatively free intramolecular rotation, allowing excited-state energy to dissipate predominantly through nonradiative relaxation pathways and resulting in weak fluorescence. As the glycerol content increased from 10 to 70% (v/v), the fluorescence intensity of ThT-Red at approximately 600 nm progressively increased (Figure 2E). These results support a contribution of restricted intramolecular motion to the fluorescence enhancement of ThT-Red. Accordingly, the fluorescence activation observed upon AptXAA addition is consistent with the formation of a more conformationally restricted dye–aptamer microenvironment, although changes in excitation absorbance may also contribute to the overall signal enhancement.
3.3. Selection of Working Concentrations for the ThT-Red/AptXAA Sensing System
The influence of ThT-Red concentration was preliminarily evaluated at 1.0 and 2.0 µM under otherwise identical conditions. Among the two concentrations examined, 2.0 µM ThT-Red produced a larger fluorescence response upon interaction with AptXAA and XAA and was therefore selected as the working concentration for subsequent experiments (Figure S8). This comparison was used to select a practical working condition rather than to establish a globally optimal ThT-Red concentration. The AptXAA concentration was subsequently varied from 0 to 10 µM. An AptXAA concentration of 1.5 µM provided the largest target-dependent signal change under the tested conditions and was selected for subsequent sensing experiments (Figure S9).
3.4. Target-Responsive Signal Transduction and Analytical Performance for XAA
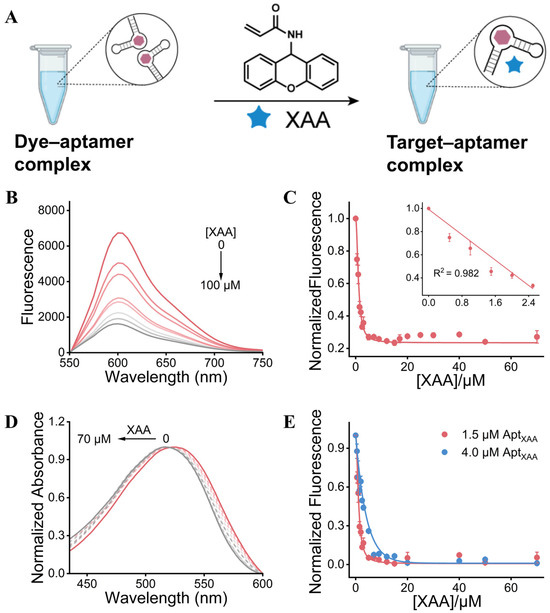
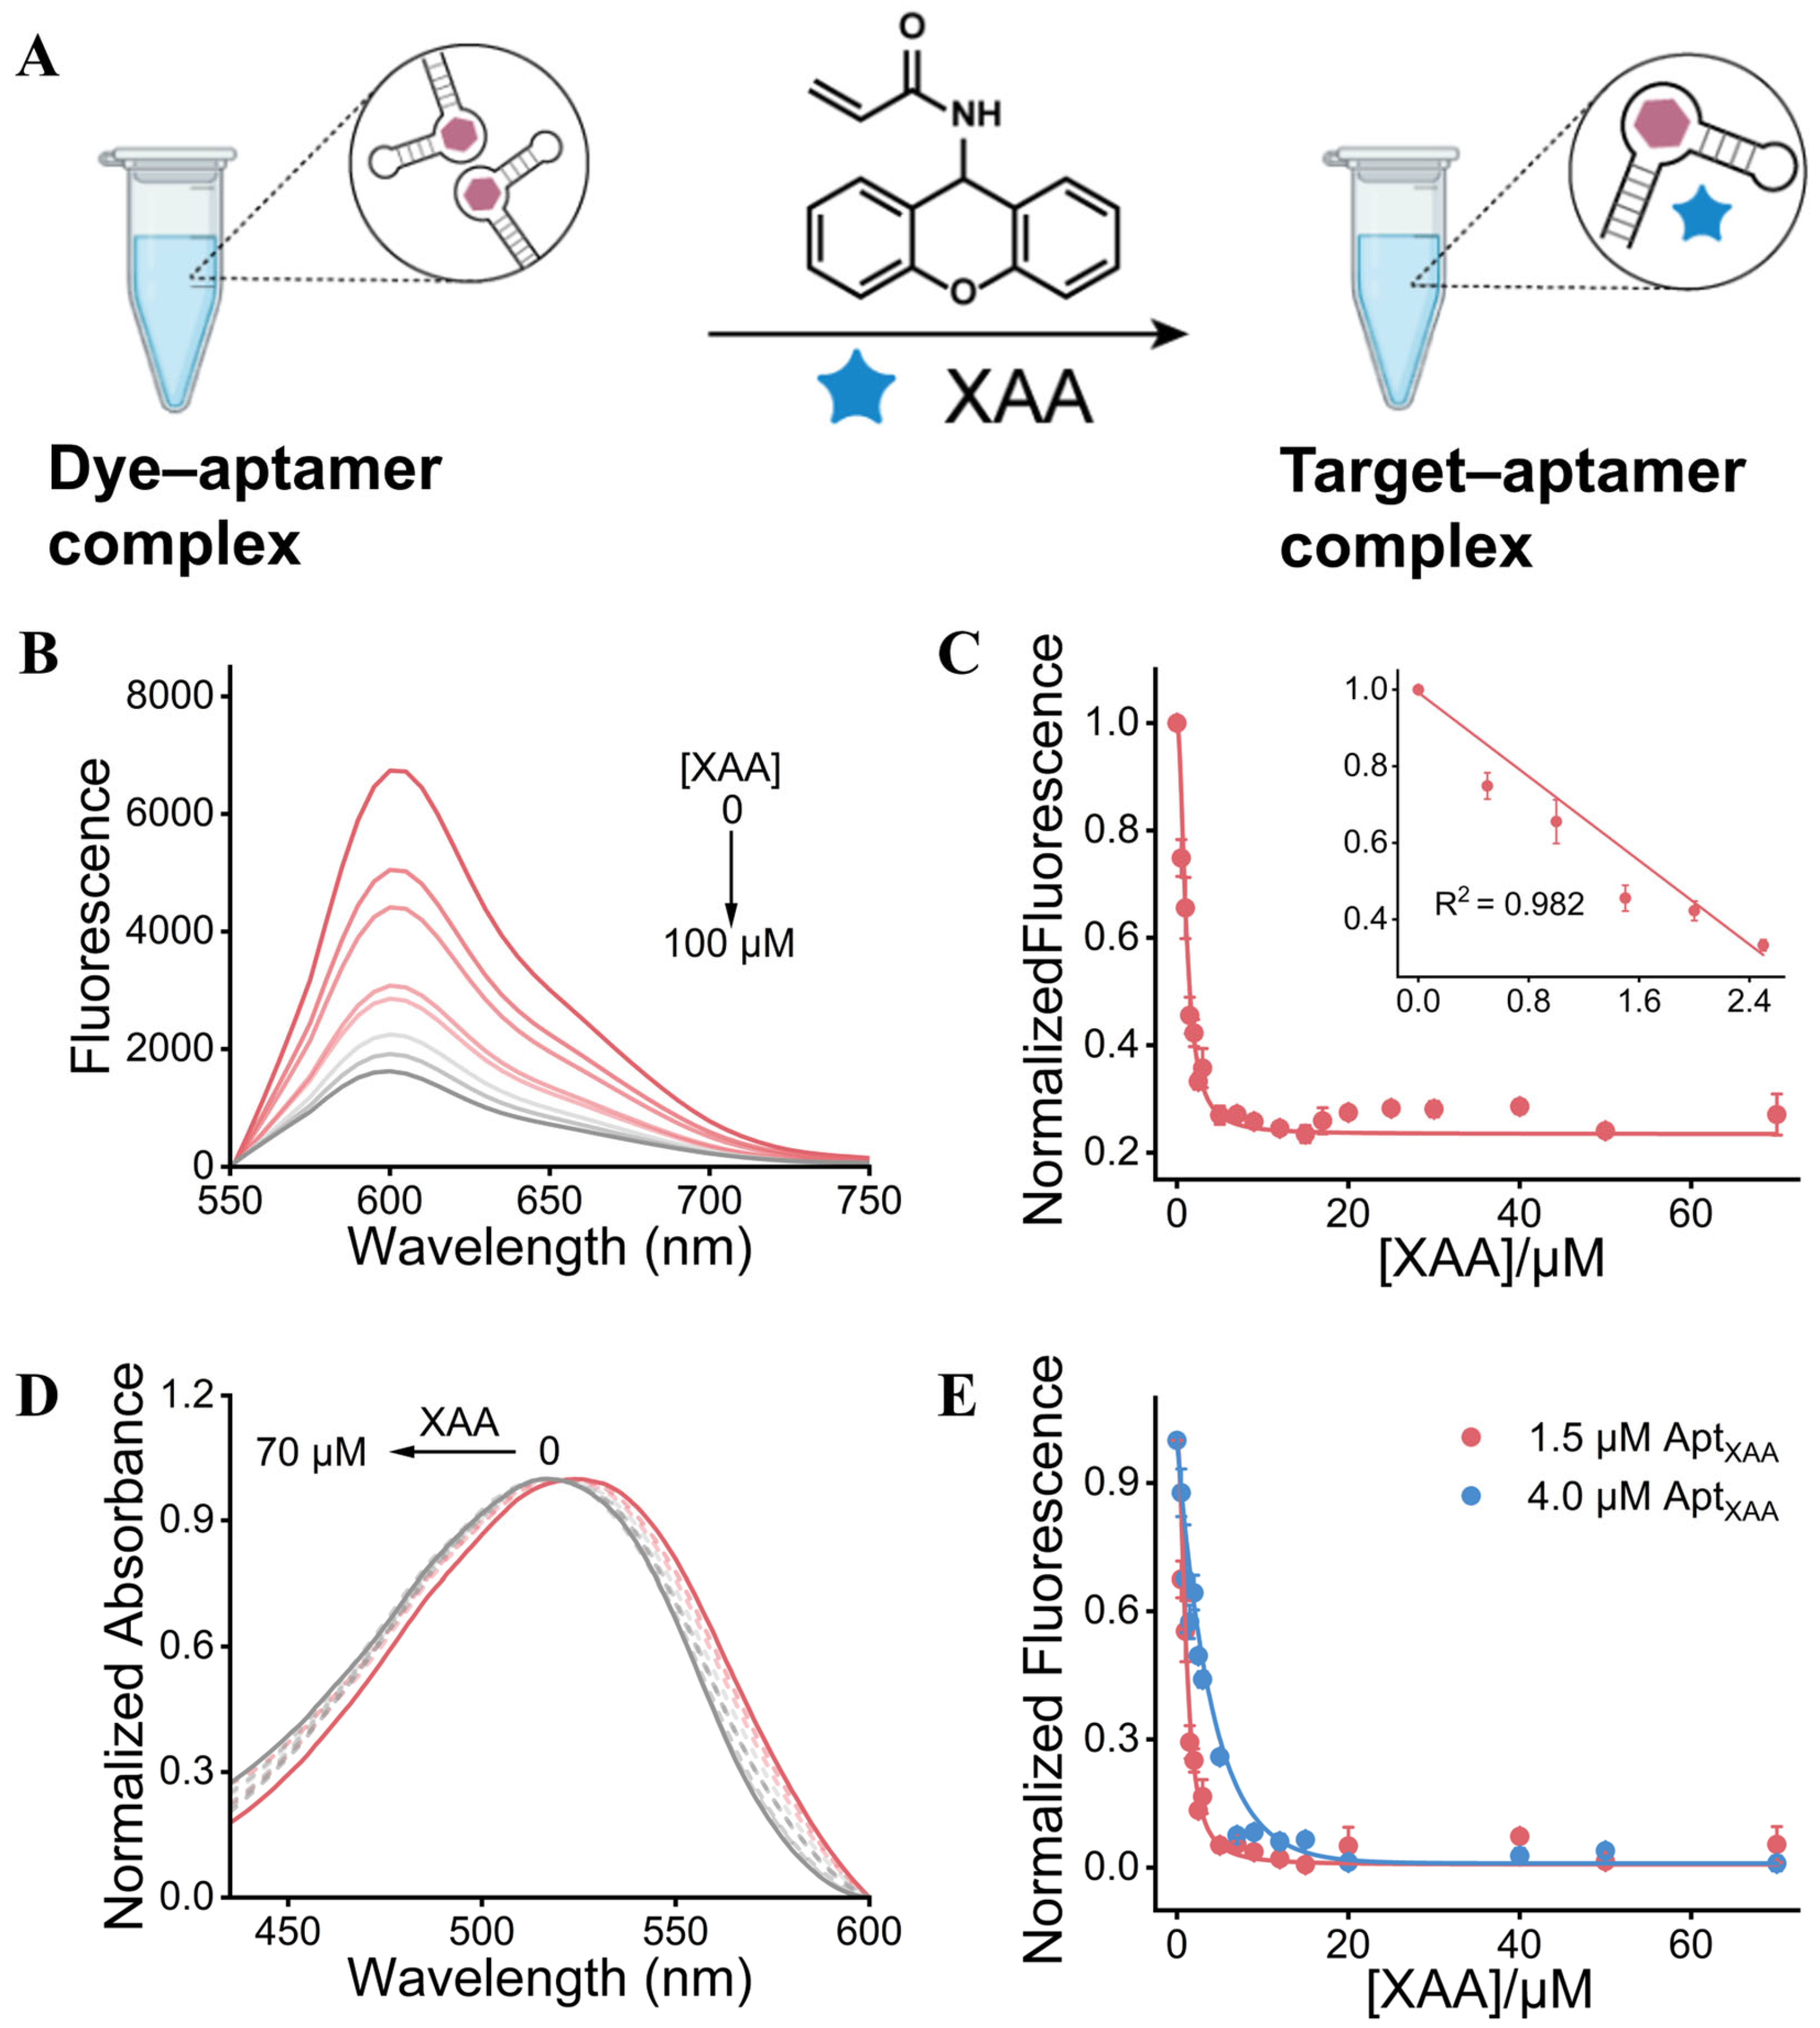
The fluorescence response of the ThT-Red/AptXAA system was based on target-induced competitive displacement. In the absence of XAA, ThT-Red associated with AptXAA to form a fluorescent dye–aptamer complex, in which the relatively rigid aptamer microenvironment restricted the intramolecular rotation of the dye and enhanced its emission. Upon addition of XAA, the fluorescence intensity of the ThT-Red/AptXAA system progressively decreased. Together with the corresponding absorption changes, this behavior is consistent with XAA binding perturbing the ThT-Red–AptXAA equilibrium through a competitive-displacement process (Figure 3A). Such perturbation would increase the conformational freedom of ThT-Red and favor nonradiative excited-state relaxation, providing a plausible explanation for the concentration-dependent fluorescence decrease at approximately 600 nm (Figure 3B).
Figure 3.
Competitive displacement-based signal transduction and analytical response of the ThT-Red/AptXAA aptasensor toward XAA. (A) Schematic illustration of the proposed competitive-displacement mechanism underlying the XAA-induced fluorescence response. (B) Fluorescence emission spectra of the ThT-Red/AptXAA system in the presence of increasing concentrations of XAA from 0 to 100 μM. (C) Normalized fluorescence intensity at 600 nm as a function of XAA concentration. (Inset: linear calibration plot over the range of 0–2.5 μM.) (D) Normalized UV–vis absorption spectra of the sensing system upon addition of XAA at concentrations ranging from 0 to 70 μM. (E) Effect of AptXAA concentration (1.5 and 4.0 μM) on the normalized fluorescence response of the sensing system toward XAA. Error bars represent the standard deviation of replicate measurements (n = 3).
Under the optimized conditions, with ThT-Red and AptXAA concentrations fixed at 2.0 and 1.5 μM, respectively, the fluorescence intensity of the sensing system at 600 nm progressively decreased as the XAA concentration increased from 0 to 100 μM (Figure 3B). The normalized fluorescence response, expressed as , declined rapidly at low XAA concentrations and gradually approached a plateau at higher concentrations, consistent with the progressive disruption of the fluorescent ThT-Red–AptXAA complex. A good linear relationship was obtained over the range of 0–2.5 μM XAA, described by the equation , with a correlation coefficient of (Figure 3C). The calculated limit of detection was 0.23 μM XAA based on the 3σ/k criterion. This value should be regarded as a statistically estimated detection limit derived from the calibration data. The visible absorption spectra also changed upon XAA addition (Figure 3D), with the main absorption band showing a modest hypsochromic shift as the XAA concentration increased. Because these spectra were normalized, they primarily demonstrate changes in spectral position rather than absolute absorbance. Consequently, the present data do not allow a quantitative assessment of whether changes in absorbance at the 500 nm excitation wavelength contribute to the fluorescence decrease, and such a contribution cannot be excluded.
The concentration of AptXAA also markedly affected the analytical response of the system. Compared with 4.0 μM AptXAA, the system containing 1.5 μM AptXAA showed a more rapid fluorescence decrease at low XAA concentrations and approached the minimum signal at a lower target concentration (Figure 3E). This behavior can be attributed to the lower amount of aptamer-bound dye that must be displaced when a lower aptamer concentration is used. By contrast, an excess of AptXAA increased the population of dye–aptamer complexes and consequently required a higher XAA concentration to achieve comparable signal suppression. Therefore, 1.5 μM AptXAA was selected for subsequent analytical measurements to obtain a more sensitive response toward XAA.
3.5. Selectivity and Portable Detection Performance in Potato-Chip Samples
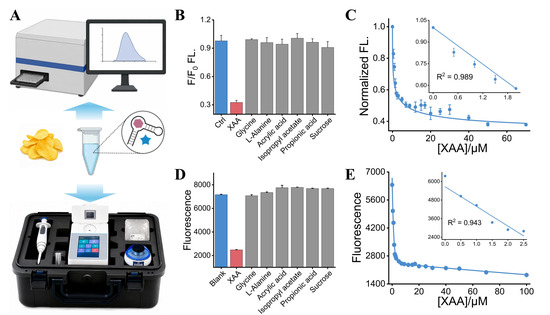
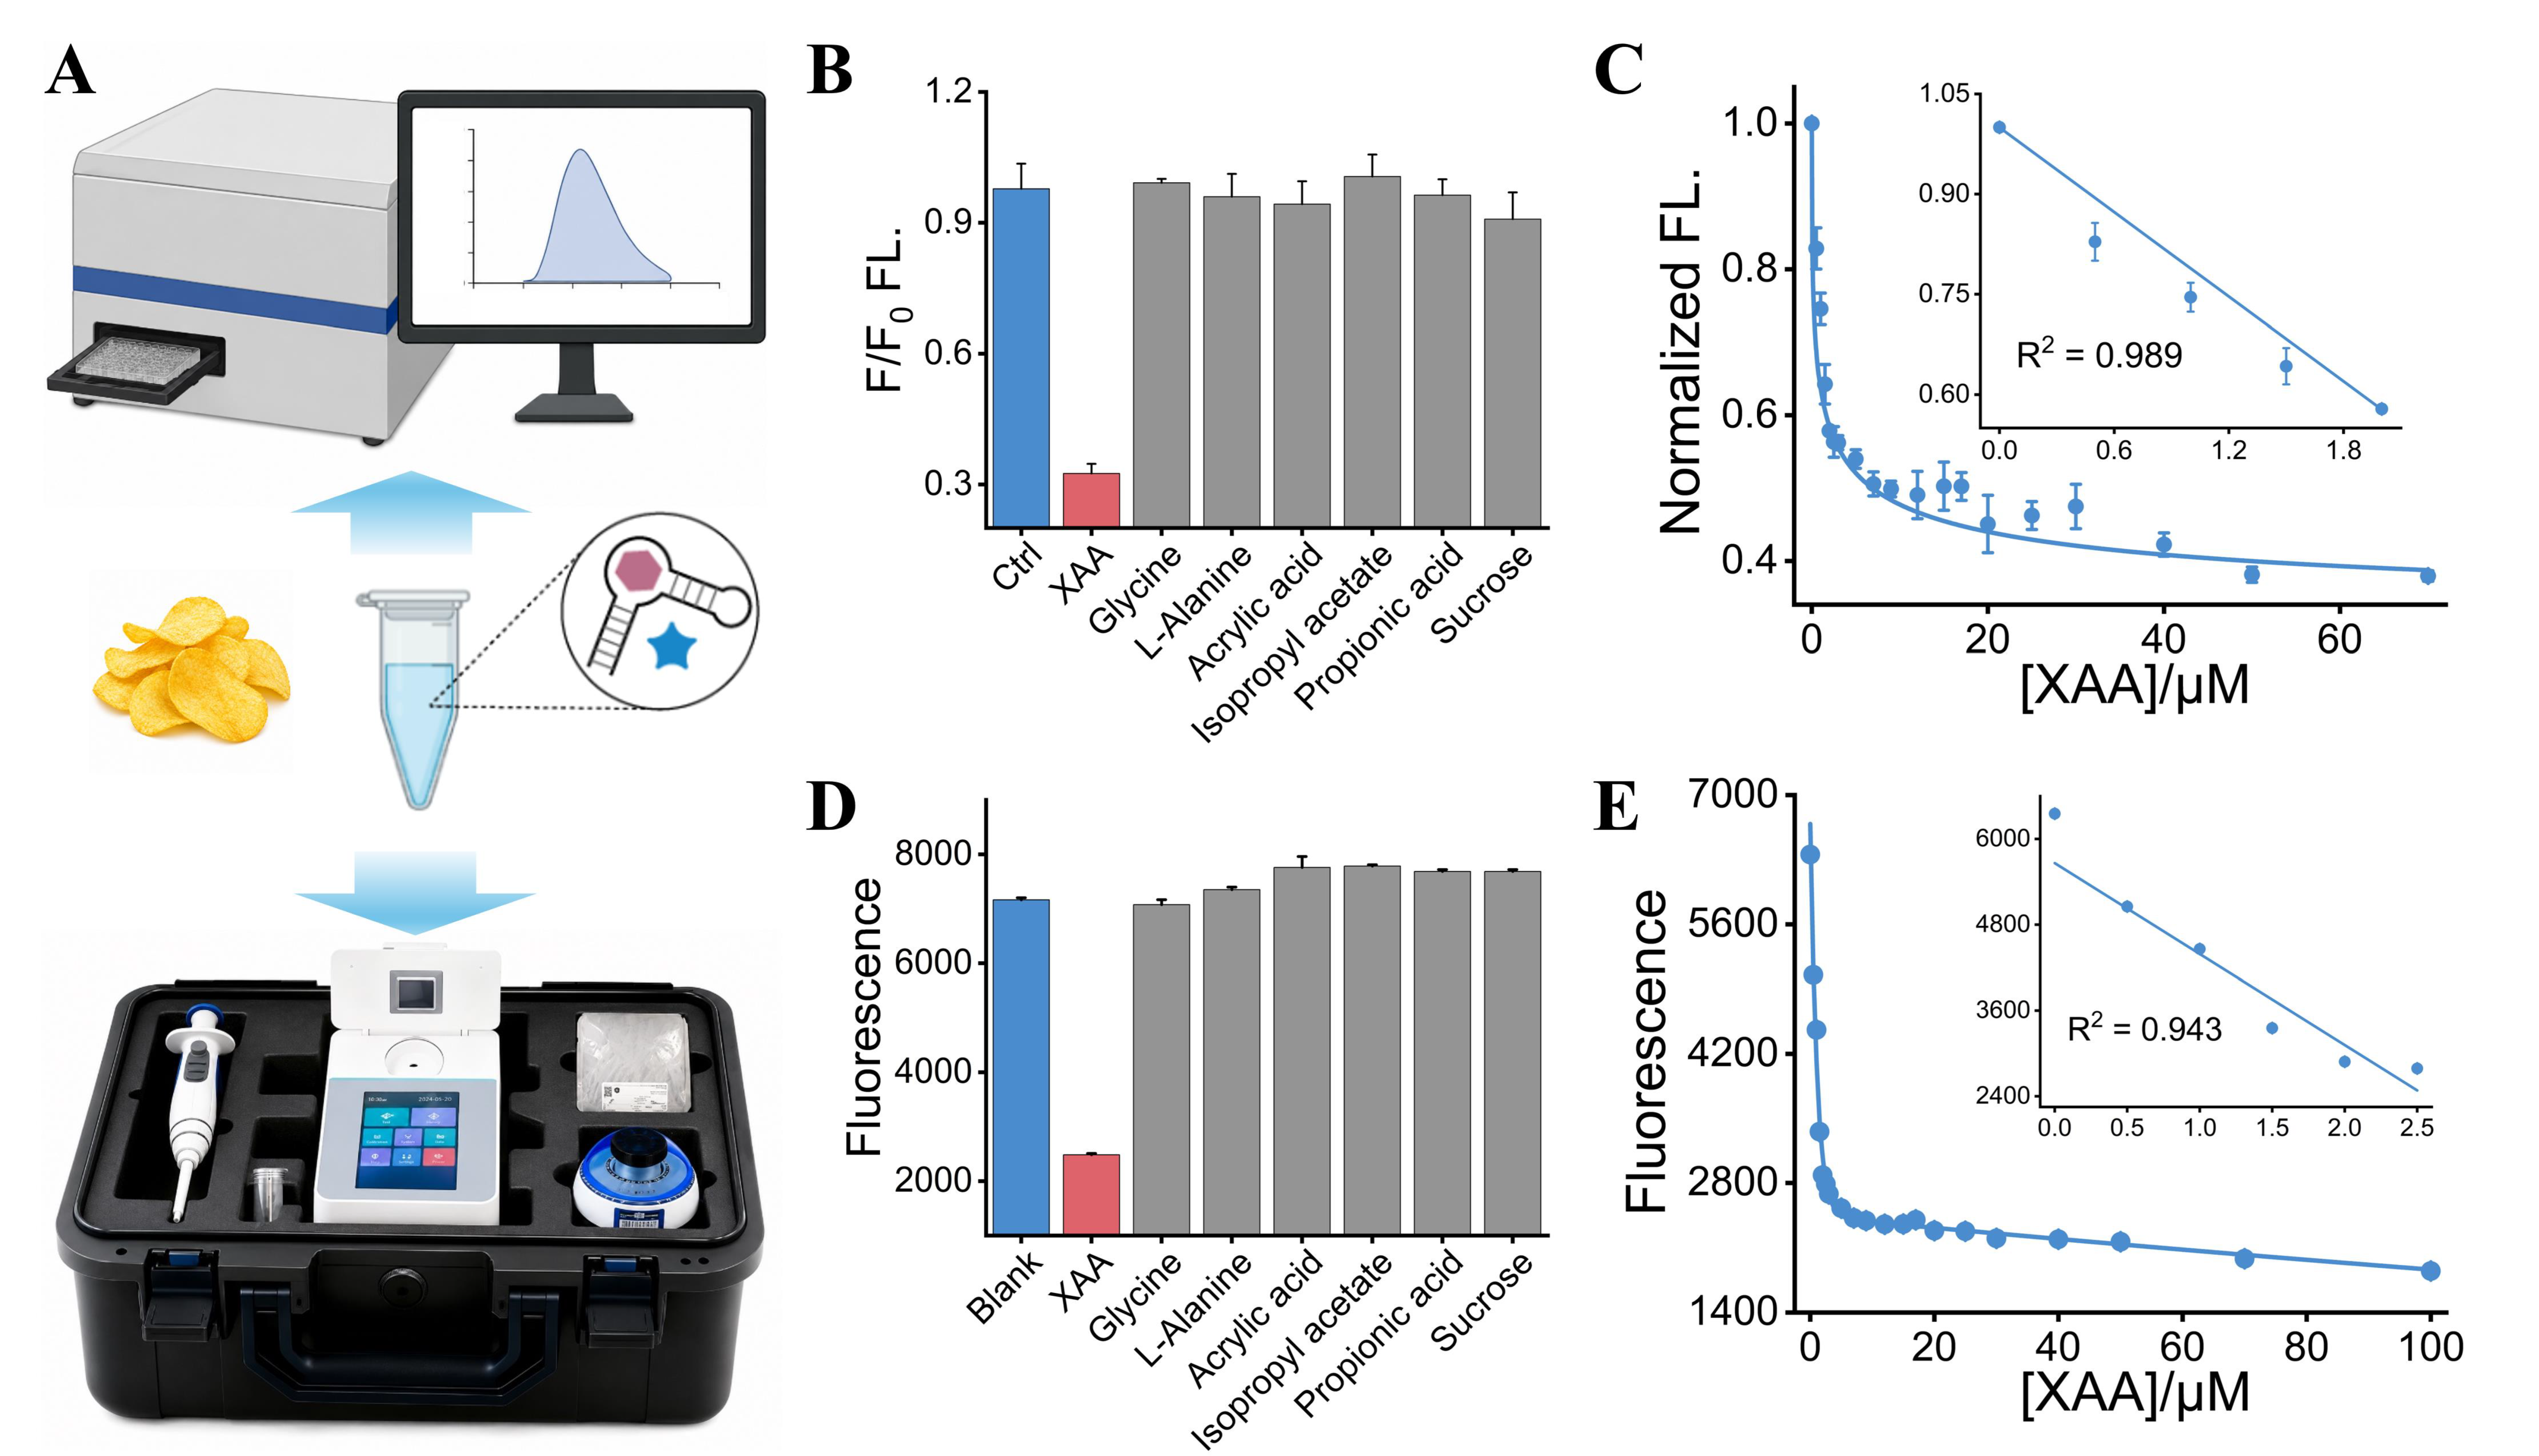
The analytical selectivity of the ThT-Red/AptXAA sensing system was first evaluated using a laboratory fluorescence instrument. As shown in Figure 4B, XAA caused a pronounced decrease in the normalized fluorescence intensity, whereas glycine, L-alanine, acrylic acid, isopropyl acetate, propionic acid, and sucrose produced only negligible signal changes relative to the control. These results indicate that the fluorescence response mainly originated from the specific recognition of XAA by AptXAA rather than from nonspecific interactions with the tested interferents. The laboratory fluorescence measurements also revealed a concentration-dependent decrease in the normalized fluorescence intensity with increasing XAA concentration (Figure 4C). A good linear relationship was obtained over the range of 0–2 μM XAA, described by the equation , with a correlation coefficient of (Figure 4C). The limit of detection was calculated to be 0.23 μM using the 3σ/k method, supporting the quantitative determination of XAA using the ThT-Red/AptXAA system. Spiking experiments were further performed to evaluate the analytical performance of the ThT-Red/AptXAA sensing system in potato-chip extracts. At spiking levels of 0.5, 1.0, and 1.5 μM, recoveries of 119.72%, 90.14%, and 95.71% were obtained, respectively, with corresponding RSD values of 12.20%, 6.95%, and 6.25% (n = 3) (Table S1).
Figure 4.
Selectivity and analytical performance of the ThT-Red/AptXAA aptasensor measured using a laboratory fluorescence instrument and a portable fluorescence reader. (A) Schematic illustration of the workflow for XAA analysis in potato-chip samples. (B) Selectivity of the ThT-Red/AptXAA sensing system measured using the laboratory fluorescence instrument in the presence of XAA and potential interferents, including glycine, L-alanine, acrylic acid, isopropyl acetate, propionic acid, and sucrose. (C) Normalized fluorescence response of the sensing system toward increasing concentrations of XAA measured using the laboratory fluorescence instrument. (Inset: linear calibration plot in the low-concentration range.) (D) Selectivity of the sensing system in potato-chip extracts evaluated using the portable fluorescence reader. (E) Fluorescence response of the portable fluorescence reader toward increasing concentrations of XAA. (Inset: linear calibration plot over the low-concentration range.) Error bars represent the standard deviation of replicate measurements (n = 3).
The assay was subsequently transferred to a portable fluorescence reader to evaluate its feasibility for portable screening. The portable device was integrated with the sample-treatment and sensing procedures for rapid analysis of XAA in potato-chip extracts, as illustrated in Figure 4A. Consistent with the laboratory fluorescence results, the portable readout showed a marked fluorescence decrease in the presence of XAA, while the blank extract and samples containing the tested interferents retained relatively high fluorescence signals (Figure 4D). Furthermore, the fluorescence intensity recorded by the portable device progressively decreased as the XAA concentration increased and exhibited a linear response in the low-concentration region (0–2.5 μM), with an R2 value of 0.943 (Figure 4E). Although the portable reader generated fluorescence values on a different intensity scale from those obtained with the laboratory instrument, the two measurement platforms showed consistent target-dependent response trends. These findings support the feasibility of the ThT-Red/AptXAA aptasensor for rapid and portable analysis of acrylamide in potato-chip samples after derivatization to XAA.
4. Conclusions
A π-conjugation-extended ThT analogue, ThT-Red, was developed for red-emissive aptasensing of acrylamide after xanthydrol derivatization. Binding of ThT-Red to AptXAA enhanced its fluorescence at 600 nm by restricting intramolecular motion, whereas XAA recognition perturbed the dye–aptamer interaction, producing a fluorescence decrease consistent with competitive displacement. The resulting aptasensor achieved a linear range of 0–2.5 μM and a detection limit of 0.23 μM, and was successfully applied to spiked potato-chip extracts. Its compatibility with a portable fluorometer further supports the feasibility of rapid on-site analysis. Overall, this study extends the established XAA-recognition strategy through rational fluorophore engineering and provides a practical optical transduction approach for low-epitope analytes.
Supplementary Materials
The following supporting information can be downloaded at: https://www.mdpi.com/article/10.3390/chemosensors14090203/s1. Figure S1: Synthetic route for compound NM-1. Figure S2: Synthetic route for ThT-Red. Figure S3: NMR spectra of XAA. 1H NMR (400 MHz, DMSO-d6) δ 9.01 (d, J = 8.7 Hz, 1H), 7.37–7.30 (m, 4H), 7.16–7.10 (m, 4H), 6.35 (d, J = 8.7 Hz, 1H), 6.21–6.16 (m, 2H), 5.64 (dd, J = 7.4, 4.9 Hz, 1H). Figure S4: NMR spectra of XAA. 13C NMR (101 MHz, DMSO-d6) δ 164.50, 151.13, 131.89, 129.82, 129.67, 126.90, 124.16, 122.19, 116.77, 43.14. Figure S5: HRMS (ESI) spectrum of XAA. Figure S6: NMR spectra of ThT-Red. 1H NMR (400 MHz, DMSO-d6) δ 8.29–8.24 (m, 1H), 8.09–8.02 (m, 1H), 7.99 (s, 1H), 7.87 (d, J = 9.0 Hz, 2H), 7.74 (ddd, J = 8.5, 7.3, 1.2 Hz, 1H), 7.68–7.54 (m, 2H), 6.78 (d, J = 9.0 Hz, 2H), 4.18 (s, 3H), 3.06 (s, 6H). Figure S7: NMR spectra of ThT-Red. 13C NMR (101 MHz, DMSO-d6) δ 171.84, 153.98, 150.62, 142.47, 133.36, 129.38, 127.95, 127.34, 124.34, 121.98, 116.47, 112.46, 106.79, 40.30, 40.14, 36.13. Figure S8: Comparison of the fluorescence responses obtained with two tested ThT-Red concentrations (1.0 and 2.0 μM) upon interaction with AptXAA and XAA. Figure S9: Response of the ThT-Red/AptXAA system at different AptXAA concentrations. Table S1: Estimation of XAA in Potato Chips.
Author Contributions
C.L.: Conceptualization, methodology, investigation, data curation, formal analysis, visualization, writing—original draft. K.Y.: Investigation, validation, data curation. J.Y.: Methodology, investigation, validation. X.W.: Investigation, visualization. F.W.: Resources, supervision, project administration, writing—review and editing. Z.W.: Investigation, formal analysis, validation. Q.S.: Resources, validation, writing—review and editing. J.Z.: Conceptualization, methodology, supervision, project administration, writing—review and editing. All authors have read and agreed to the published version of the manuscript.
Funding
This research was funded by the Natural Science Foundation of Henan Province, grant number 252300421575; the Doctoral Fund Project of Zhengzhou University of Light Industry, grant number 2023BSJJ018; and the Basic Scientific Research Business Fee Supporting Project of Henan Province, grant number 2025KY53.
Institutional Review Board Statement
Not applicable.
Informed Consent Statement
Not applicable.
Data Availability Statement
The data that support the findings of this study are available from the corresponding authors upon reasonable request.
Conflicts of Interest
Author Fengqin Wang, Zeyu Wang and Qianjin Song was employed by Henan Boiler and Pressure Vessel Inspection Technology Research Institute. The remaining authors declare that the research was conducted in the absence of any commercial or financial relationships that could be construed as a potential conflict of interest.
References
- Friedman, M. Chemistry, Biochemistry, and Safety of Acrylamide. A Review. J. Agric. Food Chem. 2003, 51, 4504–4526. [Google Scholar] [CrossRef] [Scilit] [PubMed]
- Mottram, D.S.; Wedzicha, B.L.; Dodson, A.T. Acrylamide Is Formed in the Maillard Reaction. Nature 2002, 419, 448–449. [Google Scholar] [CrossRef] [Scilit] [PubMed]
- Pedreschi, F.; Mariotti, M.S.; Granby, K. Current Issues in Dietary Acrylamide: Formation, Mitigation and Risk Assessment. J. Sci. Food Agric. 2014, 94, 9–20. [Google Scholar] [CrossRef] [Scilit] [PubMed]
- Elbashir, A.A.; Omar, M.M.A.; Wan Ibrahim, W.A.; Schmitz, O.J.; Aboul-Enein, H.Y. Acrylamide Analysis in Food by Liquid Chromatographic and Gas Chromatographic Methods. Crit. Rev. Anal. Chem. 2014, 44, 107–141. [Google Scholar] [CrossRef] [Scilit] [PubMed]
- Pundir, C.S.; Yadav, N.; Chhillar, A.K. Occurrence, synthesis, toxicity and detection methods for acrylamide determination in processed foods with special reference to biosensors: A review. Trends Food Sci. Technol. 2019, 85, 211–225. [Google Scholar] [CrossRef] [Scilit]
- Quan, Y.; Chen, M.; Zhan, Y.; Zhang, G. Development of an Enhanced Chemiluminescence ELISA for the Rapid Detection of Acrylamide in Food Products. J. Agric. Food Chem. 2011, 59, 6895–6899. [Google Scholar] [CrossRef] [Scilit] [PubMed]
- Liang, Y.; Zeng, Y.; Luo, L.; Xu, Z.; Shen, Y.; Wang, H.; Hammock, B.D. Detection of Acrylamide in Foodstuffs by Nanobody-Based Immunoassays. J. Agric. Food Chem. 2022, 70, 9179–9186. [Google Scholar] [CrossRef] [Scilit] [PubMed]
- Khoshbin, Z.; Moeenfard, M.; Abnous, K.; Taghdisi, S.M. Nano-Gold Mediated Aptasensor for Colorimetric Monitoring of Acrylamide: Smartphone Readout Strategy for On-Site Food Control. Food Chem. 2023, 399, 133983. [Google Scholar] [CrossRef] [Scilit] [PubMed]
- Preston, A.; Fodey, T.; Elliott, C. Development of a High-Throughput Enzyme-Linked Immunosorbent Assay for the Routine Detection of the Carcinogen Acrylamide in Food, via Rapid Derivatisation Pre-Analysis. Anal. Chim. Acta 2008, 608, 178–185. [Google Scholar] [CrossRef] [Scilit] [PubMed]
- Dunn, M.R.; Jimenez, R.M.; Chaput, J.C. Analysis of Aptamer Discovery and Technology. Nat. Rev. Chem. 2017, 1, 0076. [Google Scholar] [CrossRef] [Scilit]
- Stanciu, L.A.; Wei, Q.; Barui, A.K.; Mohammad, N. Recent Advances in Aptamer-Based Biosensors for Global Health Applications. Annu. Rev. Biomed. Eng. 2021, 23, 433–459. [Google Scholar] [CrossRef] [Scilit] [PubMed]
- Wang, J.; Li, X.; Lei, H.; Liu, J. Increasing Aptamer Affinity from Millimolar to Nanomolar by Forming a Covalent Adduct for Detecting Acrylamide. Anal. Chem. 2025, 97, 9454–9461. [Google Scholar] [CrossRef] [Scilit] [PubMed]
- Bu, L.; Liu, M.; Yang, Q.; Li, X.; Li, M.; Li, L.; Wang, S.; Lei, S.; Zhang, J. A Portable Near-Infrared Aptasensor Platform for Derivatization-Assisted On-Site Analysis of Acrylamide in Food Samples. Anal. Methods 2026, 18, 4079–4088. [Google Scholar] [CrossRef] [Scilit] [PubMed]
- Lu, X.; Kong, K.Y.S.; Unrau, P.J. Harmonizing the Growing Fluorogenic RNA Aptamer Toolbox for RNA Detection and Imaging. Chem. Soc. Rev. 2023, 52, 4071–4098. [Google Scholar] [CrossRef] [Scilit] [PubMed]
- Micura, R.; Höbartner, C. Fundamental Studies of Functional Nucleic Acids: Aptamers, Riboswitches, Ribozymes and DNAzymes. Chem. Soc. Rev. 2020, 49, 7331–7353. [Google Scholar] [CrossRef] [Scilit] [PubMed]
- Shu, Y.; Liu, S.; Liu, J. Thioflavin T Is a More General and Less Interfering Probe for Aptamer Binding Assays Than SYBR Green I. Anal. Chem. 2025, 97, 19767–19774. [Google Scholar] [CrossRef] [Scilit] [PubMed]
- Risum, A.B.; Bevilacqua, M.; Li, C.; Engholm-Keller, K.; Poojary, M.M.; Rinnan, Å.; Lund, M.N. Resolving Fluorescence Spectra of Maillard Reaction Products Formed on Bovine Serum Albumin Using Parallel Factor Analysis. Food Res. Int. 2024, 178, 113950. [Google Scholar] [CrossRef] [Scilit] [PubMed]
- Ersoy, G.; Henary, M. Roadmap for Designing Donor-π-Acceptor Fluorophores in UV-Vis and NIR Regions: Synthesis, Optical Properties and Applications. Biomolecules 2025, 15, 119. [Google Scholar] [CrossRef] [Scilit] [PubMed]
- Paez-Perez, M.; Kuimova, M.K. Molecular Rotors: Fluorescent Sensors for Microviscosity and Conformation of Biomolecules. Angew. Chem. Int. Ed. 2024, 63, e202311233. [Google Scholar] [CrossRef] [Scilit] [PubMed]
- Grabowski, Z.R.; Rotkiewicz, K.; Rettig, W. Structural Changes Accompanying Intramolecular Electron Transfer: Focus on Twisted Intramolecular Charge-Transfer States and Structures. Chem. Rev. 2003, 103, 3899–4032. [Google Scholar] [CrossRef] [Scilit] [PubMed]
- Bu, L.; Yang, X.; Qu, S.; Hu, J.; Cui, Q.; Wang, M.; Wang, Y.; Shi, K.; Lei, S.; Zhang, J. A Dual-Mode Aptasensor Integrating Ratiometric Fluorescence and Colorimetry for On-Site Cu2+ Detection. Chem. Commun. 2026, 62, 6941–6944. [Google Scholar] [CrossRef] [Scilit] [PubMed]
- Stsiapura, V.I.; Maskevich, A.A.; Kuzmitsky, V.A.; Uversky, V.N.; Kuznetsova, I.M.; Turoverov, K.K. Thioflavin T as a Molecular Rotor: Fluorescent Properties of Thioflavin T in Solvents with Different Viscosity. J. Phys. Chem. B 2008, 112, 15893–15902. [Google Scholar] [CrossRef] [Scilit] [PubMed]
- Mohanty, J.; Barooah, N.; Dhamodharan, V.; Harikrishna, S.; Pradeepkumar, P.I.; Bhasikuttan, A.C. Thioflavin T as an Efficient Inducer and Selective Fluorescent Sensor for the Human Telomeric G-Quadruplex DNA. J. Am. Chem. Soc. 2013, 135, 367–376. [Google Scholar] [CrossRef] [Scilit] [PubMed]
- Stsiapura, V.I.; Maskevich, A.A.; Tikhomirov, S.A.; Buganov, O.V. Charge Transfer Process Determines Ultrafast Excited State Deactivation of Thioflavin T in Low-Viscosity Solvents. J. Phys. Chem. A 2010, 114, 8345–8350. [Google Scholar] [CrossRef] [Scilit] [PubMed]
Disclaimer/Publisher’s Note: The statements, opinions and data contained in all publications are solely those of the individual author(s) and contributor(s) and not of MDPI and/or the editor(s). MDPI and/or the editor(s) disclaim responsibility for any injury to people or property resulting from any ideas, methods, instructions or products referred to in the content. |
© 2026 by the authors. Licensee MDPI, Basel, Switzerland. This article is an open access article distributed under the terms and conditions of the Creative Commons Attribution (CC BY) license.