


Abstract
The characterization of plant-derived extracts is strongly influenced by the extraction procedure and solvent polarity, which determine the recovery of bioactive compounds and volatile constituents. In this study, an electronic nose (E-nose) based on a metal oxide semiconductor (MOS) sensor array was evaluated as a rapid analytical tool for the classification of Cistus extracts obtained using solvents of different polarity. Leaves of Cistus salviifolius, Cistus crispus, and Cistus ladanifer were sequentially extracted with hexane, diethyl ether, tetrahydrofuran (THF), chloroform, ethanol, and methanol. Extraction yield, total phenolic content, flavonoid content, and antioxidant activity were determined, and volatile fingerprints were acquired using the E-nose system. Chemometric analysis was performed using principal component analysis (PCA) and partial least squares discriminant analysis (PLS-DA). Differences were observed among extraction solvents regarding extraction efficiency, phytochemical composition, and antioxidant activity. PCA successfully discriminated extracts according to solvent polarity, explaining between 70.96% and 90.22% of the total variance depending on the Cistus species analyzed. Furthermore, the PLS-DA model achieved a classification accuracy of 87.5%, with sensitivity and specificity values of 87.5% and 97.5%, respectively. These results demonstrate that the combination of E-nose technology and chemometric tools provides a rapid, non-destructive, and cost-effective approach for the classification and characterization of Cistus extracts according to extraction solvent, highlighting its potential application in quality control and process monitoring of plant-derived products.
1. Introduction
The analysis of volatile organic compounds (VOCs) is relevant in food quality assessment, environmental monitoring, plant science, and chemical sensing applications [1,2]. Gas chromatography coupled to mass spectrometry (GC–MS) is widely regarded as a reference technique for VOC characterization because of its high sensitivity and selectivity [3]; however, its relatively complex and time-consuming procedures may limit its suitability for rapid screening applications [4].
Electronic nose (E-nose) systems provide an alternative approach based on the global characterization of volatile profiles [5]. Rather than identifying individual compounds, E-noses combine arrays of partially selective sensors with pattern-recognition methods to generate characteristic fingerprints of complex VOC mixtures [6,7,8]. Their rapid, non-destructive, and cost-effective operation has promoted their application in analytical screening [9,10], particularly using metal oxide semiconductor (MOS) sensors [11]. MOS-based E-noses have been applied to food authentication, plant discrimination, aroma profiling, and quality control of natural products [8,11]. Nevertheless, their application to the discrimination of Cistus extracts according to extraction solvent remains limited. Previous studies on Cistus have mainly characterized volatile profiles using hydrodistillation, HS-SPME, or simultaneous extraction followed by GC–MS or GC–FID [12,13], or investigated the influence of extraction conditions on phenolic and flavonoid contents and biological activity [14,15]. E-nose applications have instead focused primarily on essential oils, adulteration, and terpene-related discrimination [16,17,18].
Chemometric analysis is essential for extracting useful information from multivariate E-nose responses. Techniques such as principal component analysis (PCA) and supervised classification methods facilitate visualization of sample patterns and discrimination based on sensor fingerprints [9,19]. Their combination with sensor arrays therefore provides a suitable strategy for analysing complex VOC datasets [14]. Extraction solvent polarity strongly influences the composition of plant extracts by selectively recovering compounds according to their physicochemical properties. This effect can modify both the chemical composition and volatile fingerprint of the resulting extracts. Cistus species are particularly suitable for investigating these effects because they contain diverse volatile and semi-volatile secondary metabolites, including terpenoids [10,15]. Accordingly, the present study evaluates a MOS-based E-nose combined with chemometric analysis for the discrimination of extracts from different Cistus species obtained using solvents of different polarity. The approach is intended for rapid volatile fingerprinting and classification rather than compound-specific identification, providing a complementary analytical strategy for assessing differences associated with species and extraction conditions. Therefore, the objective of this study was to assess the analytical potential of the E-nose–chemometrics approach for the discrimination of complex plant-derived volatile matrices according to Cistus species and extraction solvent [20,21].
2. Materials and Methods
2.1. Plant Material and Sample Preparation
Leaves of three Cistus species, namely Cistus salviifolius L., Cistus ladanifer L., and Cistus crispus L., were collected in La Codosera (Badajoz, Spain; 39.192156 N, −7.174903 W; 442 m a.s.l.). Botanical identification was performed at the Herbarium of the Scientific and Technological Research Center of the University of Extremadura. Voucher specimens were deposited under accession numbers 088394 (C. salviifolius), 088395 (C. ladanifer), and 088396 (C. crispus). The samples were collected in the spring, when the plant exhibits peak physiological activity, and 5 kg of fresh material was gathered. After collection, plant material was air-dried at room temperature in the sample preparation laboratory of the Ecology Area, Faculty of Sciences, University of Extremadura. Dried leaves were subjected to solid–liquid extraction using a Soxhlet apparatus (Büchi, Flawil, Switzerland). A sequential extraction procedure employing solvents of increasing polarity was carried out in order to obtain fractions enriched in different groups of phytochemicals. The solvents used were hexane, diethyl ether, tetrahydrofuran (THF), chloroform, ethanol and methanol (Sigma-Aldrich, St. Louis, MO, USA). After extraction, the solvents were removed under reduced pressure (70 mmHg) using a rotary evaporator (R-210, Büchi Labortechnik AG, Flawil, Switzerland). The evaporation temperature was adjusted according to the volatility and boiling characteristics of each extraction solvent (hexane, diethyl ether, tetrahydrofuran, chloroform, ethanol, and methanol) to ensure efficient solvent removal while minimizing prolonged thermal exposure of the extracted compounds. After complete solvent removal, the extraction yield was determined gravimetrically and expressed as the percentage of dry extract relative to the initial mass of dry plant material. Prior to E-nose analysis, the dried extracts were reconstituted in the corresponding extraction solvent at a concentration of 10 mg mL−1. Subsequently, a 20 mL aliquot of each reconstituted extract was transferred to the analysis container. All measurements were performed at a controlled temperature of 25 °C. Before data acquisition, the samples were allowed to equilibrate for 10 min in the closed container to promote the accumulation and stabilization of volatile compounds in the headspace.
2.2. Determination of Total Phenolic Compounds
The total phenolic content (TPC) of the extracts was determined using the Folin–Ciocalteu method according to Singleton and Rossi [22]. Briefly, 10 mg of each extract was dissolved in 10 mL of methanol. Aliquots of 1 mL were mixed with 500 μL of Folin–Ciocalteu reagent (Sigma-Aldrich, St. Louis, MO, USA) and 6 mL of distilled water. After 5 min, 1.5 mL of sodium carbonate solution (20%, w/v) (Sigma-Aldrich, St. Louis, MO, USA) and 1.9 mL of distilled water were added. The mixture was homogenized and incubated for 1 h at room temperature. Absorbance was measured at 760 nm using a UV–Vis spectrophotometer (Evolution 220, Thermo Fisher Scientific, Waltham, MA, USA). Methanol was used as the blank. Gallic acid (Sigma-Aldrich, St. Louis, MO, USA) was employed as the calibration standard, and results were expressed as mg gallic acid equivalents (GAE) per gram of extract.2.3. Antioxidant Activity Assays
2.2.1. DPPH Radical Scavenging Assay
The antioxidant activity was evaluated using the DPPH radical scavenging (Sigma-Aldrich, St. Louis, MO, USA) assay following the methodology described by Katalinic et al. [23]. A methanolic DPPH solution (1 × 10⁻⁴ M) was prepared and mixed with extract solutions. Briefly, 1 mL of extract was added to 2 mL of DPPH solution and incubated in darkness at room temperature for 45 min. Absorbance was recorded at 517 nm. Radical scavenging activity was expressed as percentage inhibition according to the corresponding equation. Quercetin was used as the reference antioxidant for calibration purposes.
2.2.2. ABTS Radical Cation Decolorization Assay
The 2,2′-Azinobis (3-ethylbenzothiazoline-6-sulfonic acid) (ABTS radical cation) (Sigma-Aldrich, St. Louis, MO, USA) cation decolorization assay was performed according to the method described by Stratil et al. [24]. The ABTS•+ radical cation was generated by mixing ABTS solution (7 mM) with potassium persulfate (4.95 mM) in a 1:1 ratio and allowing the mixture to react in darkness for 16 h. The resulting solution was diluted to obtain an absorbance of approximately 1.2 at 734 nm. Subsequently, 0.1 mL of extract was mixed with 3.9 mL of ABTS solution and incubated in darkness for 10 min. Absorbance was measured at 734 nm. Antioxidant activity was expressed as percentage inhibition and quantified using a quercetin calibration curve.
2.3. Determination of Total Flavonoid Content
Total flavonoid content (TFC) was determined using the aluminum chloride colorimetric method described by Chang et al. [25]. Briefly, 90 μL of extract was mixed with 1.91 mL of methanol, 0.1 mL of ethanolic AlCl3 solution (5%, w/v), and 2.9 mL of methanol. The mixture was incubated at room temperature for 10 min, and absorbance was measured at 425 nm using a UV–Vis spectrophotometer (Evolution 220, Thermo Fisher Scientific, Waltham, MA, USA). Quantification was performed using a quercetin calibration curve, and the results were expressed as mg quercetin equivalents (QE) per gram of dry extract.
2.4. Electronic Nose Analysis
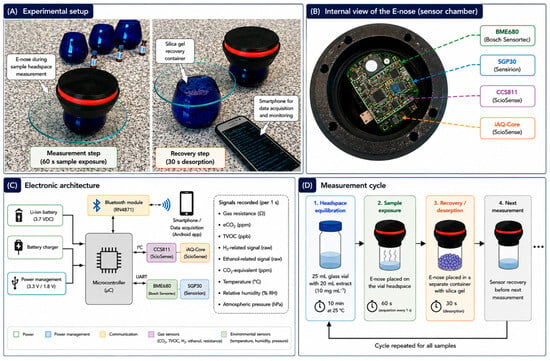
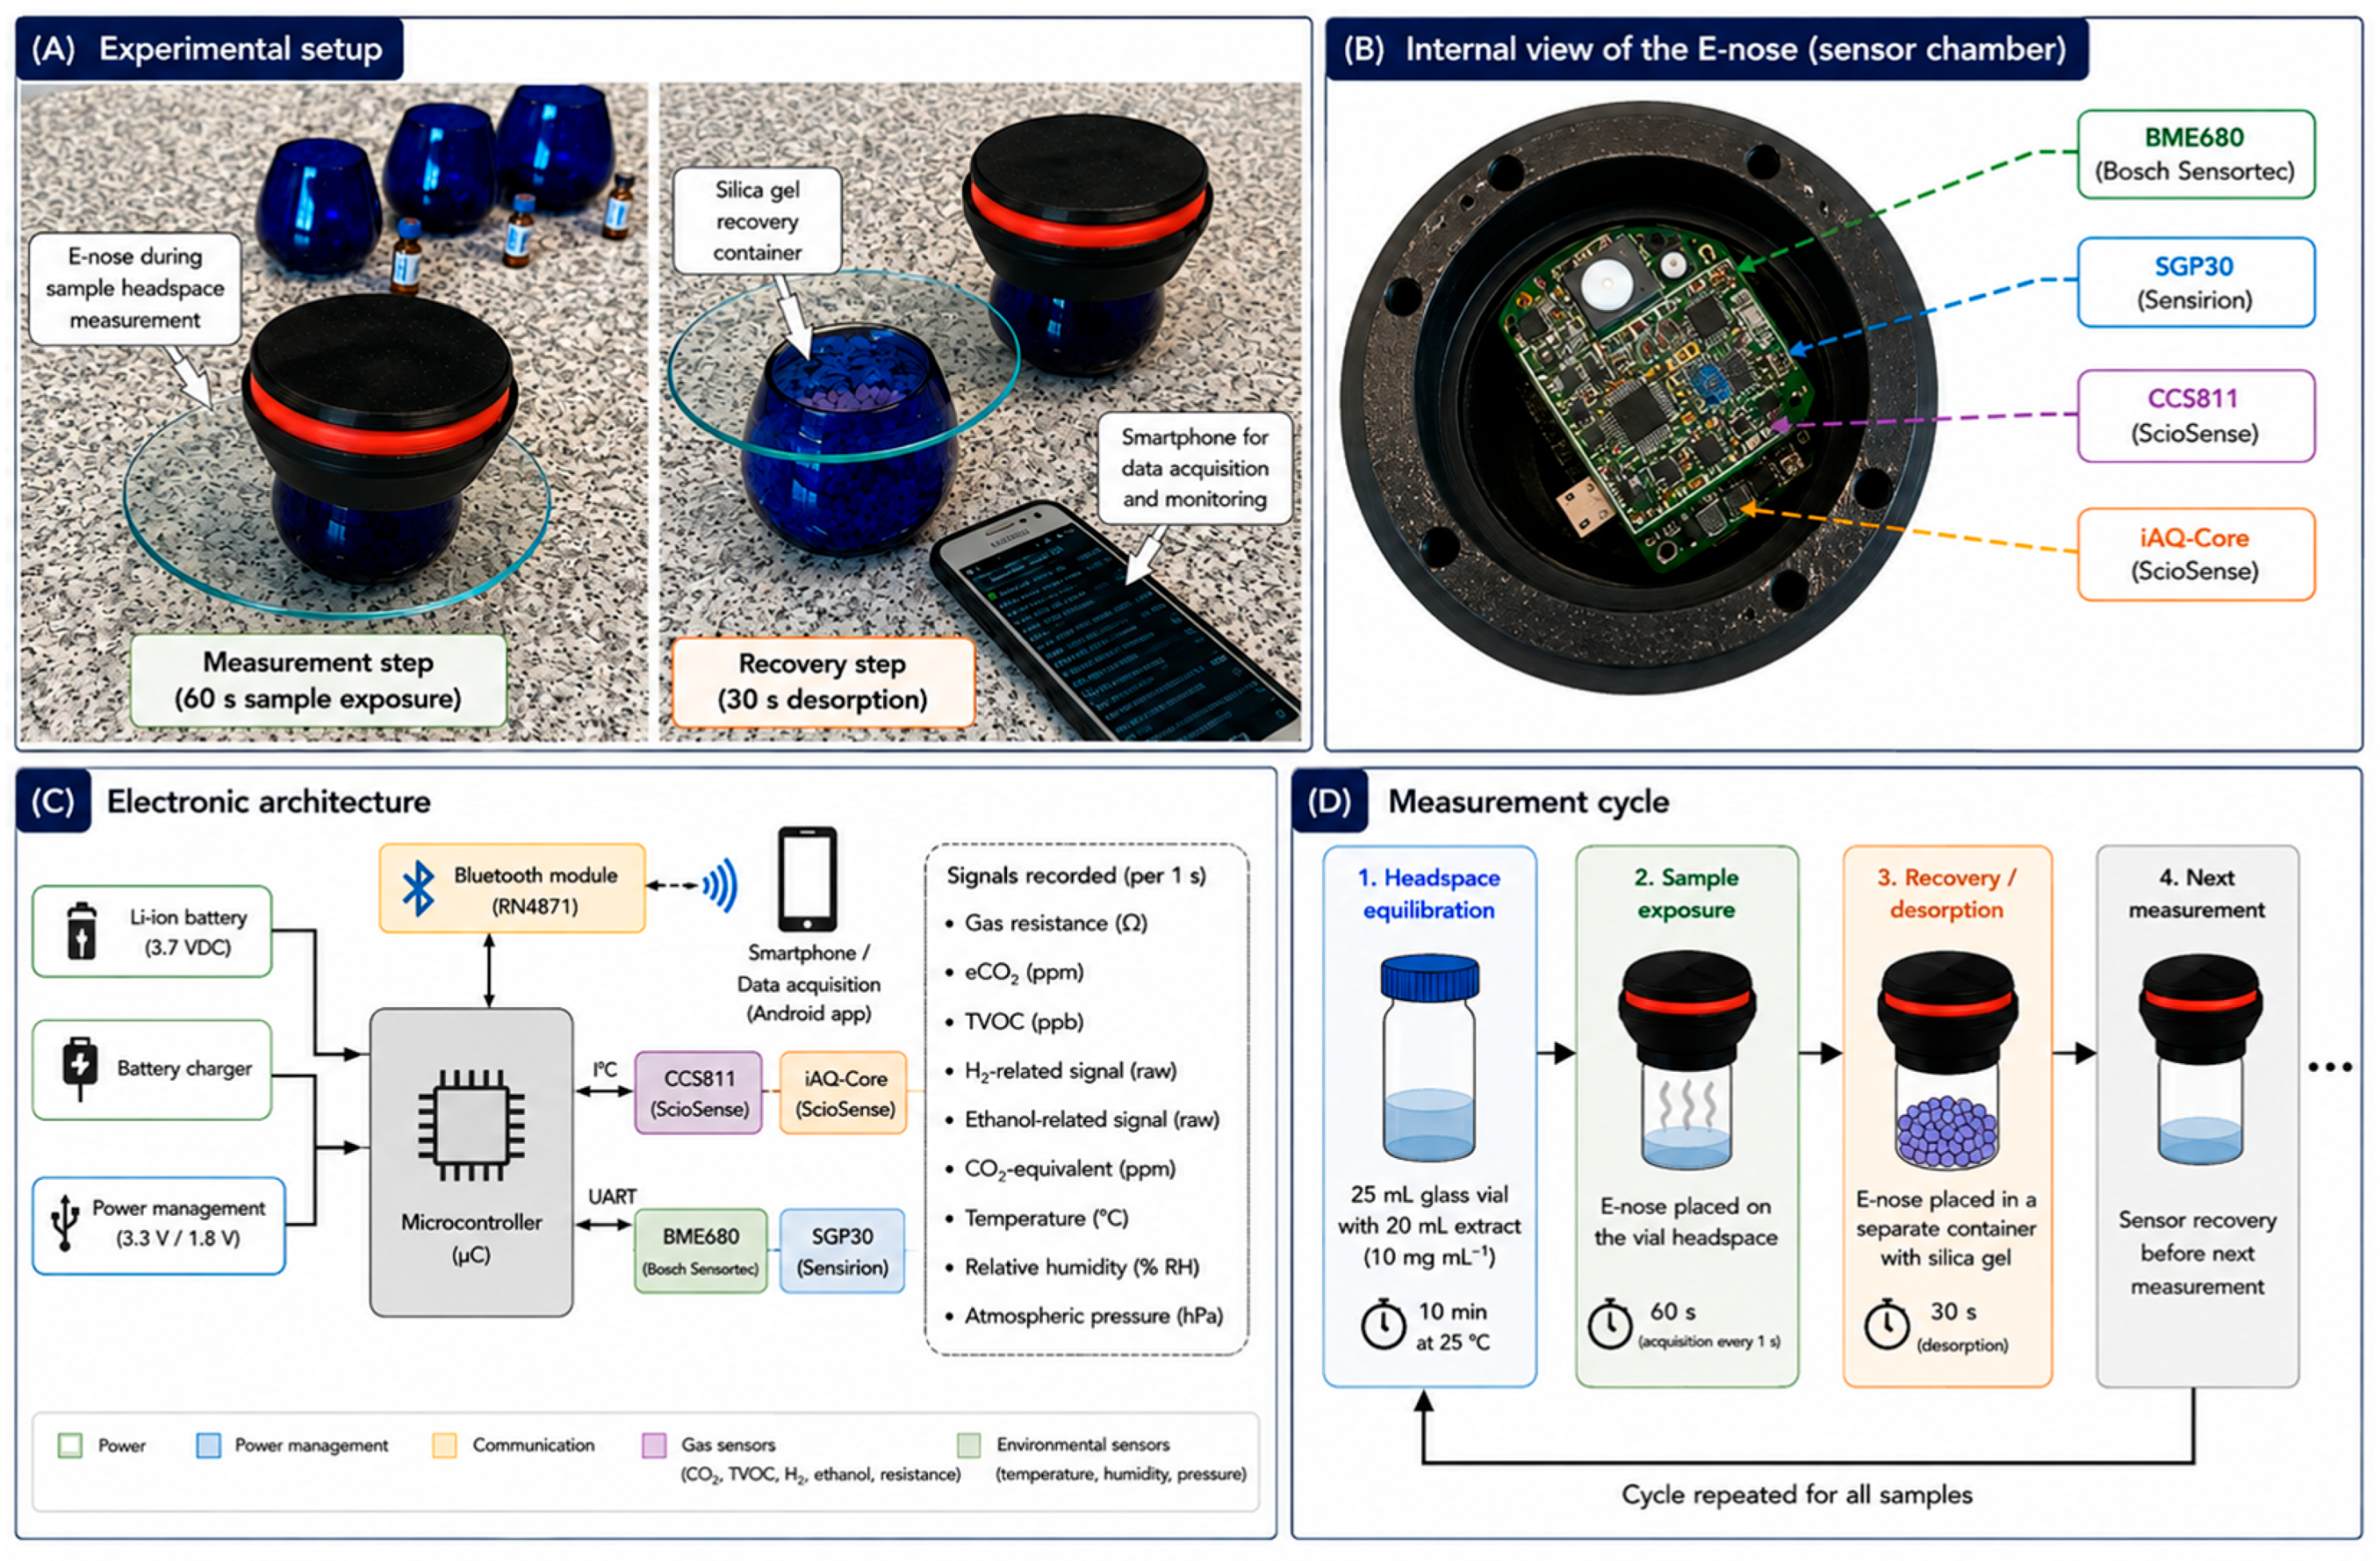
Volatile fingerprints of the extracts were analyzed using an E-nose prototype developed by Extremadura University (Spain), based on the instrumental architecture previously described by Arroyo et al. (2020) [26]. The device integrates four commercially available digital metal oxide semiconductor (MOX) sensor modules: BME680 (Bosch Sensortec), SGP30 (Sensirion), CCS811 (ScioSense), and iAQ-Core (ScioSense) (ScioSense, Eindhoven, The Netherlands). The BME680 provides temperature (°C), atmospheric pressure (hPa), relative humidity (% RH), and gas resistance (Ω); the SGP30 provides equivalent CO2 (eCO2, ppm), total volatile organic compounds (TVOC, ppb), and raw H2- and ethanol-related signals; while the CCS811 and iAQ-Core provide CO2-equivalent/eCO2 and TVOC responses together with sensor-resistance-related outputs (Temperature, atmospheric pressure, and relative humidity were used to monitor measurement conditions and were not considered analytical variables for discrimination. Prior to E-nose analysis, dried extracts were reconstituted in their corresponding extraction solvent at a concentration of 10 mg mL−1. Subsequently, 20 mL of each extract was transferred to a 25 mL glass vial and equilibrated for 10 min at 25 °C to promote stabilization of the volatile headspace. The E-nose was then exposed directly to the sample headspace for 60 s without the use of an external carrier gas. Sensor responses were recorded at 1 s intervals, following the acquisition procedure previously described for this E-nose platform, resulting in 60 temporal readings per sensor output during each sample-exposure period. After each measurement, the sensor array was exposed to a separate container containing silica gel for 30 s to facilitate desorption of residual volatile compounds and recovery of the sensor response before the subsequent analysis (Figure 1).
Figure 1.
Electronic nose device and experimental setup used for volatile fingerprint analysis of Cistus extracts. (A) Experimental setup during sample headspace exposure (60 s) and sensor recovery using silica gel (30 s) between consecutive measurements. (B) Internal view of the E-nose showing the integrated digital sensor modules (BME680, SGP30, CCS811, and iAQ-Core). (C) Schematic representation of the electronic architecture, including power management, microcontroller, Bluetooth communication, sensor modules, and recorded signals. (D) Measurement cycle applied to each sample, comprising headspace equilibration (10 min at 25 °C), sample exposure (60 s), and sensor recovery/desorption using silica gel (30 s) before the subsequent measurement. After each measurement, the E-nose was transferred to a separate container containing silica gel for a 30 s recovery/desorption period. This step promoted the desorption of residual volatile compounds and allowed the sensor responses to approach their pre-exposure baseline before the subsequent measurement, thereby minimizing potential carryover. No external clean-air or inert-gas purge was used because the portable E-nose operates under a static-headspace configuration without an external carrier-gas or pumping system.
Sensor outputs were processed according to the acquisition and signal-processing procedures implemented in the E-nose platform, including signal averaging, baseline compensation, and humidity correction where applicable. The temporal readings obtained during each acquisition were summarized to generate representative sensor-response values for subsequent multivariate analysis and were not considered independent experimental observations. The resulting gas-related sensor responses constituted the volatile fingerprint used for PCA and supervised chemometric analysis. The main target gases/compounds, recorded signal, measurement cycle, and their treatment prior to chemometric analysis are summarized in Table 1.
Table 1.
Electronic nose sensor modules, recorded signals, measurement units, sampling intervals, and data treatment prior to chemometric analysis.
After the equilibration period, the E-nose sensors were directly exposed to the volatile atmosphere generated within the container for an acquisition time of 1 min. No external carrier gas or controlled gas flow was employed, as the sensor array interacted directly with the volatile compounds present in the sample headspace. The analysis vessels were 25 mL glass headspace vials with screw-cap closures, to which the E-nose was coupled to ensure a perfect seal. The E-nose remained connected to the vial throughout the equilibration period, with the adsorption and desorption phases controlled by software. After each measurement, the E-nose was transferred to a separate container containing silica gel for 30 s to facilitate the desorption of residual volatile compounds and the recovery of the sensor response before the subsequent analysis. All measurements were performed at a controlled temperature of 25 °C. The signals generated by the sensing elements were acquired and processed using embedded algorithms for signal averaging, humidity correction, and baseline compensation. Data acquisition and sampling intervals were controlled through ASCII-based communication protocols, while the integrated microprocessor collected, formatted, and transmitted the sensor responses via Bluetooth to an external smart device. After each sample measurement, a desorption and sensor recovery step was performed by exposing the E-nose to a separate container containing silica gel. This procedure facilitated the removal of residual volatile compounds and the recovery of the sensor responses before the subsequent analysis. In addition, solvent blanks were analyzed using the corresponding extraction solvent to assess potential background contributions to the sensor signals. Finally, the recorded data were transferred to a computer and organized into a structured data matrix for subsequent statistical and chemometric analysis [27,28,29,30].
2.5. Chemometric and Statistical Analysis
Three independent extractions were prepared for each combination of Cistus species and extraction solvent, representing three independent experimental replicates. Each independent extract was subsequently measured three times with the electronic nose, corresponding to three technical E-nose replicates per extract. During each E-nose acquisition, multiple temporal sensor readings were recorded over the 60 s measurement period at 1 s intervals; these temporal readings were averaged and were not treated as independent replicates. Thus, independent extractions, technical E-nose measurements, and within-acquisition temporal readings represented three distinct levels of the experimental design. The chemometric dataset was constructed from the resulting averaged E-nose responses after data-quality screening and removal of measurements considered unsuitable for analysis. After data-quality screening, the final dataset used for supervised chemometric analysis comprised 73 retained E-nose observations: 12 for hexane (Merck, Darmstadt, Germany), 12 for diethyl ether (Merck, Darmstadt, Germany), 12 for etrahydrofuran (THF) (Merck, Darmstadt, Germany), 12 for chloroform (Merck, Darmstadt, Germany), 13 for ethanol (Merck, Darmstadt, Germany), and 12 for methanol (Merck, Darmstadt, Germany). The unequal class sizes resulted from the exclusion of measurements during data-quality screening. The PLS-DA model was internally evaluated using five-fold cross-validation. In each iteration, four folds constituted the training set used to build the model, whereas the remaining fold was held out and used exclusively for internal validation. The sensor-response features used as input variables were obtained from the acquisition and signal-processing procedure described in Section 2.5 before construction of the chemometric dataset. No additional fold-specific preprocessing was applied during cross-validation. Classification performance was evaluated in terms of accuracy, sensitivity, and specificity. For the multiclass PLS-DA model, sensitivity and specificity were calculated using a one-versus-rest approach, in which each solvent class was successively considered as the positive class and all remaining classes as the negative class. Sensitivity was calculated as TP/(TP + FN), whereas specificity was calculated as TN/(TN + FP). Volatile fingerprint data obtained from the electronic nose were subjected to principal component analysis (PCA) using SPSS Statistics version 18.0 (SPSS Inc., Chicago, IL, USA). PCA was applied to reduce data dimensionality and visualize clustering patterns among extracts obtained using different solvents. The percentage of variance explained by the principal components was used to evaluate the discriminatory capability of the electronic system.
3. Results and Discussion
3.1. Extraction Yield of Cistus spp. Extracts Obtained with Solvents of Different Polarities
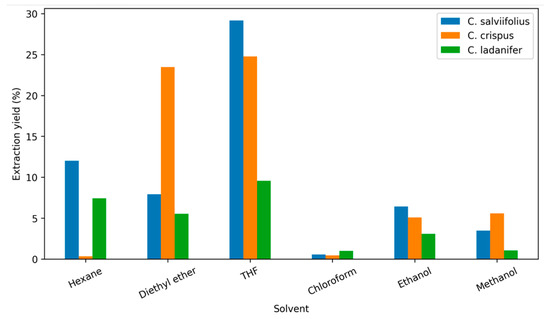
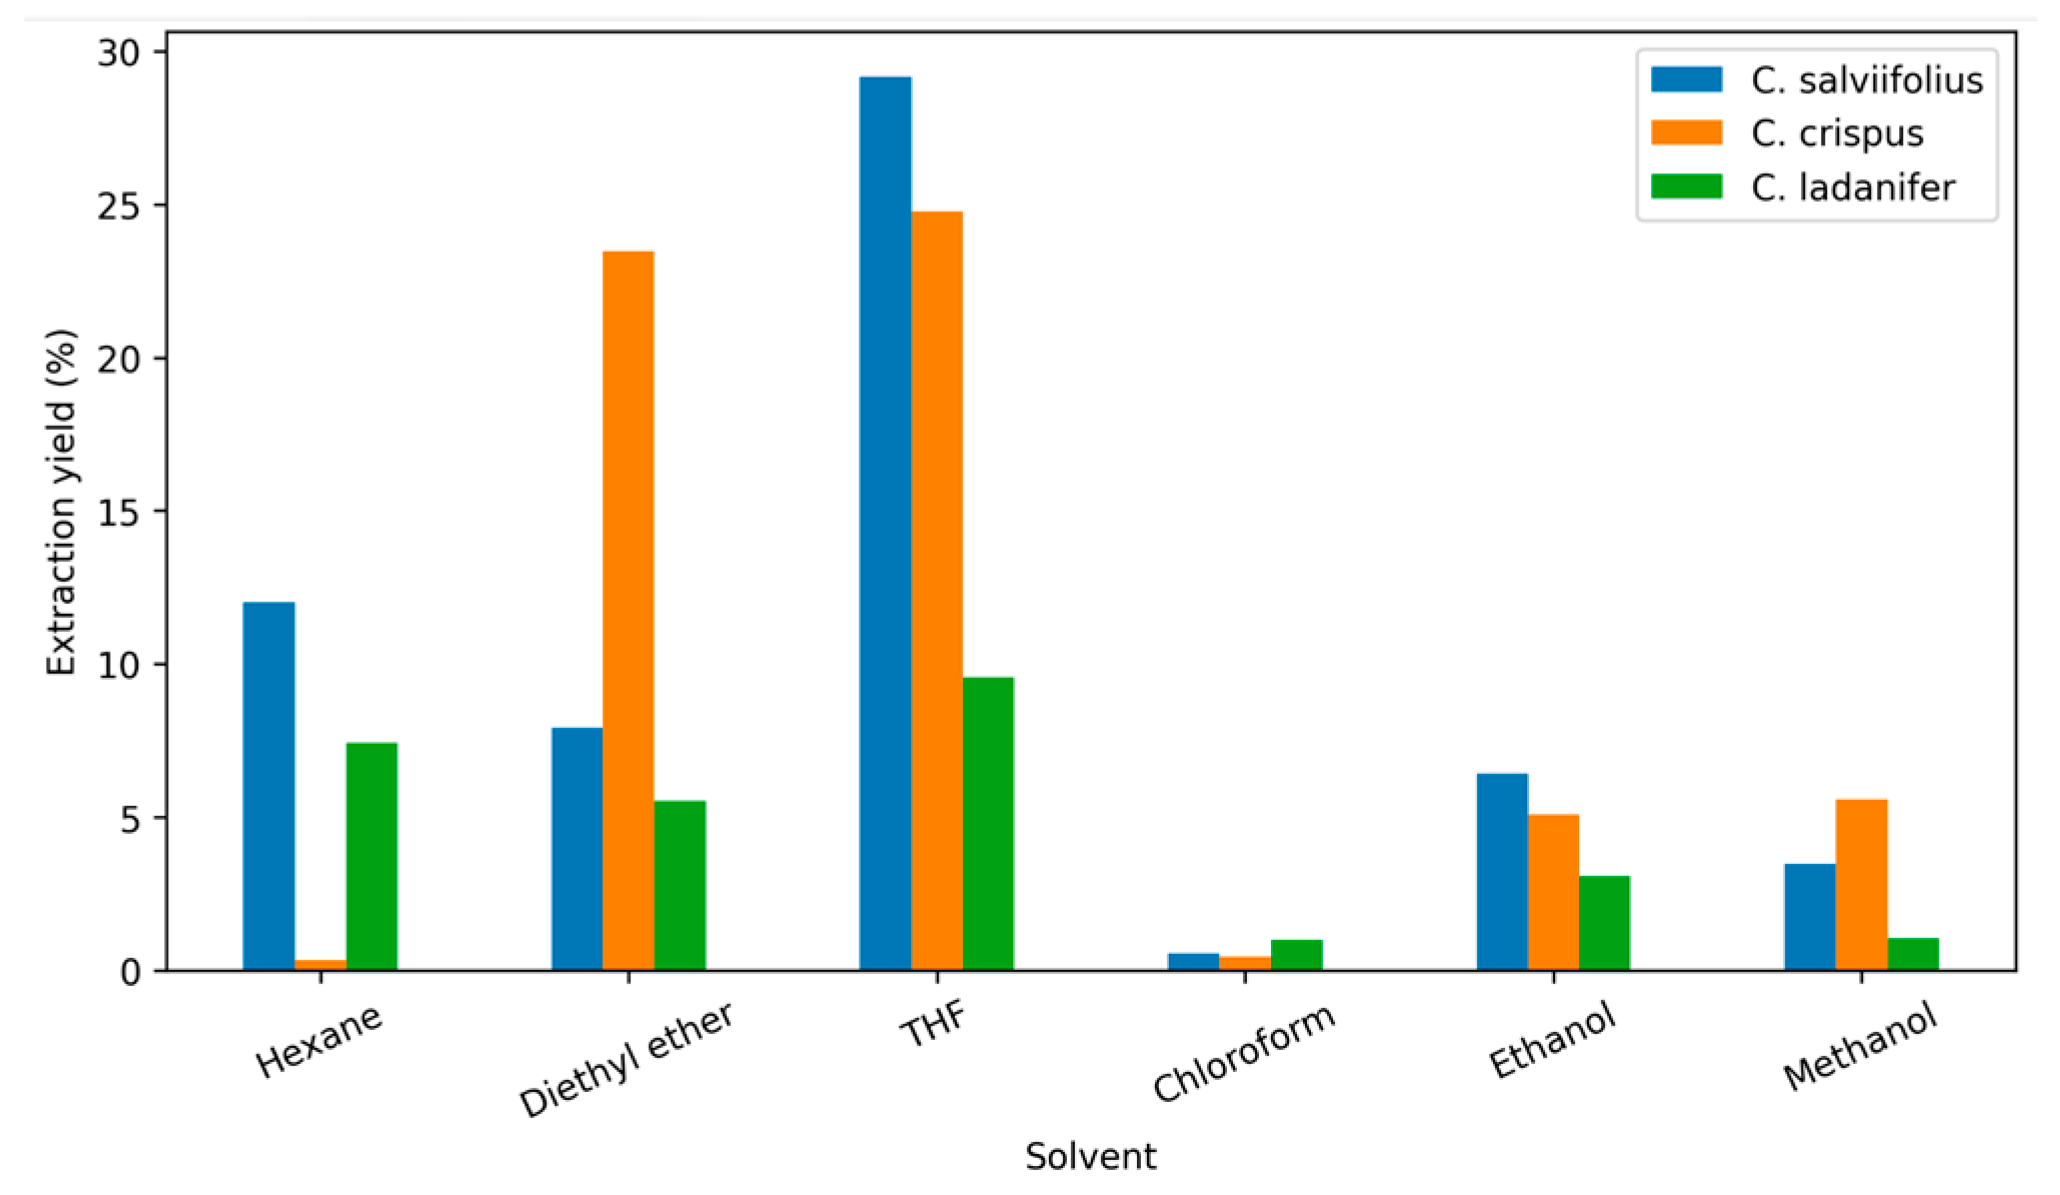
The extraction yields obtained from Cistus salviifolius, Cistus crispus, and Cistus ladanifer using solvents of increasing polarity are presented in Figure 2. Differences were observed among solvents and plant species, suggesting an influence of solvent polarity on extraction efficiency and metabolite recovery.
Figure 2.
Extraction yields (%) obtained for Cistus salviifolius, Cistus crispus, and Cistus ladanifer using solvents of increasing polarity. THF showed the highest extraction efficiency for all species, whereas chloroform produced the lowest yields.
Among the solvents evaluated, tetrahydrofuran (THF) provided the highest extraction yields for all species, reaching 29.18% for C. salviifolius, 24.78% for C. crispus, and 9.56% for C. ladanifer. In contrast, chloroform exhibited the lowest extraction efficiencies, with yields below 1% in all cases. Intermediate extraction yields were obtained with hexane and diethyl ether, whereas ethanol and methanol showed moderate extraction performance.
The differences observed among solvents can be attributed to their physicochemical properties, particularly polarity, which strongly influences the solubility of plant secondary metabolites and consequently extraction efficiency [29,30]. Solvents with intermediate polarity, such as THF and diethyl ether, may facilitate the extraction of a broader range of compounds, including volatile constituents and moderately polar phytochemicals, which are abundant in species of the genus Cistus spp. [31].
Species-specific differences were also detected. C. salviifolius exhibited the highest extraction yields overall, whereas C. ladanifer consistently showed lower recovery values regardless of the solvent employed. Similar variations among Cistus species have been reported previously and have been associated with differences in their phytochemical composition and metabolite distribution [32,33]. The marked variation in extraction yields suggests that solvents of different polarity recovered distinct fractions of secondary metabolites. Since these compounds contribute directly to the volatile profile of plant extracts, differences in solvent extraction are expected to generate characteristic volatile fingerprints that may be detected and discriminated by the electronic system. This hypothesis was further explored through chemometric analysis of sensor response. The substantial differences in extraction yield observed among solvents suggest that distinct groups of metabolites were recovered depending on solvent polarity. Consequently, the resulting extracts are expected to exhibit different volatile fingerprints, which may be discriminated by the electronic nose system.
3.2. Phytochemical Characterization of Cistus Extracts
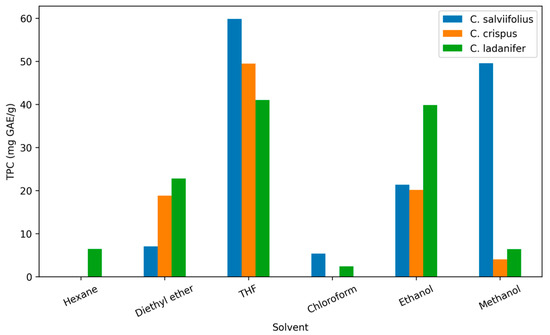
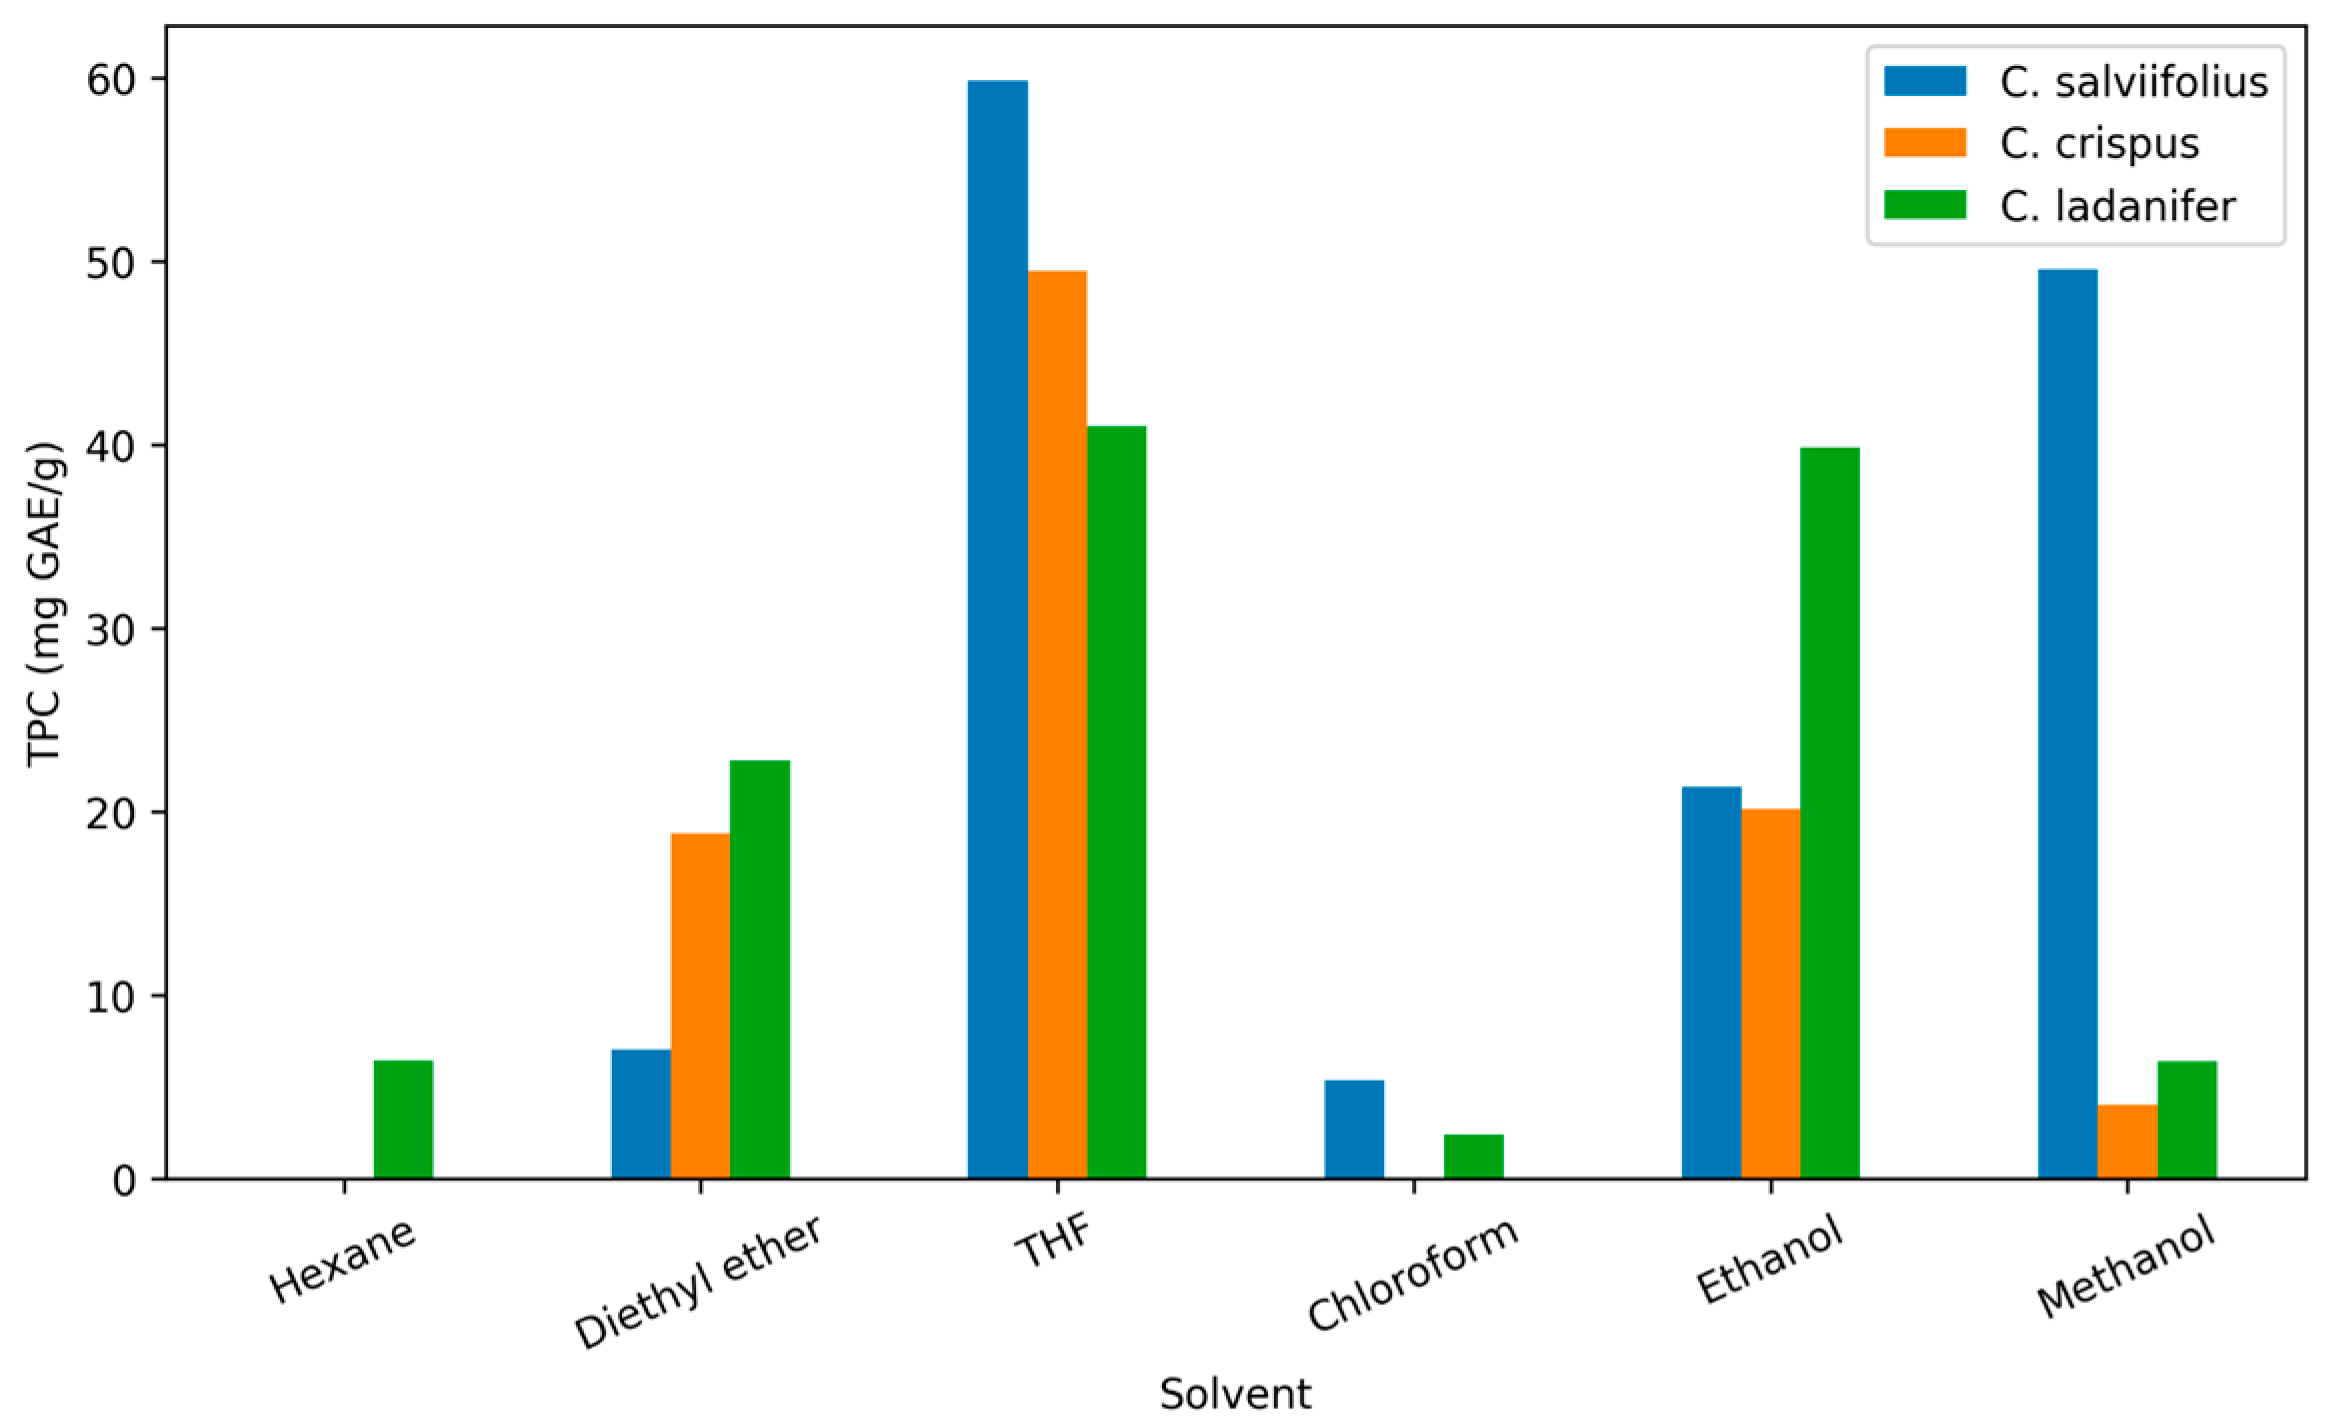
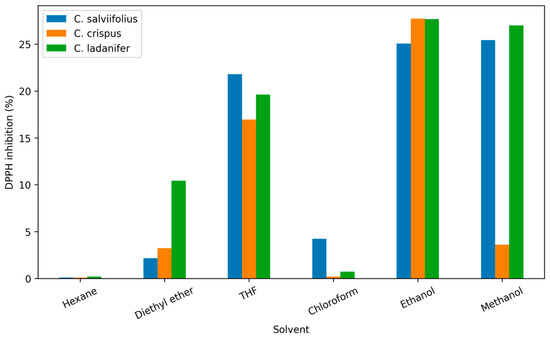
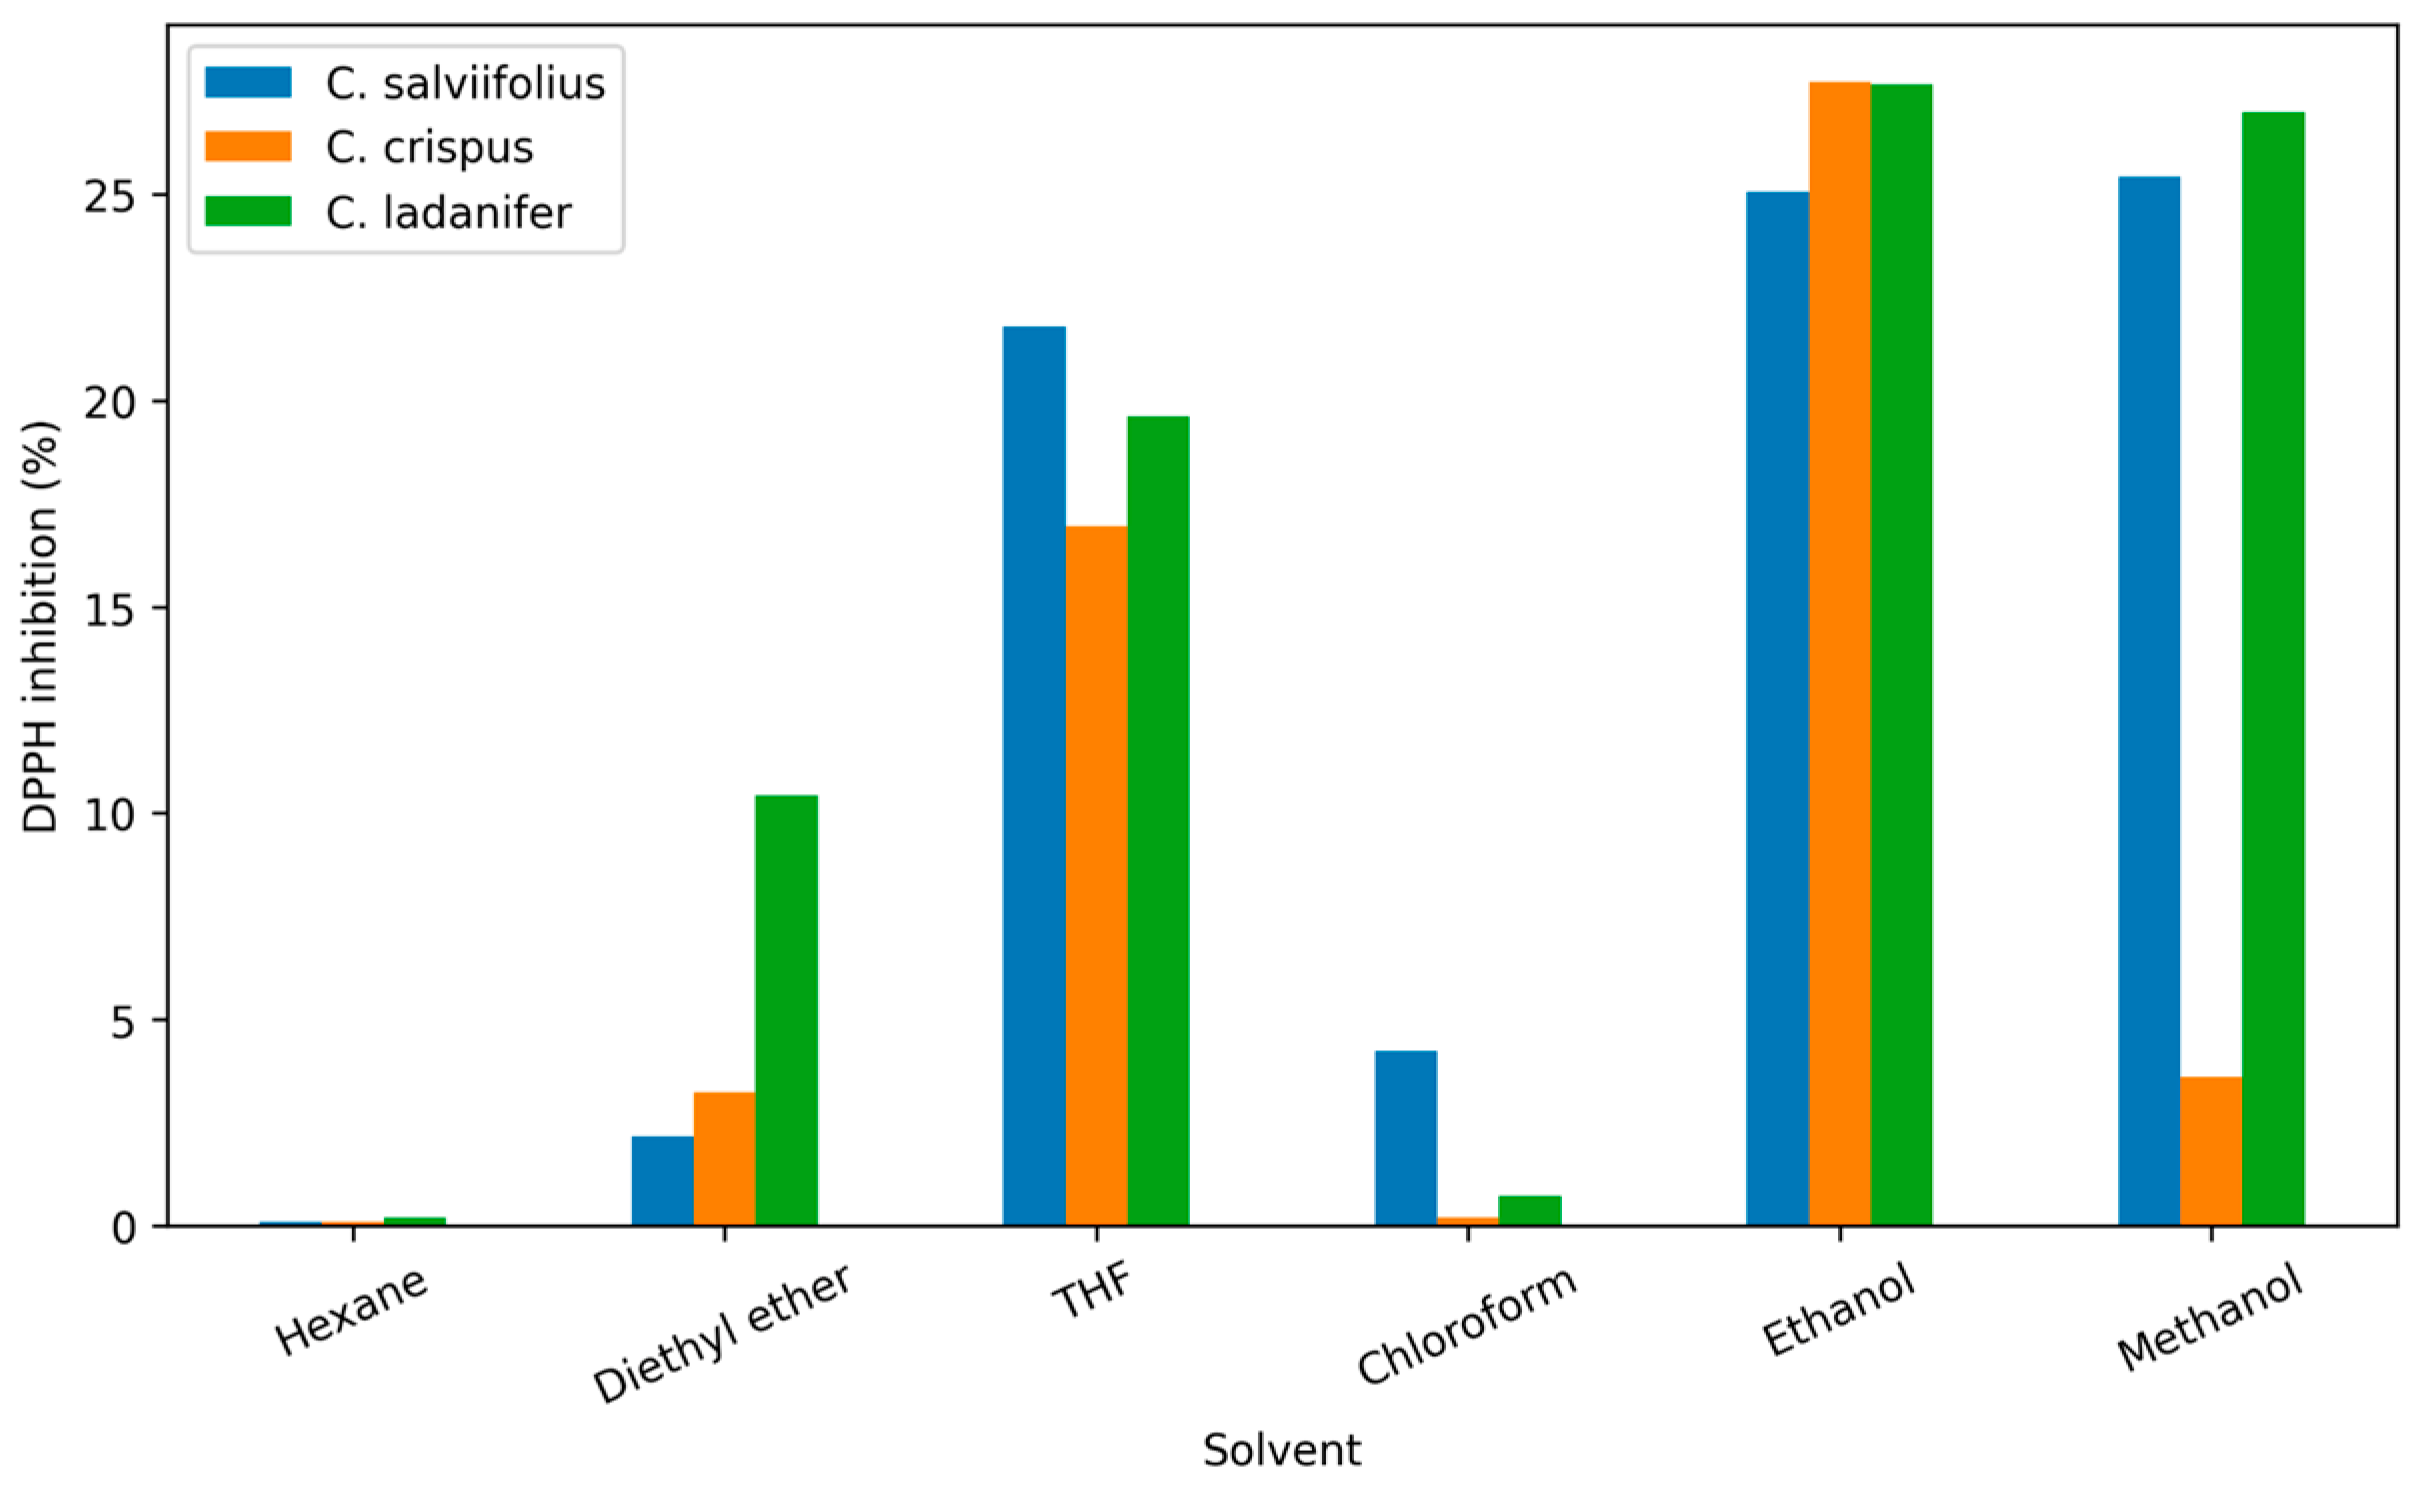
The phytochemical characterization of the extracts revealed substantial differences among extraction solvents and Cistus species (Figure 3 and Figure 4). Total phenolic content, total flavonoid content, and antioxidant activity varied considerably depending on the extraction medium, indicating the selective recovery of bioactive compounds according to solvent polarity.
Figure 3.
Total phenolic content (TPC) of Cistus salviifolius, Cistus crispus, and Cistus ladanifer extracts obtained using solvents of different polarity. THF extracts showed the highest phenolic concentrations in all three species, indicating an enhanced extraction efficiency for phenolic compounds.
Figure 4.
DPPH radical scavenging activity (%) of Cistus salviifolius, Cistus crispus, and Cistus ladanifer extracts obtained using solvents of different polarity. The highest antioxidant activities were generally observed in ethanolic and methanolic extracts, highlighting the influence of solvent polarity on the recovery of antioxidant compounds.
Among the evaluated extracts, THF and methanol generally exhibited the highest total phenolic contents, particularly in C. salviifolius, suggesting a greater affinity of these solvents for phenolic constituents. In contrast, flavonoid concentrations were predominantly associated with diethyl ether extracts, highlighting the influence of solvent polarity on the extraction of specific classes of secondary metabolites. The antioxidant activity measured by DPPH and ABTS assays also showed differences among extracts. In general, ethanolic extracts displayed the highest DPPH radical scavenging activity, whereas lower antioxidant capacities were observed in extracts obtained with less suitable solvents. Similar trends have been reported in previous studies on Cistus species, where solvent selection strongly influenced both phytochemical composition and antioxidant potential [32,33].
The variability observed in phenolic compounds, flavonoids, and antioxidant activity confirms that each solvent recovered distinct phytochemical fractions. Since many of these compounds contribute directly or indirectly to the volatile composition of plant extracts, differences in phytochemical profiles are expected to generate characteristic volatile fingerprints.
3.3. E-Nose-Based Discrimination of Cistus Extracts
The discrimination capability of the electronic system was evaluated through principal component analysis (PCA) of the sensor responses obtained from the different Cistus extracts. The objective was to determine whether the volatile fingerprints generated by extracts obtained with solvents of different polarity could be differentiated using a rapid and non-destructive analytical approach. E-noses based on metal oxide semiconductor (MOS) sensors have been widely applied for the characterization of complex volatile mixtures and the classification of plant-derived materials due to their sensitivity to changes in volatile composition [34]. The PCA score plots revealed distinct clustering patterns according to the extraction solvent, indicating that the electronic nose successfully detected differences in the volatile composition of the evaluated samples. The separation observed among extracts suggests that solvent polarity strongly influenced the composition of the recovered metabolites, resulting in characteristic volatile profiles that could be distinguished by the sensor array. Similar discrimination patterns have been reported in previous studies where electronic devices were combined with chemometric techniques for the classification of botanical materials and natural products [35]. Variations in chemical composition are expected to influence the release of volatile compounds and consequently modify the response pattern of the sensor array. Such relationships between phytochemical composition and volatile fingerprints have been widely documented in plant matrices and aromatic species [36]. The combination of electronic nose technology and PCA demonstrated a strong capacity to discriminate among Cistus extracts obtained using different extraction systems. This approach provides a rapid, non-destructive, and cost-effective alternative to conventional analytical methodologies for the characterization and classification of plant-derived extracts. To further evaluate the discrimination performance of the system, PCA was performed separately for each of the studied species. (See Figure S1)
3.3.1. PCA-Based Discrimination of Cistus salviifolius Extracts
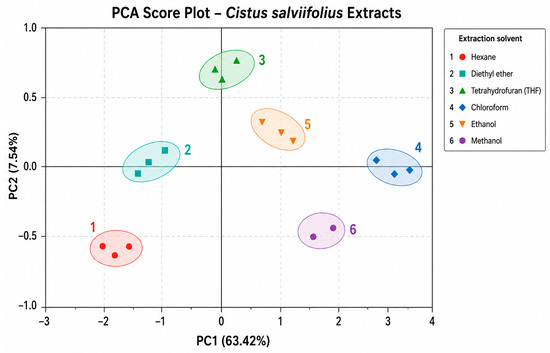
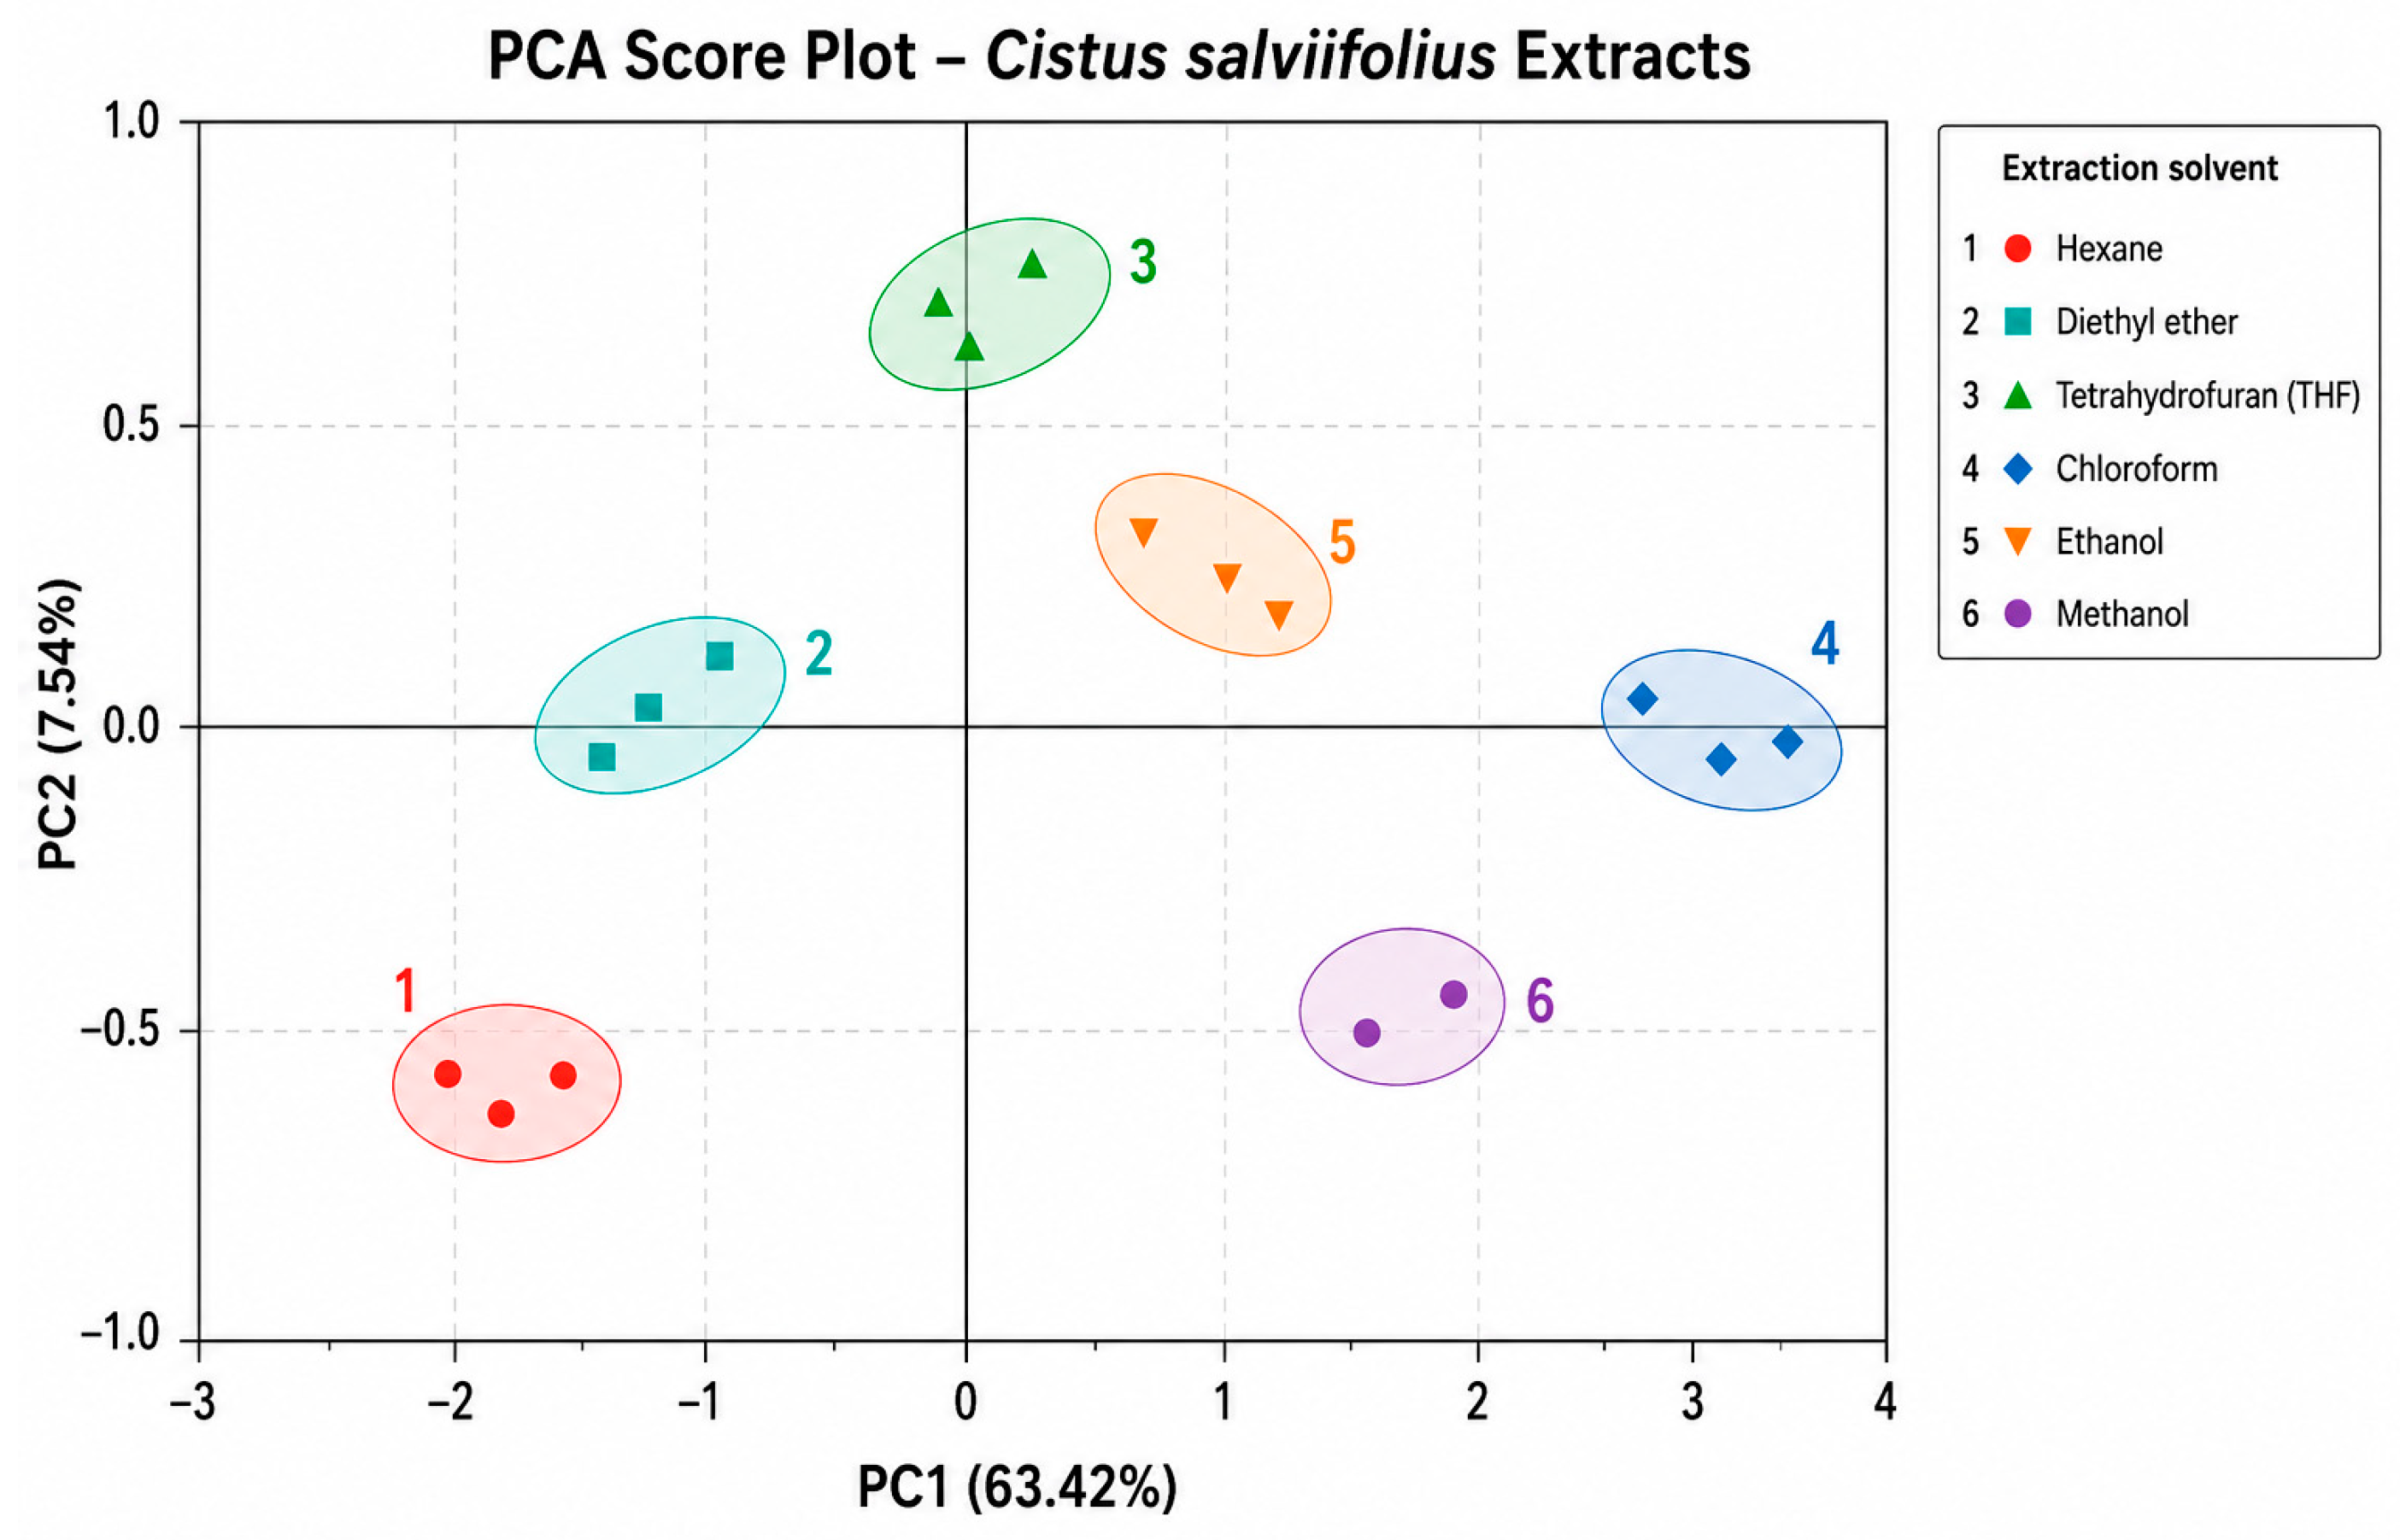
Principal component analysis (PCA) was applied to the electronic nose responses obtained from Cistus salviifolius extracts prepared using solvents of different polarity (Figure 5). The first two principal components explained 70.96% of the total variance, with PC1 and PC2 accounting for 63.42% and 7.54%, respectively. The relatively high percentage of explained variance indicates that the sensor array successfully captured the main sources of variability associated with the volatile fingerprints of the evaluated extracts. The PCA score plot revealed a clear separation among the different extraction solvents, demonstrating the ability of the electronic nose to discriminate extracts according to their volatile composition. Hexane extracts were clearly separated from the remaining samples along the negative side of PC1, whereas THF, ethanol, methanol, diethyl ether, and chloroform extracts occupied distinct regions of the score space. The observed clustering patterns indicate differences in the multivariate E-nose response among extracts obtained with different solvents. However, these PCA results should be interpreted as exploratory, particularly for groups represented by a reduced number of retained observations.
Figure 5.
Principal component analysis (PCA) score plot obtained from the E-nose responses of Cistus salviifolius extracts prepared using solvents of different polarity. PC1 and PC2 explained 63.42% and 7.54% of the total variance, respectively, accounting for 70.96% of the total variability. Numbers indicate the extraction solvent: (1) Hexane, (2) Diethyl ether, (3) Tetrahydrofuran (THF), (4) Chloroform, (5) Ethanol, and (6) Methanol. The score plot shows clear discrimination among extracts and extraction systems. Each point represents an averaged E-nose measurement obtained from a Cistus extract; temporal sensor readings recorded within an individual acquisition were averaged and were not treated as independent observations.
A close spatial relationship was observed between THF and ethanolic extracts, suggesting similarities in their volatile profiles despite differences in solvent polarity. In contrast, methanolic, chloroform, and diethyl ether extracts formed independent clusters, indicating that each extraction system recovered a specific fraction of volatile and semi-volatile compounds. The discrimination achieved in the present study is in agreement with previous investigations reporting the successful application of electronic noses combined with PCA for the classification of medicinal plants and botanical materials. Similar clustering patterns have been reported for aromatic and medicinal plants, where differences in volatile composition were effectively translated into characteristic sensor-response fingerprints and subsequently discriminated through multivariate statistical analysis.
Furthermore, electronic systems have been widely recognized as rapid and non-destructive analytical tools for the characterization and quality assessment of medicinal and aromatic plant products. The combination of sensor arrays and chemometric approaches such as PCA has proven particularly useful for differentiating complex plant matrices based on their volatile signatures. The PCA results demonstrate that the volatile fingerprints of C. salviifolius extracts were strongly influenced by the extraction solvent and confirm the suitability of the electronic nose as a rapid, non-destructive, and cost-effective tool for extract classification. The clear discrimination observed among the evaluated extracts supports the potential application of this methodology in phytochemical characterization and quality-control studies of plant-derived products.
3.3.2. PCA-Based Discrimination of Cistus crispus Extracts
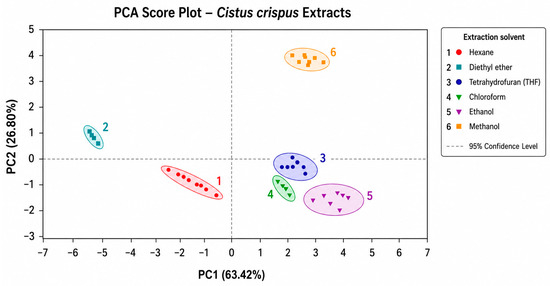
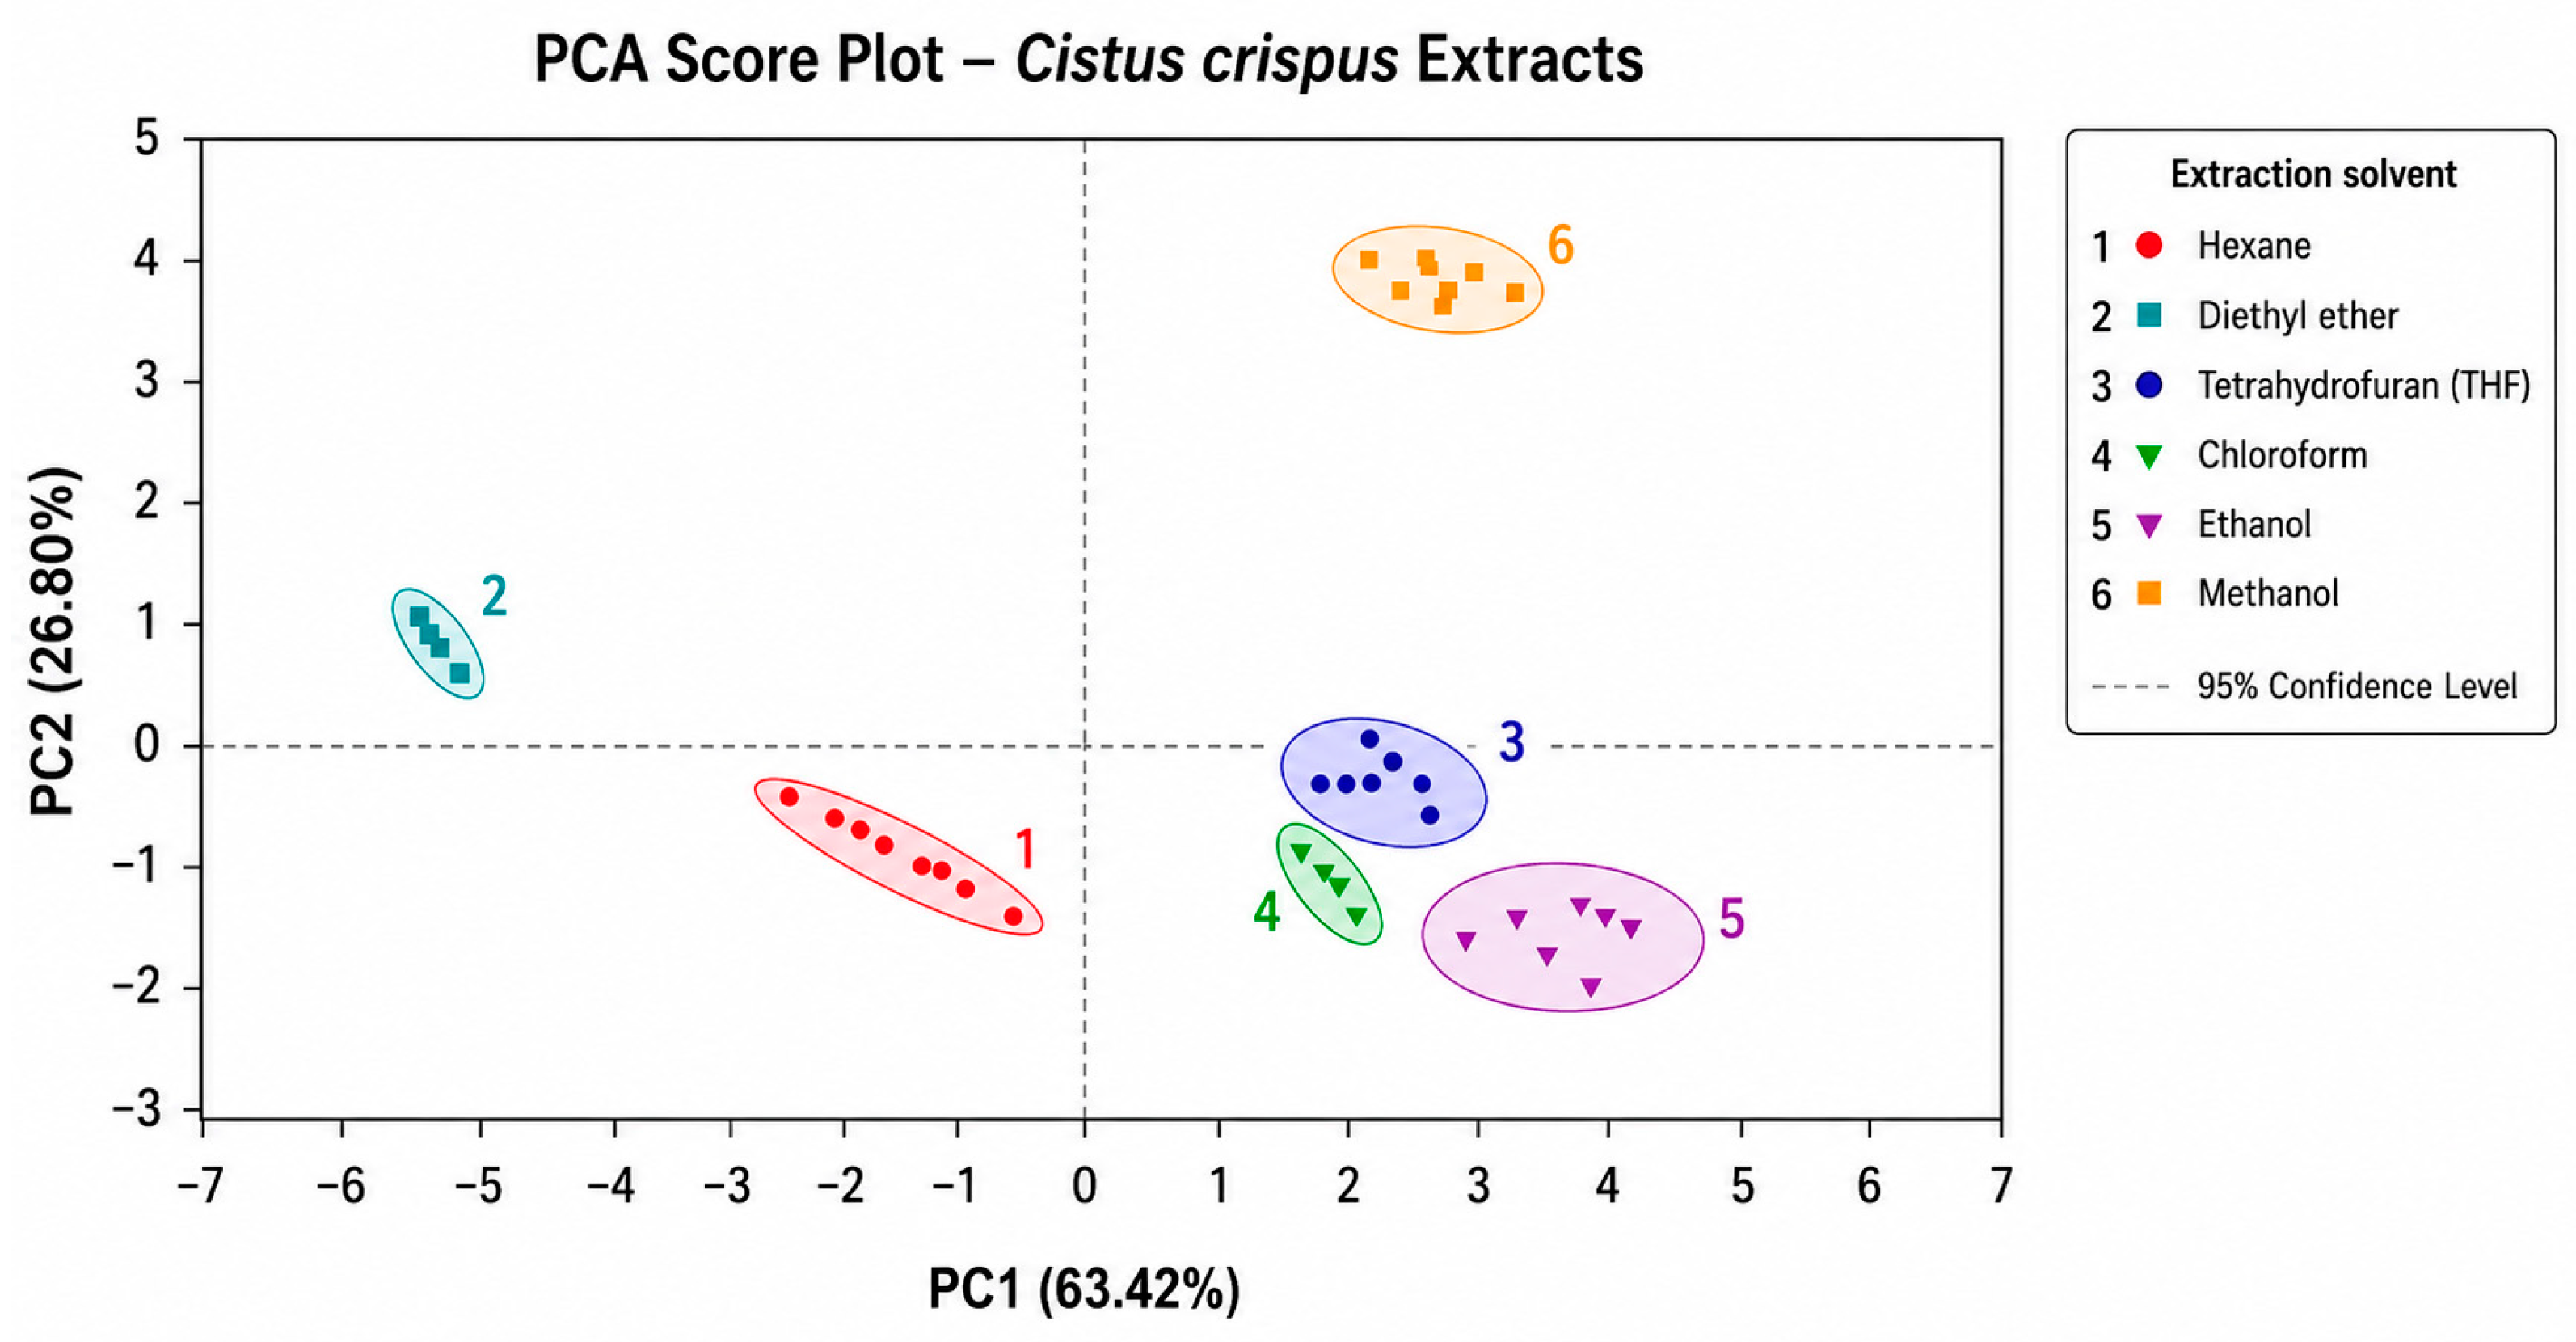
Principal component analysis (PCA) was performed on the electronic nose responses obtained from C. crispus extracts prepared using solvents of different polarity (Figure 6). The first two principal components explained 90.22% of the total variance, indicating that the sensor array captured almost all the relevant information associated with the volatile fingerprints of the evaluated extracts. This high percentage of explained variance demonstrates the suitability of the electronic nose system for the characterization and classification of C. crispus extracts.
Figure 6.
Principal component analysis (PCA) score plot obtained from the electronic nose responses of Cistus crispus extracts prepared using solvents of different polarity. The first two principal components explained 90.22% of the total variance. Numbers indicate the extraction solvent: (1) Hexane, (2) Diethyl ether, (3) Tetrahydrofuran (THF), (4) Chloroform, (5) Ethanol, and (6) Methanol. The score plot shows a clear discrimination among extracts according to solvent polarity and extraction system.
The PCA score plot revealed a clear separation among the different extraction solvents, with all samples forming well-defined clusters and showing minimal overlap between confidence regions. Such clustering behaviour indicates good repeatability of the measurements and highlights the strong influence of solvent polarity on the volatile composition of the obtained extracts. Distinct groupings were observed throughout the PCA space, suggesting that each extraction solvent recovered specific fractions of volatile and semi-volatile compounds. Hexane extracts were clearly separated from the remaining samples, whereas diethyl ether, THF, chloroform, ethanol, and methanol extracts occupied independent regions of the score plot. The marked separation among clusters confirms that the E-nose was able to detect subtle differences in volatile composition generated by the extraction process.
Similar results have been reported for medicinal and aromatic plants, where electronic noses combined with PCA successfully discriminated plant materials according to differences in their volatile fingerprints and chemical composition [37,38]. The use of chemometric techniques together with sensor arrays has proven particularly effective for the rapid characterization and classification of complex botanical matrices [28,39]. The high percentage of explained variance and the clear separation observed among solvent extracts demonstrate the robustness of the proposed methodology and confirm the potential of electronic technology as a rapid, non-destructive, and cost-effective tool for the classification of C. crispus extracts.
3.3.3. PCA-Based Discrimination of Cistus ladanifer Extracts
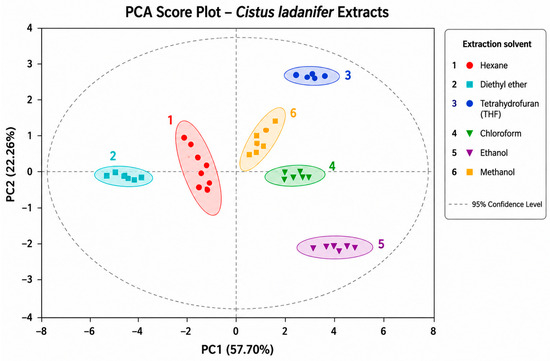
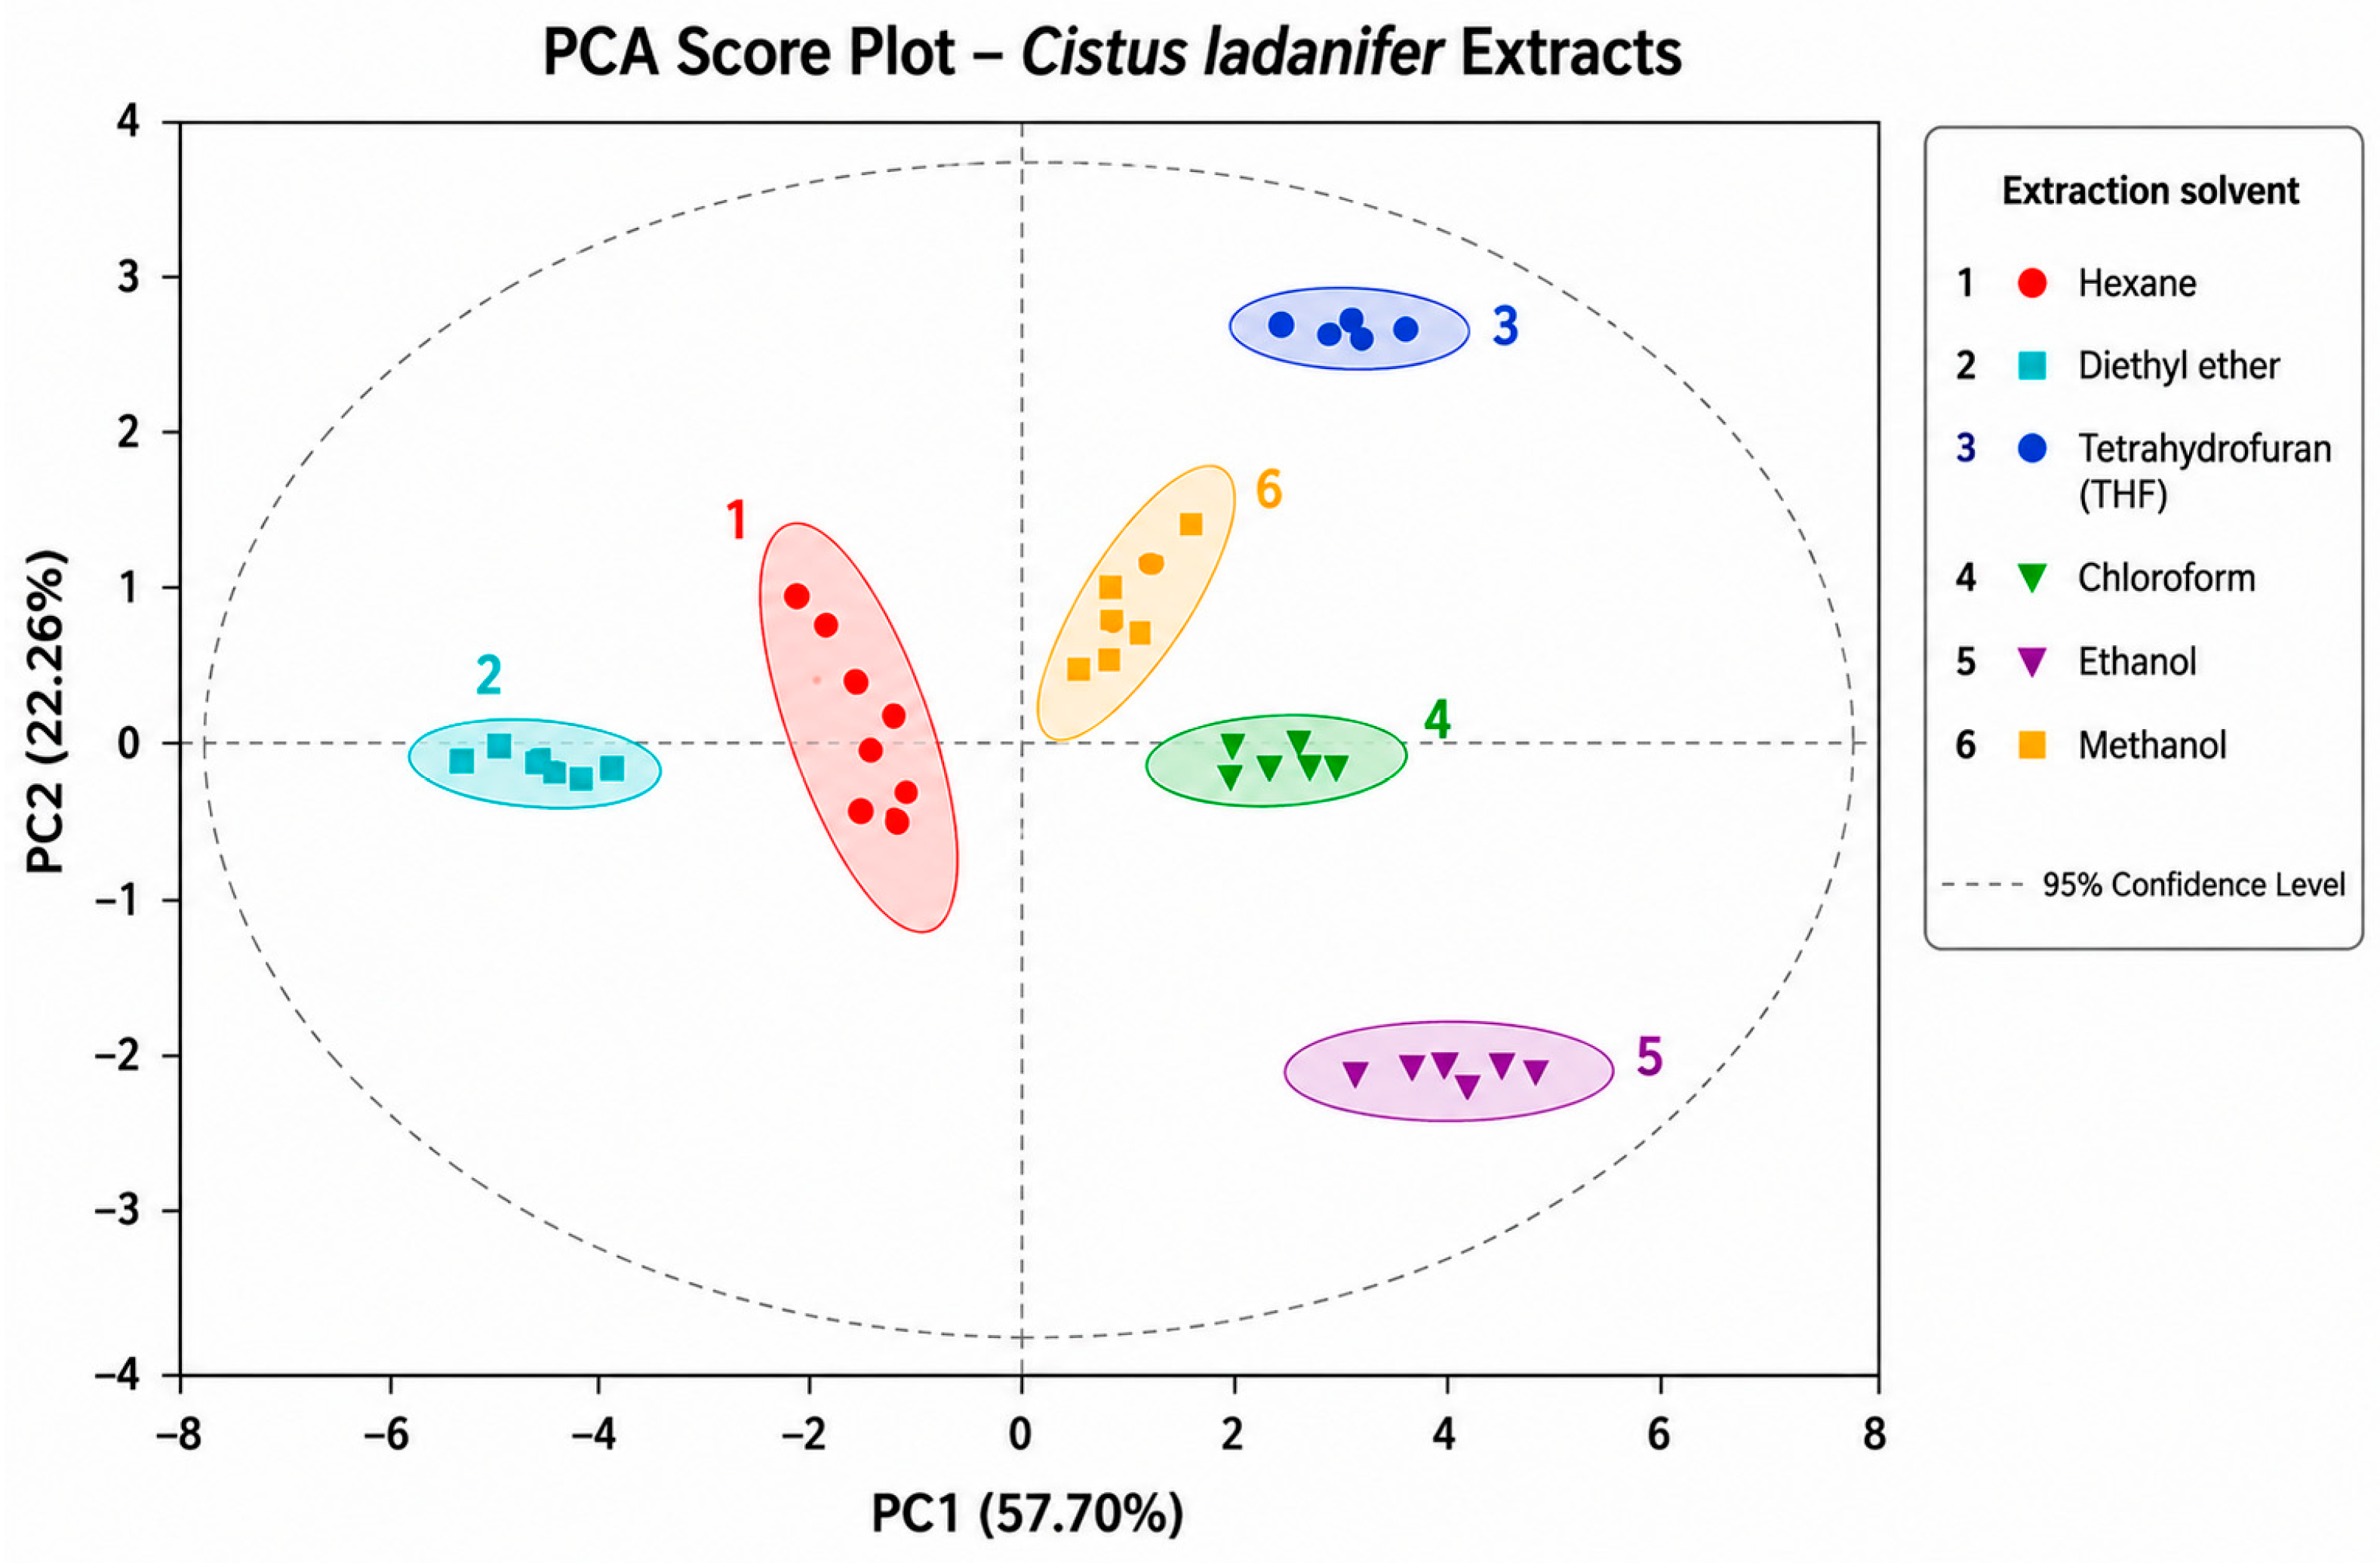
Principal component analysis (PCA) was applied to the electronic nose responses obtained from Cistus ladanifer extracts prepared using solvents of different polarity (Figure 7). The first two principal components explained 79.96% of the total variance, with PC1 and PC2 accounting for 57.70% and 22.26%, respectively. This high percentage of explained variance indicates that the electronic nose successfully captured the major sources of variability associated with the volatile fingerprints of the evaluated extracts. The PCA score plot revealed a clear discrimination among extracts obtained using different solvents. Distinct and well-defined clusters were observed throughout the score space, with minimal overlap between confidence ellipses, demonstrating good repeatability of the measurements and strong discrimination capability of the sensor array. The distribution of the samples along both PC1 and PC2 indicates that solvent polarity exerted a substantial influence on the volatile composition of the extracts.
Figure 7.
Principal component analysis (PCA) score plot obtained from the electronic nose responses of Cistus ladanifer extracts prepared using solvents of different polarity. PC1 and PC2 explained 57.70% and 22.26% of the total variance, respectively, accounting for 79.96% of the variability. Numbers indicate the extraction solvent: (1) Hexane, (2) Diethyl ether, (3) Tetrahydrofuran (THF), (4) Chloroform, (5) Ethanol, and (6) Methanol. The score plot shows a clear discrimination among extracts according to solvent polarity and extraction system.
Hexane and diethyl ether extracts were clearly separated from the remaining samples along the negative side of PC1, whereas THF, chloroform, ethanol, and methanol extracts occupied different regions of the positive PC1 axis. In particular, ethanol extracts were strongly differentiated along the negative side of PC2, while THF extracts appeared in the upper region of the score plot, suggesting the recovery of distinct groups of volatile and semi-volatile compounds. The separation observed among the solvent extracts confirms that each extraction system generated characteristic volatile fingerprints that could be effectively detected by the electronic nose.
These observations are consistent with the phytochemical characterization results, where substantial differences in total phenolic content and antioxidant activity were found among extraction solvents. Since the extraction solvent determines the type and abundance of metabolites recovered from plant matrices, differences in volatile composition are expected and may explain the clustering behaviour observed in the PCA model.
Similar discrimination patterns have been reported in previous studies involving medicinal and aromatic plants, where E-noses combined with PCA successfully differentiated samples according to their volatile profiles and chemical composition [37,38]. Furthermore, the combination of metal oxide semiconductor (MOS) sensor arrays and chemometric tools has demonstrated considerable potential for the rapid characterization and classification of botanical materials and plant-derived products [28,39].
3.4. Supervised Classification and Model Validation
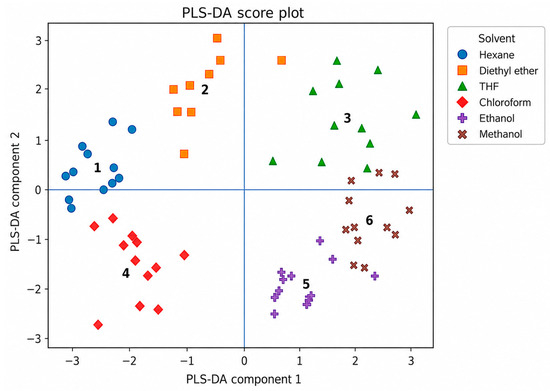
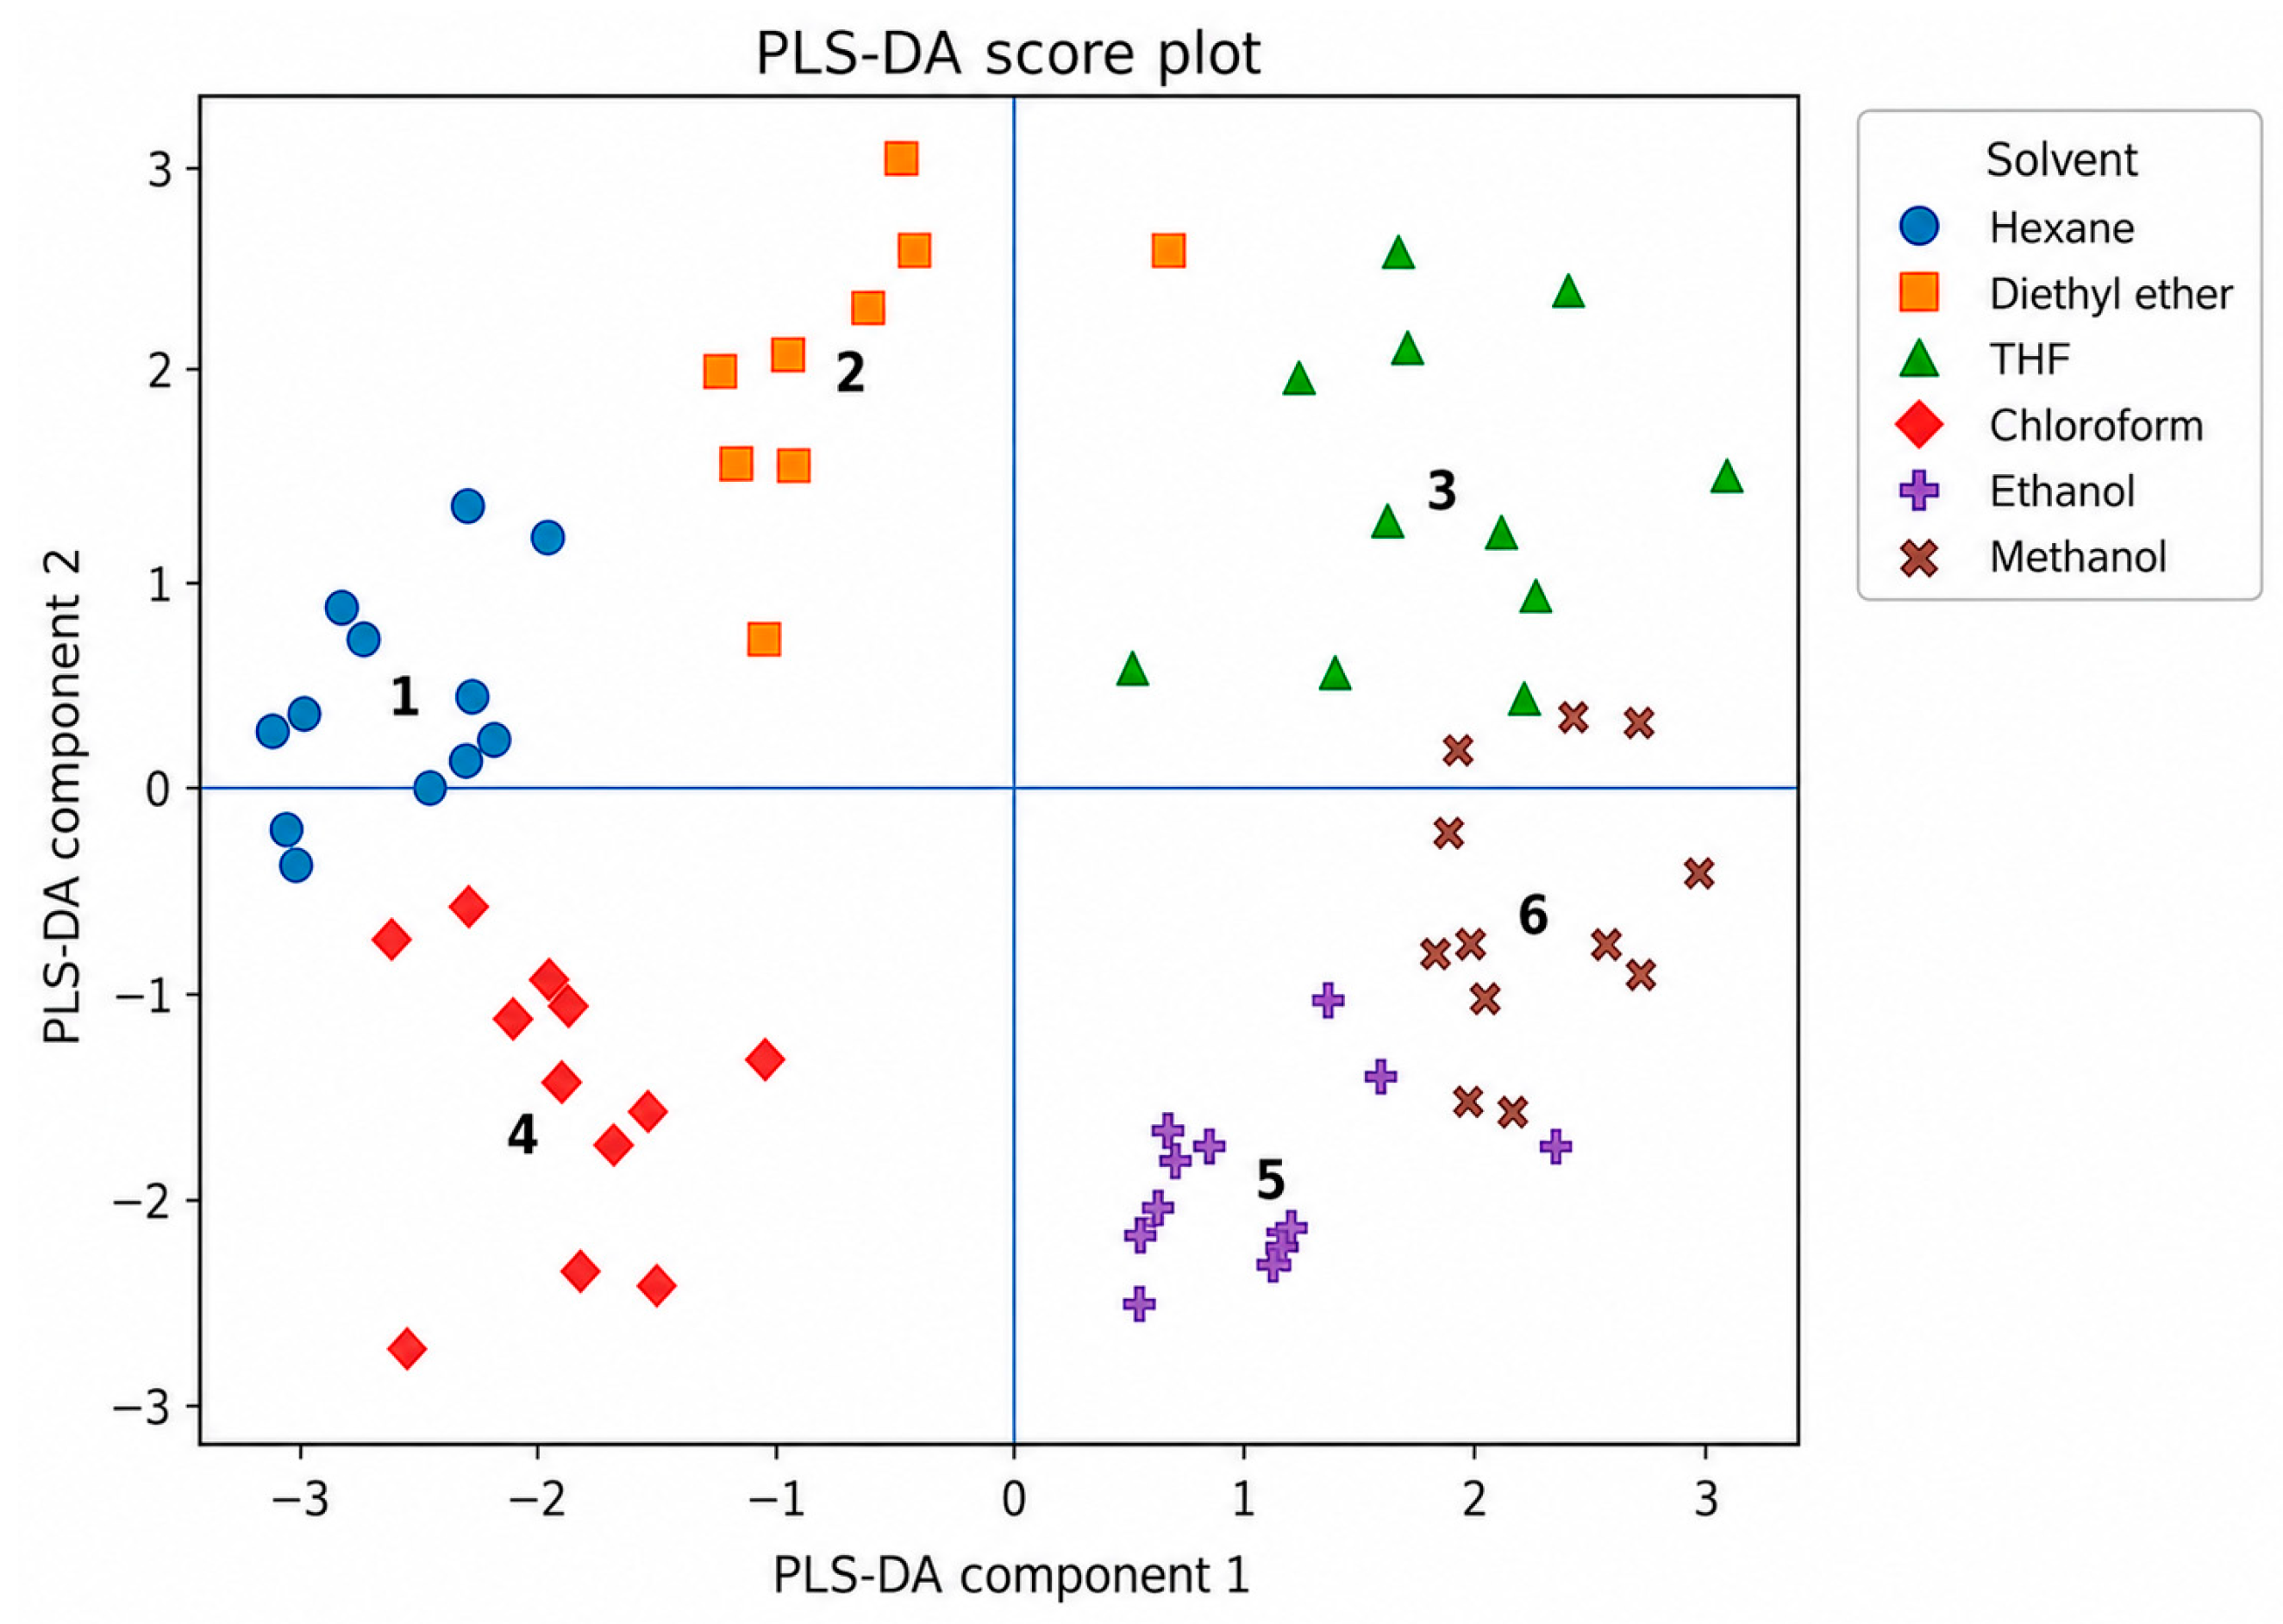
Although the PCA score plots showed clear exploratory separation among several solvent groups, PCA is an unsupervised dimensionality-reduction technique and does not directly provide class predictions. Consequently, the visual separation observed by PCA cannot be directly compared with the predictive accuracy obtained using a supervised classification model. PLS-DA was therefore retained as the supervised approach because it provides explicit class predictions whose performance can be evaluated by cross-validation. To further evaluate the analytical performance of the proposed methodology, a partial least squares discriminant analysis (PLS-DA) model was developed using the E-nose responses as predictor variables and the extraction solvent as the classification variable. Unlike PCA, which is an unsupervised exploratory technique, PLS-DA maximizes class separation and provides information regarding the predictive capability of the analytical model. The PLS-DA score plot (Figure 8) showed a clear discrimination among extracts obtained using the six extraction solvents. All classes formed compact and well-defined clusters, indicating that the volatile fingerprints acquired by the E-nose contained sufficient information for reliable solvent classification. All classes formed compact clusters with only limited proximity between some neighboring groups and no evident class overlap.
Figure 8.
Partial least squares discriminant analysis (PLS-DA) score plot obtained from the E-nose responses of Cistus extracts prepared using different extraction solvents. Numbers indicate the solvent class: (1) Hexane, (2) Diethyl ether, (3) Tetrahydrofuran (THF), (4) Chloroform, (5) Ethanol, and (6) Methanol. The model shows a clear discrimination among extraction systems, demonstrating the suitability of the electronic nose for supervised classification of plant extracts.
The first latent variable primarily separated extracts obtained with less polar solvents from those extracted using more polar solvent systems, whereas the second latent variable further enhanced class discrimination by resolving solvent-specific differences within these groups. Similar clustering patterns have been reported in previous studies employing E-noses combined with supervised chemometric techniques for the classification of plant-derived products and medicinal plants [26,28].
The compact distribution of the samples within each class demonstrates good repeatability of the analytical measurements, whereas the substantial inter-cluster distances between class centroids indicate substantial differences in volatile composition among extraction systems. These results confirm that solvent polarity strongly influences the volatile fingerprints of Cistus extracts and can therefore be effectively monitored using electronic nose technology. The internal predictive performance of the PLS-DA model was assessed by five-fold cross-validation. The classification model achieved an accuracy of 87.5%, together with sensitivity and specificity values of 87.5% and 97.5%, respectively. Comparable applications have demonstrated the potential of E-nose systems coupled with supervised chemometric approaches for advanced screening purposes. Piergiovanni et al. (2025) [27], for example, applied an E-nose combined with PLS-DA for the detection of ergot alkaloid contamination in wheat, achieving 95.5% correct classification. Importantly, the sensor-based discrimination was complemented by HS-SPME/GC–Orbitrap HRMS analysis, which enabled characterization of the volatile compounds associated with the different sample groups. This combined strategy illustrates the complementary roles of E-nose fingerprinting for rapid screening and chromatographic–mass spectrometric techniques for compound-specific characterization [27,40,41,42].
Interestingly, the spatial arrangement of the clusters followed a trend broadly with solvent polarity, suggesting that extraction selectivity strongly influences the volatile composition detected by the E-nose. This observation further supports the capability of the sensor array to capture systematic compositional changes associated with the extraction process.
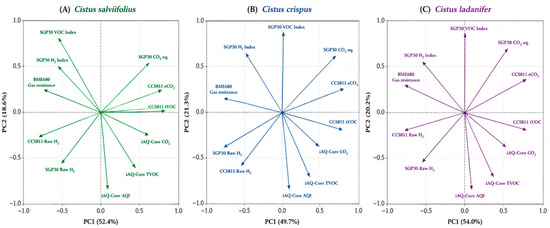
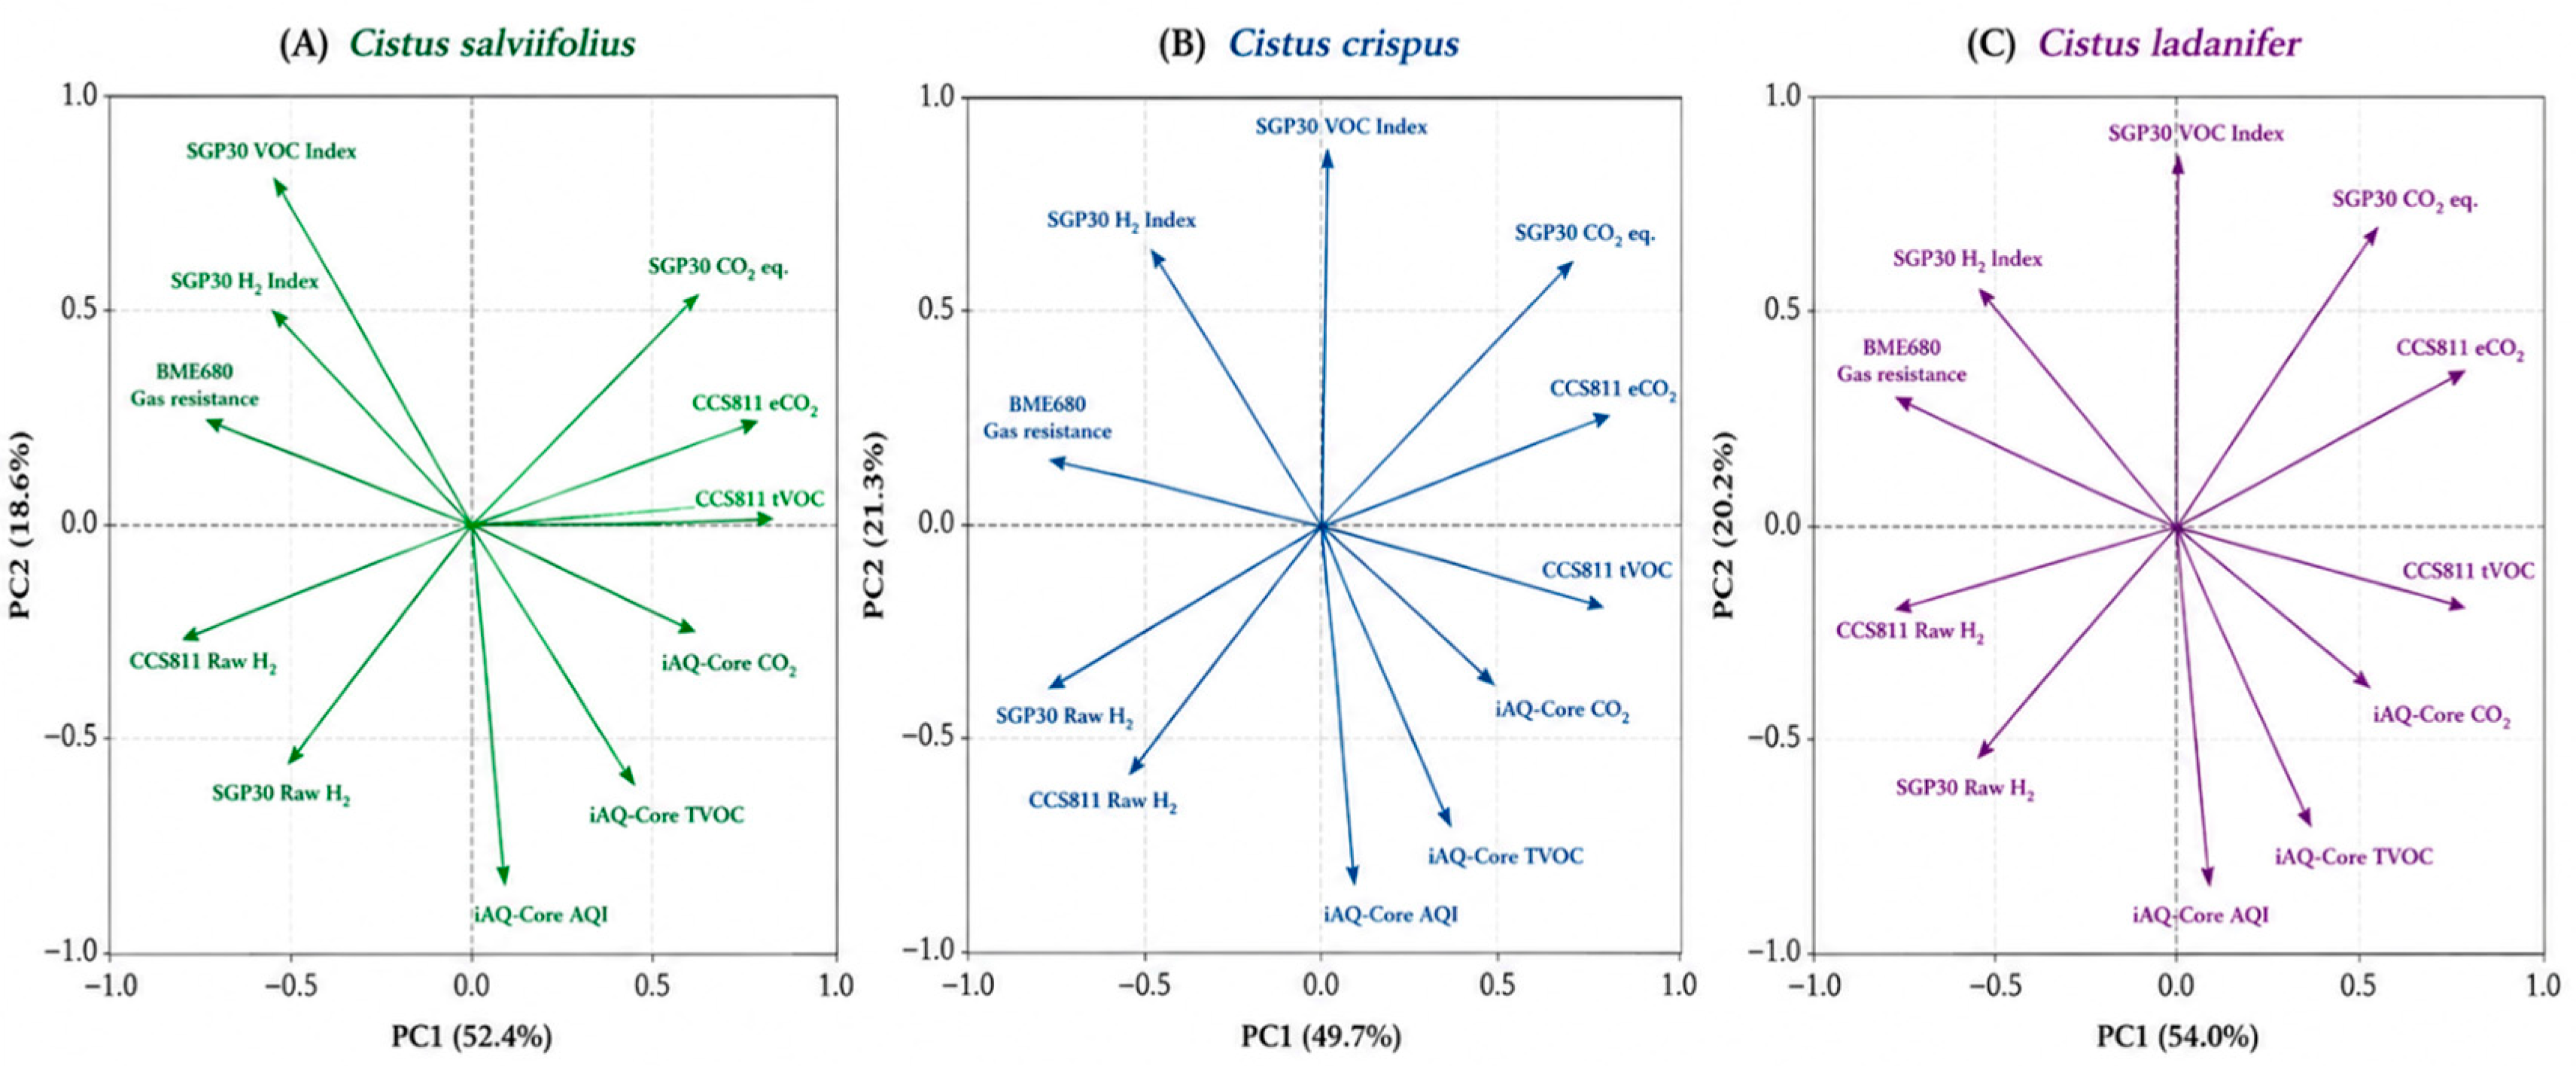
The PCA loading plots provided additional information on the sensor variables contributing to the multivariate patterns observed in the score plots. For C. salviifolius, PC1 was mainly associated with positive contributions from the SGP30 CO2-equivalent and CCS811-related responses, whereas SGP30 H2- and VOC-related variables showed comparatively strong negative contributions. PC2 was particularly influenced by the SGP30 VOC- and H2-related responses, while some iAQ-Core variables were located predominantly in the negative PC2 region. For C. crispus, a similar distribution of sensor responses was observed, although the relative contribution of the individual variables to PC1 and PC2 differed, indicating species-dependent variation in the volatile fingerprints. In C. ladanifer, the orientation of the loading vectors again showed contributions from several sensor modules rather than dominance by a single sensor (Figure 9).
Figure 9.
PCA loading plots showing the contribution of E-nose variables to PC1 and PC2 for (A) Cistus salviifolius, (B) Cistus crispus, and (C) Cistus ladanifer. The direction and magnitude of the loading vectors indicate the association and relative contribution of each sensor variable to the corresponding principal components.
The confusion matrix obtained from five-fold cross-validation provided further insight into the classification performance of the PLS-DA model (Table 2). Most samples were correctly assigned to their corresponding solvent classes, confirming the strong discriminative capability of the electronic nose system toward differences in volatile profiles generated by the extraction solvents. The predominance of correctly classified samples along the main diagonal of the matrix was further reflected by the high class-specific sensitivity values obtained for most solvent classes.
Table 2.
Confusion matrix obtained after five-fold cross-validation of the PLS-DA model.
The final supervised dataset comprised 73 retained E-nose observations, with slightly unequal class sizes resulting from data-quality screening. The confusion matrix obtained from five-fold cross-validation provided further insight into the classification performance of the PLS-DA model. Perfect classification was achieved for hexane extracts, with all samples correctly identified and no misclassifications observed, resulting in a sensitivity of 100% (Table 3). This result indicates that hexane extraction produced a highly distinctive volatile fingerprint that was clearly differentiated from those obtained with the remaining solvents. The absence of confusion with any other class suggests that the compounds extracted under highly non-polar conditions generated a unique sensor response pattern. The present approach was specifically designed for rapid pattern-based discrimination rather than compound-specific VOC characterization. Accordingly, the E-nose responses should be interpreted as multivariate volatile fingerprints, while complementary chromatographic techniques such as GC–MS would provide a different and compound-specific level of analytical information.
Table 3.
Class-specific sensitivity values (%) obtained from the PLS-DA model after five-fold cross-validation of E-nose responses from Cistus extracts prepared using different extraction solvents.
Diethyl ether and THF extracts exhibited similarly high classification rates, with only one sample misclassified in each direction, corresponding to sensitivity values of 91.7% for both classes. This reciprocal confusion likely reflects certain similarities in the volatile composition of extracts obtained with these solvents, which possess intermediate polarity and may extract partially overlapping groups of metabolites. Nevertheless, the very low error rate demonstrates that the electronic nose was capable of distinguishing these two extraction systems with high reliability.
Chloroform extracts also showed excellent classification performance, with only a single sample assigned to another class, resulting in a sensitivity of 91.7%. Although chloroform differs considerably from ethanol in polarity, this isolated misclassification may reflect natural variability in extract composition or minor overlap in specific volatile constituents detected by the sensor array.
The lowest classification performance was observed for ethanol and methanol extracts, which exhibited sensitivity values of 76.9% and 75.0%, respectively. Ethanol samples were primarily confused with methanol, whereas methanol samples were distributed among ethanol, THF, and chloroform classes. These results suggest that the volatile fingerprints associated with these highly polar solvents share a greater degree of similarity than those obtained using less polar extraction systems. Consequently, although the electronic nose successfully classified the majority of samples, the discrimination of extracts obtained with polar solvents proved to be more challenging.
Interestingly, the pattern of misclassification followed a chemically meaningful trend. Most classification errors occurred between solvents with relatively similar extraction characteristics, whereas no confusion was observed between highly dissimilar solvents such as hexane and methanol. This observation suggests that the PLS-DA model captured genuine compositional relationships among the extracts rather than random variations in sensor responses. The confusion matrix and class-specific sensitivity values confirm the robustness of the proposed E-nose–PLS-DA methodology. The high proportion of correctly classified samples, together with the systematic nature of the observed misclassifications, demonstrates that solvent polarity exerts a strong influence on the volatile composition of Cistus extracts and that these differences can be effectively monitored through electronic nose analysis coupled with supervised chemometric modelling.
4. Conclusions
Solvent polarity influenced the extraction yield, phytochemical characteristics, antioxidant activity, and volatile fingerprints of Cistus extracts. The E-nose detected differences among extracts obtained with different solvents, while PCA revealed exploratory clustering patterns for C. salviifolius, C. crispus, and C. ladanifer, with the first two principal components explaining 70.96–90.22% of the total variance.
Supervised PLS-DA provided further evidence of the discriminatory potential of the E-nose responses. Internal five-fold cross-validation yielded an accuracy of 87.5%, with sensitivity and specificity values of 87.5% and 97.5%, respectively. Overall, these results support the potential of E-nose fingerprinting combined with chemometric analysis as a rapid approach for differentiating Cistus extracts according to extraction solvent. Nevertheless, independent external validation and complementary chromatographic characterization, such as HS-SPME–GC–MS, are required to establish model generalizability and relate the sensor fingerprints to specific volatile compounds.
Supplementary Materials
The following supporting information can be downloaded at https://www.mdpi.com/article/10.3390/chemosensors14090197/s1. Figure S1. Representative E-nose sensograms obtained during the analysis of Cistus extracts. Temporal response profiles of the recorded E-nose signals are shown as a function of acquisition time, illustrating the characteristic sensor-response dynamics during sample measurement.
Author Contributions
Conceptualization, D.M.-V. and I.M.F.; Data curation, D.M.-V., I.M.F. and V.M.F.; Formal analysis, D.M.-V., M.F.C. and I.M.F.; Funding acquisition, I.M.F., S.A.S.M. and D.M.-V.; Investigation, D.M.-V., I.M.F., V.M.F. and S.A.S.M.; Methodology, S.A.S.M., M.F.C., I.M.F. and D.M.-V.; Project administration, I.M.F. and D.M.-V.; Resources, I.M.F., V.M.F. and D.M.-V.; Supervision, S.A.S.M. and D.M.-V.; Validation, D.M.-V. and I.M.F.; Visualization, I.M.F. and D.M.-V.; Writing—original draft, I.M.F., S.A.S.M., M.F.C., V.M.F. and D.M.-V.; Writing—review and editing, D.M.-V. All authors have read and agreed to the published version of the manuscript.
Funding
This research was funded by the local government of Extremadura (ref. GR21121—AGA008) and the European Regional Development Fund (FEDER).
Institutional Review Board Statement
Not applicable.
Informed Consent Statement
Not applicable.
Data Availability Statement
The authors confirm that the data supporting the findings of this study are available within the article and the raw data that support the findings are available from the corresponding author, upon reasonable request.
Acknowledgments
We thank the helps the Research Groups of the Junta de Extremadura (ref. GR21121) and National University of Agriculture (Honduras) for their help in the development of this work.
Conflicts of Interest
The authors declare no conflicts of interest.
References
- Wilson, A.D.; Baietto, M. Applications and advances in electronic-nose technologies. Sensors 2009, 9, 5099–5148. [Google Scholar] [CrossRef] [Scilit] [PubMed]
- Ampuero, S.; Bosset, J.O. The electronic nose applied to dairy products: A review. Sens. Actuators B Chem. 2003, 94, 1–12. [Google Scholar] [CrossRef] [Scilit]
- Sparkman, O.D.; Penton, Z.; Kitson, F.G. Gas Chromatography and Mass Spectrometry: A Practical Guide; Academic Press: Oxford, UK, 2011. [Google Scholar]
- Rocha, S.M.; Coimbra, M.A. New insights into aroma compounds in plant matrices. TrAC Trends Anal. Chem. 2011, 30, 151–161. [Google Scholar] [CrossRef] [Scilit]
- Cascos, G.; Barea-Ramos, J.D.; Montero-Fernández, I.; Ruiz-Canales, A.; Lozano, J.; Martín-Vertedor, D. Burn Defect and Phenol Prediction for Flavoured Californian-Style Black Olives Using Digital Sensors. Foods 2023, 12, 1377. [Google Scholar] [CrossRef] [Scilit] [PubMed]
- Loutfi, A.; Coradeschi, S.; Mani, G.K.; Shankar, P.; Rayappan, J.B.B. Electronic noses for food quality: A review. J. Food Eng. 2015, 144, 103–111. [Google Scholar] [CrossRef] [Scilit]
- Barsan, N.; Koziej, D.; Weimar, U. Metal oxide-based gas sensor research: How to? Sens. Actuators B Chem. 2007, 121, 18–35. [Google Scholar] [CrossRef] [Scilit]
- Peris, M.; Escuder-Gilabert, L. A 21st century technique for food control: Electronic noses. Anal. Chim. Acta 2009, 638, 1–15. [Google Scholar] [CrossRef] [Scilit] [PubMed]
- Bro, R.; Smilde, A.K. Principal component analysis. Anal. Methods 2014, 6, 2812–2831. [Google Scholar] [CrossRef] [Scilit]
- Robles, C.; Garzino, S. Infraspecific variability in the essential oil composition of Cistus monspeliensis leaves. Phytochemistry 2000, 53, 71–75. [Google Scholar] [CrossRef] [Scilit] [PubMed]
- Scott, S.M.; James, D.; Ali, Z. Data analysis for electronic nose systems. Microchim. Acta 2007, 156, 183–207. [Google Scholar] [CrossRef] [Scilit]
- Morales-Soto, A.; Oruna-Concha, M.J.; Elmore, J.S.; Barrajón-Catalán, E.; Micol, V.; Roldán, C.; Segura-Carretero, A. Volatile profile of Spanish Cistus plants as sources of antimicrobials for industrial applications. Ind. Crops Prod. 2015, 74, 425–433. [Google Scholar] [CrossRef] [Scilit]
- Abu-Orabi, S.T.; Al-Qudah, M.A.; Saleh, N.R.; Bataineh, T.T. Antioxidant activity of crude extracts and essential oils from flower buds and leaves of Cistus creticus and Cistus salviifolius. Arab. J. Chem. 2020, 13, 6256–6266. [Google Scholar] [CrossRef] [Scilit]
- Bouyahya, A.; Abrini, J.; Et-Touys, A.; Bakri, Y.; Dakka, N. Phytochemical screening, antiradical and antibacterial activities of Cistus crispus from Morocco. J. Mater. Environ. Sci. 2017, 8, 1560–1566. [Google Scholar]
- Gaweł-Bęben, K.; Kukula-Koch, W.; Hoian, U.; Czop, M.; Strzępek-Gomółka, M.; Antosiewicz, B. Characterization of Cistus × incanus L. and Cistus ladanifer L. extracts as potential multifunctional antioxidant ingredients for skin protecting cosmetics. Antioxidants 2020, 9, 202. [Google Scholar] [CrossRef] [Scilit] [PubMed]
- Viciano-Tudela, S.; Sendra, S.; Parra, L.; Jimenez, J.M.; Lloret, J. Proposal of a gas sensor-based device for detecting adulteration in essential oil of Cistus ladanifer. Sustainability 2023, 15, 3357. [Google Scholar] [CrossRef] [Scilit]
- Viciano-Tudela, S.; Parra, L.; Navarro-García, P.; Sendra, S.; Lloret, J. Proposal of a new system for essential oil classification based on low-cost gas sensor and machine learning techniques. Sensors 2023, 23, 5812. [Google Scholar] [CrossRef] [Scilit] [PubMed]
- Díaz Blasco, F.J.; Viciano-Tudela, S.; Parra, L.; Ahmad, A.; Chaloupková, V.; Bados, R.; Esteban Pascual, L.S.; Mediavilla, I.; Sendra, S.; Lloret, J. Employment of MQ gas sensors for the classification of Cistus ladanifer essential oils. Microchem. J. 2024, 206, 111585. [Google Scholar] [CrossRef] [Scilit]
- Brereton, R.G. Chemometrics for Pattern Recognition; Wiley: Chichester, UK, 2009. [Google Scholar]
- Oliveros, M.C.C.; Pavón, J.L.P.; Pinto, C.G.; Laespada, M.E.F.; Cordero, B.M.; Forina, M. Electronic nose based on metal oxide semiconductor sensors as a fast alternative for the detection of adulteration of virgin olive oils. Talanta 2018, 176, 116–123. [Google Scholar] [CrossRef] [Scilit] [PubMed]
- Demetzos, C.; Anastasaki, T.; Perdetzoglou, D.; Gazouli, M.; Loukis, A. Chemical analysis and antimicrobial activity of Cistus essential oils. Phytochemistry 2002, 59, 37–45. [Google Scholar] [CrossRef] [Scilit] [PubMed]
- Singleton, V.L.; Rossi, J.A., Jr. Colorimetry of total phenolics with phosphomolybdic-phosphotungstic acid reagents. Am. J. Enol. Vitic. 1965, 16, 144–158. [Google Scholar] [CrossRef] [Scilit]
- Katalinic, V.; Milos, M.; Kulisic, T.; Jukic, M. Screening of 70 medicinal plant extracts for antioxidant capacity and total phenols. Food Chem. 2006, 94, 550–557. [Google Scholar] [CrossRef] [Scilit]
- Stratil, P.; Klejdus, B.; Kubáň, V. Determination of total content of phenolic compounds and their antioxidant activity in vegetables—Evaluation of spectrophotometric methods. J. Agric. Food Chem. 2006, 54, 607–616. [Google Scholar] [CrossRef] [Scilit] [PubMed]
- Chang, C.C.; Yang, M.H.; Wen, H.M.; Chern, J.C. Estimation of total flavonoid content in propolis by two complementary colorimetric methods. J. Food Drug Anal. 2002, 10, 178–182. [Google Scholar] [CrossRef] [Scilit]
- Arroyo, P.; Meléndez, F.; Suárez, J.I.; Herrero, J.L.; Rodríguez, S.; Lozano, J. Electronic Nose with Digital Gas Sensors Connected via Bluetooth to a Smartphone for Air Quality Measurements. Sensors 2020, 20, 786. [Google Scholar] [CrossRef] [Scilit] [PubMed]
- Piergiovanni, M.; Giliberti, C.; Maffezzoni, C.; Errico, D.; Blandino, M.; Dall’Asta, C.; Mattarozzi, M.; Bianchi, F.; Giannetto, M.; Careri, M. Electronic nose technology for the detection of ergot alkaloid in soft wheat and identification of the relevant volatile compounds by solid phase microextraction/gas chromatography-high resolution Orbitrap-mass spectrometry coupled to chemometrics. Food Chem. 2025, 484, 144455. [Google Scholar] [CrossRef] [Scilit] [PubMed]
- Berna, A. Metal oxide sensors for electronic noses and their application to food analysis. Sensors 2010, 10, 3882–3910. [Google Scholar] [CrossRef] [Scilit] [PubMed]
- Cascos, G.; Montero-Fernández, I.; Marcía-Fuentes, J.A.; Aleman, R.S.; Ruiz-Canales, A.; Martín-Vertedor, D. Electronic prediction of chemical contaminants in aroma of brewed roasted coffee and quantification of acrylamide levels. Foods 2024, 13, 768. [Google Scholar] [CrossRef] [Scilit] [PubMed]
- Zhan, X.; Guan, X.; Wu, R.; Wang, Z.; Wang, Y.; Li, G. Discrimination between Alternative Herbal Medicines from Different Categories with the Electronic Nose. Sensors 2018, 18, 2936. [Google Scholar] [CrossRef] [Scilit] [PubMed]
- Zhou, B.; Wang, J. Discrimination of Different Types Damage of Rice Plants by Electronic Nose. Biosyst. Eng. 2011, 109, 250–257. [Google Scholar] [CrossRef] [Scilit]
- Patel, H.K.; Kunpara, M.; Desai, M.D. Electronic Nose Sensor Response and Qualitative Review of E-Nose Sensors. In Proceedings of the International Conference on Communication Systems and Network Technologies (CSNT), Rajkot, India, 11–13 May 2012; pp. 735–739. [Google Scholar]
- Teixeira, S.; Mendes, A.; Alves, A.; Santos, L. Simultaneous Distillation–Extraction of High-Value Volatile Compounds from Cistus ladanifer L. Anal. Chim. Acta 2007, 584, 439–446. [Google Scholar] [CrossRef] [Scilit] [PubMed]
- El Euch, S.K.; Bouajila, J.; Bouzouita, N. Chemical Composition, Biological and Cytotoxic Activities of Cistus salviifolius Flower Buds and Leaves Extracts. Ind. Crops Prod. 2015, 76, 1100–1105. [Google Scholar] [CrossRef] [Scilit]
- Boubekeur, S.; Messaoudi, M.; Awuchi, C.G.; Otekunrin, O.A.; Sawicka, B.; Idjeri-Mecherara, S.; Bouchareb, S.; Hassani, A.; Sharifi-Rad, M.; Begaa, S.; et al. Biological Properties and Polyphenols Content of Algerian Cistus salviifolius L. Aerial Parts. Eur. J. Biol. Res. 2022, 12, 163–180. [Google Scholar] [CrossRef]
- Mahanti, N.K.; Sanganamoni, S.; Chhetri, K.B.; Kumar, A.; Kumar, P.; Kumar, S.; Dash, S.K. Enhancing Food Authentication through E-Nose and E-Tongue Technologies: Current Trends and Future Directions. Trends Food Sci. Technol. 2024, 150, 104574. [Google Scholar] [CrossRef] [Scilit]
- Titova, T.; Nachev, V. Electronic Tongue in the Food Industry. Food Sci. Appl. Biotechnol. 2020, 3, 71–76. [Google Scholar] [CrossRef] [Scilit]
- Tan, J.; Xu, J. Applications of Electronic Nose (E-Nose) and Electronic Tongue (E-Tongue) in Food Quality-Related Properties Determination: A Review. Artif. Intell. Agric. 2020, 4, 104–115. [Google Scholar] [CrossRef] [Scilit]
- Laothawornkitkul, J.; Taylor, J.E.; Paul, N.D.; Hewitt, C.N. Biogenic Volatile Organic Compounds in the Earth System. New Phytol. 2009, 183, 27–51. [Google Scholar] [CrossRef] [Scilit] [PubMed]
- Cascos, G.; Lozano, J.; Montero-Fernández, I.; Marcía-Fuentes, J.A.; Aleman, R.S.; Ruiz-Canales, A.; Martín-Vertedor, D. Electronic Nose and Gas Chromatograph Devices for the Evaluation of the Sensory Quality of Green Coffee Beans. Foods 2024, 13, 87. [Google Scholar] [CrossRef] [Scilit] [PubMed]
- Banal, J.E.P.L.; Rañola, R.A.G.; Santiago, K.S.; Sevilla, F.B. Electronic Nose Based on Conducting Polymers for the Discrimination of Medicinal Plants. Appl. Mech. Mater. 2014, 490–491, 1194–1198. [Google Scholar] [CrossRef] [Scilit]
- Rodríguez-Méndez, M.L.; Apetrei, C.; Gay, M.; Medina-Plaza, C.; de Saja, J.A.; Vidal, S.; Aagaard, O.; Ugliano, M.; Wirth, J.; Cheynier, V. Electronic Noses and Tongues in Wine Industry. Front. Bioeng. Biotechnol. 2016, 4, 81. [Google Scholar] [CrossRef] [Scilit] [PubMed]

Disclaimer/Publisher’s Note: The statements, opinions and data contained in all publications are solely those of the individual author(s) and contributor(s) and not of MDPI and/or the editor(s). MDPI and/or the editor(s) disclaim responsibility for any injury to people or property resulting from any ideas, methods, instructions or products referred to in the content. |
© 2026 by the authors. Licensee MDPI, Basel, Switzerland. This article is an open access article distributed under the terms and conditions of the Creative Commons Attribution (CC BY) license.