


Abstract
During the experiments presented in this work, the electrochemical synthesis of ferrate ions was performed from high-purity iron electrode in a 45% (m/m) aqueous NaOH solution at different temperatures. The synthesis process was investigated using dual dynamic voltammetry (DDV), which involves applying independent potential–time waveforms (dynamic potential programs) simultaneously to the disk and ring electrodes of a rotating ring–disk electrode (RRDE, Pt-ring—Fe-disk) setup. This innovative technique facilitates the instantaneous measurement of the concentration of ferrate ions generated at the disk electrode. The effect of temperature on ferrate ion formation was examined, and the optimal potential range and applied current density at various temperatures were determined to maximize ferrate ion production and current efficiency. The results indicate that the rate of both ferrate ion production and oxygen evolution increases with temperature within the investigated temperature range (15–45 °C). It was found that there is an optimal potential range at each temperature where ferrate ion formation occurs at the highest rate (limited by other factors). The maximum current efficiency was determined at each temperature, with the highest value obtained at approximately 35 °C.
1. Introduction
Ferrate salts are inorganic salts containing ferrate ion (FeO42−), in which iron is present in a +6 oxidation state. These salts have diverse applications, including organic synthesis, power storage, and water treatment. Among these, water treatment stands out as the most promising application due to the several advantages ferrate salts offer over conventional oxidizing agents [1,2,3,4,5]. At neutral and acidic pH, ferrate ions exhibit a higher redox potential than both ozone and chlorine, making ferrate salts more potent oxidants. There are no known bacteria resistant to ferrate ions [2,6]. Furthermore, the reduction products of ferrate ions are Fe(III) species, which possess strong coagulant and flocculant properties [1,7,8]. Chemical oxidation, coagulation, and flocculation are essential steps in modern water treatment processes, and ferrates uniquely combine these functions in a single chemical [9,10]. Fe(III) ions are non-toxic, making ferrate-based treatments an environmentally friendly alternative to other methods.
The electrochemical synthesis of ferrates has been thoroughly investigated in recent decades owing to its relative simplicity and ability to yield high-purity ferrate salts [11,12,13,14,15,16,17]. In this process, the transpassive anodic dissolution of an iron-containing electrode (often referred to as a “sacrificial” anode) takes place. A highly alkaline medium is used as the electrolyte, since ferrate ions are highly unstable in neutral and acidic environments. It is generally assumed that under the conditions of electrochemical ferrate synthesis, the mechanisms of ferrate ion formation and oxygen evolution are coupled [18]. This coupling makes the exclusive synthesis of ferrate ions—without the occurrence of “parasitic” oxygen evolution—impossible. One of the key factors influencing electrochemical ferrate synthesis is the applied temperature. At higher temperatures, both oxygen evolution and ferrate ion formation are enhanced, although the ratio between these two processes remains unclear. Unfortunately, higher temperatures also accelerate the decomposition of ferrate ions. This has prompted researchers to investigate the optimum temperature for electrochemical ferrate ion synthesis. Another key factor in electrochemical ferrate synthesis is the applied potential (or the current density) [19,20,21,22]. At appropriately positive electrode potentials (or current densities), both oxygen evolution and ferrate ion production are accelerated. However, at even higher positive potentials (or at high current densities), oxygen evolution appears to be more favorable than ferrate ion formation. Most experiments on electrochemical ferrate synthesis have focused on determining the accumulated ferrate ion concentration (i.e., by analyzing electrolyte solution samples collected during electrolysis), which is the total ferrate ions produced minus those decomposed [23]. The sampling-based approach has limited time resolution and may alter the volume or composition of the electrolyte. In concentrated alkaline electrolytes, high viscosity, limited mixing, and possible precipitation can also lead to samples that are not representative of the bulk solution. This means that these measurements determine the amount of ferrate accumulated in the electrolyte rather than the amount formed directly at the anode [24,25,26,27]. However, since ferrate ion decomposition is highly dependent on conditions that are difficult to control, the results obtained through this approach are often unreliable. In fact, none of the previously used methods were suitable for determining the amount of “directly formed” ferrate ions. Additionally, in most cases, the sampling of electrolyte solution—required to measure ferrate ion concentrations—was performed manually, limiting the time resolution of the data from these experiments.
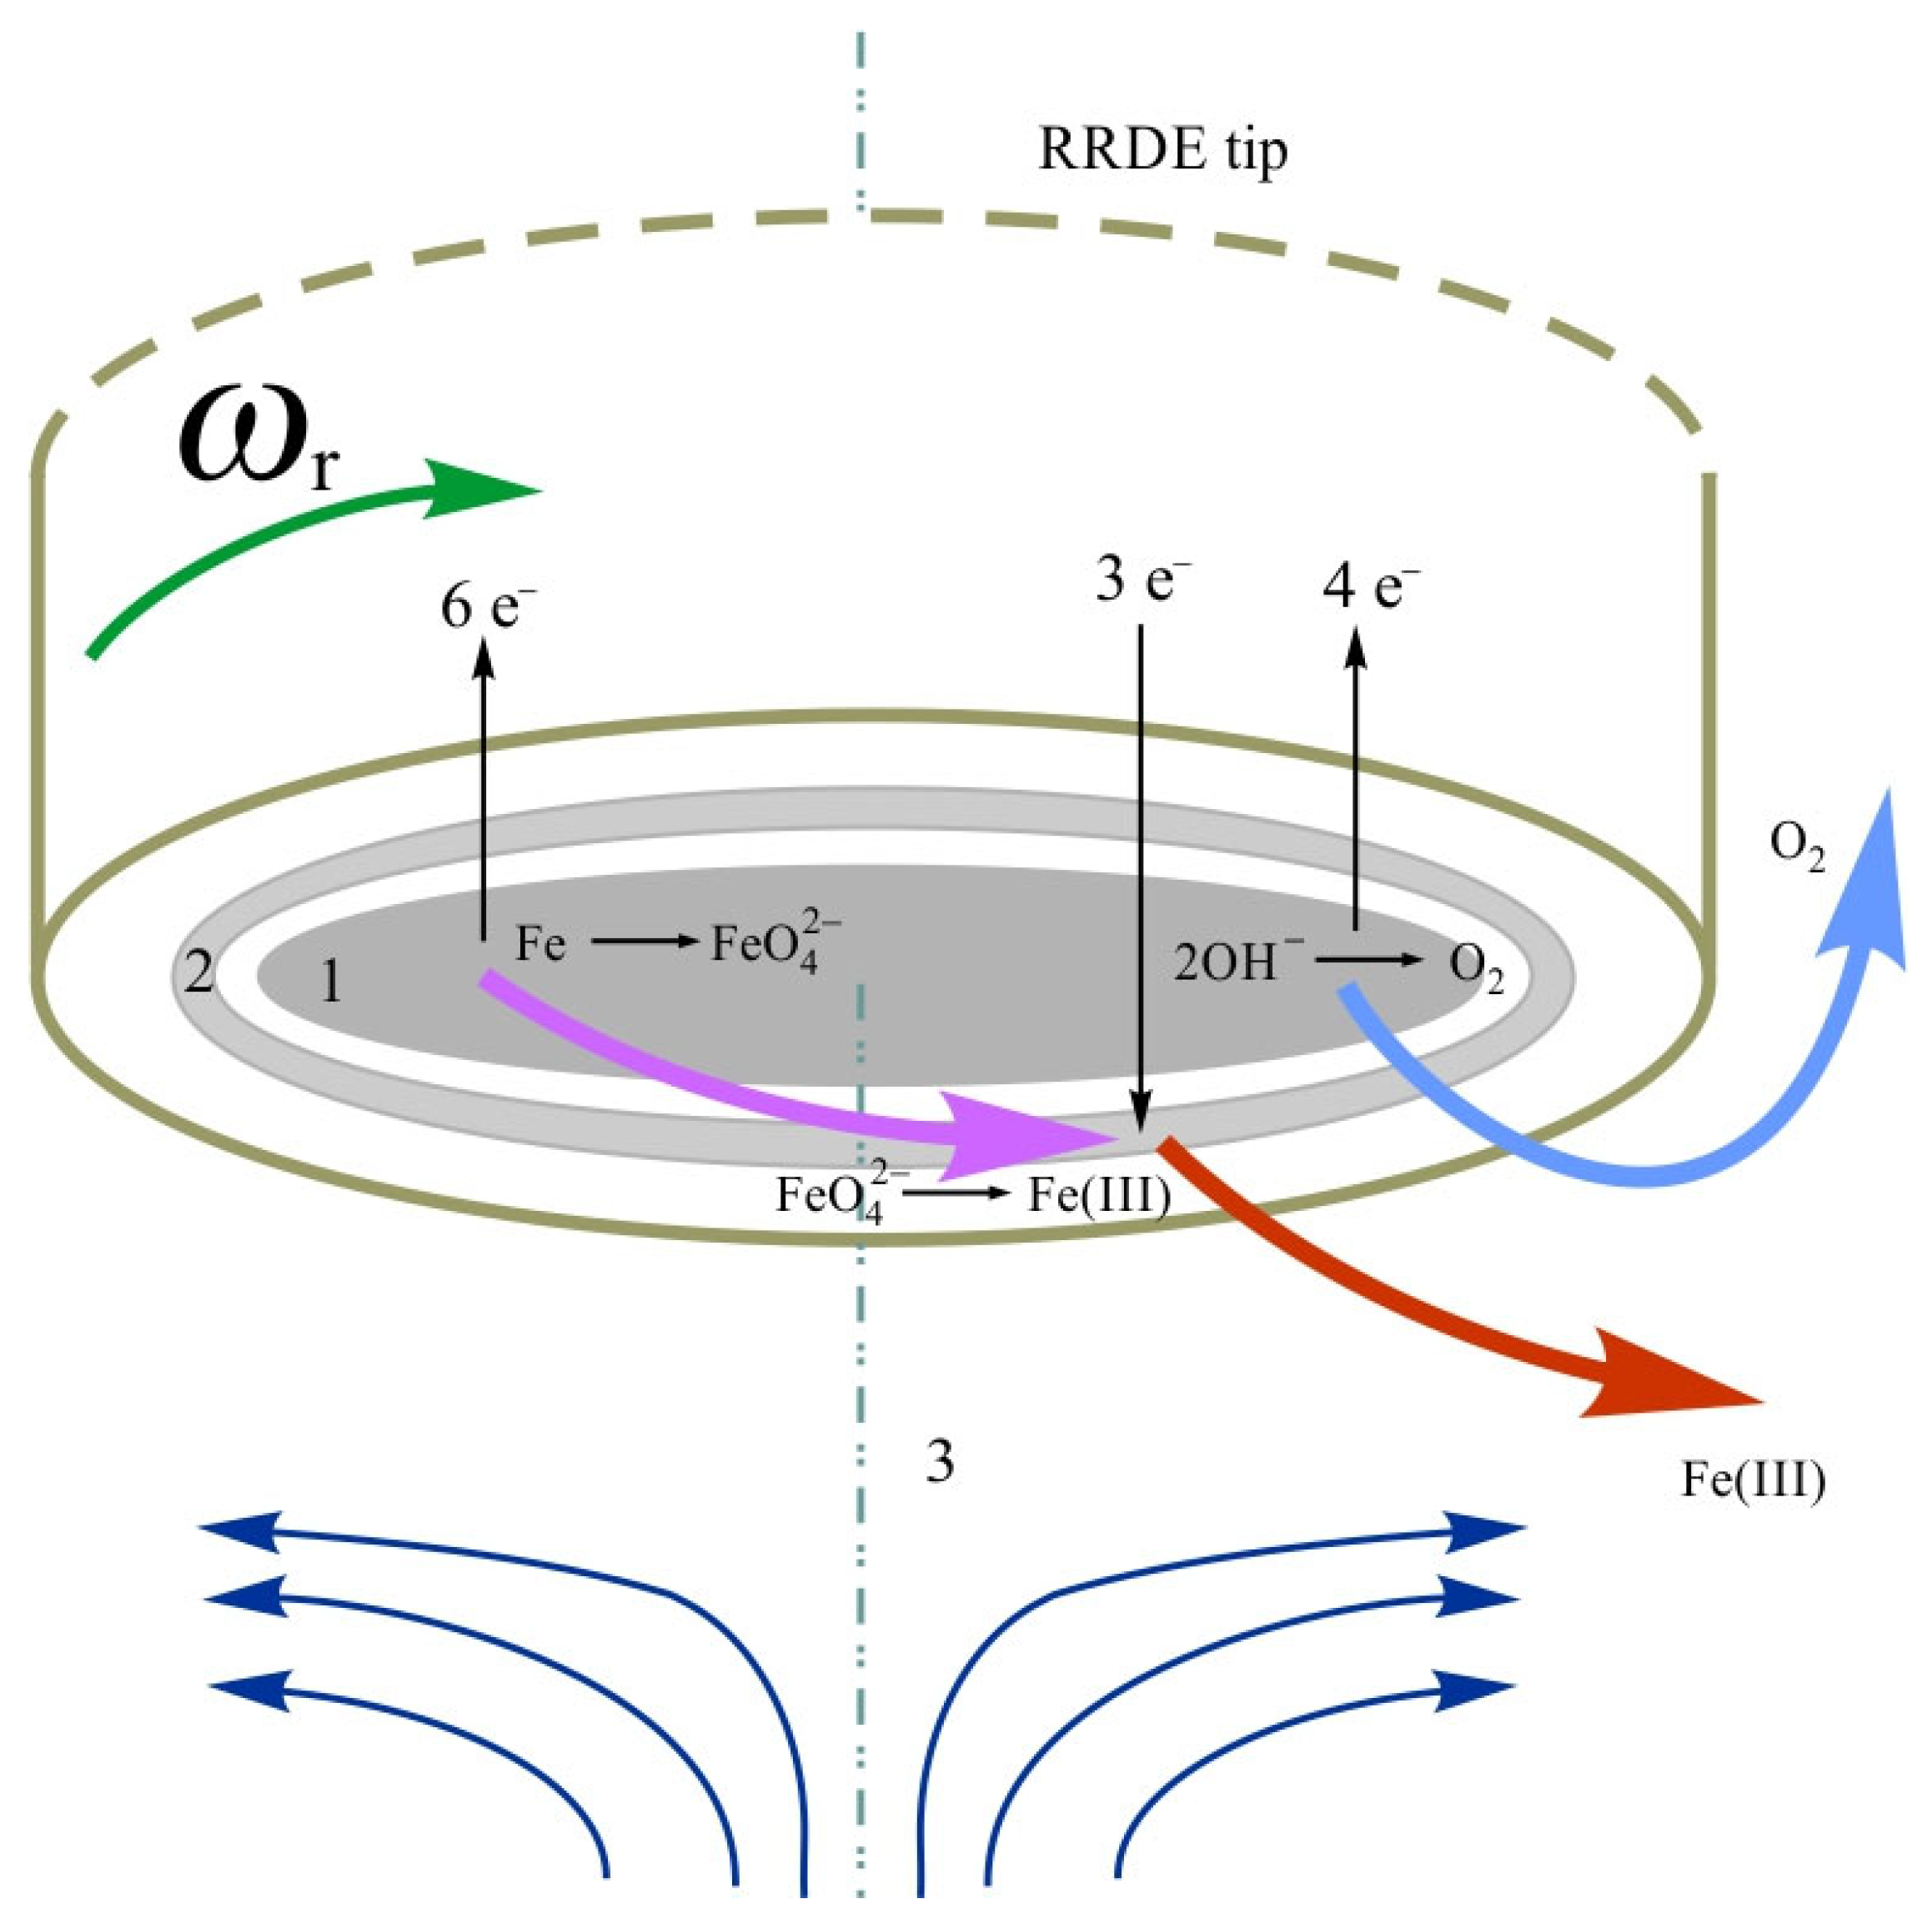
Dual Dynamic Voltammetry (DDV) is a powerful electrochemical method designed for use with Rotating Ring–Disk Electrode (RRDE) setups [28]. DDV involves the application of independent potential–time waveforms (programmed excitation signals) at the disk and ring electrodes of an RRDE system. By applying Cyclic Voltammetry (CV) at the ring electrode with a high potential scan rate and simultaneously Linear Sweep Voltammetry (LSV) with low potential sweep rate at the disk electrode, multiple voltammograms can be recorded at the ring electrode while performing a single LSV at the disk electrode (see, e.g., Figure A1 in Appendix A as an illustrative example of the application of the method). During the time required for one CV measurement at the ring electrode, the potential of the disk electrode can be considered approximately constant. It has been shown that ferrate ion concentration can be determined from the limiting current of ferrate ion reduction at a platinum electrode under appropriate conditions [29,30]. DDV can be employed to investigate ferrate ion formation. In this application, an iron-containing disk electrode and a platinum ring electrode are used as parts of the RRDE system. In a generator-collector configuration, ferrate ions produced at the iron-containing disk electrode are reduced at the platinum ring electrode. By using suitable sweep rates for the disk and ring electrodes, the aforementioned condition is satisfied, enabling the determination of ferrate ions produced at the disk electrode from the CV recorded at the ring electrode. It has been demonstrated that, under these conditions, oxygen produced at the disk electrode does not react at the ring electrode. This is due to the salting out effect, because oxygen is practically insoluble in concentrated alkaline solutions [29]. This selectivity ensures that the oxidation products of the disk electrode detected at the ring electrode are exclusively ferrate ions (see Figure A2 in Appendix A). The amount of ferrate ions generated at the disk electrode can then be calculated directly from the CV data of the ring electrode. This approach provides an online method with high time resolution for determining ferrate ion concentration without the need for sampling. Furthermore, in this setup, ferrate ion accumulation is negligible due to very low electrode surface area-to-cell volume ratio, allowing the method to specifically quantify the concentration of ferrate ions produced in real time [30].
The present study forms part of a broader project aimed at optimizing electrochemical ferrate production with respect to anode material, electrolyte composition, potential/current density, and temperature. During the project, “conventional” methods, namely electrolysis and analytical determination of the composition of the samples, was used, which, although suitable for the tasks set, proved to be extremely time-consuming. Nonetheless, based on the experience acquired with dual dynamic voltammetry (DDV) it was anticipated that this technique would shorten the testing time.
Preliminary DDV results obtained with a high-purity iron anode at 30 °C were reported previously [29] in a short communication.
The present work extends that study to the temperature range of 15 °C to 45 °C and quantifies ferrate formation current and current efficiency as functions of disk potential and total disk current density.
2. Materials and Methods
All experiments were performed in a polypropylene container equipped with a water jacket (Figure A3 in Appendix B). Reagent grade NaOH (Sigma-Aldrich, St. Louis, MO, USA) was utilized to prepare the 45% (m/m) aqueous NaOH solutions that served as electrolyte solutions in every experiment. An electronic thermometer was used to track the electrolyte solution’s temperature (T), which was controlled by a refrigerated circulator chiller (RE 106, LAUDA Dr. R. Wobser GmbH & Co. KG, Lauda-Königshofen, Germany).
Dual dynamic voltammetry (DDV) experiments were conducted utilizing a specially modified AFRDE 5 Pine bipotentiostat (Pine Research Instrumentation, Durham, NC, USA) with a four-electrode cell arrangement containing a reference electrode, a counter electrode, and two working electrodes (disk and ring). A Metrohm Autolab PGSTAT 302N electrochemical workstation (Metrohm Autolab B.V., Utrecht, The Netherlands) and a three-electrode cell arrangement was used to perform electrochemical impedance spectroscopy (for ohmic drop correction). A porous polypropylene film served as a separator between the counter electrode and the working electrodes.
The electrochemical measurements were performed at 15, 20, 25, 30, 35, 40, and 45 °C.
A Hg|HgO electrode filled with a 5 mol/dm3 aqueous KOH solution maintained at 25 °C served as the reference electrode (Mercury Oxide Reference Electrode 5088, Koslow Scientific Company, Englewood, NJ, USA, Eref = +0.085 V vs. SHE).
Temperature-related liquid junction potentials were disregarded. The counter electrode was a cylindrically curved (high purity) iron plate in contact with the electrolyte solution. The cylindrical iron plate was precisely shaped to fit within the cell container. The electrolysis cell was exposed to the air (Figure A3 in Appendix B).
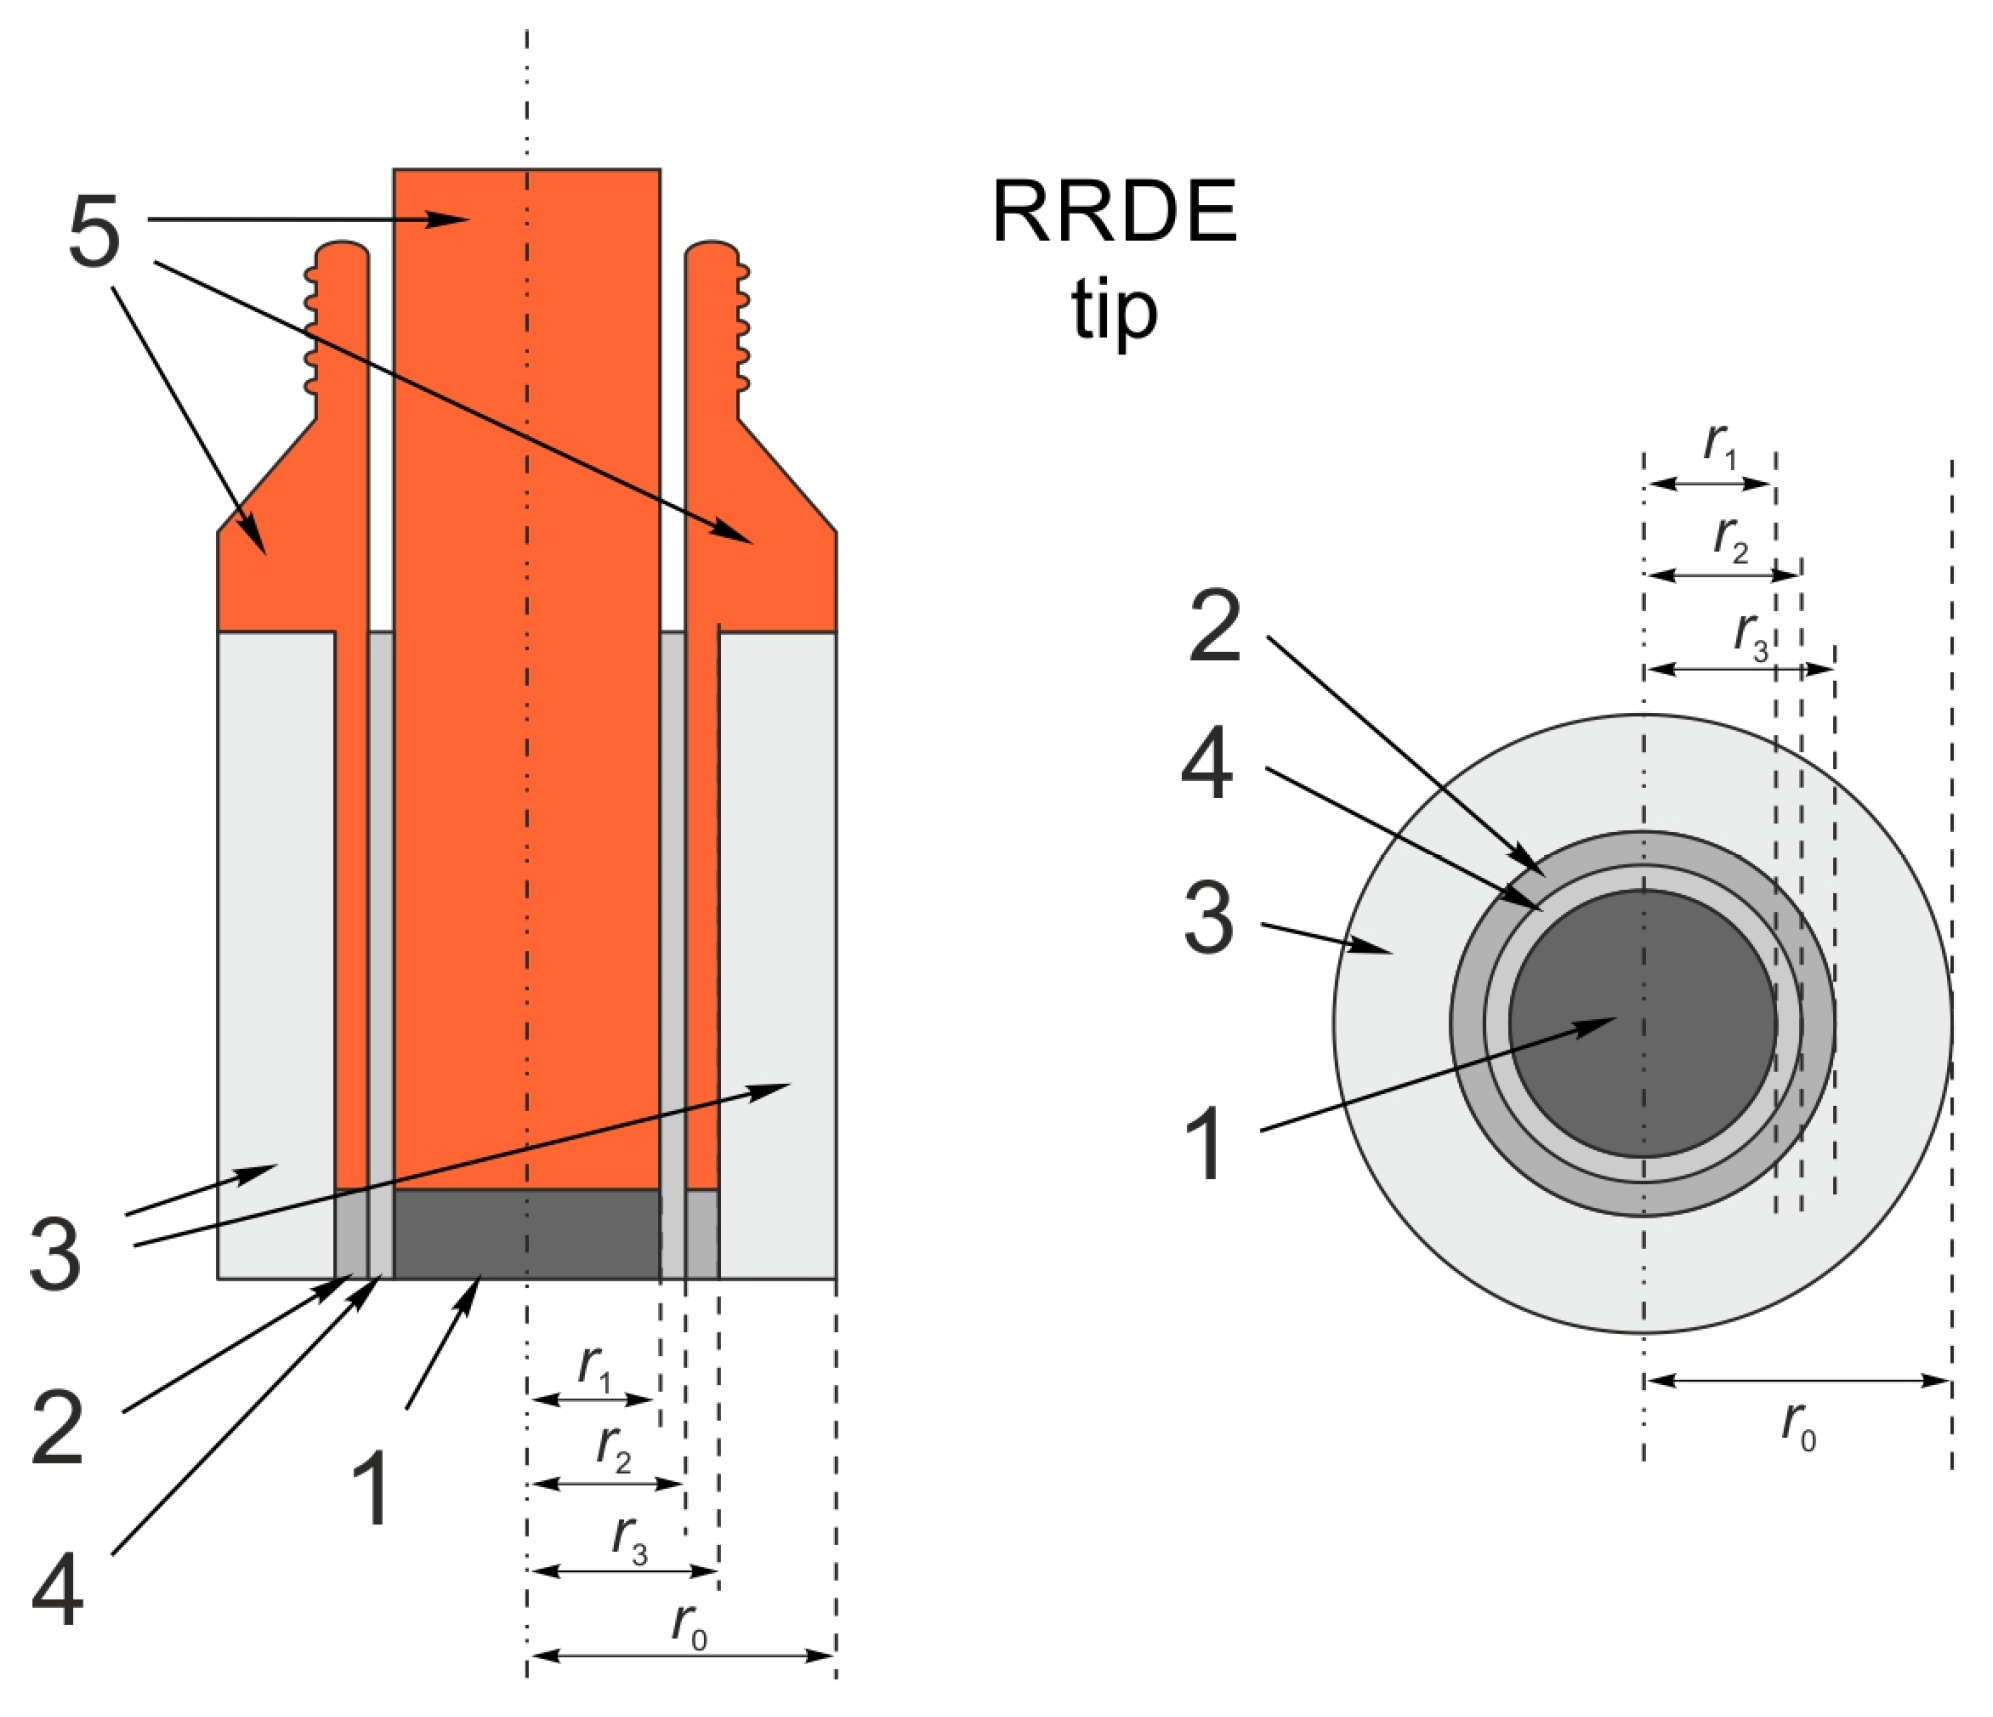
A PINE AFMSRCE (Pine Research Instrumentation, Durham, NC, USA) rotator was used to rotate the RRDE tip during the RRDE studies at a rotation rate of ωr = 1200 rpm. The RRDE tip was composed of a disk made of high-purity iron (Alfa Aesar, 99.98%, Ward Hill, MA, USA) and a ring made of high-purity platinum (Alfa Aesar, 99.99%). (Disk radius: r1 = 2.50 mm, ring inner radius: r2 = 3.25 mm, ring outer radius: r3 = 3.75 mm, outer radius of the tip: ro = 5.75 mm.) High-purity polypropylene served as the insulation (see Figure A4 in Appendix B). In the dual dynamic voltammetry studies, the scan rate of the electrode potential was →νr = 200 mV/s for the ring electrode and νd = 0.5 mV/s for the disk electrode, respectively. The interchangeable working electrodes were polished with 1 µm and 0.1 µm diamond suspensions, washed with high-purity water, subjected to ultrasonic cleaning, and dried prior to each experiment.
For each disk potential, the ring current (Ir,i) was averaged over the ring potential range Er = 0.05–0.15 V vs. Hg|HgO, where ferrate(VI) reduction was under limiting-current conditions. The corresponding average ring current is denoted by . The ring current (Ir,0) measured at Ed = 0.5 V vs. Hg|HgO, where ferrate formation was negligible, was used as the “background current”. Its mean value is represented by . The ferrate-related ring-current difference, , was calculated according to Equation (1).
The ferrate formation current at the disk, , was calculated according to Equation (2) using an RRDE theoretical collection efficiency of N = 0.2555, calculated from the geometric parameters of the RRDE.
The factor of 2 accounts for the difference between the six-electron oxidation of Fe(0) to Fe(VI) at the disk and the three-electron reduction of Fe(VI) to Fe(III) at the ring. The negative sign converts the cathodic ferrate reduction current measured at the ring into a positive ferrate formation current at the disk. The effective current density for ferrate formation, , was calculated according to Equation (3) using the geometric area of the disk electrode, .
The “total” disk current density, , was calculated according to Equation (4), where is the “total” current measured at the disk.
The current efficiency of ferrate formation, , was then calculated according to Equation (5).
3. Results and Discussion
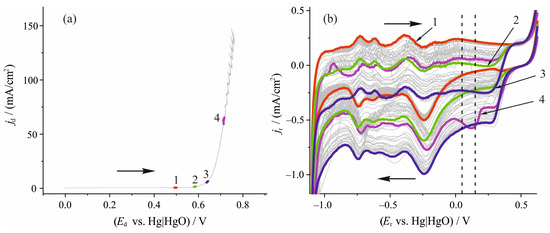
The results of the dual dynamic voltammetry measurement using an RRDE are presented in Figure 1 (the results obtained at 35 °C are reported in detail as an illustrative example). Figure 1a displays the linear sweep voltammogram obtained at 35 °C, recorded at the disk electrode within the potential range of 0.0 V to 0.75 V vs. Hg|HgO (5 mol/dm3 KOH) at a sweep rate of 0.5 mV/s (referred to as “slow polarization”). Figure 1b shows cyclic voltammograms recorded at a sweep rate of 200 mV/s (referred to as “fast polarization”), at the platinum ring electrode while the disk electrode undergoes slow polarization. The symbols jd and jr stand for the current densities at the disk and the ring electrodes, respectively.
Figure 1.
Different potential regions (1—red, 2—green, 3—blue, 4—magenta) of the voltammogram recorded at the disk electrode (a) and the corresponding voltammograms (1—red, 2—green, 3—blue, 4—magenta) measured at the ring electrode (b). T = 35 °C, Ed: electrode potential of the disk, Er: electrode potential of the ring, jd: current density at the disk, jr: current density at the ring, respectively. (Rotation rate 1200 rpm. Electrolyte solution: 45% (m/m) aqueous NaOH solution. Iron disk radius: r1 = 0.25 cm, geometric surface area: Ad = 0.1964 cm2, sweep rate: νd = 0.50 mV/s. Platinum ring: outer radius: r3 = 0.375 cm, inner radius: r2 = 0.325 cm, geometric surface area: Ar = 0.110 cm2, sweep rate: νr = 200 mV/s). The arrows indicate the potential scan directions. The grey curves in panel (b) are the intermediate ring voltammograms recorded during the disk sweep, and the vertical dashed lines delimit the ring-potential interval (Er = 0.05–0.15 V vs. Hg|HgO) used to average the limiting current.
Specific regions within the disk voltammogram are highlighted to illustrate distinct electrochemical behaviors. In the red region (Figure 1a, 1—red), the disk potential is approximately Ed ≈ 0.50 V, and the measured current is very low, indicating that the electrochemical processes are taking place at a negligible rate. The corresponding voltammogram measured at the ring electrode (Figure 1b, 1—red) shows a typical platinum response in a highly alkaline medium. This serves as a reference voltammogram for calculating effective current and current efficiency.
In the green region (Figure 1a, 2—green), the disk potential is around Ed ≈ 0.58 V, corresponding to a “shoulder-like” feature in the voltammogram. The substantial current indicates that oxidation processes are occurring at a significant rate. The current in corresponding ring voltammogram (Figure 1b, 2—green) shifts in the negative direction below ring potentials of approximately Er ≈ 0.40 V, indicating the presence of an electroactive species generated at the disk that undergoes reduction at the ring. Since it has been shown that oxygen reduction does not occur at platinum under these conditions, the electroactive species reduced at the ring must be the ferrate ions (as discussed in the introduction this is due to the salting out effect, because oxygen is practically insoluble in concentrated alkaline solutions) [29]. The onset of ferrate ion reduction occurs at electrode potentials more negative than approximately 0.4 V at platinum in this very alkaline milieu [29,31]. In the blue region (Figure 1a, 3—blue), the disk potential is increased to around Ed ≈ 0.64 V, leading to more rapid oxidation processes. The current in the corresponding ring voltammogram (Figure 1b, 3—blue) shifts further in the negative direction, reflecting more rapid reduction processes, likely due to increased ferrate ion production at the disk. In the magenta region (Figure 1a, 4—magenta) the disk potential reaches approximately Ed ≈ 0.71 V, marking the exponential region of the voltammogram. In this region rapid oxygen evolution occurs. The corresponding ring voltammogram (Figure 1b, 4—magenta) deviates notably from the reference voltammogram (Figure 1b, 1). Besides a negative shift in the current indicating reduction processes, it also displays horizontal displacement of some peaks and increased noise. This behavior is attributed to bubble formation from the rapid oxygen evolution at the disk, which alters the active surface area and diffusion layer around the ring electrode, affecting the voltammogram’s shape.
The current shift in the negative direction can be determined for each voltammogram recorded at the ring electrode. This is done by subtracting the average current of the “reference voltammogram” (Figure 1b, 1—red)—measured within the Er = 0.15–0.05 V potential range during the negative going scan—from the average current of all other voltammograms in the same potential range (see Equation (1)). The resulting ΔI values represent the current shift relative to the reference voltammogram, where no ferrate ion reduction occurs. (It should be noted here that at these ring electrode potentials the reduction of ferrate ions occurs in the “limiting current range”, i.e., where the reduction current reaches a maximum plateau and becomes essentially independent of the applied voltage or potential). Using the RRDE tip’s collection efficiency, the current associated with ferrate ion formation can then be calculated. Since ferrate ion is produced from an iron disk electrode in which iron has an oxidation state of 0, but the reduction product is Fe(III), the calculated values need to be multiplied by two to obtain the correct effective current for ferrate ion formation (Equation (2)).
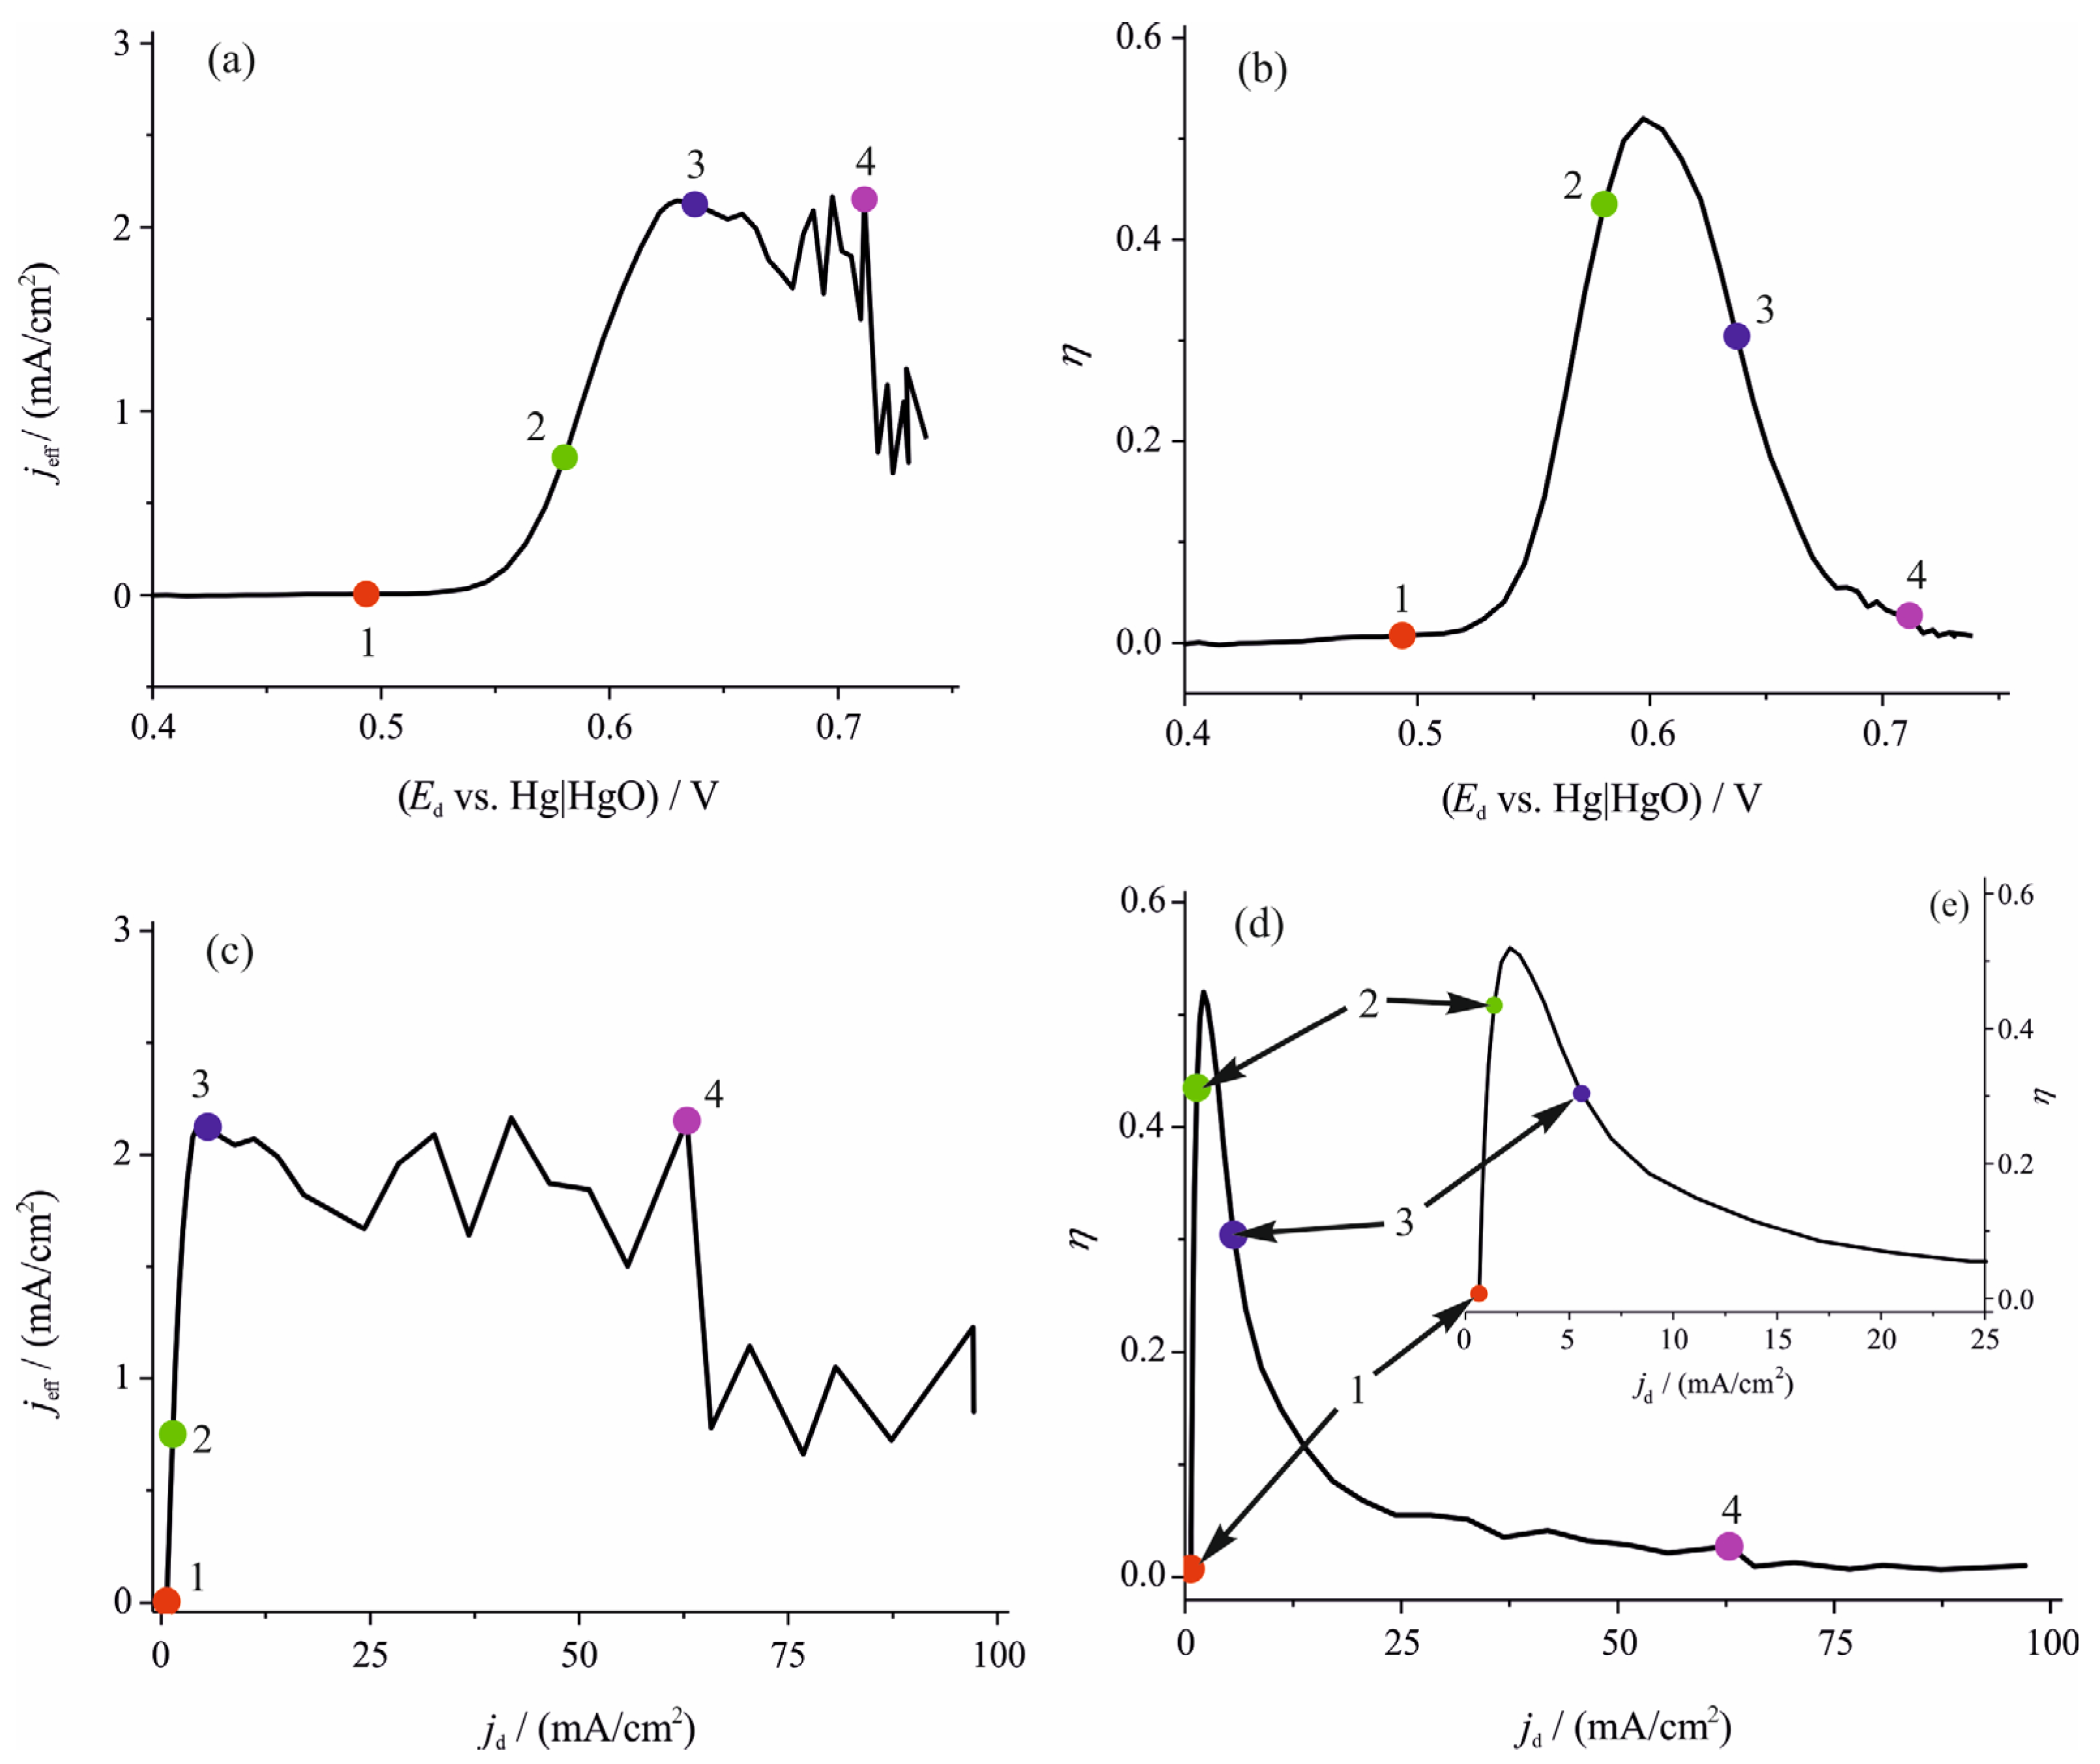
By plotting these “effective current density” values (jeff, the current density corresponding to the ferrate ion formation) against the disk potential, a voltammogram for the disk can be constructed that reflects only the effective current. The current efficiency for ferrate ion formation can then be calculated by dividing the effective current by the total current. Figure 2 illustrates the effective current (Figure 2a) and current efficiency (Figure 2b) for ferrate ion formation as a function of disk potential at T = 35 °C.
Figure 2.
(a) Effective current density (jeff) and (b) current efficiency (η) for ferrate ion formation as a function of disk potential. The points (1–4) correspond to the same regions in Figure 1. (c) Effective current density and (d) current efficiency for ferrate ion formation as a function of the current density at the disk (“total current density”). The points (1–4) correspond to the same regions in Figure 1. The inset (e) illustrates an enlarged part of (d). (T = 35 °C, Ed: electrode potential of the disk, rotation rate 1200 rpm. Electrolyte solution: 45% (m/m) aqueous NaOH solution. Iron disk radius: r1 = 0.25 cm, geometric surface area: Ad = 0.1964 cm2, sweep rate: νd = 0.50 mV/s. Platinum ring: outer radius: r3 = 0.375 cm, inner radius: r2 = 0.325 cm, geometric surface area: Ar = 0.110 cm2, sweep rate: νr = 200 mV/s).
The regions highlighted at Figure 1 are also represented in Figure 2 using the same color scheme and numbering system. Each voltammogram recorded at the ring electrode (Figure 1b) corresponds to a data point in Figure 2 (after performing the calculations based on Equations (1) and (2)). The onset of ferrate ion formation is at approximately Ed ≈ 0.525 V. As the disk potential increases, the rate of ferrate ion formation rises, peaking around Ed ≈ 0.625 V, and then apparently declines (Figure 2a). At potentials more positive than Ed ≈ 0.675 V increased scattering of data points is observed, which can be attributed to bubble formation corresponding to rapid oxygen evolution. Figure 2b illustrates the current efficiency for ferrate ion formation as a function of the disk potential. It reaches its maximum near Ed ≈ 0.60 V. Notably, at more positive potentials, despite the relatively high effective current, the current efficiency drops sharply. This decline is due to the exponential increase in total current at the disk (Figure 1a, 4—magenta), driven by rapid oxygen evolution. Based on Figure 2, the optimal potential range for ferrate ion formation under these conditions (T = 35 °C, 45 m/m% aqueous NaOH electrolyte solution) can be determined. Figure 2a,b well illustrate the usefulness of dual dynamic voltammetry, which allows the quantitative determination of the effective current and current efficiency for a specific reaction (in this case the ferrate ion formation) even in the presence of a competing process (oxygen evolution).
While the effective current density and current efficiency plotted as functions of the electrode potential can provide valuable mechanistic insight, direct comparison of potentials across different studies is quite problematic. Differences in reference electrodes, as well as variations in the activity of species such as H+, OH−, and even water, complicate such comparisons [32]. Furthermore, the ohmic potential drop during electrolysis is often uncorrected or insufficiently corrected, further limiting comparability. Most ferrate ion synthesis studies employ galvanostatic electrolysis, where the applied current (or current density) is the controlled parameter. Current density is a practical and universally comparable quantity (metric) for studying the efficiency of ferrate synthesis; however, it also contains uncertainties due to the difficulty of determining the true surface area of the electrodes.
Figure 2c shows the effective current density and current efficiency (Figure 2d) as functions of the current density at the disk. The highlighted data points correspond to those presented in Figure 1 and Figure 2a,b. From Figure 2d the optimal current density for ferrate ion formation, in terms of current efficiency is identified as 2–4 mA/cm2 under the studied conditions (T = 35 °C, 45 m/m% aqueous NaOH).
It should be emphasized that obtaining an equivalent number of data points by discrete electrolyte sampling would require several days, whereas the DDV data shown in Figure 2 were obtained in less than two hours. DDV also avoids removal of electrolyte and measures ferrate formation current rather than the amount of ferrate accumulated in the electrolyte. (A direct experimental comparison of analytical accuracy between DDV and sampling-based methods was not performed in this study).
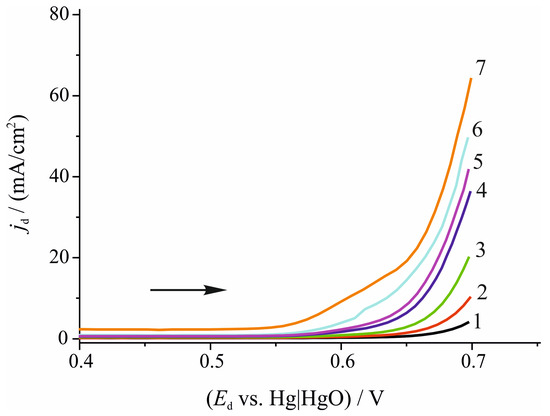
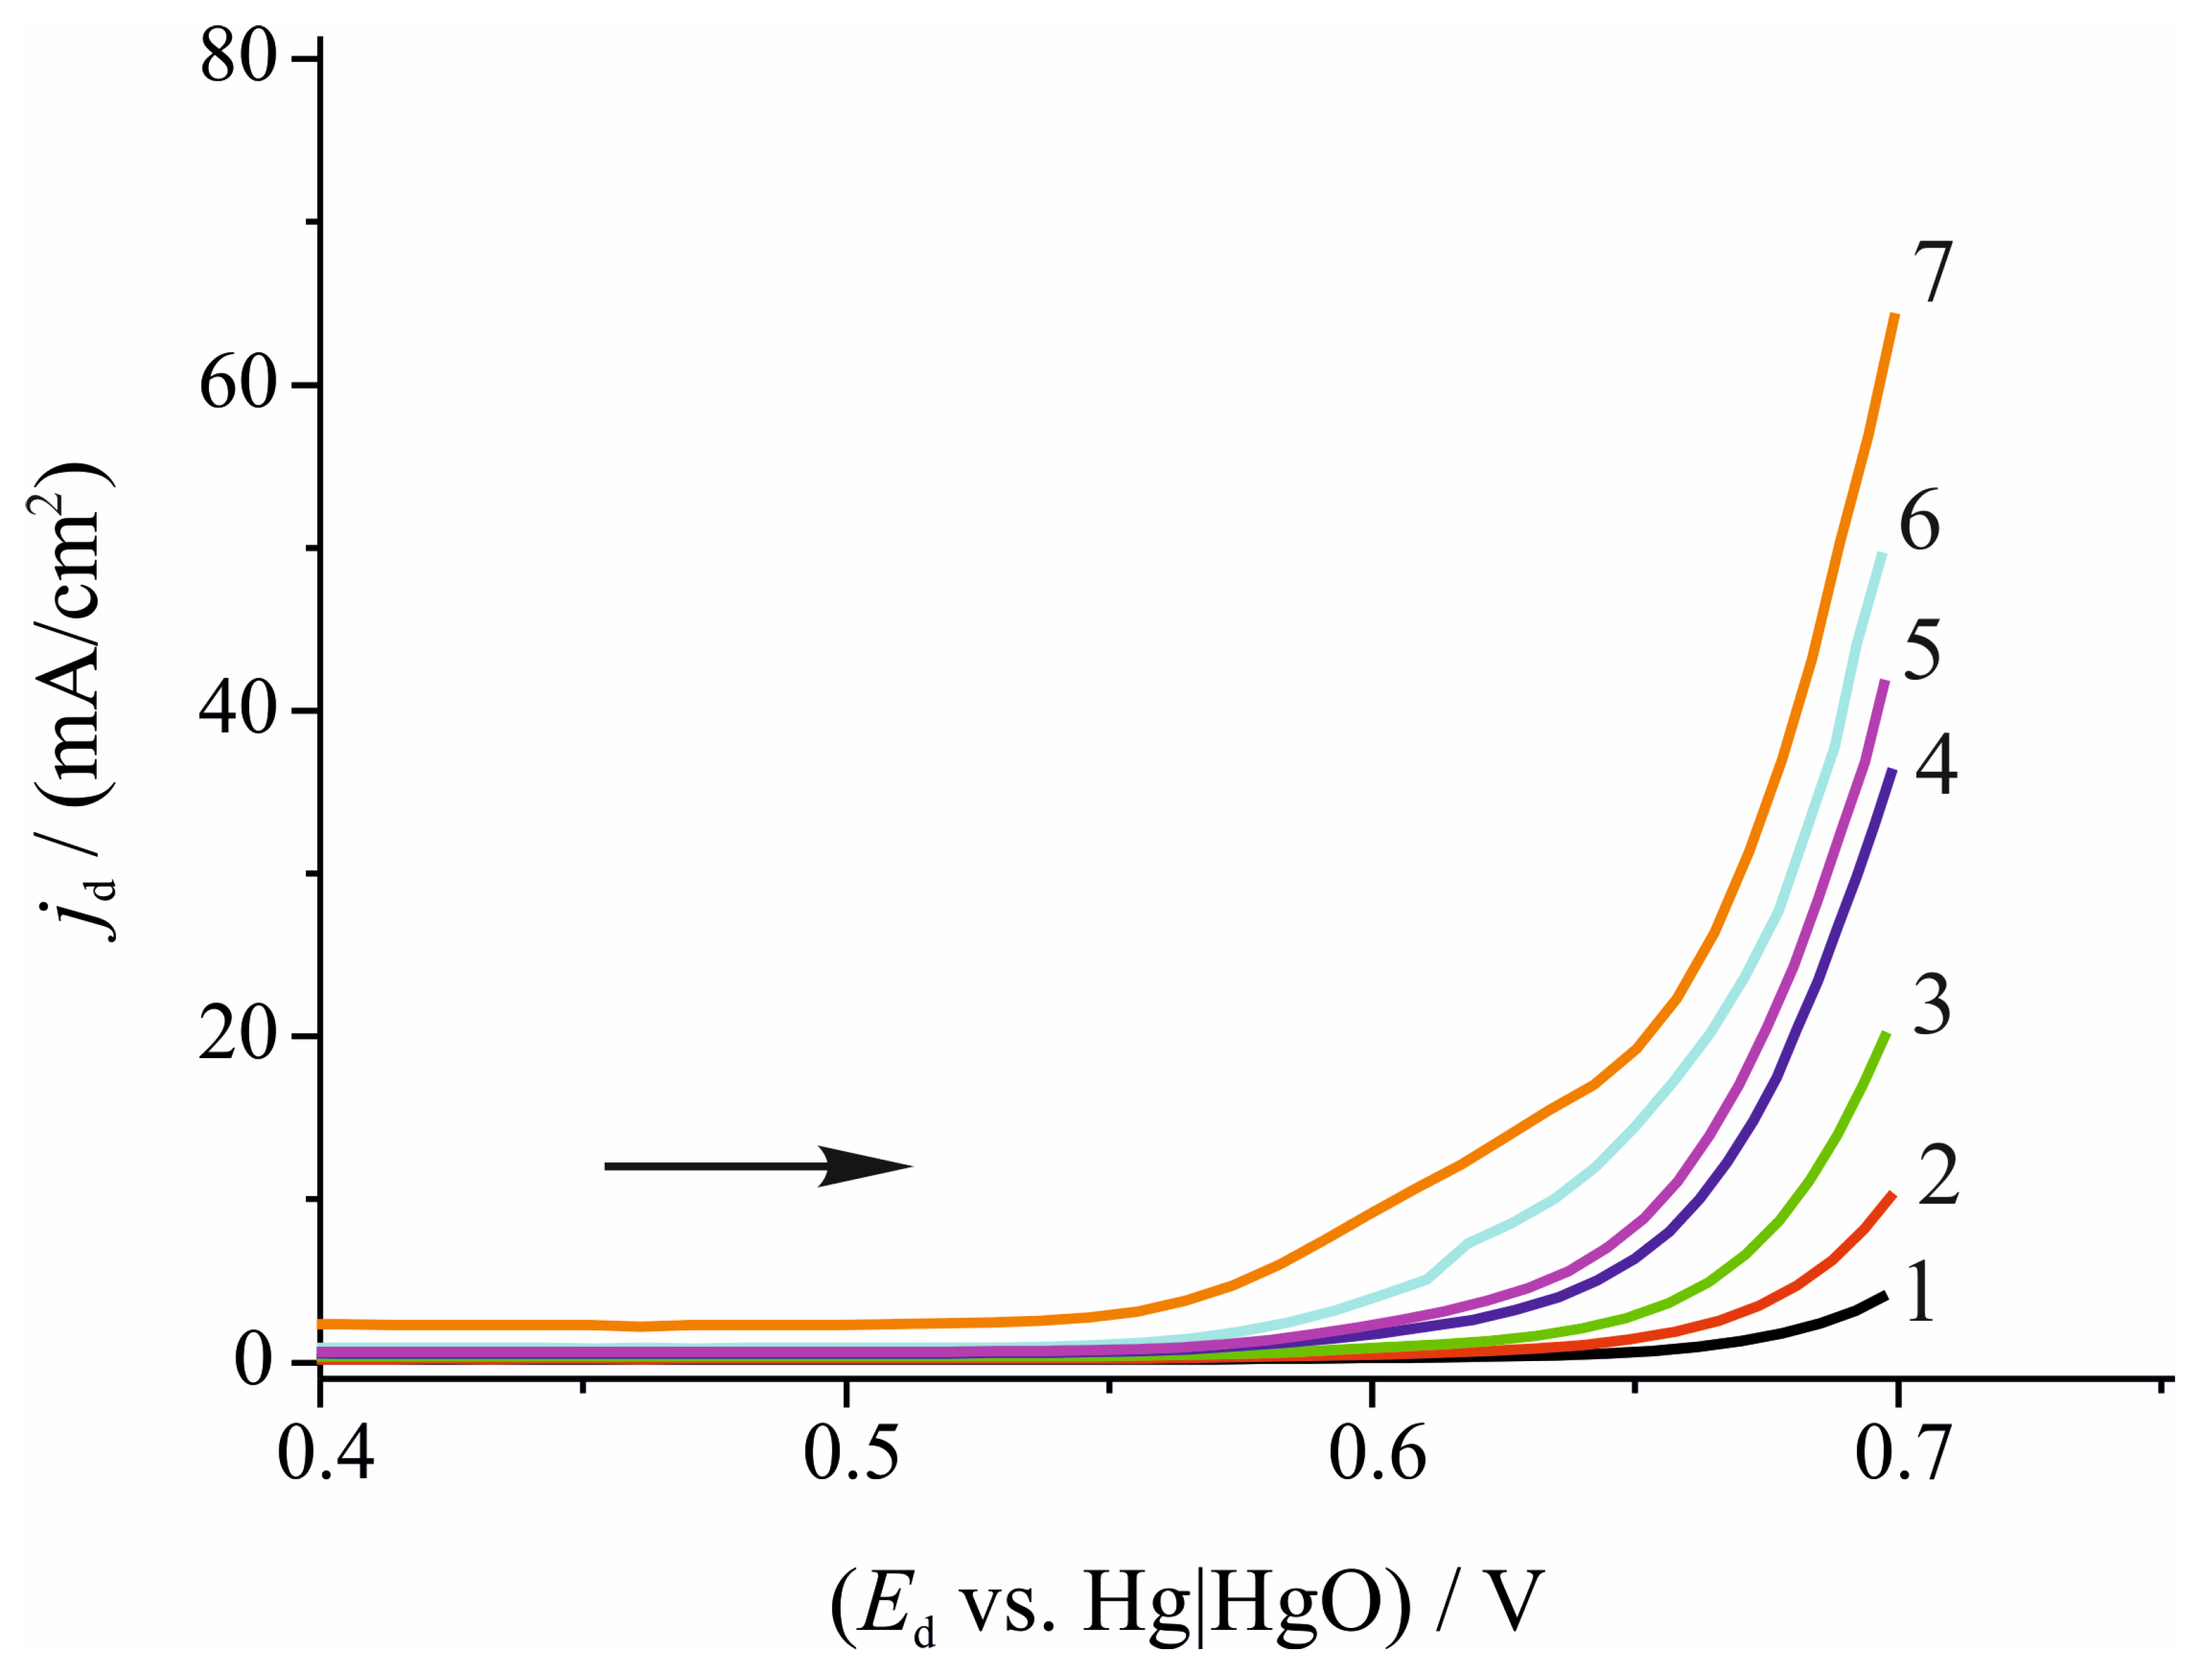
Figure 3 presents the total current densities during dual dynamic voltammetry measured at different temperatures at a high-purity iron disk electrode. All voltammograms exhibit a similar shape to those in Figure 1a, showing a low-current region followed by a “shoulder-like” feature at moderate positive potentials and an exponential increase at higher positive potentials. At elevated temperatures, the current densities increase, and both the “shoulder-like” region and the exponential rise occur at lower potentials. In contrast, at very low temperatures (Figure 3, 1–3, 15–25 °C) the “shoulder-like” region is practically absent. At more negative electrode potentials the oxidation processes proceed at a negligible rate. In the “shoulder-like” region, ferrate ion and oxygen evolution occur at comparable rates. However, in the exponential region, oxygen evolution becomes dominant, substantially surpassing the formation of ferrate ions.
Figure 3.
Parts of polarization curves of pure iron disk during the dual dynamic voltammetry measurement in 45% (m/m) aqueous NaOH solutions recorded between 0 V and 0.7 V vs. Hg|HgO (5 mol/dm3 KOH) at different temperatures: 15 °C (black, 1); 20 °C (red, 2); 25 °C (green, 3); 30 °C (blue, 4); and 35 °C (magenta, 5); 40 °C (cyan, 6); 45 °C (orange, 7). (Ed: electrode potential of the disk, jd current density at the disk, rotation rate 1200 rpm. Electrolyte solution: 45% (m/m) aqueous NaOH solution. Iron disk radius: r1 = 0.25 cm, geometric surface area: Ad = 0.1964 cm2, sweep rate: νd = 0.50 mV/s. Platinum ring: outer radius: r3 = 0.375 cm, inner radius: r2 = 0.325 cm, geometric surface area: Ar = 0.110 cm2, sweep rate: νr = 200 mV/s). The arrow indicates the potential scan direction.
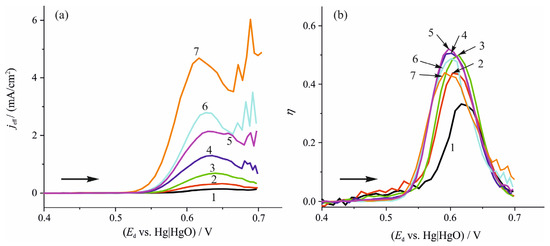
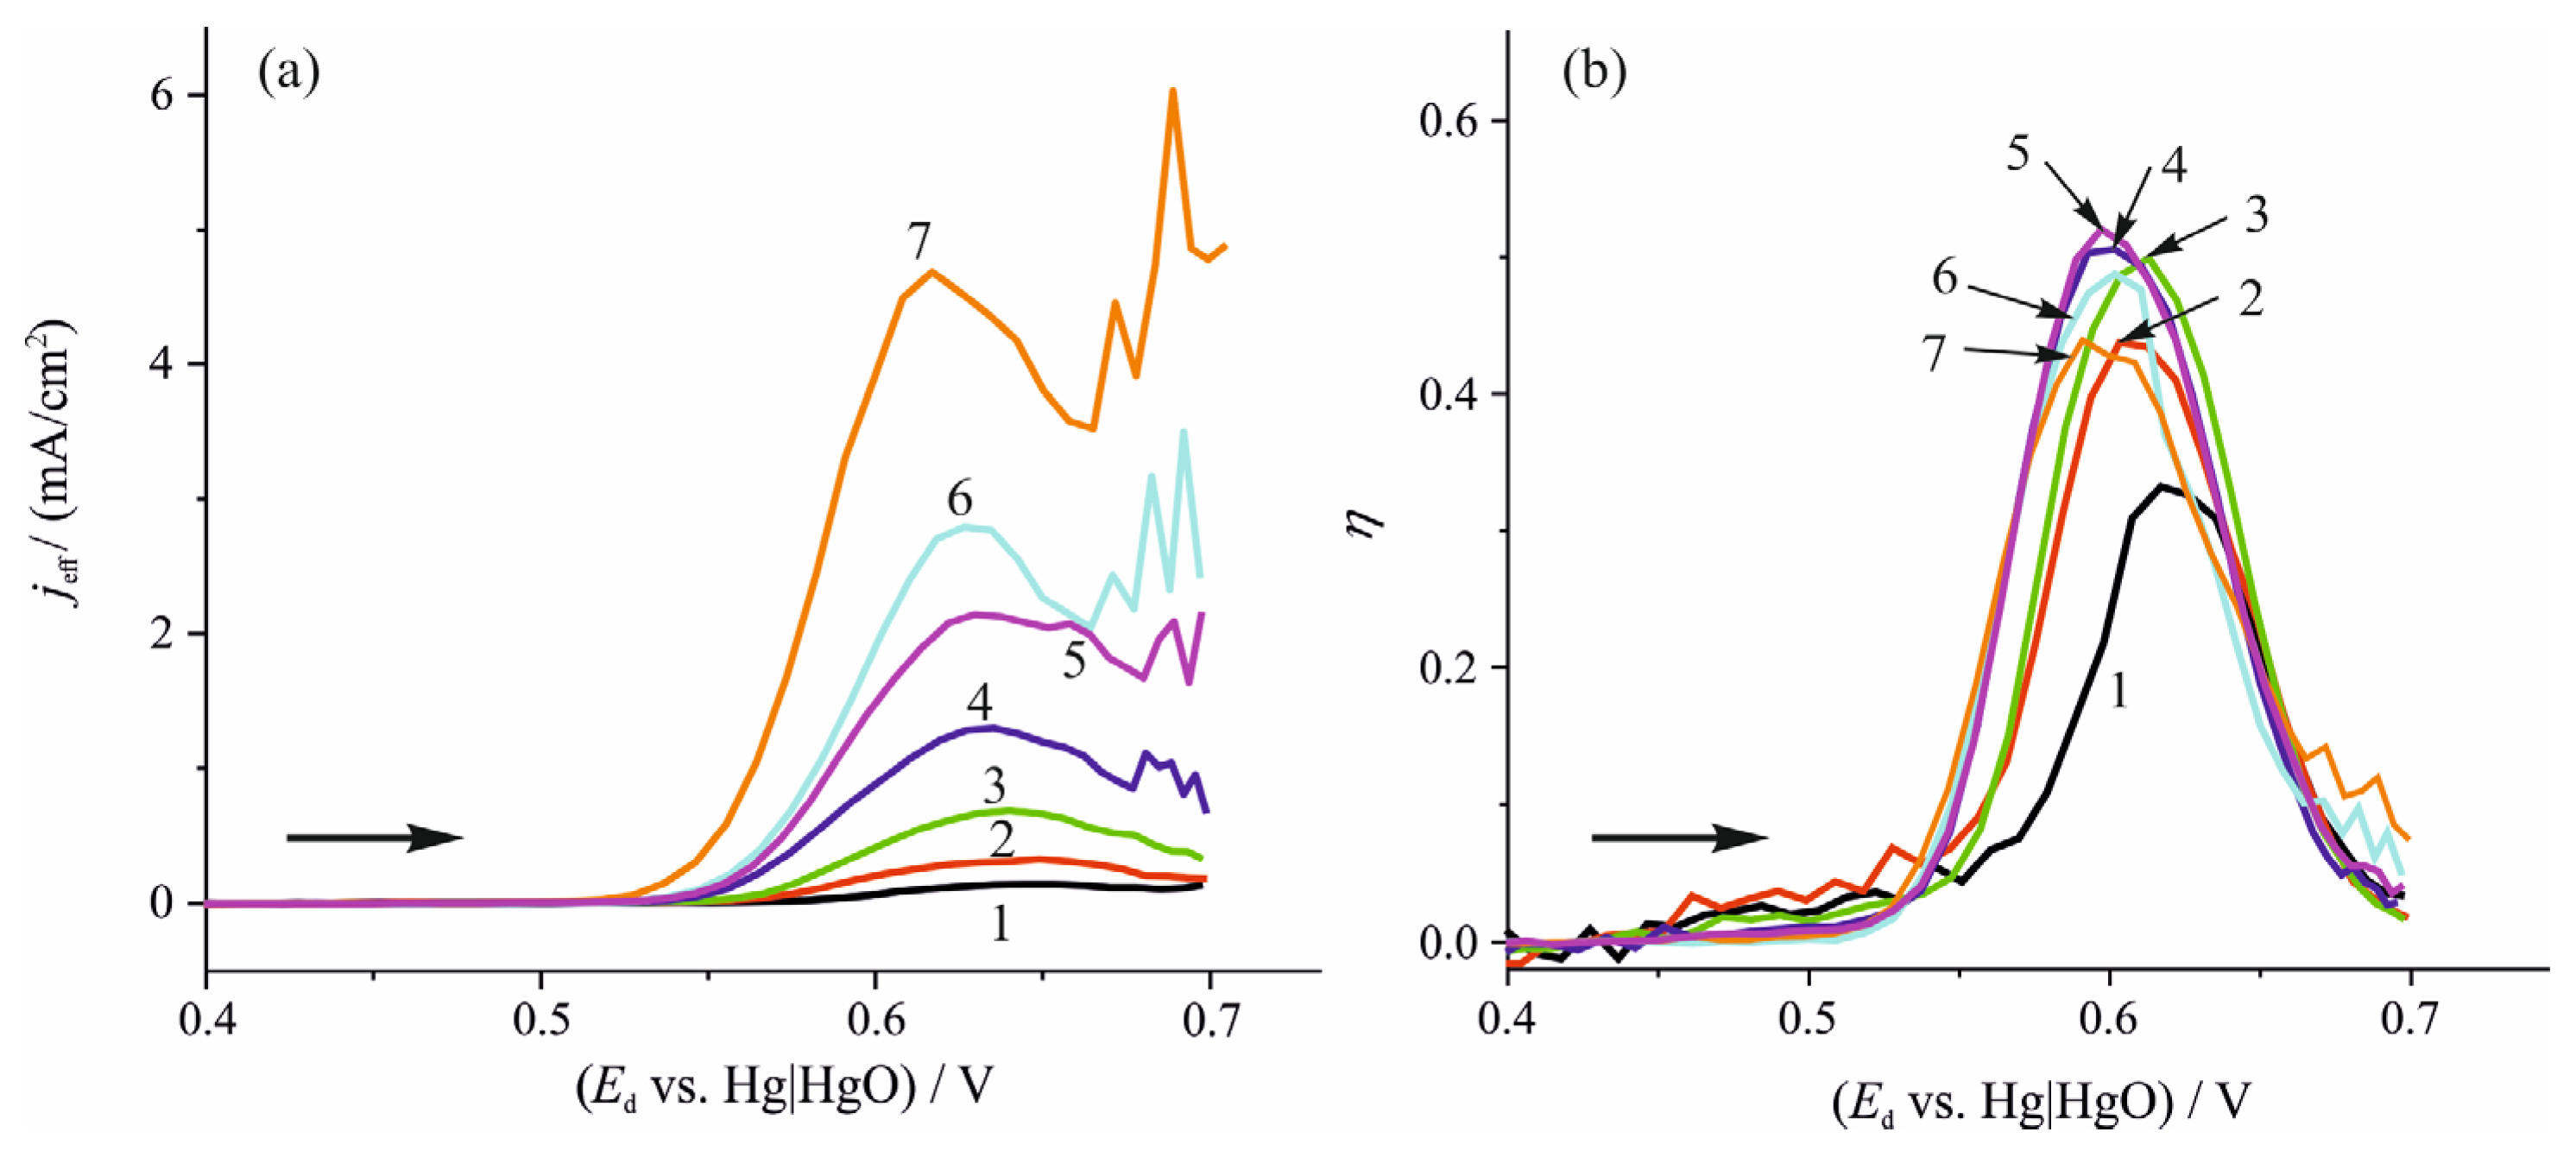
Figure 4a shows the effective current for ferrate ion formation as a function of potential at various temperatures, calculated in the same way as in Figure 2a. At lower temperatures (15–25 °C, Figure 4, 1–3), the effective current is quite low, and the scattering of the data points is negligible even at more positive potentials. This suggests that at these temperatures, bubbles from oxygen evolution do not interfere with the measurement, which aligns with the lower “total” current density (jd) measured at 15–25 °C, as shown in Figure 3. At higher temperatures, the effective current increases significantly, and it appears that the peak maxima shift towards negative potentials. However, the scattering in the current observed at 40–45 °C (Figure 4, 6–7, Ed > 0.65 V) should be treated with caution due to the uncertainty of these points. At these potentials, oxygen bubbles may alter the effective disk area, local hydrodynamic conditions, local solution resistance and may disturb the limiting-current response at the ring, reducing the quantitative reliability of the affected data. Possible indirect effects of ferrate decomposition products or local changes in electrolyte composition on the ring response cannot be excluded at the highest temperatures and current densities.
Figure 4.
(a) Effective current density (jeff) and (b) current efficiency (η) of ferrate ion formation as a function of the electrode potential of the disk (Ed vs. Hg|HgO (5 mol/dm3 KOH)) at different temperatures: 15 °C (black, 1); 20 °C (red, 2); 25 °C (green, 3); 30 °C (blue, 4); and 35 °C (magenta, 5); 40 °C (cyan, 6); 45 °C (orange, 7). (Rotation rate 1200 rpm. Electrolyte solution: 45% (m/m) aqueous NaOH solution. Iron disk radius: r1 = 0.25 cm, geometric surface area: Ad = 0.1964 cm2, sweep rate: νd = 0.50 mV/s. Platinum ring: outer radius: r3 = 0.375 cm, inner radius: r2 = 0.325 cm, geometric surface area: Ar = 0.110 cm2, sweep rate: νr = 200 mV/s). The arrows indicate the potential scan direction.
Figure 4b presents the current efficiency (determined using Equation (5)) at different temperatures. Although all curves exhibit a similar peak-shaped pattern, no clear trend emerges. It appears that while higher temperatures promote ferrate ion formation (Figure 4a), this increase is approximately equivalent to the enhanced oxygen evolution, leading to a similar current efficiency across all temperatures. Nonetheless, some conclusions can still be drawn from Figure 4b: at 15 °C (Figure 4b, 1) ferrate ion formation is so slow that the current efficiency is noticeably lower compared to higher temperatures. Additionally, the potential corresponding to the maximum current efficiency can be identified at all temperatures, which is a crucial “practical” parameter for the ferrate ion formation reaction.
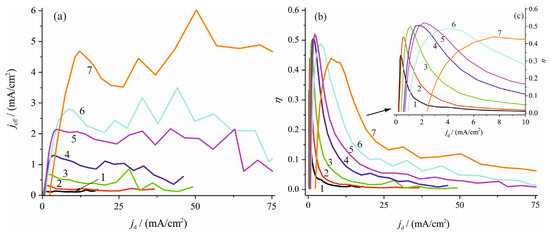
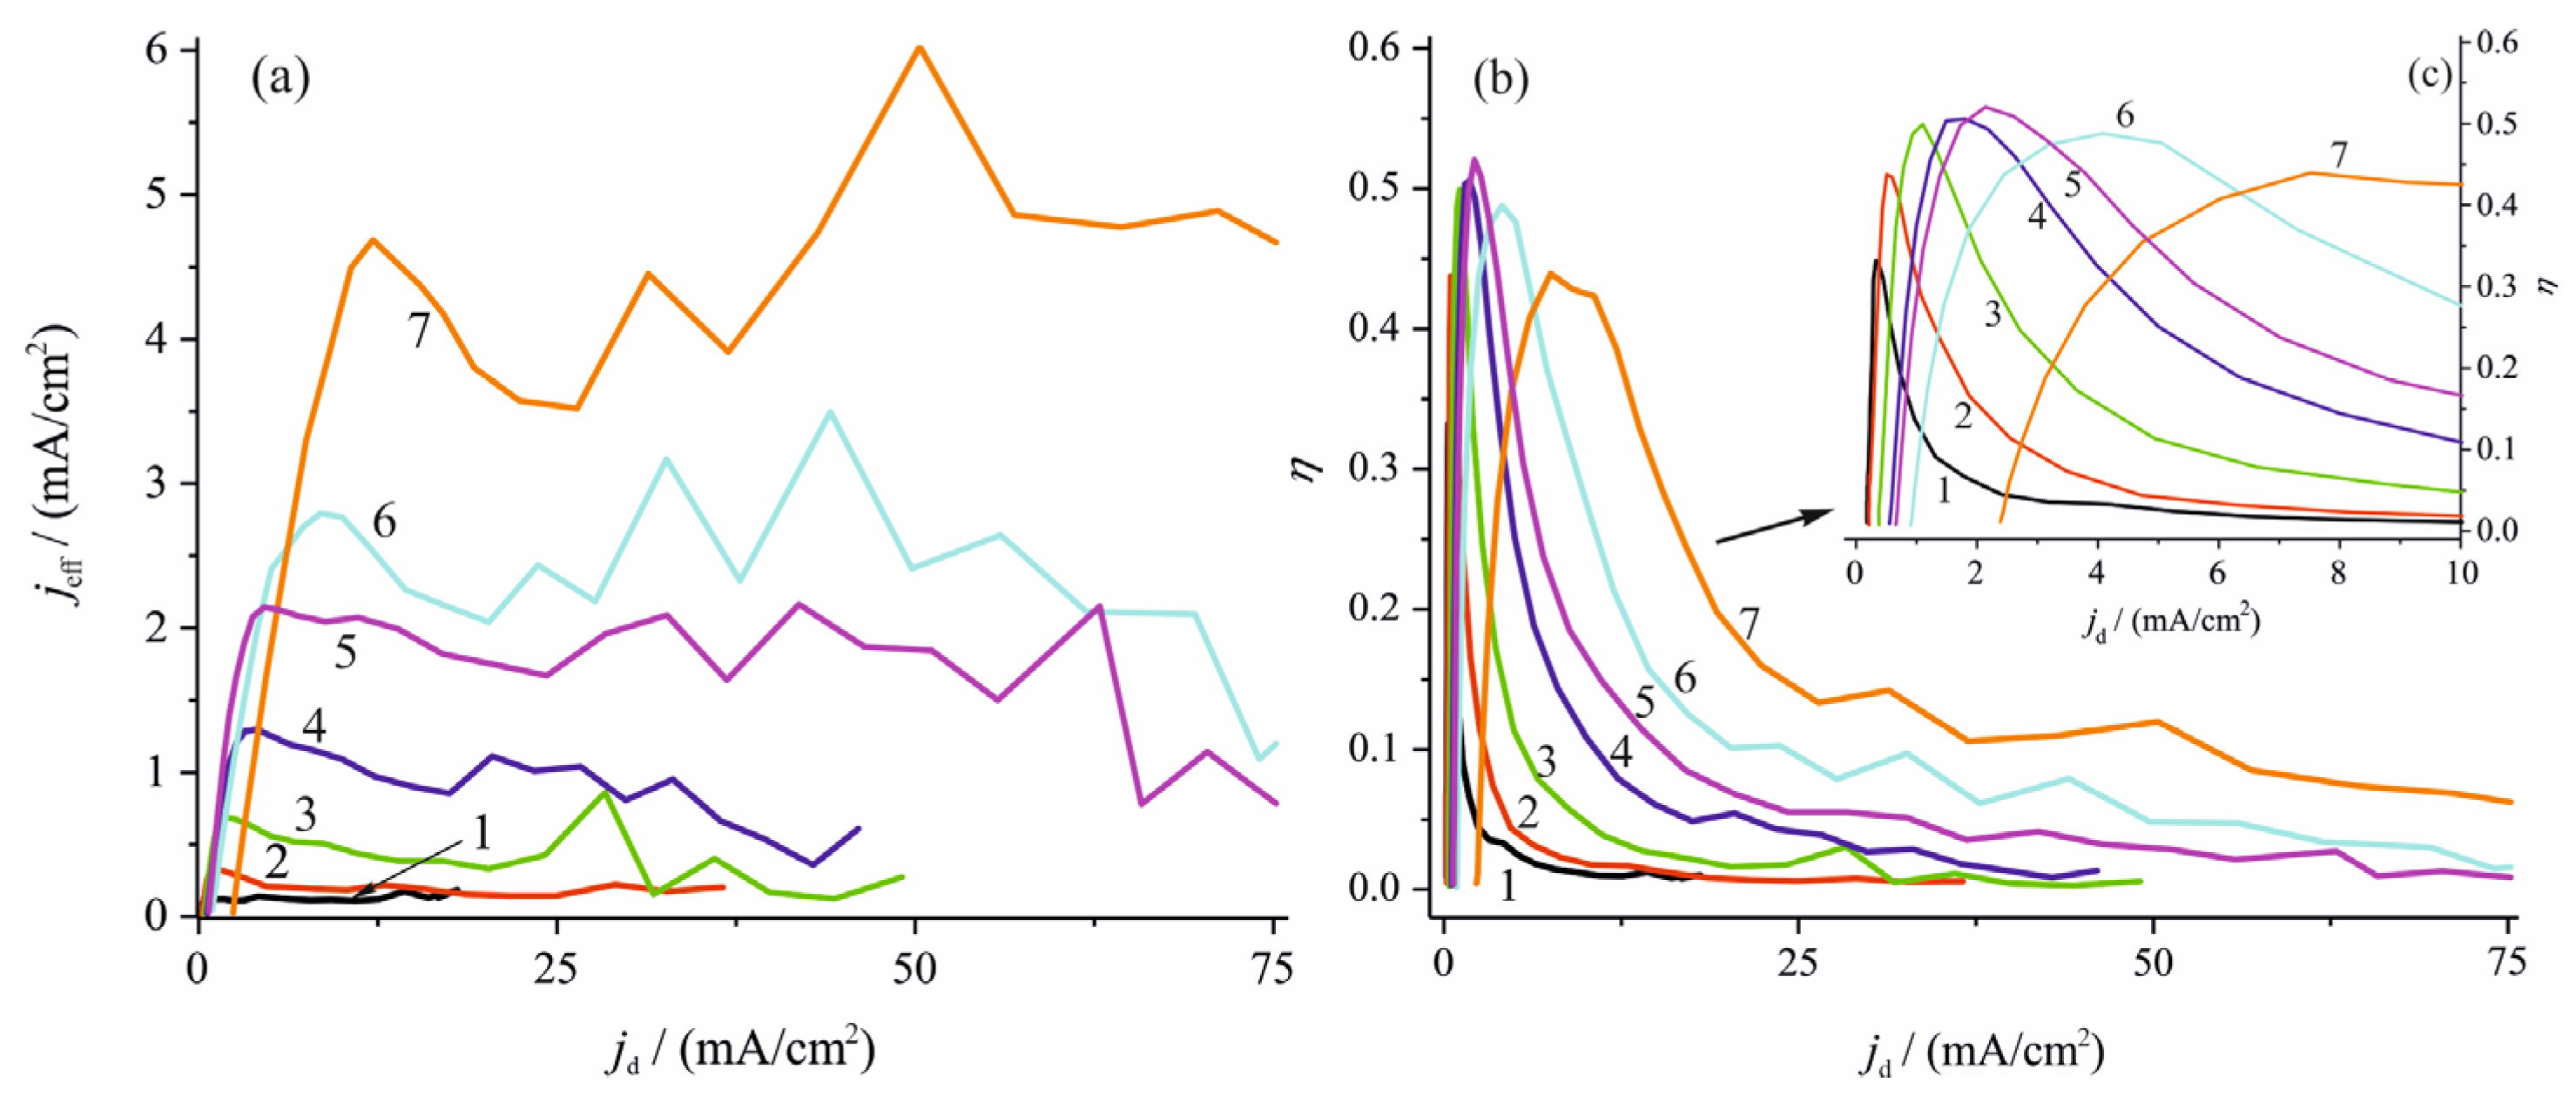
Figure 5a presents the effective current density of ferrate ion formation (jeff) as a function of the current density at the disk (jd, “total current density”, the calculations were made based on Equations (1)–(4)). At each temperature, a peak in effective current density appears at relatively low current density. Beyond this point, increased scattering of data points is observed, which can be attributed to bubble formation caused by rapid oxygen evolution. While both the maximum effective current density and the corresponding total current density increase with temperature, the onset of scattering consistently occurs around the same total current density (20–25 mA/cm2).
Figure 5.
(a) Effective current density (jeff) and (b) current efficiency (η) of ferrate ion formation at different temperatures at the disk as a function of the disk current density: 15 °C (black, 1); 20 °C (red, 2); 25 °C (green, 3); 30 °C (blue, 4); and 35 °C (magenta, 5); 40 °C (cyan, 6); 45 °C (orange, 7). The inset (c) illustrates an enlarged part of (b). (The other conditions were the same as those shown in Figure 4).
Figure 5b illustrates the current efficiency (η) as a function of “total” current density (jd) at different temperatures, while the inset (Figure 5c) highlights the lower-current region, which is particularly relevant for ferrate ion production. At lower temperatures (15–20 °C), the maximum current efficiency is relatively low, and the peaks are narrow. At moderate temperatures (25–35 °C), the maximum current efficiency reaches its highest values across the studied range (15–45 °C). At higher temperatures (40–45 °C), the maximum efficiency decreases, and the peaks broaden. The current-efficiency peak shifts to higher disk current densities and becomes broader as the temperature increases from 15 °C to 45 °C.
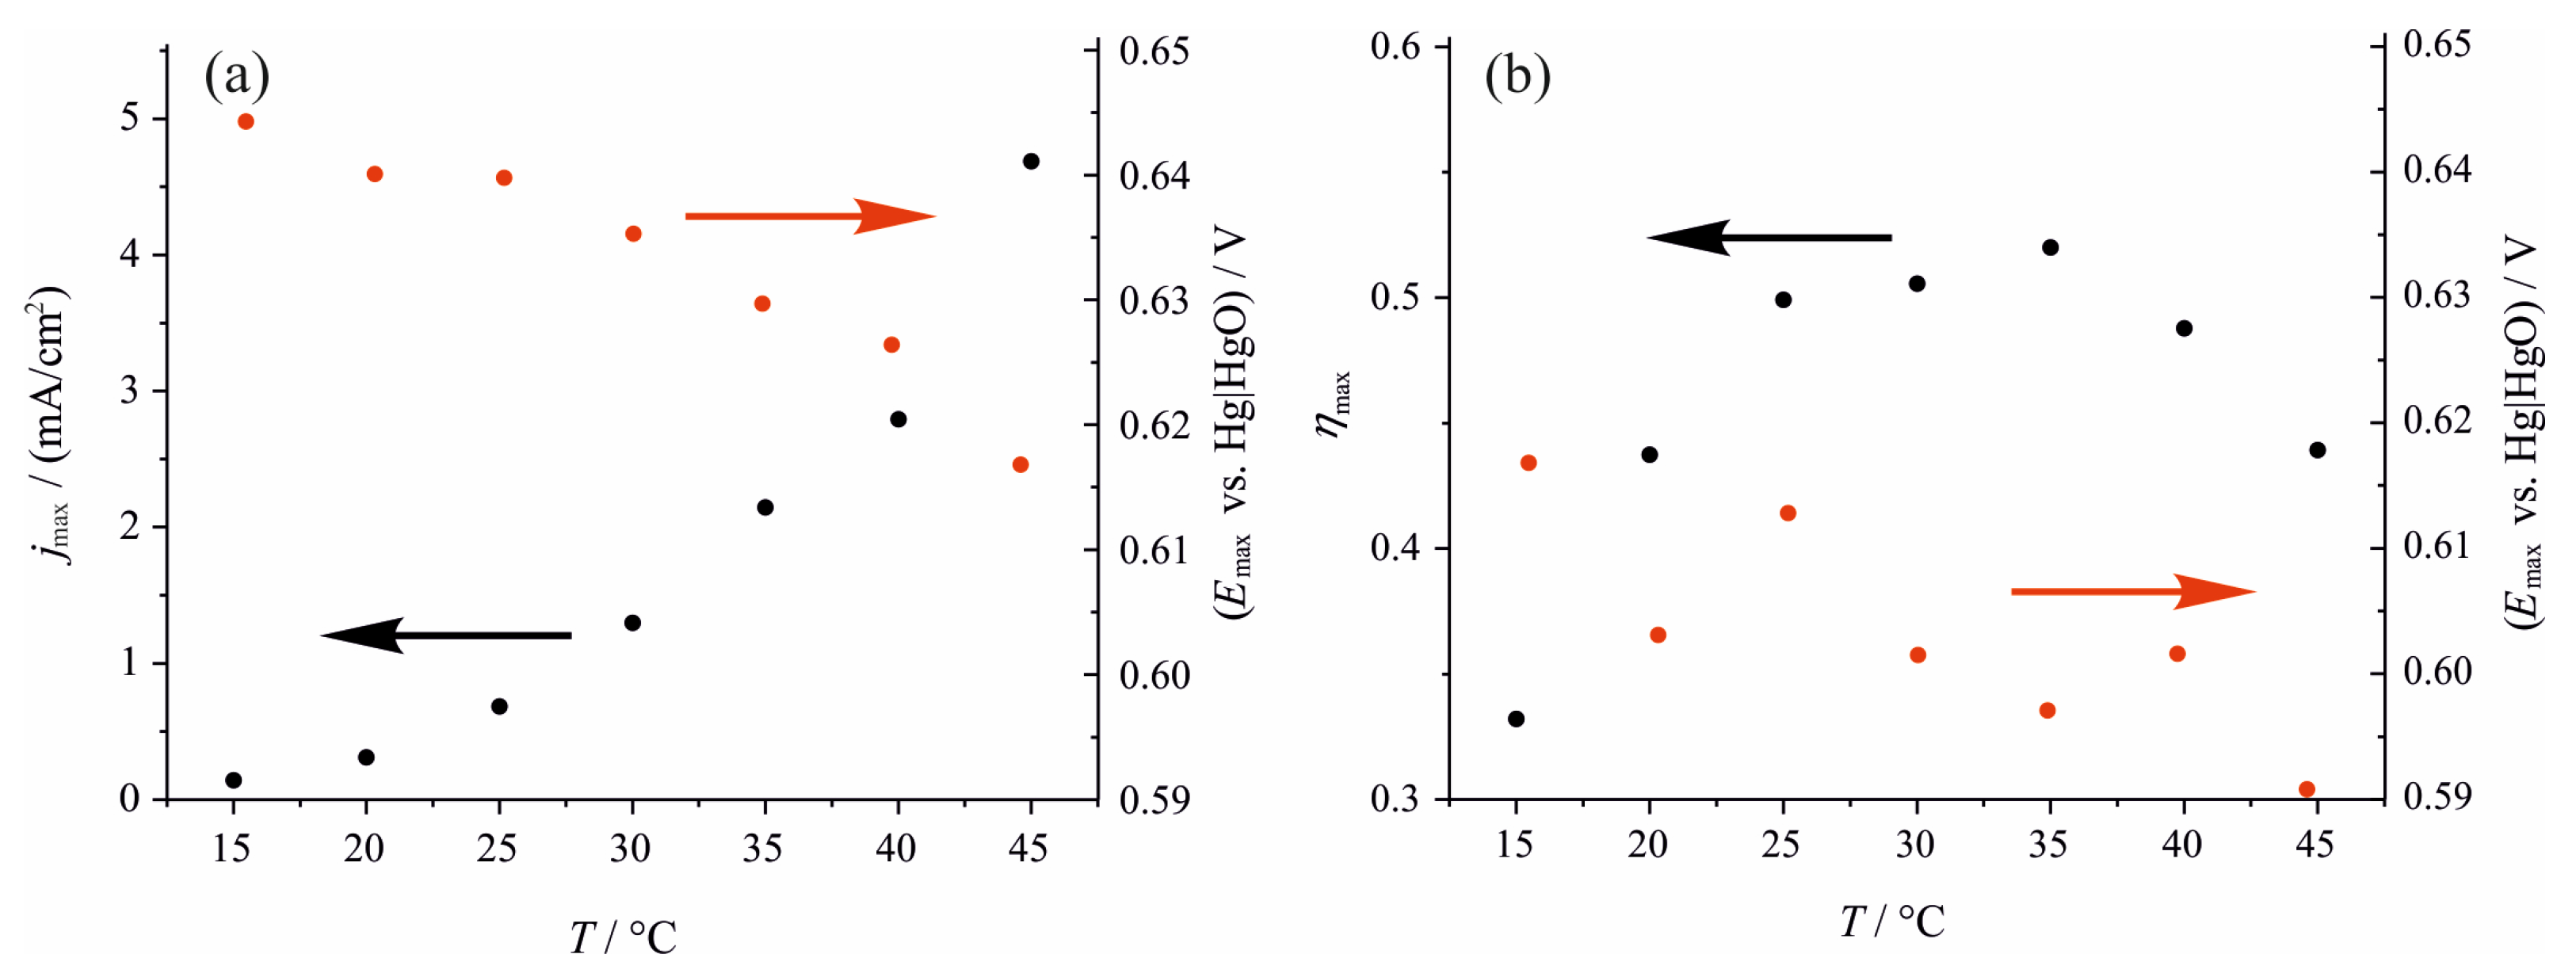
The maximum effective current densities (jeff,max) and the corresponding disk potentials (Ed) at different temperatures are listed in Table 1. The maximum current efficiencies (ηmax), together with the corresponding disk potentials (Ed) and total disk current densities (jd) at which they were obtained, are listed in Table 2. The temperature dependence of these quantities is shown in Figure 6.
Table 1.
The maximum effective current density for ferrate ion formation (jeff, max) and the corresponding disk potential (Ed) at different temperatures.
Table 2.
The maximum current efficiency for ferrate ion formation (ηmax) and the corresponding disk potential (Ed) and total disk current density (jd) at different temperatures.
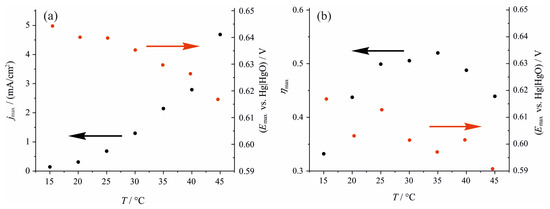
Figure 6.
(a) The maximum effective current densities (jeff,max) and (b) the maximum current efficiencies (ηmax) of ferrate ion formation together with the corresponding peak potentials (Emax) determined from the dual dynamic voltammetry measurements at different temperatures (T). Black symbols correspond to jeff, max in (a) and ηmax in (b) (left axes), while red symbols correspond to the associated Emax values (right axes); the arrows indicate the corresponding y-axes.
Figure 6a displays the current density and potential at the maximum effective current for ferrate ion formation at different temperatures. The trend is clear: as the temperature increases, the potential of the peak decreases, while the current density increases. Figure 6b shows the maximum current efficiency and the corresponding disk potential at each temperature. A decreasing trend in peak potentials is observed with increasing temperature. The current efficiency exhibits a peak-shaped profile, reaching its maximum at about 35 °C. The quantitative optimum values reported in this study apply specifically to 45% (m/m) NaOH and to the laboratory-scale RRDE configuration. Changes in electrolyte composition may affect ferrate formation, solubility, and decomposition. Scale-up may also shift the optimum conditions because reactor geometry, electrode arrangement, ohmic losses, gas evolution, electrode passivation, and separator design may differ from those in the laboratory-scale RRDE configuration. The optimum values determined here should therefore not be extrapolated directly to other electrolyte compositions or larger electrolyzers.
4. Conclusions
The results of this study demonstrate again that dual dynamic voltammetry (DDV) is an effective technique for determining the current associated with ferrate ion formation from that of the concurrent oxygen evolution reaction over the temperature range of 15–45 °C. Using DDV, both the effective current density and the current efficiency of ferrate ion formation were determined as functions of electrode potential and total disk current density at different temperatures with rather high time-resolution. Since the accumulation of ferrate ions in the cell during the experiments was negligible (due to very low electrode surface area-to-cell volume ratio), the results specifically reflect the generation of ferrate ions.
The findings indicate that the rates of both ferrate ion production and oxygen evolution increase with temperature within the investigated temperature range (15–45 °C). An optimum electrode-potential region was identified at each temperature, where ferrate ion formation reached its maximum rate under the investigated conditions. The current efficiency showed a similar peak-shaped dependence on disk potential at all temperatures, and it was also possible to calculate the maximum current efficiency for every temperature. The optimal temperature range required to achieve maximum current efficiency could also be determined (the highest value was found at about 35 °C), and a range of total disk current densities associated with the maximum current efficiency of ferrate formation was identified at each temperature.
These results are relevant to the optimization of ferrate production, although in practical applications ferrate decomposition, which becomes faster at higher temperatures, must also be considered (this issue might be mitigated with the utilization of specifically designed reactors [15,33]).
Author Contributions
Conceptualization, Á.Z. and G.G.L.; methodology, G.G.L.; validation, Á.Z., É.F. and G.G.L.; formal analysis, Á.Z. and G.G.L.; investigation, Á.Z. and É.F.; resources, G.G.L.; data curation, Á.Z.; writing—original draft preparation, Á.Z.; writing—review and editing, Á.Z. and G.G.L.; visualization, Á.Z. and G.G.L.; supervision, G.G.L.; funding acquisition, G.G.L. All authors have read and agreed to the published version of the manuscript.
Funding
This work was performed in the framework of the 2018-1.1.2-KFI-2018-00123 project, implemented with the support provided by the National Research, Development and Innovation Fund of Hungary, financed under the 2018-1.1.2-KFI funding scheme. G.G.L. and É.F. acknowledge grants from the National Research, Development, and Innovation Office (NKFIH, Hungary), grant nos. K 129210, FK135375. The publication was created as part of the Momentum Programme of the Hungarian Academy of Sciences (grant LP2022–18/2022).
Institutional Review Board Statement
Not applicable.
Informed Consent Statement
Not applicable.
Data Availability Statement
The original contributions presented in this study are included in the article. Further inquiries can be directed to the corresponding author(s).
Acknowledgments
The DDV measurement apparatus was provided by Soma Vesztergom, for which the authors are grateful.
Conflicts of Interest
The authors declare no conflicts of interest.
Abbreviations
The following abbreviations are used in this manuscript:
| CV | Cyclic Voltammetry |
| DDV | Dual Dynamic Voltammetry |
| LSV | Linear Sweep Voltammetry |
| RRDE | Rotating Ring–Disk Electrode |
| SHE | Standard Hydrogen Electrode |
Appendix A
Figure A1.
The applied potential programs (scans) at the disk (a) and ring (c) electrodes during a DDV measurement, and the resulting voltammograms of the disk (b) and ring (d) electrodes at T = 30 °C (E: electrode potential, j: current density). Rotation rate 1200 rpm. Electrolyte solution: 45% (m/m) aqueous NaOH solution. Iron disk: radius: r1 = 0.25 cm, geometric surface area: Ad = 0.1964 cm2, sweep rate: ν = 0.50 mV/s. Platinum ring: outer radius: r3 = 0.375 cm, inner radius: r2 = 0.325 cm, geometric surface area: Ar = 0.1100 cm2, sweep rate: ν = 200 mV/s [29]. The arrows indicate the potential scan directions. Colors distinguish successive stages of the DDV measurement; the numbered labels identify the corresponding selected regions/voltammograms discussed in the text, and the vertical dashed lines delimit the intervals marked a–d.
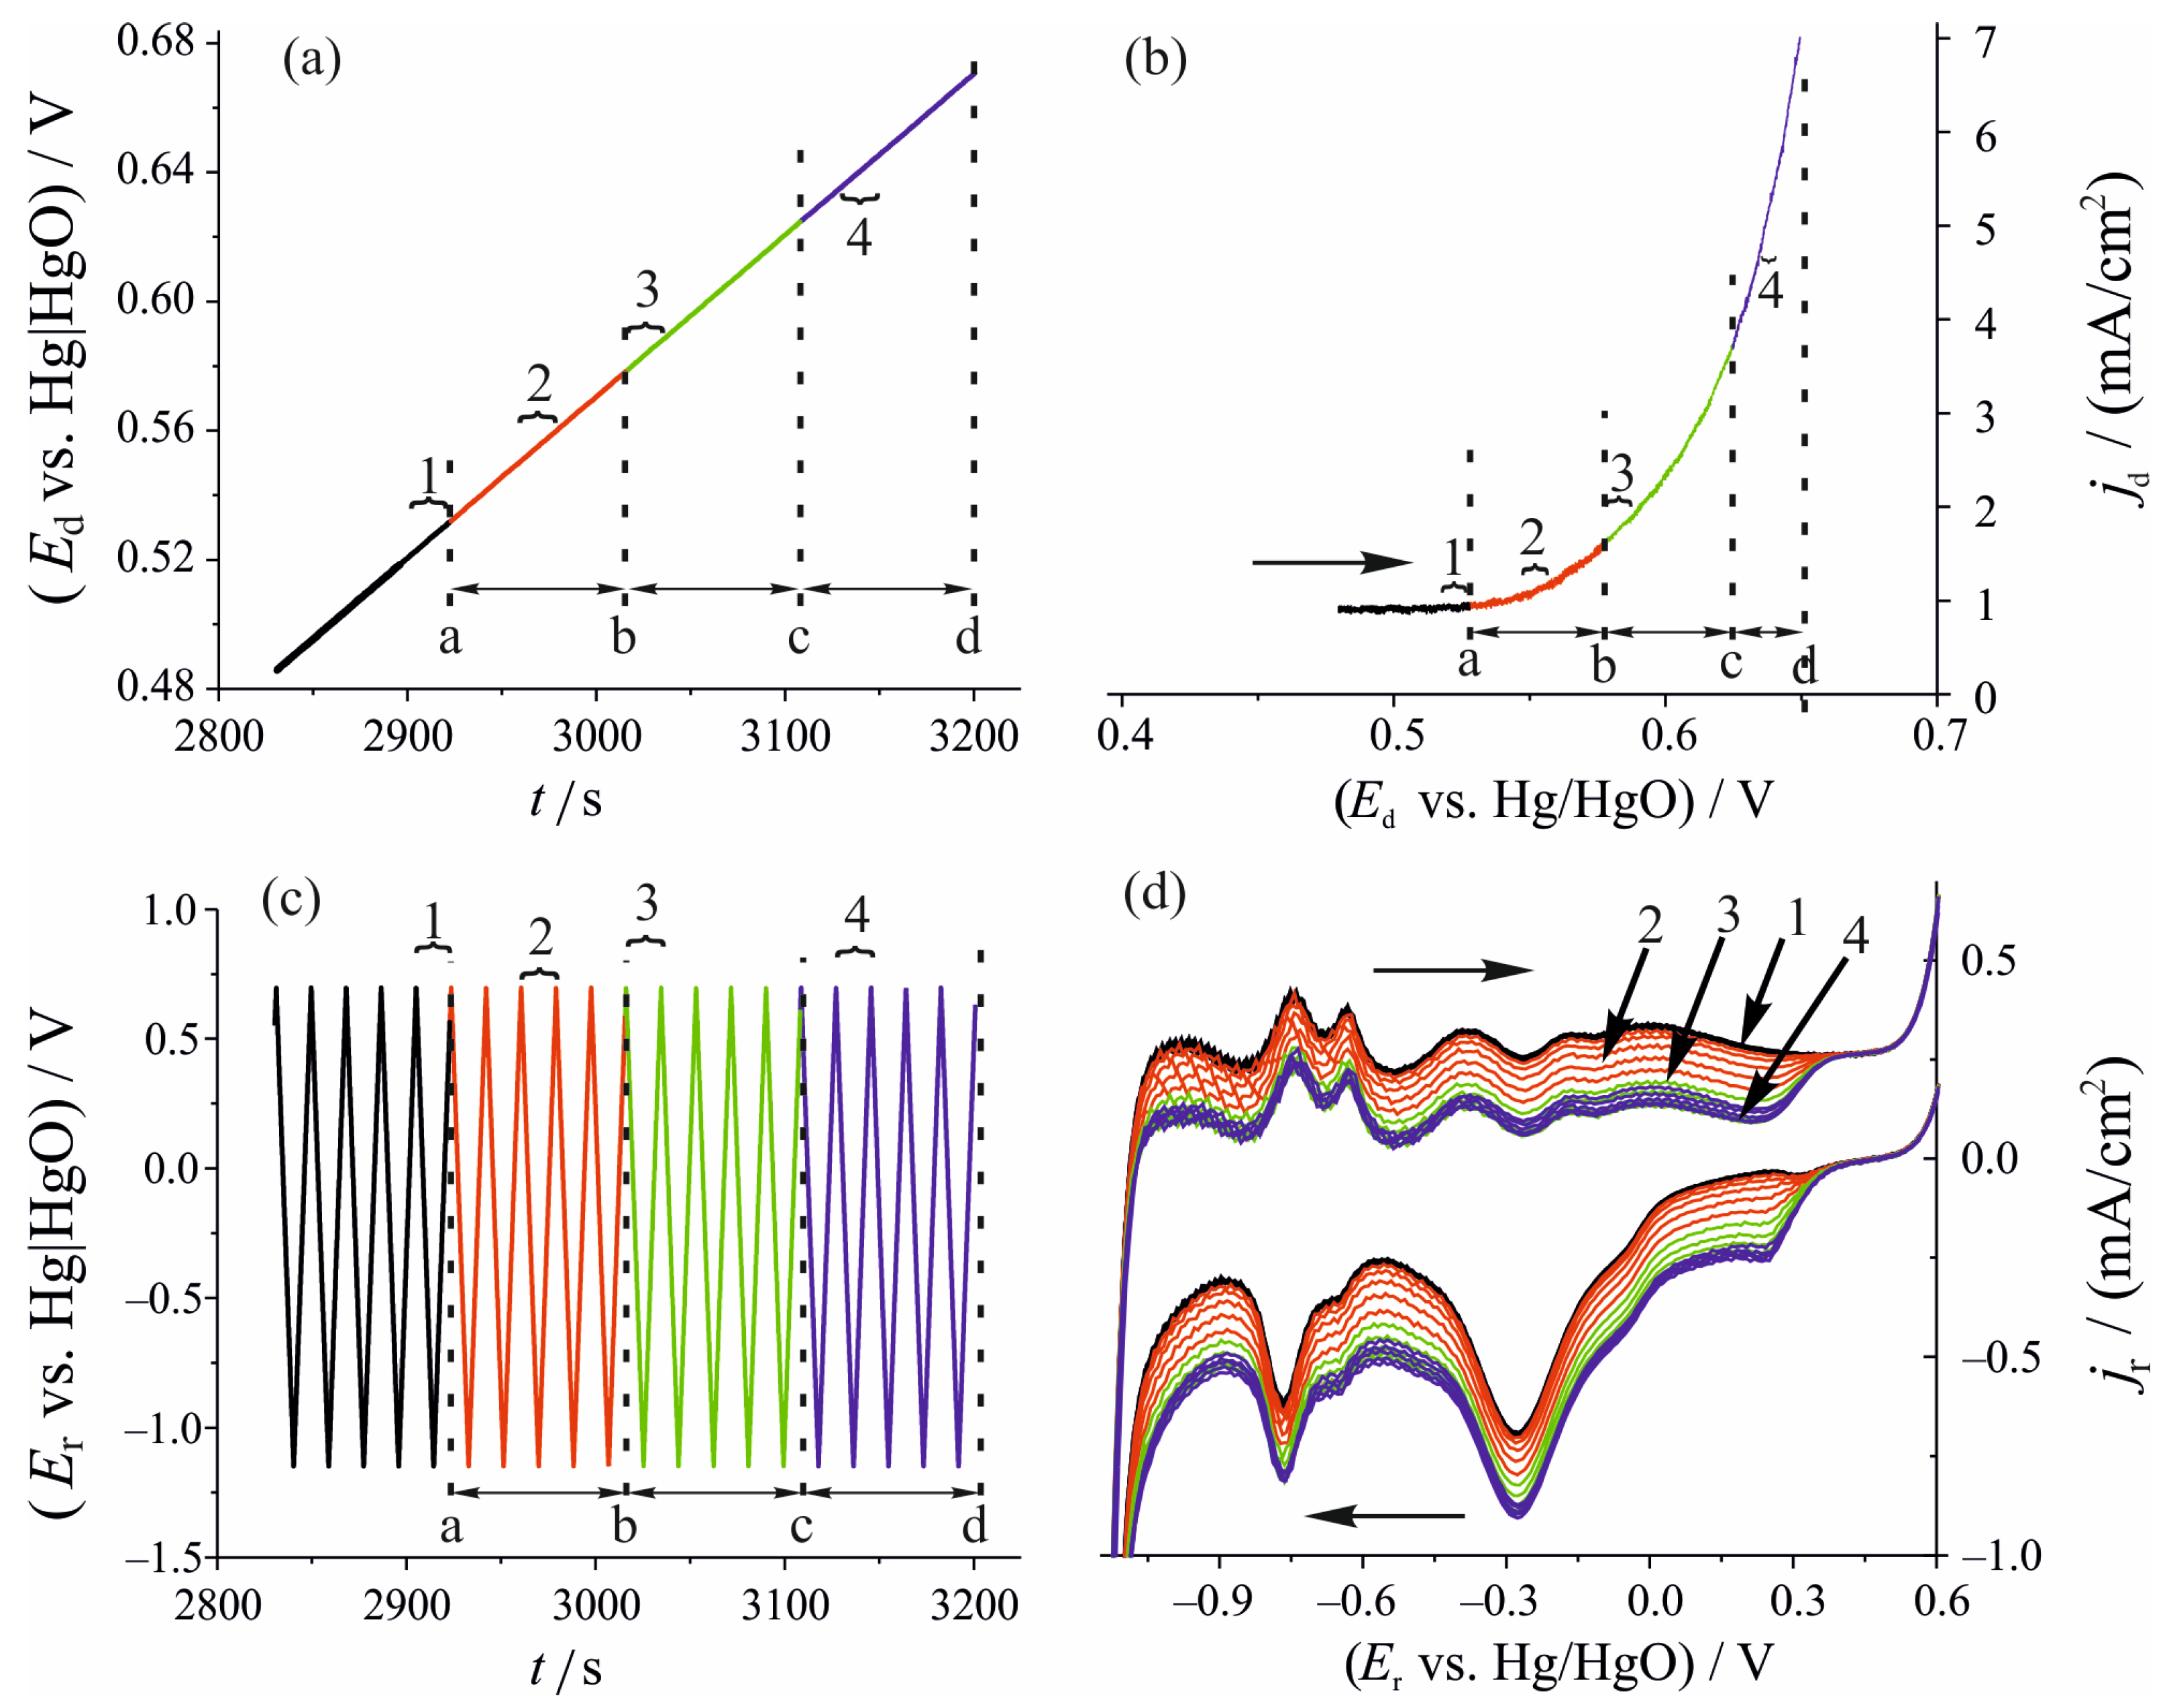
The relation between the sweep rates applied at the disk (0.5 mV/s) and ring (200 mV/s) electrodes can be observed clearly: while 5 entire sweep cycles are performed at the ring electrode (a → b in Figure A1a), the disk potential changed merely with ca. 50 mV (a → b in Figure A1c). The symbols Ed and Er stand for the disk and ring potentials with respect to the Hg/HgO/5 mol/dm3 KOH (aq.) electrode, respectively.
Based on Figure A1 it can be seen that the shapes of the CV-s recorded at the ring (Figure A1d) essentially do not depend on the potential of the disk as long as only a small anodic current (primarily from the anodic dissolution of iron in the form of Fe(III)) flows on the disk (up to about Ed ≈ 0.525 V vs. Hg|HgO, i.e., in the potential range more negative than the potential corresponding to point “a” in Figure A1b).
The start of oxidation reactions (ferrate ion formation and oxygen evolution) is indicated by a rapid increase in the anodic current that occurs when the disk potential is changed further in the positive direction (a → c in Figure A1b). Simultaneously, at ring potentials of ca. Er < 0.4 V the ring currents shift in the negative direction (1 → 3 in Figure A1d), indicating the reduction of an electroactive species at the ring electrode. As the disk potential increases further (c → d in Figure A1b), the anodic current measured at the disk rises almost exponentially, whereas the current shift at the ring electrode shows only a minor change (3 → 4 in Figure A1d). It has been shown in [29] that since oxygen reduction cannot be detected at a platinum electrode in these conditions, the reduction shift at the ring electrode can only be caused by ferrate ion reduction.
Figure A2.
Schematic of the processes taking place in the RRDE tip, which consists of an iron disk and a platinum ring. The green arrow indicates the direction of rotation. The magenta arrow represents ferrate transport from the Fe disk to the Pt ring, the red arrow indicates Fe(III) transport away from the ring, the light-blue arrow indicates O2 evolution, and the dark-blue arrows represent the hydrodynamic flow. The dashed vertical line marks the rotation axis, and the grey areas represent the Fe disk and Pt ring.
Appendix B
Figure A3.
Schematic of the water jacketed container (and the electrochemical cell) used in the experiments.
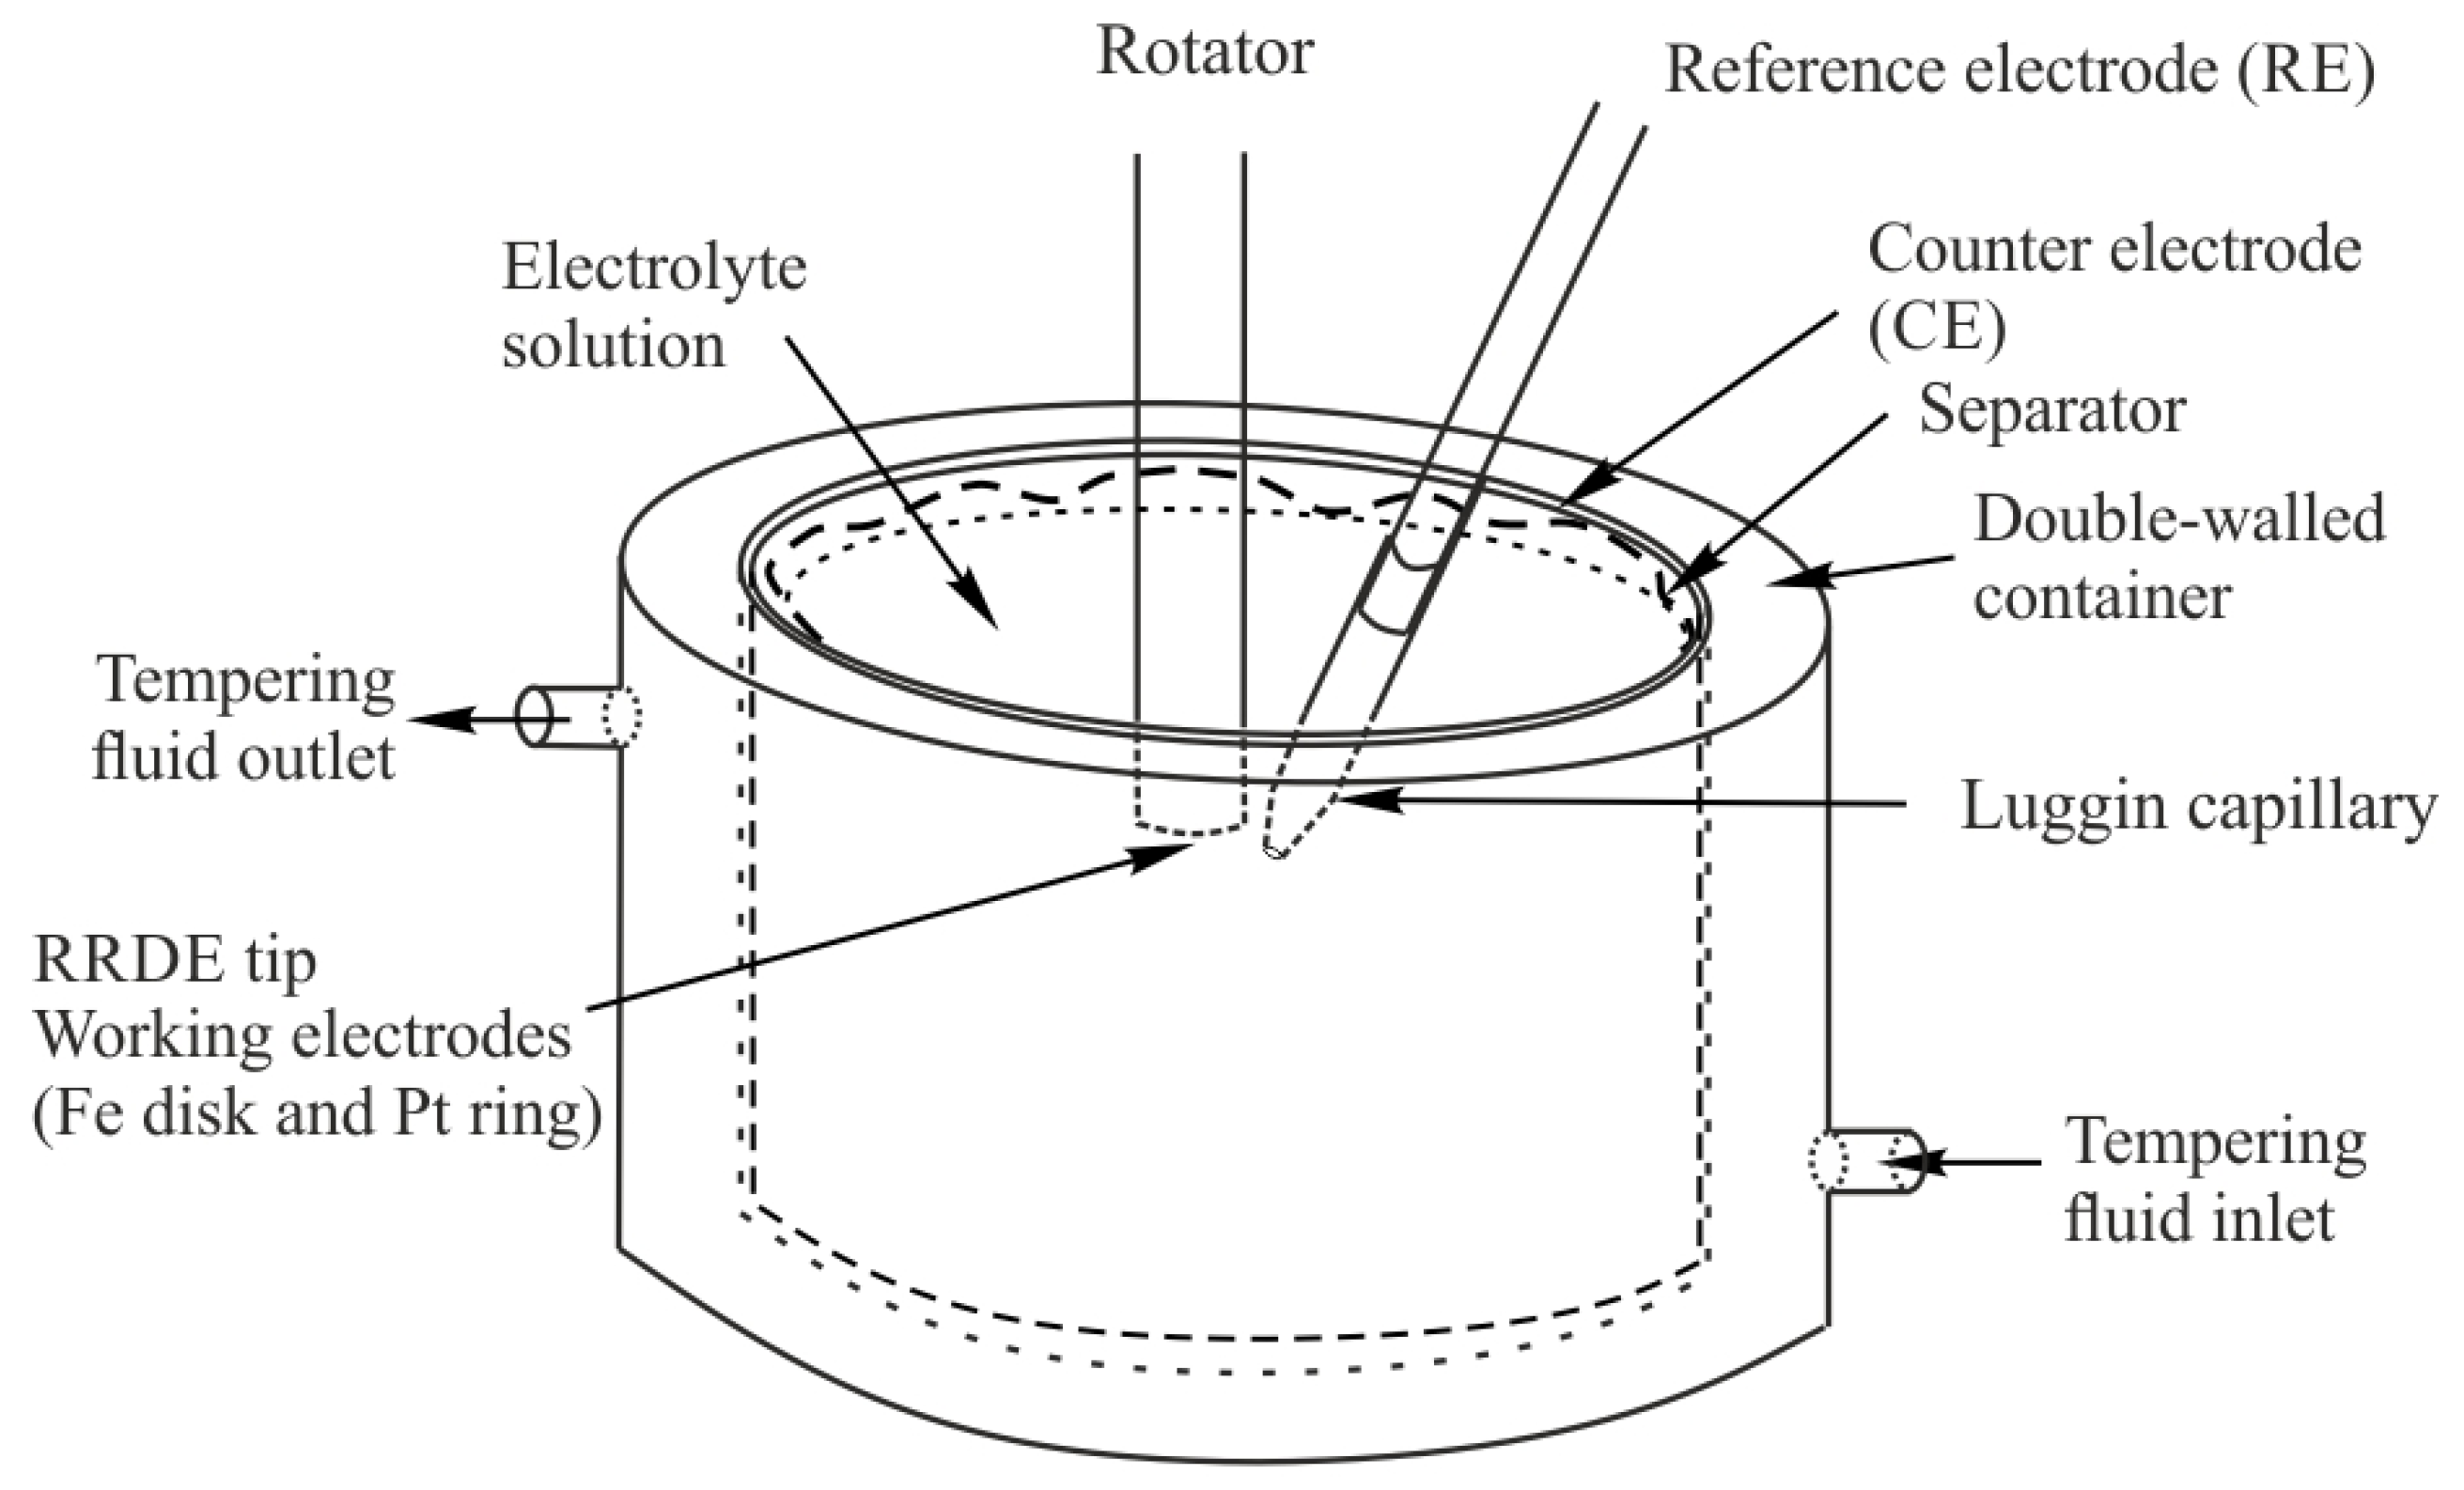
Figure A4.
The structure of the RRDE tip. 1: Fe disk; 2: Pt ring; 3: insulator (polypropylene); 4: insulating material between the disk and the ring (polypropylene); 5: metal parts (copper or copper alloy); r1: radius of the disk, r2: inner radius of the ring, r3: outer radius of the ring, r0: outer radius of the tip.
References
- Jiang, J.-Q.; Lloyd, B. Progress in the development and use of ferrate(VI) salt as an oxidant and coagulant for water and wastewater treatment. Water Res. 2002, 36, 1397–1408. [Google Scholar] [CrossRef] [Scilit] [PubMed]
- Gunawan, G.; Prasetya, N.B.A.; Wijaya, R.A. Electrosynthesis of ferrate from iron waste and seawater salts as antibacterials for water pollutant treatment. Chem. Eng. J. 2024, 498, 155422. [Google Scholar] [CrossRef] [Scilit]
- Lettie, L. Removal of refractory TKN from an effluent wastewater using sodium ferrate. In Electronic Theses and Dissertations; University of Central Florida: Orlando, FL, USA, 2006; Volume 943, Available online: https://stars.library.ucf.edu/etd/943 (accessed on 29 June 2026).
- Tang, Z.; He, Z.; Deng, Y. Engineering ferrate(vi) for water and wastewater treatment: Translating science into technology. Environ. Sci. Technol. 2026, 60, 11901–11913. [Google Scholar] [CrossRef] [Scilit] [PubMed]
- Wang, Y.; Luo, X.; Ma, X.; Kemacheevakul, P.; Qu, S.; Huang, J.; Chea, T.G.; Sun, P.; Zhao, L.; Zhang, Y.; et al. The effect and adjustment of ferrate species in ferrate-based advanced oxidation processes for wastewater treatment: A systematic review. Water 2025, 17, 1343. [Google Scholar] [CrossRef] [Scilit]
- Cao, J.-Y.; Du, Y.; Dai, X.; Liu, T.; Wang, Z.-J.; Li, J.; Zhang, H.; Zhou, P.; Lai, B. Ferrate(VI)-based synergistic oxidation processes (Fe(VI)-SOPs): Promoted reactive species production, micropollutant/microorganism elimination, and toxicity reduction. Chem. Eng. J. 2024, 489, 151180. [Google Scholar] [CrossRef] [Scilit]
- Amano, M.; Lohwacharin, J.; Dubechot, A.; Takizawa, S. Performance of integrated ferrate–polyaluminum chloride coagulation as a treatment technology for removing freshwater humic substances. J. Environ. Manag. 2018, 212, 323–331. [Google Scholar] [CrossRef] [Scilit] [PubMed]
- Vizsolyi, É.C.; Katona, K.; Láng, G.G.; Varga, J.; Záray, G. Effect of cations and ferric-oxide/hydroxide precipitation on the removal of chlorobenzene compounds from model solutions applying ferrate treatment. Desalin. Water Treat. 2020, 193, 352–358. [Google Scholar] [CrossRef] [Scilit]
- Deng, Y.; Guan, X. Unlocking the potential of ferrate(VI) in water treatment: Toward one-step multifunctional solutions. J. Hazard. Mater. 2024, 464, 132920. [Google Scholar] [CrossRef] [Scilit] [PubMed]
- Khoi, T.T.; An, N.T.; Huy, N.N.; Thuy, N.T. Ferrate as an all-in-one coagulant, oxidant, and disinfectant for drinking water treatment. J. Appl. Water Eng. Res. 2024, 12, 277–286. [Google Scholar] [CrossRef] [Scilit]
- Bouzek, K.; Rousar, I. The study of electrochemical preparation of ferrate(VI) using alternating current superimposed on the direct current. Frequency dependence of current yields. Electrochim. Acta 1993, 38, 1717–1720. [Google Scholar] [CrossRef] [Scilit]
- Kupec, R.; Plischka, W.; Duman, E.; Schneider, S.; Weidlich, C.; Keller, R.; Wessling, M.; Stöckl, M. Toward continuous electrochemical synthesis of ferrate. Adv. Sustain. Syst. 2025, 9, 2400398. [Google Scholar] [CrossRef] [Scilit]
- Petkova, A.P.; Gorbatyuk, S.M.; Sharafutdinova, G.R.; Nagovitsyn, V. Selection of materials and technologies for the electrochemical synthesis of sodium ferrate. Metallurgist 2024, 68, 449–459. [Google Scholar] [CrossRef] [Scilit]
- McBeath, S.T.; Zhang, Y.; Hoffmann, M.R. Novel synthesis pathways for highly oxidative iron species: Generation, stability, and treatment applications of ferrate (iv/v/vi). Environ. Sci. Technol. 2023, 57, 18700–18709. [Google Scholar] [CrossRef] [Scilit] [PubMed]
- Láng, G.G.; Varga, J.; Lendvai, J. Electrochemical Cluster System for the Production of Ferrate. HU Patent 0,005,559, 2 December 2022. [Google Scholar]
- Láng, G.G.; Varga, J.; Záray, G.; Varga, I.P. Polypropylene or Polyethylene-Based Separator for Use in Electrochemical Cells for Producing Alkali Metal Ferrates. E.P. Patent 3,983,577B1, 21 June 2023. Available online: https://patents.google.com/patent/EP3983577B1/en (accessed on 29 June 2026).
- Feihu, Z.; Yi, S.S. Electrochemical synthesis of ferrate (vi): Factors influencing synthesis and current research trends. J. Appl. Adv. Appl. Mech. 2024, 117, 72–90. [Google Scholar] [CrossRef] [Scilit]
- Beck, F.; Kaus, R.; Oberst, M. Transpassive dissolution of iron to ferrate(VI) in concentrated alkali hydroxide solutions. Electrochim. Acta 1985, 30, 173–183. [Google Scholar] [CrossRef] [Scilit]
- Bouzek, K.; Rousar, I. Current efficiency during anodic dissolution of iron to ferrate(vi) in concentrated alkali hydroxide solutions. J. Appl. Elchem. 1993, 23, 1317–1322. [Google Scholar] [CrossRef] [Scilit]
- Bouzek, K.; Schmidt, M.J.; Wragg, A.A. Influence of electrolyte composition on current yield during ferrate(VI) production by anodic iron dissolution. Electrochem. Commun. 1999, 1, 370–374. [Google Scholar] [CrossRef] [Scilit]
- He, W.; Wang, J.; Shao, H.; Zhang, J.; Cao, C. Novel KOH electrolyte for one-step electrochemical synthesis of high purity solid K2FeO4: Comparison with NaOH. Electrochem. Commun. 2005, 7, 607–611. [Google Scholar] [CrossRef] [Scilit]
- Maghraoui, A.E.; Zerouale, A.; Ijjaali, M.; Sajieddine, M. Synthesis and characterization of ferrate(vi) alkali metal by electrochemical method. Adv. Mater. Phys. Chem. 2013, 3, 83–87. [Google Scholar] [CrossRef]
- Hernández, M.A.C.; May, A.; Bonakdapour, A.; Mohseni, M.; Wilkinson, D.P. Analytical quantification of electrochemical ferrates for drinking water treatments. Can. J. Chem. 2017, 95, 1. [Google Scholar] [CrossRef] [Scilit]
- Li, C.; Li, X.Z.; Graham, N. A study of the preparation and reactivity of potassium ferrate. Chemosphere 2005, 61, 537–543. [Google Scholar] [CrossRef] [Scilit] [PubMed]
- Barisci, S.; Ulu, F.; Särkkä, H.; Dimoglo, A.; Sillanpää, M. Electrosynthesis of ferrate (vi) ion using high purity iron electrodes: Optimization of influencing parameters on the process and investigating its stability. Int. J. Electrochem. Sci. 2014, 9, 3099–3117. [Google Scholar] [CrossRef] [Scilit]
- Cataldo-Hernández, M.; Stwart, M.; Bonakdarpour, A.; Mohseni, M.; Wilkinson, D.P. Degradation of ferrate species produced electrochemically for use in drinking water treatment applications. Can. J. Chem. Eng. 2018, 96, 1045–1052. [Google Scholar] [CrossRef] [Scilit]
- Nguyen, T.V.A.; Mai, T.T.T.; Phan, T.B.; Tran, H.Q.; Bui, M.Q. Ferrate(VI) green oxidant: Electrochemical generation, self-decomposition, and application for reactive red 195 azo dye treatment. J. Chem. Technol. Biotechnol. 2024, 99, 2454–2463. [Google Scholar] [CrossRef] [Scilit]
- Láng, G.G.; Ujvári, M.; Kovács, N.; Vesztergom, S. The Theory and Applications of Dual Dynamic Voltammetry with Rotating Ring-Disk Electrodes. ChemElectroChem 2025, 12, e202400661. [Google Scholar] [CrossRef] [Scilit]
- Zsubrits, Á.; Kuti, M.; Fekete, É.; Ujvári, M.; Láng, G.G. Where do ferrate ions form? A dual dynamic voltammetry study. Electrochem. Commun. 2023, 156, 107587. [Google Scholar] [CrossRef] [Scilit]
- Zsubrits, Á.; Kuti, M.; Fekete, É.; Láng, G.G. Dual dynamic voltammetric study of the formation of ferrate ions during the electrochemical dissolution of white cast iron in the transpassive region. Z. Phys. Chem. 2025, 239, 1411–1424. [Google Scholar] [CrossRef] [Scilit]
- Wang, Y.L.; Ye, S.H.; Bo, J.K.; Wang, Y.Y.; Wu, F. Electrochemical Reduction Mechanism of Fe(VI) at a Porous Pt Black Electrode. J. Electrochem. Soc. 2009, 156, A572–A576. [Google Scholar] [CrossRef] [Scilit]
- Nickell, R.A.; Zhu, W.H.; Payne, R.U.; Cahela, D.R.; Tatarchuk, B.J. Hg/HgO electrode and hydrogen evolution potentials in aqueous sodium hydroxide. J. Power Sources 2006, 161, 1217–1224. [Google Scholar] [CrossRef] [Scilit]
- Láng, G.G.; Varga, J.; Záray, G.; Varga, I.P. Equipment and Procedure for the Preparation of Sodium and Potassium Ferrate Solutions by Electrochemical Method. HU Patent 231043, 22 November 2019. [Google Scholar]

Disclaimer/Publisher’s Note: The statements, opinions and data contained in all publications are solely those of the individual author(s) and contributor(s) and not of MDPI and/or the editor(s). MDPI and/or the editor(s) disclaim responsibility for any injury to people or property resulting from any ideas, methods, instructions or products referred to in the content. |
© 2026 by the authors. Licensee MDPI, Basel, Switzerland. This article is an open access article distributed under the terms and conditions of the Creative Commons Attribution (CC BY) license.