


Abstract
In this study, an integrated machine learning (ML)-based calibration approach was employed for the data-driven calibration of a low-cost PM2.5 sensor. The primary objective was to systematically evaluate the relative contributions of location-specific environmental covariates, auxiliary gaseous pollutants, and Feature Engineering (FE) strategies in the calibration of a low-cost PM2.5 sensor deployed in an outdoor residential environment. For this purpose, a multi-stage experimental framework based on an ablation study design incorporating different environmental information groups was implemented, and the models were evaluated using a leakage-safe time-based validation approach. The results demonstrated that FE strategies significantly improved model performance across all experimental configurations. The highest performance was obtained under the configuration using raw PM2.5 sensor data together with FE-derived features, where the RF model increased the Test R2 value from 0.7237 to 0.8467 and reduced the RMSE from 6.96 µg/m3 to 5.19 µg/m3. Feature importance analyses indicated that humidity-based interaction features and cyclic temporal encoding structures provided substantial contributions to model performance. The findings suggest that meaningful PM2.5 calibration performance can be achieved using location-specific environmental covariates and data-driven FE strategies in scenarios where continuous co-location is not operationally feasible.
1. Introduction
Air pollution is considered one of the most significant global environmental problems directly affecting human health, environmental sustainability, and quality of life. Among atmospheric pollutants, fine particulate matter (PM) can penetrate deep into the respiratory system due to its small aerodynamic diameter and may lead to severe health problems. Numerous studies have reported that long-term exposure to PM2.5 is associated with cardiovascular diseases, chronic respiratory disorders, lung cancer, neurological disorders, and premature mortality [1,2,3]. From a regulatory and health-risk perspective, PM2.5 concentrations are commonly evaluated using guideline or limit values expressed in µg/m3. The 2021 WHO Global Air Quality Guidelines recommend an annual mean PM2.5 level of 5 µg/m3 and a 24-h mean level of 15 µg/m3 [4]. In addition, the revised EU Ambient Air Quality Directive (Directive (EU) 2024/2881) sets a 2030 annual limit value of 10 µg/m3 for PM2.5 and a 24-h limit value of 25 µg/m3, not to be exceeded more than 18 times per calendar year [5]. These reference levels provide a regulatory context for interpreting the PM2.5 concentrations and calibration errors reported in this study.
Therefore, the accurate, continuous, and high-temporal-resolution monitoring of PM2.5 concentrations is of critical importance for public health policies and air quality management. Conventional air quality monitoring systems mainly rely on reference-grade monitoring stations. Although these stations provide high accuracy and reliability, their installation, maintenance, and operational costs are considerably high, resulting in a limited number of stations in most cities [6,7]. Consequently, the spatial resolution of official air quality monitoring networks remains low. However, PM2.5 concentrations may exhibit substantial variations even over short distances due to traffic density, building structures, topographical conditions, street geometry, and local meteorological variables [8]. As a result, measurements obtained from a limited number of fixed monitoring stations may fail to fully represent individual- or neighborhood-scale micro-environmental exposure conditions.
In recent years, low-cost sensors (LCSs) have emerged as an important alternative in air quality monitoring studies due to their ability to provide high spatial and temporal resolution data. Owing to their low cost, portability, and capability to be deployed as dense sensor networks, these systems have been widely adopted in smart city applications [9], Internet of Things (IoT)-based environmental monitoring systems, and citizen science projects [10,11]. LCSs enable more detailed monitoring of local air pollution variations and allow regional variability beyond the coverage of conventional monitoring networks to be evaluated more comprehensively. However, the major limitation of these sensors is their lower measurement accuracy and higher environmental sensitivity compared to reference-grade instruments [12].
Most low-cost PM sensors operate based on the optical light-scattering principle. However, the measurement accuracy of these sensors is influenced not only by particle concentration but also by particle size, aerosol type, and environmental conditions. In particular, factors such as relative humidity, temperature, atmospheric pressure, and sensor drift are known to have significant effects on the performance of low-cost PM sensors [13,14]. Therefore, the direct use of raw sensor data is often considered insufficient, and calibration procedures become necessary to obtain reliable results.
Calibration can be defined as a correction process performed to reduce systematic deviations in LCS measurements and to improve the agreement between raw sensor outputs and a reliable target dataset. In the literature, this target dataset generally consists of co-located reference-grade instrument measurements; however, approaches utilizing location-specific environmental data sources and model-based atmospheric estimates as supportive targets or auxiliary data have recently attracted increasing attention. Early studies primarily employed Linear Regression (LR)-based statistical methods [15,16]. Nevertheless, conventional linear models have proven insufficient in many cases due to the non-linear behavior of PM sensor responses and their complex interactions with environmental variables [17].
In recent years, ML-based data-driven calibration approaches have been widely employed to improve the accuracy of low-cost PM sensors [18,19,20]. In particular, ensemble learning methods have been reported to achieve successful results in modeling non-linear environmental relationships in low-cost PM2.5 sensor calibration [19]. Several studies have demonstrated that tree-based models such as RF, XGBoost (XGB), and LGBM can provide robust and stable calibration performance when combined with meteorological variables, auxiliary gaseous pollutants, and temporal features [21,22]. The ability of these models to learn multidimensional environmental relationships provides significant advantages over conventional linear models. One of the primary reasons why ensemble-based models have become prominent in low-cost PM sensor calibration is their capability to effectively capture non-linear relationships and variable interactions among environmental factors. In particular, tree-based boosting methods can more effectively learn variable importance within high-dimensional environmental datasets and provide more consistent prediction performance under varying environmental conditions.
In ML-based calibration studies, the structure of the features included in the model plays a critical role in overall model performance. Recent studies have shown that FE strategies such as lag-based features, rolling averages, environmental interaction terms, and cyclic temporal encoding methods can improve the calibration accuracy of low-cost PM sensors [23]. In particular, the inclusion of temporal features representing historical observations and interaction terms between environmental variables can contribute to more accurate modeling of short-term PM2.5 variations.
In the literature, the majority of LCS calibration studies are based on the co-location approach [24]. In this method, LCSs are operated alongside reference-grade instruments at the same location to collect synchronized measurements. Although this approach can provide high accuracy, continuously operating all sensors together with reference instruments in large-scale sensor networks is not practically or economically sustainable. Therefore, data-driven PM2.5 calibration approaches utilizing location-specific environmental covariates have attracted increasing attention in recent years [25,26]. Several studies have demonstrated that meteorological variables and gaseous pollutant estimates obtained from publicly available environmental data services can be utilized as auxiliary information sources for LCS calibration [27,28]. In this study, location-specific environmental covariates and PM2.5 estimates obtained from Open-Meteo (OM) were incorporated into the calibration process.
In addition, recent studies have shown that incorporating features representing historical observations into models can improve PM2.5 prediction performance in air quality datasets with temporal dependency [29,30]. Nevertheless, integrated studies simultaneously evaluating auxiliary gaseous pollutants, selected FE strategies, and leakage-safe validation approaches remain limited.
In ML-based time-series studies, the data splitting strategy is critical for the reliable evaluation of model performance. In datasets containing temporal dependency, random train–test splitting methods may lead to data leakage and cause model performance to be overestimated [31,32,33]. Therefore, leakage-safe time-based validation approaches have recently been recommended as more realistic and reliable evaluation methods for air quality time-series analyses.
In this study, an adapted version of the previously developed AQ-MultiCal platform was utilized for the data-driven calibration of a low-cost PM2.5 sensor deployed at balcony level. In the proposed approach, raw sensor measurements were evaluated together with sensor-side meteorological variables, OM-based environmental covariates, and selected FE strategies. In addition, a systematic ablation study design was implemented to investigate the effects of different variable groups on calibration performance. Within the scope of the study, RF, XGB, LGBM, CatBoost, Ridge Regression (Ridge), and other regression models were comparatively evaluated, and model performances were assessed using a leakage-safe time-based validation approach. The findings confirm that carefully selected environmental covariates and FE strategies can provide meaningful contributions to low-cost PM2.5 sensor calibration.
The proposed approach provides a practical alternative for performing data-driven calibration using location-specific environmental covariates without requiring continuous co-location, particularly in regions lacking dense air quality monitoring infrastructure.
Overall, this study extends the previous AQ-MultiCal framework beyond a simple re-application to PM2.5 calibration. Its main scientific contribution lies in the integrated use of location-specific OM-based environmental covariates, selected FE structures, ablation-based variable group evaluation, and a leakage-safe chronological validation protocol.
The main contributions of this study to the literature are summarized as follows:
- A data-driven calibration approach for low-cost PM2.5 sensors was implemented using OM-based environmental covariates and sensor-side meteorological variables.
- The effects of meteorological variables, OM gaseous pollutants, and selected FE strategies on calibration performance were systematically evaluated using an ablation study approach.
- The performances of different ML models under various feature groups were comparatively analyzed.
- A more realistic performance evaluation framework for time-series-based PM2.5 calibration was established using a leakage-safe time-based validation approach.
The remainder of this paper is organized as follows: Section 2 presents the study area, data collection protocol, system architecture of the AQ-MultiCal platform, FE framework, experimental design, and the ML models used in the study. Section 3 presents the statistical characteristics of the dataset, model performances obtained under different experimental configurations, and detailed error analyses. Finally, Section 4 summarizes the main findings of the study, discusses the strengths and limitations of the proposed approach, and outlines potential directions for future work.
2. Materials and Methods
2.1. Study Area and Data Collection Protocol
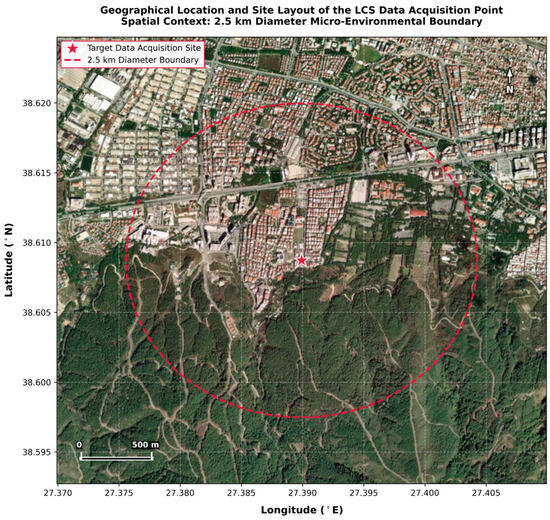
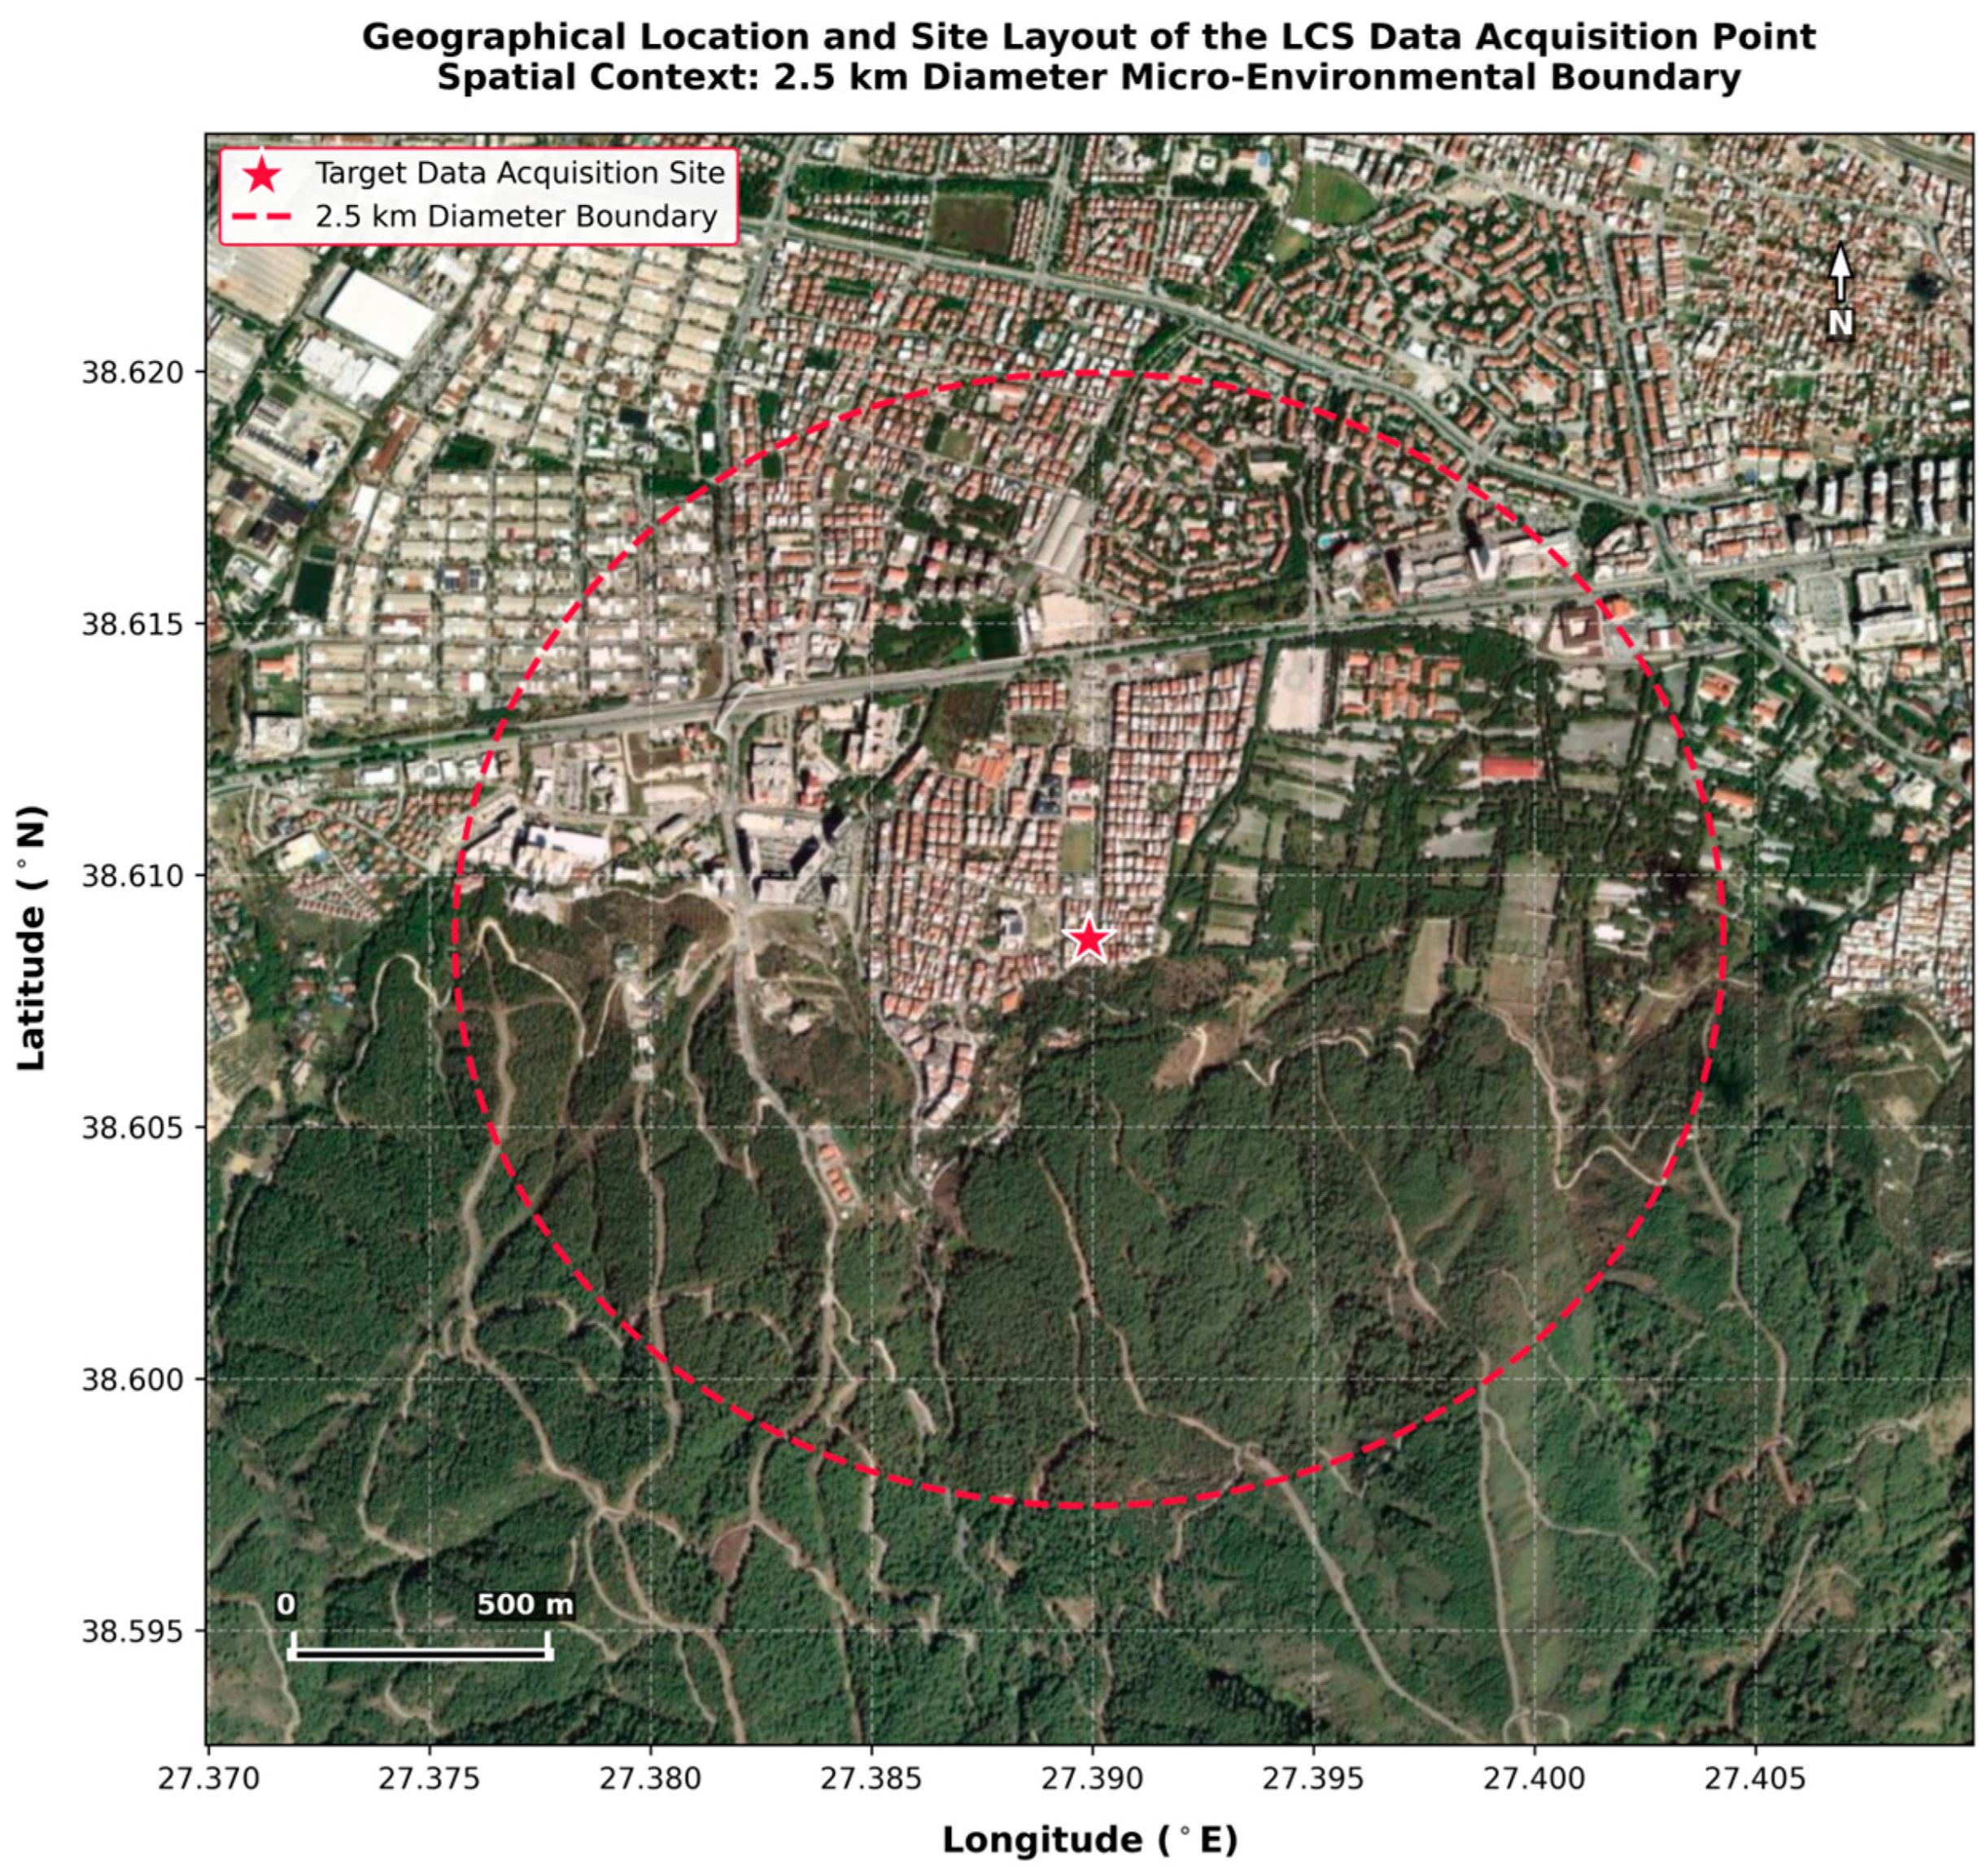
The experimental study was conducted in Yunusemre, Manisa, Türkiye, an urban residential area where the effects of anthropogenic activities on air quality can be observed. The measurement location shown in Figure 1 was strategically selected to evaluate the capability of the LCS system to represent household-level air quality exposure and the urban microclimate. The LCS system was installed in an open balcony environment at an approximate height of 3 m above ground level and positioned to avoid direct exposure to sunlight and precipitation while maintaining natural air circulation. This deployment configuration provided a suitable measurement environment for monitoring urban micro-scale air quality variations.
Figure 1.
Geographical location and site layout of the LCS data acquisition point (Yunusemre, Manisa, Turkey).
The calibration approach applied in this study was based on the combined use of the location-specific OM_PM2.5 proxy calibration target, meteorological variables, and auxiliary environmental data associated with the sensor location. In this context, the term calibration refers to a proxy-based data-driven alignment procedure rather than direct reference-grade ground-truth calibration. Accordingly, OM_PM2.5 was used as a location-specific proxy target to guide the correction of systematic deviations in LCS measurements. Although this approach does not eliminate the inherent uncertainties of OM estimates or replace co-located reference instrumentation, it provides a practical alternative for improving the consistency of low-cost sensor outputs with local PM2.5 patterns in settings where continuous reference co-location is not available.
Using the sensor coordinates as a reference, meteorological variables, including temperature, relative humidity, wind speed, atmospheric pressure, and dew point, as well as auxiliary gaseous pollutant data such as CO, NO2, SO2, and O3, were retrieved through the OM API service. All data were synchronized at hourly resolution using timestamps to construct an integrated dataset. The OM_PM2.5 variable was treated as a location-specific proxy calibration target rather than a direct reference-grade ground-truth measurement. The dataset was subsequently subjected to preprocessing procedures, including missing data handling, time synchronization, and data quality enhancement. In addition, physical boundary checks, missing data analyses, and temporal consistency controls were applied.
2.2. System Architecture and Calibration Framework
In this study, an adapted and optimized version of the AQ-MultiCal platform, previously introduced as a machine learning-based calibration and comparative model analysis framework for low-cost air quality sensors, was utilized for PM2.5 calibration analyses [19]. The platform has a flexible structure that can be applied to the analysis of different air quality parameters, including PM2.5. In the present study, this framework was extended with PM2.5-focused feature engineering structures, an experimental design evaluating the contributions of different environmental variable groups, and a chronological validation protocol.
The PM2.5 measurements used in this study were obtained from a Plantower PMS7003 particulate matter sensor. The PMS7003 is a low-cost, high-sensitivity optical PM sensor manufactured by Plantower (Beijing, China) and operates based on the laser light-scattering principle [34]. In this sensing mechanism, suspended particles passing through the optical chamber scatter the incident laser light, and the scattered light signal is processed to estimate particle number and mass concentration, including PM2.5. Therefore, the measurement uncertainty and sensor noise discussed in this study are mainly associated with optical scattering behavior, particle size distribution, particle optical properties, humidity-related particle growth, airflow stability, and internal signal processing, rather than a chemical sensing reaction.
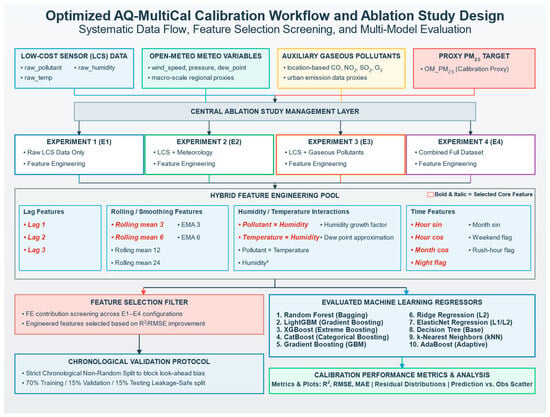
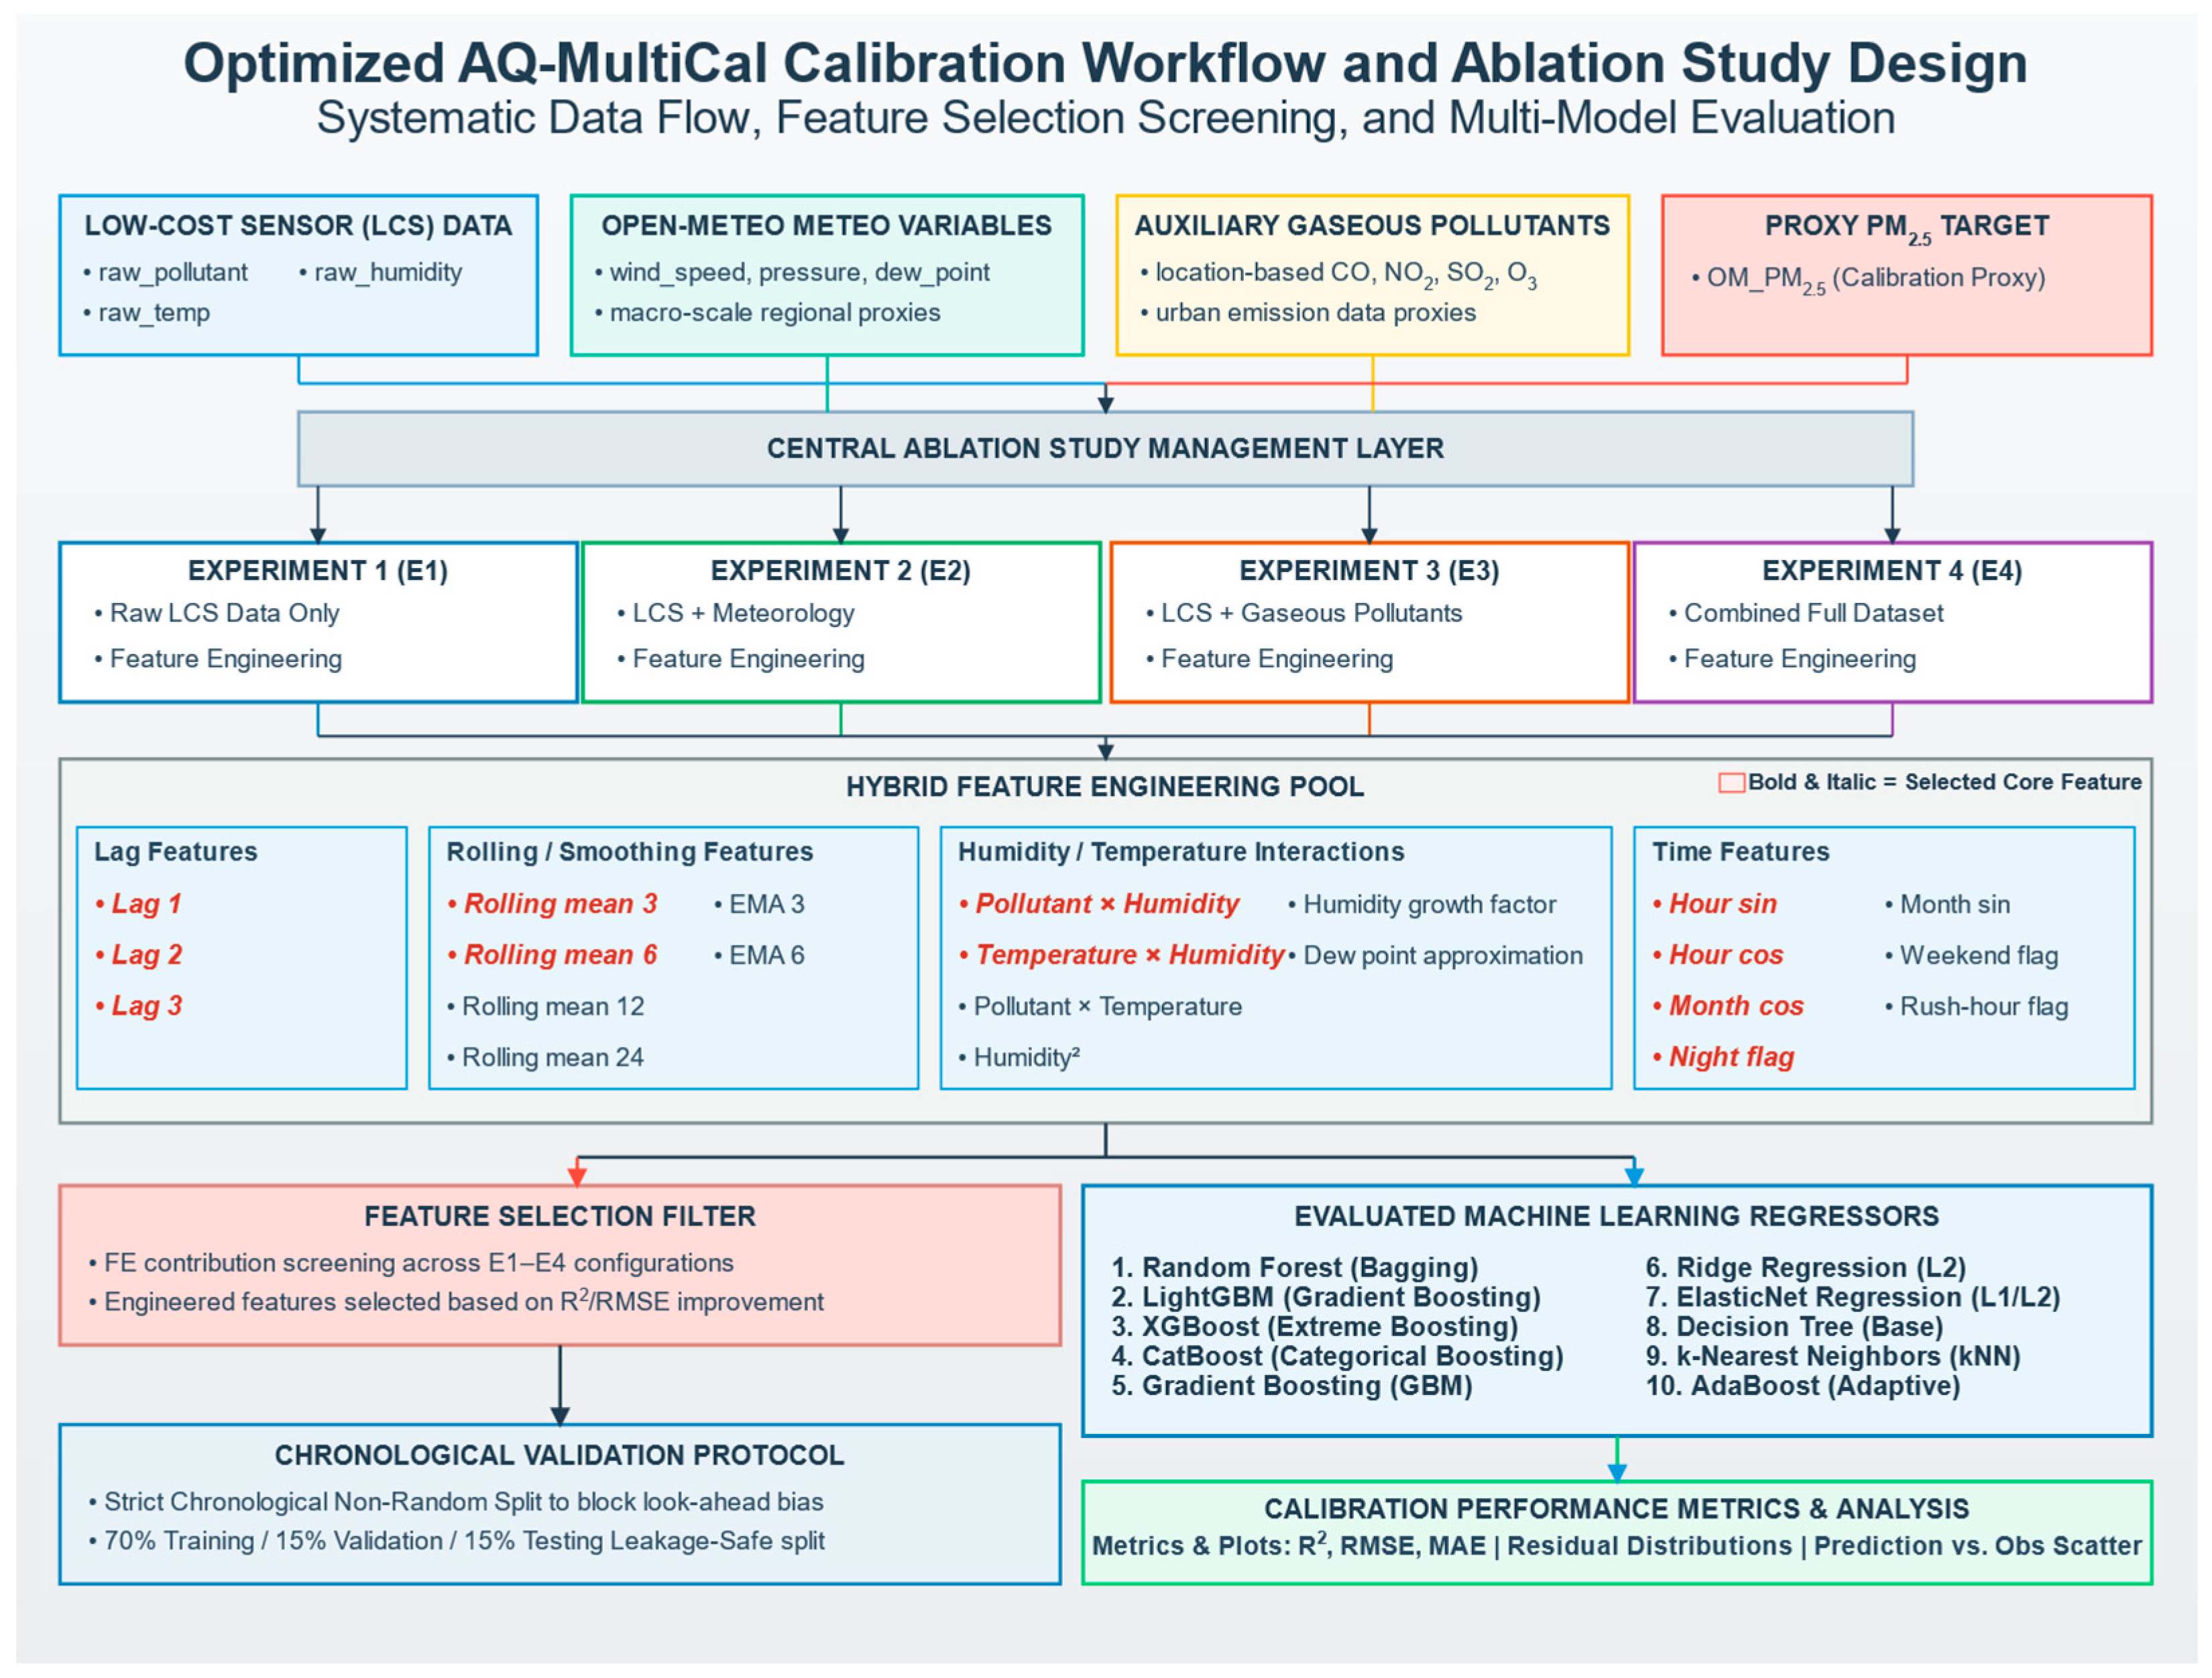
The platform was structured to enable the systematic and comparative analysis of low-cost PM2.5 sensor calibration processes. The experimental workflow presented in Figure 2 consists of data collection and preprocessing, FE, experimental configuration generation, ML-based modeling, and leakage-safe performance evaluation stages.
Figure 2.
Optimized calibration workflow and ablation study architecture of the proposed AQ-MultiCal platform.
The system architecture presented in Figure 2 integrates raw LCS data, OM-based environmental covariates, FE modules, experimental configuration structures, and ML models within a unified analytical workflow. The primary objective of the platform is to systematically investigate the effects of different environmental information groups and FE strategies on PM2.5 calibration performance.
During the data management stage, time-series data obtained from heterogeneous sources were integrated under a common temporal index. The platform simultaneously processes PM2.5 measurements acquired from the LCS unit together with location-specific meteorological variables and gaseous pollutant data obtained through OM. Since the OM environmental data were provided at hourly resolution, the raw sensor data originally recorded at 1 min resolution were resampled into hourly averages to ensure temporal synchronization. This process also contributed to reducing short-term sensor noise. In the preprocessing stage, additional procedures aimed at improving data quality were applied, including timestamp standardization, missing data control, physical boundary checks, and outlier removal.
The FE stage transforms the environmental and temporal dependencies of the sensor into more informative inputs that can be effectively learned by the model. Within this framework, lag-based features representing atmospheric continuity, rolling average structures smoothing short-term fluctuations, interaction terms representing non-linear relationships among environmental variables, and cyclic temporal encoding methods capturing daily and seasonal patterns were utilized. In addition, time-based flag variables representing nighttime conditions were included in the feature set. This hybrid feature structure contributes to a more effective representation of temporal and non-linear relationships among environmental variables within the model.
One of the key components of the AQ-MultiCal platform is the ablation study framework designed to analyze the contribution of different variable groups to calibration performance. Through this structure managed via a centralized feature selection pipeline, variable groups were isolated and evaluated under four different experimental configurations: the E1 configuration using only raw sensor data, the E2 configuration incorporating meteorological variables into the raw sensor data, the E3 configuration incorporating gaseous pollutant variables into the raw sensor data, and the E4 configuration combining all environmental variables. The same FE structure was preserved across all experimental configurations, enabling the comparative evaluation of the contributions of different environmental information groups to the model.
The modeling strategy was based on the comparative evaluation of 10 machine learning models representing linear, distance-based, tree-based, bagging, and boosting approaches, including Ridge, ElasticNet, Decision Tree, k-Nearest Neighbors, Random Forest, Gradient Boosting, AdaBoost, XGBoost, LightGBM, and CatBoost.
In the final stage, a leakage-safe time-based validation protocol was applied to prevent temporal data leakage. Unlike conventional random data splitting methods, the dataset was divided into training, validation, and test subsets according to chronological order. This approach prevented future observations from leaking into the training process and enabled a more reliable evaluation of model performance in terms of temporal generalization capability. Model performances were analyzed using R2, RMSE, and MAE metrics, together with residual analyses, prediction–observation comparisons, and feature importance evaluations.
2.3. Feature Engineering Framework
Raw LCS data contain systematic deviations caused by atmospheric conditions, short-term fluctuations, and nonlinear error structures. Therefore, within the AQ-MultiCal platform, raw sensor measurements were transformed into an extensive feature pool to enable the models to more effectively learn environmental and temporal relationships. To avoid unnecessary dimensionality and maximize model performance, a systematic feature selection process was performed on this feature pool. For this purpose, each engineered feature set was separately applied within the E1–E4 experimental configurations under the train–validation–test analysis protocol described in Section 2.4. The performance contribution of each feature set across the evaluated ML models was assessed by comparing the corresponding changes in R2 and RMSE values. Based on this comparative evaluation, the final set of 11 engineered features that provided the most consistent improvement in calibration performance was selected from the FE pool and incorporated into the final modeling framework. All engineered features used in this study were derived exclusively from the LCS-side data stream, including raw sensor measurements and their timestamps; OM variables were not used during feature construction.
Recent studies have confirmed that FE strategies such as lag-based features, rolling averages, and cyclic temporal encoding can improve the calibration performance of low-cost PM sensors [23,27,35].
Since air pollution data exhibit strong temporal dependency and autocorrelation, historical observations provide important information for modeling current PM2.5 behavior. Accordingly, lag1, lag2, and lag3 features were incorporated into the model. These variables represent PM2.5 measurements recorded 1, 2, and 3 h earlier, respectively. In addition, roll3 and roll6 rolling average features were generated to reduce the effects of short-term fluctuations and represent more stable atmospheric trends. These rolling features represent 3 h and 6 h moving window averages, contributing to a more balanced representation of temporal variability [23,35].
It is well known that the response of optical low-cost PM sensors to variations in relative humidity and temperature is non-linear [13,14]. In particular, under high-humidity conditions, particles may absorb water vapor and increase in size due to hygroscopic growth effects, leading to systematic deviations in sensor measurements. To more effectively represent these environmental effects within the model, pollutant_×_humidity, pollutant_×_temp, and temp_×_humidity interaction features were generated. These interaction terms contribute to the representation of non-linear relationships between PM2.5 measurements and environmental variables.
PM2.5 concentrations may exhibit periodic behavior due to traffic density, heating activities, and meteorological cycles. However, directly using time variables in numerical form may prevent the model from accurately capturing cyclic proximity, such as the temporal relationship between 23:00 and 00:00. Therefore, to preserve daily temporal cycles, hour_sin and hour_cos features were generated by applying sine–cosine transformations to the hour variable. Similarly, the month_cos feature was included in the feature set to represent seasonal variations. In addition, a night_flag variable was created to represent atmospheric behavioral differences during nighttime conditions. The cyclic temporal encoding approach contributes to the model’s ability to more effectively learn daily and seasonal periodic patterns.
2.4. Experimental Design and Performance Evaluation
In this study, a multi-stage experimental design was implemented to systematically investigate the effects of different environmental information groups on PM2.5 calibration performance. The experimental structure was based on the progressive incorporation of environmental information layers into raw sensor measurements. This approach enabled the additional explanatory contributions of meteorological variables and gaseous pollutant data to be evaluated in an isolated manner. Since air quality data contain strong temporal dependency, conventional random data splitting methods may lead to data leakage and cause model performance to appear unrealistically high [31,32,33].
To prevent this issue, the dataset was divided into training (70%), validation (15%), and test (15%) subsets using a chronological time-based split approach. This strategy enabled a more realistic evaluation of model performance while preserving temporal dependency. In addition, it prevented future observations from leaking into the training process, allowing model performance to be analyzed more reliably in terms of temporal generalization capability.
Within this framework, lag- and rolling-based features derived from historical observations were calculated only within the internal windows of their corresponding data subsets after the chronological time-based split procedure. Thus, any potential information leakage from the validation or test subsets into the training subset was strictly prevented.
To systematically evaluate the contributions of different environmental information groups to PM2.5 calibration performance, an ablation study approach was applied, and four different experimental configurations shown in Table 1 were established. The experimental structure was based on the progressive incorporation of environmental information layers into raw sensor measurements. The E1 configuration represented the baseline structure containing only raw LCS PM2.5 measurements. In the E2 configuration, meteorological variables were added to the raw sensor data, whereas the E3 configuration evaluated the contribution of gaseous pollutant variables to the model. The E4 configuration represented the combined environmental information structure in which both meteorological variables and gaseous pollutants were simultaneously incorporated. The same FE structure was preserved across all experimental configurations, ensuring that performance variations originated directly from the environmental information groups.
Table 1.
Experimental Framework Summary.
This experimental structure enabled the hierarchical evaluation of the contributions provided by different environmental information sources to the model. In addition, the OM_ PM2.5 variable was treated solely as the target variable across all experimental configurations and was not included as an input feature in the model to prevent any potential data leakage.
Model performances were evaluated using statistical error metrics widely adopted in the literature. The coefficient of determination (R2) was used to assess the model’s ability to explain variance within the dataset. The RMSE metric evaluated the overall magnitude of prediction errors by assigning greater penalties to larger deviations. The MAE metric measured the average magnitude of absolute errors, while the MAPE metric enabled percentage-based analysis of relative error behavior across different concentration levels.
2.5. Machine Learning Models
In this study, various linear and non-linear ML models were employed to comparatively evaluate low-cost PM2.5 sensor calibration performance under different environmental information groups and FE structures. The analysis included Ridge, DT, kNN, RF, GB, AdaBoost, XGB, LGBM, ENet, and CatBoost models. The primary objective of model diversity was to systematically investigate behavioral differences in the capability of different algorithms to represent environmental and temporal relationships.
During the model selection process, the strong temporal dependency structure of the dataset, multicollinearity effects, and the non-linear nature of PM2.5 behavior were taken into consideration. During the preliminary evaluation stage, LR, Lasso Regression, and Ridge showed similar performance trends within the linear model family; therefore, Ridge was selected to represent this model family in the final comparative analyses.
Since the relationships between PM2.5 concentrations and environmental variables exhibit highly non-linear characteristics, ensemble-based algorithms constituted one of the main components of the study [18,19,20,21,22]. The RF model was evaluated due to its ability to reduce variance and limit overfitting through the bagging approach. Boosting-based models, including GB, AdaBoost, XGB, LGBM, and CatBoost, were incorporated into the analysis because of their capability to learn complex environmental patterns, maintain stable performance under high-dimensional feature structures, and represent non-linear variable interactions. In addition, DT and kNN models were used to comparatively evaluate their ability to represent local PM2.5 patterns occurring under temporally similar environmental conditions.
Since the primary focus of the study was to investigate the effects of different environmental information groups and FE structures on calibration performance rather than hyperparameter optimization, no additional hyperparameter optimization was applied. All models were trained using their default library hyperparameter settings, and the same settings were consistently applied across all E1–E4 experimental configurations. The default hyperparameter settings used for the evaluated models are provided in Supplementary Table S5.
3. Results and Discussion
In this section, the performance of the proposed AQ-MultiCal platform for low-cost PM2.5 sensor calibration was comprehensively evaluated. First, the temporal and statistical characteristics of the dataset were examined, followed by a comparative analysis of model performances obtained under different experimental configurations. Within the scope of the ablation study approach, the contributions of environmental information groups to calibration performance were systematically evaluated, and the effects of FE structures on model behavior were investigated. During the experimental analyses, the contributions of meteorological variables and gaseous pollutant data under different model structures were comparatively assessed, and the effects of environmental information layers on performance were hierarchically evaluated. In addition, the capabilities of linear and ensemble-based ML models to represent temporally dependent PM2.5 behavior were comparatively analyzed. In the final stage, residual distributions, prediction–observation agreement, and feature importance analyses were performed for the best-performing models to investigate model behaviors in detail. Thus, not only performance metrics but also the capabilities of the models to represent environmental relationships and their generalization behavior were comprehensively evaluated.
3.1. Statistical Characteristics of the Dataset
The dataset used in this study was constructed by temporally synchronizing raw low-cost PM2.5 sensor measurements with OM-based meteorological and environmental variables associated with the sensor location. The dataset was subjected to a preprocessing procedure in which missing records were removed and high-frequency sensor measurements were resampled into hourly averages. This approach reduced the influence of short-term sensor fluctuations while contributing to the representation of more stable temporal patterns in PM2.5 behavior.
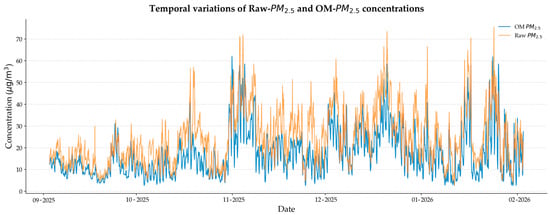
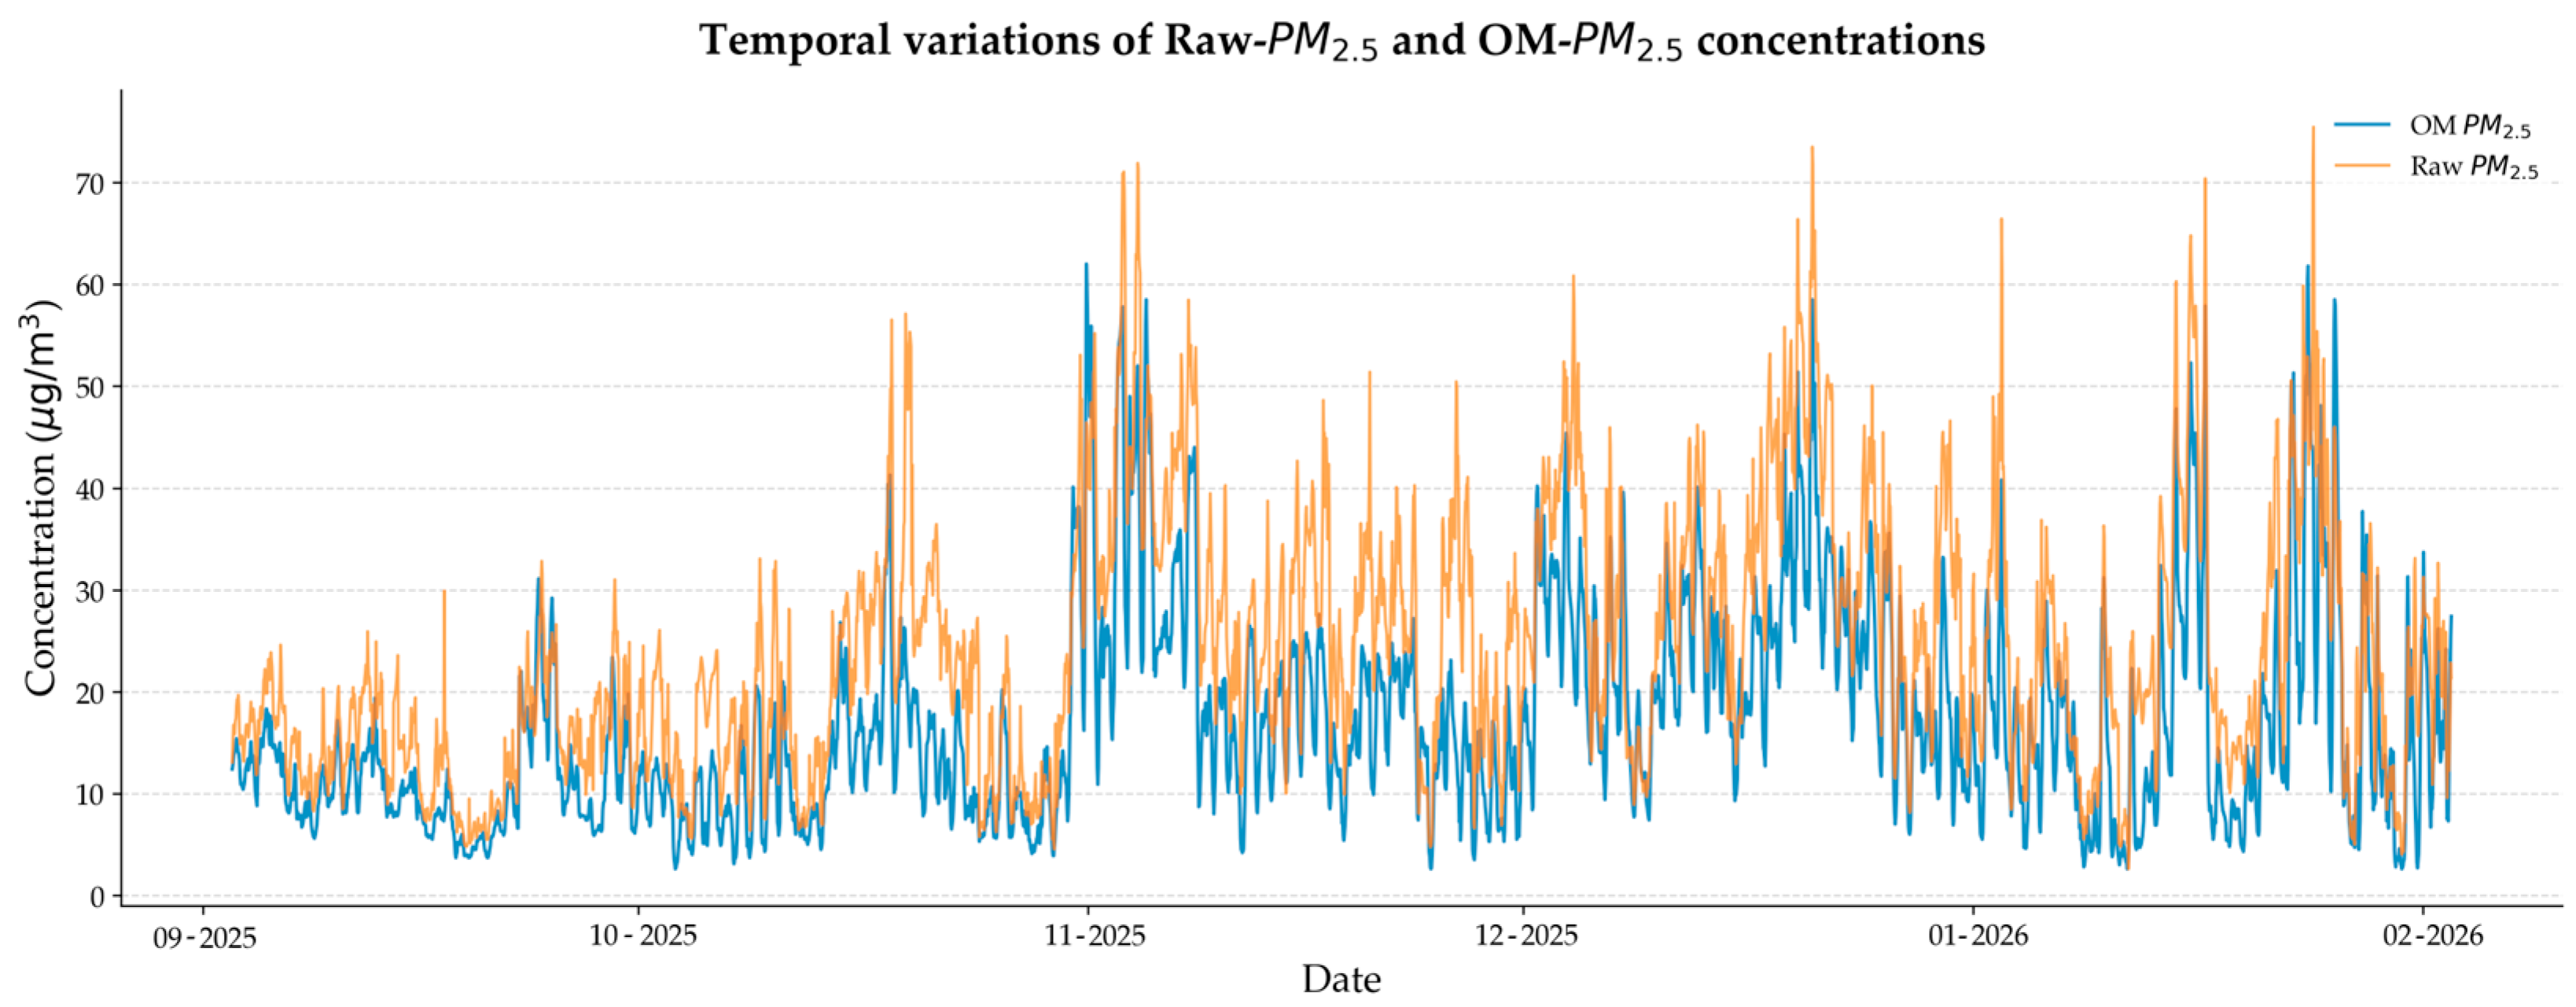
Figure 3 comparatively presents the temporal behavior of the raw LCS measurements and the OM_PM2.5 target variable. Examination of the time series indicates that both data sources exhibit similar overall trends, although short-term high-concentration peaks and abrupt fluctuations are observed during certain periods. More pronounced increases in PM2.5 levels are particularly evident during the autumn and winter seasons. This observation supports the influence of environmental factors such as traffic density, local emission sources, and atmospheric conditions on PM2.5 behavior. In addition, the high variability observed in the time series indicates that the PM2.5 calibration problem exhibits a non-linear and temporally dependent structure.
Figure 3.
Time-series profile comparing Raw_PM2.5 signals and OM_PM2.5 estimates.
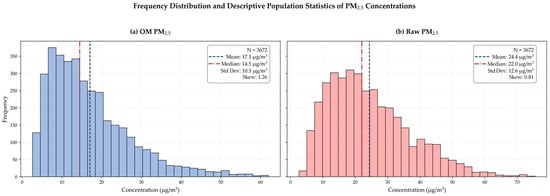
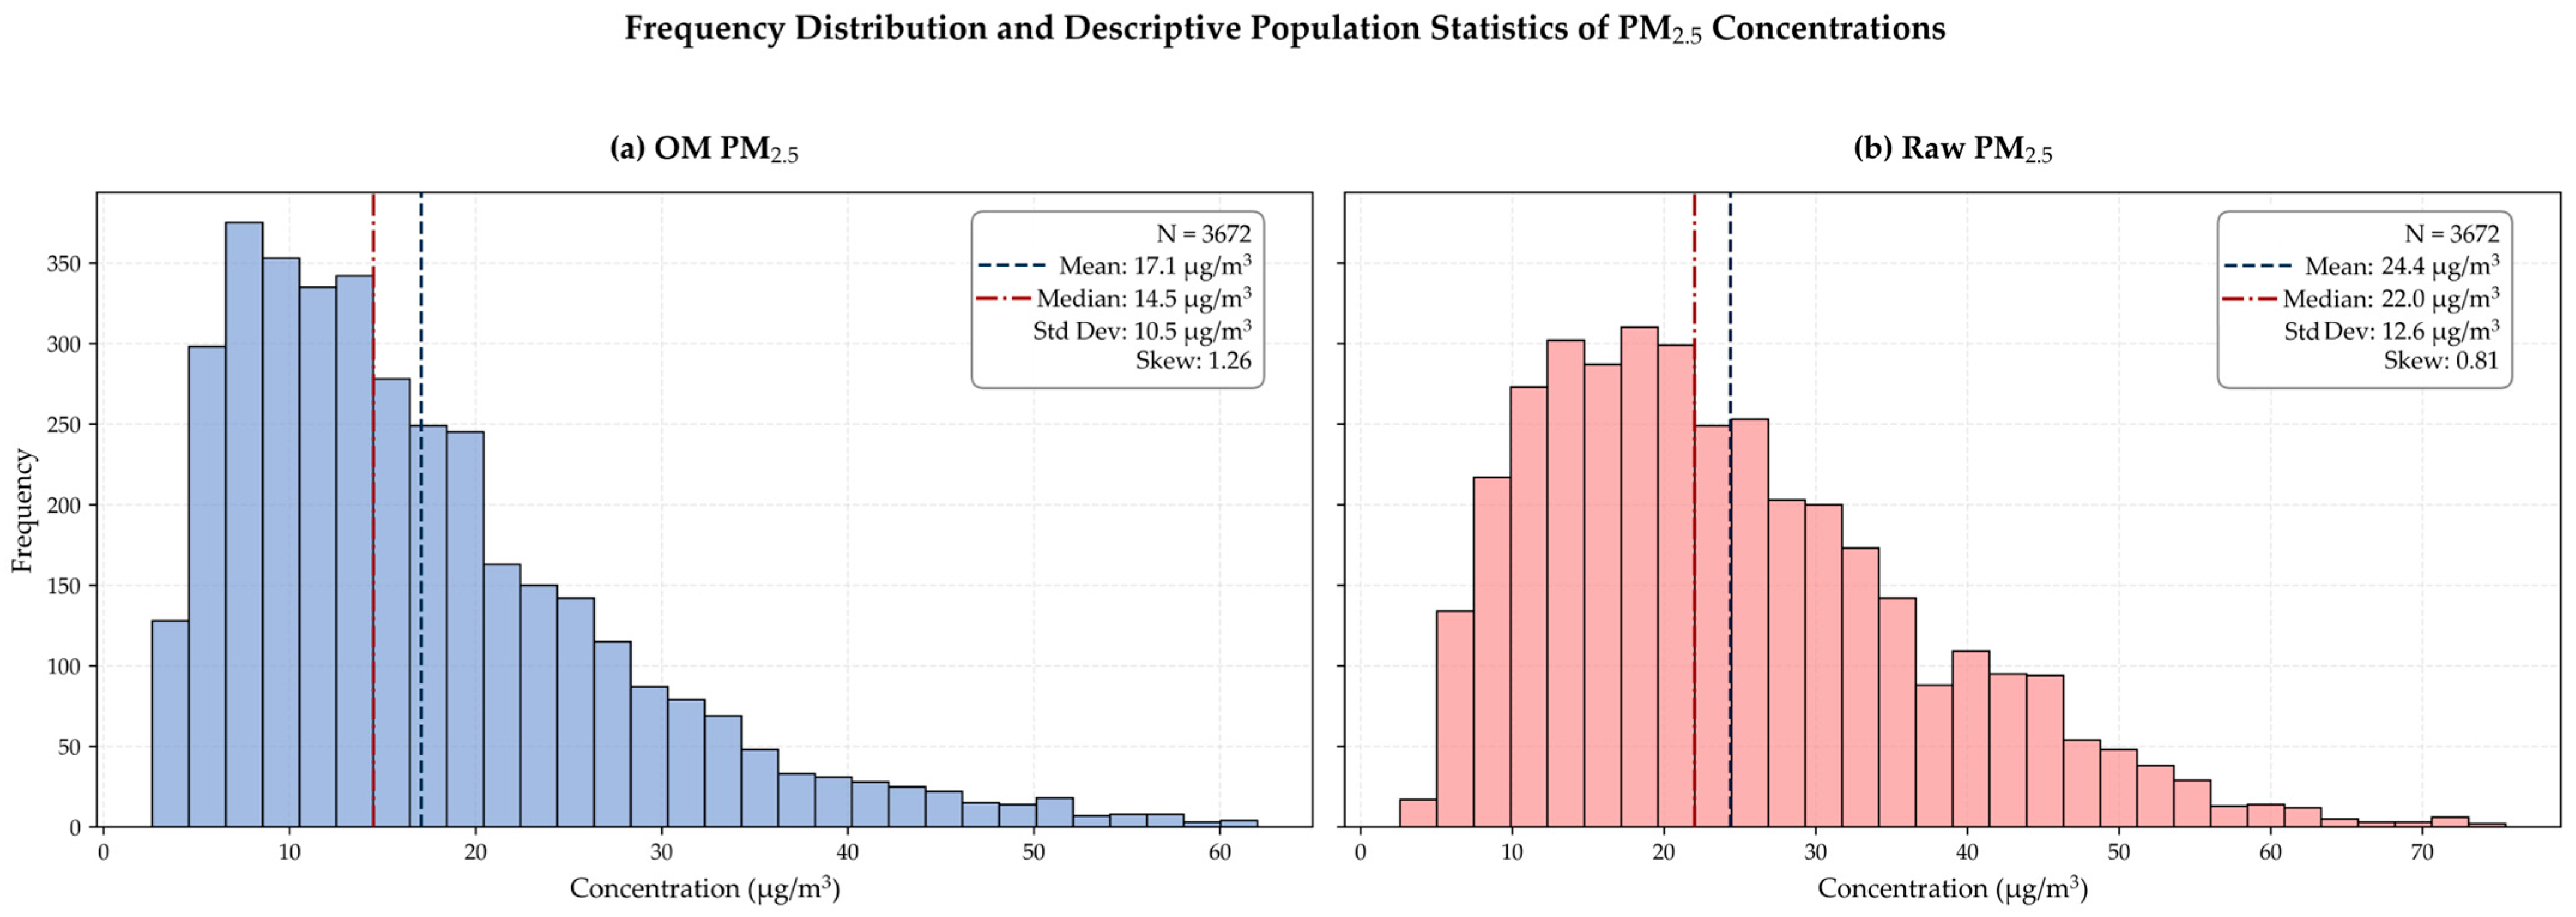
Figure 4 presents the frequency distributions of the OM_PM2.5 target variable and the raw LCS PM2.5 measurements. Examination of the histograms indicates that neither distribution follows a perfectly normal pattern and that both exhibit right-skewed behavior at higher concentration ranges. The raw LCS measurements particularly display a wider distribution under elevated concentration conditions. This observation suggests that LCS measurements may respond more sensitively to short-term environmental changes and atmospheric conditions. The observed non-linear distribution structure further supports the importance of ensemble-based models and FE strategies within the calibration process.
Figure 4.
Frequency distribution of PM2.5 concentrations: (a) OM_PM2.5 estimates, and (b) Raw_PM2.5 responses.
Table 2 presents the main statistical summary characteristics of the dataset. Examination of the mean, standard deviation, and maximum values indicates that PM2.5 concentrations exhibit a wide range of variability. The higher variance observed in the raw LCS PM2.5 measurements compared to the OM_PM2.5 variable used as the proxy calibration target suggests that sensor measurements are more strongly affected by environmental conditions and short-term atmospheric fluctuations. In addition, the table also presents the experimental configurations in which different variable groups were utilized, enabling the systematic evaluation of the contributions of environmental information layers to model performance within the scope of the ablation study.
Table 2.
Statistical summary and variable categorization of PM2.5 and environmental variables used in the study.
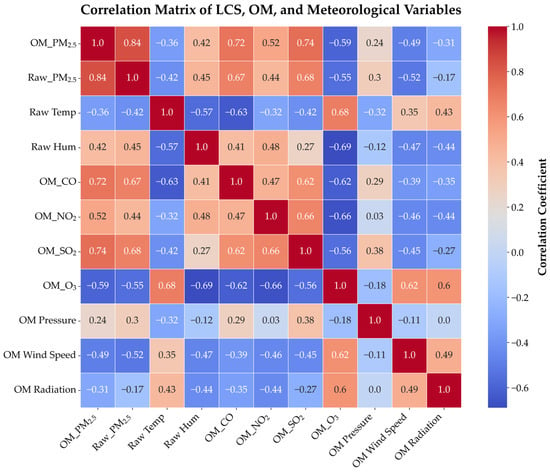
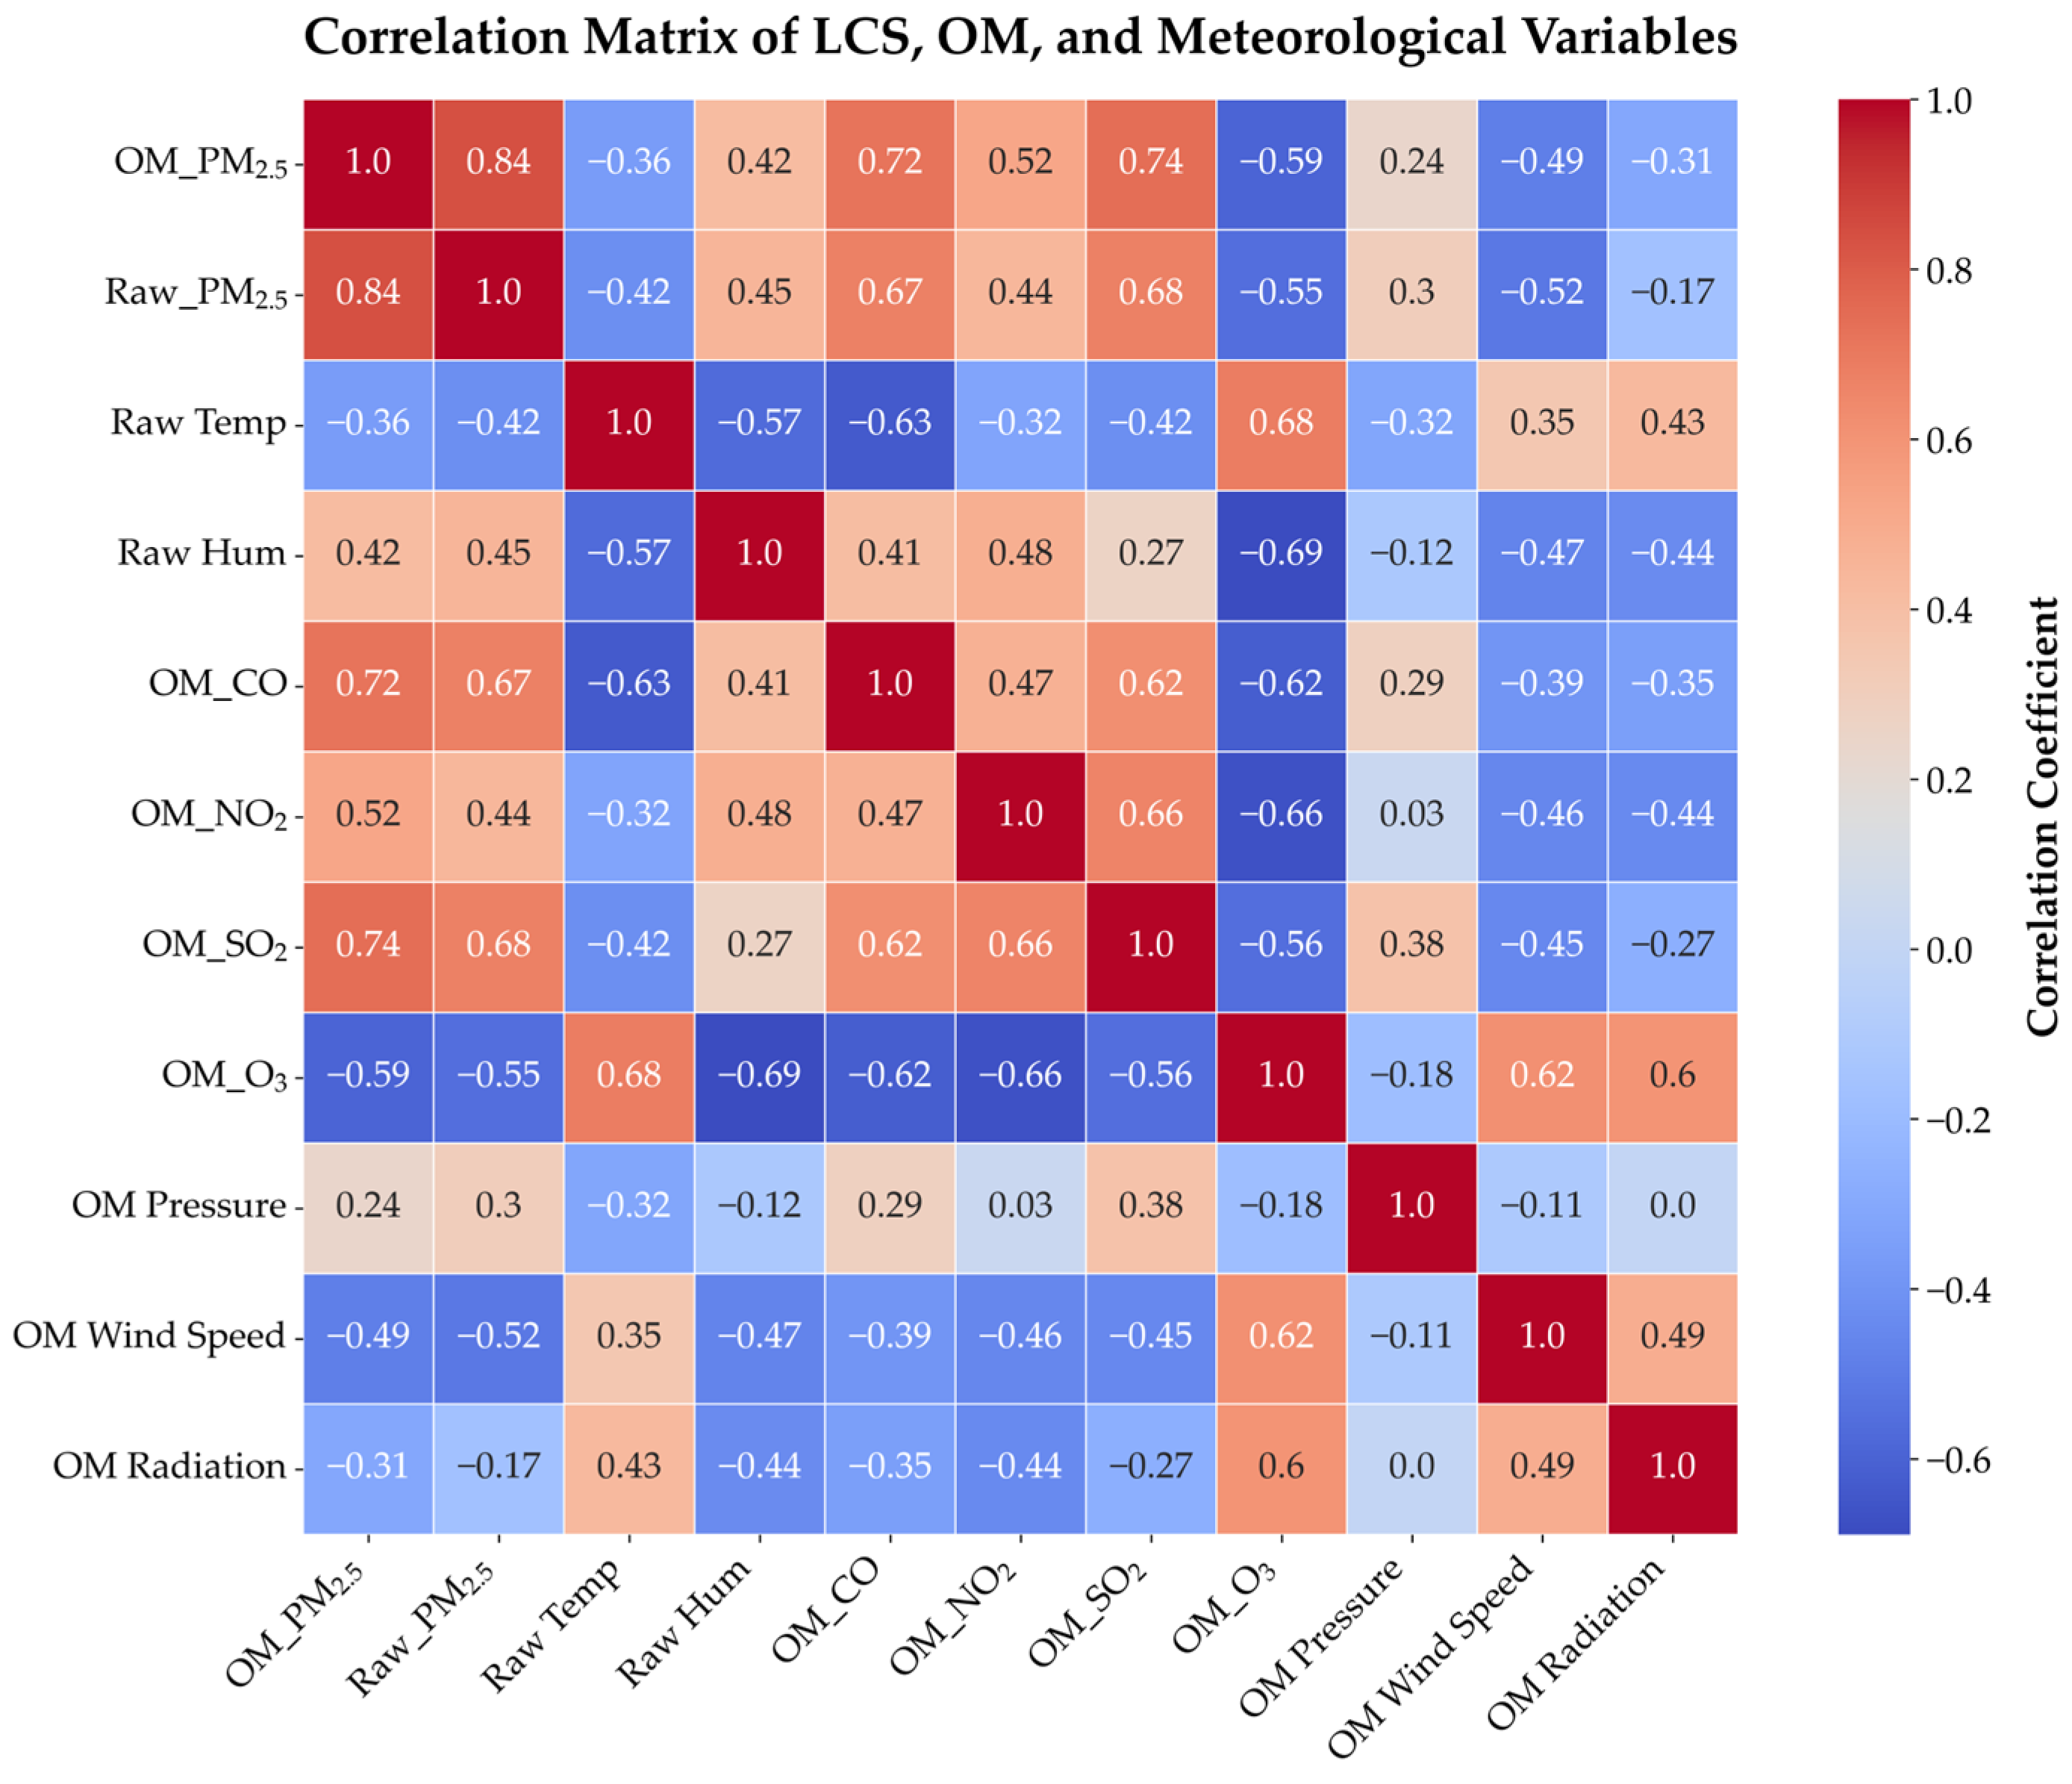
Figure 5 presents the Pearson correlation coefficients among the variables. Examination of the correlation analysis indicates that the OM_PM2.5 variable exhibits strong positive relationships, particularly with OM_CO and OM_SO2. In contrast, a negative correlation was observed with the OM_O3 variable. Among the meteorological variables, some parameters, such as temperature and wind speed, showed negative relationships with PM2.5 levels. The strong positive correlation between the raw LCS measurements and the OM_PM2.5 target variable indicates that the raw sensor data contain meaningful information for calibration purposes. Overall, the correlation structure demonstrates that PM2.5 behavior involves multidimensional relationships with both meteorological conditions and gaseous pollutant variables.
Figure 5.
Pearson correlation matrix between LCS measurements, OM data, and meteorological parameters.
3.2. Comparative Calibration Performance Across Experimental Configurations
In this section, the effects of different environmental information groups and the developed FE structures on PM2.5 calibration performance were comparatively evaluated. Within the scope of the experimental analyses, model performances obtained under the E1–E4 configurations were systematically examined, and the capabilities of different ML models to represent environmental and temporal relationships were compared. Detailed numerical performance metrics for all experimental scenarios are summarized in Table 3. The complete model-specific performance results for each experimental configuration are provided in Supplementary Tables S1–S4.
Table 3.
Comparative calibration performance across experimental configurations before and after FE.
Overall examination of the results presented in Table 3 indicates that, under the baseline models without FE, the highest performance was achieved by the linear Ridge model in the E4 configuration, where all environmental information groups were simultaneously incorporated (Test R2 = 0.7664, RMSE = 6.40 µg/m3). However, after integrating the proposed FE strategies into the models, substantial performance improvements were observed across all experimental configurations and all tested algorithms. This finding suggests that, rather than the diversity of data sources alone, high-quality time-series and interaction features derived from raw data play a decisive role in calibration performance.
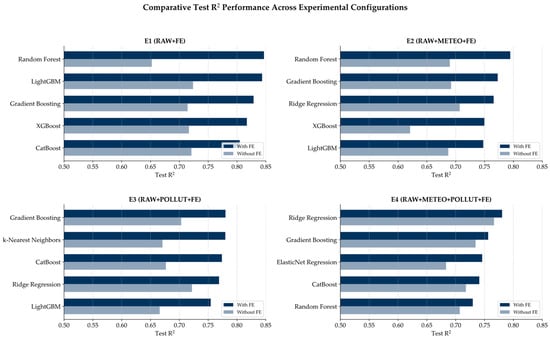
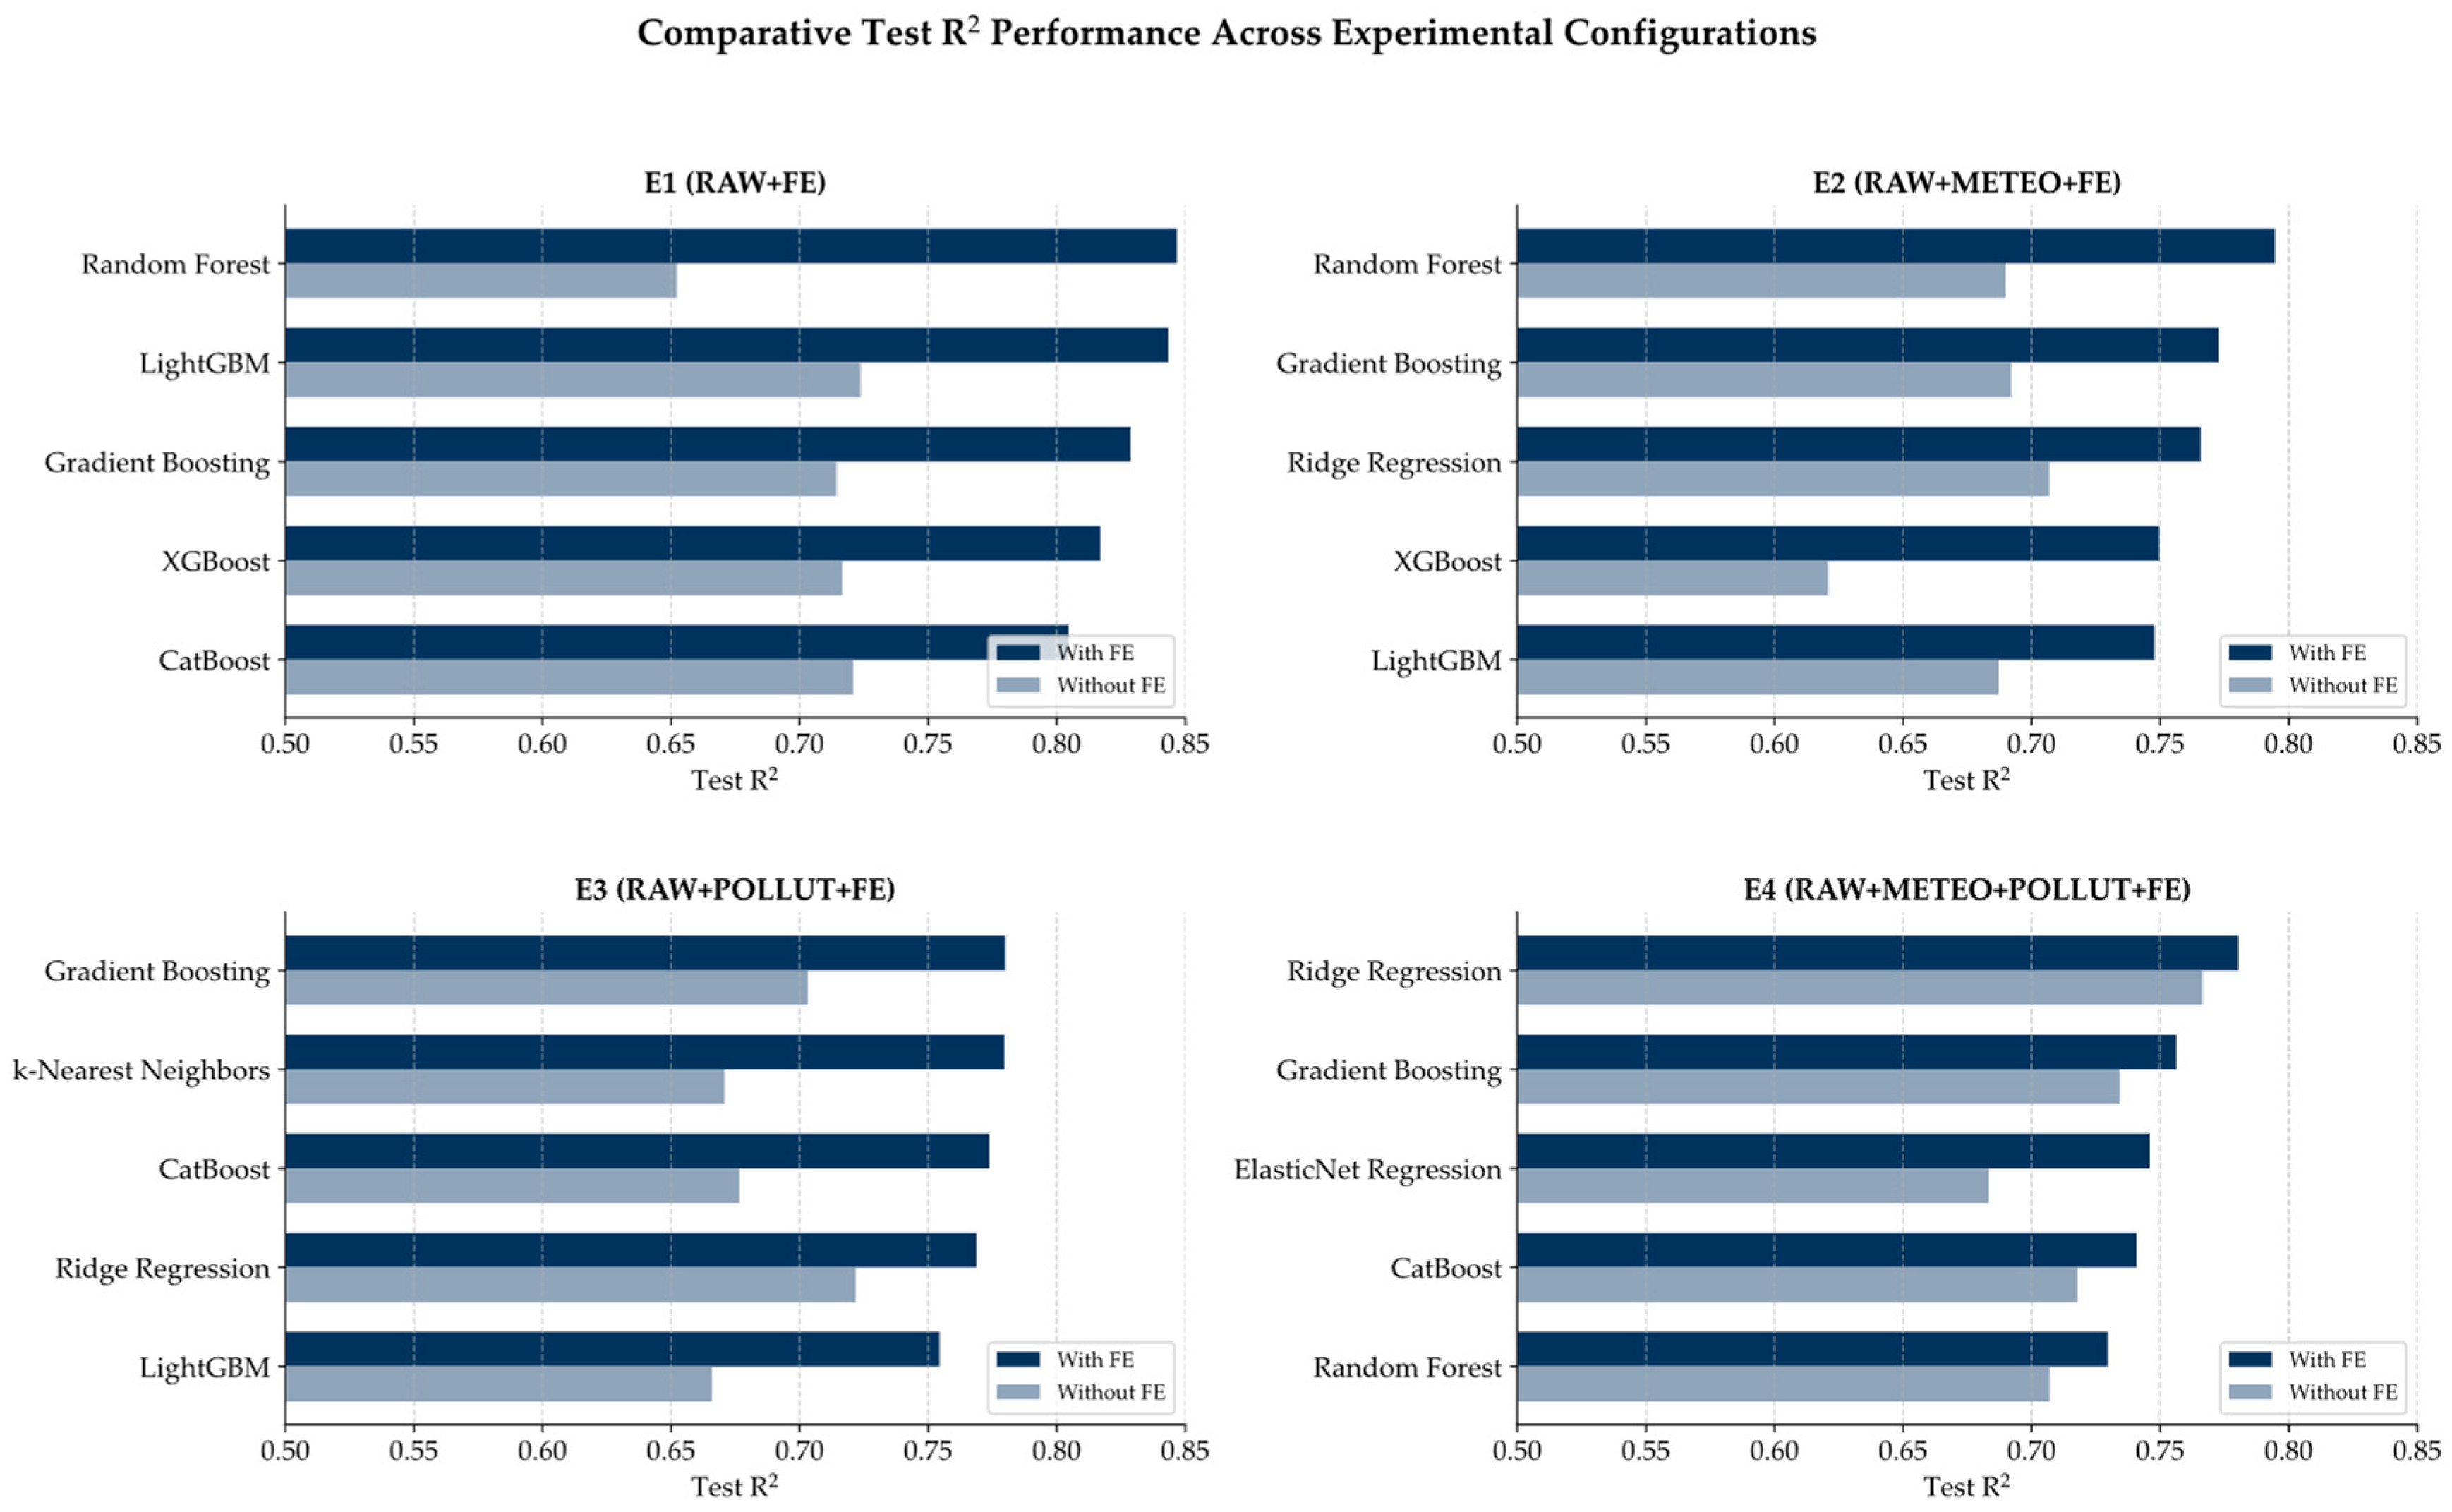
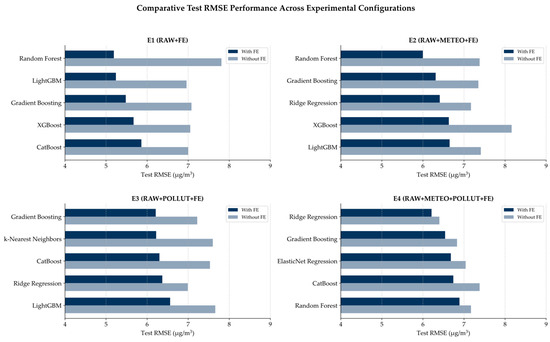
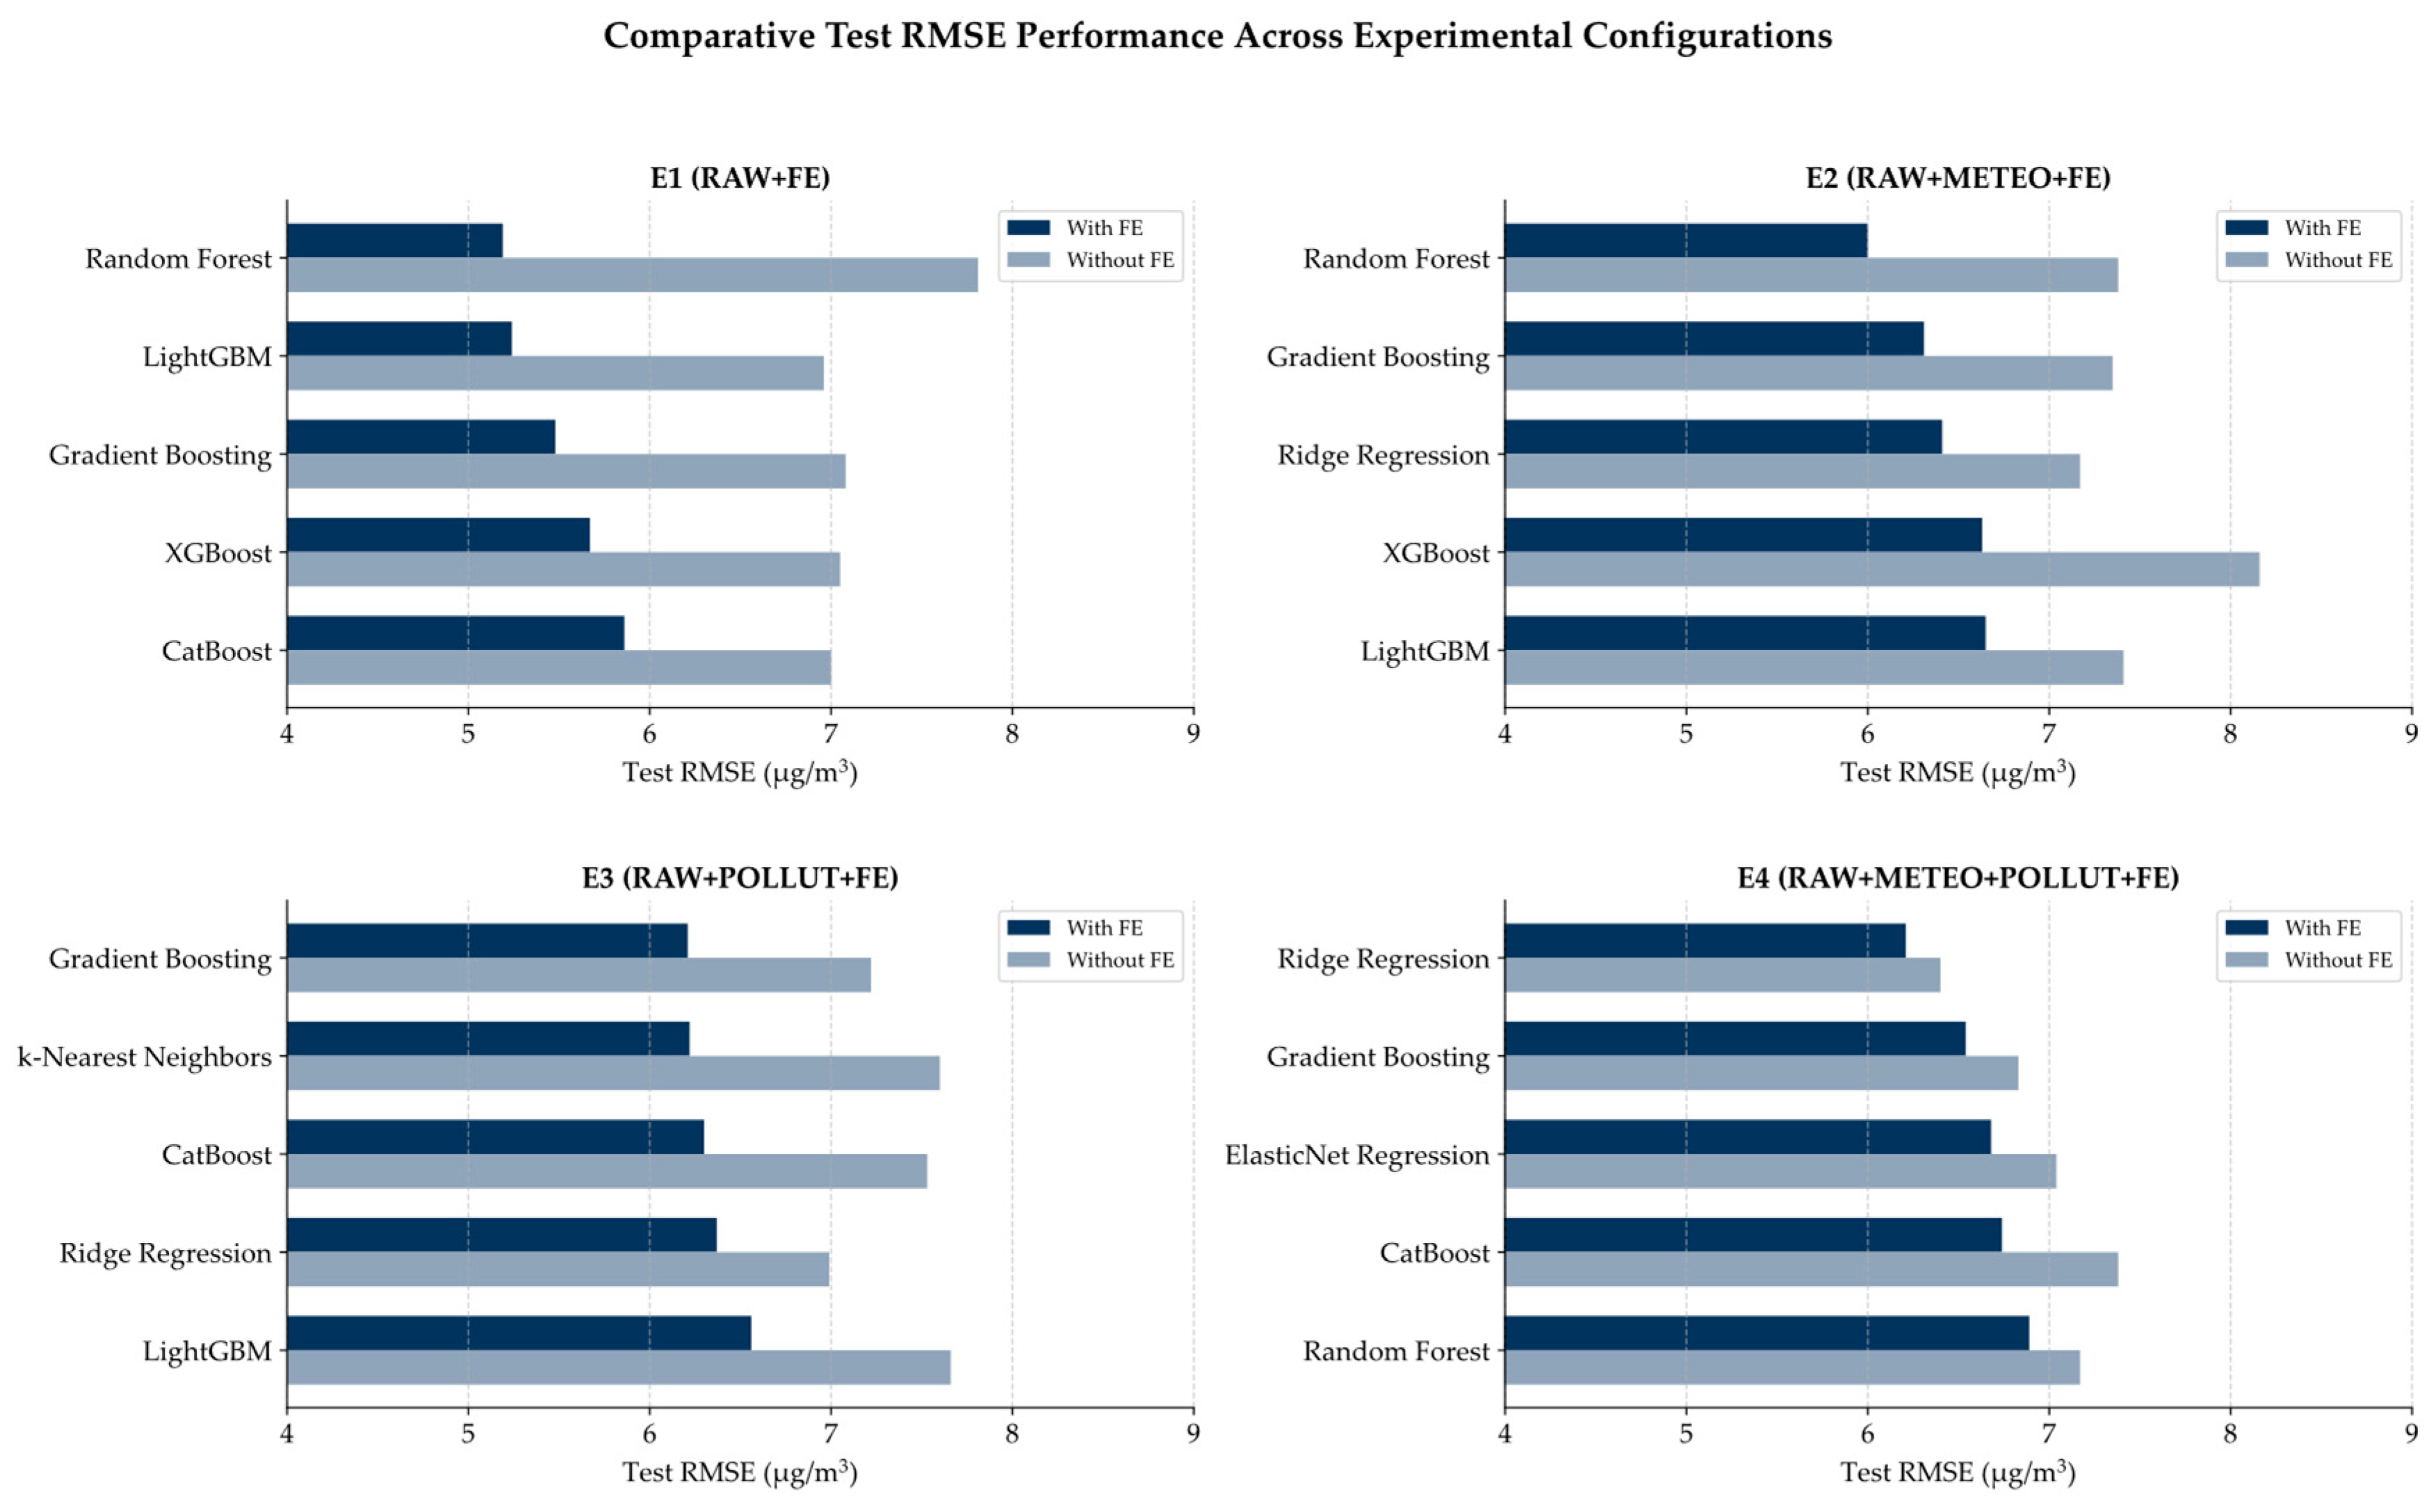
To visually analyze these hierarchical performance changes and the model behaviors before and after FE integration, the distributions of Test R2 and Test RMSE are presented separately in Figure 6 and Figure 7, respectively.
Figure 6.
Comparative calibration performance of machine learning models across experimental configurations under baseline and FE conditions (Test R2 scores).
Figure 7.
Comparative calibration performance of machine learning models across experimental configurations under baseline and FE conditions (Test RMSE values).
Figure 6 and Figure 7 comparatively present the Test R2 scores and Test RMSE values obtained under different experimental configurations, respectively. Detailed examination of both figures clearly demonstrates that the FE structures substantially improved model performance across all experimental configurations. In particular, lag-based features, rolling averages, interaction terms, and cyclic temporal encoding methods played significant roles in transferring temporal continuity and environmental relationship patterns to the models.
Under the E1 configuration, where only raw sensor data were utilized, LGBM achieved the best performance in the baseline scenario (Test R2 = 0.7237, RMSE = 6.96 µg/m3). However, following the integration of FE strategies, the RF model outperformed all other models, increasing the Test R2 value to 0.8467 while reducing the RMSE to 5.19 µg/m3. This important finding demonstrates that carefully designed FE strategies can provide substantial explanatory power and variance management capability using only raw sensor measurements without requiring any external data sources.
Examination of the E2 configuration, in which meteorological variables were incorporated into the system, revealed noticeable improvements in model performance following the application of FE. However, one of the important findings of the study is that the highest performance achieved under the E2 configuration (RF: Test R2 = 0.7946, RMSE = 6.00 µg/m3) remained below the performance obtained in the purely sensor-based E1 configuration. The primary reason for this outcome is that the meteorological variables used in the study were obtained from OM as macro-scale, regionally simulated environmental data. When physical factors occurring at the sensor’s micro-environmental location (residential balcony), such as sudden thermal fluctuations or localized wind-shadowing effects, could not be fully represented by macro-scale meteorological estimates, these discrepancies propagated into the model as noise and partially limited the overall generalization performance of the ensemble-based models.
Under the E3 configuration, in which external gaseous pollutant variables (e.g., CO and NO2) were incorporated, the FE-enhanced GB model achieved the best performance (Test R2 = 0.7800, RMSE = 6.21 µg/m3), while ensemble-based models generally clustered within a narrower and more stable performance range. This observation confirms that PM2.5 formation, retention, and urban transport processes are strongly influenced by shared emission sources associated with gaseous pollutants, such as traffic-related emissions and urban residential heating activities.
In the E4 configuration, representing the most complex scenario in which all environmental information groups (sensor measurements, meteorological variables, and gaseous pollutants) were simultaneously incorporated, the Ridge model achieved the best performance both in the baseline scenario (Test R2 = 0.7664) and after the integration of FE strategies (Test R2 = 0.7804), indicating a distinctive statistical behavior. Since the E4 configuration involved a large number of heterogeneous variables, this stage exhibited the highest feature-space dimensionality and the greatest risk of linear dependency among variables (multicollinearity). Within such a complex, dense, and high-variance feature space, powerful non-linear ensemble models such as RF and XGB became more sensitive to high-dimensional noise, leading to partial performance degradation on the test set. In contrast, the linear Ridge model, which incorporates L2 regularization within its structure, successfully suppressed noise by mathematically shrinking the coefficient weights of redundant and highly correlated variables, thereby providing the most robust test performance.
Overall, the results indicate that ensemble- and boosting-based tree models (RF, GB, and LGBM) were more effective in capturing complex non-linear relationships, whereas the linear Ridge model demonstrated superior capability in regularizing high-dimensional noisy data. Consequently, it became evident that increasing the amount of environmental information or the number of variables does not necessarily guarantee the highest calibration performance in every scenario. This finding suggests that the success of PM2.5 calibration depends not only on raw data volume or input diversity, but also directly on the quality and relevance of the feature structure provided to the model, as well as the selection of an appropriate algorithm for the target problem.
3.3. Prediction Consistency and Residual Analysis
In this section, the prediction behavior and error characteristics of the RF model, which produced one of the best calibration results, were examined in detail. Within the scope of the analyses, the model’s prediction–observation agreement, residual behavior, and temporal tracking performance were evaluated. Thus, not only the performance metrics but also the model’s ability to represent PM2.5 behavior and its generalization characteristics were analyzed.
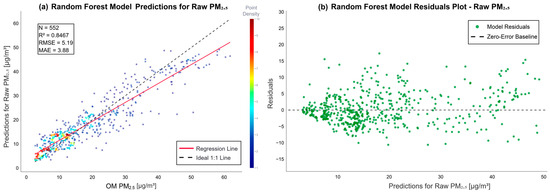
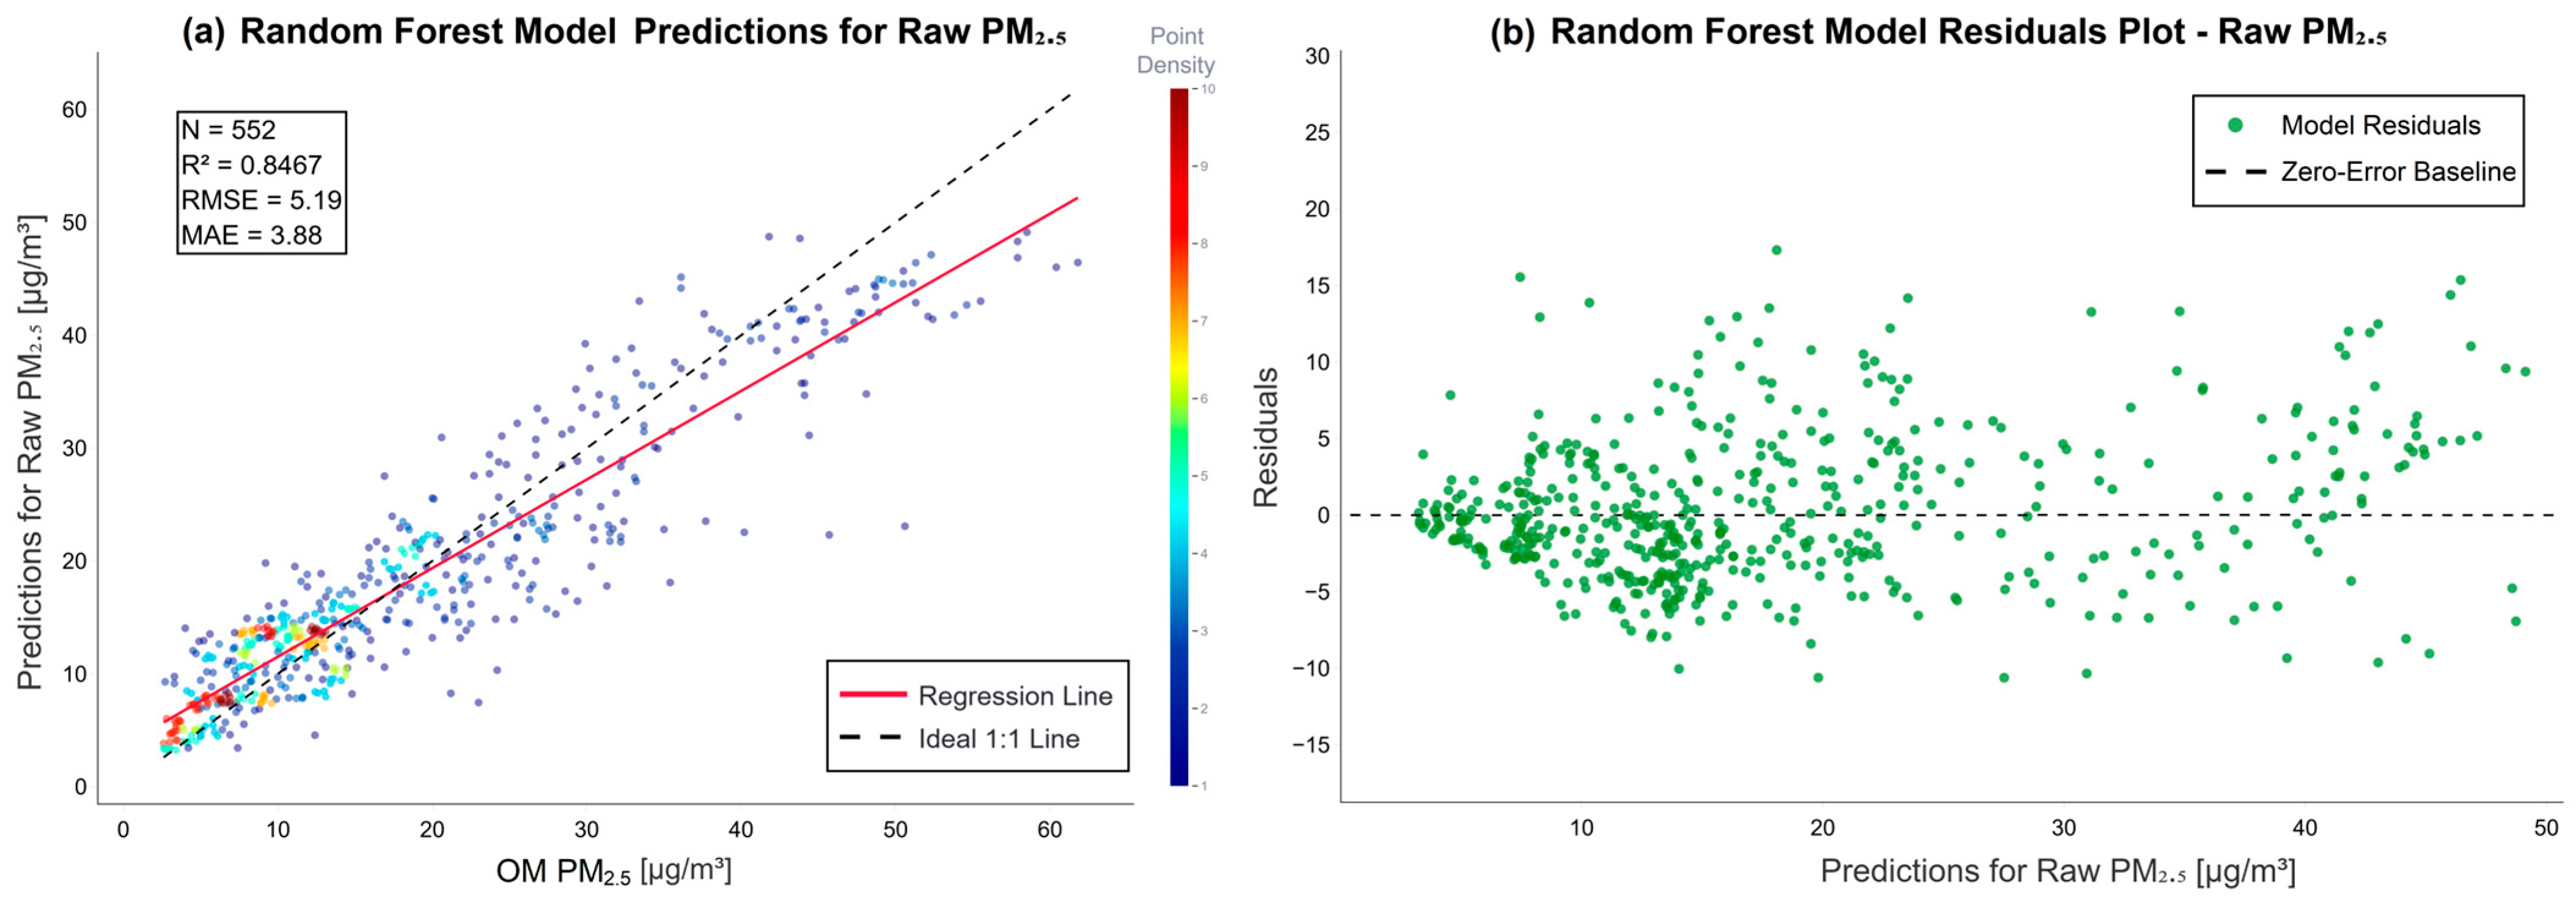
Figure 8 presents the prediction–observation relationship and residual behavior of the RF model developed under the E1 configuration. Examination of Figure 8a indicates that the predicted values are densely concentrated around the ideal 1:1 line, demonstrating strong agreement across a wide range of PM2.5 concentrations. The model performance metrics (R2 = 0.8467, RMSE = 5.19 µg/m3, and MAE = 3.88 µg/m3) demonstrate that the RF approach supported by FE strategies can effectively model PM2.5 behavior. In particular, the denser clustering of observations around the regression line within low and moderate concentration ranges indicates that the model exhibits more stable prediction behavior under these conditions. In contrast, the tendency of predictions to remain below the ideal line at higher PM2.5 concentrations suggests that the model may exhibit partial underestimation behavior during extreme concentration events. This behavior may reflect the increasing complexity of PM2.5 dynamics during high-concentration events influenced by short-term emissions and changing atmospheric conditions.
Figure 8.
Prediction performance and residual behavior of the RF model under the E1 configuration: (a) prediction-observation relationship and (b) residual distribution pattern.
The residual distribution presented in Figure 8b reveals the systematic structure of model errors across different prediction levels. The concentration of most residual values around the zero line supports that the model generally exhibits balanced error behavior. In addition, the absence of pronounced linear patterns in the residual distribution indicates that the model does not produce substantial concentration-dependent bias. Nevertheless, an increase in residual variance at higher prediction levels is noticeable. This behavior is consistent with the heteroscedastic structure frequently observed in air quality time-series data and may be related to the increasing complexity of atmospheric processes during high PM2.5 periods. In particular, the simultaneous effects of traffic density, local emission sources, and meteorological variability may complicate the modeling of short-term PM2.5 behavior under elevated concentration conditions. Despite this, the overall residual structure demonstrates that FE strategies reduce short-term sensor noise and contribute to more balanced and generalizable prediction behavior.
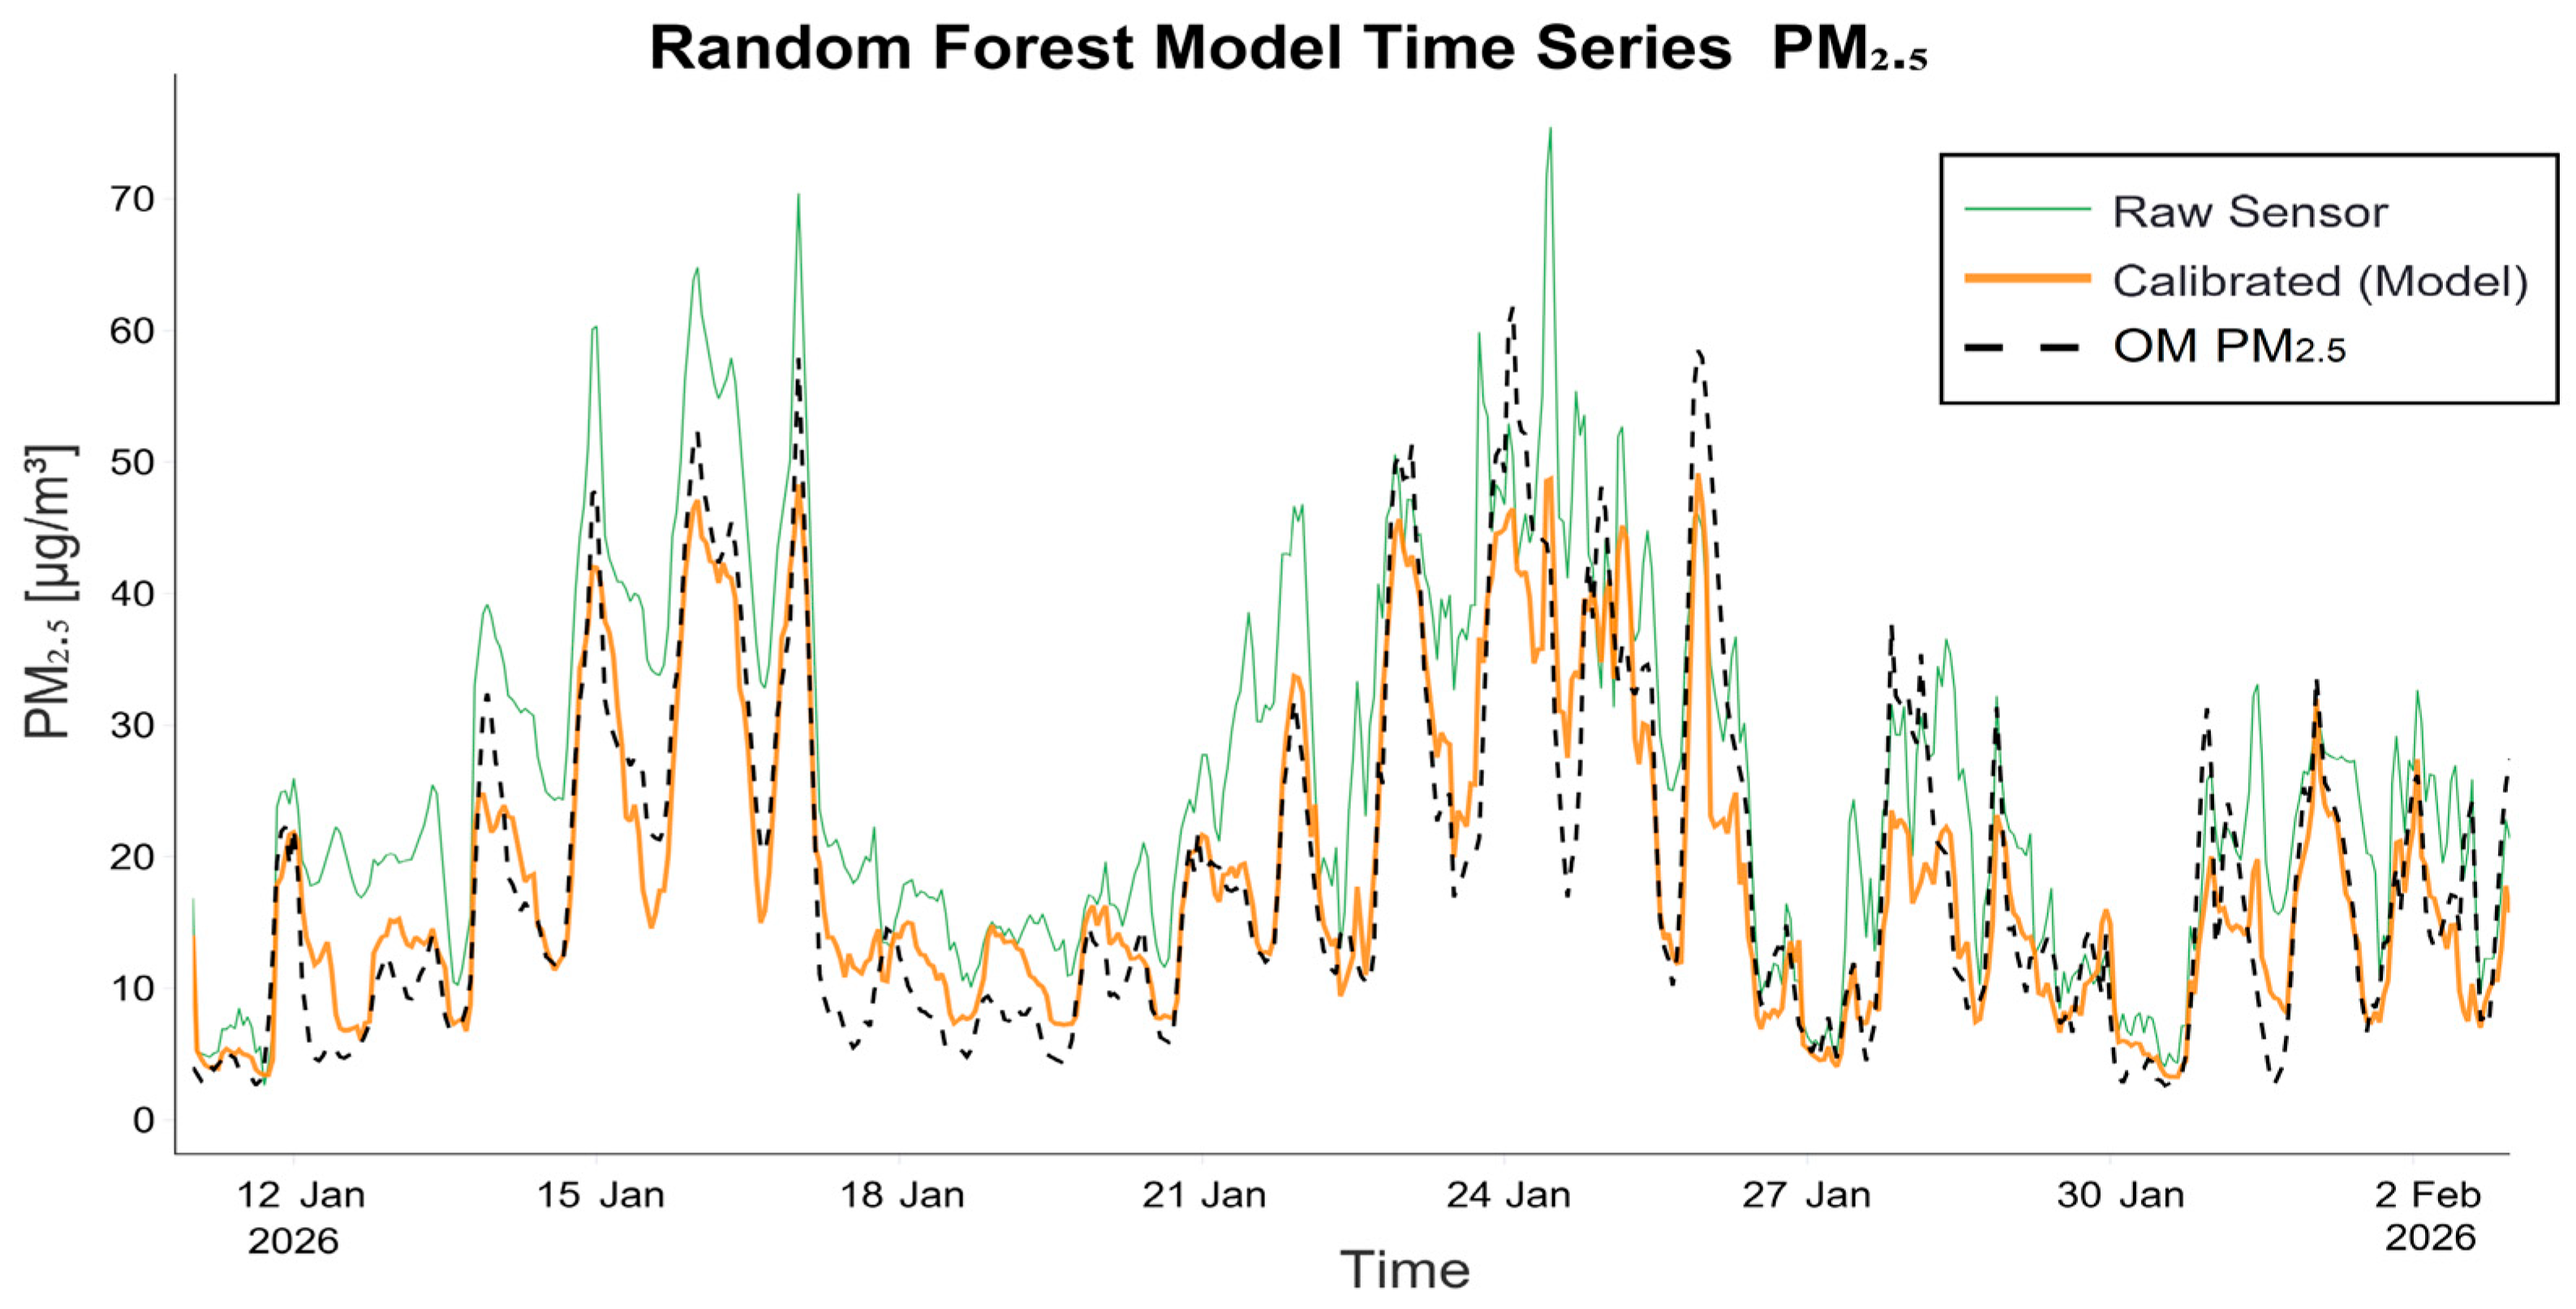
Figure 9 presents the temporal behavior of the raw sensor measurements, the calibrated PM2.5 predictions generated by the model, and the OM_PM2.5 target variable. The raw sensor measurements exhibit high-amplitude short-term fluctuations and abrupt peak behaviors during certain periods. In contrast, the calibrated model outputs follow the overall atmospheric trend in a more stable and balanced manner.
Figure 9.
Temporal comparison between raw sensor measurements, calibrated model predictions, and OM_PM2.5 target values.
The substantial reduction in short-term sensor-induced fluctuations by the model indicates that the FE strategies effectively transferred temporal continuity information into the learning process. Lag-based features and rolling average structures may have contributed to the model’s ability to consider not only instantaneous sensor behavior but also historical PM2.5 patterns. As a result, the calibrated outputs exhibit a more stable and physically consistent temporal behavior compared to the raw sensor measurements. Nevertheless, some high-intensity short-term peaks appear to be partially smoothed by the model. This behavior may be associated with the tendency of ensemble-based models to represent extreme short-term events more conservatively while optimizing overall trends. In particular, sudden emission changes and complex atmospheric processes during high-concentration periods may complicate the modeling of short-term PM2.5 dynamics. Despite this limitation, the model predictions successfully follow the general trend of the OM_ PM2.5 target variable over extended temporal intervals.
Overall, Figure 9 confirms that the proposed approach can effectively model the non-linear temporal patterns of PM2.5 behavior. The results further demonstrate that FE strategies improve not only performance metrics but also model stability and temporal generalization capability.
3.4. Feature Contribution and Environmental Interpretation
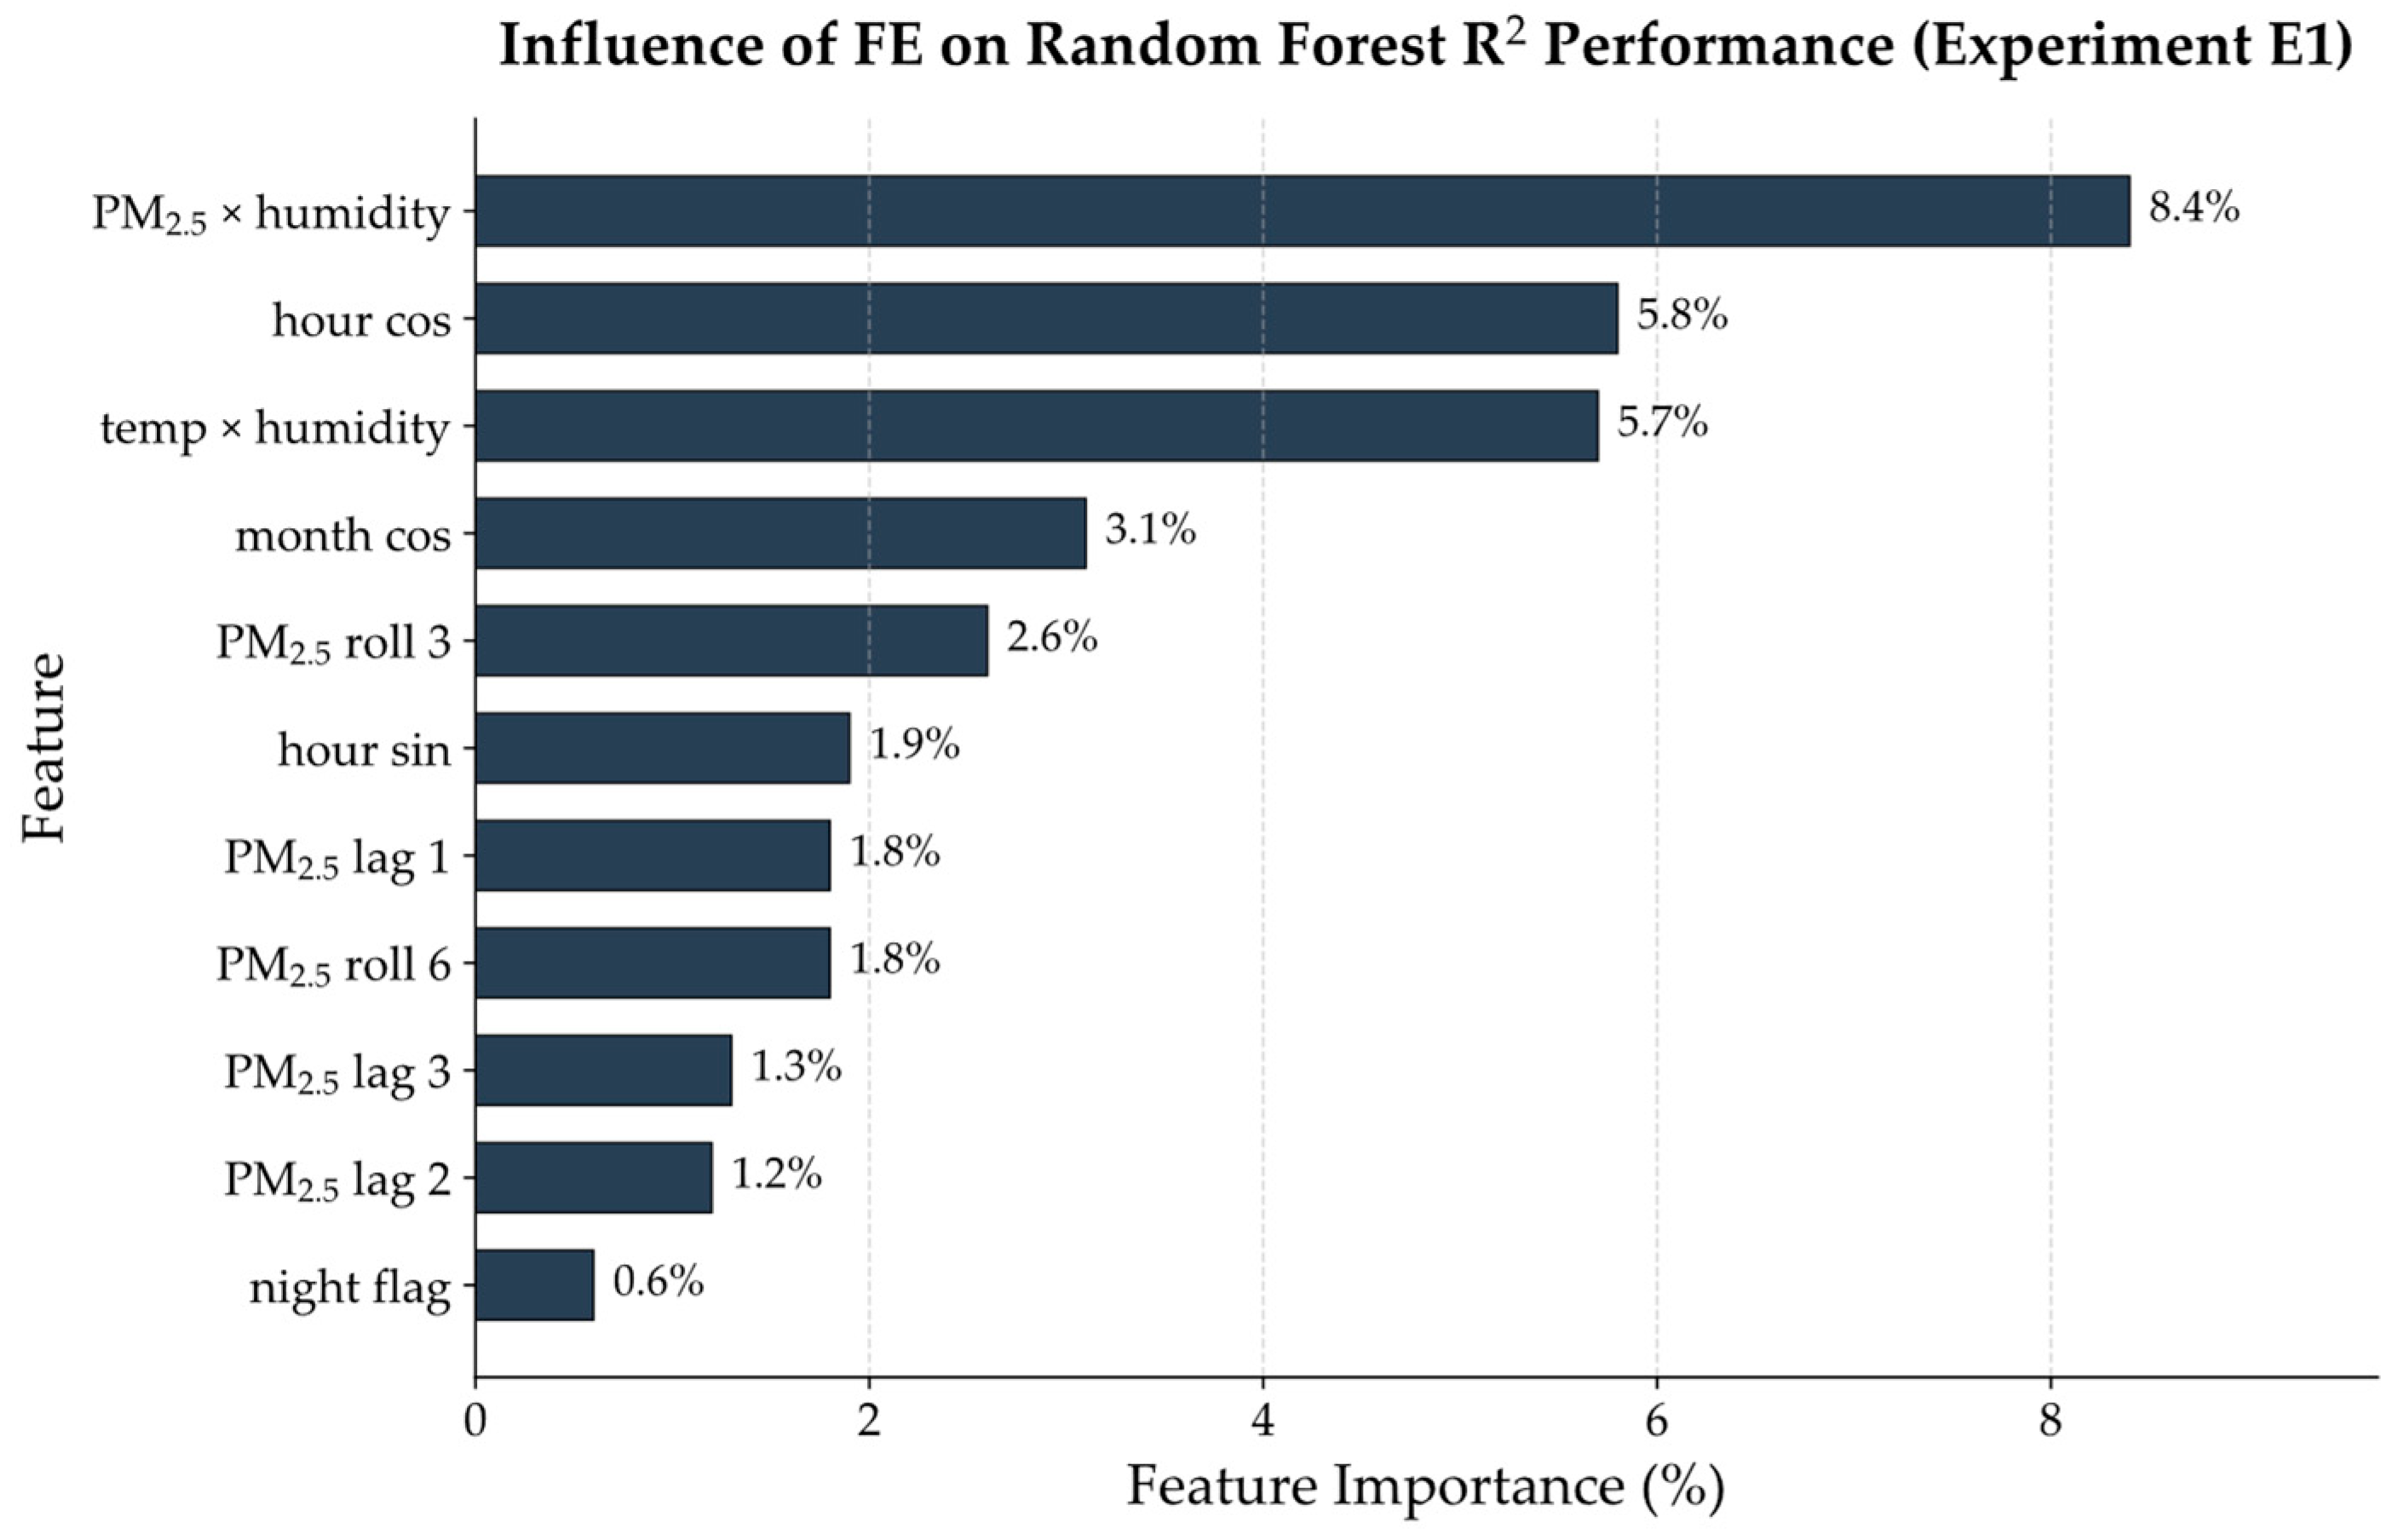
In this section, the feature importance results of the RF model developed under the E1 configuration were examined to evaluate the contributions of the FE structures to PM2.5 calibration performance. The relative contribution distributions presented in Figure 10 quantitatively demonstrate the relative effects of different feature groups on model behavior.
Figure 10.
Relative feature importance distribution of FE variables under the E1 configuration.
Examination of Figure 10 indicates that the highest relative contribution value belongs to the PM2.5 × humidity feature (8.4%). This value is approximately 45% higher than that of the second-ranked feature, hour_cos (5.8%). In addition, the contribution provided solely by the PM2.5 × humidity feature exceeds the combined contribution values of lag1 (1.8%), lag2 (1.2%), and lag3 (1.3%). This finding suggests that non-linear environmental effects associated with relative humidity can provide stronger explanatory contributions than short-term temporal dependencies. Considering the influence of hygroscopic growth mechanisms on the behavior of low-cost optical PM sensors, the high contribution of humidity-based interaction features represents an atmospherically consistent result.
Similarly, the temp × humidity feature exhibited a contribution of 5.7%, which is notably close to that of the hour_cos feature. This observation indicates that the combined atmospheric effects of temperature and relative humidity play a significant role in modeling PM2.5 behavior. Furthermore, except for the roll3 feature (2.6%), the contribution value of the temp × humidity feature exceeded those of all lag- and rolling-based features, demonstrating that environmental interaction-based FE strategies can provide stronger explanatory information to the model.
Examination of the cyclic temporal encoding structures indicates that the hour_cos feature, with a contribution value of 5.8%, provided approximately three times the contribution of the hour_sin feature (1.9%). This finding suggests that the daily patterns of PM2.5 behavior may exhibit asymmetric temporal structures. In particular, daily environmental processes such as traffic density, human activities, and atmospheric boundary layer variations may become more dominant during specific time intervals, thereby increasing the explanatory contribution of the hour_cos feature. Similarly, the month_cos feature exhibited a contribution of 3.1%, indicating that seasonal atmospheric variability exerts meaningful effects on model behavior.
Among the rolling average-based features, the roll3 feature demonstrated a contribution value of 2.6%, exceeding the contribution of all lag-based features. In particular, the contribution of roll3 was approximately twice as high as that of lag1 (1.8%) and lag2 (1.2%). This result suggests that short-term atmospheric continuity can be represented more effectively through smoothed temporal patterns rather than isolated historical observations. In contrast, the relatively lower contributions of the lag-based features may be associated with the fact that the current PM2.5 measurement itself already contains strong explanatory information.
The similar contribution values observed for hour_sin (1.9%) and roll6 (1.8%) indicate that both daily temporal cycles and medium-scale temporal continuity contribute to model behavior. In contrast, the night_flag feature exhibited only a 0.6% contribution, suggesting that the day–night distinction alone provides relatively limited explanatory information for PM2.5 behavior. This finding further supports that PM2.5 variability is shaped primarily by multiple environmental interactions and temporal continuity mechanisms rather than simple categorical distinctions.
Overall, the feature importance distributions presented in Figure 10 demonstrate that the FE strategies provided substantial additional explanatory contributions to the model, particularly through environmental interaction terms and cyclic temporal encoding structures. In particular, the substantially higher contributions of humidity-based interaction features compared to conventional lag-based structures indicate that non-linear environmental effects play a critical role in PM2.5 calibration. Furthermore, the higher contributions of rolling average-based features relative to lag-based structures suggest that short-term atmospheric continuity can be represented more effectively through smoothed temporal patterns.
3.5. Study Limitations and Practical Implications
Although the analysis approach proposed in this study produced successful results for the data-driven calibration of low-cost PM2.5 sensors, several limitations should be acknowledged. First, since the analyses were conducted within a single geographical region and under specific atmospheric conditions, model performance may vary across different climatic regions, aerosol characteristics, and emission profiles. In particular, due to potential differences in PM2.5 behavior within industrial areas, coastal regions, or environments with distinct topographical characteristics, the generalizability of the models should be further evaluated through multi-location studies. The meteorological and auxiliary environmental variables used in this study were not directly measured by the sensor itself but were obtained from location-specific environmental data services. Although this approach provides important operational advantages for real-world applications, the spatial resolution and measurement uncertainties of environmental data sources may influence model behavior. Nevertheless, the results demonstrate that auxiliary variables obtained from location-specific environmental data services can be effectively utilized for LCS calibration.
The scalability discussed in this study should therefore be interpreted as the transferability of the AQ-MultiCal-based workflow rather than the direct transferability of a trained model without retraining. In regions with different humidity dynamics, the relative importance of PM2.5–humidity interaction features may vary. Therefore, local retraining and re-evaluation of feature importance are required when applying the proposed approach to different climatic or geographical conditions.
One of the important findings of the study is that the FE strategies provided substantial contributions to calibration performance. In particular, the higher contribution of humidity-based interaction features compared to conventional lag-based structures indicates that non-linear environmental effects play a critical role in PM2.5 calibration. In addition, the more stable performance exhibited by ensemble-based models across most experimental configurations further supports that PM2.5 behavior involves highly non-linear environmental relationships. Nevertheless, the FE strategies used in this study were evaluated under a combined framework. The independent effects of lag features, rolling averages, interaction terms, and cyclic temporal encoding components were not analyzed under separate experimental scenarios. Future studies evaluating these FE components individually may provide more detailed insights into model interpretability. The findings demonstrate that LCSs can be calibrated using data-driven environmental variables without requiring continuous co-location. This approach may improve the applicability of LCS networks, particularly in regions lacking reference monitoring infrastructure. Future studies involving multi-sensor networks across different climatic regions, the use of environmental data sources with higher spatial resolution, and the development of real-time adaptive calibration systems may contribute to more generalizable data-driven calibration approaches.
4. Conclusions
In this study, an integrated ML-based analytical approach was applied for the data-driven calibration of a low-cost PM2.5 sensor deployed in an outdoor residential environment. Within the scope of the study, raw sensor measurements were evaluated together with location-specific meteorological variables, auxiliary pollutant data, and FE strategies. In addition, a systematic ablation study approach was implemented to investigate the contributions of different environmental information groups to model performance. The results demonstrated that FE strategies substantially improved model performance across all experimental configurations. The most notable performance improvement was observed under the E1 configuration, where only raw PM2.5 sensor measurements were utilized. Under this configuration, the Test R2 value increased from 0.7237 to 0.8467, while the RMSE decreased from 6.96 µg/m3 to 5.19 µg/m3. This finding indicates that FE strategies can successfully derive meaningful temporal and environmental patterns directly from raw sensor measurements. Feature contribution analyses further revealed that humidity-based interaction features provided particularly strong explanatory contributions to the model. In addition, the higher contribution of rolling average-based features compared to conventional lag-based structures suggests that short-term atmospheric continuity can be represented more effectively through smoothed temporal patterns. The more stable performance exhibited by ensemble-based models across most experimental configurations further supports that PM2.5 behavior involves non-linear environmental relationships. When prediction–observation agreement, residual behavior, and time-series analyses were evaluated together, the proposed analytical approach demonstrated balanced and generalizable prediction behavior across a wide concentration range. In particular, the FE components contributed to reducing short-term sensor noise and producing more stable PM2.5 representations. One of the major contributions of the study is the demonstration that meaningful PM2.5 calibration performance can be achieved using location-specific environmental variables in scenarios where continuous co-location is not operationally feasible. This approach provides a scalable and operationally practical alternative that may improve the applicability of LCS networks, particularly in regions lacking reference monitoring infrastructure. Future studies involving multi-sensor networks across different climatic regions, higher-spatial-resolution environmental data sources, and real-time adaptive calibration approaches may contribute to the development of more generalizable data-driven calibration models.
Supplementary Materials
The following supporting information can be down-loaded at: https://www.mdpi.com/article/10.3390/chemosensors14070154/s1, Table S1: Comparative model performance results for E1 (Raw Sensor Data) with and without feature engineering; Table S2: Comparative model performance results for E2 (Raw Sensor + Meteorology Data) with and without feature engineering; Table S3: Comparative model performance results for E3 (Raw Sensor + Gaseous Pollutants Data) with and without feature engineering; Table S4: Comparative model performance results for E4 (Raw Sensor + Meteorology + Gaseous Pollutants Data) with and without feature engineering; Table S5: Default hyperparameter settings used consistently across all experimental configurations.
Funding
This research received no external funding.
Institutional Review Board Statement
Not applicable.
Informed Consent Statement
Not applicable.
Data Availability Statement
The source code of the AQ-MultiCal platform developed in this study is publicly available on GitHub at https://github.com/tastan45/AQ-MultiCal_v2, accessed on 22 May 2026. The interactive web-based application can also be accessed at https://aq-multicalv2-9esms9kbyxdjeac4tskvkx.streamlit.app/, accessed on 22 May 2026.
Acknowledgments
The author has reviewed and edited the output and takes full responsibility for the content of this publication.
Conflicts of Interest
The author declares no conflicts of interest.
References
- Fuller, R.; Landrigan, P.J.; Balakrishnan, K.; Bathan, G.; Bose-O’Reilly, S.; Brauer, M.; Caravanos, J.; Chiles, T.; Cohen, A.; Corra, L.; et al. Pollution and Health: A Progress Update. Lancet Planet. Health 2022, 6, e535–e547. [Google Scholar] [CrossRef] [Scilit] [PubMed]
- Chen, J.; Hoek, G. Long-Term Exposure to PM and All-Cause and Cause-Specific Mortality: A Systematic Review and Meta-Analysis. Environ. Int. 2020, 143, 105974. [Google Scholar] [CrossRef] [Scilit] [PubMed]
- Strak, M.; Weinmayr, G.; Rodopoulou, S.; Chen, J.; De Hoogh, K.; Andersen, Z.J.; Atkinson, R.; Bauwelinck, M.; Bekkevold, T.; Bellander, T.; et al. Long Term Exposure to Low Level Air Pollution and Mortality in Eight European Cohorts within the ELAPSE Project: Pooled Analysis. BMJ 2021, 374, n1904. [Google Scholar] [CrossRef] [Scilit] [PubMed]
- World Health Organization (WHO). WHO Global Air Quality Guidelines: Particulate Matter (PM2.5 and PM10), Ozone, Nitrogen Dioxide, Sulfur Dioxide And Carbon Monoxide; World Health Organization: Geneva, Switzerland, 2021; pp. 1–360. [Google Scholar]
- Directive—EU—2024/2881—EN—EUR-Lex. Available online: https://eur-lex.europa.eu/eli/dir/2024/2881/oj/eng (accessed on 18 June 2026).
- Kumar, P.; Druckman, A.; Gallagher, J.; Gatersleben, B.; Allison, S.; Eisenman, T.S.; Hoang, U.; Hama, S.; Tiwari, A.; Sharma, A.; et al. The Nexus between Air Pollution, Green Infrastructure and Human Health. Environ. Int. 2019, 133, 105181. [Google Scholar] [CrossRef] [Scilit] [PubMed]
- Parums, D.V. A Review of the Increasing Impact and Effects of Air Pollution Throughout Life and Before Birth. Med. Sci. Monit. 2026, 32, e953109. [Google Scholar] [CrossRef] [Scilit] [PubMed]
- Zhivkov, P.; Fidanova, S. Machine Learning Calibration Transfer for Low-Cost Air Quality Sensors: Distance-Based Uncertainty Quantification in a Hybrid Urban Monitoring Network. Atmosphere 2026, 17, 335. [Google Scholar] [CrossRef] [Scilit]
- Barrientos-Mauricio, R.G.; Medrano-Jacobo, A.Q.; Carrera-Salas, E.A. IoT-Based Air Pollution Monitoring System: A Case Study in Artisanal Brick Kilns. Sustain. Environ. 2026, 12, 2607841. [Google Scholar] [CrossRef] [Scilit]
- Penza, M.; Suriano, D.; Pfister, V.; Dipinto, S.; Prato, M.; Cassano, G. Networked Low-Cost Sensor Systems for Urban Air Quality Monitoring: A Long-Term Use-Case in Bari (Italy). Chemosensors 2025, 13, 380. [Google Scholar] [CrossRef] [Scilit]
- Cowell, N.H.; Chapman, L.; Topping, D.; James, P.; Bell, D.; Bannan, T.; Murabito, E.; Evans, J.; Birkin, M. Moving from Monitoring to Real-Time Interventions for Air Quality: Are Low-Cost Sensor Networks Ready to Support Urban Digital Twins? Front. Sustain. Cities 2024, 6, 1500516. [Google Scholar] [CrossRef] [Scilit]
- Crilley, L.R.; Shaw, M.; Pound, R.; Kramer, L.J.; Price, R.; Young, S.; Lewis, A.C.; Pope, F.D. Evaluation of a Low-Cost Optical Particle Counter (Alphasense OPC-N2) for Ambient Air Monitoring. Atmos. Meas. Tech. 2018, 11, 709–720. [Google Scholar] [CrossRef] [Scilit]
- Kim, Y.H.; Moon, S.H. Machine Learning-Based Quality Control for Low-Cost Air Quality Monitoring: A Comprehensive Review of the Past Decade. Atmosphere 2025, 16, 1136. [Google Scholar] [CrossRef] [Scilit]
- Patel, M.Y.; Vannucci, P.F.; Kim, J.; Berelson, W.M.; Cohen, R.C. Towards a Hygroscopic Growth Calibration for Low-Cost PM2.5 Sensors. Atmos. Meas. Tech. 2024, 17, 1051–1060. [Google Scholar] [CrossRef] [Scilit]
- Li, H.; Zhu, Y.; Zhao, Y.; Chen, T.; Jiang, Y.; Shan, Y.; Liu, Y.; Mu, J.; Yin, X.; Wu, D.; et al. Evaluation of the Performance of Low-Cost Air Quality Sensors at a High Mountain Station with Complex Meteorological Conditions. Atmosphere 2020, 11, 212. [Google Scholar] [CrossRef] [Scilit]
- Sahu, R.; Nagal, A.; Dixit, K.K.; Unnibhavi, H.; Mantravadi, S.; Nair, S.; Simmhan, Y.; Mishra, B.; Zele, R.; Sutaria, R.; et al. Robust Statistical Calibration and Characterization of Portable Low-Cost Air Quality Monitoring Sensors to Quantify Real-Time O3 and NO2 Concentrations in Diverse Environments. Atmos. Meas. Tech. 2021, 14, 37–52. [Google Scholar] [CrossRef] [Scilit]
- Karagulian, F.; Barbiere, M.; Kotsev, A.; Spinelle, L.; Gerboles, M.; Lagler, F.; Redon, N.; Crunaire, S.; Borowiak, A. Review of the Performance of Low-Cost Sensors for Air Quality Monitoring. Atmosphere 2019, 10, 506. [Google Scholar] [CrossRef] [Scilit]
- Taştan, M. Machine Learning–Based Calibration and Performance Evaluation of Low-Cost Internet of Things Air Quality Sensors. Sensors 2025, 25, 3183. [Google Scholar] [CrossRef] [Scilit] [PubMed]
- Taştan, M.; Asal, E.C.K.; Gökozan, H. AQ-MultiCal: An Interactive No-Code Machine Learning Platform for Low-Cost Air Quality Sensor Calibration and Comparative Model Analysis. Sensors 2026, 26, 2398. [Google Scholar] [CrossRef] [Scilit] [PubMed]
- Kumar, V.; Sahu, M. Evaluation of Nine Machine Learning Regression Algorithms for Calibration of Low-Cost PM2.5 Sensor. J. Aerosol Sci. 2021, 157, 105809. [Google Scholar] [CrossRef] [Scilit]
- Ma, X.; Fan, Y.; Wang, Y.; Wang, X.; Tan, Z.; Li, D.; Gao, J.; Zhang, L.; Xu, Y.; Liu, X.; et al. A Machine Learning-Based Calibration Framework for Low-Cost PM2.5 Sensors Integrating Meteorological Predictors. Chemosensors 2025, 13, 425. [Google Scholar] [CrossRef] [Scilit]
- Kang, J.; Choi, K. Calibration Methods for Low-Cost Particulate Matter Sensors Considering Seasonal Variability. Sensors 2024, 24, 3023. [Google Scholar] [CrossRef] [Scilit] [PubMed]
- Shingare, A.A.; Rajput, K.A.; Kamble, S.; Jha, S.K.; Kumar, M.; Arora, V.; Tripathi, S.N.; Motghare, V.M. Domain Adaptation-Based Deep Calibration of Low-Cost PM2.5 Sensors. IEEE Sens. J. 2021, 21, 25941–25949. [Google Scholar] [CrossRef] [Scilit]
- Taştan, M.; Gökozan, H. Real-Time Monitoring of Indoor Air Quality with Internet of Things-Based E-Nose. Appl. Sci. 2019, 9, 3435. [Google Scholar] [CrossRef] [Scilit]
- Malyan, V.; Kumar, V.; Sahu, M.; Prakash, J.; Choudhary, S.; Raliya, R.; Chadha, T.S.; Fang, J.; Biswas, P. Calibrating Low-Cost Sensors Using MERRA-2 Reconstructed PM2.5 Mass Concentration as a Proxy. Atmos. Pollut. Res. 2024, 15, 102027. [Google Scholar] [CrossRef] [Scilit]
- De Vito, S.; Del Giudice, A.; D’Elia, G.; Esposito, E.; Fattoruso, G.; Ferlito, S.; Formisano, F.; Loffredo, G.; Massera, E.; D’Auria, P.; et al. Future Low-Cost Urban Air Quality Monitoring Networks: Insights from the EU’s AirHeritage Project. Atmosphere 2024, 15, 1351. [Google Scholar] [CrossRef] [Scilit]
- Gómez, R.; Rodríguez, J.; Ferro, R. Calibration of Low-Cost Sensors for PM10 and PM2.5 Based on Artificial Intelligence for Smart Cities. Sensors 2026, 26, 796. [Google Scholar] [CrossRef] [Scilit] [PubMed]
- Shetty, S.; Hassani, A.; Hamer, P.D.; Stebel, K.; Salamalikis, V.; Berntsen, T.K.; Castell, N.; Schneider, P. Evaluating the Role of Low-Cost Sensors in Machine Learning Based European PM2.5 Monitoring. Environ. Res. 2026, 291, 123558. [Google Scholar] [CrossRef] [Scilit] [PubMed]
- Kim, B.Y.; Lim, Y.K.; Cha, J.W. Short-Term Prediction of Particulate Matter (PM10 and PM2.5) in Seoul, South Korea Using Tree-Based Machine Learning Algorithms. Atmos. Pollut. Res. 2022, 13, 101547. [Google Scholar] [CrossRef] [Scilit]
- Jia, D.; Ruan, W.; Ma, R.; Zhao, S.; Wang, Y.; Xu, W.; Zhou, W.; Ge, X.; Xu, Z. Hybrid Framework for Improved PM2.5 Prediction Based on Seasonal-Trend Decomposition and Tailored Component Processing. Sci. Rep. 2025, 15, 21601. [Google Scholar] [CrossRef] [Scilit] [PubMed]
- Hewamalage, H.; Ackermann, K.; Bergmeir, C.; Christoph Bergmeir, B.; Ackermann KlausAckermann, K. Forecast Evaluation for Data Scientists: Common Pitfalls and Best Practices. Data Min. Knowl. Discov. 2022, 37, 788–832. [Google Scholar] [CrossRef] [Scilit]
- Cerqueira, V.; Torgo, L.; Mozetič, I.; Soldatova, L.; Vanschoren, J.; Mozetič, I. Evaluating Time Series Forecasting Models: An Empirical Study on Performance Estimation Methods. Mach. Learn. 2020, 109, 1997–2028. [Google Scholar] [CrossRef] [Scilit]
- Bergmeir, C.; Benítez, J.M. On the Use of Cross-Validation for Time Series Predictor Evaluation. Inf. Sci. 2012, 191, 192–213. [Google Scholar] [CrossRef] [Scilit]
- PMS7003—Laser PM2.5 Sensor-Plantower Technology. Available online: https://plantower.com/en/products_33/76.html (accessed on 18 June 2026).
- Bulot, F.M.J.; Ossont, S.J.; Morris, A.K.R.; Basford, P.J.; Easton, N.H.C.; Mitchell, H.L.; Foster, G.L.; Cox, S.J.; Loxham, M. Characterisation and Calibration of Low-Cost PM Sensors at High Temporal Resolution to Reference-Grade Performance. Heliyon 2023, 9, e15943. [Google Scholar] [CrossRef] [Scilit] [PubMed]

Disclaimer/Publisher’s Note: The statements, opinions and data contained in all publications are solely those of the individual author(s) and contributor(s) and not of MDPI and/or the editor(s). MDPI and/or the editor(s) disclaim responsibility for any injury to people or property resulting from any ideas, methods, instructions or products referred to in the content. |
© 2026 by the author. Licensee MDPI, Basel, Switzerland. This article is an open access article distributed under the terms and conditions of the Creative Commons Attribution (CC BY) license.