


Abstract
Formalin, a commercial aqueous solution typically containing 37% formaldehyde, often includes a few percent methanol to inhibit polymerization. Nevertheless, formaldehyde readily forms polymerization products such as glycols, dimethoxy (acetal), and methoxyalcohol (hemiacetal) derivatives, making their analysis important. In this work, we employ ion mobility spectrometry (IMS) for qualitative and quantitative detection of these species and demonstrate that analysis is not feasible using the standard IMS reactant ion, H3O+(H2O)n. Protonation by H3O+(H2O)n induces loss of water or methanol, preventing stable detection of the intact derivatives. Hence, ammonia was introduced as a dopant to replace H3O+(H2O)n with NH4+(H2O)n in the ionization region, thereby shifting the ionization mechanism from proton transfer to ammonium attachment. A high-temperature injection port was also designed to enable the analysis of both liquid samples and their corresponding headspace. Using the developed method, we identified both acetal and hemiacetal derivatives in commercial formaldehyde solution, while only the more volatile acetal species were detected in the headspace. Quantitative analysis yielded a limit of detection (LOD) of 1.9 ppm and a linear range of 5.5–120 ppm for solution measurements. Importantly, the method provides reliable detection in the presence of substantial humidity, an environment in which many polymer-based sensors fail due to severe moisture interference. Overall, ammonia-doped IMS offers a robust and humidity-tolerant platform for characterizing formaldehyde polymerization products in both the gas and liquid phases.
1. Introduction
Formaldehyde is a widely used industrial chemical, serving as a key precursor in the manufacture of resins, plastics, textiles, disinfectants, and numerous building materials [1]. Its high reactivity, while central to these applications, also contributes to its pervasive presence in the environment. Formaldehyde is emitted from combustion processes, off-gassing of polymeric materials, and various chemical reactions occurring both indoors and outdoors, making it one of the most common volatile organic compounds (VOCs) in occupational, residential, and urban atmospheres [2]. Despite its industrial relevance, formaldehyde poses significant environmental and public health risks. It is classified as a human carcinogen and is associated with respiratory irritation, asthma exacerbation, and other adverse health effects even at low concentrations [3]. These concerns highlight the need for sensitive, selective, and rapid methods for formaldehyde detection.
Chromatographic techniques, particularly high-performance liquid chromatography (HPLC) and gas chromatography (GC), are widely employed for formaldehyde quantification due to their high selectivity and suitability for trace-level analysis [4,5,6]. However, these methods typically require lengthy analysis times and rely on derivatization—most commonly with 2,4-dinitrophenylhydrazine—which adds complexity and limits real-time monitoring capabilities [7]. Beyond chromatography, fluorescence [8,9], chemiluminescence [10], Raman spectroscopy [11], electrochemical sensors [12,13], semiconductor- and polymer-based devices [14,15,16], proton transfer reaction–mass spectrometry (PTR-MS) [17], and colorimetric assays [18,19] have been explored for formaldehyde detection. Nevertheless, many of these approaches still suffer from drawbacks such as toxic reagents, high instrument costs, or insufficient sensitivity in complex environments.
Because formaldehyde is highly unstable in the gas phase [20], it is commercially supplied as an aqueous solution stabilized with methanol. A typical 37% formaldehyde solution, widely used for tissue preservation, contains a dynamic mixture of species formed through hydration and polymerization reactions [21]. In water, formaldehyde rapidly forms methylene glycol, and at room temperature the equilibrium strongly favors this hydrated form (K ≈ 1.3 × 10³) [22].
CH2O + H2O → HO − CH2 − OH
Methanol is added to inhibit polymerization, but it also participates in acetal formation, yielding methoxymethanol and dimethoxymethane through reactions (2) and (3) [23].
HO − CH2 − OH + CH3OH → CH3O − CH2 − OH + H2O
HO − CH2 − OH + 2CH3OH → CH3O − CH2 − OCH3 + 2H2O
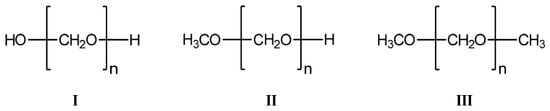
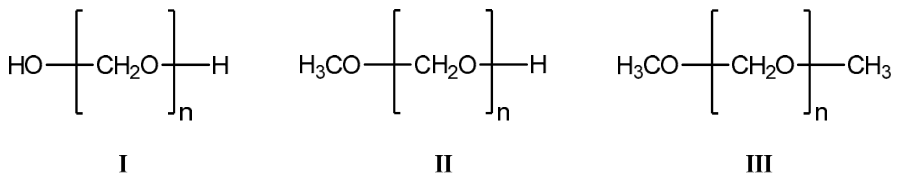
Consequently, aqueous formaldehyde solutions contain at least three major classes of products, namely glycols, methoxyalcohols (hemiacetals), and dimethoxyalkanes (acetals), as shown in Figure 1.
Figure 1.
Structures of the three major formaldehyde-derived polymers—glycol (I), methoxyalcohol or hemiacetal (II), and dimethoxyalkane or acetal (III)—formed through reactions of formaldehyde with water and methanol.
Because formalin solutions are widely used in both industrial processes and laboratory settings, monitoring polymerization in aqueous formaldehyde is essential. Polymer formation reduces the concentration of free formaldehyde, compromises key functional properties—such as fixation efficiency and chemical reactivity—and can ultimately lead to inaccurate experimental results or suboptimal industrial products. Consequently, a variety of analytical techniques, including NMR [23], Raman and infrared spectroscopy [21,24], and mass spectrometry [20,25], have been used to characterize these solution-phase species. However, these methods primarily elucidate structural information in the liquid phase and provide limited insight into the composition of the headspace or the distribution of formaldehyde-derived compounds in the gas phase.
In this work, we employ ion mobility spectrometry (IMS) and mass spectrometry (MS) to analyze the headspace above aqueous formaldehyde solutions and compare the species present in the gas and liquid phases. IMS offers rapid response, portability, and real-time monitoring capabilities, making it a promising platform for VOC detection [26,27,28]. Yet, formaldehyde’s low proton affinity and high ionization energy, combined with interference from humidity and other VOCs, hinder its detection using conventional IMS protonation chemistry [29,30].
In this work, we present an IMS-based method for detecting formaldehyde polymerization products in the presence of methanol and humidity, both in solution and in the gas phase. To address the ionization challenges associated with formaldehyde derivatives, we introduce ammonia as a dopant to shift the ionization pathway from protonation to ammonium-ion attachment. In IMS, a dopant is added to the ion source to convert the standard reactant ion, H3O+, into an alternative reactant ion, thereby modifying the ionization mechanism. Although IMS has previously been applied to formaldehyde (HCHO) detection [29], it has not been used to measure formaldehyde polymerization products. Furthermore, most existing analytical techniques focus solely on polymerization products in solution [20,21,22,23,24,25], whereas the method developed here enables analysis in both the gas phase and solution.
2. Experimental Section
2.1. Instrumentation
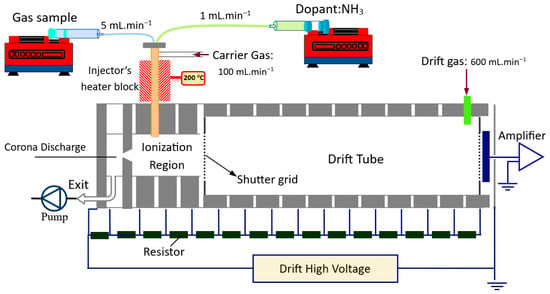
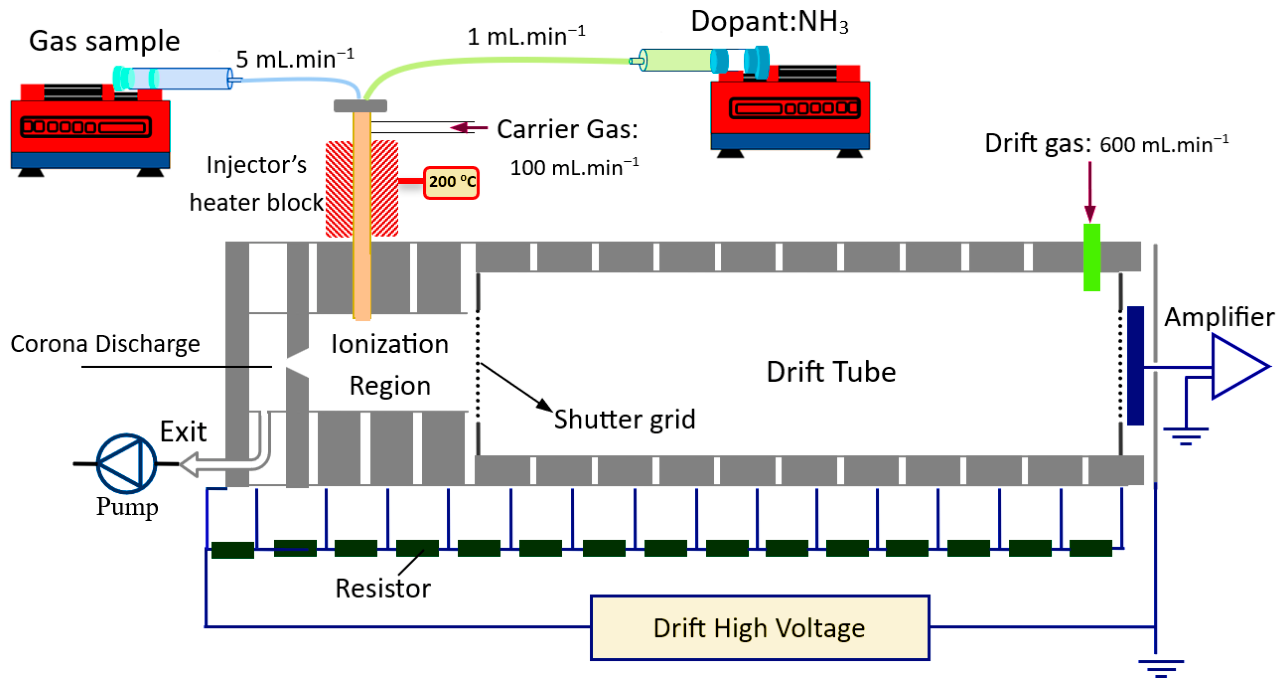
Both IMS and IMS combined with time-of-flight mass spectrometry (IMS-TOFMS) devices are custom-built instruments developed at the Department of Experimental Physics. A detailed description of the instruments can be found elsewhere [31]. In summary, the IMS cell consists of three sequential regions: the corona discharge (CD) ionization source, the ionization/injection zone controlled by a Bradbury–Nielsen-type shutter grid, and the drift tube for mobility separation (Figure 2). The CD ion source employed a needle-to-plane geometry with a 7 mm gap, using a tungsten needle of 150 μm diameter positioned opposite a target electrode containing a 3 mm orifice. The shutter grid regulated ion packet injection into the drift tube, opening for 100 μs at 15 ms intervals to pulse product ions forward for subsequent mobility separation. The IMS drift tube operates at sub-ambient pressure (600 mbar) and a temperature of 105 ± 2 °C (temperature of the drift gas at exit), with a Faraday cup as the IMS detector at the end of the drift tube. The flow rate of the drift gas (purified ambient air) was 600 mL min−1. A voltage of 8.5 kV was applied across the IMS cell (12.5 cm) to provide a drift field of 680 V cm−1. The CD of the IMS ion source was supplied by a potential difference of 3 kV between the needle and the planar electrode.
Figure 2.
Schematic representation of the experimental setup, including the IMS components, the sample injection system, and the associated gas flow configuration.
The IMS was coupled to a three-stage differential pumping system via a 100 μm pinhole, achieving pressures of 10−1, 10−5, and 5 × 10⁻⁶ mbar in successive chambers using rotary and turbomolecular pumps. Ions transmitted through the pinhole were focused by an ion optic assembly (skimmer and five electrodes) before entering the orthogonal acceleration region of the time of flight–mass spectrometer (TOF-MS). The TOFMS comprised a seven-electrode acceleration region and a 547 mm flight tube, with detection by a multichannel plate (MCP).
Both instruments utilize an internal corona discharge ion source to generate reactant ions (RIs), primarily protonated water clusters, H+(H2O)n. The sample gas (M) is ionized through the following proton transfer reaction [32]:
H+(H2O)n + M → [M+H]+ + nH2O
This method selectively ionizes compounds whose proton affinities (PA) exceed that of the reactant ion.
2.2. Experimental Setup
Figure 2 presents a schematic overview of the experimental setup, including the ion mobility spectrometer (IMS), sample introduction system, and gas flow configuration. A high-temperature injection port was constructed and connected directly to the inlet of the IMS ionization region to enable the introduction of both gas-phase and liquid samples. The injection port was heated using a 1 m heating wire (20 Ω), to which a voltage of 20 V and a current of 1 A were applied, raising the port temperature to approximately 200 °C.
Ammonia dopant was generated by collecting the headspace above a 30% ammonium carbonate (ACS reagent, Sigma-Aldrich, Darmstadt, Germany) using a gas-tight syringe. The dopant was delivered to the injection port via a syringe pump at a flow rate of 1 mL min−1.
For gas-phase analysis of formaldehyde derivatives, standard solutions of varying concentrations were prepared from a commercial formaldehyde solution (37% in water, stabilized with 10–15% methanol; ACS reagent grade, Sigma-Aldrich). The headspace above these solutions was collected and introduced into the injection port using a syringe pump at 5 mL min−1. Both the sample stream and ammonia dopant were transported to the IMS ionization region by zero air serving as the carrier gas at a flow rate of 100 mL min−1. For liquid-phase measurements, 1 µL of the prepared solution was injected into the heated port using a 10 µL Hamilton syringe. The injected liquid rapidly vaporized, and the resulting vapor was carried into the ionization region by zero air at a flow rate of 100 mL min−1.
2.3. Computational Details
All neutral and charged species were fully optimized in the gas phase using density functional theory (DFT) with the B3LYP functional, as implemented in Gaussian 16 [33]. All calculations were performed using the 6-311++G(d,p) basis set, which includes both diffuse and polarization functions for hydrogen and heavier atoms. Frequency calculations were performed at 298.15 K at the same level of theory to obtain thermodynamic properties such as enthalpy and Gibbs free energy values.
3. Results and Discussion
3.1. Headspace Analysis
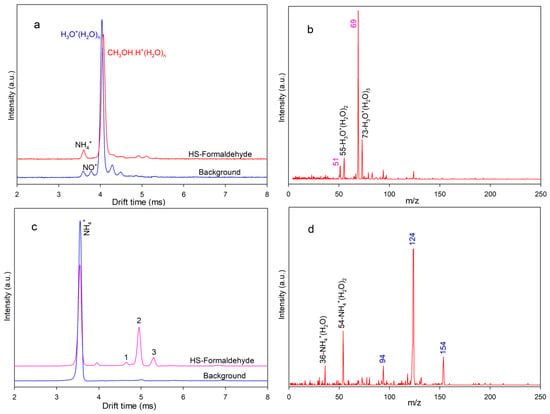
Figure 3a compares the ion mobility spectrum of the headspace above a 180 ppm formaldehyde solution diluted with water to the background IMS spectrum. The headspace spectrum exhibits a broad peak at a drift time of 4.03 ms, which overlaps with the reactant ion peak, H3O+(H2O)n. Mass spectrometry reveals that this peak corresponds to protonated methanol cluster ions, [CH3OH + H]+(H2O)2,3, with m/z 51 and 69 (Figure 3b). Thus, under standard IMS ionization conditions, only methanol, the stabilizer present in commercial formaldehyde solution, is detected, while no signals attributable to formaldehyde or its polymerization products are observed. This behavior is expected based on ionization energetics. Even if free formaldehyde (CH2O) is present in the headspace, its lower proton affinity (711.5 kJ mol−1) relative to methanol (754.3 kJ mol−1) (Table S1), combined with the competitive nature of proton-transfer reactions [34], ensures preferential protonation of methanol. This observation is consistent with previous reports noting that formaldehyde detection in the presence of methanol is challenging due to the significantly higher IMS sensitivity toward methanol [29].
Figure 3.
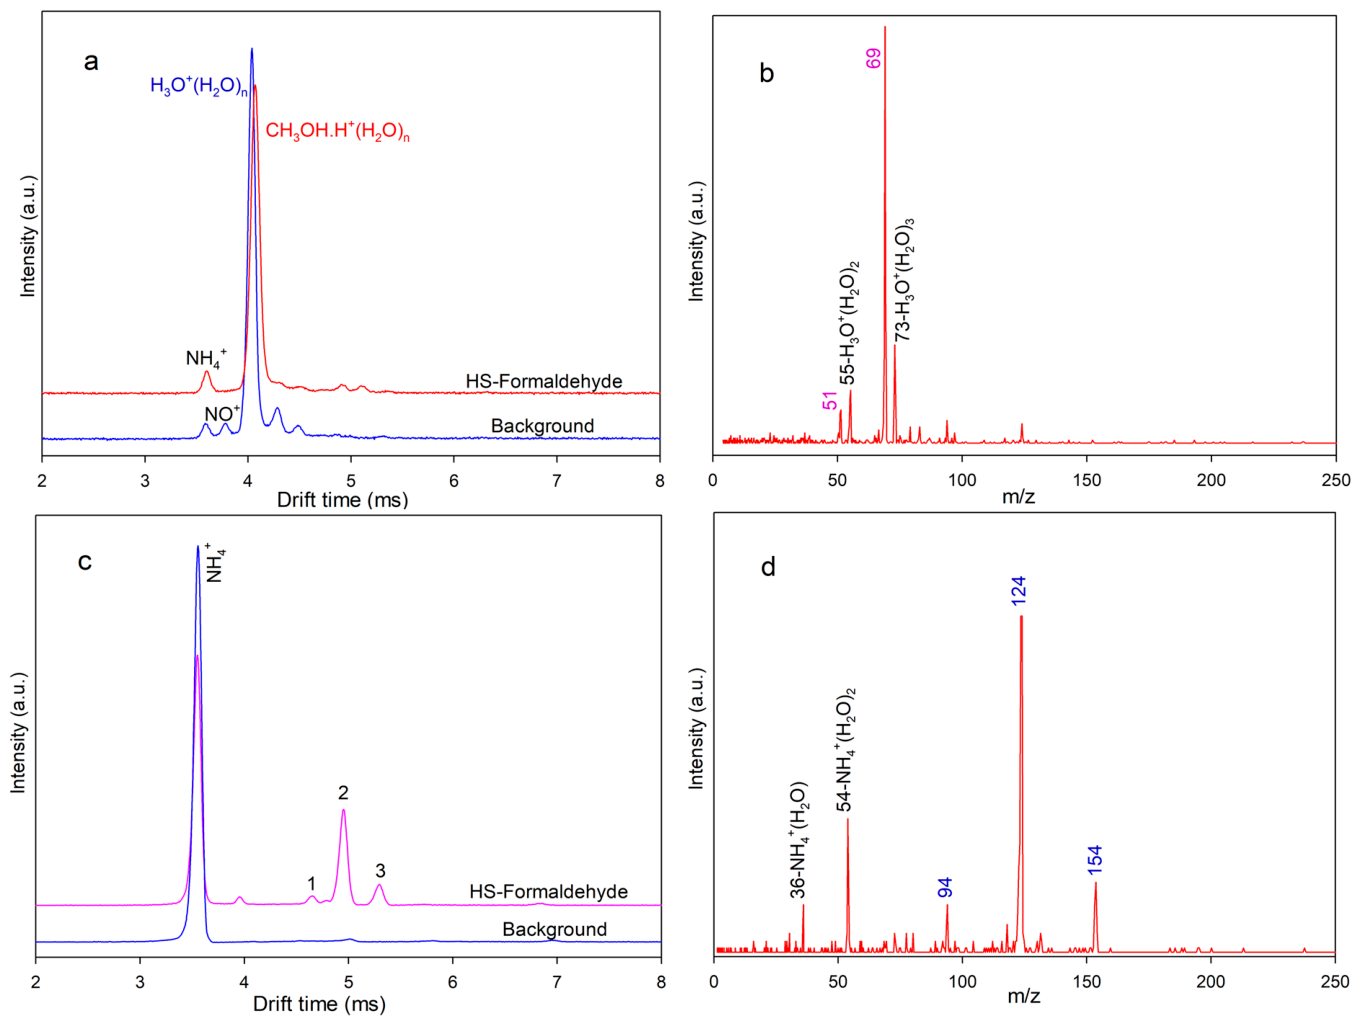
(a) Comparison of the background IMS spectrum showing H3O+(H2O)n as the main reactant ion with the spectrum of the headspace (HS) of a formaldehyde solution (180 ppm). (b) Mass spectrum of the formaldehyde headspace. (c) Comparison of the IMS spectrum of the ammonia dopant, showing NH4+(H2O)n as the main reactant ion, with the IMS spectrum of the formaldehyde headspace in the presence of ammonia dopant. (d) Mass spectrum of the formaldehyde headspace obtained with ammonia dopant.
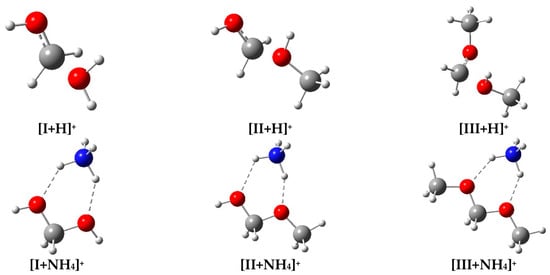
The absence of peaks corresponding to formaldehyde derivatives may also arise from their lower volatility and, consequently, lower headspace concentrations compared with methanol. Furthermore, because ionization with H3O+(H2O)n proceeds via proton transfer, we examined the stability of protonated formaldehyde derivatives using DFT-B3LYP geometry optimization (Figure 4). The optimized structures indicate that methylene glycol (I), methoxymethanol (II), and dimethoxymethane (III) readily undergo loss of water or methanol upon protonation, ultimately yielding species that contribute to the methanol-related peak. In other words, the polymerization products readily dissociate upon protonation by the standard IMS reactant ion, H3O+(H2O)n, which makes their identification difficult. This explains why detecting these derivatives with conventional IMS reactant ions is essentially impossible and why a softer ionization approach is required.
Figure 4.
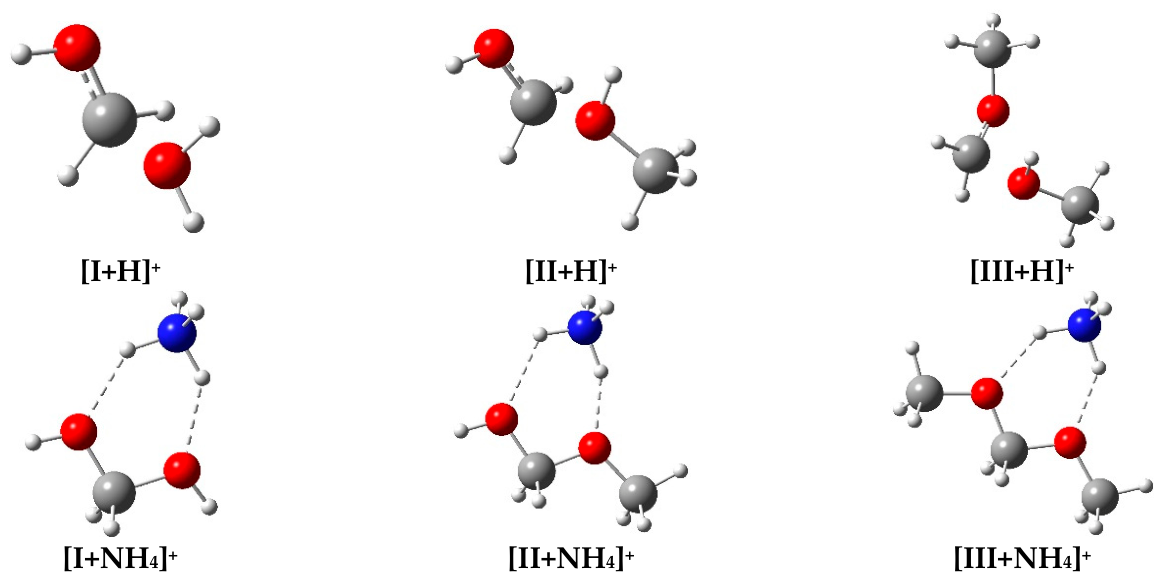
Optimized structures of the protonated forms of typical formalin polymerization products, methylene glycol (I), methoxymethanol (II), and dimethoxymethane (III), along with their corresponding ammonium adduct ions. When ionized by the standard IMS reactant ion H3O+(H2O)n, the protonated products readily dissociate (top), hindering their accurate identification. In contrast, using ammonia as a dopant generates NH4+(H2O)n reactant ions that form stable ammonium adducts (bottom), enabling intact ionization and accurate analysis of the products. Color code: carbon (gray), hydrogen (white), oxygen (red), and nitrogen (blue).
To overcome this limitation, we introduced ammonia as a dopant to replace H3O+(H2O)n with NH4+(H2O)n as the dominant reactant ion. This modification shifts the ionization mechanism from proton transfer to ammonium-ion attachment [32], thereby preventing the dissociation of formaldehyde derivatives during ionization.
Figure 3c shows the ion mobility spectrum of the headspace of the formaldehyde solution (180 ppm) in the presence of ammonia dopant. Three distinct peaks (1, 2, and 3) appear at drift times of 4.65, 4.97, and 5.29 ms. The corresponding mass spectrum (Figure 3d) displays peaks at m/z 94, 124, and 154, which correspond to ammonium adducts of dimethoxy (acetal) derivatives, CH3O(CH2O)1,2,3CH3 (compound III in Figure 1), consistent with previous observations [25]. Among these, CH3O(CH2O)2CH3 is the most abundant species in the gas phase, as indicated by its relative peak intensity.
DFT optimization confirms that these adduct ions form through two NH···O hydrogen bonds between NH4+ and the dimethoxy compounds (Figure 4). The calculated ΔG for the formation of [CH3OCH2OCH3 + NH4]+ is −94 kJ mol−1, demonstrating that these clusters are thermodynamically favored and stable in the gas phase (Table S1).
The absence of signals corresponding to glycols (I) and hemiacetals (II) in both IMS and MS spectra does not imply that these species are absent in solution. Rather, their higher polarity and the presence of one or two hydroxyl groups likely result in significantly lower vapor pressures, reducing their concentrations in the headspace. To further investigate their presence, we therefore analyzed the formaldehyde solution via direct liquid injection.
3.2. Solution Analysis
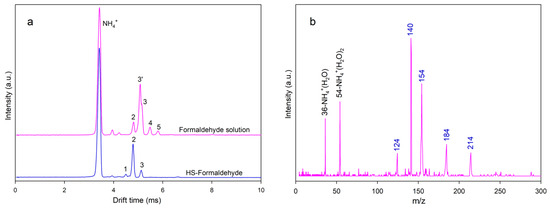
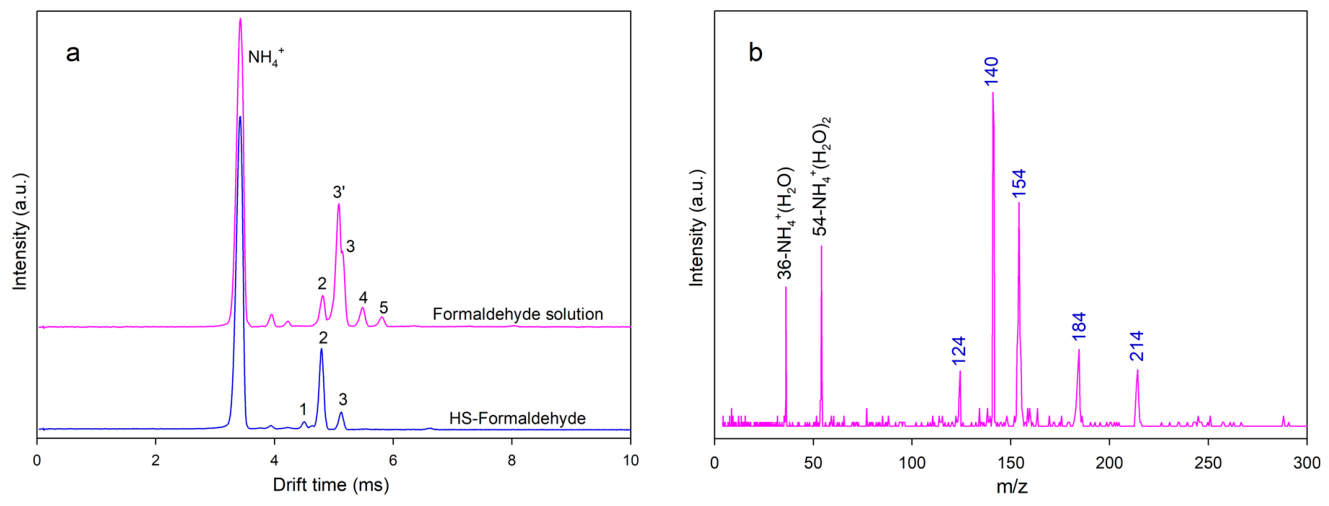
Formaldehyde solutions of varying concentrations were analyzed by injecting 1 µL of each solution into the heated injection port. As observed in the headspace experiments (Figure 3a), in the absence of ammonia dopant and with H3O+(H2O)n as the reactant ion, only the methanol peak appeared in the IMS spectrum, and no signals corresponding to formaldehyde derivatives were detected. This again confirms that proton-transfer ionization suppresses the detection of formaldehyde-derived species. When ammonia dopant was introduced and NH4+(H2O)n became the dominant reactant ion, six distinct IMS peaks were observed for the injected formalin solutions (Figure 5a). Comparison of the IMS spectra for the headspace and solution reveals that peaks 2 and 3 appear in both phases, whereas peak 1—present in the headspace—is absent in the solution spectra. The absence of peak 1 in the liquid-phase analysis suggests that the smallest dimethoxy species is largely converted into higher oligomers in solution. Any remaining trace amounts, due to their higher volatility, preferentially partition into the headspace, consistent with the small peak observed in the gas-phase spectra.
Figure 5.
(a) Comparison of the IMS spectra of the formaldehyde headspace (HS) and solution (120 ppm) in the presence of ammonia dopant. (b) Mass spectrum of the formaldehyde solution obtained with ammonia dopant.
Two additional peaks, labeled 4 and 5, appear only in the spectra obtained from direct liquid injection and are absent in the headspace spectra. The regular spacing between peaks 2, 3, 4, and 5 indicates that they belong to the same homologous series of dimethoxy-terminated oligomers. Mass spectrometry of the solution (Figure 5b) confirms this assignment: peaks at m/z 184 and 214 correspond to ammonium adducts of the larger dimethoxy derivatives CH3O(CH2O)4CH3 and CH3O(CH2O)5CH3, respectively.
In addition to these oligomers, a new peak labeled 3′ appears in the IMS spectrum, partially overlapping with peak 3. The mass spectrum (Figure 5b) shows an ion at m/z 140, corresponding to the ammonium adduct of the hemiacetal HO(CH2O)3CH3 [25]. This species is present at appreciable concentrations in solution but was not detected in the headspace, indicating that its volatility is significantly lower than that of the dimethoxy derivatives. These observations clearly demonstrate that the composition of the formaldehyde solution differs from that of its headspace. Higher-mass and more polar formaldehyde derivatives—such as hemiacetals—remain predominantly in the liquid phase due to their low vapor pressures, whereas the gas phase is enriched in the less polar, more volatile dimethoxy derivatives. This distinction underscores the importance of analyzing both phases to obtain a complete understanding of formaldehyde polymerization chemistry.
3.3. Quantitative Measurements
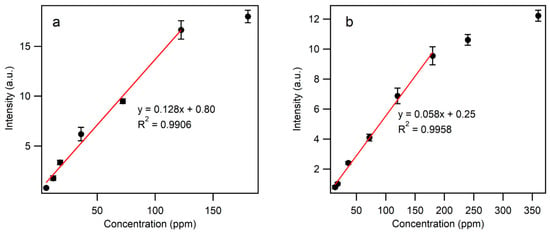
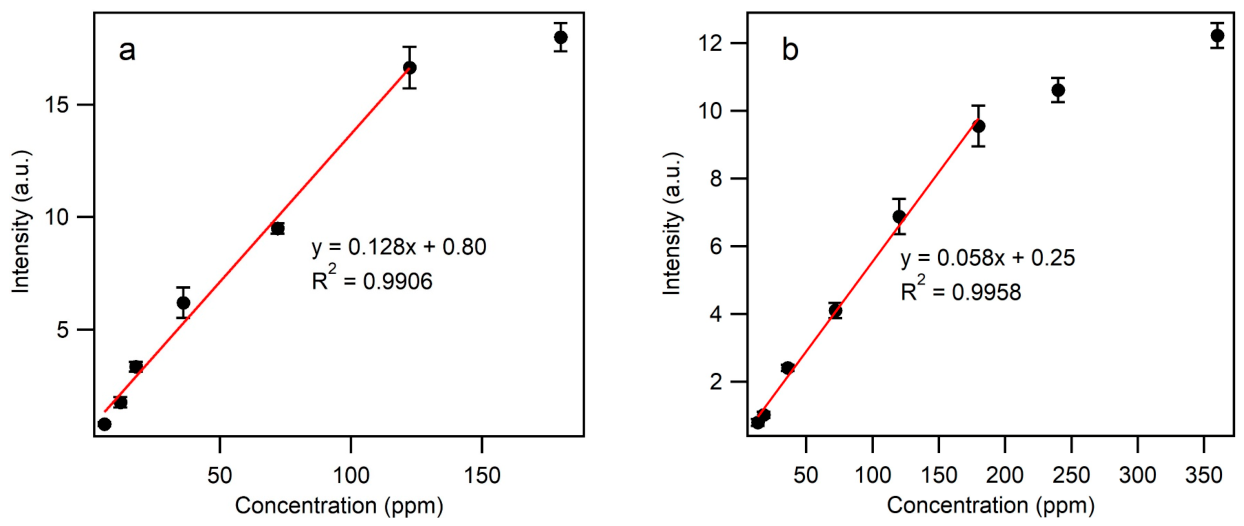
The quantitative response of the IMS system toward formaldehyde derivatives was evaluated for both gas-phase and solution samples. For gas-phase measurements, peak 2 in Figure 3c was selected as the analytical signal because it exhibited the highest intensity among the three observed peaks. For solution analysis, peak 3′—the most intense peak in the liquid-phase spectra—was used to construct the calibration curve.
Standard solutions of formaldehyde with varying concentrations were prepared in water from a commercial formaldehyde solution (37% formaldehyde in water). For solution measurements, 1 µL of each standard was directly injected into the heated port. For gas-phase measurements, the headspace above each standard solution was collected and introduced into the IMS ionization region using a 100 mL min−1 air stream.
Calibration curves were constructed by plotting the average peak intensities against the corresponding solution concentrations. The resulting calibration plots for solution and headspace measurements are shown in Figure 6a,b, respectively. For each concentration, error bars represent the relative standard deviation (RSD) obtained from triplicate measurements. The linear dynamic ranges were 5.5–120 ppm for solution analysis and 13.5–180 ppm for gas-phase analysis, with correlation coefficients (R2) of 0.9906 and 0.9958, respectively. The limit of detection (LOD) was calculated as 3σ/S, where σ (0.08 V) is the standard deviation of the baseline noise, and S is the slope of the calibration curve. The resulting LODs were 1.9 ppm for solution analysis and 4.1 ppm for gas-phase analysis. Limits of quantification (LOQs) were determined as 6.2 ppm for solution samples and 13.8 ppm for gas-phase samples. To evaluate measurement repeatability and ensure quantitative reliability, all experiments were performed in triplicate for seven concentrations in solution (5.5–120 ppm) and eight concentrations in the gas phase (13.5–180 ppm). RSD values were calculated for each concentration, yielding average RSDs of 6.5% for gas-phase measurements and 7.7% for solution measurements. Because the calibration curves for gas-phase and liquid samples were obtained on different days, these small and comparable RSD values indicate good signal stability and repeatability.
Figure 6.
Calibration curves obtained by IMS with ammonia dopant for formaldehyde derivatives measured (a) in solution and (b) in the gas phase.
Comparison with the literature shows that the sensitivity of IMS for formaldehyde detection is lower than that of several established analytical techniques. Colorimetric assays can achieve LODs as low as 0.06 ppm [18], PTR-MS reaches the ppbv range [17], GC offers LODs around 0.5 ppb [5], and HPLC can detect concentrations as low as 0.004 µg/mL (0.004 ppm) [4]. However, the sensitivity of IMS is superior to that of metal oxide semiconductor sensors such as Au/ZnO, which exhibit LOQs of approximately 50 ppm [34], and is comparable to that of a bio-anode-based electrochemical sensor with an LOD of 0.006 mM (0.18 ppm) [13]. The linear range obtained here, spanning more than one order of magnitude, is comparable to that reported for biosensors and semiconductor-based sensors [15,35].
A major challenge in formaldehyde sensing technologies is the strong influence of humidity, which often introduces significant signal interference and can lead to false responses or even complete suppression of formaldehyde detection in humid environments [16]. This issue is particularly critical because humidity is not an external contaminant but an inherent component of ambient air. A key advantage of IMS is its ability to detect formaldehyde derivatives in the presence of substantial moisture without requiring sample pre-treatment or drying steps. Although our samples were prepared in water—introducing considerable humidity into the IMS—the system maintained reliable sensitivity. While humidity can shift IMS peak positions, its effect on signal intensity is comparatively minor [30,36,37,38,39]. Moreover, despite the differing humidity levels in the solution and headspace samples, both produced comparable sensitivities, indicating that humidity variation did not significantly affect peak intensity.
We also evaluated potential interference from several common volatile organic compounds, including acetaldehyde, acetone, benzene, toluene, and ethyl acetate. Their individual ion mobility spectra were recorded and are shown in Figure S1. Comparison of these spectra with that of formalin indicates that none of these compounds—except ethyl acetate—exhibit peak overlap with the characteristic peaks of formaldehyde derivatives. Thus, most do not interfere with the qualitative identification of formaldehyde. However, their presence can influence the quantitative signal intensity of formaldehyde derivatives. To assess this effect, we measured the ion mobility spectra of mixtures containing formalin headspace combined with each interferent, with the resulting spectra provided in Figure S2. The results indicate that these interferents decrease the peak intensity of formaldehyde derivatives by approximately 10%. When measurements are performed in the presence of interferents that exert a stronger impact on signal intensity, the use of a pre-separation device—such as a multicapillary column (MCC)—is recommended [40].
We also evaluated NO2 as an alternative dopant, which generates NO+(H2O)n reactant ions in the IMS ionization region. The ion mobility and mass spectra for this dopant are shown in Figure S3. Using NO+, a strong IMS peak was observed for the formaldehyde headspace (Figure S4), and mass spectrometry identified the corresponding ion as CH3O(CH2O)2CH2+, formed via hydride abstraction by NO+. However, the ion mobility peak overlapped with the methanol peak, complicating both qualitative and quantitative analysis in samples containing methanol. Nevertheless, NO+ may be a useful dopant for samples free of methanol contamination.
4. Conclusions
In this work, we demonstrated that ion mobility spectrometry (IMS) equipped with its conventional reactant ion, H3O+(H2O)n, is not suitable for qualitative or quantitative analysis of formaldehyde derivatives due to competitive protonation and fragmentation processes. To overcome this limitation, we introduced ammonia as a dopant to shift the ionization mechanism from proton transfer to ammonium-ion attachment. This modification enabled stable ionization of formaldehyde oligomers and allowed for their detection and quantification in both the gas phase and solution.
Using NH4+(H2O)n as the reactant ion, both IMS and MS revealed clear differences between the composition of formalin in solution and its headspace. While both dimethoxy (acetal) and methoxyalcohol (hemiacetal) species are present in solution, only the more volatile dimethoxy derivatives appear in the gas phase. This highlights an important advantage of the developed IMS method over electrospray ionization mass spectrometry (ESI-MS), which is limited to liquid-phase analysis and cannot probe the gas-phase distribution of formaldehyde derivatives.
A further strength of the method is its robustness in the presence of high humidity. Unlike many sensor-based approaches whose responses are severely affected by moisture, the IMS method described here successfully detects formaldehyde derivatives without any humidity-removal steps, even when samples are introduced directly from an aqueous solution. This capability is particularly valuable for real-world applications, where humidity is unavoidable and often a major source of analytical interference. Overall, the ammonia-doped IMS approach provides a rapid (millisecond-scale), humidity-tolerant, and phase-independent platform for analyzing formaldehyde polymerization products.
Supplementary Materials
The following supporting information can be downloaded at: https://www.mdpi.com/article/10.3390/chemosensors14050105/s1. Table S1. Calculated ΔH and ΔG values for protonation and ammonium-ion attachment of the formaldehyde derivatives methylene glycol (I), methoxymethanol (II), and dimethoxymethane (III). Experimental values from the literature [41,42] are shown in parentheses. Figure S1. Comparison of the ion mobility spectra of potential interference including acetaldehyde (100 ppm), acetone (50 ppm), benzene (300 ppm), toluene (300 ppm), and ethyl acetate (50 ppm) with that of formalin indicatng that none of these compounds—except ethyl acetate—exhibit peak overlap with the characteristic peak (2) of formaldehyde derivatives. Figure S2. Ion mobility spectra of mixtures containing formalin headspace combined with each interferent: (a) acetaldehyde, (b) acetone, (c) benzene, (d) toluene, and (e) ethyl acetate. Figure S3. (a) IMS spectrum of the NO2 dopant showing the formation of NO+ as the dominant reactant ion in the corona discharge ion source. (b) Mass spectrum of the NO2 dopant confirming the formation of NO+(H2O) and NO+(H2O)2 ions with m/z 48 and 66, respectively. Figure S4. (a) Comparison of the IMS spectra of formaldehyde headspace and methanol in the presence of NO2 dopant, showing significant peak overlap. (b) Mass spectrum of the formaldehyde headspace obtained with NO+ as the reactant ion, indicating formation of CH3O(CH2O)2CH2+ via hydride abstraction by NO+.
Author Contributions
V.I., conceptualization, investigation, data acquisition, methodology, writing—review and editing. Y.V., DFT calculations, data interpretation, writing original draft, writing—review and editing. Š.M., supervision, funding acquisition, resources, data interpretation, writing—review and editing. All authors have read and agreed to the published version of the manuscript.
Funding
The research was funded by the NextGeneration EU program through the Recovery and Resilience Plan for Slovakia under the project No. 09I01-03-V04-00025. It was partially supported by the Slovak Research and Development Agency under project Nos. APVV-22-0133 and APVV-23-0522 and the Slovak Grant Agency VEGA project No. 1/0266/26.
Institutional Review Board Statement
Not applicable.
Informed Consent Statement
Not applicable.
Data Availability Statement
All data generated or analysed during this study are included in this published article and its Supplementary Materials.
Conflicts of Interest
The authors declare no conflict of interest.
References
- Marsal, A.; Cuadros, S.; Manich, A.M.; Izquierdo, F.; Font, J. Reduction of the formaldehyde content in leathers treated with formaldehyde resins by means of plant polyphenols. J. Clean. Product. 2017, 148, 518–526. [Google Scholar] [CrossRef] [Scilit]
- Athanassiadis, B.; George, G.A.; Abbott, P.V.; Wash, L.J. A review of the effects of formaldehyde release from endodontic materials. Int. Endod. J. 2015, 48, 829–838. [Google Scholar] [CrossRef] [Scilit]
- Khoshakhlagh, A.H.; Mohammadzadeh, M.; Ghobakhloo, S.; Cheng, H.; Gruszecka-Kosowska, A.; Knight, J. Health risk assessment from inhalation exposure to indoor formaldehyde: A systematic review and meta-analysis. J. Hazard. Mater. 2024, 471, 134307. [Google Scholar] [CrossRef] [Scilit]
- Ma, B.; Xu, F.; He, M.; Lin, Y.; Hu, G.; Zhang, M.; Zhao, X.; Liu, W. Detection of residual formaldehyde in N-butyl-2-cyanoacrylate by high-performance liquid chromatography with rhodamine B hydrazide. Michrochim. J. 2020, 158, 105222. [Google Scholar] [CrossRef] [Scilit]
- Zhu, H.; She, J.; Zhou, M.; Fan, X. Rapid and sensitive detection of formaldehyde using portable 2-dimensional gas chromatography equipped with photoionization detectors. Sens. Actuators B Chem. 2019, 283, 182–187. [Google Scholar] [CrossRef] [Scilit]
- Chothia, S.Y.; Emms, V.L.; Thomas, L.A.; Bulman, N.F.A.; Monks, P.S.; Cordell, R.L.; Hopkinson, R.J. Formaldehyde quantification using gas chromatography–mass spectrometry reveals high background environmental formaldehyde levels. Sci. Rep. 2024, 14, 20621. [Google Scholar] [CrossRef] [Scilit] [PubMed]
- Bhowmik, S.; Begum, M.; Hossain, M.A.; Rahman, M.; Alam, A.K.M.N. Determination of formaldehyde in wet marketed fish by HPLC analysis: A negligible concern for fish and food safety in Bangladesh. Egypt. J. Aquat. Res. 2017, 43, 245–248. [Google Scholar] [CrossRef] [Scilit]
- Becker, A.; Andrikopoulou, C.; Bernhardt, P.; Trocquet, C.; Le Calvé, S. On-line gaseous formaldehyde detection based on a closed-microfluidic-circuit analysis. Chemosensors 2020, 8, 57. [Google Scholar] [CrossRef] [Scilit]
- Akshath, U.S.; Bhatt, P. Supramolecular nano-sniffers for ultrasensitive detection of formaldehyde. Biosens. Bioelectron. 2018, 100, 201–207. [Google Scholar] [CrossRef] [Scilit]
- Motyka, K.; Mikuška, P.; Večeřa, Z. Continuous chemiluminescence determination of formaldehyde in air based on Trautz–Schorigin reaction. Anal. Chim. Acta 2006, 562, 236–244. [Google Scholar] [CrossRef] [Scilit]
- Wang, C.; Gao, Y.; Qiu, X.; Nie, L.; Liu, Y.; Zhou, R.; Wang, H.; Xiong, S. A Rapid and interference-resistant formaldehyde detection method based on surface-enhanced Raman spectroscopy with a reaction-induced self-amplification strategy. Chemosensors 2024, 12, 132. [Google Scholar] [CrossRef] [Scilit]
- Zhang, Y.; Yu, Y.; Zhang, C.; Song, N.; Guo, Z.; Liang, M. Highly sensitive and selective detection of formaldehyde via bio-electrocatalysis over aldehyde dehydrogenase. Anal. Chem. 2022, 94, 15827–15831. [Google Scholar] [CrossRef] [Scilit]
- Sun, X.; Zhang, H.; Hao, S.; Zhai, J.; Dong, S. A self-powered biosensor with a flake electrochromic display for electrochemical and colorimetric formaldehyde detection. ACS Sens. 2019, 4, 2631–2637. [Google Scholar] [CrossRef] [Scilit]
- Marzuki, N.I.; Bakar, F.A.; Salleh, A.B.; Heng, L.Y.; Yusof, N.A.; Siddiquee, S. Development of Electrochemical biosensor for formaldehyde determination based on immobilized enzyme. Int. J. Electrochem. Sci. 2012, 7, 6070–6083. [Google Scholar] [CrossRef] [Scilit]
- Yuan, Z.; Yang, C.; Meng, F. Strategies for improving the sensing Performance of semiconductor gas sensors for high-performance formaldehyde detection: A review. Chemosensors 2021, 9, 179. [Google Scholar] [CrossRef] [Scilit]
- Min, Y.; Yuan, C.; Fu, D.; Liu, J. Formaldehyde gas sensors fabricated with polymer-based materials: A review. Chemosensors 2023, 11, 134. [Google Scholar] [CrossRef] [Scilit]
- Vlasenko, A.; Macdonald, A.M.; Sjostedt, S.J.; Abbatt, J.P.D. Formaldehyde measurements by Proton transfer reaction—Mass Spectrometry (PTR-MS): Correction for humidity effects. Atmos. Meas. Tech. 2010, 3, 1055–1062. [Google Scholar] [CrossRef] [Scilit]
- Thepchuay, Y.; Chairit, W.; Saengsane, N.; Porrawatkul, P.; Pimsen, R. Simple and green colorimetric method for the detection of formaldehyde in vegetable samples. J. Food Compos. Anal. 2022, 111, 104623. [Google Scholar] [CrossRef] [Scilit]
- Arsawiset, S.; Teepoo, S. Ready-to-use, functionalized paper test strip used with a smartphone for the simultaneous on-site detection of free chlorine, hydrogen sulfide and formaldehyde in wastewater. Anal. Chim. Acta 2020, 1118, 63–72. [Google Scholar] [CrossRef] [Scilit]
- Barakoti, K.K.; Subedi, P.; Chalyavi, F.; Gutierrez-Portocarrero, S.; Tucker, M.J.; Alpuche-Aviles, M.A. Formaldehyde analysis in non-aqueous methanol solutions by infrared spectroscopy and electrospray ionization. Front. Chem. 2021, 9, 678112. [Google Scholar] [CrossRef] [Scilit]
- Gaca-Zajac, K.Z.; Smith, B.R.; Nordon, A.; Fletcher, A.J.; Johnston, K.; Sefcik, J. Investigation of IR and Raman spectra of species present in formaldehyde-water-methanol systems. Vib. Spectrosc. 2018, 97, 44–54. [Google Scholar] [CrossRef] [Scilit]
- Winkelman, J.G.M.; Voorwinde, O.K.; Ottens, M.; Beenackers, A.A.C.M.; Janssen, L.P.B.M. Kinetics and Chemical Equilibrium of the Hydration of Formaldehyde. Chem. Eng. Sci. 2002, 57, 4067–4076. [Google Scholar] [CrossRef] [Scilit]
- Gaca, K.Z.; Parkinson, J.A.; Lue, L.; Sefcik, J. Equilibrium speciation in moderately concentrated formaldehyde-methanol-water solutions investigated using 13C and 1H nuclear magnetic resonance spectroscopy. Ind. Eng. Chem. Res. 2014, 53, 9262–9271. [Google Scholar] [CrossRef] [Scilit]
- Johnson, R.A.; Stanley, A.E. GC/MS and FT-IR Spectra of Methoxymethanol. Appl. Spectrosc. 1991, 45, 218–222. [Google Scholar] [CrossRef] [Scilit]
- Lyczko, J.; Beach, D.G.; Gabryelski, W. Commercial formaldehyde standard for mass calibration in mass spectrometry. J. Mass Spectrom. 2015, 50, 463–469. [Google Scholar] [CrossRef] [Scilit]
- Li, S.; Gao, X.; He, X.; Li, J. Detection of toluene, methanol and formaldehyde using corona discharge ion mobility spectrometry. Anal. Lett. 2012, 45, 841–849. [Google Scholar] [CrossRef] [Scilit]
- Ilbeigi, V.; Valadbeigi, Y.; Zvaríková, M.; Fedor, P.; Matejčík, Š. Rapid detection of volatile organic compounds emitted from plants by multicapillary column-ion mobility spectrometry. Anal. Method 2025, 17, 485–492. [Google Scholar] [CrossRef] [Scilit] [PubMed]
- Giménez-Campillo, C.; Campillo, N.; Arroyo-Manzanares, N.; Viñas, P. Ion mobility spectrometry for the monitoring of volatile biomarkers: A review of clinical applications. TrAC Trend Anal. Chem. 2025, 184, 118138. [Google Scholar] [CrossRef] [Scilit]
- Obee, T.N.; Piech, M.; Mantese, J.V.; Dardona, S. Effect of water vapor and formaldehyde detection with differential mobility spectrometry. Int. J. Ion Mobil. Spec. 2012, 15, 131–139. [Google Scholar] [CrossRef] [Scilit]
- Mayer, T.; Borsdorf, H. Accuracy of ion mobility measurements dependent on the influence of humidity. Anal. Chem. 2014, 86, 5069–5076. [Google Scholar] [CrossRef] [Scilit] [PubMed]
- Sabo, M.; Matejčík, Š. Corona discharge ion mobility spectrometry with orthogonal acceleration time of flight mass spectrometry for monitoring of volatile organic compounds. Anal. Chem. 2012, 84, 5327–5334. [Google Scholar] [CrossRef] [Scilit]
- Valadbeigi, Y.; Ilbeigi, V.; Michalczuk, B.; Sabo, M.; Matejcik, Š. Study of atmospheric pressure chemical ionization mechanism in corona discharge ion source with and without NH3 dopant by ion mobility spectrometry combined with mass spectrometry: A theoretical and experimental study. J. Phys. Chem. A 2019, 123, 313–322. [Google Scholar] [CrossRef] [Scilit] [PubMed]
- Frisch, M.J.; Trucks, G.W.; Schlegel, H.B.; Scuseria, G.E.; Robb, M.A.; Cheeseman, J.R.; Scalmani, G.; Barone, V.; Petersson, G.A.; Nakatsuji, H.; et al. Gaussian 16, Revision C.01; Gaussian, Inc.: Wallingford, CT, USA, 2016. [Google Scholar]
- Valadbeigi, Y.; Causon, T. Significance of competitive reactions in an atmospheric pressure chemical ionization ion source: Effect of solvent. J. Am. Soc. Mass Spectrom. 2022, 33, 961–973. [Google Scholar] [CrossRef] [Scilit] [PubMed]
- Li, Y.; Jin, H.; Sun, G.; Zhang, B.; Luo, N.; Lin, L.; Bala, H.; Cao, J.; Zhang, Z.; Wang, Y. Synthesis of novel porous ZnO octahedrons and their improved UV-light activated formaldehyde-sensing performance by Au decoration. Phys. E Low Dimens. Syst. Nanostruct. 2019, 106, 40–44. [Google Scholar] [CrossRef] [Scilit]
- Mäkinen, M.; Sillanpää, M.; Viitanen, A.K.; Knap, A.; Mäkelä, J.M.; Puton, J. The effect of humidity on sensitivity of amine detection in ion mobility spectrometry. Talanta 2011, 84, 116–121. [Google Scholar] [CrossRef] [Scilit]
- Wolańska, I.; Piwowarski, K.; Budzyńska, E.; Puton, J. Effect of humidity on the mobilities of small ions in ion mobility spectrometry. Anal. Chem. 2023, 95, 8505–8511. [Google Scholar] [CrossRef] [Scilit]
- Borsdorf, H.; Fiedler, P.; Mayer, T. The effect of humidity on gas sensing with ion mobility spectrometry. Sens. Actuators B Chem. 2015, 218, 184–190. [Google Scholar] [CrossRef] [Scilit]
- Izadi, Z.; Tabrizchi, M.; Borsdorf, H.; Farrokhpour, H. Humidity Effect on the Drift Times of the Reactant Ions in Ion Mobility Spectrometry. Anal. Chem. 2019, 91, 15932–15940. [Google Scholar] [CrossRef] [Scilit]
- Ilbeigi, V.; Valadbeigi, Y.; Slováková, L.; Matejčík, Š. Solid phase microextraction–multicapillary column–ion mobility spectrometry (SPME–MCC–IMS) for detection of methyl salicylate in tomato leaves. J. Agric. Food Chem. 2022, 70, 15593–15601. [Google Scholar] [CrossRef] [Scilit]
- Bouchoux, G.; Leblanc, D. Gas-phase basicity of formaldehyde by the thermokinetic method. Eur. J. Mass Spectrom. 2000, 6, 443. [Google Scholar] [CrossRef] [Scilit]
- Hunter, E.P.; Lias, S.G. Evaluated Gas Phase Basicities and Proton Affinities of Molecules: An Update. J. Phys. Chem. Ref. Data 1998, 27, 413–656. [Google Scholar] [CrossRef] [Scilit]
Disclaimer/Publisher’s Note: The statements, opinions and data contained in all publications are solely those of the individual author(s) and contributor(s) and not of MDPI and/or the editor(s). MDPI and/or the editor(s) disclaim responsibility for any injury to people or property resulting from any ideas, methods, instructions or products referred to in the content. |
© 2026 by the authors. Licensee MDPI, Basel, Switzerland. This article is an open access article distributed under the terms and conditions of the Creative Commons Attribution (CC BY) license.