


Abstract
Raman spectroscopy is a valuable tool for characterizing biological samples, as it provides molecular information without labeling. To overcome its intrinsically weak intensity, surface-enhanced Raman spectroscopy (SERS) chips have been developed, greatly amplifying the intensity thanks to a plasmon resonance with a metallic surface. At the same time, multimodal characterization is now being actively pursued to better capture the complexity inherent in biological samples. This study presents a SERS gold substrate compatible with atomic force microscopy (AFM) and designed for use with a 785 nm excitation laser to minimize biological sample fluorescence. The study of the magnetron sputtering process revealed that increasing the chamber working pressure led to an increase in surface grain height. It was also found that the average lateral diameter of these surface grains could be finely tuned by controlling the deposition rate and film thickness through varying applied currents, with the former playing a dominant role. Under optimized conditions, surface grains with the desired lateral dimensions (mean diameter 20 ± 2 nm) were obtained, allowing the formation of SERS hot spots with an enhancement factor on the order of 104. At the same time, the substrate’s low roughness ensures that it does not interfere with the AFM characterization of nano-objects deposited on its surface. Thus, it is possible to obtain topographical and chemical (SERS) information from a single sample deposited on the biochip. The substrate was further evaluated using extracellular vesicles, wherein an enhancement of the Raman signal was observed following their deposition. These findings demonstrate the development of an efficient SERS-AFM platform, well suited for biological analysis.
1. Introduction
Raman spectroscopy is a label-free optical characterization method that provides a specific molecular signature based on the vibrations of chemical bonds. It is an effective tool for analyzing the biochemical composition of biological samples, offering precise information on proteins, nucleic acids, lipids, and other biomolecules [1]. Conventional Raman spectroscopy, also called spontaneous Raman spectroscopy, has several significant limitations, mainly due to the very low probability of inelastic scattering of photons. Indeed, only one photon out of 106 to 108 undergoes Raman scattering [2], which makes the Raman signal very weak, i.e., multiple orders of magnitude below fluorescence intensity. This low efficiency typically necessitates prolonged acquisition times to achieve an acceptable signal-to-noise ratio, which restricts the investigation of fast dynamic processes [3] and poses challenges when only a limited quantity of material is available for analysis. To compensate for this weakness, increasing the laser power is often used, but this can cause local heating, or even degradation or chemical modification of the samples, especially in the case of fragile biological systems. Moreover, the Raman signal can easily be masked by background fluorescence, which is much more intense, sometimes making the identification of vibrational bands difficult [4]. The detection of molecules present at very low concentrations also remains complex, because their signal is drowned in the background noise or dominated by that of the majority species. To overcome these limitations, amplified techniques such as surface-enhanced Raman spectroscopy (SERS) have been developed to significantly increase signal intensity and improve sensitivity [2]. The signal amplification arises mainly from the electromagnetic effect caused by the excitation of surface plasmons, which enhance the local electric field near the metal surface [5]. It is complemented by the chemical effect produced by charge transfer or electronic interactions between the molecule and the surface, thereby modifying the molecular polarization [6].
In the biomedical field, the use of SERS in the form of an analysis chip enables biological diagnosis to be miniaturized and automated. These chips integrate metallic nanostructures into microfluidic circuits to analyze complex samples in an ultra-rapid manner [7]. Thanks to their unique spectral signatures, these chips can detect a wide range of targets, including nucleic acids (DNA, RNA, micro-RNA), for genetic diagnosis [8], as well as pathogens such as viruses (hepatitis B, dengue, influenza) [9]. Moreover, they facilitate the identification of disease markers, in particular cancer biomarkers such as prostate-specific antigen (PSA) and carcinoembryonic antigen (CEA), while also enabling the monitoring of the intracellular environment by measuring parameters such as pH and redox potential [10]. This technology is also very effective for the study of extracellular vesicles (EVs), which range from 50 nm to several hundred nanometers and serve as a means of intercellular communication [11]. Because EVs reflect the physio-pathological status of their producing cell, they are emerging as promising diagnostic and therapeutic tools [12]. SERS stands out as a label-free method to obtain the chemical composition of the membranes or of molecular cargo without the need for pre-analytical labeling [13]. SERS substrates mainly use noble metals such as silver (Ag), which provides the highest enhancement but is sensitive to oxidation [14], and gold (Au), which is preferred for biological applications due to its high chemical stability and biocompatibility [15]. Other materials are also used, such as copper, which is a cost-effective alternative but it oxidizes easily [16], while aluminum is particularly interesting for SERS in the UV range [17], allowing the analysis of proteins or amino acids that absorb in this wavelength range. The current trend in analysis of biological samples is to develop multimodal analyses in order to better capture their complexity. Coupling multiple techniques makes it possible to obtain both structural and molecular information, thereby outperforming single-modality approaches for small biological objects, as highlighted in recent work on the characterization of EVs [18].
Manufacturing methods for SERS chips can be classified according to their level of morphological control, cost, and reproducibility. This is essential for generating “hot spots”, i.e., localized regions of strongly enhanced electromagnetic fields that substantially amplify the Raman signal. Bottom-up approaches, such as colloidal synthesis, rely on the chemical reduction of metal precursors (AgNO3 or HAuCl4) using reducing agents such as sodium citrate, NaBH4, or ascorbate. This makes it possible to obtain simple and inexpensive nanoparticles with a high amplification factor, but they present limitations in terms of stability and reproducibility [19]. Top-down lithography techniques, such as electron beam lithography [20] or nanosphere lithography [21], enable precise and reproducible control of periodic structures, but remain costly, while innovative approaches on flexible substrates, including printing and electrospinning, pave the way for disposable sensors with high specific surface area, suitable for field analytical applications. Electrochemical methods consist of roughening electrodes through oxidation–reduction cycles, generating nanostructures by local dissolution and redeposition, which present good integration capability into sensors but more limited morphological control [6]. Physical vapor deposition processes, in particular thermal evaporation forming island-like films according to a Volmer–Weber-type growth mode [22], and cathode sputtering, controlled by parameters such as power, pressure, or angle of incidence, offer excellent reproducibility and high compatibility with microfabrication and integrated biochips [7].
The originality of this work is to present an optimized SERS chip compatible with atomic force microscopy (AFM). Most SERS substrates rely on topographies of a few tens of nanometers [23], but this hinders the imaging of nano-objects of interest deposited on them for analysis, such as EVs. Here, our substrate maintains a sufficiently flat surface so as not to interfere with AFM imaging. This enables the correlated acquisition of topographical information and vibrational signatures via Raman spectroscopy, without the risk of bias arising from the preparation of two separate samples. Furthermore, this reduces the required sample volume, which can be costly to obtain or prepare. The objective was to develop a biocompatible SERS/AFM chip, adapted to near-infrared illumination to decrease the autofluorescence [5], and with a fabrication process that is relatively straightforward to implement. To this end, DC magnetron sputtering, a physical vapor deposition (PVD) method, was employed because it offers exceptionally fine control over film thickness, grain size, and nanoscale surface roughness [24]. These parameters are crucial for engineering the electromagnetic SERS “hot spots” that arise on continuous gold thin films [25]. At the same time, this technique preserves a fabrication process that remains simple, scalable, and highly reproducible.
The second objective of this work was to study the influence of sputtering parameters such as pressure, deposition current, power, and gold thickness on the nanostructure at the surface of the substrate [26]. Indeed, it has been shown in other deposition techniques that deposition parameters strongly affect the morphology of nanostructures, which has a crucial impact on SERS efficiency [7].
2. Methods
2.1. Materials
Pure 99.99% gold metal target (Neyco, Vanves, France) with a diameter of 100 mm and a melting temperature of approximately (Tm ≈ 1064 °C/1337 K) and SF11 glass slides (Verrehaget, Hagetaubin, France) were used. The length of the biochip was 28 mm, the width was 12.5 mm, and the thickness was 0.5 mm. Methylene blue (MB) (Sigma-Aldrich, St. Louis, MO, USA) was prepared at a concentration of 10−5 M by diluting it with deionized pure water.
2.2. EV Isolation
EVs were isolated from two sources: HMEC-1 cells and bovine milk. Human endothelial HMEC-1 cells were originally obtained from Centre for Disease Control and Prevention (Atlanta, GA, USA), and cultured in Endothelial Basal Medium MCDB131, adjusted to pH 7.6 with sodium bicarbonate, and supplemented with 10% heat-inactivated FBS (56 °C, 30 min), L-glutamine (10 mM), penicillin/streptomycin (100 U/mL), gentamicin (500 μg/mL), EGF (10 ng/mL), and hydrocortisone (1 μg/mL). Conditioned culture media were collected and first centrifuged at 3650× g for 10 min at 4 °C to remove any cells and cell debris. The cleared supernatant was then ultracentrifuged to pellet EVs at 10,000× g for 30 min at 4 °C (Optima L-90 K ultracentrifuge and Sw 28.1 Ti rotor or XE-90 ultracentrifuge and Sw 32 Ti rotor, Beckman Coulter, Indianapolis, IN, USA). After removing the supernatants, the EV pellets were resuspended in 1X phosphate-buffered saline (PBS) and another ultracentrifugation was performed (10,000× g for 30 min at 4 °C) to wash the culture medium. The final EV pellet was suspended in 50 μl 1X PBS and stored at −20 °C. The EV concentration was measured at (2.9 ± 0.1) × 1010 particles/mL by nanoparticle tracking analysis (NTA).
The second type of EVs used for testing consisted of bovine milk-derived EVs supplied by Excilone (Elancourt, France). These samples underwent precipitation and were subsequently purified using a size-exclusion chromatography (SEC) column (qEV column, 35 nm pore size, Izon Science, Lyon, France). PBS was used for washing and resuspension. The particle concentration was measured at 1.2 × 10¹³ particles/mL by NTA.
2.3. Cleaning of Glass Substrate
Piranha solution was prepared in a glass beaker by mixing concentrated sulfuric acid (75% H2SO4) with hydrogen peroxide (25% H2O2). The mixture was left to react for two minutes before use. The glass (SF11) slide was immersed in the solution for 3 to 5 min to remove organic material from its surface. After cleaning, the slide was thoroughly rinsed twice with ultrapure water to remove any remaining chemical residues. Finally, it was dried with filtered compressed air and stored in a sterile box to prevent any contamination prior to use.
2.4. Deposition of Gold Atoms by Sputtering
After preparing the SF11 glass substrate, the sample was placed on the sample holder of the DC magnetron sputtering system (MP700S, PLASSYS Bestek, Marolles-en-Hurepoix, France). Once a base pressure of 4 × 10⁻³ mTorr was reached, argon was introduced as the sputtering gas. Gold was deposited directly onto the SF11 glass substrate without an adhesion layer. Gold was selected as the plasmonic material because of its high chemical stability and resistance to oxidation, unlike silver, which degrades under ambient conditions [5]. Multiple sputtering parameters were systematically investigated. For a given film thickness (10 nm) and a given applied current (0.15 A), four working pressures were tested. (4, 7, 16, and 32 mTorr). Then, for a given working pressure (32 mTorr), film thicknesses of 5, 10, and 20 nm were examined, as well as applied currents of 0.15 A and 0.3 A. The film thickness was measured in the chamber during deposition with a quartz crystal microbalance (QCM).
To minimize potential thermal effects, all depositions were performed at room temperature (substrate temperature, Ts ≈ 25 °C/293 K). The deposition rates were 50, 52, 40, and 30 nm/min at a current of 0.15 A for Ar pressures of 4, 7, 16, and 32 mTorr, respectively. At 0.30 A and 32 mTorr, the deposition rate was increased to 70 nm/min. The Ar flow rate was maintained at 50 sccm, and the target–substrate distance was fixed at 9.8 cm with a target–substrate angle of 0°. The substrate remained stationary (no rotation) during deposition. These conditions were kept constant for all experiments.
2.5. Atomic Force Microscopy
2.5.1. Acquisition
Topographical analyses were performed using a Bruker Nanowizard® 4 Bioscience atomic force microscope (Bruker, Billerica, MA, USA) equipped with triangular pyrex-nitride cantilevers with a pyramidal tip (NanoAndMore, Wetzlar, Germany) [12]. The cantilevers exhibited a triangular geometry with a length of 200 μm, a width of 28 μm, and a thickness of 0.5 μm, and were characterized by a resonance frequency of approximately 17 kHz and a nominal force constant of 0.08 N/m. Measurements in air were performed in contact mode with a setpoint in the range of approximately 0.5–1 V. AFM images were acquired from randomly selected regions of the biochip surface, with scan areas ranging from 1 × 1 μm2 to 2 × 2 μm2, a resolution of 512 × 512 pixels, and a line rate of 1.0 Hz, in accordance with previously published protocols [27]. Data analysis was carried out using the JPK Data Processing software (version 6.4). The height channel was selected, and appropriate corrections were applied to remove imaging artifacts.
2.5.2. Image Processing and Data Analysis
AFM images were analyzed to determine the apparent diameter and the height of the gold surface grains. To reduce noise while preserving surface feature morphology, a Gaussian filter was applied to the raw image [28]. A morphological white top-hat operation with a circular structuring element was then used to remove large-scale background variations. The resulting image was further smoothed with a second Gaussian filter to improve grain detection [29].
The apex of each individual surface grain was identified as a local maximum. For each detected apex, four cross-sectional height profiles passing through its center were extracted along the horizontal, vertical, and two diagonal directions. For each direction, the height and radius were determined on both sides of the local maximum. The height was defined as the difference between the local maximum and the nearest local minimum. The radius was defined as the distance between the position of the local maximum and the position at which the height reached the midpoint between the local maximum and minimum. The smoothed profile was used to identify the local minima and maxima, whereas the raw data were used to calculate the heights and radii to avoid artificial broadening caused by the applied filters. Among the eight values of height and radius, outliers were removed using an interquartile range (IQR)-based thresholding procedure. Remaining values were averaged to obtain the height and the radius, and diameter by multiplying by two, of the grain. Based on the distributions of height and diameter of all grains, the smallest 10% of values were discarded to eliminate artifacts that were not grains. The characteristic grain diameter and height for each substrate were finally defined as the median of the distributions.
2.6. Scanning Electron Microscopy
Scanning electron microscopy (SEM) was used to confirm the measurements of the diameters of the gold surface grains, using a Helios NanoLab 600i (FEI, Hillsboro, OR, USA) dual-beam SEM/FIB system [30]. Images were smoothed using a Gaussian filter, then the contrast was enhanced, and the images were segmented using the Otsu threshold method. Grains were separated using a watershed method, and their equivalent diameter was calculated from their surface, assuming a circular shape. As for AFM measurements, the smallest 10% of values were discarded to eliminate artifacts that were not grains.
2.7. Raman Spectroscopy
The Raman microscope used was a home-made setup, assembled from standard optical components, in a backscattering geometry. The main laser source was a 785 nm laser (FPV785M, Thorlabs, Newton, NJ, USA), which is particularly suitable for biological applications because it reduces intrinsic fluorescence [5]. The light was focused onto the sample using a Nikon (Tokyo, Japan) CFI TU Plan Fluor Epi 20x objective (10 mm focal length). The Raman-scattered light from the sample is then transmitted to the Wasatch Photonics (Morrisville, NC, USA) WP 785 XL spectrometer (spectral resolution of 7 cm−1), using a 105 µm optical fiber (M15L01, Thorlabs, Newton, NJ, USA). For each sample, measurements were performed at different points to generate detailed Raman maps, with an exposure time of 2 s for recording a single spectrum and a laser power of 100 mW at the sample. This approach allows the study of the homogeneity and variability of signals across the analyzed surface.
Raman signal processing was carried out in several steps to obtain a usable spectrum free of common artifacts, such as fluorescence background and detector noise. The region of interest, ranging from 400 to 3000 cm−1, was isolated. The background signal was subtracted. Baseline correction, mainly due to fluorescence, was performed using the arPLS algorithm (asymmetrically reweighted penalized least squares) [31]. Acquisitions were averaged over all spectra recorded in the Raman map to reduce statistical noise.
2.8. Raman Characterization Using Methylene Blue
Substrates were characterized by Raman spectroscopy using MB as a probe molecule. An MB stock solution (10−2 M) was prepared and serially diluted with deionized water to yield 10−5 M, 10−6 M or 10−7 M working solutions. A 1 µL aliquot of this working solution was drop-cast onto the substrate surface and allowed to dry under ambient conditions, producing droplets with a radius of 1.0 ± 0.2 mm. All measurements were systematically acquired around the center of the dried MB droplets to prevent coffee-ring artifacts at the perimeter. Consequently, any observed variations in the SERS signal are primarily attributed to differences in gold surface grain morphology, size, and nanoscale surface protrusions, rather than heterogeneous dye distribution.
3. Results and Discussion
3.1. Morphological and Structural Characterization
3.1.1. Influence of Working Pressure
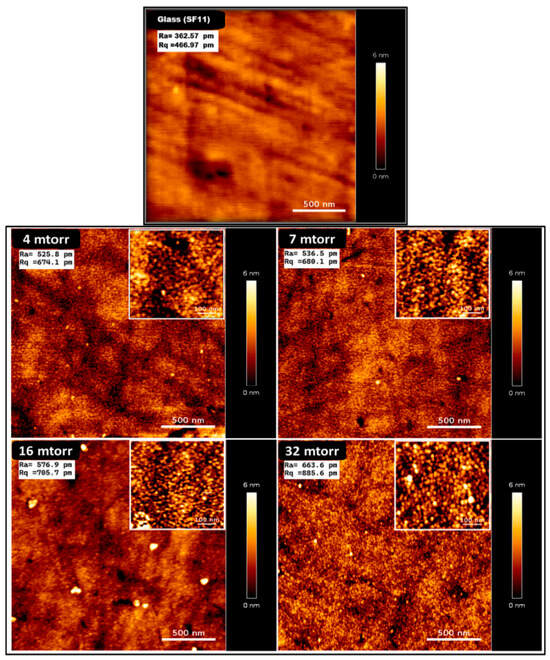
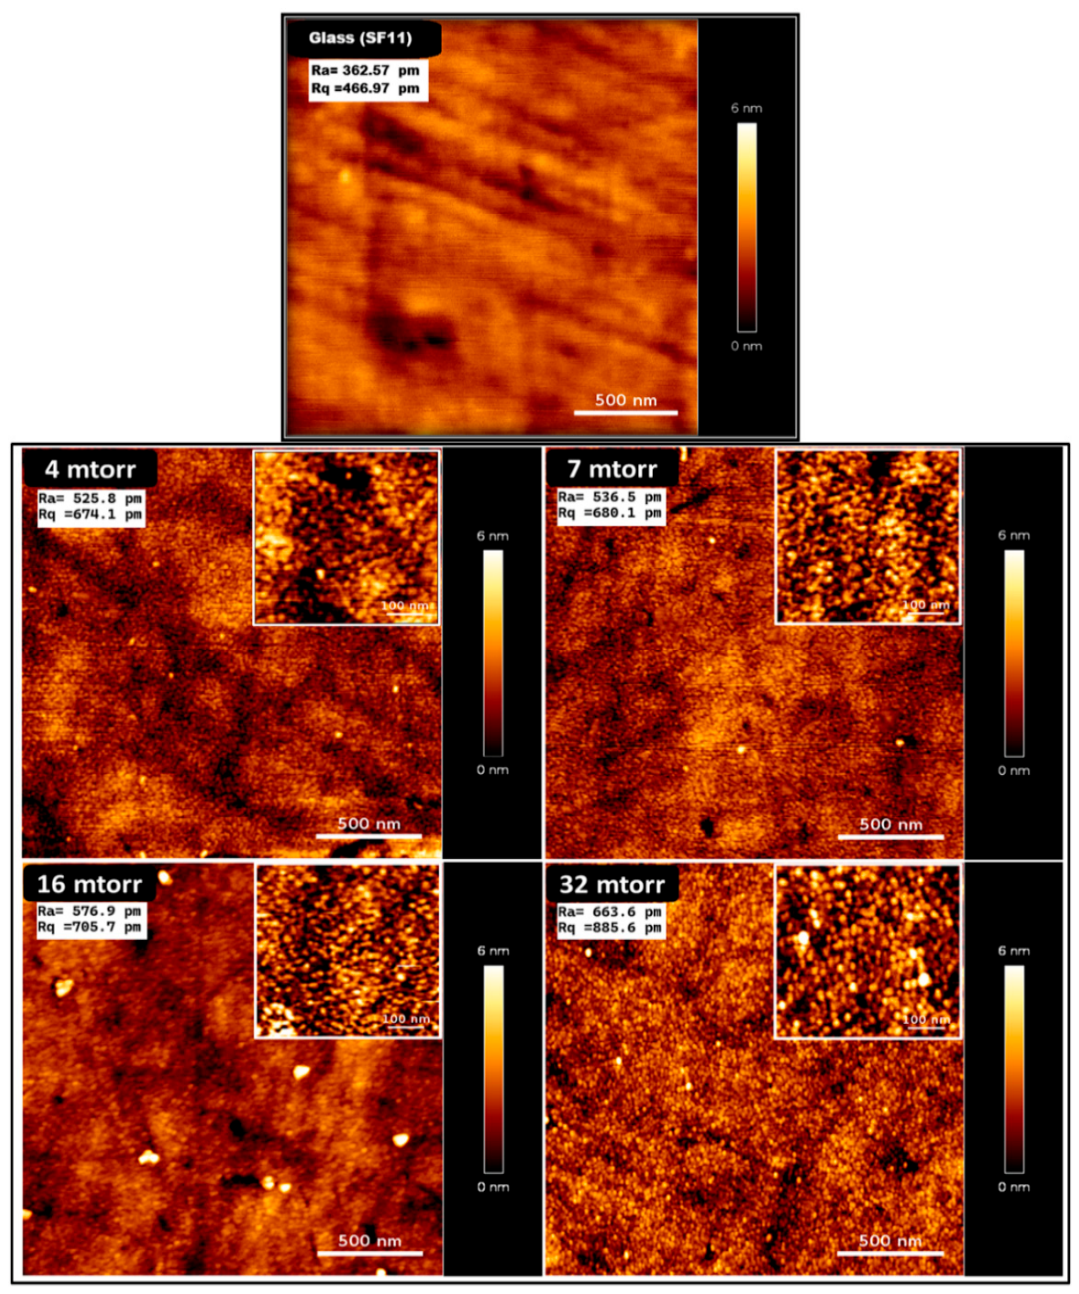
The effect of the working pressure on the deposited thin films was investigated while keeping all other deposition parameters constant. The film thickness as measured by QCM was fixed at 10 nm, and the deposition current was maintained at 0.15 A. Deposition experiments were performed for four different working pressures: 4, 7, 16 and 32 mTorr (higher limit of the sputtering machine was used). Figure 1 shows AFM topographies of gold thin films prepared under various working pressures, highlighting changes in surface grain morphology.
Figure 1.
AFM images of SF11 glass and gold thin films deposited with a current of 0.15 A and a thickness of 10 nm at different working pressures: 4 mTorr, 7 mTorr, 16 mTorr, and 32 mTorr. The corresponding surface roughness parameters, Ra (arithmetic mean roughness) and Rq (root mean square roughness), were used to quantify the surface morphology.
AFM images show that the pressure used during deposition strongly affects how the thin film surface looks. When the pressure increases from 4 to 32 mTorr (while keeping the film thickness the same), the surface becomes grainier and rougher, with more tiny structures appearing. This change is confirmed by the measured roughness values Ra and Rq, which both increase compared to the reference roughness of glass (Figure 1).
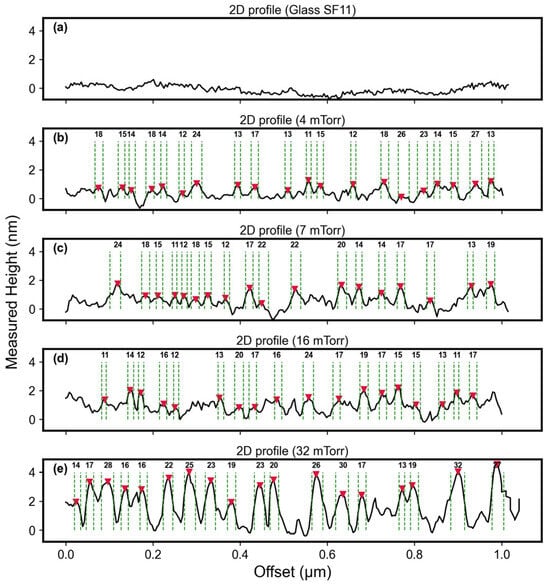
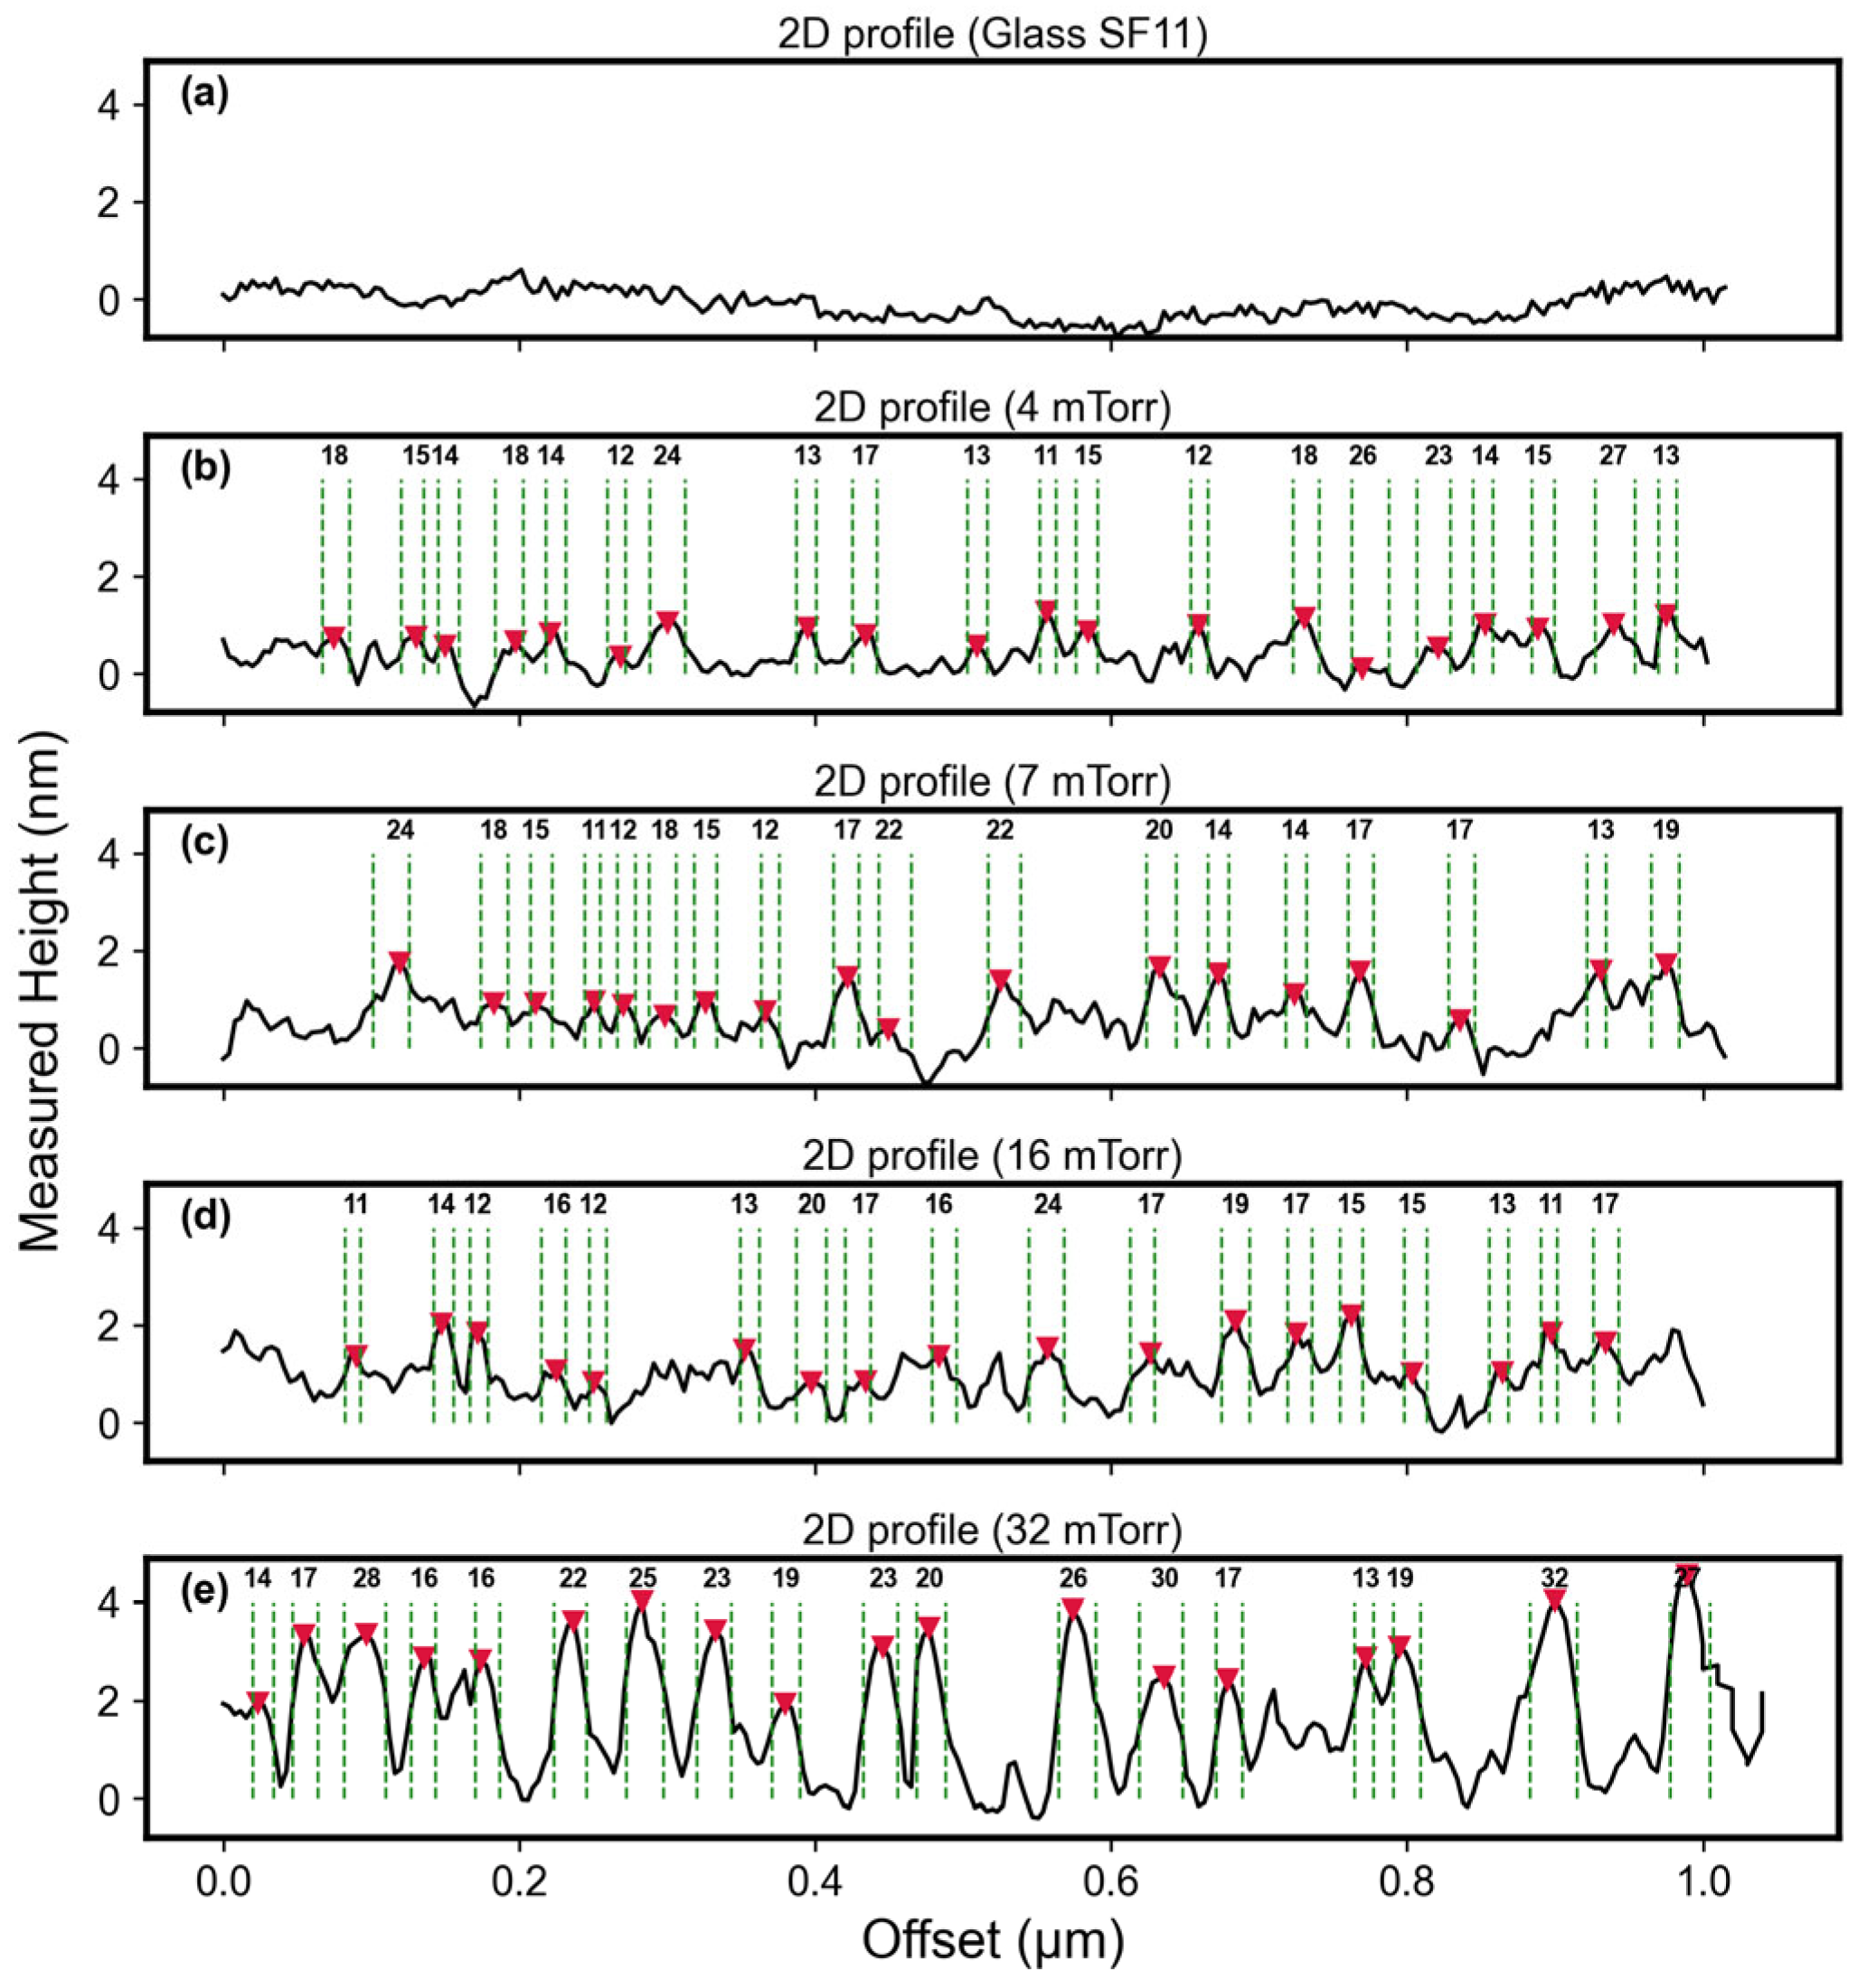
The 2D AFM profiles (Figure 2) further demonstrate the influence of working pressure on surface grain morphology. At 4 mTorr and 7 mTorr, the surface grains exhibit relatively low average heights of 1.2 nm and 2.0 nm, respectively; at 16 mTorr, the particles display a more uniform spatial distribution, accompanied by a slight increase in average height to 1.4 nm. In contrast, at 32 mTorr, the average height rises markedly to 3.5 nm, compared to the reference average height of glass of 0.5 nm, indicating enhanced vertical growth and increased particle aggregation under higher-pressure conditions.
Figure 2.
2D AFM profiles of the SF11 glass substrate (a) and gold surface grains following deposition (0.15 A, 10 nm) under different working pressures: 4 (b), 7 (c), 16 (d), and 32 mTorr (e). Median diameters were measured at half-height relative to the local minima. Red markers indicate areas with detected surface grains used for median diameter measurements.
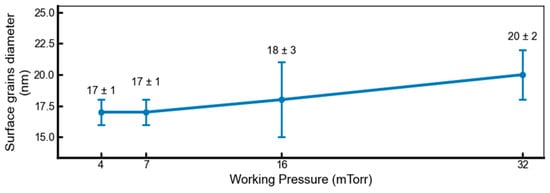
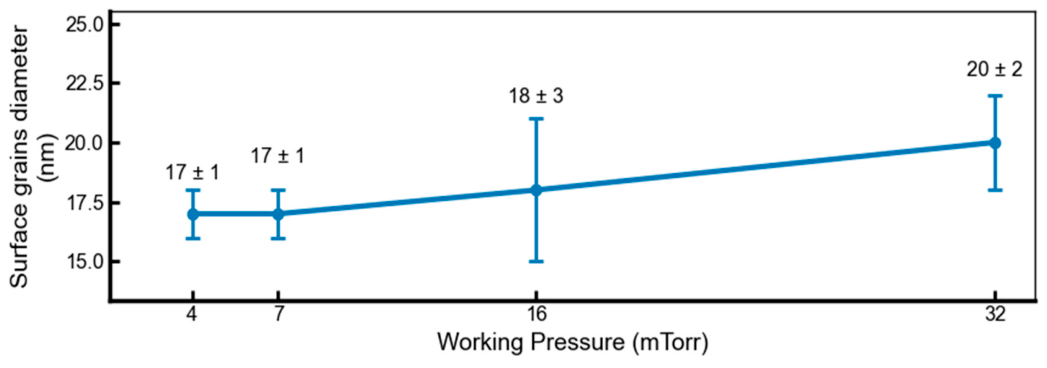
Figure 3 shows the median diameters of the structures, measured at half-height across approximately 104 surface grains for each condition. The diameter distributions remain relatively similar across the different working pressures, although a slight but noticeable shift in the distribution towards larger diameters is observed as the working pressure increases. The grain diameter measurements obtained by AFM were confirmed by SEM for the deposition under a working pressure of 32 mTorr, which also yielded a median diameter of 20 ± 6 nm (Figure S1). Note that the surface grains have a spherical cap geometry, characterized by a lateral diameter that significantly exceeds their height. The low surface roughness, characterized by height variations below 3.5 nm, constitutes a significant advantage for AFM-based analysis of samples deposited on the surface of the chip.
Figure 3.
Surface grain median diameter as a function of deposition pressure. Error bars indicate the standard deviation of median diameters across individual images. Each condition is based on analysis of ~104 particles.
3.1.2. Effect of Applied Current and Film Thickness
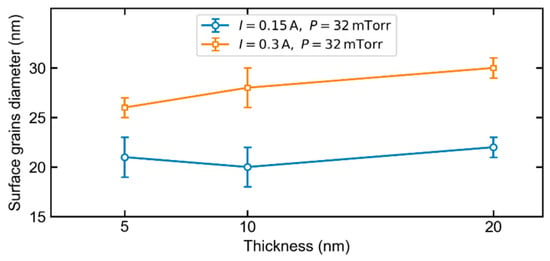
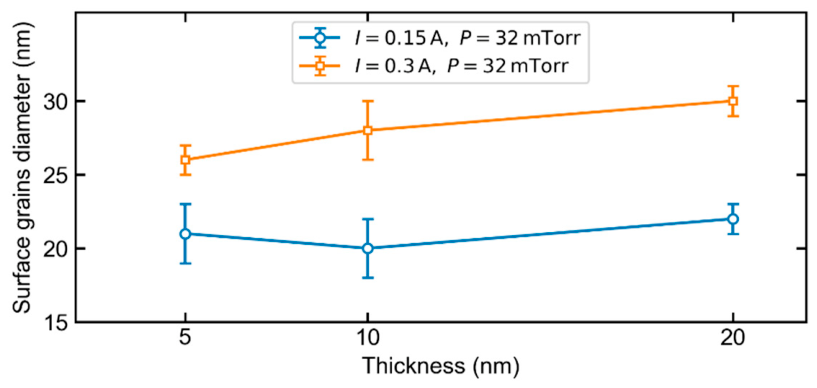
By setting the pressure to 32 mTorr, we then tested two deposition currents, 0.15 A and 0.3 A, for deposited thicknesses of 5, 10, and 20 nm. Figure 4 presents the diameters (median diameters based on the FWHM, on AFM images) of the surface grains obtained for each condition.
Figure 4.
Surface grain diameter for two deposition currents (0.15 A, blue, and 0.3 A, orange) at a working pressure of 32 mTorr, with error bars: standard deviation of median diameters from multiple images.
The applied current emerges as the predominant influencing parameter. For a given film thickness, an increase in current from 0.15 A to 0.30 A yields a marked increase in average surface grain diameter. This can be attributed to the higher applied current, which elevates the sputtering rate and Au atom flux, thereby promoting greater gold adatom accumulation, resulting in larger surface grains, in agreement with previous reports [32]. For example, at a thickness of 10 nm, the median diameters increase from approximately 20 ± 2 nm to 28 ± 2 nm, an increase of about 35%. Under both experimental conditions, an increase in film thickness leads to a progressive growth of surface grains in lateral size. However, the effect of thickness is less significant than that of current.
The error bars in Figure 4 are associated with the standard deviation of median diameters from multiple images. The dispersion remains moderate, indicating a relatively homogeneous surface grain composition in each experimental condition. This homogeneity is particularly important for SERS applications, where surface grain size distribution and spatial arrangement play a critical role in generating plasmonic hot spots. Stringent control over surface grain size is of critical importance, as it directly governs the plasmonic response of the substrate and, consequently, Raman signal enhancement and the overall performance of the substrate.
3.2. SERS Performance and Molecular Detection
3.2.1. Impact of Working Pressure on MB SERS Signal
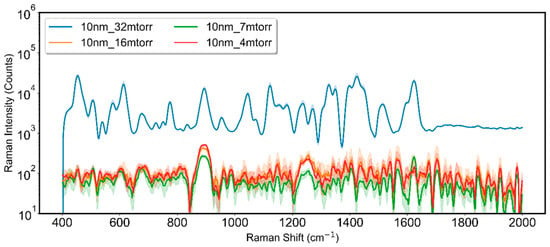
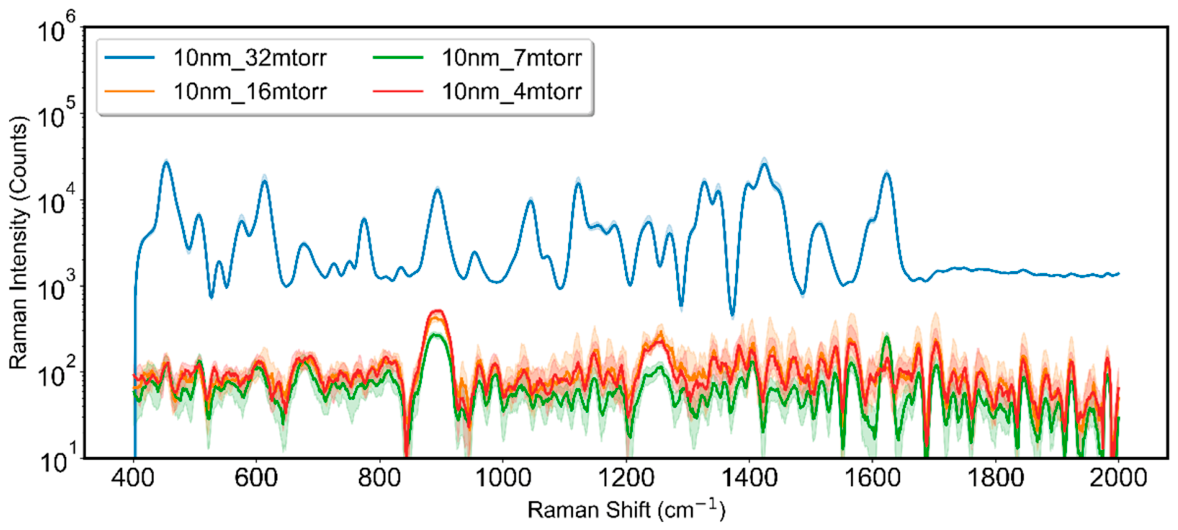
The SERS performance of the gold nanostructured films was then evaluated using MB (10−5 M) as a probe molecule under identical experimental conditions. Figure 5 shows the resulting SERS spectra of MB obtained at different Ar working pressures (4, 7, 16, and 32 mTorr), allowing a direct comparison of how surface grain morphology affects the SERS signal intensity.
Figure 5.
Median Raman spectra of (MB, 10−5 M) recorded on Au substrates deposited at different working pressures (4, 7, 16, and 32 mTorr), with an applied current of 0.15 A and a nominal Au thickness of 10 nm. The intervals represented by the shaded areas correspond to the range between the first and third quartiles.
Among the investigated conditions, a working pressure of 32 mTorr was identified as the optimal parameter, yielding the highest plasmonic activity.
Overall, pressure affects the nucleation of surface grains, increasing their height while its influence on diameter is relatively weak. As previously reported in the literature, pressure significantly impacts the behavior of charged species within the plasma, affecting their role in film growth due to the increased collisions at higher pressure [33,34]. This behavior can be attributed to the effect of working pressure on both the energy and surface mobility of the sputtered Au atoms [34]. At 4 mTorr, the relatively low gas-phase collision frequency allows Au atoms to reach the substrate with comparatively high kinetic energy [35], which enhances their surface diffusion and mobility. Consequently, fewer stable nuclei are formed, leading to a reduced surface roughness (674 pm). In contrast, at 32 mTorr, the increased collision rate in the gas phase induces stronger thermalization of the sputtered Au species, thereby reducing their kinetic energy upon arrival at the substrate. The adatoms exhibit restricted surface mobility and remain predominantly near their initial landing sites. This limited diffusion favors enhanced columnar growth, which is reflected in an increased surface roughness of 885 pm. These observations are in full agreement with Thornton’s structure zone model (SZM). The low homologous temperature (Ts/Tm ≈ 0.22) is characteristic of Thornton’s structure zone 1 [36], where adatom mobility is limited. The model predicts a transition toward more open, columnar microstructures as the working pressure increases and the mobility of the depositing species decreases [37].
In light of these results, an Ar working pressure of 32 mTorr is optimal for producing a nanostructured gold surface rich in active plasmonic sites. At this pressure, the pronounced increase in average surface grain height to 3.5 nm promotes strong electromagnetic field localization and delivers the maximum SERS signal enhancement.
3.2.2. Impact of Current and Film Thickness on MB SERS Signal
For the calculation of the SERS enhancement factor, we selected the Raman peak located between 1614 and 1630 cm−1, corresponding to the conjugated aromatic C–C stretching vibration of MB. This peak was chosen because it is highly intense, well-defined, and minimally affected by interferences from other spectral bands [38], making it particularly reliable for quantifying SERS enhancement.
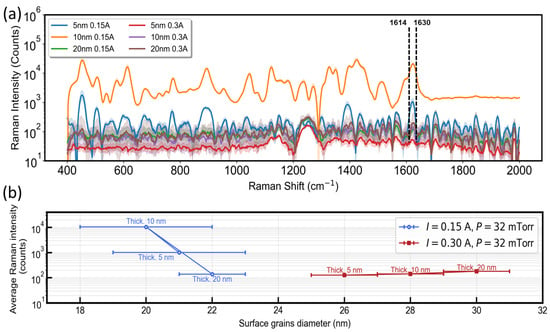
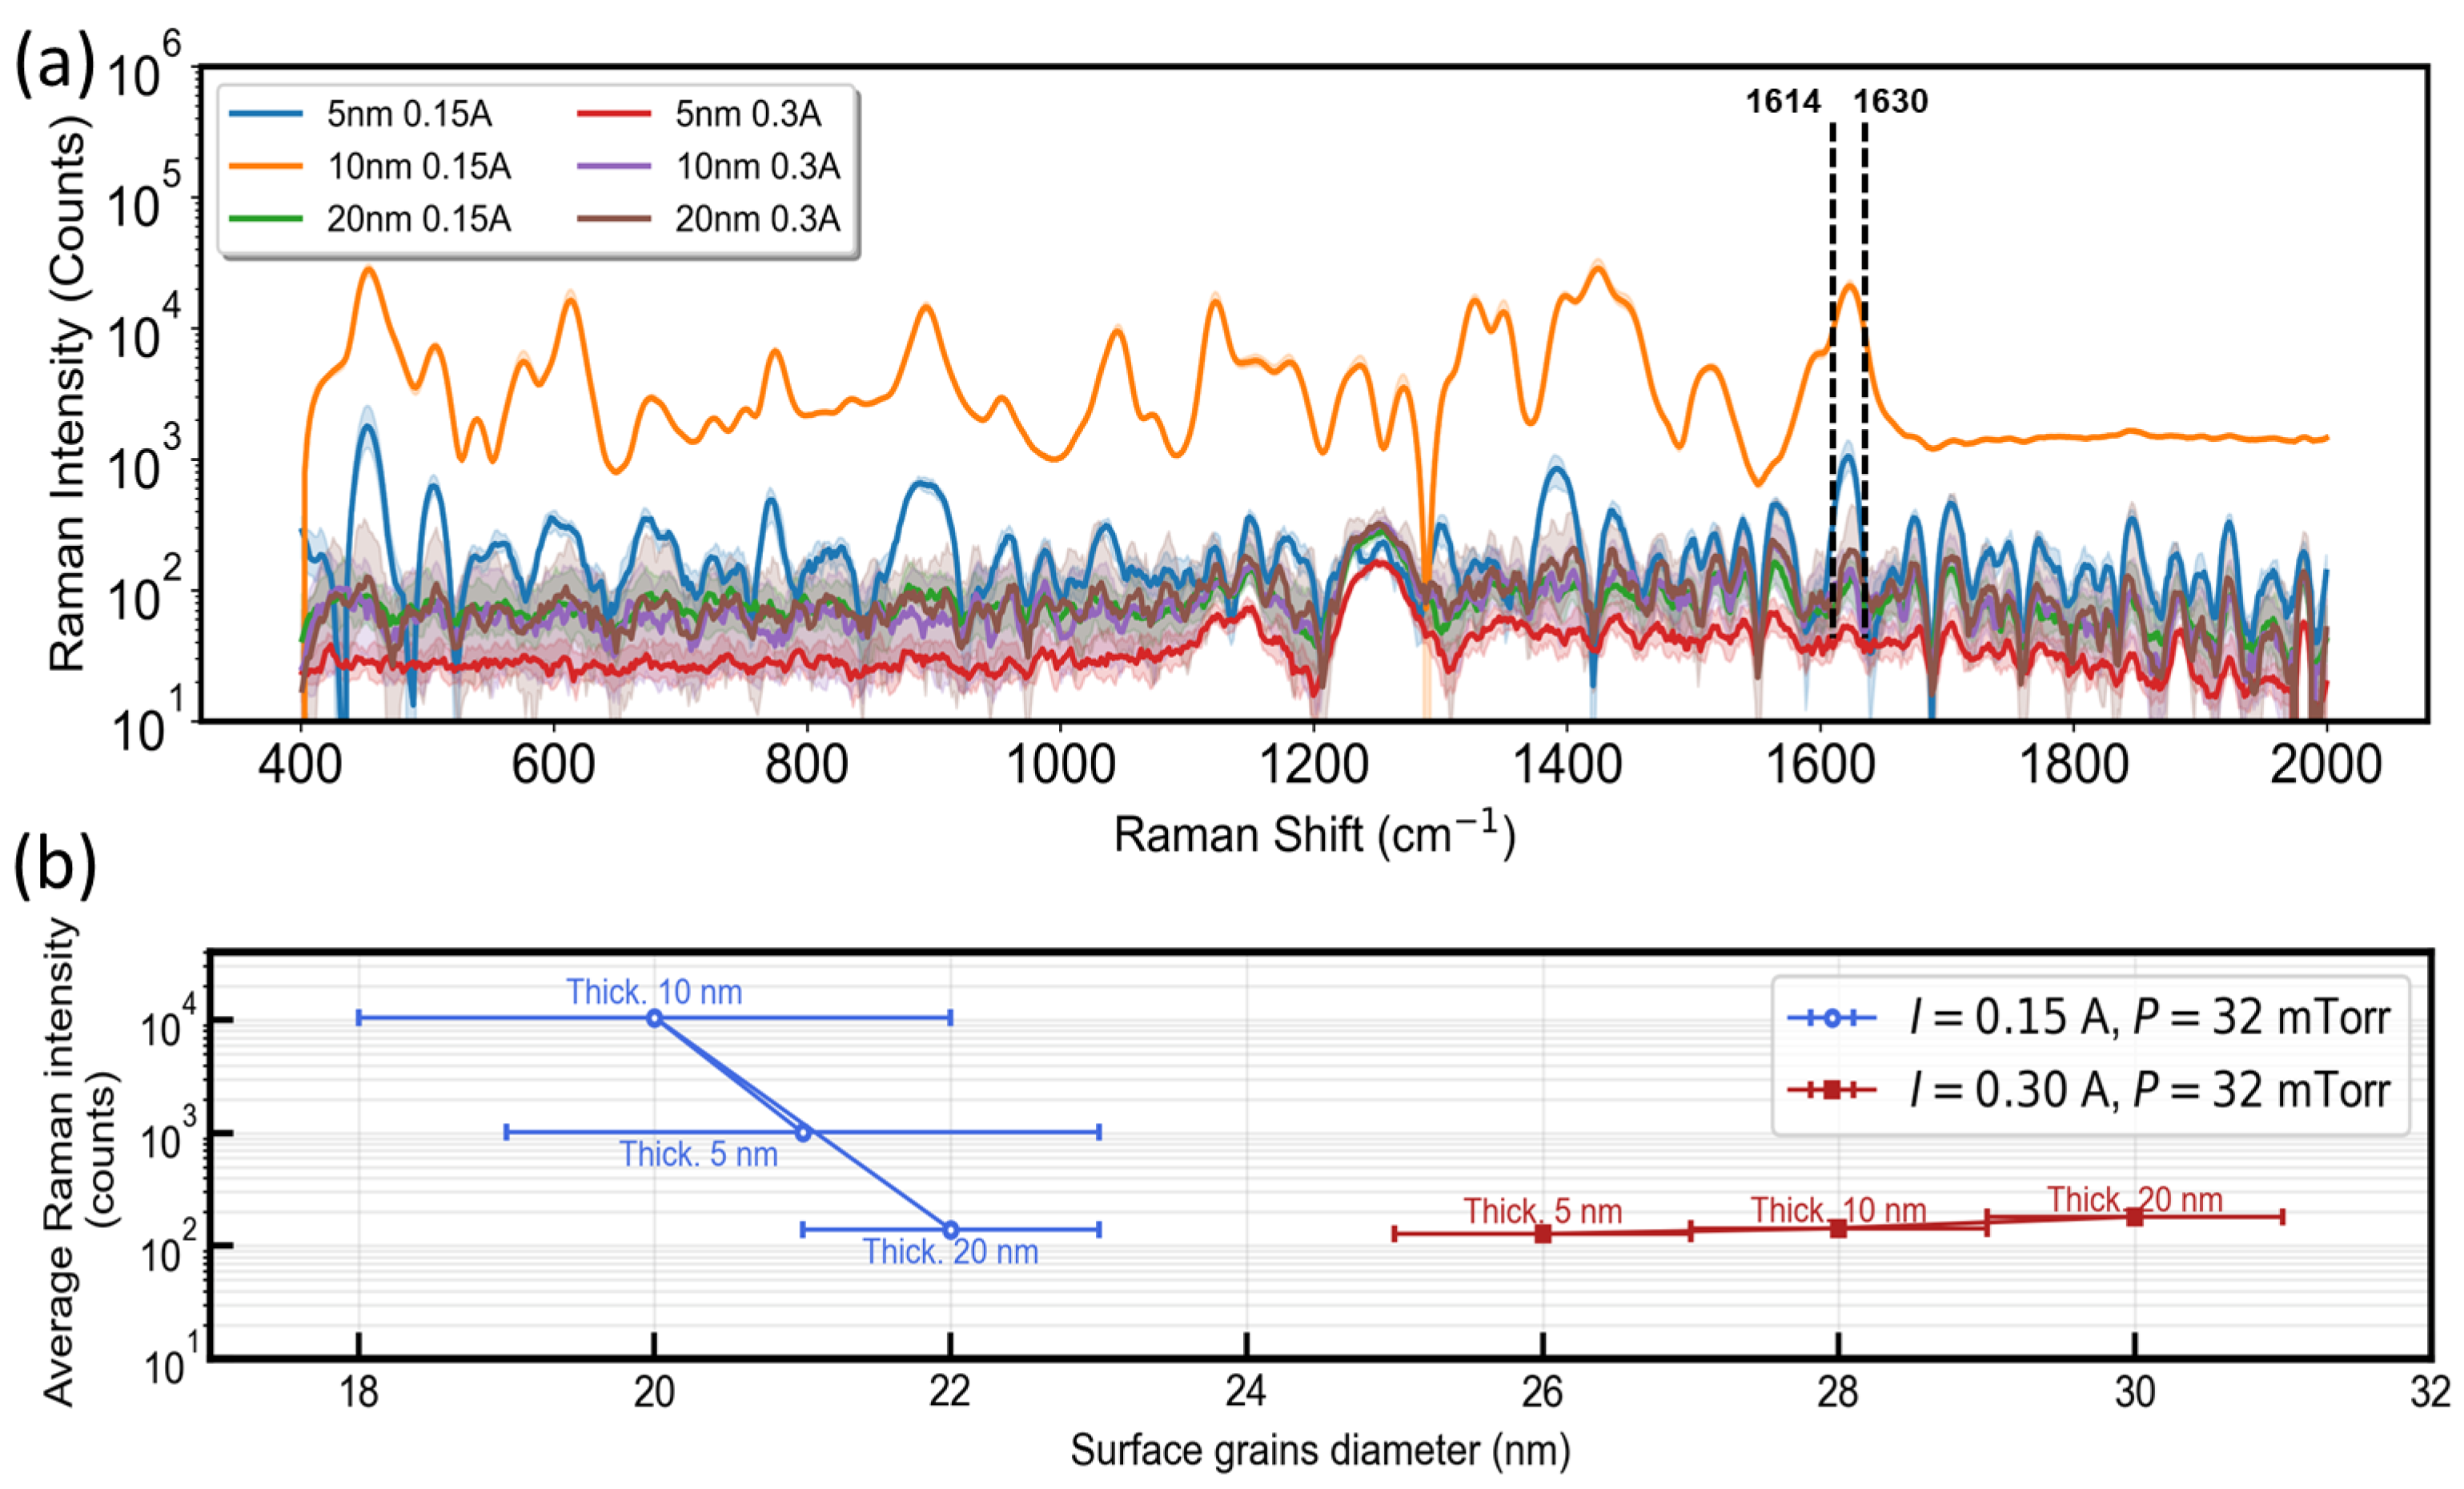
Figure 6a presents the Raman spectra of MB (10−5 M) recorded on the chip following dye deposition, obtained under identical measurement conditions with roughly 100 positions on the chip per spectrum. The samples were prepared using deposition currents of 0.15 A and 0.3 A at film thicknesses of 5, 10, and 20 nm, under a working pressure of 32 mTorr. Under these conditions, the sample deposited at 32 mTorr with a 10 nm film using a deposition current of 0.15 A exhibits the strongest Raman signal at the reference band. Its intensity clearly exceeds that of the samples prepared at 0.3 A, highlighting a significant enhancement of the Raman response for this specific deposition condition.
Figure 6.
(a) Median Raman spectra of MB (10−5 M) recorded on Au substrates deposited at a working pressure of 32 mTorr, using two applied currents (0.15 and 0.3 A) and three nominal Au thicknesses (5, 10, and 20 nm). The intervals represented by the shaded areas correspond to the range between the first and third quartiles. (b) Average SERS intensity of the MB band at 1614–1630 cm−1 as a function of surface grain diameter for both deposition currents at 32 mTorr.
Figure 6b presents the average SERS intensity between 1614 and 1630 cm−1, on a logarithmic scale, as a function of surface grain diameter for the two deposition currents, 0.15 A and 0.3 A, and three deposited thicknesses of 5, 10, and 20 nm, at a constant pressure of 32 mTorr. The analysis of the results shows that the efficiency of the SERS signal is mainly governed by the diameter of the grains, which is controlled by the deposition current and the deposition thickness. The maximum performance (ISERS = 1.7 104 counts) was achieved with surface grains exhibiting a median diameter of 20 ± 2 nm, obtained by a deposited thickness of 10 nm at a low applied current of 0.15 A. Under these conditions, the slow growth rate favors the formation of a granular surface morphology that efficiently generates electromagnetic hot spots.
3.3. Evaluation of SERS Enhancement Factor
The substrate with an average grain diameter of 20 ± 2 nm exhibited high efficiency in SERS-based detection of MB. The Raman spectra clearly revealed the characteristic vibrational bands of MB even at very low concentrations, with a prominent peak in the 1614–1630 cm−1 range.
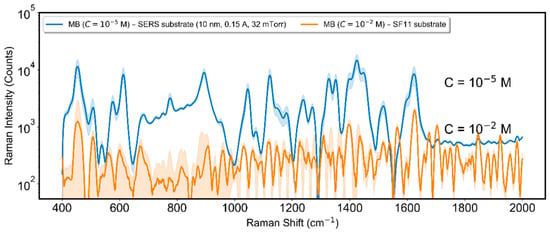
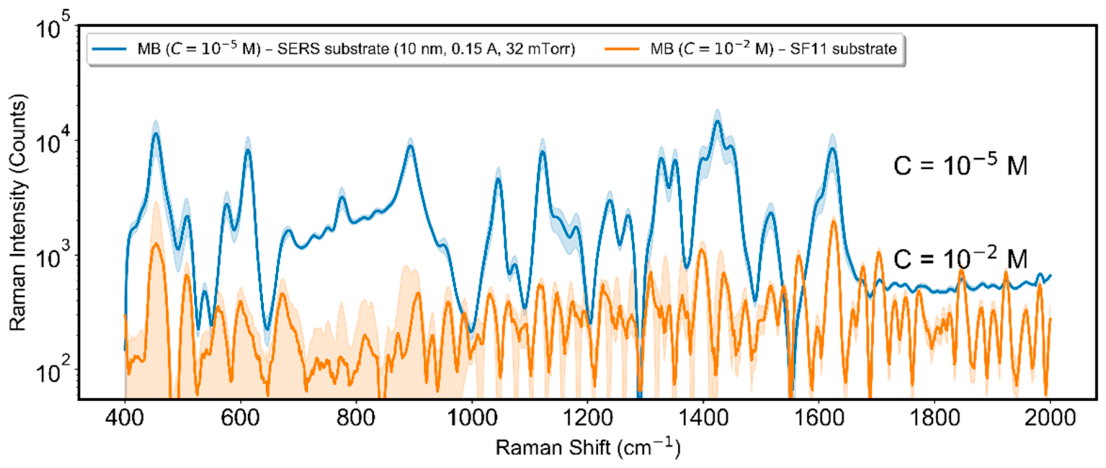
Figure 7 shows a comparison between the conventional median Raman spectrum of an MB solution at 10−2 M deposited on a glass substrate (SF11) and the SERS spectrum of an MB solution at 10−5 M deposited on a gold substrate. The raw Raman spectrum of the empty SERS substrate is shown in Figure S2 in the Supplementary Materials for additional information. As noted in the previous section, the peak in the 1614–1630 cm−1 region was selected as the reference for evaluating SERS performance. On the gold substrate, this peak reached an intensity of 17 ± 3 × 10³. The reproducibility of the SERS response was assessed by recording spectra at 100 points. The enhancement factor (EF) was calculated using:
where ISERS and IRef are the Raman intensities under SERS and non-SERS conditions, respectively, and CSERS and CRef are the corresponding concentrations of MB on the SERS substrate and on the reference substrate. The analyzed substrates demonstrated enhancement factors on the order of (14 ± 8) × 103. To link this enhancement to plasmon resonance, the chip’s transmission absorbance was measured (Figure S3). An absorbance peak, corresponding to the plasmon resonance, is visible at a wavelength of 872 nm. This wavelength is close to the theoretical wavelength that allows for maximum amplification: midway between the excitation wavelength (785 nm in this case) and the Raman emission wavelength (900 nm for the MB peak at 1622 cm−1) [39]. Optimal SERS performance is achieved when the size and morphology of the surface grains are carefully controlled.
Figure 7.
Median of 3 droplets of Raman spectra of MB recorded at 10−5 M on Au substrate (10 nm Au, 0.15 A, 32 mTorr) and at 10−2 M on a reference SF11 substrate. The intervals represented by the shaded areas correspond to the range between the first and third quartiles.
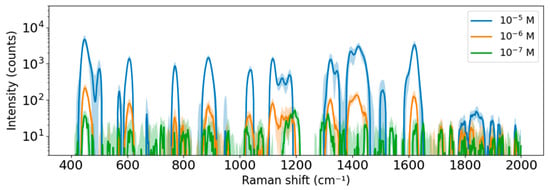
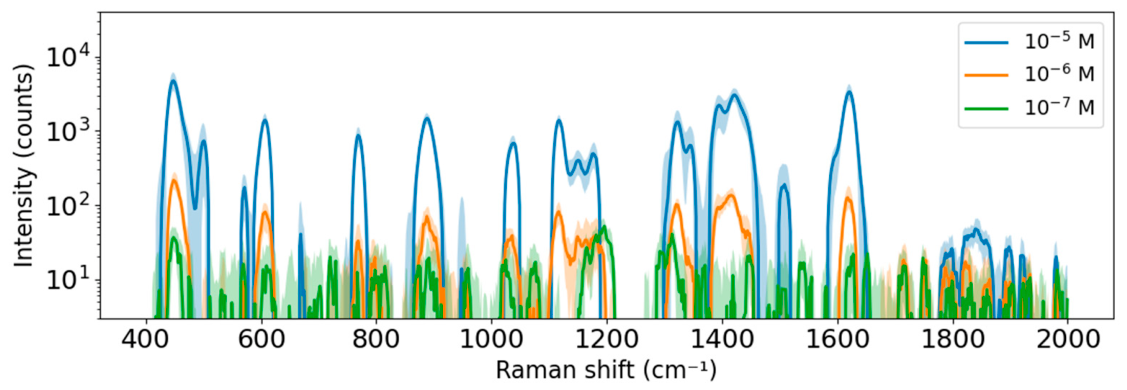
To test the detection limit of the MB on the SERS chip, measurements were performed at concentrations of 10−6 and 10−7 M (Figure 8), under the same exposure time and laser power conditions. All of the peaks are still clearly visible at 10−6 M, but only the most intense ones remain visible at 10−7, such as the one at 446 cm−1. This is because the intensity becomes too low (a few dozen beats) relative to the noise induced by the substrate signal. However, greater sensitivity could be achieved by increasing the exposure time or the laser power.
Figure 8.
Median Raman spectra of MB at different concentrations on the SERS substrate (10 nm Au, 0.15 A, 32 mTorr). The intervals represented by the shaded areas correspond to the range between the first and third quartiles.
3.4. Validation on A Biological Sample (EVs)
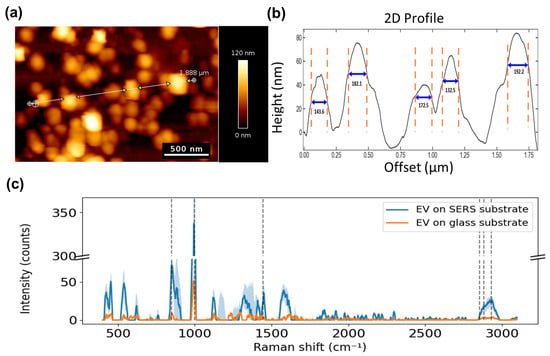
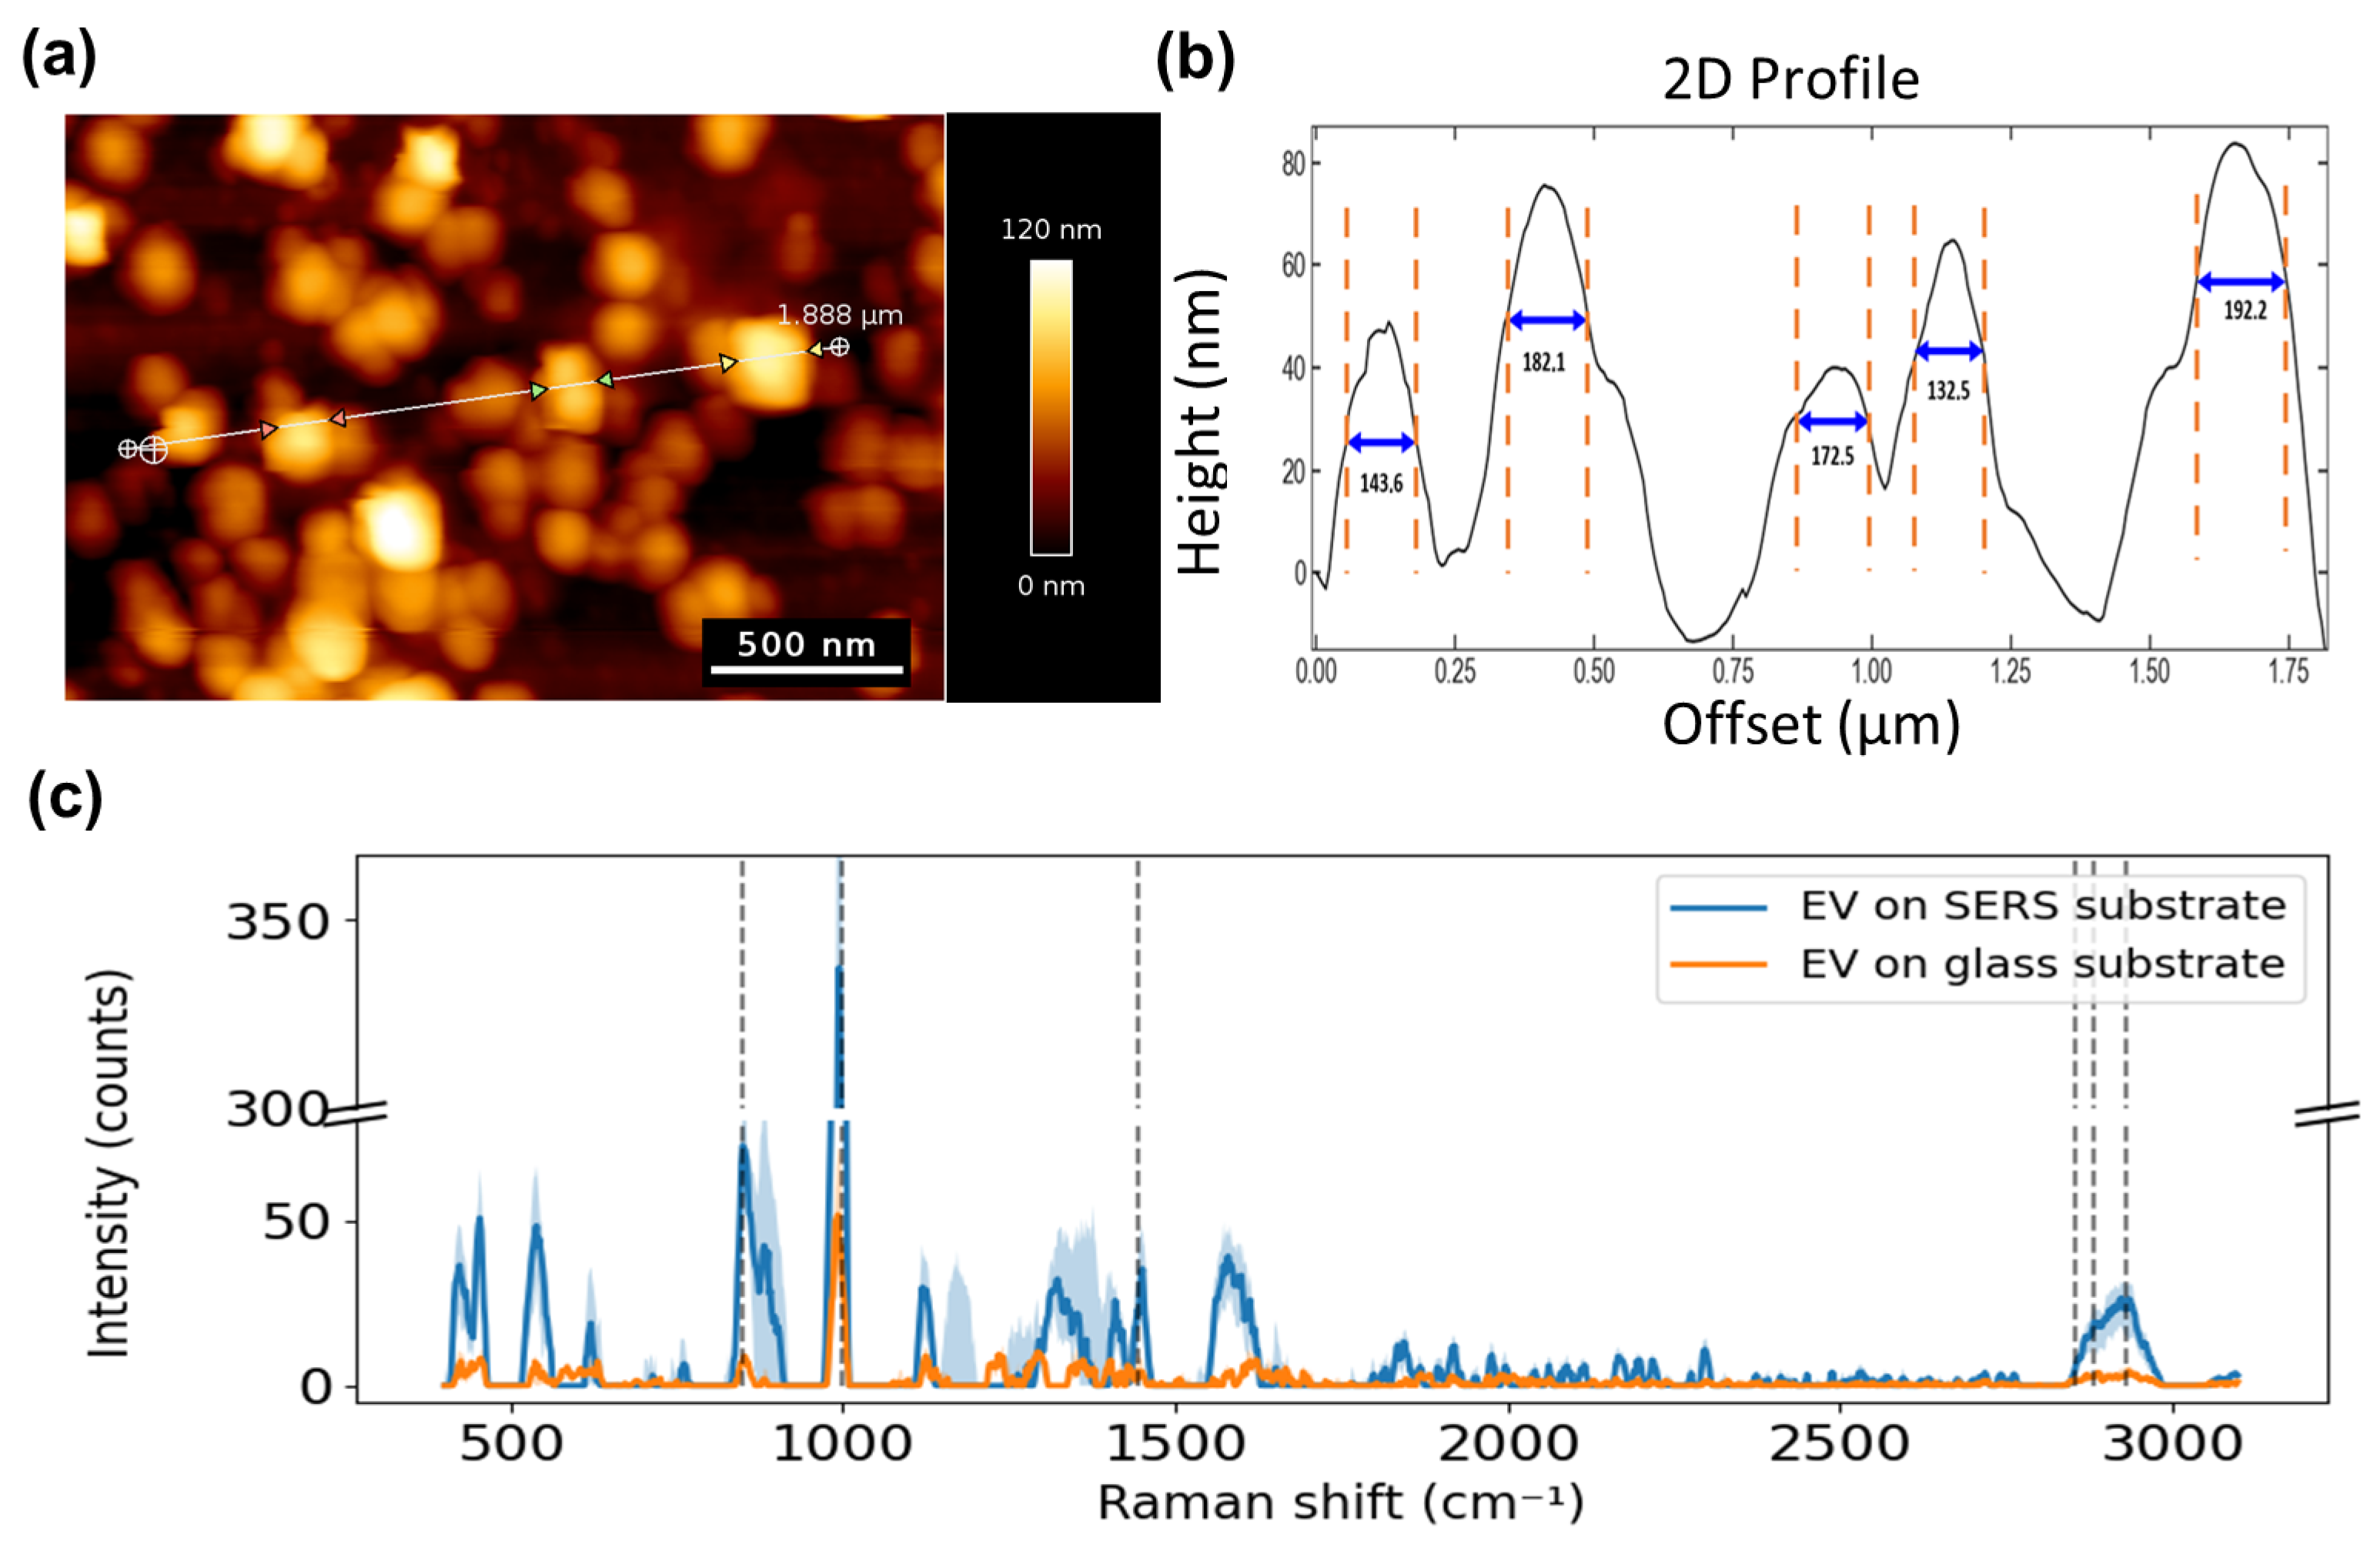
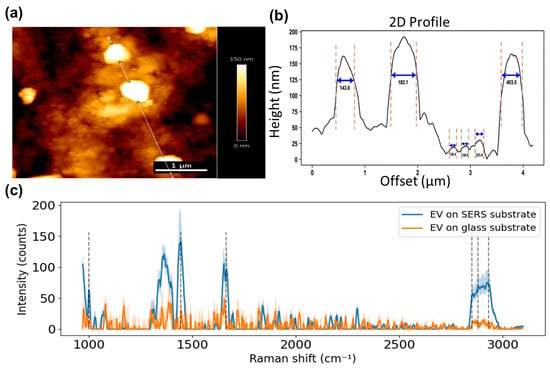
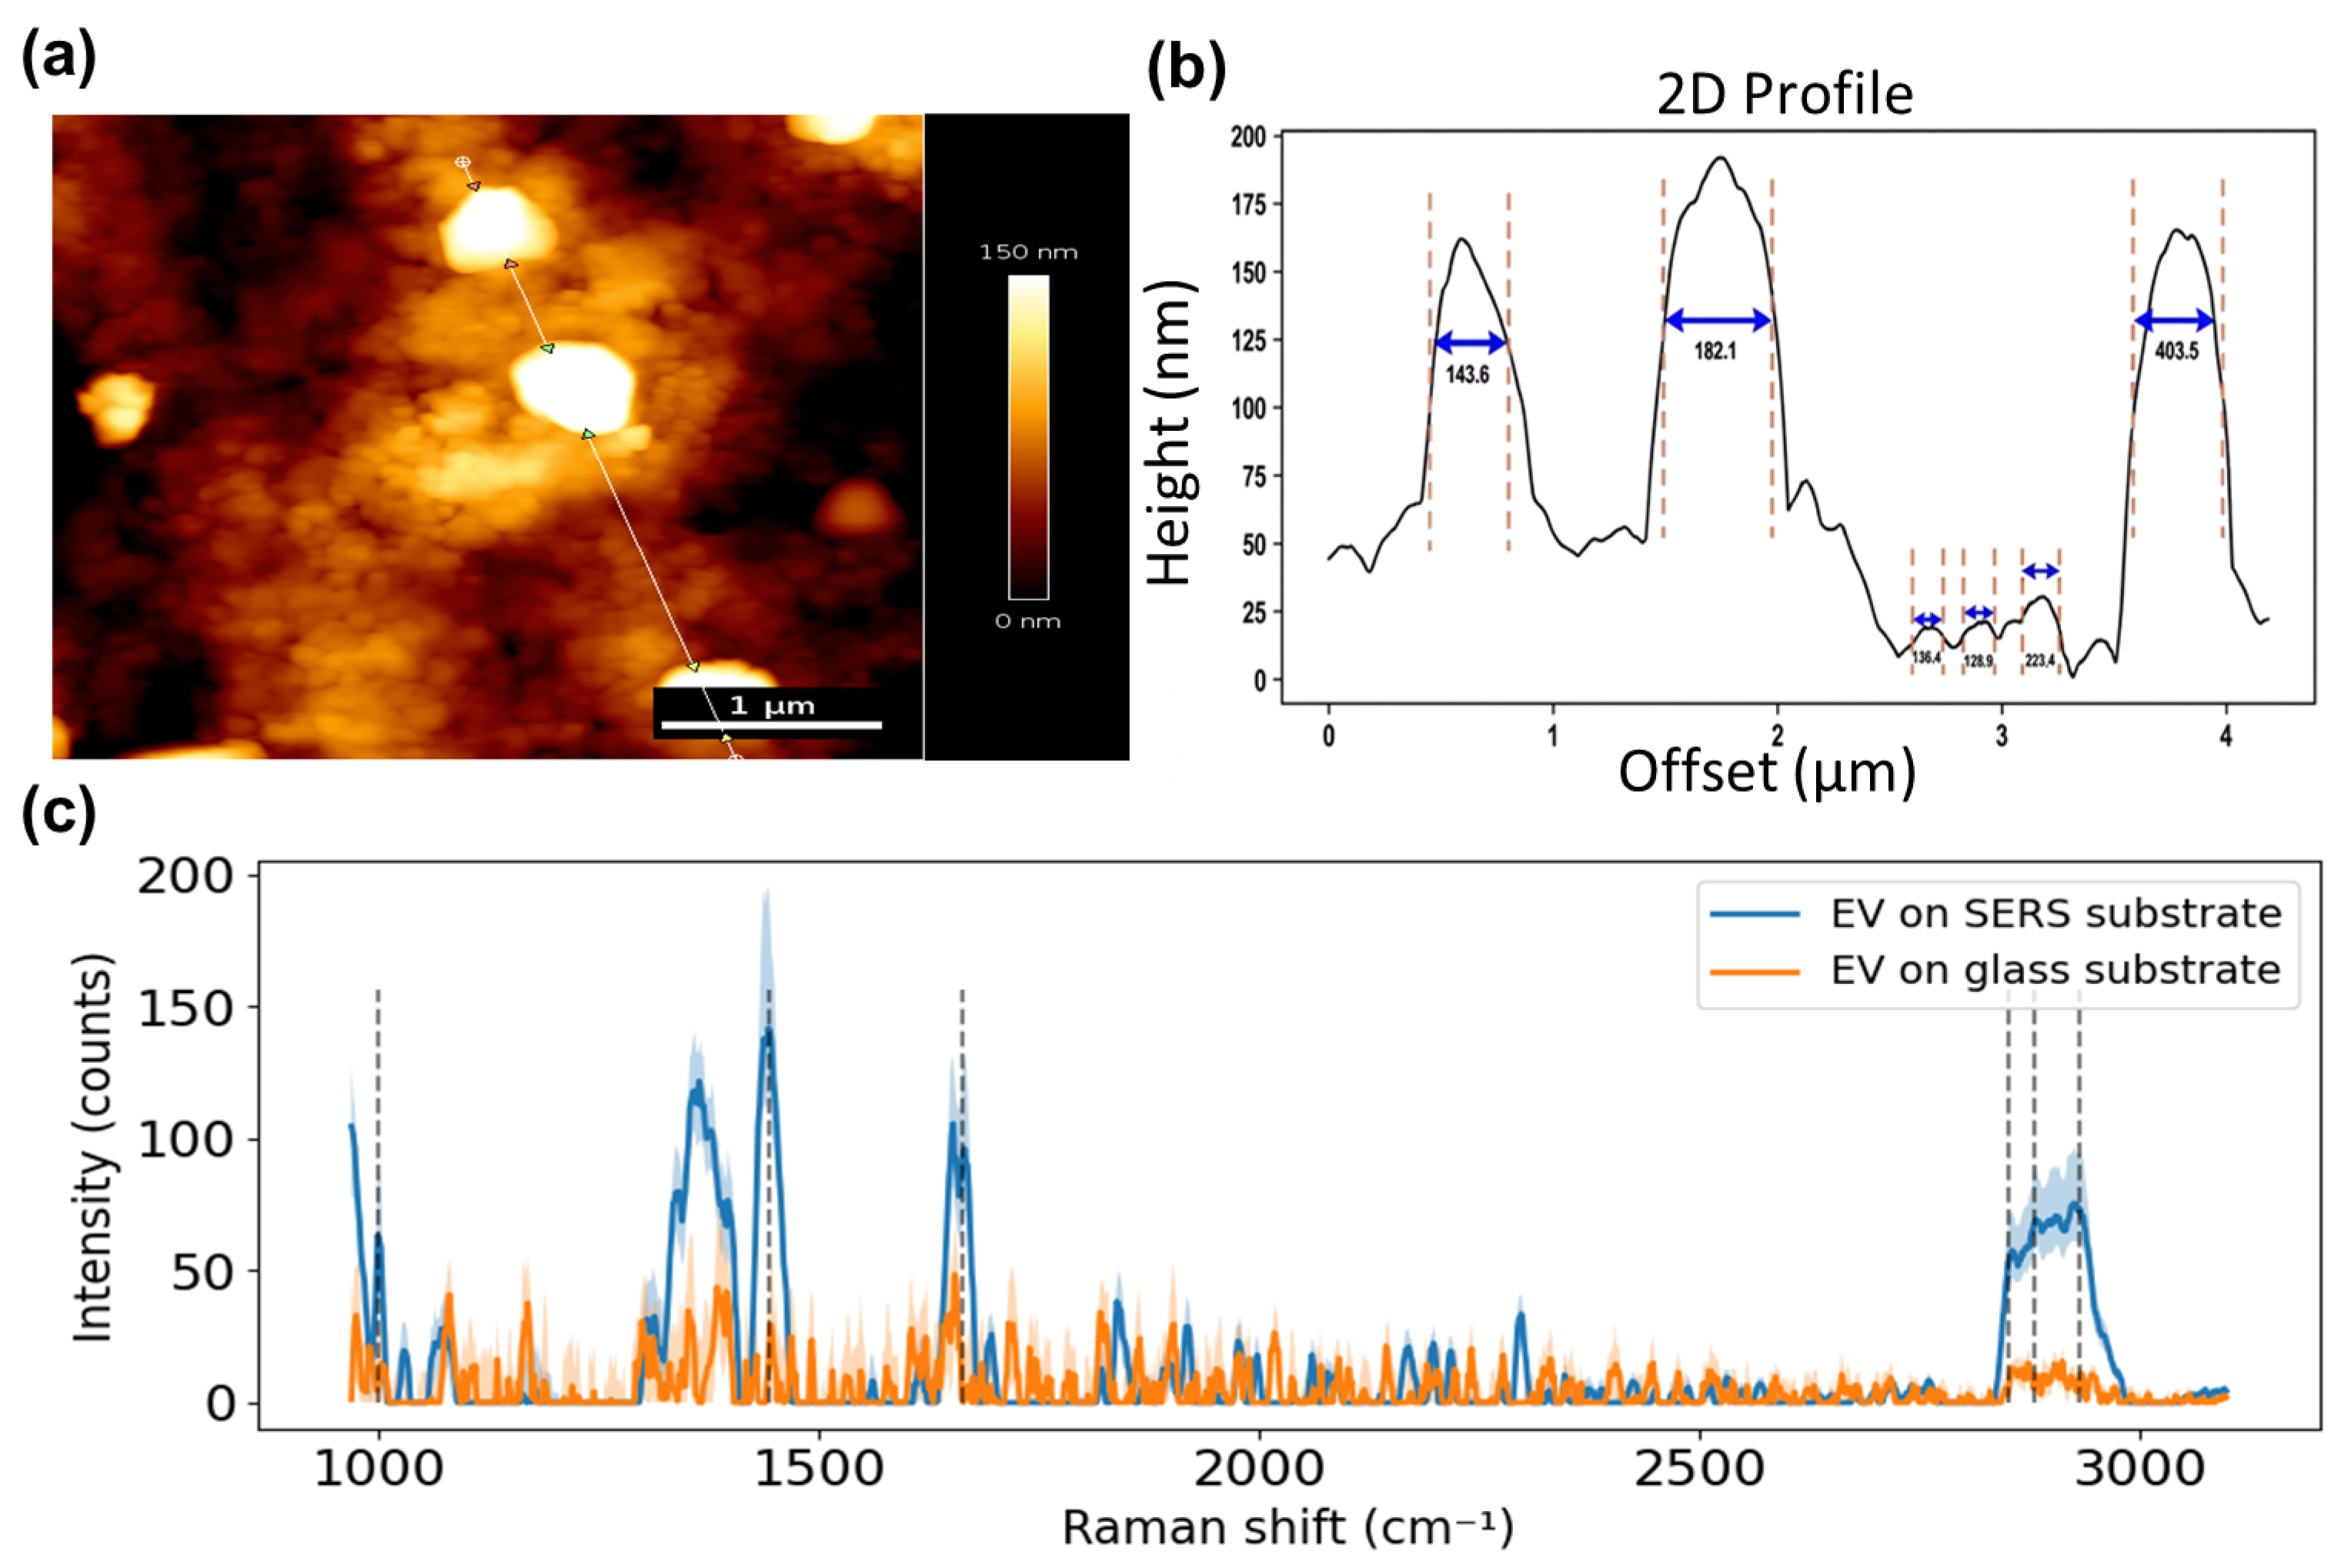
In order to assess the substrate’s performance on a biological sample, it was tested on EVs isolated from two different media: HMEC-1 cell culture supernatant and bovine milk (BM). For the EVs derived from HMEC-1 cells and purified by ultracentrifugation, the suspension was deposited onto the substrate surface and allowed to dry completely at room temperature. A total of 92 particles were examined, yielding a median lateral diameter of 169 ± 34 nm and a median height of 60 ± 22 nm (Figure 9a,b). For the EVs derived from BM and purified by SEC, the sample was also deposited onto the substrate and dried at room temperature. In total, 161 particles were analyzed, resulting in a median lateral diameter of 136 ± 44 nm and a median height of 20 ± 20 nm (Figure 10a,b).
Figure 9.
(a) AFM image, (b) 2D AFM profile, and (c) Raman spectra of dried EVs derived from HMEC-1 cells. Raman spectra were taken on the SERS substrate (blue) and on the glass (CaF2) control substrate (orange). The intervals represented by the shaded areas correspond to the range between the first and third quartiles.
Figure 10.
(a) AFM image, (b) 2D AFM profile, and (c) Raman spectra of dried EVs derived from bovine milk. Raman spectra were taken on the SERS substrate (blue) and on the glass (SF11) control substrate (orange). The intervals represented by the shaded areas correspond to the range between the first and third quartiles.
Raman spectroscopy measurements were then carried out on EVs deposited either on the SERS substrate or on a glass substrate used as a reference (Figure 9c and Figure 10c). The main Raman bands observed in the EV spectra were assigned to characteristic vibrational modes of proteins and lipids. The peaks at 850, 1000, 1446, 1665, 2853, 2882, and 2932 cm−1 were attributed to tyrosine (Tyr), phenylalanine (Phe), α(CH2/CH3) symmetric deformation modes, amide I band, and CH2/CH3 stretching vibrations, respectively [12]. As indicated in Section 2.2, the protocol used to isolate the EVs includes a washing step to remove the culture medium. Thus, we believe that the obtained Raman spectrum does not contain any contribution from the medium. The CH2/CH3 stretching vibrations between 2856 and 2964 cm−1 were used to compare the intensity. For HMEC-1-derived EVs, intensities reached 24 counts on the SERS substrate (ISERS) and 3.4 counts on the glass substrate (Iref). For BM-derived EVs, intensities reached 72 counts on the SERS substrate and 8 counts on the glass substrate.
For the estimation of the SERS enhancement factor (EF), it was assumed that only the fraction of the EV located within approximately hSERS = 3 nm of the substrate surface was subject to SERS enhancement [40]. The remaining portion of the EV was assumed to contribute solely via conventional, non-enhanced Raman scattering. Assuming a cylindrical geometry for EVs on the surface, with a height h and a diameter d, the ratio between the intensities measured on the two substrates can be expressed as follows:
where ⟨…⟩ represents an average across the EV population, as measured by AFM.
Then, the enhancement factor (EF) can be expressed as follows:
For HMEC-1-derived EVs, the EF was calculated to be 1.4 × 10², whereas it was 1.0 × 10² for MB-derived EVs. This result shows that the SERS surface increases the Raman signal by about 102 times compared to the plain glass surface.
The estimated lower apparent enhancement factor for EVs compared to MB could be explained by their different types of adsorption. While EVs are mainly physisorbed, MB contains a sulfur atom in its thiazine ring, which can promote a specific interaction with the gold surface, possibly through chemisorption [41]. This interaction may contribute to the EF observed for MB through chemical enhancement.
4. Conclusions
In this study, we present a simple fabrication method using DC magnetron sputtering to produce a planar near-infrared SERS chip based on nanoscale surface grains. This chip can be used to study biological samples at the nanoscale, including very small structures like EVs, which are being investigated as potential disease biomarkers. We systematically explored the influence of deposition parameters on the morphology and optical properties of the surface nanostructure, measured by AFM, in order to optimize the SERS enhancement factor.
The results obtained show that each deposition parameter plays a specific role. Specifically, raising the chamber working pressure led to an increase in nanoscale surface grains without significantly altering their average diameter. The applied current turns out to be the most influential parameter on the diameter of surface grains, with an increase of about 35% when the current was doubled. This indicates a strong impact during the initial stages of surface grain growth. However, increasing the film thickness from 5 nm to 20 nm led to a modest, non-significant increase in average surface grain diameter (from 26 nm to 30 nm). Controlling these parameters is crucial, as the surface grain diameter must be tightly controlled to achieve strong and reproducible Raman enhancement. In this study, SERS performance was optimized for a 785 nm laser excitation to minimize the autofluorescence commonly observed in biological samples, which often obscures Raman scattering. However, from an understanding of the influence of the various sputtering parameters, one could tune the average surface grain diameter for other wavelengths.
The SERS measurements demonstrate that the proposed method is effective, enabling the detection of MB at a concentration of 10−7 M (100 nM). This performance is adequate for an initial validation and indicates that the substrate exhibits a satisfactory level of sensitivity. Tests with EVs also show that the SERS signal is about 102 times stronger than on a bare reference surface, while enabling AFM imaging of EVs that is not affected by the chip’s topography. These results prove that the substrate possesses sufficient sensitivity and provides a good starting point for further improvements in chemical and biological sensing. A particularly promising direction for future work is the integration of this SERS platform with surface plasmon resonance imaging (SPRi). Such a combined system would leverage the molecular specificity of SERS together with the real-time, label-free detection capabilities of SPRi, thereby enabling a more powerful and comprehensive sensing platform with improved overall analytical performance.
Supplementary Materials
The following supporting information can be downloaded at https://www.mdpi.com/article/10.3390/chemosensors14120260/s1. Figure S1: Scanning electron microscopy (SEM) of the SERS substrate surface (10 nm Au, 0.15 A, 32 mTorr) (a) and its segmentation into surface grains (b). Figure S2: Raw Raman spectra acquired on the SERS substrate (10 nm Au, 0.15 A, 32 mTorr), without any sample deposited on it. The intervals represented by the shaded areas correspond to the range between the first and third quartiles. Figure S3: Absorbance spectrum of the SERS substrate (10 nm Au, 0.15 A, 32 mTorr).
Author Contributions
Conceptualization, M.K., S.O., R.Z., F.C. and B.B.; Methodology, M.K. and B.B.; Software, M.K. and B.B.; Validation, C.E.-C., F.C. and B.B.; Formal analysis, M.K. and B.B.; Investigation, M.K., S.O., R.Z., F.C. and B.B.; Resources, C.E.-C. and B.B.; Data curation, M.K.; Writing—original draft, M.K. and B.B.; Writing—review & editing, M.K., S.O., R.Z., C.E.-C., F.C. and B.B.; Visualization, M.K.; Supervision, F.C. and B.B.; Funding acquisition, B.B. All authors have read and agreed to the published version of the manuscript.
Funding
This research was funded by the French National Research Agency (ANR) through the project RESONANCE, grant ANR-23-CE19-0001-01 and the project ENDOMITOPAH, grant ANR-R23137NN. This work was supported by the Région Bourgogne-Franche-Comté through the project SPECTRAVEX. This work was supported by the French RENATECH network and its FEMTO-ST technological facility. This work has been supported by the EIPHI Graduate School (contract ANR-17-EURE-0002) and the Region Bourgogne-Franche-Comté.
Data Availability Statement
The data presented in this study are available on request from the corresponding author.
Acknowledgments
We would like to thank Eric Le Ferrec and Camille Chauvin (IRSET, Rennes) for providing us with the HMEC-1-derived EVs used in the tests. We would like to thank Zuzana Krupova (Excilone) for providing us with the BM-derived EVs used in the tests.
Conflicts of Interest
The authors declare no conflict of interest.
References
- Butler, H.J.; Ashton, L.; Bird, B.; Cinque, G.; Curtis, K.; Dorney, J.; Esmonde-White, K.; Fullwood, N.J.; Gardner, B.; Martin-Hirsch, P.L.; et al. Using Raman spectroscopy to characterize biological materials. Nat. Protoc. 2016, 11, 664–687. [Google Scholar] [CrossRef] [Scilit] [PubMed]
- Pimenta, S.; Correia, J.H. Biomedical Applications of Raman Spectroscopy: A Review. Photochem 2025, 5, 29. [Google Scholar] [CrossRef] [Scilit]
- Kumamoto, Y.; Harada, Y.; Takamatsu, T.; Tanaka, H. Label-free Molecular Imaging and Analysis by Raman Spectroscopy. Acta Histochem. Cytochem. 2018, 51, 101–110. [Google Scholar] [CrossRef] [Scilit] [PubMed]
- Chandra, A.; Kumar, V.; Garnaik, U.C.; Dada, R.; Qamar, I.; Goel, V.K.; Agarwal, S. Unveiling the Molecular Secrets: A Comprehensive Review of Raman Spectroscopy in Biological Research. ACS Omega 2024, 9, 50049–50063. [Google Scholar] [CrossRef] [Scilit] [PubMed]
- Huang, Z.; Peng, J.; Xu, L.; Liu, P. Development and Application of Surface-Enhanced Raman Scattering (SERS). Nanomaterials 2024, 14, 1417. [Google Scholar] [CrossRef] [Scilit] [PubMed]
- Mosier-Boss, P.A. Review of SERS Substrates for Chemical Sensing. Nanomaterials 2017, 7, 142. [Google Scholar] [CrossRef] [Scilit] [PubMed]
- Jing, T.; Gao, R.; Zhan, C.; Yu, Y.; Chen, X.; Lu, Y.; Nam, H.K.; Kim, Y.-J.; Yu, L. Flexible surface-enhanced Raman scattering substrates: A review on design strategies, fabrication technologies, and applications. Coord. Chem. Rev. 2025, 539, 216739. [Google Scholar] [CrossRef] [Scilit]
- Prado, E.; Colin, A.; Servant, L.; Lecomte, S. SERS Spectra of Oligonucleotides as Fingerprints to Detect Label-Free RNA in Microfluidic Devices. J. Phys. Chem. C 2014, 118, 13965–13971. [Google Scholar] [CrossRef] [Scilit]
- Zheng, X.; Zong, C.; Xu, M.; Wang, X.; Ren, B. Raman Imaging from Microscopy to Nanoscopy, and to Macroscopy. Small 2015, 11, 3395–3406. [Google Scholar] [CrossRef] [Scilit] [PubMed]
- Szaniawska, A.; Kudelski, A. Applications of Surface-Enhanced Raman Scattering in Biochemical and Medical Analysis. Front. Chem. 2021, 9, 664134. [Google Scholar] [CrossRef] [Scilit] [PubMed]
- Raizada, G.; Namasivayam, B.; Obeid, S.; Brunel, B.; Boireau, W.; Lesniewska, E.; Elie-Caille, C. Multimodal Analytical Platform on a Multiplexed Surface Plasmon Resonance Imaging Chip for the Analysis of Extracellular Vesicle Subsets. J. Vis. Exp. (JoVE) 2023, e64210. [Google Scholar] [CrossRef] [Scilit] [PubMed]
- Raizada, G.; Brunel, B.; Guillouzouic, J.; Aubertin, K.; Shigeto, S.; Nishigaki, Y.; Lesniewska, E.; Le Ferrec, E.; Boireau, W.; Elie-Caille, C. Raman spectroscopy of large extracellular vesicles derived from human microvascular endothelial cells to detect benzo[a]pyrene exposure. Anal. Bioanal. Chem. 2024, 416, 6639–6649. [Google Scholar] [CrossRef] [Scilit] [PubMed]
- Shin, H.; Seo, D.; Choi, Y. Extracellular Vesicle Identification Using Label-Free Surface-Enhanced Raman Spectroscopy: Detection and Signal Analysis Strategies. Molecules 2020, 25, 5209. [Google Scholar] [CrossRef] [Scilit] [PubMed]
- Michieli, N.; Pilot, R.; Russo, V.; Scian, C.; Todescato, F.; Signorini, R.; Agnoli, S.; Cesca, T.; Bozio, R.; Mattei, G. Oxidation effects on the SERS response of silver nanoprism arrays. RSC Adv. 2016, 7, 369–378. [Google Scholar] [CrossRef] [Scilit]
- Kunzmann, A.; Andersson, B.; Thurnherr, T.; Krug, H.; Scheynius, A.; Fadeel, B. Toxicology of engineered nanomaterials: Focus on biocompatibility, biodistribution and biodegradation. Biochim. Biophys. Acta (BBA) Gen. Subj. 2011, 1810, 361–373. [Google Scholar] [CrossRef] [Scilit] [PubMed]
- Chan, G.H.; Zhao, J.; Hicks, E.M.; Schatz, G.C.; Van Duyne, R.P. Plasmonic Properties of Copper Nanoparticles Fabricated by Nanosphere Lithography. Nano Lett. 2007, 7, 1947–1952. [Google Scholar] [CrossRef] [Scilit]
- Gérard, D.; Gray, S.K. Aluminium plasmonics. J. Phys. D. Appl. Phys. 2014, 48, 184001. [Google Scholar] [CrossRef] [Scilit]
- Raizada, G.; Guillouzouic, J.; Rouleau, A.; Lesniewska, E.; Le Ferrec, E.; Elie-Caille, C.; Boireau, W. NanoBioAnalytical (NBA) Platform to Decipher Extracellular Vesicles Secreted by Microvascular Endothelial Cells Under Benzo[a]pyrene Exposure. Biosensors 2025, 15, 103. [Google Scholar] [CrossRef] [Scilit] [PubMed]
- Deriu, C.; Fabris, L. A surface chemistry perspective on SERS: Revisiting the basics to push the field forward. Chem. Soc. Rev. 2025, 54, 5224–5247. [Google Scholar] [CrossRef] [Scilit] [PubMed]
- Stewart, M.E.; Anderton, C.R.; Thompson, L.B.; Maria, J.; Gray, S.K.; Rogers, J.A.; Nuzzo, R.G. Nanostructured Plasmonic Sensors. Chem. Rev. 2008, 108, 494–521. [Google Scholar] [CrossRef] [Scilit] [PubMed]
- Stiles, P.L.; Dieringer, J.A.; Shah, N.C.; Van Duyne, R.P. Surface-Enhanced Raman Spectroscopy. Annu. Rev. Anal. Chem. 2008, 1, 601–626. [Google Scholar] [CrossRef] [Scilit] [PubMed]
- Doron-Mor, I.; Barkay, Z.; Filip-Granit, N.; Vaskevich, A.; Rubinstein, I. Ultrathin Gold Island Films on Silanized Glass. Morphology and Optical Properties. Chem. Mater. 2004, 16, 3476–3483. [Google Scholar] [CrossRef] [Scilit]
- Peng, J.; Song, Y.; Lin, Y.; Huang, Z. Introduction and Development of Surface-Enhanced Raman Scattering (SERS) Substrates: A Review. Nanomaterials 2024, 14, 1648. [Google Scholar] [CrossRef] [Scilit] [PubMed]
- Qiao, Z.; Dan-Feng, L.; Chen, C.; Zhi-Mei, Q. Characterization of Mesoporous Silica Film Sensitized SERS Substrates Based on Evanescent-Wave Excitation. Acta Phys.-Chim. Sin. 2014, 30, 2335–2341. [Google Scholar] [CrossRef] [Scilit]
- Gaspar, D.; Pimentel, A.C.; Mateus, T.; Leitão, J.P.; Soares, J.; Falcão, B.P.; Araújo, A.; Vicente, A.; Filonovich, S.A.; Águas, H.; et al. Influence of the layer thickness in plasmonic gold nanoparticles produced by thermal evaporation. Sci. Rep. 2013, 3, 1469. [Google Scholar] [CrossRef] [Scilit] [PubMed]
- Foltýn, M.; Patočka, M.; Řepa, R.; Šikola, T.; Horák, M. Influence of Deposition Parameters on the Plasmonic Properties of Gold Nanoantennas Fabricated by Focused Ion Beam Lithography. ACS Omega 2024, 9, 37408–37416. [Google Scholar] [CrossRef] [Scilit] [PubMed]
- Raizada, G.; Brunel, B.; Bragantini, B.; Guillouzouic, J.; Le Ferrec, E.; Boireau, W.; Lesniewska, E.; Elie-Caille, C. Large extracellular vesicles subsets and contents discrimination: The potential of morpho mechanical ap-proaches at single vesicle level. bioRxiv 2025. [Google Scholar] [CrossRef] [Scilit]
- Otsu, N. A threshold selection method from gray-level histograms. IEEE Trans. Syst. Man. Cybern. 1979, 9, 62–66. [Google Scholar] [CrossRef] [Scilit]
- Cuate, O.; Derbel, B.; Liefooghe, A.; Talbi, E.-G.; Schütze, O. An Approach for the Local Exploration of Discrete Many Objective Optimization Problems; Springer Nature: Cham, Switzerlands, 2017; pp. 135–150. [Google Scholar] [CrossRef] [Scilit]
- Martin, N.; Martin, E.; Cote, J.-M.; Sthal, F.; Gavoille, J.; Raschetti, M.; Oliveri, S. Low temperature dependence of resistivity in obliquely sputter-deposited gold thin films. Surf. Coat. Technol. 2025, 499, 131884. [Google Scholar] [CrossRef] [Scilit]
- Baek, S.-J.; Park, A.; Ahn, Y.-J.; Choo, J. Baseline correction using asymmetrically reweighted penalized least squares smoothing. Anal. 2014, 140, 250–257. [Google Scholar] [CrossRef] [Scilit] [PubMed]
- Deng, L.; Nguyen, M.T.; Shi, J.; Chau, Y.-T.R.; Tokunaga, T.; Kudo, M.; Matsumura, S.; Hashimoto, N.; Yonezawa, T. Highly Correlated Size and Composition of Pt/Au Alloy Nanoparticles via Magnetron Sputtering onto Liquid. Langmuir 2020, 36, 3004–3015. [Google Scholar] [CrossRef] [Scilit] [PubMed]
- Kim, D.-Y.; Kwon, J.-H.; Jang, G.-S.; Hwang, N.-M. Effect of Pressure on the Film Deposition during RF Magnetron Sputtering Considering Charged Nanoparticles. Coatings 2021, 11, 132. [Google Scholar] [CrossRef] [Scilit]
- Bulowski, W.; Skibińska, K.; Żabiński, P.; Wojnicki, M. Optimization of Gold Thin Films by DC Magnetron Sputtering: Structure, Morphology, and Conductivity. Coatings 2025, 15, 1240. [Google Scholar] [CrossRef] [Scilit]
- Zhu, G.; Han, M.; Xiao, B.; Gan, Z. Influence of Sputtering Pressure on the Micro-Topography of Sputtered Cu/Si Films: Integrated Multiscale Simulation. Processes 2023, 11, 1649. [Google Scholar] [CrossRef] [Scilit]
- Kusano, E. Structure-Zone Modeling of Sputter-Deposited Thin Films: A Brief Review. Appl. Sci. Converg. Technol. 2019, 28, 179–185. [Google Scholar] [CrossRef] [Scilit]
- Thornton, J.A. Influence of apparatus geometry and deposition conditions on the structure and topography of thick sputtered coatings. J. Vac. Sci. Technol. 1974, 11, 666–670. [Google Scholar] [CrossRef] [Scilit]
- Horta, I.; Neto, N.F.A.; Kito, L.T.; Miranda, F.; Thim, G.; Pereira, A.L.d.J.; Pessoa, R. Ultra-Trace Monitoring of Methylene Blue Degradation via AgNW-Based SERS: Toward Sustainable Advanced Oxidation Water Treatment. Sustainability 2025, 17, 4448. [Google Scholar] [CrossRef] [Scilit]
- Kahraman, M.; Mullen, E.R.; Korkmaz, A.; Wachsmann-Hogiu, S. Fundamentals and applications of SERS-based bioanalytical sensing. Nanophotonics 2017, 6, 831–852. [Google Scholar] [CrossRef] [Scilit]
- Israelsen, N.D.; Hanson, C.; Vargis, E. Nanoparticle Properties and Synthesis Effects on Surface-Enhanced Raman Scattering Enhancement Factor: An Introduction. Sci. World J. 2015, 2015, 124582. [Google Scholar] [CrossRef] [Scilit]
- Naujok, R.R.; Duevel, R.V.; Corn, R.M. Fluorescence and Fourier Transform surface-enhanced Raman scattering measurements of methylene blue adsorbed onto a sulfur-modified gold electrode. Langmuir 1993, 9, 1771–1774. [Google Scholar] [CrossRef] [Scilit]
Disclaimer/Publisher’s Note: The statements, opinions and data contained in all publications are solely those of the individual author(s) and contributor(s) and not of MDPI and/or the editor(s). MDPI and/or the editor(s) disclaim responsibility for any injury to people or property resulting from any ideas, methods, instructions or products referred to in the content. |
© 2026 by the authors. Licensee MDPI, Basel, Switzerland. This article is an open access article distributed under the terms and conditions of the Creative Commons Attribution (CC BY) license.