


Abstract
Fluconazole (FLU) is a widely used antifungal drug, and its reliable determination is important for quality control in pharmaceutical analysis. This study aimed to develop a simple and accurate FLU-selective potentiometric sensor based on a molecularly imprinted polymer (MIP). The prepared MIP was evaluated by FT-IR spectroscopy and TG/DSC analysis. The sensor was characterized using direct potentiometry. The influence of membrane composition on sensor response was investigated by varying the MIP content and plasticizer type. The optimized sensor contained 12.5% MIP and dibutyl sebacate as the plasticizer. It exhibited a near-Nernstian response with a slope of 56.1 mV/decade of activity, a wide measuring range (1.0 × 10⁻⁷–1.0 × 10⁻³ M), and a low limit of detection (7.5 × 10⁻⁸ M). Additionally, it showed a fast response (5 s), low signal drift (−0.6 mV/h), and excellent selectivity attributed to the recognition properties of the MIP. The sensor applicability was confirmed by FLU determination in standard solutions and pharmaceutical samples using direct potentiometry and the Gran method. Both approaches provided acceptable results, while the Gran method showed slightly better agreement with the expected FLU concentrations, with recoveries within ±10%. The developed sensor enables reliable FLU determination in pharmaceutical samples.
1. Introduction
Fungal infections are recognized worldwide as a critical global health challenge, with Candida species being among the most prevalent fungal pathogens [1]. Fluconazole (2-(2,4-difluorophenyl)-1,3-bis(1H-1,2,4-triazol-1-yl)propan-2-ol, FLU)) is a compound from the triazole group, widely used for the treatment of various human fungal infections [2]. In many countries, FLU is the most commonly used antifungal medicine for the treatment of Candida infections [3]. It has also demonstrated antifungal activity against phytopathogenic fungi affecting fruit and vegetables [4]. To ensure quality control, therapeutic efficacy, and safety of the patients, accurate quantification of active pharmaceutical compounds in drug formulations is essential. In addition, FLU is poorly biodegradable and can be detected in various environmental matrices, where it may pose an ecotoxicological risk, contribute to antifungal resistance in fungi [5], and result in potential human exposure [6]. Therefore, the development of simple, accurate, selective, and low-cost methods for FLU determination remains an important analytical challenge.
Different analytical methods, such as UV–vis spectrophotometry [2], fluorimetry [7], Raman spectroscopy [8], and bioassay [9], can be applied for FLU determination, although chromatographic methods remain the most widely used due to their high accuracy and sensitivity [10,11,12]. However, chromatographic methods, especially those coupled with mass spectrometry (MS), require expensive instrumentation, often involve time-consuming and complex sample preparation, and are not environmentally friendly because they consume large amounts of organic solvents. Therefore, potentiometric sensors have emerged as promising alternatives to these methods, providing simple, accurate, selective, rapid, and low-cost analysis with minimal consumption of toxic solvents. Potentiometric sensors are ion-selective electrodes (ISEs) whose selective membranes determine their analytical properties. The membrane usually consists of a sensing material, a plasticizer, and poly(vinyl chloride) (PVC). The sensing material incorporated into the membrane provides selective recognition of the analyte and determines the overall sensor response. Usually, the sensing material is an electroactive ion pair formed between the analyte and an appropriate counterion [13,14,15,16]. In recent years, alternative sensing materials, such as molecularly imprinted polymers (MIPs) [17,18,19,20], cyclodextrins [21,22], metal–organic frameworks [23,24], and nanomaterial-modified sensing elements [25,26] have been increasingly used to develop potentiometric sensors with improved analytical performance. In addition to the sensing material, the plasticizer also plays a crucial role in determining the membrane’s physical and analytical properties. As a major membrane component, it reduces the membrane viscosity, enhances flexibility, and improves the membrane’s mechanical properties [27,28]. Furthermore, the plasticizer provides a suitable environment for the sensing material within the PVC matrix. Its physicochemical characteristics, particularly polarity, lipophilicity, and compatibility with both the PVC matrix and the sensing material, strongly influence the sensor’s analytical performance, including selectivity and limit of detection (LOD) [27]. In addition, the membrane’s long-term stability depends on the low water solubility of its components; the choice of plasticizer and its compatibility with the PVC matrix are essential for minimizing membrane leaching and improving sensor lifetime [27]. Therefore, optimization of membrane components enables the development of potentiometric sensors with enhanced analytical properties, including lower LOD, wider measuring ranges, faster response times, and improved selectivity, accuracy, and signal stability.
MIPs are a promising class of biomimetic materials that provide selective recognition of target molecules through the formation of specific binding sites complementary to the analyte in terms of size, shape, and arrangement of functional groups [29]. Due to their high chemical stability, reusability, and selectivity, MIPs have been successfully applied for the extraction and determination of pharmaceutical compounds [30,31]. MIP synthesis relies on the careful selection of four main components: the template molecule, functional monomer, cross-linking agent, and polymerization initiator. The properties and interactions of these components determine the formation of selective recognition sites and influence the affinity, stability, and selectivity of the resulting polymer. Functional monomers provide the functional groups involved in recognition of the template molecule, while cross-linking agents stabilize the polymer network and preserve the resulting binding sites [32]. In this study, methacrylic acid (MAA) was selected as the functional monomer because it forms strong non-covalent interactions, including hydrogen bonding, with a variety of template molecules and is compatible with methacrylate-based cross-linkers [30,33]. Trimethylolpropane trimethacrylate (TRIM) was employed as a cross-linking agent to provide a stable three-dimensional polymer network and preserve the spatial arrangement of FLU-specific recognition cavities after template removal [31,34,35]. The combination of MAA and TRIM enables the preparation of a mechanically stable MIP with selective binding sites suitable for FLU recognition. Benzoyl peroxide (BZO) was selected as the polymerization initiator because it generates free radicals upon thermal decomposition, initiating polymer chain formation and promoting radical polymerization. Owing to its efficient radical-generating properties, BZO is among the most commonly used initiators in the synthesis of MIPs via free-radical polymerization [36]. Therefore, in this study, a FLU-imprinted polymer was developed and characterized using MAA as the functional monomer and TRIM as the cross-linking agent to obtain a selective polymeric material for FLU recognition. Although FLU-imprinted polymer has previously been employed as a selective sorbent for solid-phase extraction prior to ultra-performance liquid chromatography coupled with MS analysis for FLU determination in pharmaceutical samples [37], the present study introduces a different MIP design approach and application strategy by utilizing the MIP as the sensing material in a FLU-selective potentiometric sensor.
To the best of our knowledge, only two studies have described the development of potentiometric sensors for FLU determination [38,39], and neither of them employed MIPs as sensing materials. Therefore, this work aimed to develop, optimize, and characterize a sensitive and reliable MIP-based potentiometric FLU-selective sensor (MIP-FLU sensor) and to demonstrate its applicability as a rapid analytical tool for quality control applications. The present study therefore provides new insight into the use of molecular imprinting as a selective recognition strategy for potentiometric FLU determination and demonstrates the potential of a FLU-imprinted MIP as a sensing material for this purpose.
2. Materials and Methods
2.1. Reagents and Materials
FLU (Thermo Fisher Scientific, Waltham, MA, USA) was used as the analyte. MIP and non-imprinted polymer (NIP) were synthesized using TRIM, MAA, and methanol (MeOH) (all from Termo Fisher Scientific, Waltham, MA, USA), BZO (Merck, Darmstadt, Germany), acetonitrile (ACN, VWR Chemicals, Radnor, PA, USA), and acetic acid (AcOH, LabExpert d.o.o., Zagreb, Hrvatska). Chemicals used for membrane preparation were PVC, plasticizers (dibutyl sebacate (DS), o-nitrophenyl octyl ether (o-NPOE), bis(2-ethylhexyl) sebacate (BEHS), bis(2-ethylhexyl) phthalate (DOP), dibutyl phthalate (DBP), 2-nitrophenyl phenyl ether (NPPE)), and tetrahydrofuran (THF), all purchased from Fluka, Buchs, Switzerland. All salt solutions, tioconazole (Thermo Fisher Scientific, Waltham, MA, USA), itraconazole (Thermo Fisher Scientific, Waltham, MA, USA), and HCl (Carlo Erba, Milan, Italy) were prepared from analytical-grade chemicals. Fluconazole Kabi 2 mg/mL solution for infusion (Fresenius Kabi, Bad Homburg, Germany) was used as the real sample. All solutions were prepared using deionized water (conductivity of 0.055 µS/cm).
2.2. Apparatus
FT-IR spectra were recorded using an FTIR 88400S spectrometer (Shimadzu, Kyoto, Japan). Thermogravimetric (TG) and differential scanning calorimetry (DSC) analyses were performed using a simultaneous TGA/DSC analyzer (Mettler-Toledo TGA/DSC 1, Columbus, OH, USA). An ultrasonic bath (BANDELIN RK-100, Berlin, Germany) was used to prepare sensor membranes and the analyte solution. A 794 Basic Titrino equipped with an 806 Exchange Unit and a 728 Stirrer (all from Metrohm, Herisau, Switzerland), controlled by in-house software, was used for all potentiometric measurements. The two-electrode system consisted of the newly developed potentiometric sensor (Philips electrode body IS-561 (Glasblaeserei Moeller, Zurich, Switzerland) with the home-made membrane) and a silver/silver chloride reference electrode (Metrohm, Herisau, Switzerland). NaCl and KCl (c = 3 M for both) were used as the inner electrolytes for the Philips electrode and the reference electrode, respectively. The pH was measured using 826 mobile pH meter equipped with a combined pH electrode with LiCl in ethanol as the inner electrolyte (both from Metrohm, Herisau, Switzerland).
2.3. Synthesis of the MIP
The MIP was synthesized by bulk polymerization. For the synthesis, the template molecule (FLU, 60 mg, 0.2 mmol), ACN (5 mL), and the functional monomer (MAA, 68 μL, 0.8 mmol) were added to a flask and vortexed for 2 min. Next, TRIM (1077 μL, 4 mmol) was added as the cross-linking agent, followed by BZO (32 mg, 0.1 mmol) as the radical initiator. Finally, the reaction mixture was purged with nitrogen for 30 min. The polymerization was then carried out at 60 °C for 24 h in a sealed flask immersed in an oil bath. The obtained polymer (unwashed MIP) was washed with a MeOH/AcOH solution (1:1, v/v) using a Soxhlet extraction system for 72 h to ensure complete removal of the template molecule, yielding the washed MIP. The washed MIP was dried under vacuum using a rotary evaporator and subsequently ground mechanically to obtain a fine powder. The NIP (control polymer) was prepared using the same synthetic procedure, except that FLU was omitted from the reaction mixture.
2.4. Preparation of the Sensor
To prepare the sensor membrane, MIP or NIP, PVC, and plasticizer were mixed in 2 mL of THF using an ultrasonic bath. For all membranes, the PVC-to-plasticizer mass ratio was 1:2, and the total membrane mass was 0.1814 g. The MIP content, expressed as a percentage of the total membrane mass, was varied for different membranes (1.0%, 5.0%, 10.0%, 12.5%, 15.0%, and 20.0%). After mixing, the membrane mixture was poured onto a glass plate fitted with a glass ring with an inner radius of 12 mm. The membrane was left overnight to allow THF to evaporate, after which membrane discs with a radius of 3.5 mm were cut and mounted onto the Philips electrode body.
2.5. Procedure
FT-IR measurements were performed in the range of 4000–400 cm−1 with a spectral resolution of 4 cm−1. For TG/DSC analysis, the samples were placed in 100 μL alumina pans and heated under a nitrogen atmosphere at a flow rate of 200 mL min−1 up to 400 °C using a heating rate of 2 °C min−1.
The sensor was conditioned daily for 10 min in a FLU solution (c = 2.0 × 10⁻³ M), followed by calibration over the FLU concentration range from 1.0 × 10⁻⁵ M to 1.0 × 10⁻³ M to verify its response. All solutions were prepared without ionic strength adjustment and were magnetically stirred during measurements, which were performed at room temperature. To prepare FLU solutions, the pH was adjusted to 3 using HCl solution (c = 1.0 M) due to the low solubility of FLU in water. Potentiometric response measurements were performed by successive additions of FLU solutions (c = 2.0 × 10⁻³ M and 5.0 × 10⁻⁵ M) to 20 mL of water, while dynamic response measurements were carried out by adding FLU solutions (c = 2.0 × 10⁻³ M and 5.0 × 10⁻⁴ M) to 50 mL of water at 30 s intervals. The selectivity of the sensor was evaluated using the fixed interference method [40], where the volume of interfering solution was always 20 mL and the concentration was 1.0 × 10⁻² M, except for tioconazole and itraconazole, for which a concentration of 5.0 × 10⁻⁵ M was used. The sensor signal drift was determined in 15 mL of FLU solution (c = 2.0 × 10⁻³ M). For the analysis of real samples, Fluconazole Kabi solution for infusion was diluted with deionized water, and measurements were performed using the Gran method [41], where eight increments of FLU solution (c = 2.0 × 10⁻³ M) were added to 15 mL of sample solution, and the potential was measured after each addition. The sensor was stored in deionized water between measurements.
3. Results and Discussion
3.1. Characterization of the MIP
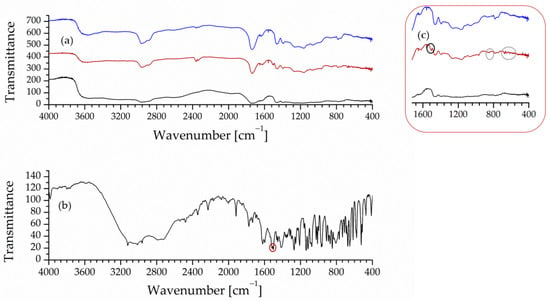
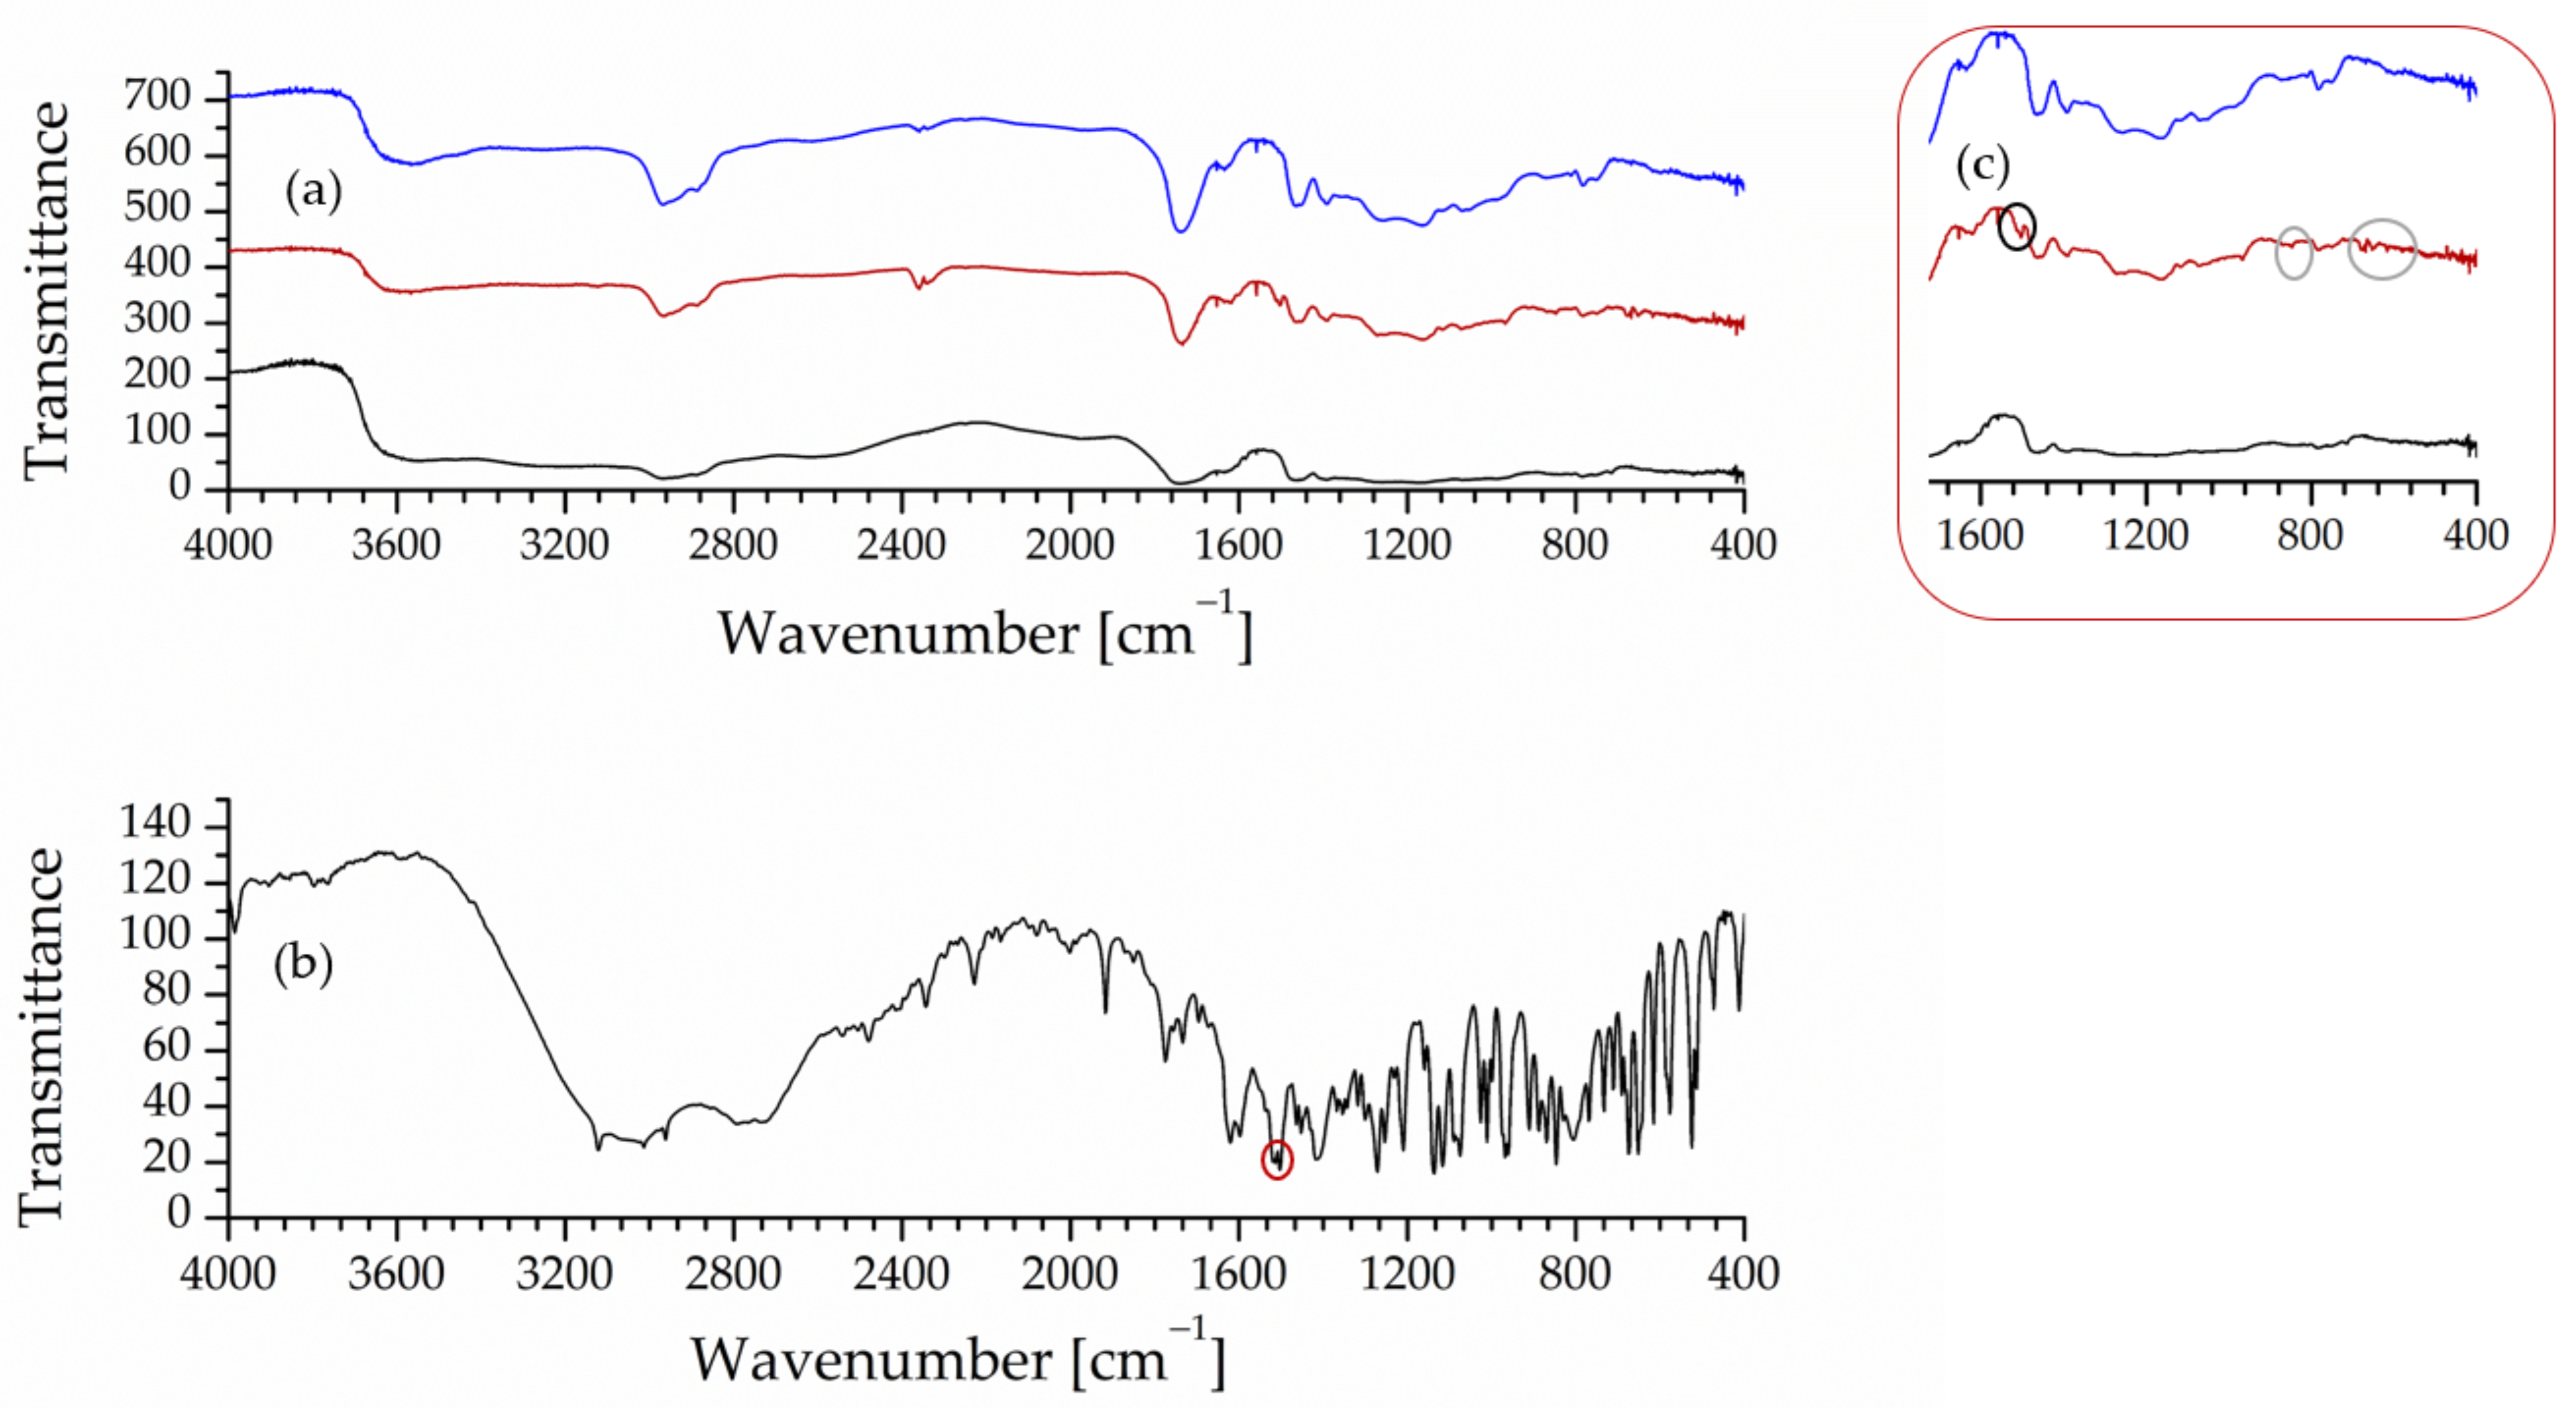
Figure 1 presents the FT-IR spectra of the washed MIP, unwashed MIP, NIP, and pure FLU. All three polymers show similar characteristic absorption bands, indicating that they share the same polymeric backbone. The observed differences in band intensities, particularly between the washed and unwashed MIP, reflect the presence and subsequent removal of the template molecule. A broad absorption band observed at approximately 3600–3200 cm−1 is assigned to the O–H stretching vibrations of the poly(methacrylic) acid (PMAA) structure [42]. The absorption bands in the 2950–2850 cm−1 region correspond to asymmetric and symmetric stretching vibrations of aliphatic C–H groups originating from the polymer framework. A strong band around 1720–1730 cm−1 is attributed to the stretching vibration of the carbonyl (C=O) group, corresponding to the PMAA structure and confirming the incorporation of the methacrylate-based polymer network.
Figure 1.
FT-IR spectra of (a) washed MIP (–), unwashed MIP (–), and NIP (–); (b) pure FLU; (c) enlarged region of the peaks of interest.
A weak absorption band observed at approximately 1600 cm−1 in the unwashed MIP spectrum can be attributed to C=N stretching vibrations of the triazole rings and/or aromatic C=C stretching vibrations of the entrapped FLU template (black and red marked). The disappearance of this band after template extraction confirms the successful removal of FLU from the polymer matrix. Furthermore, the spectrum of the unwashed MIP exhibits several additional or more intense absorption bands, particularly in the fingerprint region (approximately 1000–600 cm−1), which can also be attributed to the presence of entrapped FLU molecules (grey marked). These bands decrease in intensity or disappear after template removal, indicating that the extraction procedure successfully removed most of the template molecules from the polymer matrix.
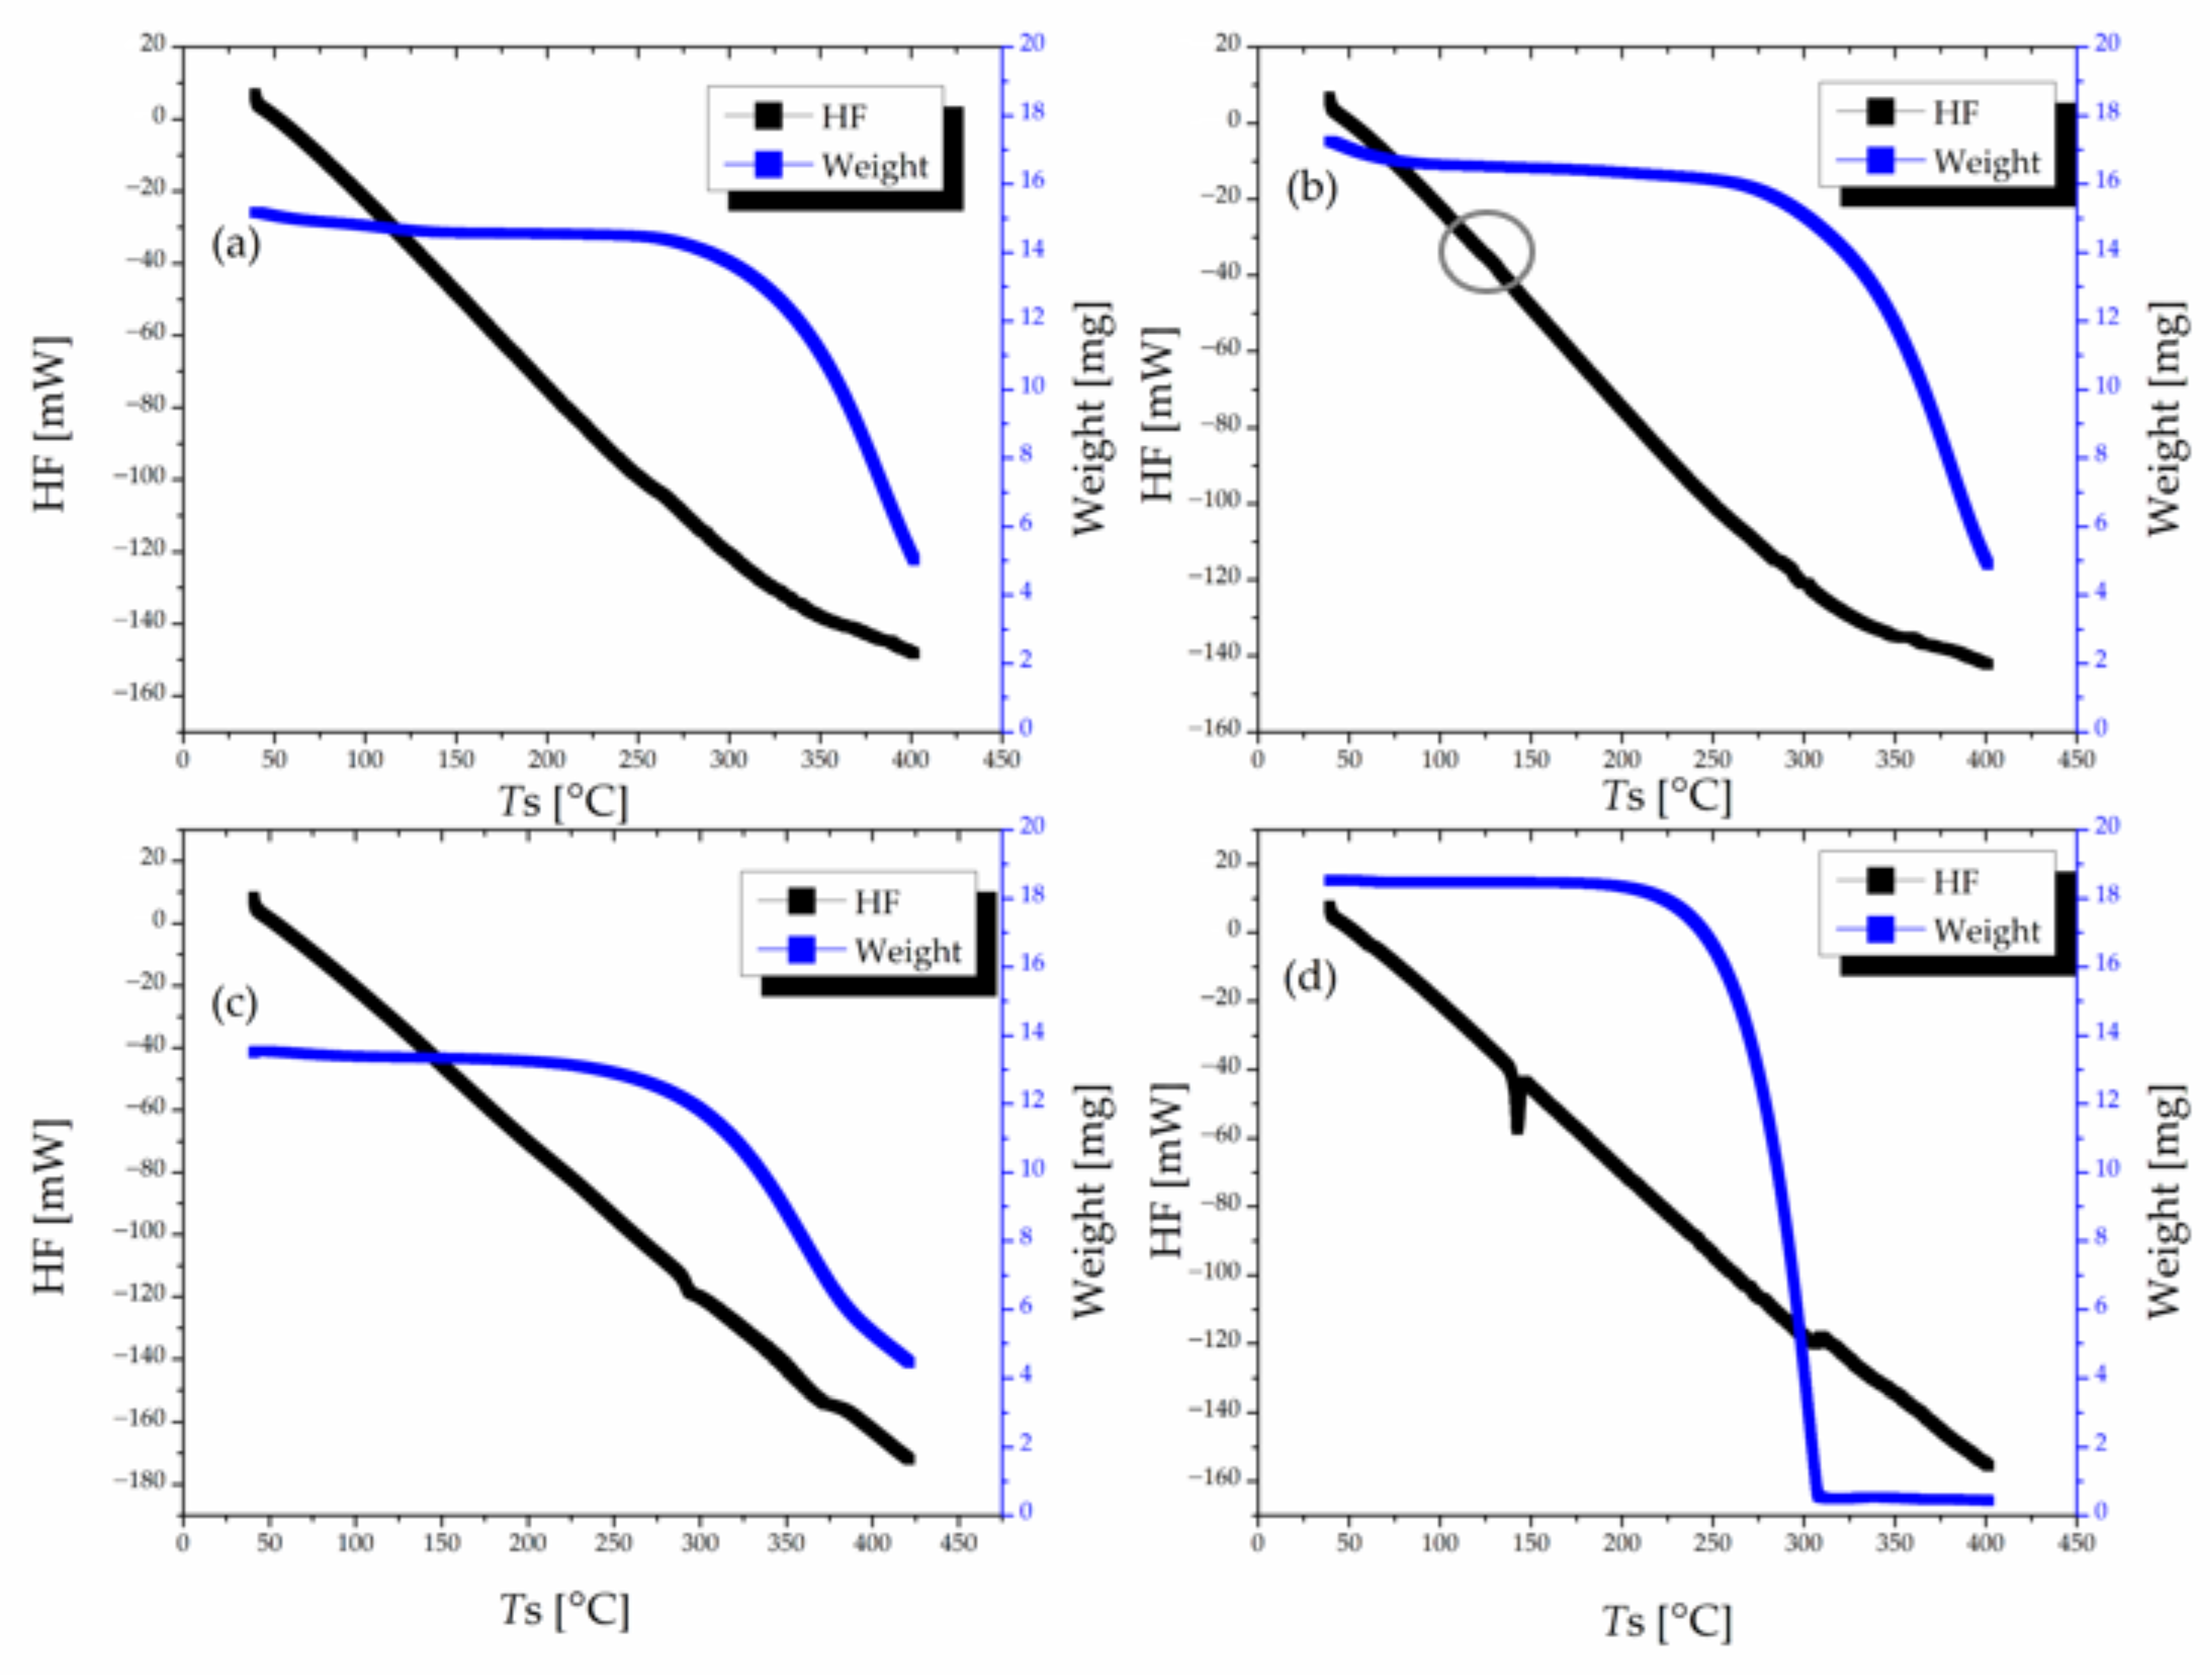
The TG/DSC curves of the washed MIP, unwashed MIP, NIP, and pure FLU are shown in Figure 2. The TG curve of the unwashed polymer (Figure 2b) showed a higher overall mass loss (78.43%) than the washed material (76.54%) (Figure 2a), indicating the presence of additional thermally labile organic content, likely due to retained FLU molecules. In comparison, the NIP exhibited a lower overall mass loss of 67.07%, further supporting the presence of additional organic content associated with the FLU template in the MIP. In the unwashed sample (Figure 2b), an earlier and broader mass loss was observed in the 50–250 °C range, which is consistent with the release and partial degradation of entrapped template molecules and residual low-molecular species. After template extraction, this early mass loss was significantly reduced, confirming effective template removal. For pure FLU, the decomposition process was observed at 230 °C. The DSC curve of pure FLU (Figure 2d) revealed an endothermic peak around 140 °C, consistent with the melting point reported in the literature [43]. A weak endothermic peak at a similar temperature was also observed in the unwashed MIP (Figure 2b, grey marked), however, it was barely detectable and was not observed in the DSC curves of the NIP (Figure 2c) and washed MIP (Figure 2a). This signal in the unwashed MIP may be attributed to residual FLU molecules entrapped within the polymer matrix, while its absence after washing confirms the effective removal of the FLU template.
Figure 2.
TG/DSC curves of: (a) washed MIP; (b) unwashed MIP; (c) NIP; (d) pure FLU.
3.2. Optimization of Membrane Formulation
3.2.1. Selection of the Plasticizer for the MIP-FLU Sensor
The plasticizer significantly influences membrane properties and, consequently, the analytical performance of the MIP-FLU sensor. Therefore, selecting a suitable plasticizer is an important step in membrane optimization. For this purpose, six different plasticizers (DS, o-NPOE, BEHS, DOP, DBP, and NPPE) were used to prepare membranes for six sensors, and their influence on the response characteristics of the new MIP-FLU sensor was evaluated.
In all membranes investigated, the MIP content was 5%, and the plasticizer-to-PVC weight ratio was 2:1 (63.33% and 31.67%, respectively). FLU solutions were used to investigate the potentiometric response of the sensors toward FLU within the concentration range from 2.5 × 10⁻⁸ M to 1.0 × 10⁻³ M, and the obtained data are summarized in Table 1. Each measurement was performed in five replicants, and linear regression analysis was applied for data evaluation. The LOD values were determined according to the IUPAC recommendations [44]. It can be observed that all investigated sensors exhibited a sub-Nernstian response toward FLU. The sensors prepared with different plasticizers showed comparable measuring ranges. Among the plasticizers investigated, the sensor containing DS exhibited the slope value closest to the Nernstian slope (51.0 mV/decade of activity), while also providing a wide measuring range (1.0 × 10⁻⁷–1.0 × 10⁻³) and low LOD value (7.5 × 10⁻⁸). Therefore, DS was selected as the plasticizer for further investigations.
Table 1.
Analytical characteristics of MIP-FLU sensors containing 5% MIP and different plasticizers 1.
3.2.2. Optimization of the MIP Content for the MIP-FLU Sensor
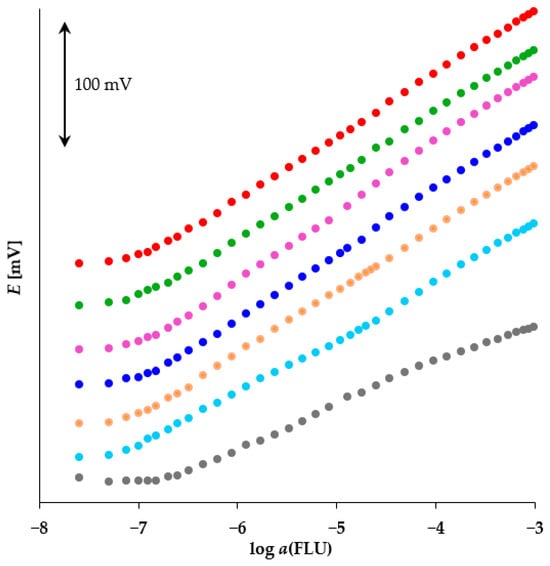
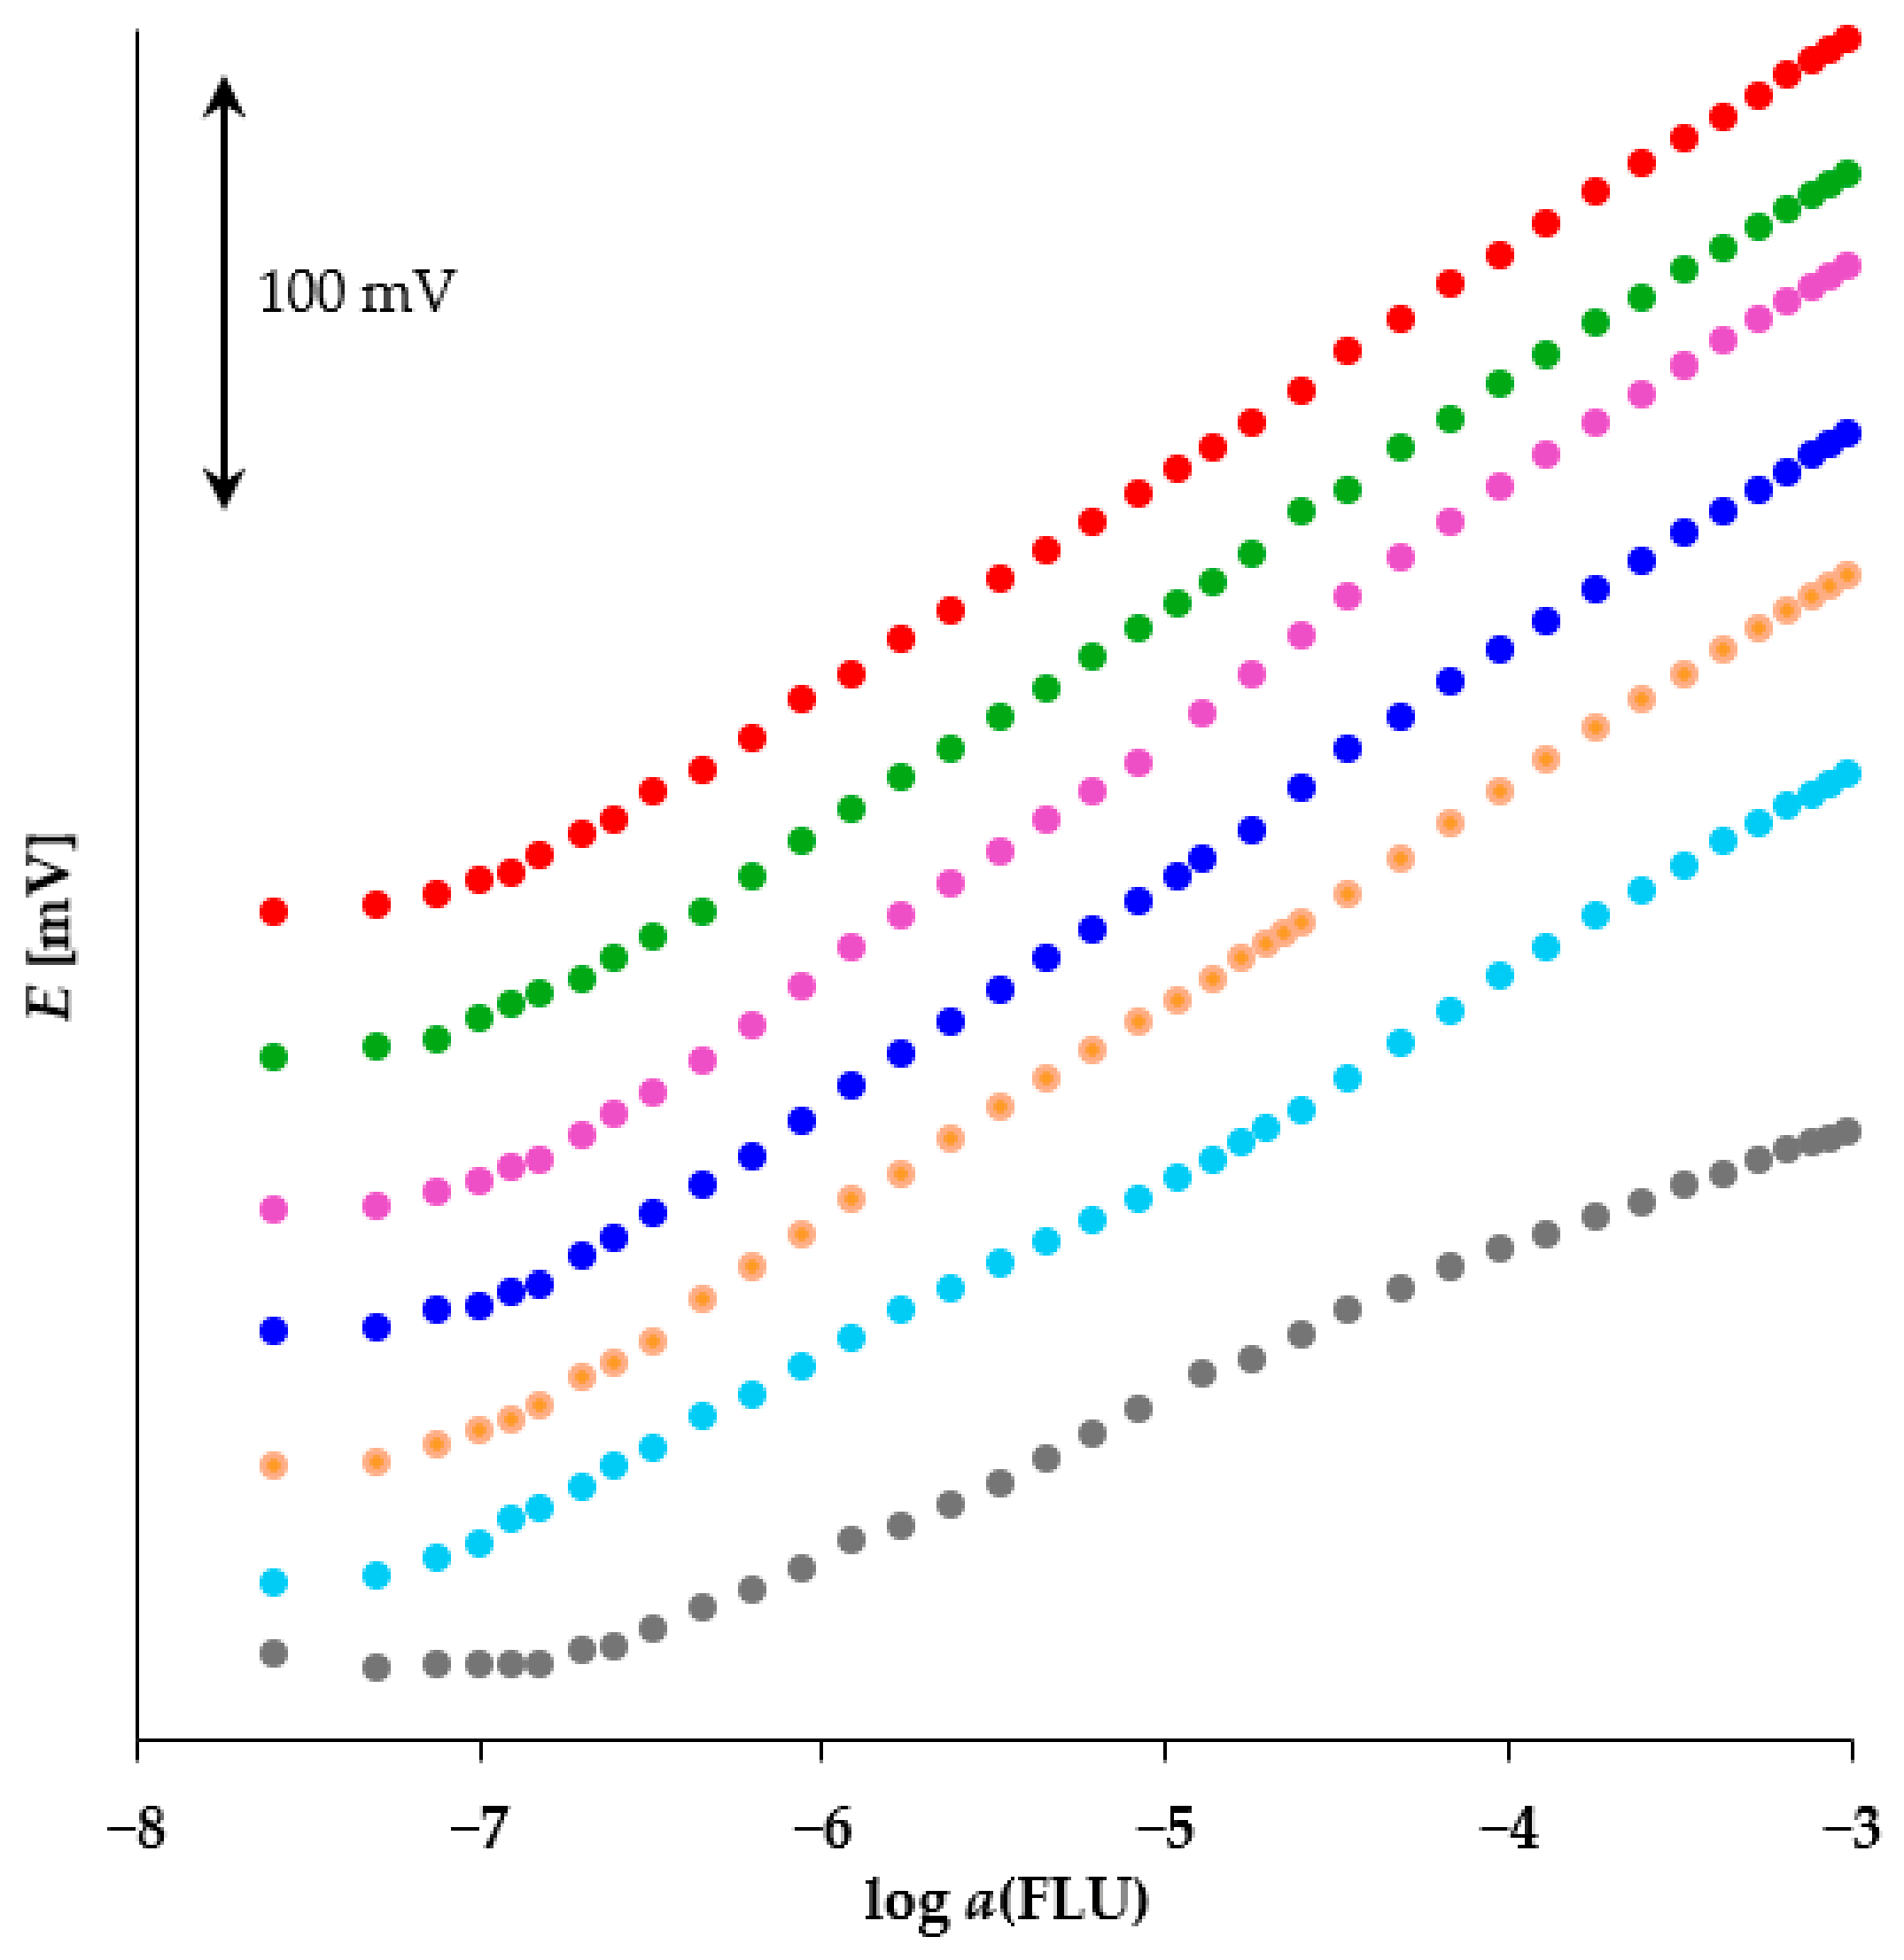
After selecting the optimal plasticizer, the membrane composition was further optimized by varying the MIP content, as the sensing material has the greatest influence on the sensor’s analytical performance. For this purpose, six new sensors with membranes containing different MIP contents (1.0%, 5.0%, 10.0%, 12.5%, 15.0%, and 20.0%) were prepared. In all membranes investigated, DS was used as the plasticizer, and the plasticizer-to-PVC weight ratio was 2:1. As previously described, the potentiometric response of the sensors toward FLU was investigated within the concentration range from 2.5 × 10⁻⁸ M to 1.0 × 10⁻³ M. Table 2 and Figure 3 summarize the results. It can be observed that all investigated sensors exhibited a sub-Nernstian response toward FLU, with the same measuring range and comparable LOD values. Furthermore, increasing the MIP content resulted in an increase in the slope value up to an MIP content of 12.5%, followed by a decrease at higher MIP contents. This behavior can be attributed to an excessive amount of MIP in the membrane, which may cause membrane heterogeneity, disrupt its physical structure, and alter the balance between the membrane components [45]. Consequently, the sensor containing 12.5% MIP exhibited the slope value closest to the Nernstian slope (56.1 mV/decade of activity) and was therefore selected for further investigations.
Table 2.
Analytical characteristics of MIP-FLU sensors containing DS as the plasticizer and different MIP contents 1.
Figure 3.
Potentiometric responses toward FLU obtained with MIP-FLU sensors containing different MIP contents (• 1.0%, • 5.0%, • 10.0%, • 12.5%, • 15.0%, and • 20.0%) and with the NIP-based sensor (•). Some curves are vertically offset for clarity.
To further evaluate the contribution of the MIP to the sensor response, an NIP-based sensor containing 12.5% NIP was prepared. The remaining membrane components were kept identical to those of the optimized MIP-based sensor. The potentiometric response of the NIP-based sensor toward FLU is presented in Figure 3. It can be seen that the NIP-based sensor exhibited significantly poorer analytical performance compared with the MIP-based sensors, characterized by a lower slope, a narrower measuring range, and a higher LOD. This can be attributed to the absence of specific recognition sites formed during the imprinting process, confirming the important role of molecular imprinting in FLU recognition.
A comparison of the proposed MIP-FLU sensor with other sensors for FLU determination is presented in Table S1 [46]. It can be seen that only two published studies have reported potentiometric determination of FLU, and neither employed an MIP as the sensing material.
3.3. Dynamic Response of the MIP-FLU Sensor
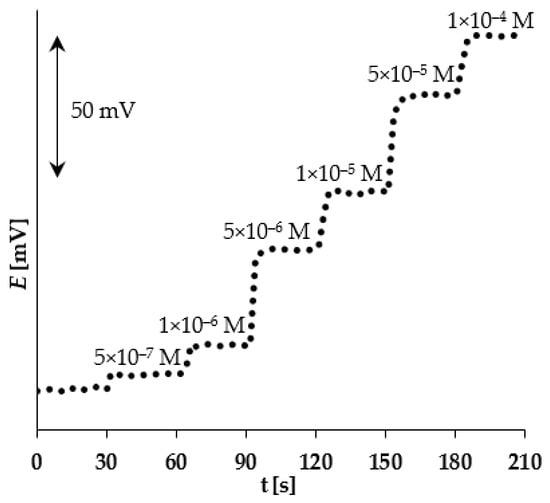
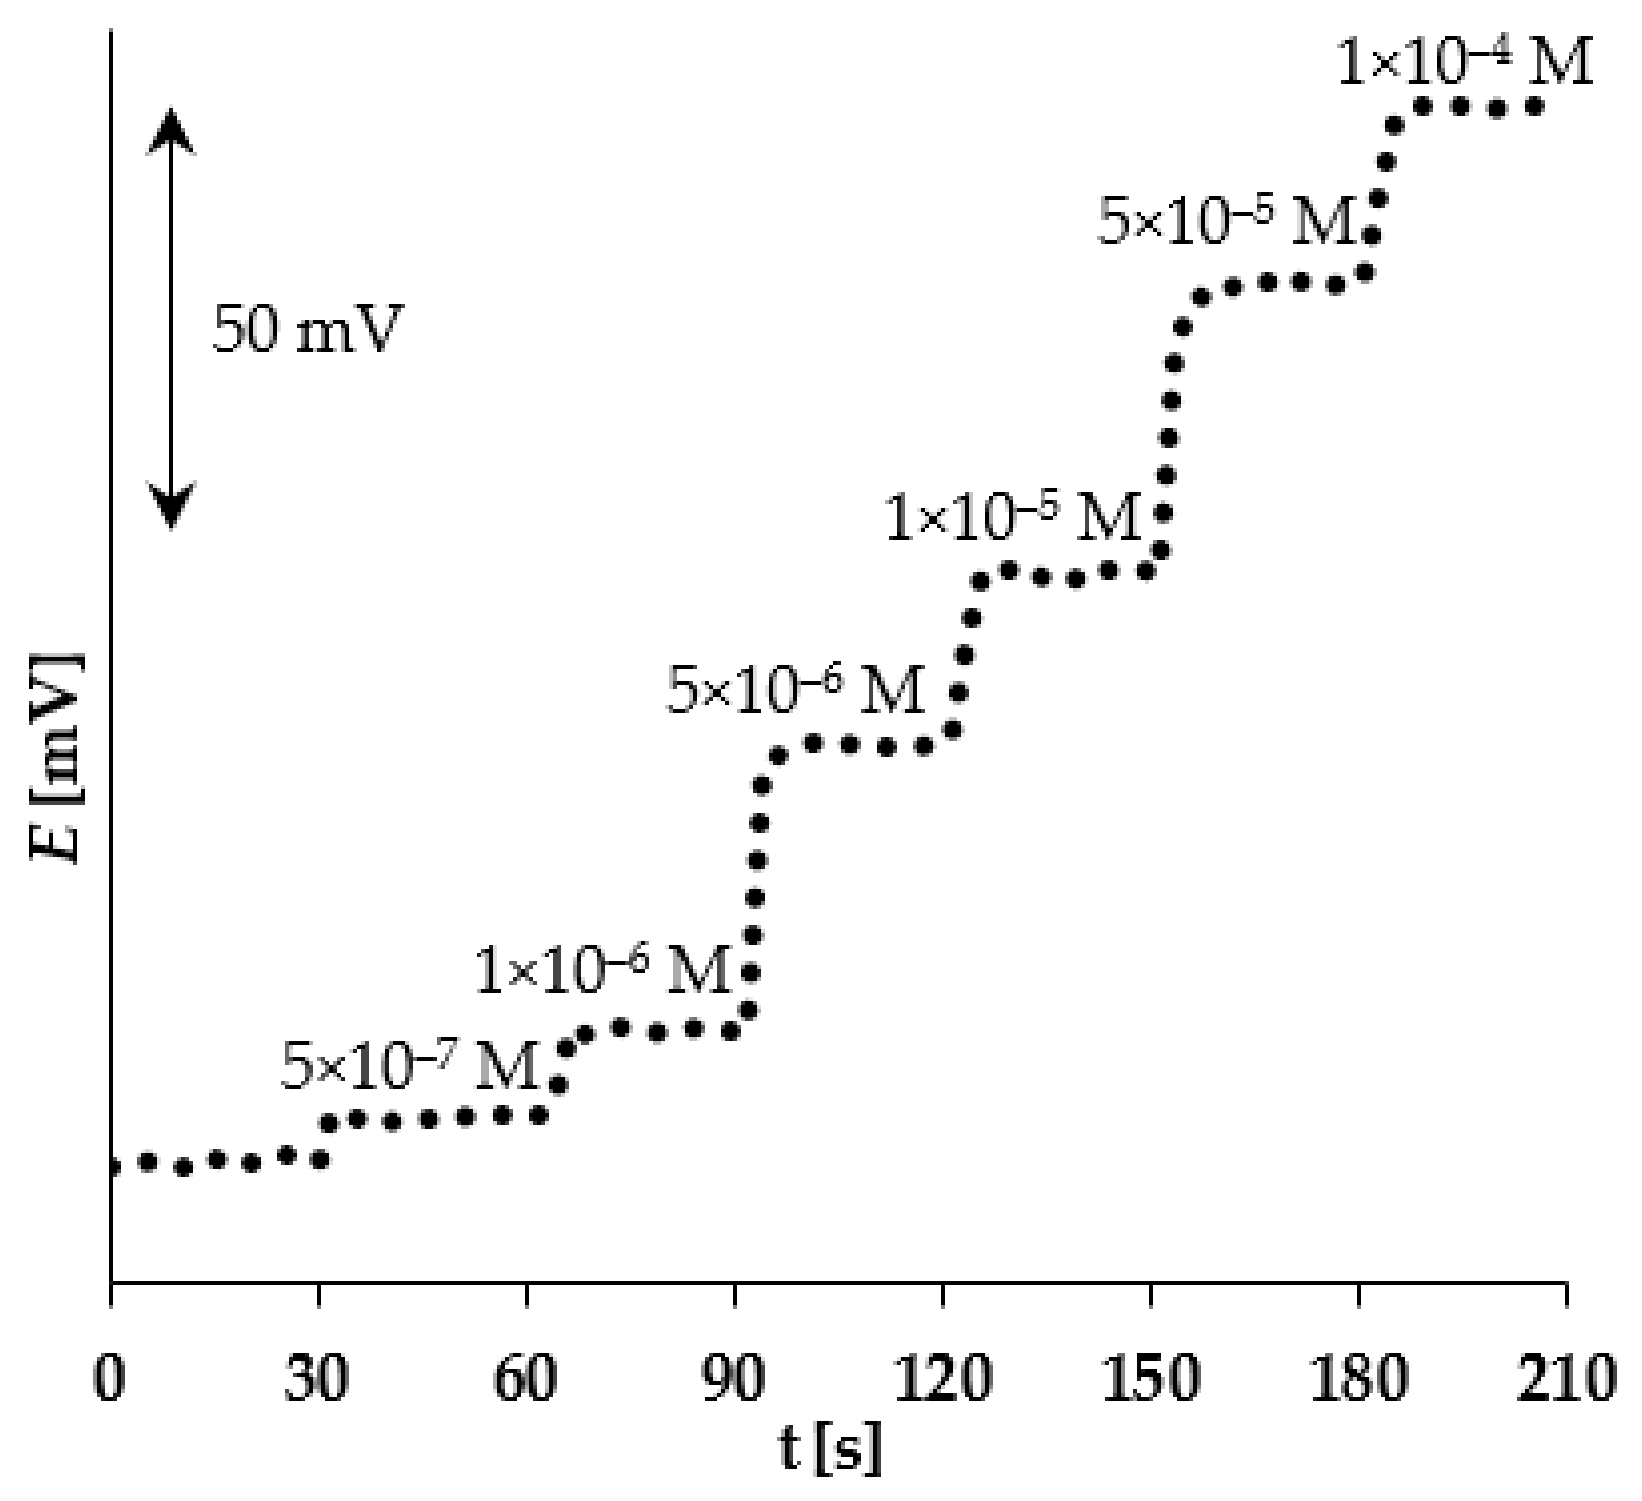
The dynamic response time is defined as the time required for the sensor to reach 90% of its final potential value after a sudden change in analyte concentration [47]. It was evaluated to determine how fast the MIP-FLU sensor responds to changes in FLU concentration. For this purpose, the FLU concentration was increased stepwise in the solution from 0 (pure water) to 1.0 × 10⁻⁴ M at 30 s intervals. Figure 4 shows the resulting response curve. The rapid potential stabilization after each FLU addition indicates a fast response of the MIP-FLU sensor, with an average response time of 5 s.
Figure 4.
Dynamic response of the MIP-FLU sensor.
3.4. Stability of the MIP-FLU Sensor
3.4.1. Signal Drift of the MIP-FLU Sensor
Signal drift reflects gradual, non-random changes in sensor potential over time under constant solution composition and temperature [40]. Low signal drift indicates good long-term sensor stability. The signal drift of the MIP-FLU sensor was determined in a 2.0 × 10⁻³ M FLU solution by linear regression analysis. The potential-time dependence was described by the regression equation E (mV) = −0.00019 × t (s) + 32.78, corresponding to an average signal drift of −0.6 mV/h measured over a 3 h period.
3.4.2. Lifetime of the MIP-FLU Sensor
The lifetime of the sensor refers to the period during which it retains its analytical characteristics and can be reliably used for FLU determination. Usually, a decrease in the slope value of approximately 10–15% is considered an indication of the end of the sensor’s lifetime [48]. The lifetime of the MIP-FLU sensor was evaluated by performing calibration measurements in the FLU concentration range from 1.0 × 10⁻⁵ M to 1.0 × 10⁻³ M prior to daily measurements. The sensor performance was assessed based on changes in the calibration slope over time. With regular daily use, the MIP-FLU sensor maintained its analytical performance for approximately 3.5 months. After this period, a decrease in the slope value of approximately 15% was observed, indicating changes in the membrane properties and a gradual deterioration of the sensor response (Figure S1). Although the sensor remained functional, changes in the calibration parameters indicated decreased analytical performance.
3.5. Selectivity of the MIP-FLU Sensor
Selectivity is a crucial parameter for evaluating the applicability of an ion-selective sensor, particularly for analyzing complex samples containing potentially interfering species. The selectivity of the MIP-FLU sensor was evaluated by determining the potentiometric selectivity coefficients () using the fixed interference method [40]. Figure S2 presents the chemical structures of FLU, used as the target analyte, and the two structurally related triazole antifungal compounds, itraconazole and tioconazole, selected for the selectivity tests. The sensor response was measured in solutions containing a constant concentration of the interfering ion (1.0 × 10⁻² M for all interferents except tioconazole and itraconazole, for which a concentration of 5 × 10⁻⁵ M was used because of their poor water solubility) and varying FLU concentrations (1.0 × 10⁻⁵ M to 1.0 × 10⁻³ M for all interferents except tioconazole and itraconazole, for which the concentration range was 2.5 × 10⁻⁷ M to 2.5 × 10⁻⁵ M. The obtained potentiometric responses were used to calculate values by fitting the Nikolsky–Eisenman equation (Equation (1)) to the experimental data using Solver in Microsoft Excel.
In the Nikolsky–Eisenman equation, E is electrode potential, E° is standard electrode potential, aA and aB represent the activities of FLU and the interfering ion, respectively, while zA and zB correspond to their charge numbers. The calculated values are summarized in Table 3. Values of lower than 1 indicate that the sensor exhibits higher selectivity toward FLU than toward the interfering species [44]. Consequently, lower values are desirable because they indicate better selectivity of the sensor. The obtained results demonstrate excellent selectivity of the MIP-FLU sensor toward FLU, confirming the high recognition capability of the imprinted recognition sites.
Table 3.
Potentiometric selectivity coefficients of the MIP-FLU sensor.
3.6. Analytical Application of the MIP-FLU Sensor
The practical applicability and accuracy of the new MIP-FLU sensor were evaluated by determining FLU in standard solutions and pharmaceutical samples using direct potentiometric measurements and the Gran method [41]. Three standard FLU solutions with concentrations of 5.0 × 10⁻⁴ M, 5 × 10⁻⁵ M, and 5 × 10⁻⁶ M were prepared. For FLU determination in pharmaceutical samples, Fluconazole Kabi solution for infusion was diluted with deionized water to obtain FLU concentrations corresponding to those of the standard solutions, based on the declared FLU content of the formulation.
For direct potentiometric measurements, the potentials of FLU solutions with known concentrations were measured, and the FLU concentrations were calculated using the linear equation obtained from the calibration curve.
The Gran method, based on the standard addition principle, was additionally applied for FLU determination. Aliquots of FLU standard solution (V = 1 mL, c = 2.0 × 10⁻³ M) were successively added to 15 mL of the analyzed solution in eight increments, and the potential was measured after each addition. The measured potential was related to the FLU concentration according to Equation (2):
where k is a constant, S is the sensor slope, and c is the FLU concentration. After rearrangement, it follows
E = k + S log c
The FLU concentration after each standard addition was calculated as follows:
where cx and cs are the FLU concentrations before standard addition and in the standard solution, respectively. V0 and Vs are the volume of the FLU solution before standard addition and the volume of the added standard solution, respectively. Combining Equations (3) and (4) gives:
After rearrangement, it follows:
Dividing the sensor response obtained after standard addition by the response before standard addition and rearranging gives Equations (7) and (8):
where E1 and E0 represent the measured potential after and before standard addition, respectively. The linear relationship obtained from plotting against csVs was used for determination of FLU amount initially present in the sample. The x-intercept of the obtained line corresponds to the negative value of the analyte amount before standard additions. Based on this value and the known sample volume, the FLU concentration in the analysed solution can be calculated. Figure S3 presents an example of Gran plot obtained for determining FLU in a standard FLU solution (c = 5.0 × 10⁻⁵ M) using the MIP-FLU sensor.
Table 4 summarizes the results obtained by direct potentiometry and the Gran method. The obtained FLU concentrations were in good agreement with the expected values, confirming the suitability of the MIP-FLU sensor for FLU determination in both standard solutions and pharmaceutical samples. As expected, the Gran method showed slightly better agreement, with all calculated recoveries within ±10%. This can be attributed to the multiple standard additions involved in the Gran method, which can reduce the influence of potential measurement errors and matrix effects. Based on these results, both approaches can be used for FLU determination, with the Gran method providing slightly better accuracy, while direct potentiometry offers a simpler and faster alternative.
Table 4.
Comparative results of FLU determination in standard solutions and pharmaceutical samples using direct potentiometry and the Gran method with the MIP-FLU sensor 1.
4. Conclusions
A new MIP-based potentiometric sensor for FLU determination was successfully developed and optimized. A key advantage of the proposed sensor is the use of the MIP as the sensing material, which provides highly selective recognition of FLU. In addition, optimization of the membrane composition, involving six plasticizers and six MIP contents, resulted in favorable analytical performance. The selected sensor exhibited a very fast response, good signal stability, a long lifetime, near-Nernstian behavior, a wide measuring range, and a low LOD, enabling reliable FLU determination. Its applicability was confirmed by analyzing standard solutions and pharmaceutical samples, where both direct potentiometry and the Gran method yielded satisfactory results, although the Gran method provided slightly better accuracy. Considering its simplicity, rapid response, and good analytical performance, the proposed sensor represents a suitable approach for FLU determination in pharmaceutical samples. Moreover, the sensor is very simple to use, the measurements are not time-consuming, no complicated sample preparation is required, and the method does not involve the use of large amounts of toxic solvents. A limitation of the present study is that the sensor’s applicability has so far been demonstrated only in pharmaceutical samples, while its performance in biological fluids remains to be investigated. Nevertheless, the results demonstrate the potential of the proposed MIP-FLU sensor for further investigation and possible application for FLU determination in other types of samples.
Supplementary Materials
The following supporting information can be downloaded at https://www.mdpi.com/article/10.3390/chemosensors14100221/s1, Figure S1: Potentiometric responses toward FLU obtained with MIP-FLU sensor (• new sensor, • sensor after approximately 3.5 months with daily measurements); Figure S2: Structural formulas of: (a) FLU; (b) itraconazole; (c) tioconazole; Figure S3: Gran plot obtained for the determination of FLU in a standard FLU solution (c = 5.0 × 10⁻⁵ M) using the MIP-FLU sensor; Table S1: The comparison of the performance of the new MIP-FLU sensor with the performance of other sensors for FLU determination.
Author Contributions
Conceptualization, M.B. and M.S.; methodology, M.B., A.D. and M.S.; validation, M.B., A.D. and M.S.; formal analysis, M.B., K.K., A.D., A.S. and M.S.; investigation, M.B., K.K., A.D., A.S. and M.S.; resources, M.B., A.D., A.S. and M.S.; writing—original draft preparation, M.B., A.D. and M.S.; writing—review and editing, M.B., A.D. and M.S.; visualization, M.B., K.K., A.D. and M.S.; supervision, M.B. and M.S.; project administration, M.B. and M.S.; funding acquisition, M.B. and M.S. All authors have read and agreed to the published version of the manuscript.
Funding
This research was funded by the European Union—Next Generation EU under the number 581-UNIOS-105. However, the views and opinions expressed are solely those of the authors and do not necessarily reflect those of the European Union or the European Commission. Neither the European Union nor the European Commission can be held responsible for them.
Institutional Review Board Statement
Not applicable.
Informed Consent Statement
Not applicable.
Data Availability Statement
Dataset available on request from the authors.
Conflicts of Interest
The authors declare no conflicts of interest. The funders had no role in the design of the study; in the collection, analyses, or interpretation of data; in the writing of the manuscript; or in the decision to publish the results.
Abbreviations
The following abbreviations are used in this manuscript:
| ACN | Acetonitrile |
| AcOH | Acetic acid |
| BEHS | Bis(2-ethylhexyl) sebacate |
| BZO | Benzoyl peroxide |
| DBP | Dibutyl phthalate |
| DOP | Bis(2-ethylhexyl) phthalate |
| DS | Dibutyl sebacate |
| DSC | Differential scanning calorimetry |
| FLU | Fluconazole |
| ISE | Ion-selective electrode |
| LOD | Limit of detection |
| MAA | Methacrylic acid |
| MeOH | Methanol |
| MIP | Molecularly imprinted polymer |
| MIP-FLU sensor | MIP-based potentiometric FLU-selective sensor |
| MS | Mass spectroscopy |
| NIP | Non-imprinted polymer |
| NPPE | 2-nitrophenyl phenyl ether |
| o-NPOE | o-nitrophenyl octyl ether |
| PMAA | Poly(methacrylic) acid |
| PVC | Poly(vinyl chloride) |
| TG | Thermogravimetric |
| THF | Tetrahydrofuran |
| TRIM | Trimethylolpropane trimethacrylate |
References
- Sabino, R.; Antunes, F.; Araujo, R.; Bezerra, A.R.; Brandão, J.; Carneiro, C.; Carvalho, A.; Carvalho, D.; Conceição, I.C.; Cota Medeiros, F.; et al. Addressing Critical Fungal Pathogens under a One Health Perspective: Key Insights from the Portuguese Association of Medical Mycology. Mycopathologia 2025, 190, 73. [Google Scholar] [CrossRef] [Scilit] [PubMed]
- Oliveira do Nascimento, M.; Lima Guedes, I.; Alves Lopes Junior, C.; Juan Chavez Gutierrez, S.; Medeiros Barreto, H.; Luis Menezes Carvalho, A. Validation of Spectrophotometric Methods for the Simultaneous Determination of Fluconazole and Riparin B in the Development of Lipid Nanoparticles Modified by β-Cyclodextrin: Application for in Vitro Characterization and Ex Vivo Studies of Nail Retention. Microchem. J. 2024, 200, 110387. [Google Scholar] [CrossRef] [Scilit]
- Daneshnia, F.; de Almeida Júnior, J.N.; Ilkit, M.; Lombardi, L.; Perry, A.M.; Gao, M.; Nobile, C.J.; Egger, M.; Perlin, D.S.; Zhai, B.; et al. Worldwide Emergence of Fluconazole-Resistant Candida Parapsilosis: Current Framework and Future Research Roadmap. Lancet Microbe 2023, 4, e470. [Google Scholar] [CrossRef] [PubMed]
- Adomi, P.O.; Oshevire, A.E. Effect of Fluconazole on Fungi Isolates from Fruits and Vegetables. Trop. J. Biol. Sci. 2025, 1, 1–8. [Google Scholar] [CrossRef] [Scilit]
- Aldana, J.C.; Rodríguez, E.; Acero, J.L.; Álvarez, P.M. Insights into the Degradation of Fluconazole in Water by Some Light-Based AOPs. Sep. Purif. Technol. 2026, 394, 137489. [Google Scholar] [CrossRef] [Scilit]
- Fahy, W.D.; Zhang, Z.; Wang, S.; Li, L.; Mabury, S.A. Environmental Fate of the Azole Fungicide Fluconazole and Its Persistent and Mobile Transformation Product 1,2,4-Triazole. Environ. Sci. Technol. 2025, 59, 3239–3251. [Google Scholar] [CrossRef] [Scilit] [PubMed]
- Alshehri, A.; Alqahtani, A.; Alqahtani, T.; Alqahtani, S.; Almrasy, A.A. Green and Sustainable Determination of Fluconazole Using a Box–Behnken Optimized Zn-CQDs Fluorescence Quenching Approach: Application to Pharmaceutical Formulations and Pharmacokinetic Studies. Luminescence 2025, 40, e70213. [Google Scholar] [CrossRef] [Scilit] [PubMed]
- Sanada, T.; Yoshida, N.; Kimura, K.; Tsuboi, H. Detection Method of Falsified Medicines by Using a Low-Cost Raman Scattering Spectrometer Combined with Soft Independent Modeling of Class Analogy and Partial Least Squares Discriminant Analysis. Biol. Pharm. Bull. 2021, 44, 691–700. [Google Scholar] [CrossRef] [Scilit] [PubMed]
- Marchetti, O.; Majcherczyk, P.A.; Glauser, M.P.; Bille, J.; Moreillon, P.; Sanglard, D. Sensitive Bioassay for Determination of Fluconazole Concentrations in Plasma Using a Candida Albicans Mutant Hypersusceptible to Azoles. Antimicrob. Agents Chemother. 2001, 45, 696–700. [Google Scholar] [CrossRef] [Scilit] [PubMed]
- Wang, Y.; Zhang, G.; Zhang, N.; Dong, L.; Liang, B.; Cai, Y. Simultaneous Determination of a Four-Triazole Antifungal Panel in Human Plasma by LC-MS/MS for Clinical Therapeutic Drug Monitoring. Microchem. J. 2026, 224, 117877. [Google Scholar] [CrossRef] [Scilit]
- Adamiszak, A.; Czyrski, A.; Sznek, B.; Grześkowiak, E.; Bienert, A. The Application of the Design of Experiments and Artificial Neural Networks in the Development of a Fast and Straightforward HPLC-UV Method for Fluconazole Determination in Hemato-Oncologic Pediatric Patients and Its Adaptation to Therapeutic Drug Monitoring. Pharmaceuticals 2024, 17, 1679. [Google Scholar] [CrossRef] [Scilit] [PubMed]
- Valero Rivera, K.P.; Aquino, M.M.; Azúa, J.S.; del Carmen Romero Méndez, M.; Medellín Garibay, S.E.; del Carmen Milán Segovia, R.; Gutiérrez, F.M.; Moreno, S.R. UPLC-MS/MS Method for Fluconazole Determination in Plasma and Its Application in Mexican Patients with Candidaemia. Bioanalysis 2024, 16, 1045–1053. [Google Scholar] [CrossRef] [Scilit] [PubMed]
- Budetić, M.; Samardžić, M.; Bubnjar, K.; Dandić, A.; Živković, P.; Széchenyi, A.; Kiss, L. A New Sensor for Direct Potentiometric Determination of Thiabendazole in Fruit Peels Using the Gran Method. Food Chem. 2022, 392, 133290. [Google Scholar] [CrossRef] [Scilit] [PubMed]
- Sharma, N.; Sanan, R. Cheap and Effective Potentiometric PVC Sensor for the Determination of Imidazolium Based Ionic Liquids in Aqueous and Aqua-Organic Media. J. Ion. Liq. 2024, 4, 100095. [Google Scholar] [CrossRef] [Scilit]
- Dyab, A.; Darwish, M.; Al Rahal, F.; Moustapha, A. Selective Ion-Pair Potentiometric Sensor for the Determination of Ondansetron Hydrochloride in Different Matrixes. ChemistrySelect 2023, 8, e202204551. [Google Scholar] [CrossRef] [Scilit]
- Özbek, O.; Altunoluk, O.C. Potentiometric Determination of the Local Anesthetic Procaine in Pharmaceutical Samples. Anal. Biochem. 2024, 695, 115657. [Google Scholar] [CrossRef] [Scilit] [PubMed]
- Atayde, E.C.; Edañol, Y.D.G.; Pestaño, M.R.F.; Arco, S.D. A Portable Potentiometric MIP-Based Sensor for the Rapid and Reliable Detection of Clenbuterol. Microchem. J. 2025, 216, 114652. [Google Scholar] [CrossRef] [Scilit]
- Ragab, M.T.; Mouhamed, A.A.; Mahmoud, A.M.; Soudi, A.T. Fabrication of Disposable MIP-Based Electrochemical Sensor for Sensitive Point-of-Care Determination of Atomoxetine in Pharmaceutical and Biological Samples. Microchem. J. 2026, 222, 117056. [Google Scholar] [CrossRef] [Scilit]
- Wang, X.; Wang, K.; Liang, R. Environmentally Friendly Anti-Biofouling Polymeric Membrane Potentiometric Sensors Based on Imprinted Receptors. Int. J. Electrochem. Sci. 2024, 19, 100564. [Google Scholar] [CrossRef] [Scilit]
- Yang, Q.; Wu, X.; Peng, H.; Fu, L.; Song, X.; Li, J.; Xiong, H.; Chen, L. Simultaneous Phase-Inversion and Imprinting Based Sensor for Highly Sensitive and Selective Detection of Bisphenol A. Talanta 2018, 176, 595–603. [Google Scholar] [CrossRef] [Scilit] [PubMed]
- Rizk, M.; Ramzy, E.; Toubar, S.; Mahmoud, A.M.; El Hamd, M.A.; Helmy, M.I. Graphene-Modified Copper Microfabricated Solid-Contact Ion-Selective Electrode for Sustainable Potentiometric Determination of Lofexidine HCl with Docking-Guided γ-Cyclodextrin Ionophore. Sustain. Chem. Pharm. 2026, 52, 102471. [Google Scholar] [CrossRef] [Scilit]
- Hussein, O.G.; Rezk, M.R.; Mahmoud, A.M.; Wadie, M. Dual-Sensor Potentiometric Platform Utilizing β-Cyclodextrin Ionophores and Cu-Gallic MOFs for Ophthalmic Drugs Determination in Rabbit Aqueous Humor. Sens. Biosens. Res. 2026, 52, 101000. [Google Scholar] [CrossRef] [Scilit]
- Heragy, M.O.; Tantawy, M.A.; Moustafa, A.A.M.; Elghobashy, M.R.; El-Mosallamy, S.S. Molecularly Imprinted Metal-Organic Framework-Based Potentiometric Sensor for Sensitive Detection of Torsemide in Dietary Supplements and Milk. Food Chem. 2026, 517, 149504. [Google Scholar] [CrossRef] [Scilit] [PubMed]
- Elashery, S.E.A.; Attia, N.F.; El Badry Mohamed, M. Exploitation of 2D Mn-MOF Nanosheets for Developing Rapid, Sensitive, and Selective Sensor for Determination of Mn(II) Ions in Food and Biological Samples. Talanta 2025, 294, 128217. [Google Scholar] [CrossRef] [Scilit] [PubMed]
- Ghoniem, N.S.; Algmaal, S.E.; Boltia, S.A.; El Saharty, Y.S. Solid-State Potentiometric Sensor for the Determination of Pregabalin in Urine and Plasma: A Proof-of-Concept for Therapeutic and Abuse Monitoring. Microchem. J. 2026, 226, 118528. [Google Scholar] [CrossRef] [Scilit]
- Fares, N.V.; Ali, Y.Y.; Abbas, M.M.; Ayad, M.F. A Novel Copper Oxide–MWCNTs Nanocomposite Graphite Sensor: The First Synergistic and Eco-Friendly Potentiometric Platform for Edaravone Monitoring in Human Plasma. Microchem. J. 2026, 226, 118421. [Google Scholar] [CrossRef] [Scilit]
- Zahran, E.M.; New, A.; Gavalas, V.; Bachas, L.G. Polymeric Plasticizer Extends the Lifetime of PVC-Membrane Ion-Selective Electrodes. Analyst 2014, 139, 757–763. [Google Scholar] [CrossRef] [Scilit] [PubMed]
- Sakač, N.; Madunić-Čačić, D.; Karnaš, M.; Đurin, B.; Kovač, I.; Jozanović, M. The Influence of Plasticizers on the Response Characteristics of the Surfactant Sensor for Cationic Surfactant Determination in Disinfectants and Antiseptics. Sensors 2021, 21, 3535. [Google Scholar] [CrossRef] [Scilit] [PubMed]
- Chen, L.; Wang, X.; Lu, W.; Wu, X.; Li, J. Molecular Imprinting: Perspectives and Applications. Chem. Soc. Rev. 2016, 45, 2137–2211. [Google Scholar] [CrossRef] [Scilit] [PubMed]
- Alexander, C.; Andersson, H.S.; Andersson, L.I.; Ansell, R.J.; Kirsch, N.; Nicholls, I.A.; O’Mahony, J.; Whitcombe, M.J. Molecular Imprinting Science and Technology: A Survey of the Literature for the Years up to and Including 2003. J. Mol. Recognit. 2006, 19, 106–180. [Google Scholar] [CrossRef] [Scilit] [PubMed]
- Cormack, P.A.G.; Elorza, A.Z. Molecularly Imprinted Polymers: Synthesis and Characterisation. J. Chromatogr. B 2004, 804, 173–182. [Google Scholar] [CrossRef] [Scilit] [PubMed]
- Wang, J.; Liang, R.; Qin, W. Molecularly Imprinted Polymer-Based Potentiometric Sensors. TrAC Trends Anal. Chem. 2020, 130, 115980. [Google Scholar] [CrossRef] [Scilit]
- Whitcombe, M.J.; Chianella, I.; Larcombe, L.; Piletsky, S.A.; Noble, J.; Porter, R.; Horgan, A. The Rational Development of Molecularly Imprinted Polymer-Based Sensors for Protein Detection. Chem. Soc. Rev. 2011, 40, 1547–1571. [Google Scholar] [CrossRef] [Scilit] [PubMed]
- Haupt, K.; Mosbach, K. Molecularly Imprinted Polymers and Their Use in Biomimetic Sensors. Chem. Rev. 2000, 100, 2495–2504. [Google Scholar] [CrossRef] [Scilit] [PubMed]
- Karim, K.; Breton, F.; Rouillon, R.; Piletska, E.V.; Guerreiro, A.; Chianella, I.; Piletsky, S.A. How to Find Effective Functional Monomers for Effective Molecularly Imprinted Polymers? Adv. Drug Deliv. Rev. 2005, 57, 1795–1808. [Google Scholar] [CrossRef] [Scilit] [PubMed]
- Yan, H.; Kyung, H.R. Characteristic and Synthetic Approach of Molecularly Imprinted Polymer. Int. J. Mol. Sci. 2006, 7, 155–178. [Google Scholar] [CrossRef] [Scilit]
- Manzoor, S.; Buffon, R.; Rossi, A.V. Molecularly Imprinted Solid Phase Extraction of Fluconazole from Pharmaceutical Formulations. Talanta 2015, 134, 1–7. [Google Scholar] [CrossRef] [Scilit] [PubMed]
- Ershad, S.; Kangari, S. Preparation of a Fluconazole Potentiometric Sensor and Its Application to Pharmaceutical Analysis and to Drug Recovery from Biological Fluids. Int. J. Electrochem. Sci. 2009, 4, 1100–1108. [Google Scholar] [CrossRef] [Scilit]
- Hussein, L.A.; El-Kosasy, A.M.; Trabik, Y.A. Comparative Study of Normal, Micro- & Nano-Sized Iron Oxide Effect in Potentiometric Determination of Fluconazole in Biological Fluids. RSC Adv. 2015, 5, 37957–37963. [Google Scholar] [CrossRef] [Scilit]
- Buck, R.P.; Lindner, E. Recommendations for Nomenclature of Ionselective Electrodes (IUPAC Recommendations 1994). Pure Appl. Chem. 1994, 66, 2527–2536. [Google Scholar] [CrossRef] [Scilit]
- Eggins, B.R. Chemical Sensors and Biosensors; J. Wiley: Hoboken, NJ, USA, 2002; ISBN 9780471899136. [Google Scholar]
- García, D.M.; Escobar, J.L.; Bada, N.; Casquero, J.; Hernáez, E.; Katime, I. Synthesis and Characterization of Poly(Methacrylic Acid) Hydrogels for Metoclopramide Delivery. Eur. Polym. J. 2004, 40, 1637–1643. [Google Scholar] [CrossRef] [Scilit]
- Desai, S.R.; Shaikh, M.M.; Dharwadkar, S.R. Thermoanalytical Study of Polymorphic Transformation in Fluconazole Drug. Thermochim. Acta 2003, 399, 81–89. [Google Scholar] [CrossRef] [Scilit]
- Umezawa, Y.; Bühlmann, P.; Umezawa, K.; Tohda, K.; Amemiya, S. Potentiometric Selectivity Coefficients of Ion-Selective Electrodes Part I. Inorganic Cations (Technical Report). Pure Appl. Chem. 2000, 72, 1851–2082. [Google Scholar] [CrossRef] [Scilit]
- Zhang, H.; Yao, R.; Wang, N.; Liang, R.; Qin, W. Soluble Molecularly Imprinted Polymer-Based Potentiometric Sensor for Determination of Bisphenol AF. Anal. Chem. 2018, 90, 657–662. [Google Scholar] [CrossRef] [Scilit] [PubMed]
- Zad, Z.R.; Davarani, S.S.H.; Taheri, A.; Bide, Y. A Yolk Shell Fe3O4 @PA-Ni@Pd/Chitosan Nanocomposite -Modified Carbon Ionic Liquid Electrode as a New Sensor for the Sensitive Determination of Fluconazole in Pharmaceutical Preparations and Biological Fluids. J. Mol. Liq. 2018, 253, 233–240. [Google Scholar] [CrossRef] [Scilit]
- Maccà, C. Response Time of Ion-Selective Electrodes: Current Usage versus IUPAC Recommendations. Anal. Chim. Acta 2004, 512, 183–190. [Google Scholar] [CrossRef] [Scilit]
- Özbek, O.; Berkel, C.; Altunoluk, O.C.; Eski, I.M.; Wardak, C. Recent Advances in Potentiometric Analysis of Rare Earth Metals: The Need for Further Research. MRS Bull. 2026, 51, 989–1005. [Google Scholar] [CrossRef] [Scilit]


Disclaimer/Publisher’s Note: The statements, opinions and data contained in all publications are solely those of the individual author(s) and contributor(s) and not of MDPI and/or the editor(s). MDPI and/or the editor(s) disclaim responsibility for any injury to people or property resulting from any ideas, methods, instructions or products referred to in the content. |
© 2026 by the authors. Licensee MDPI, Basel, Switzerland. This article is an open access article distributed under the terms and conditions of the Creative Commons Attribution (CC BY) license.