


Highlights
What are the main findings?
- •
- In a cross-sectional sample of adult women, nearly half of whom reported an eating-disorder history, childhood trauma and disgust sensitivity each showed a unique association with disordered eating attitudes.
- •
- The two associations were of similar magnitude and remained significant in alternative full-sample specifications, but were attenuated after adjustment for eating-disorder status and were not significant in some within-group and holdout estimates.
What are the implications of the main findings?
- •
- Assessment of disordered eating may benefit from considering both developmental adversity and disgust-related processes.
- •
- Longitudinal and clinically characterized studies are needed to clarify the temporal and clinical significance of these associations.
Abstract
Background/Objectives: Childhood trauma is associated with eating psychopathology, but the psychological processes that may contribute to this association remain insufficiently understood. Disgust sensitivity, the predisposition to experience disgust in response to a range of elicitors, is an underexplored affective trait that has been associated with both developmental adversity and eating pathology. This study examined the unique associations of childhood trauma and disgust sensitivity with disordered eating attitudes in adult women, examining whether disgust sensitivity was associated with disordered eating attitudes beyond childhood trauma, and assessing whether these associations differed in relation to self-reported eating-disorder status. Methods: In this cross-sectional online study, 292 adult women (M age = 37.13 years, SD = 10.34) were recruited without diagnostic pre-screening. Nearly half of the sample (n = 134, 45.9%) reported a current (n = 50) or past (n = 46) eating-disorder diagnosis or self-identified as having an eating disorder without a formal diagnosis (n = 38). Participants completed the Childhood Trauma Questionnaire–Short Form, the Multidimensional Disgust Sensitivity Scale, and the Eating Attitudes Test-26 (EAT-26). Structural equation models in which EAT-26 scores were regressed on latent trauma and disgust factors were estimated as the primary analysis, followed by sensitivity and secondary analyses. Results: The final model, which included two residual covariances added post hoc on the basis of modification indices, showed acceptable but not good fit (CFI = 0.939, RMSEA = 0.067, SRMR = 0.054). Childhood trauma (β = 0.26, 95% CI [0.10, 0.41]) and disgust sensitivity (β = 0.27, 95% CI [0.11, 0.42]) each showed a unique association with disordered eating attitudes, jointly accounting for 19% of the variance in EAT-26 scores. The two structural coefficients did not differ significantly in magnitude. Both associations were attenuated but remained statistically significant after adjustment for age, BMI, and self-reported eating-disorder status (β = 0.17 and 0.15), and within-group estimates were smaller and non-significant in the eating-disorder group. No specific maltreatment subtype or non-hygiene disgust domain added unique prediction beyond the general factors. Conclusions: In this cross-sectional sample enriched for eating-disorder history, childhood trauma and disgust sensitivity showed unique associations of similar magnitude with disordered eating attitudes, which were attenuated after accounting for eating-disorder status. Assessment of disordered eating may benefit from considering both developmental adversity and disgust sensitivity. Longitudinal studies with clinically characterized samples are needed to establish the temporal ordering and clinical relevance of these associations.
1. Introduction
Disordered eating attitudes and behaviors—encompassing restrictive eating, intense preoccupation with weight and body image, and unhealthy weight-control practices—represent a critical, transdiagnostic challenge within global public health [1,2]. In this study, disordered eating attitudes refer to dimensional, self-reported cognitions and behaviors related to eating, weight, and shape, as assessed by screening instruments such as the EAT-26. They are not equivalent to a clinical diagnosis: eating disorders are diagnosed according to the DSM-5-TR criteria [3], which require a persistent disturbance of eating or eating-related behavior (e.g., restriction of energy intake leading to significantly low body weight in anorexia nervosa, or recurrent binge eating with or without inappropriate compensatory behaviors in bulimia nervosa and binge-eating disorder) that significantly impairs physical health or psychosocial functioning. Accordingly, a high EAT-26 score indicates clinically relevant eating concerns that warrant further assessment, but does not establish a diagnosis. Although clinical eating disorders such as anorexia nervosa, bulimia nervosa, and binge eating disorder impose severe individual and healthcare burdens, subclinical eating pathology is substantially more widespread in the general population, particularly among girls and women [4,5]. Subclinical disordered eating frequently precedes full-syndrome psychopathology [6] and is linked to heightened psychological distress, impaired social functioning, medical comorbidities, and diminished quality of life [7,8]. Consequently, identifying the socio-emotional and affective factors associated with these attitudes is important for designing early screening, targeted prevention, and trauma-informed interventions within healthcare systems.
Among environmental risk factors, childhood trauma—understood here as childhood abuse and neglect—has long been recognized as a major transdiagnostic risk factor for adult psychiatric illness, including dysfunctional eating behavior [9,10]. Exposure to early interpersonal trauma during key developmental windows may disrupt neurobiological and emotional maturation, leaving individuals vulnerable to long-term affective dysregulation [11]. Historically, clinical research on trauma and eating pathology prioritized overt, acute events, such as physical or sexual abuse [12]. However, a growing body of literature highlights that non-physical, relational forms of trauma—specifically emotional abuse and emotional neglect—may exert an equally profound, if not more persistent, impact on psychological functioning and bodily self-representation [13,14]. Chronic emotional invalidation, rejection, or verbal humiliation during childhood may impair the development of functional coping, so that dysfunctional eating attitudes (e.g., rigid control over body shape or food intake) come to serve as strategies to regulate overwhelming negative affect and restore a sense of bodily control [15,16]. Recent syntheses have reinforced these findings: a meta-analysis of observational studies found that childhood maltreatment was associated with more than twice the odds of an eating disorder [17], and a systematic review has proposed that childhood maltreatment be regarded as an etiological factor shaping a distinct “maltreated eco-phenotype” of eating disorders [18]. In community adults, emotional abuse and emotional neglect assessed with the CTQ-SF have also been associated with disordered eating [19].
In parallel with interpersonal trauma, visceral affective processes—most notably disgust sensitivity—have received increasing attention in research on the development and maintenance of eating pathology [20,21]. From an evolutionary perspective, disgust is a defensive emotion that protects the organism from contamination, disease, and physical harm [22]. However, disgust extends beyond food avoidance into multiple domains, including hygiene, moral violations, body envelope breaches, and disease transmission [23,24]. Heightened disgust sensitivity has been linked to body dissatisfaction, bodily shame, and restrictive eating behaviors [25,26]. Individuals with elevated disgust sensitivity may perceive their own bodies, physiological processes, or specific foods through a lens of contamination, prompting avoidance behaviors that manifest as disordered eating [27]. Recent work in adolescents with anorexia nervosa further suggests that self-disgust may account for the association between disgust propensity and negative body image [28], and our previous study found that disgust was related to dissociative symptoms in women with eating disorders [29].
It is important to distinguish disgust sensitivity—the trait-like predisposition to experience disgust in response to different elicitors, which is the construct assessed in the present study—from disgust tolerance (the capacity to endure the experience of disgust) and from emotion regulation (the strategies used to modify emotional responses once they have been elicited) [20,25]. Only disgust sensitivity was directly assessed here; the present data therefore do not speak to disgust tolerance or to how disgust is regulated. Within the measure used in this study, contamination-related disgust is indexed mainly by the hygiene and deterioration/disease domains, whereas the sexual, moral, animal, and body envelope violation domains index other types of elicitors [23].
Despite the recognized roles of both childhood trauma and disgust sensitivity in mental health, important theoretical divergences and gaps remain unresolved. On the one hand, developmental trauma frameworks and clinical evidence suggest that early traumatic experiences not only increase vulnerability to eating disorders [30,31,32] but are also closely linked to dissociative symptoms and altered emotional processing [29]. In this line, heightened disgust sensitivity has been hypothesized to be an emotional sequela of, or a mediating mechanism stemming from, bodily boundary violations during early trauma [33]. On the other hand, cognitive-affective accounts propose that disgust sensitivity operates as a parallel vulnerability factor that may be associated with dysfunctional eating behavior independently of trauma history [25,34]. Furthermore, empirical research rarely examines these constructs simultaneously at the latent level. It remains largely unexplored which specific dimensions of childhood trauma (e.g., emotional vs. physical or sexual abuse) and of disgust sensitivity (e.g., hygiene-related vs. moral, sexual, or pathogen disgust) are most strongly associated with disordered eating attitudes in women when modeled within a unified structural equation modeling framework.
To address these gaps, the primary objective of the present study was to examine the unique associations of latent childhood trauma (assessed with the Childhood Trauma Questionnaire–Short Form, CTQ-SF) and latent multidimensional disgust sensitivity (assessed with the Escala Multidimensional de Sensibilidad al Asco [Multidimensional Disgust Sensitivity Scale], EMA) with disordered eating attitudes (measured with the Eating Attitudes Test-26, EAT-26) in a sample of adult women recruited through an online survey. Specifically, the study evaluated alternative structural models to identify which indicators showed the strongest loadings within each latent construct and whether specific trauma or disgust dimensions contributed beyond the general constructs. Because emotional abuse has been described as the maltreatment type most consistently related to eating psychopathology [13,14], and because eating-related disgust primarily concerns the oral incorporation of contaminants and contamination-based appraisals of food and of one’s own body [25,27,34], three hypotheses were formulated:
H1.
Childhood trauma and disgust sensitivity will each show a significant and unique association with disordered eating attitudes.
H2.
Beyond the general childhood trauma factor, emotional abuse will show a unique association with disordered eating attitudes.
H3.
Contamination-related disgust domains (hygiene and deterioration/disease) will show the strongest loadings on latent disgust sensitivity and will account for its association with disordered eating attitudes, with no incremental contribution of the remaining domains.
2. Materials and Methods
2.1. Participants
The initial sample comprised 330 adult respondents recruited through an online self-report survey (data collection: September 2022–July 2024). The survey was hosted on a secure online platform (Google Forms; Google LLC, Mountain View, CA, USA; https://forms.google.com, accessed on 15 November 2026) and distributed using a multi-channel recruitment strategy. Specifically, the link to the survey was disseminated through professional social media accounts specialized in clinical psychology and psychiatry, as well as shared directly with collaborating clinicians and researchers across participating psychological centers for distribution among potential respondents. Participation was entirely voluntary, and no monetary or non-monetary incentives were provided. Inclusion criteria were identifying as a woman, being 18 years or older, being able to read Spanish, and providing online informed consent; no exclusion criteria based on psychiatric history were applied.
Three respondents who identified as non-binary and 17 who did not know whether they had an eating disorder (ED) were excluded, as were one duplicate record and 17 records in which responses had been shifted by two columns during data export, which invalidated their EAT-26 and EMA scores. These records could not be corrected because the misalignment could not be unambiguously reconstructed. The 17 respondents who did not know whether they had an eating disorder were excluded because their ED status could not be classified; as some of them may have had subclinical eating difficulties, this exclusion may have reduced variability in eating attitudes. The participant flow is shown in Figure S1. The final sample comprised 292 adult women aged 18–65 years (M = 37.13, SD = 10.34; body mass index [BMI], computed from self-reported weight and height: M = 24.64, SD = 5.72, n = 279). Participants completed a detailed clinical characterization protocol assessing age, body mass index (BMI), current and past eating disorder diagnoses, time since diagnosis, history of psychiatric hospitalizations, suicidal ideation, suicide attempts, non-suicidal self-injury, and pharmacological treatment. To preserve participant anonymity and minimize response fatigue given the length of the battery and the sensitive nature of the trauma items, broader sociodemographic indicators (e.g., ethnicity, formal education, socioeconomic status) were not recorded.
Group membership was based on self-report. A total of 158 women reported no history of an eating disorder and were classified as the control group, whereas 134 women were classified into an ED-status group because they reported a current or past eating-disorder diagnosis or self-identified as having an eating disorder without a formal diagnosis. The ED-status group therefore comprised 50 women with a current formal diagnosis, 38 with a self-identified ED without a formal diagnosis, and 46 with a past diagnosis. The self-reported ED types in the ED-status group were binge-eating disorder (n = 35), other specified or unspecified feeding or eating disorder (n = 29), bulimia nervosa (n = 23), anorexia nervosa (n = 22), obesity reported as the eating problem (n = 11), and unknown or unreported type (n = 14); their distribution by subgroup is shown in Table S2. ED status was self-reported and was not verified with a structured diagnostic interview based on DSM-5 criteria [3]; the ED-status group should therefore be understood as women reporting an eating-disorder history, not as a clinically verified diagnostic group. The three subgroups were combined because the main aim was dimensional (associations with EAT-26 scores across the full sample) and ED status was used only as a covariate and grouping factor; the robustness of this decision was examined in a sensitivity analysis restricted to participants with a formal (current or past) diagnosis and controls (Section 2.3).
The sample analyzed in this study partially overlaps with that of a previous study from the same data-collection project (September 2022–July 2024) [29]. In both studies, participants were recruited through collaborating clinical centers, which distributed the survey link to their patients with eating disorders, and through social-media announcements aimed at women with eating disorders and at the general population, and eating-disorder status was based on participants’ responses to the survey. In the previous study, participants who reported an eating disorder or obesity were analyzed as a single clinical group (n = 147) and compared with 158 controls on disgust sensitivity and dissociative symptoms. In the present study, eating-disorder status was coded in more detail, distinguishing current formal diagnoses, past diagnoses and self-identified eating disorders without a formal diagnosis, and respondents who did not know whether they had an eating disorder and records affected by export errors were excluded. The control group is the same in both studies (n = 158), and the 134 women in the ED-status group were also included in the previous study. In that publication, the EAT-26 was used only to screen the control group, and no EAT-26 scores were analyzed or reported; the CTQ-SF was not reported, and none of the structural equation models presented here were examined.
All participants provided informed consent prior to completing the questionnaire battery. Because the CTQ-SF includes sensitive items regarding childhood abuse and neglect, safeguards were implemented to protect participant well-being. The participant information sheet explicitly forewarned respondents about the sensitive nature of the questions, emphasized that participation was strictly voluntary and could be discontinued at any point, and provided contact information for the research team along with resources for seeking professional psychological support. The study protocol received formal approval from the Institutional Review Board and Ethics Committee of the Open University of Madrid (UDIMA, protocol code PSIP220722-4, approved on 22 July 2022), in accordance with the ethical principles outlined in the Declaration of Helsinki.
2.2. Instruments
Childhood Trauma Questionnaire—Short Form (CTQ-SF). The CTQ-SF [35,36,37] was used to assess participants’ history of childhood abuse and neglect. This self-report instrument comprises 28 items, of which 25 are distributed across five subscales: emotional abuse, physical abuse, sexual abuse, emotional neglect, and physical neglect. Each item is rated on a 5-point Likert scale ranging from 1 (never true) to 5 (very often true). Items 2, 5, 7, 13, 19, 26, and 28 are reverse-scored. The remaining three items (10, 16, and 22) form the minimization/denial scale; the number of these items endorsed as very often true was computed and used in the sensitivity analyses. Higher scores indicate greater severity of reported childhood trauma.
In the sample, the total score was M = 49.86 (SD = 18.60), and internal consistency was excellent (α = 0.94). For the subscales, α was 0.87 (emotional abuse), 0.84 (physical abuse), 0.90 (sexual abuse), 0.91 (emotional neglect), and 0.72 (physical neglect). Using the moderate-to-severe thresholds proposed by Bernstein and Fink [38] (emotional abuse ≥ 13, physical abuse ≥ 10, sexual abuse ≥ 8, emotional neglect ≥ 15, physical neglect ≥ 10), 43.2%, 14.4%, 49.7%, 39.4%, and 23.3% of participants, respectively, scored above the cut-off.
Multidimensional Disgust Sensitivity Scale (EMA). The EMA [23] is a 30-item self-report questionnaire designed to assess individual sensitivity or predisposition to experience disgust across six distinct domains, each with five items: (1) hygiene, (2) moral, (3) sexual, (4) body envelope violation, (5) animals, and (6) deterioration/disease. Participants rate the degree of disgust elicited by each item on a 5-point scale ranging from 0 (not at all) to 4 (extremely). In the sample, the total score was M = 52.85 (SD = 18.09), and internal consistency was good (α = 0.88). For the domains, α was 0.71 (hygiene), 0.83 (moral), 0.85 (sexual), 0.82 (body envelope violation), 0.77 (animals), and 0.76 (deterioration/disease).
Eating Attitudes Test-26 (EAT-26). The EAT-26 [39,40] was employed to assess disordered eating attitudes and behaviors. This self-report questionnaire consists of 26 items rated on a 6-point forced-choice scale ranging from 1 (never) to 6 (always). Responses were recoded into the standard 4-point scoring scheme (3 = always, 2 = usually, 1 = often, 0 = sometimes, rarely, or never). For the latent-variable sensitivity analysis, items were assigned by content to the three subscales of Garner et al. [39]—dieting (13 items; α = 0.91), bulimia and food preoccupation (6 items; α = 0.82), and oral control (7 items; α = 0.77). Total scores range from 0 to 78, with higher scores indicating greater severity of problematic eating attitudes; scores ≥ 20 indicate clinically relevant eating concerns [39]. In the sample, the total score was M = 14.59 (SD = 15.64; n = 273), and internal consistency was excellent (α = 0.94). Because low endorsement of this item may reflect individual food preferences rather than eating pathology, it was not included in the latent-variable sensitivity analysis, and its coding was examined in an additional sensitivity analysis (Section 2.3). In the latent-variable analysis, items were assigned by content to the three subscales of Garner et al. [39]—dieting (12 of its 13 items; α = 0.91), bulimia and food preoccupation (6 items; α = 0.82), and oral control (7 items; α = 0.77).
2.3. Statistical Analysis
All analyses were conducted in R version 4.5.2 (R Foundation for Statistical Computing, Vienna, Austria; https://www.R-project.org/, accessed on 15 November 2026) [41]. Confirmatory factor analyses, structural equation models and the Monte Carlo simulation were estimated with the lavaan package, version 0.6-21 [42]; McDonald’s ω was computed with semTools, version 0.5-6 (https://CRAN.R-project.org/package=semTools, accessed on 15 November 2026); the analytic sensitivity power analysis was performed with pwr, version 1.3-0 (https://CRAN.R-project.org/package=pwr, accessed on 15 November 2026); and the data file was imported with haven, version 2.5.4 (https://CRAN.R-project.org/package=haven, accessed on 15 November 2026). Descriptive statistics, internal consistency (Cronbach’s α), and Pearson correlations were computed for all study variables, and univariate normality was examined through skewness and kurtosis. Differences between the control and ED-status groups were tested with Welch’s t tests, and effect sizes were expressed as Cohen’s d based on the pooled standard deviation [43]; given the group sizes, the small-sample correction to Hedges’ g was negligible (correction factor ≈ 0.997). To account for multiple testing across the 16 between-group comparisons, p values were additionally adjusted with the Holm procedure [44].
Structural equation models were estimated with robust maximum likelihood (MLR; Yuan–Bentler scaled χ2) [45,46,47,48]. Missing data (EAT-26: n = 19, 6.5%; BMI: n = 13, 4.5%) were handled with full-information maximum likelihood (FIML) [49]. Model fit was evaluated with the scaled χ2 test, robust Comparative Fit Index (CFI), Tucker–Lewis Index (TLI), Root Mean Square Error of Approximation (RMSEA) with its 90% confidence interval, and Standardized Root Mean Square Residual (SRMR). CFI and TLI values ≥ 0.95, RMSEA ≤ 0.06, and SRMR ≤ 0.08 were considered indicative of good fit, whereas CFI and TLI ≥ 0.90 and RMSEA ≤ 0.08 indicated acceptable fit [45,50]. Nested models were compared with the Satorra–Bentler scaled χ2 difference test [51].
No a priori power analysis was conducted. A sensitivity power analysis was therefore performed, approximating each structural path as the test of a single coefficient in a regression with two correlated predictors (α = 0.05, power = 0.80) [43]. With the 273 participants with EAT-26 data, the study had 80% power to detect unique effects of f2 ≥ 0.029 (partial r ≈ 0.17). In the holdout half (n = 146) and in the control (n = 158) and ED-status (n = 134) subsamples, the minimum detectable effects were f2 ≈ 0.050–0.059 (partial r ≈ 0.22–0.24). Because this approximation does not account for measurement error in the latent variables, it was complemented with a Monte Carlo simulation (300 replications per condition) in which data were generated from the standardized M1c solution with both structural paths set to β = 0.10–0.30 (Table S4). With N = 292, power to detect a path of β = 0.20 was 85% (β = 0.15: 59%); in samples of the size of the holdout half (n = 146) and the ED-status group (n = 134), power for β = 0.20 was only 55–57%, and 80% power required paths of approximately β = 0.25–0.30. The covariance structure of the final model (M1c) comprised 28 free parameters, corresponding to approximately 10 participants per parameter, which is within commonly cited minimum recommendations [45]; the item-level bifactor and multigroup models involved a considerably less favorable ratio; they were therefore considered exploratory and should be interpreted with caution.
The hypothesized model (M1) specified childhood trauma, indicated by the five CTQ-SF subscales, and disgust sensitivity, indicated by the six EMA domains, as correlated latent factors predicting the observed EAT-26 total score (H1). Because M1 did not reach acceptable fit, modification indices were inspected, and residual covariances were added post hoc; only those linking indicators with overlapping content were retained. Because these modifications were data-driven, they may capitalize on sample-specific variance; therefore, results of M1 without residual covariances are reported alongside those of M1c. The resulting model (M1c) was retained as the final model.
Before estimating the structural model, separate confirmatory factor analyses were estimated for the CTQ-SF (five subscales as indicators of one factor) and the EMA (six domains as indicators of one factor), and McDonald’s ω was computed for each latent factor. For the CTQ-SF, a correlated two-factor model (abuse vs. neglect) was compared with the one-factor model, and item-level one-factor, five-correlated-factor, second-order, and bifactor models were compared; for the bifactor model, ω_H and ECV were computed [52], and the model was re-estimated with WLSMV treating items as ordinal. In addition, the EAT-26 was modeled as a latent variable indicated by its three subscales (dieting, bulimia and food preoccupation, and oral control) to examine whether the structural coefficients changed when measurement error in the outcome was taken into account. Standardized factor loadings, the latent correlation, and standardized regression coefficients (β) with 95% confidence intervals (CIs) were examined. The equality of the two structural effects was tested with a Wald test on the difference between their coefficients, estimated with latent variances fixed to 1, and the 95% CI of the unstandardized difference was reported.
The robustness of the primary structural coefficients was examined using the following sensitivity analyses, which were planned before estimating the models but were not preregistered: (a) M1 without residual covariances; (b) a parsimonious model retaining the three disgust indicators with the highest standardized loadings in M1 (M2); (c) a model in which the disgust factor was replaced by the observed EMA total score; (d) M1c controlling for age, BMI, and ED-status group (0 = control, 1 = ED-status); (e) M1c after excluding participants who endorsed at least one CTQ-SF minimization/denial item; (f) M1c with the reverse-keyed EAT-26 item (“Enjoy trying new rich foods”) scored without reversal, because its content may reflect food preferences rather than eating pathology, to verify that results did not depend on the coding of this item;; (g) a split-half cross-validation, in which the sample was randomly divided into two halves, the three disgust indicators with the highest loadings were selected in the first half, and the resulting model was tested in the holdout half; M1c was also estimated in each half, and the equality of its loadings, structural paths, and residual covariances across halves was tested with a multigroup model; (h) M1c restricted to controls and participants with a formal (current or past) ED diagnosis, excluding those with a self-identified ED without a diagnosis, with and without adjustment for age, BMI, and ED group; and (i) M1c controlling for age, BMI, and the three ED subgroups (current, past, and self-identified) as separate dummy variables. M2 was treated as a sensitivity analysis rather than as the primary model. The remaining multigroup, maltreatment-subtype, and bifactor analyses were considered exploratory secondary analyses addressing group differences and the potential specificity of trauma and disgust dimensions, respectively.
To examine whether the associations differed between the control and ED-status groups, M1c was estimated as a multigroup model. Configural, metric (equal factor loadings), and structural (equal loadings and regression paths) models were compared with scaled Δχ2 tests and changes in CFI, with ΔCFI ≤ −0.010 indicating a meaningful deterioration in fit [53,54]. Each regression path was also constrained separately. To test H2, each CTQ-SF subscale was added in turn to the primary structural model (M1c) as a direct predictor of EAT-26 scores, alongside the two latent factors, so that each coefficient reflected the contribution of a specific type of maltreatment beyond the general trauma factor. The resulting p values were adjusted with the Holm procedure [44].
To test H3, an exploratory item-level bifactor confirmatory factor analysis of the EMA was estimated, with a general factor and six orthogonal domain-specific factors. Omega hierarchical (ωH), omega total (ωT), omega hierarchical subscale (ωHS), and explained common variance (ECV) were computed from the standardized solution [52]. Because the hygiene-specific factor could not be separated from the general factor (see Results), a bifactor-(S–1) model with hygiene as the reference domain was used [55]. In this model, the general factor is defined by the hygiene items, and each specific factor captures the variance of a domain that is not shared with hygiene. The general factor and the CTQ-SF factor were entered as predictors of EAT-26 scores, and the incremental contribution of the five specific factors was tested with a scaled Δχ2 test. As robustness checks, the S–1 model was re-estimated allowing correlations among the specific factors, and its measurement part was estimated with weighted least squares mean- and variance-adjusted (WLSMV) estimation, treating the items as ordinal [47].
3. Results
3.1. Preliminary Analyses
Questionnaire scores were complete for all participants except the EAT-26 (n = 273). Physical abuse (skewness = 2.44, kurtosis = 6.24) and physical neglect (skewness = 1.86, kurtosis = 4.52) showed the most marked departures from normality (Table 1). Overall, 86 of the 273 participants with complete EAT-26 data (31.5%) scored at or above the clinical cut-off. All CTQ-SF subscales correlated positively with EAT-26 scores (r = 0.19–0.34), with emotional abuse showing the strongest association. Among the disgust domains, hygiene (r = 0.28), sexual (r = 0.26), deterioration/disease (r = 0.23), moral (r = 0.17), and animal (r = 0.14) disgust correlated positively with EAT-26 scores, whereas body envelope violation did not (r = −0.01).
Table 1.
Descriptive Statistics and Correlations Among Study Variables.
Compared with the control group, the ED-status group reported higher scores on all CTQ-SF subscales (d = 0.31–0.62) and on all disgust domains (d = 0.31–0.53) except body envelope violation (d = −0.02, p = 0.849; Table 2). As expected, EAT-26 scores differed markedly between the control and ED-status groups, t(167.98) = 11.25, p < 0.001, d = 1.45. Among participants with complete EAT-26 data, 74 of 124 women in the ED-status group (59.7%) and 12 of 149 controls (8.1%) scored at or above the clinical cut-off. The groups did not differ in age (p = 0.125), whereas BMI was slightly higher in the ED-status group (d = 0.34, p = 0.007). All differences that were significant at p < 0.05 remained significant after Holm correction across the 16 comparisons (adjusted ps ≤ 0.043).
Table 2.
Comparison Between the Control and ED-Status Groups.
3.2. Structural Model (H1)
The hypothesized model (M1) showed marginal fit, χ2(52) = 138.73, p < 0.001, CFI = 0.908, TLI = 0.883, RMSEA = 0.081, 90% CI [0.065, 0.097], SRMR = 0.060 (Table 3). Inspection of modification indices identified two residual covariances, which were added post hoc to form M1c. These covariances were data-driven rather than specified a priori, although both linked indicators with overlapping content: the first linked emotional and physical neglect, which share omission-type content; the second linked deterioration/disease and body envelope violation, both facets of animal-reminder disgust [56]. M1c fitted significantly better than M1, Δχ2(2) = 27.78, p < 0.001, and showed acceptable fit, χ2(50) = 108.20, p < 0.001, CFI = 0.939, TLI = 0.919, RMSEA = 0.067, 90% CI [0.050, 0.084], SRMR = 0.054. Although these values meet conventional criteria for acceptable fit, CFI and TLI remained below the 0.95 threshold for good fit [50], and part of the improvement over M1 reflects post hoc respecification; the risk of overfitting was examined by comparing M1c with M1 and through cross-validation (Section 3.3). M1c was therefore retained as the primary model (Figure 1). The more parsimonious M2 model was examined only as a sensitivity analysis.
Table 3.
Fit Indices of the Structural Equation Models.
Figure 1.
Final structural model (M1c) with standardized estimates and 95% confidence intervals. Ovals represent latent factors and rectangles observed variables. Single-headed arrows represent factor loadings and regression paths; double-headed arrows represent the latent correlation and the two residual covariances. Standardized loadings ranged from 0.65 to 0.89 for childhood trauma and from 0.31 to 0.83 for disgust sensitivity (see Section 3.2). ζ = residual of EAT-26 scores. ** p < 0.01; *** p < 0.001.
In M1c, standardized loadings ranged from 0.65 to 0.89 for childhood trauma, with emotional abuse as the strongest indicator (λ = 0.89), followed by emotional neglect (λ = 0.73). For disgust sensitivity, loadings ranged from 0.31 to 0.83, with hygiene as the strongest indicator (λ = 0.83) and body envelope violation (λ = 0.31) and moral disgust (λ = 0.34) as the weakest. Unstandardized and standardized loadings, standard errors, and residual variances are reported in Table S1. Both residual covariances were significant (r = 0.29, p < 0.001, in both cases). Childhood trauma (β = 0.26, 95% CI [0.10, 0.41], p = 0.001) and disgust sensitivity (β = 0.27, 95% CI [0.11, 0.42], p < 0.001) each showed a unique association with disordered eating attitudes, and together they explained 19% of its variance (R2 = 0.19). The two latent predictors correlated moderately (r = 0.37, 95% CI [0.22, 0.51], p < 0.001), and their structural effects did not differ significantly (Δb = −0.14, SE = 2.13, 95% CI [−4.31, 4.03], p = 0.948). In the standardized metric, the difference was Δβ = −0.01, 95% CI [−0.28, 0.26]; an equivalence test with bounds of ±0.10 was not significant (p = 0.25). The width of this interval indicates that the data are compatible with differences in either direction; therefore, the absence of a significant difference should not be interpreted as evidence that the two effects are equivalent.
In the separate measurement models (Table S3), the one-factor CTQ-SF model showed adequate fit on CFI and SRMR but a high RMSEA, χ2(5) = 27.95, CFI = 0.949, RMSEA = 0.152, SRMR = 0.037 (ω = 0.86), and the one-factor EMA model showed mediocre fit, χ2(9) = 39.35, CFI = 0.892, RMSEA = 0.113, SRMR = 0.050 (ω = 0.69). The abuse–neglect two-factor model fitted better than the one-factor CTQ-SF model, Δχ2(1) = 9.94, p = 0.002 (CFI = 0.973), but the two factors were very highly correlated (r = 0.89, 95% CI [0.82, 0.95]). At the item level, the bifactor CTQ-SF model (CFI = 0.925, RMSEA = 0.069, SRMR = 0.058) showed a dominant general factor (ω_H = 0.86, ECV = 0.61; WLSMV: ω_H = 0.90, ECV = 0.67), with low reliable specific variance for the subscales (ω_HS = 0.13–0.50). Together, these results support modeling childhood trauma as a single general factor in the structural model. When the EAT-26 was modeled as a latent variable indicated by its three subscales, the model showed good fit, χ2(72) = 134.93, CFI = 0.953, TLI = 0.941, RMSEA = 0.059, SRMR = 0.055, and the structural coefficients were similar to those of M1c (childhood trauma: β = 0.27, 95% CI [0.12, 0.41], p < 0.001; disgust sensitivity: β = 0.22, 95% CI [0.07, 0.38], p = 0.005).
3.3. Sensitivity and Multigroup Analyses
The structural coefficients were broadly robust across alternative specifications (Table 4). Estimates were similar in M1, M2, and when the disgust factor was replaced by the observed EMA total score. Excluding participants who endorsed at least one CTQ-SF minimization/denial item left both effects essentially unchanged, as did scoring the reverse-keyed EAT-26 without reversal. Controlling for age, BMI, and ED group attenuated both effects, but they remained significant (trauma: β = 0.17, 95% CI [0.02, 0.31], p = 0.025; disgust: β = 0.15, 95% CI [0.01, 0.29], p = 0.031). ED group membership showed the largest standardized association (β = 0.54, p < 0.001), and the model explained 35.3% of the variance. When the three ED subgroups were entered as separate covariates, both coefficients remained significant (trauma: β = 0.14, 95% CI [0.01, 0.27], p = 0.033; disgust: β = 0.15, 95% CI [0.02, 0.28], p = 0.020). When the analysis was restricted to controls and participants with a formal (current or past) ED diagnosis (n = 254), the coefficients were similar to those of the full sample (trauma: β = 0.24, 95% CI [0.06, 0.42], p = 0.008; disgust: β = 0.29, 95% CI [0.12, 0.46], p = 0.001); after additional adjustment for age, BMI, and ED group, the disgust coefficient remained significant (β = 0.18, 95% CI [0.02, 0.33], p = 0.023), whereas the trauma coefficient did not (β = 0.15, 95% CI [−0.02, 0.32], p = 0.073).
Table 4.
Standardized Effects on EAT-26 Scores Across Model Specifications.
In the split-half cross-validation, the three indicators selected in the first half (hygiene, deterioration/disease, and sexual disgust) were the same as those retained in M2. In the holdout half, this model showed adequate fit (Table 3). Disgust sensitivity remained significantly associated with EAT-26 scores (β = 0.33, 95% CI [0.04, 0.62], p = 0.024), whereas the trauma coefficient was not statistically significant (β = 0.16, 95% CI [−0.10, 0.41], p = 0.239), consistent with the reduced precision expected in the smaller holdout sample (minimum detectable partial r ≈ 0.23; Section 2.3). M1c also showed acceptable fit in the holdout half, χ2(50) = 84.23, CFI = 0.921, RMSEA = 0.070, SRMR = 0.070, and the two residual covariances again improved fit over M1, Δχ2(2) = 31.74, p < 0.001. In the holdout half, disgust sensitivity remained significantly associated with EAT-26 scores (β = 0.29, 95% CI [0.03, 0.56], p = 0.029), whereas the trauma coefficient was not significant (β = 0.18, 95% CI [−0.06, 0.41], p = 0.138); in the first half, both were significant (trauma: β = 0.31, p = 0.005; disgust: β = 0.24, p = 0.039). Constraining loadings, structural paths, and residual covariances to equality across halves did not worsen fit, Δχ2(13) = 15.64, p = 0.269, indicating that the differences between halves are compatible with sampling variability.
The configural multigroup model showed acceptable fit, CFI = 0.921, RMSEA = 0.073, 90% CI [0.054, 0.091], SRMR = 0.069. Constraining factor loadings to equality did not worsen fit, Δχ2(9) = 10.65, p = 0.300, ΔCFI = −0.003, which provided no evidence of meaningful deterioration in fit when factor loadings were constrained to equality across groups. Additionally, constraining the two structural paths to equality did not result in a meaningful deterioration in fit, providing no evidence that the structural associations differed between groups (Δχ2(2) = 0.58, p = 0.750). The same was true when each path was constrained separately (trauma: Δχ2(1) = 0.15, p = 0.698; disgust: Δχ2(1) = 0.26, p = 0.612). Within-group coefficients were smaller than in the pooled sample (Table 4). In the control group, this attenuation is consistent with the restricted range of EAT-26 scores (SD = 7.89 vs. 15.64 in the pooled sample). However, range restriction cannot explain the smaller coefficients in the ED-status group, whose EAT-26 variability (SD = 16.72) was comparable to that of the pooled sample. This pattern suggests that part of the pooled association reflects between-group differences in trauma, disgust, and EAT-26 scores, in addition to the lower precision of the subgroup estimates.
3.4. Specific Effects of Maltreatment Types (H2)
When each CTQ-SF subscale was added in turn to M1c as a direct predictor of EAT-26 scores, no maltreatment subtype explained additional variance beyond the general trauma factor after Holm correction. Emotional abuse showed the largest coefficient, but this association did not reach conventional significance (β = 0.27, 95% CI [−0.07, 0.61], p = 0.121, pHolm = 0.605). The coefficients for the remaining subscales were also non-significant (emotional neglect: β = −0.00, p = 0.989; physical abuse: β = −0.13, p = 0.239; sexual abuse: β = 0.01, p = 0.925; physical neglect: β = −0.10, p = 0.328). H2 was therefore not supported.
3.5. General Versus Specific Disgust Sensitivity (H3)
The item-level bifactor model of the EMA showed that the scale was not essentially unidimensional, χ2(375) = 752.37, CFI = 0.889, TLI = 0.871, RMSEA = 0.060, 90% CI [0.053, 0.066], SRMR = 0.066. The general factor accounted for 76% of the reliable variance (ωH = 0.70, ωT = 0.92), whereas explained common variance was low (ECV = 0.34). Specific factors retained considerable reliable variance for moral (ωHS = 0.75), body envelope violation (ωHS = 0.67), sexual (ωHS = 0.63), and animal (ωHS = 0.55) disgust, whereas hygiene (ωHS = 0.17) and deterioration/disease (ωHS = 0.24) were largely absorbed by the general factor. The hygiene-specific factor was empirically indistinguishable from the general factor and produced an inadmissible solution in the structural model (negative residual variance for item 19).
The bifactor-(S–1) structural model, with hygiene as the reference domain, was admissible, χ2(567) = 1043.61, CFI = 0.884, TLI = 0.871, RMSEA = 0.055, 90% CI [0.050, 0.060], SRMR = 0.068. Because fit indices from MLR and WLSMV estimation are not directly comparable, the measurement part of the S–1 model was also estimated with WLSMV, treating items as ordinal, and showed good fit, χ2(370) = 647.08, CFI = 0.955, TLI = 0.947, RMSEA = 0.051, 90% CI [0.044, 0.057], SRMR = 0.066. The lower CFI under MLR may partly reflect the treatment of 5-point items as continuous.
Importantly, because the bifactor-(S–1) model uses hygiene as the reference domain, its general factor represents hygiene-related disgust, not general disgust sensitivity. The hygiene-anchored general factor was associated with disordered eating attitudes (β = 0.27, 95% CI [0.11, 0.42], p < 0.001) alongside childhood trauma (β = 0.25, 95% CI [0.09, 0.41], p = 0.002). Adding the five specific factors as predictors did not improve the model, Δχ2(5) = 5.86, p = 0.320. The general factor remained significant (β = 0.23, p = 0.003), and none of the specific factors reached significance (all ps ≥ 0.055). Results were unchanged when the specific factors were allowed to correlate (general factor: β = 0.28, p < 0.001).
Because the general factor in a bifactor-(S–1) model is defined by the reference domain, the general factor in this model represents hygiene-related disgust, and each specific factor captures variance in a non-reference domain that is not shared with hygiene. The results therefore indicate that hygiene-related disgust was associated with disordered eating attitudes and that the remaining disgust domains did not provide incremental prediction beyond it. However, because the hygiene-specific factor could not be separated from the common factor in the full bifactor model, the present data cannot determine whether this association reflects hygiene-specific content or disgust sensitivity shared across domains. H3 was therefore partially supported.
4. Discussion
The primary objective of this study was to examine the structural relationships of childhood trauma and multidimensional disgust sensitivity with disordered eating attitudes in adult women. Using SEM with robust estimation and multiple sensitivity analyses, the findings indicate that both latent constructs showed unique associations with EAT-26 scores after accounting for the other construct. In the primary model (M1c), the standardized associations were comparable in magnitude for childhood trauma (β = 0.26) and disgust sensitivity (β = 0.27), and together the two constructs accounted for 19% of the variance in disordered eating attitudes. The equality test did not provide evidence of a statistically significant difference in the magnitude of the two structural effects. These findings are consistent with a model in which early adversity and disgust-related affective processes represent related but distinguishable correlates of disordered eating attitudes, while the cross-sectional design does not permit conclusions about temporal or causal relationships.
Childhood trauma showed a significant unique association with disordered eating attitudes after accounting for disgust sensitivity. Within the latent trauma construct, emotional abuse had the highest standardized loading (λ = 0.89), followed by emotional neglect (λ = 0.73). This indicates that these dimensions were particularly strongly related to the broader latent construct of childhood trauma in this sample. Importantly, the higher loading of emotional abuse should not be interpreted as evidence of a stronger unique association with disordered eating attitudes. Consistent with this distinction, the direct tests of individual CTQ-SF subscales did not identify any maltreatment subtype that explained additional variance beyond the general trauma factor after Holm correction, and H2 was therefore not supported. This null finding should be interpreted cautiously: given the high loading of emotional abuse on the general factor, little unique variance remained, and the sensitivity power analysis indicated adequate power only for unique effects of approximately partial r ≥ 0.17, so small subtype-specific effects cannot be ruled out. The findings are nevertheless compatible with previous research emphasizing the relevance of emotional and relational adversity in eating psychopathology [13,14,15,16,30], and with meta-analytic evidence that childhood maltreatment, regardless of type, is associated with the presence of eating disorders and with greater illness severity [10,17,18].
Disgust sensitivity showed a unique association of comparable magnitude with disordered eating attitudes (β = 0.27), after accounting for childhood trauma. This is consistent with meta-analytic evidence of higher generic disgust sensitivity in people with eating disorders than in healthy controls [27] and extends it by showing that the association was observed after accounting for childhood trauma in a mixed sample of women with and without a reported eating-disorder history. Because only disgust sensitivity was assessed, these findings do not inform whether women with disordered eating attitudes differ in disgust tolerance or in the regulation of disgust. Hygiene had the highest loading on the latent disgust factor (λ = 0.83), followed by deterioration/disease. However, this loading reflects the contribution of hygiene-related items to the broader latent disgust construct and does not establish a unique association between hygiene-related disgust and disordered eating attitudes. The bifactor analyses add an important qualification: hygiene could not be isolated as a specific factor independent of the general disgust construct, and adding the domain-specific factors did not improve prediction. Thus, hygiene-related disgust appears to capture the variance in disgust sensitivity that is relevant to disordered eating attitudes in this sample, although it could not be empirically distinguished from the variance shared across disgust domains.
The absence of an association between body envelope violation disgust and EAT-26 scores (r = −0.01), together with the absence of group differences in this domain, deserves comment. Body envelope violation items refer to injuries, blood, and bodily damage, which belong to animal-reminder disgust [56] and may be conceptually distant from the concerns about food, weight, and shape captured by the EAT-26. Moreover, the form of disgust most consistently linked to eating disorders appears to be directed at one’s own body and self [27,28], a construct that is distinct from trait sensitivity to external elicitors and is not assessed by the EMA. Future studies should therefore include measures of self-disgust alongside disgust sensitivity.
A central theoretical question is whether disgust sensitivity is related to eating pathology mainly because of its overlap with trauma-related processes or whether it contributes unique variance. In the present data, the two latent predictors were moderately correlated (r = 0.37), yet each retained a statistically significant association with EAT-26 scores when modeled simultaneously. This pattern is consistent with partially distinct associations, but it does not establish disgust sensitivity as an independent causal vulnerability factor or demonstrate a mediating pathway from trauma to eating pathology. Moreover, the model with correlated predictors is statistically equivalent to a model in which disgust sensitivity mediates the association between childhood trauma and disordered eating attitudes, as both specifications yield identical fit. The present data therefore cannot distinguish between the parallel-vulnerability and mediational accounts outlined in the Introduction, and longitudinal and experimental research will be needed to test those temporal and mechanistic possibilities.
The associations should also be interpreted in light of the sample composition. Nearly half of the participants self-reported a current, past, or self-identified eating disorder, and these women scored higher on childhood trauma, disgust sensitivity, and EAT-26. When ED status was controlled, both coefficients were attenuated (β = 0.17 and 0.15), and within-group estimates were smaller and, in the ED-status group, non-significant. Because ED status is closely related to the outcome—women who reported an eating disorder scored markedly higher on the EAT-26—adjusting for it may partly remove variance genuinely shared by trauma, disgust, and eating attitudes (over-adjustment); the adjusted coefficients should therefore be regarded as conservative estimates rather than as the true unique associations. Part of the pooled association may therefore reflect between-group differences rather than a uniform association across the continuum of eating attitudes. Although the multigroup analysis did not indicate that the structural paths differed between groups, the modest subgroup sizes limited the power of this comparison (minimum detectable partial r ≈ 0.22–0.24 within groups).
4.1. Practical Implications
The present findings have several practical implications, although they should be interpreted in light of the cross-sectional design and the composition of the sample. First, at the level of assessment, the unique associations of childhood trauma and disgust sensitivity with disordered eating attitudes suggest that both domains may be usefully considered when evaluating adult women with eating-related concerns. In practice, brief and well-validated self-report instruments, such as the CTQ-SF and the EMA, could be incorporated into the assessment of women with elevated EAT-26 scores to provide a broader characterization of developmental and affective factors. Because emotional abuse and emotional neglect showed the highest loadings on the trauma factor, particular attention may be paid to emotional and relational forms of adversity, which are often less visible than physical or sexual abuse. Similarly, the central role of hygiene-related disgust within the disgust factor suggests that assessing contamination- and hygiene-related disgust responses may be informative for case formulation. Given the high rates of reported childhood maltreatment in this sample, trauma screening in eating-disorder services should be embedded in trauma-informed procedures, including sensitive inquiry and appropriate referral pathways.
Second, at the level of prevention and early detection, women who report childhood maltreatment or heightened disgust sensitivity may represent a group in which subclinical disordered eating attitudes merit monitoring. Because subclinical eating pathology frequently precedes full-syndrome disorders [6], screening for disordered eating attitudes in primary care, mental health, and trauma-focused services may facilitate earlier identification and referral. Conversely, eating-disorder services may benefit from identifying trauma histories early, given that childhood maltreatment has been associated with greater eating-disorder severity [10,17,18]. However, the present data do not establish that either construct predicts the onset of eating pathology, and prospective studies are needed before such screening strategies can be recommended as evidence-based practice.
Third, at the level of intervention, the findings may be relevant to trauma-informed approaches that address both developmental adversity and the affective responses associated with it. Trauma-focused interventions, including EMDR [57], warrant further investigation in eating psychopathology. EMDR has been explored in eating disorders, with preliminary evidence on negative body image and eating-disorder symptoms [58,59,60,61]; however, this evidence base is small and methodologically heterogeneous, and none of these studies examined disgust sensitivity as an outcome. Likewise, exposure-based strategies targeting food- and body-related disgust have been proposed as treatment components for eating disorders [25,34] and may be worth examining in women with a trauma history. The present study did not assess treatment effects, trauma processing, or changes in disgust sensitivity, and therefore cannot establish whether EMDR or any other intervention modifies disgust sensitivity or disordered eating attitudes. Future intervention studies should therefore examine whether changes in trauma-related and disgust-related processes are accompanied by improvements in eating psychopathology [60,61].
4.2. Strengths and Limitations
This study has several strengths, including the use of latent variable modeling with robust estimation, the transparent reporting of post hoc model modifications, split-half cross-validation, tests of measurement invariance across groups, and bifactor analyses to separate general from domain-specific disgust. Nevertheless, several limitations should be considered. First, the cross-sectional design precludes conclusions about temporal directionality or causality among childhood trauma, disgust sensitivity, and disordered eating attitudes. Longitudinal studies are needed to determine whether these constructs prospectively predict changes in eating pathology.
Second, participants were adult women recruited through an open online survey without diagnostic pre-screening, and ED status was self-reported and not verified with a structured clinical interview based on DSM-5 criteria [3]. Additionally, while extensive clinical parameters were recorded (e.g., self-injury, hospitalizations, time since diagnosis, and pharmacological treatment), specific sociodemographic variables such as ethnicity, educational level, and socioeconomic status were not collected to protect anonymity and reduce response burden given the sensitive trauma-related content. The absence of these broader sociodemographic indicators may limit the generalizability of the findings across different socio-cultural contexts. The ED group was heterogeneous, comprising women with a current formal diagnosis, a self-identified ED without a formal diagnosis, and a past diagnosis; although sensitivity analyses supported the stability of the structural model across various specifications, this diagnostic heterogeneity means that the ED group should not be interpreted as a uniformly clinically diagnosed group. This sampling strategy may also limit generalizability to clinically ascertained or population-based samples.
Third, the study relied on retrospective self-report measures, which may be affected by recall or reporting biases. Fourth, disordered eating attitudes were modeled as a single observed EAT-26 score, which does not account for measurement error and may have attenuated the structural coefficients. Fifth, although the sample was adequate for the primary structural model, the relatively modest sample size limits the stability and precision of the more complex multigroup and item-level bifactor models. These secondary analyses should therefore be interpreted as exploratory rather than definitive.
Sixth, the multigroup analysis did not provide evidence that the structural paths differed between the control and ED-status groups; however, subgroup sample sizes were modest and within-group estimates were less precise. These comparisons should therefore be interpreted cautiously. In addition, the two residual covariances in M1c were added post hoc on the basis of modification indices, and the final model showed acceptable rather than good fit (CFI and TLI < 0.95). Although the structural coefficients were virtually identical in the model without these covariances (M1), the final model may partly capitalize on sample-specific variance and requires replication in independent samples. Finally, women who were unsure whether they had an eating disorder (n = 17) were excluded, which may have removed some participants with subclinical difficulties.
4.3. Future Research Directions
Future research should use longitudinal designs to establish whether childhood trauma and disgust sensitivity prospectively predict changes in disordered eating attitudes, and should include clinically characterized samples with diagnoses verified through structured interviews based on DSM-5 criteria. Studies should also model eating psychopathology as a latent, multidimensional construct and assess related but distinct constructs—such as self-disgust, disgust propensity, disgust tolerance, and emotion regulation—together with behavioral or experimental measures of disgust reactivity. Larger, preregistered studies are needed to test the bifactor and multigroup models with adequate power. Finally, intervention studies, including trials of trauma-focused treatments, should examine whether changes in trauma-related and disgust-related processes are accompanied by improvements in eating psychopathology.
5. Conclusions
Childhood trauma and disgust sensitivity each showed a unique association with disordered eating attitudes in this cross-sectional sample of adult women, with structural associations of comparable magnitude. These associations were attenuated after accounting for eating-disorder status, suggesting that part of the pooled association reflects between-group differences in a sample enriched for eating-disorder history. Although emotional abuse and hygiene-related disgust showed the highest loadings on their respective general factors, no maltreatment subtype showed incremental prediction beyond the general trauma factor, and no specific disgust domain added unique prediction beyond the hygiene-anchored general disgust factor.
Clinically, these findings suggest that the assessment of women with disordered eating attitudes may benefit from considering both adverse childhood experiences and disgust sensitivity. However, given the cross-sectional design and the composition of the sample, these associations should not be interpreted as evidence that either construct is a causal vulnerability factor or a treatment target. Longitudinal studies with clinically characterized samples, as well as intervention studies, are needed to establish temporal pathways and to determine whether changes in trauma-related or disgust-related processes are associated with improvements in eating psychopathology.
Supplementary Materials
The following supporting information can be downloaded at: https://www.mdpi.com/article/10.3390/healthcare14223995/s1, Figure S1: Participant flow diagram; Table S1: Unstandardized and standardized parameter estimates of the final model (M1c); Table S2: Self-reported eating-disorder types in the ED-status group, by subgroup; Table S3: Fit indices of the measurement models; Table S4: Monte Carlo power to detect each structural path of M1c; File S1: R analysis code.
Author Contributions
Conceptualization: M.F.R.-A., A.G.-V. and J.I.B.; Methodology: M.F.R.-A., A.G.-V. and C.A.-C.; Formal Analysis: C.A.-C.; Investigation: M.F.R.-A., A.G.-V. and J.I.B.; Resources: M.F.R.-A., A.G.-V. and J.I.B.; Data Curation: C.A.-C.; Writing—Original Draft Preparation: M.F.R.-A., A.G.-V., C.A.-C. and J.I.B.; Writing—Review and Editing: M.F.R.-A., A.G.-V., C.A.-C. and J.I.B.; Supervision: M.F.R.-A., A.G.-V. and J.I.B.; Project Administration: M.F.R.-A., A.G.-V., C.A-.C. and J.I.B. All authors have read and agreed to the published version of the manuscript.
Funding
This research received no external funding.
Institutional Review Board Statement
The study was conducted in accordance with the Declaration of Helsinki and approved by the Ethics Committee of the Open University of Madrid (UDIMA, protocol code PSIP220722-4, approved on 22 July 2022).
Informed Consent Statement
Informed consent was obtained from all subjects involved in the study.
Data Availability Statement
The data are not publicly available because the study dataset contains sensitive self-report information. Anonymized data may be available from the corresponding author on reasonable request, subject to applicable ethical, privacy, and institutional restrictions. The R code used for all analyses is provided in the Supplementary Materials (File S1).
Acknowledgments
During the preparation of this manuscript, the authors used ChatGPT (GPT-6) (OpenAI, San Francisco, CA, USA; https://chatgpt.com) and Gemini (Google, Mountain View, CA, USA; https://gemini.google.com) to improve the clarity of the writing, enhance the academic style of the manuscript, and assist with translation into English. The authors also used SciSpace (https://scispace.com) to facilitate the identification and retrieval of published research relevant to the study topic during the literature review process. The authors critically reviewed and edited all AI-assisted outputs and take full responsibility for the content of this publication.
Conflicts of Interest
The authors declare no conflicts of interest.
Abbreviations
The following abbreviations are used in this manuscript:
| CTQ-SF | Childhood Trauma Questionnaire–Short Form |
| EMA | Escala Multidimensional de Sensibilidad al Asco (Multidimensional Disgust Sensitivity Scale) |
| EAT-26 | Eating Attitudes Test-26 |
| SEM | Structural Equation Modeling |
| MLR | Maximum Likelihood estimation with Robust standard errors |
| FIML | Full Information Maximum Likelihood |
| CFI | Comparative Fit Index |
| TLI | Tucker–Lewis Index |
| RMSEA | Root Mean Square Error of Approximation |
| SRMR | Standardized Root Mean Square Residual |
| ED | Eating disorder |
| BMI | Body mass index |
| WLSMV | Weighted least squares mean- and variance-adjusted |
| EMDR | Eye Movement Desensitization and Reprocessing |
References
- Galmiche, M.; Déchelotte, P.; Lambert, G.; Tavolacci, M.P. Prevalence of eating disorders over the 2000–2018 period: A systematic literature review. Am. J. Clin. Nutr. 2019, 109, 1402–1413. [Google Scholar] [CrossRef] [Scilit] [PubMed]
- Ward, Z.J.; Rodriguez, P.; Wright, D.R.; Austin, S.B.; Long, M.W. Estimation of eating disorders prevalence by age and associations with mortality in a simulated nationally representative US cohort. JAMA Netw. Open 2019, 2, e1912925. [Google Scholar] [CrossRef] [Scilit] [PubMed]
- American Psychiatric Association. Diagnostic and Statistical Manual of Mental Disorders, 5th, text rev. ed; American Psychiatric Association Publishing: Washington, DC, USA, 2022. [Google Scholar] [CrossRef] [Scilit]
- Schaumberg, K.; Welch, E.; Breithaupt, L.; Hübel, C.; Baker, J.H.; Munn-Chernoff, M.A.; Yilmaz, Z.; Ehrlich, S.; Mustelin, L.; Ghaderi, A.; et al. The science behind the Academy for Eating Disorders’ Nine Truths About Eating Disorders. Eur. Eat. Disord. Rev. 2017, 25, 432–450. [Google Scholar] [CrossRef] [Scilit] [PubMed]
- Mangweth-Matzek, B.; Kummer, K.K.; Hoek, H.W. Update on the epidemiology and treatment of eating disorders among older people. Curr. Opin. Psychiatry 2023, 36, 405–411. [Google Scholar] [CrossRef] [Scilit] [PubMed]
- Stice, E.; Gau, J.M.; Rohde, P.; Shaw, H. Risk factors that predict future onset of each major eating disorder sub-type in adolescent females: Theory testing in an 8-year longitudinal study. J. Abnorm. Psychol. 2017, 126, 38–51. [Google Scholar] [CrossRef] [Scilit] [PubMed]
- Keski-Rahkonen, A. Epidemiology of binge eating disorder: Prevalence, course, comorbidity, and risk factors. Curr. Opin. Psychiatry 2021, 34, 525–531. [Google Scholar] [CrossRef] [Scilit] [PubMed]
- Wade, T.D.; Wilksch, S.M.; Lee, C. A longitudinal investigation of the impact of disordered eating on young women’s quality of life. Health Psychol. 2012, 31, 352–359. [Google Scholar] [CrossRef] [Scilit] [PubMed]
- Felitti, V.J.; Anda, R.F.; Nordenberg, D.; Williamson, D.F.; Spitz, A.M.; Edwards, V.; Koss, M.P.; Marks, J.S. Relationship of childhood abuse and household dysfunction to many of the leading causes of death in adults: The Adverse Childhood Experiences (ACE) Study. Am. J. Prev. Med. 1998, 14, 245–258. [Google Scholar] [CrossRef] [Scilit] [PubMed]
- Molendijk, M.L.; Hoek, H.W.; Brewerton, T.D.; Elzinga, B.M. Childhood maltreatment and eating disorder pathology: A systematic review and dose-response meta-analysis. Psychol. Med. 2017, 47, 1402–1416. [Google Scholar] [CrossRef] [Scilit] [PubMed]
- McCrory, E.J.; Gerin, M.I.; Viding, E. Annual Research Review: Childhood maltreatment, latent vulnerability and the shift to preventative psychiatry—The contribution of functional brain imaging. J. Child Psychol. Psychiatry 2017, 58, 338–357. [Google Scholar] [CrossRef] [Scilit] [PubMed]
- Caslini, M.; Bartoli, F.; Crocamo, C.; Dakanalis, A.; Clerici, M.; Carrà, G. Disentangling the association between child abuse and eating disorders: A systematic review and meta-analysis. Psychosom. Med. 2016, 78, 79–90. [Google Scholar] [CrossRef] [Scilit] [PubMed]
- Trottier, K.; MacDonald, D.E. Update on psychological trauma, other severe adverse experiences and eating disorders: State of the research and future research directions. Curr. Psychiatry Rep. 2017, 19, 62. [Google Scholar] [CrossRef] [Scilit] [PubMed]
- Monteleone, A.M.; Cascino, G.; Pellegrino, F.; Ruzzi, V.; Patriciello, G.; Marone, L.; De Felice, G.; Monteleone, P.; Maj, M. The association between childhood maltreatment and eating disorder psychopathology: A mixed-model investigation. Eur. Psychiatry 2019, 61, 111–118. [Google Scholar] [CrossRef] [Scilit] [PubMed]
- Mountford, V.; Corstorphine, E.; Tomlinson, S.; Waller, G. Development of a measure to assess invalidating childhood environments in the eating disorders. Eat. Behav. 2007, 8, 48–58. [Google Scholar] [CrossRef] [Scilit] [PubMed]
- Guillaume, S.; Jaussent, I.; Maimoun, L.; Ryst, A.; Seneque, M.; Villain, L.; Hamroun, D.; Lefebvre, P.; Renard, E.; Courtet, P. Associations between adverse childhood experiences and clinical characteristics of eating disorders. Sci. Rep. 2016, 6, 35761. [Google Scholar] [CrossRef] [Scilit] [PubMed]
- Amiri, S.; Sabzehparvar, M. Childhood maltreatment and the risk of eating disorders: A meta-analysis of observational studies. Neuropsychiatrie 2025, 39, 36–46. [Google Scholar] [CrossRef] [Scilit] [PubMed]
- Rossi, E.; Cassioli, E.; Dani, C.; Marchesoni, G.; Monteleone, A.M.; Wonderlich, S.A.; Ricca, V.; Castellini, G. The maltreated eco-phenotype of eating disorders: A new diagnostic specifier? A systematic review of the evidence and comprehensive description. Neurosci. Biobehav. Rev. 2024, 160, 105619. [Google Scholar] [CrossRef] [Scilit] [PubMed]
- Pocol, C.; Ion, A.; Miu, A.C. Childhood adversity and disordered eating: The mediator role of food reward drive. Front. Psychol. 2026, 17, 1863415. [Google Scholar] [CrossRef] [Scilit] [PubMed]
- Olatunji, B.O.; Sawchuk, C.N. Disgust: Characteristic features, social manifestations, and clinical implications. J. Soc. Clin. Psychol. 2005, 24, 932–962. [Google Scholar] [CrossRef] [Scilit]
- Troop, N.A.; Murphy, F.; Bramon, E.; Treasure, J.L. Disgust sensitivity in eating disorders: A preliminary investigation. Int. J. Eat. Disord. 2000, 27, 446–451. [Google Scholar] [CrossRef]
- Rozin, P.; Haidt, J.; McCauley, C.R. Disgust. In Handbook of Emotions, 3rd ed.; Lewis, M., Haviland-Jones, J.M., Barrett, L.F., Eds.; The Guilford Press: New York, NY, USA, 2008; pp. 757–776. [Google Scholar]
- Sandín, B.; Chorot, P.; Valiente, R.M.; Santed, M.A.; Olmedo, M.; Pineda, D.; Campagne, D. Escala Multidimensional de Sensibilidad al Asco (EMA, CSA); APA PsycTests: Washington, DC, USA, 2013. [Google Scholar] [CrossRef] [Scilit]
- Curtis, V.; de Barra, M.; Aunger, R. Disgust as an adaptive system for disease avoidance behaviour. Philos. Trans. R. Soc. Lond. B Biol. Sci. 2011, 366, 389–401. [Google Scholar] [CrossRef] [Scilit] [PubMed]
- Anderson, L.M.; Berg, H.; Brown, T.A.; Menzel, J.; Reilly, E.E. The role of disgust in eating disorders. Curr. Psychiatry Rep. 2021, 23, 4. [Google Scholar] [CrossRef] [Scilit] [PubMed]
- Davey, G.C.L.; Buckland, G.; Tantow, B.; Dallos, R. Disgust and eating disorders. Eur. Eat. Disord. Rev. 1998, 6, 201–211. [Google Scholar] [CrossRef] [Scilit]
- Bektas, S.; Keeler, J.L.; Anderson, L.M.; Mutwalli, H.; Himmerich, H.; Treasure, J. Disgust and self-disgust in eating disorders: A systematic review and meta-analysis. Nutrients 2022, 14, 1728. [Google Scholar] [CrossRef] [Scilit] [PubMed]
- Boonstra, F.; de Jong, P.J.; Schulz, R.; Glashouwer, K.A. Disgust in anorexia nervosa: Testing a theoretical model connecting negative body image to disgust propensity, disgust sensitivity, and self-disgust. PLoS ONE 2026, 21, e0342648. [Google Scholar] [CrossRef] [Scilit] [PubMed]
- Rabito-Alcón, M.F.; González-Vázquez, A.; Baile, J.I. The role of disgust emotion in eating disorders and its relationship with dissociative symptoms. Healthcare 2025, 13, 954. [Google Scholar] [CrossRef] [Scilit] [PubMed]
- Rabito-Alcón, M.F.; Baile, J.I.; Vanderlinden, J. Mediating factors between childhood traumatic experiences and eating disorders development: A systematic review. Children 2021, 8, 114. [Google Scholar] [CrossRef] [Scilit] [PubMed]
- Rabito-Alcón, M.F.; Baile, J.I.; Vanderlinden, J. Child trauma experiences and dissociative symptoms in women with eating disorders: Case-control study. Children 2020, 7, 274. [Google Scholar] [CrossRef] [Scilit] [PubMed]
- Tagay, S.; Schlottbohm, E.; Reyes-Rodriguez, M.L.; Repic, N.; Senf, W. Eating disorders, trauma, PTSD, and psychosocial resources. Eat. Disord. 2014, 22, 33–49. [Google Scholar] [CrossRef] [Scilit] [PubMed]
- Badour, C.L.; Feldner, M.T. The role of disgust in posttraumatic stress: A critical review of the empirical literature. J. Exp. Psychopathol. 2018, 9, 1–26. [Google Scholar] [CrossRef] [Scilit]
- Menzel, J.E.; Reilly, E.E.; Luo, T.J.; Kaye, W.H. Conceptualizing the role of disgust in avoidant/restrictive food intake disorder: Implications for the etiology and treatment of selective eating. Int. J. Eat. Disord. 2019, 52, 462–465. [Google Scholar] [CrossRef] [Scilit] [PubMed]
- Bernstein, D.P.; Stein, J.A.; Newcomb, M.D.; Walker, E.; Pogge, D.; Ahluvalia, T.; Stokes, J.; Handelsman, L.; Medrano, M.; Desmond, D.; et al. Development and validation of a brief screening version of the Childhood Trauma Questionnaire. Child Abus. Negl. 2003, 27, 169–190. [Google Scholar] [CrossRef] [Scilit] [PubMed]
- Hernández, A.; Gallardo-Pujol, D.; Pereda, N.; Arntz, A.; Bernstein, D.P.; Gaviria, A.M.; Labad, A.; Valero, J.; Gutiérrez-Zotes, J.A. Initial validation of the Spanish Childhood Trauma Questionnaire–Short Form: Factor structure, reliability and association with parenting. J. Interpers. Violence 2013, 28, 1498–1518. [Google Scholar] [CrossRef] [Scilit] [PubMed]
- García-Fernández, A.; Martínez-Cao, C.; Sánchez-Fernández-Quejo, A.; Bobes-Bascarán, T.; Andreo-Jover, J.; Ayad-Ahmed, W.; Cebriá, A.I.; Díaz-Marsá, M.; Garrido-Torres, N.; Gómez, S.; et al. Validation of the Spanish Childhood Trauma Questionnaire-Short Form in adolescents with suicide attempts. Front. Psychol. 2024, 15, 1378486. [Google Scholar] [CrossRef] [Scilit] [PubMed]
- Bernstein, D.P.; Fink, L. Childhood Trauma Questionnaire: A Retrospective Self-Report Manual; The Psychological Corporation: San Antonio, TX, USA, 1998. [Google Scholar]
- Garner, D.M.; Olmsted, M.P.; Bohr, Y.; Garfinkel, P.E. The Eating Attitudes Test: Psychometric features and clinical correlates. Psychol. Med. 1982, 12, 871–878. [Google Scholar] [CrossRef] [Scilit] [PubMed]
- Rivas, T.; Bersabé, R.; Jiménez, M.; Berrocal, C. The Eating Attitudes Test (EAT-26): Reliability and validity in Spanish female samples. Span. J. Psychol. 2010, 13, 1044–1056. [Google Scholar] [CrossRef] [Scilit] [PubMed]
- R Core Team. R: A Language and Environment for Statistical Computing; R Foundation for Statistical Computing: Vienna, Austria, 2025; Available online: https://www.R-project.org/ (accessed on 15 June 2026).
- Rosseel, Y. lavaan: An R package for structural equation modeling. J. Stat. Softw. 2012, 48, 1–36. [Google Scholar] [CrossRef] [Scilit]
- Cohen, J. Statistical Power Analysis for the Behavioral Sciences, 2nd ed.; Lawrence Erlbaum Associates: Hillsdale, NJ, USA, 1988. [Google Scholar]
- Holm, S. A simple sequentially rejective multiple test procedure. Scand. J. Stat. 1979, 6, 65–70. [Google Scholar]
- Kline, R.B. Principles and Practice of Structural Equation Modeling, 4th ed.; Guilford Press: New York, NY, USA, 2016. [Google Scholar]
- Muthén, L.K.; Muthén, B.O. Mplus User’s Guide, 8th ed.; Muthén & Muthén: Los Angeles, CA, USA, 2017. [Google Scholar]
- Finney, S.J.; DiStefano, C. Non-normal and categorical data in structural equation modeling. In Structural Equation Modeling: A Second Course; Hancock, G.R., Mueller, R.O., Eds.; Information Age Publishing: Greenwich, CT, USA, 2006; pp. 269–314. [Google Scholar]
- Yuan, K.-H.; Bentler, P.M. Three likelihood-based methods for mean and covariance structure analysis with nonnormal missing data. Sociol. Methodol. 2000, 30, 165–200. [Google Scholar] [CrossRef] [Scilit]
- Enders, C.K.; Bandalos, D.L. The relative performance of full information maximum likelihood estimation for missing data in structural equation models. Struct. Equ. Model. 2001, 8, 430–457. [Google Scholar] [CrossRef] [Scilit] [PubMed]
- Hu, L.; Bentler, P.M. Cutoff criteria for fit indexes in covariance structure analysis: Conventional criteria versus new alternatives. Struct. Equ. Model. 1999, 6, 1–55. [Google Scholar] [CrossRef] [Scilit]
- Satorra, A.; Bentler, P.M. A scaled difference chi-square test statistic for moment structure analysis. Psychometrika 2001, 66, 507–514. [Google Scholar] [CrossRef] [Scilit]
- Rodriguez, A.; Reise, S.P.; Haviland, M.G. Evaluating bifactor models: Calculating and interpreting statistical indices. Psychol. Methods 2016, 21, 137–150. [Google Scholar] [CrossRef] [Scilit] [PubMed]
- Cheung, G.W.; Rensvold, R.B. Evaluating goodness-of-fit indexes for testing measurement invariance. Struct. Equ. Model. 2002, 9, 233–255. [Google Scholar] [CrossRef] [Scilit] [PubMed]
- Chen, F.F. Sensitivity of goodness of fit indexes to lack of measurement invariance. Struct. Equ. Model. 2007, 14, 464–504. [Google Scholar] [CrossRef] [Scilit]
- Eid, M.; Geiser, C.; Koch, T.; Heene, M. Anomalous results in G-factor models: Explanations and alternatives. Psychol. Methods 2017, 22, 541–562. [Google Scholar] [CrossRef] [Scilit] [PubMed]
- Olatunji, B.O.; Williams, N.L.; Tolin, D.F.; Abramowitz, J.S.; Sawchuk, C.N.; Lohr, J.M.; Elwood, L.S. The Disgust Scale: Item analysis, factor structure, and suggestions for refinement. Psychol. Assess. 2007, 19, 281–297. [Google Scholar] [CrossRef] [Scilit] [PubMed]
- Shapiro, F. EMDR, adaptive information processing, and case conceptualization. J. EMDR Pract. Res. 2007, 1, 68–87. [Google Scholar] [CrossRef] [Scilit]
- Bloomgarden, A.; Calogero, R.M. A randomized experimental test of the efficacy of EMDR treatment on negative body image in eating disorder inpatients. Eat. Disord. 2008, 16, 418–427. [Google Scholar] [CrossRef] [Scilit] [PubMed]
- Balbo, M.; Zaccagnino, M.; Cussino, M.; Civilotti, C. Eye Movement Desensitization and Reprocessing (EMDR) and eating disorders: A systematic review. Clin. Neuropsychiatry 2017, 14, 321–329. [Google Scholar]
- Hatoum, A.H.; Burton, A.L. Eye movement desensitization and reprocessing (EMDR) therapy for the treatment of eating disorders: A systematic review of the literature. Ment. Health Sci. 2024, 2, e92. [Google Scholar] [CrossRef] [Scilit]
- Morando, S. Eye-Movement Desensitization Reprocessing Therapy (EMDR) for Eating Disorders. In Eating Disorders; Robinson, P., Wade, T., Herpertz-Dahlmann, B., Fernandez-Aranda, F., Treasure, J., Wonderlich, S., Eds.; Springer: Cham, Switzerland, 2024; pp. 1–12. [Google Scholar] [CrossRef] [Scilit]
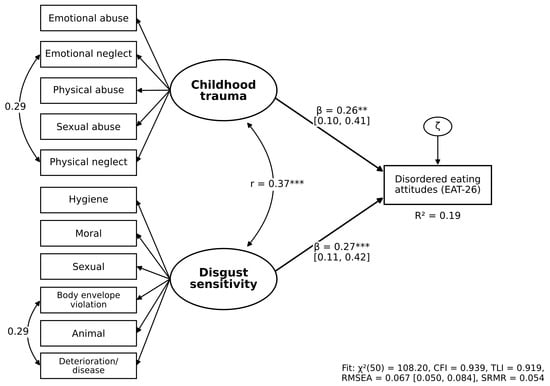
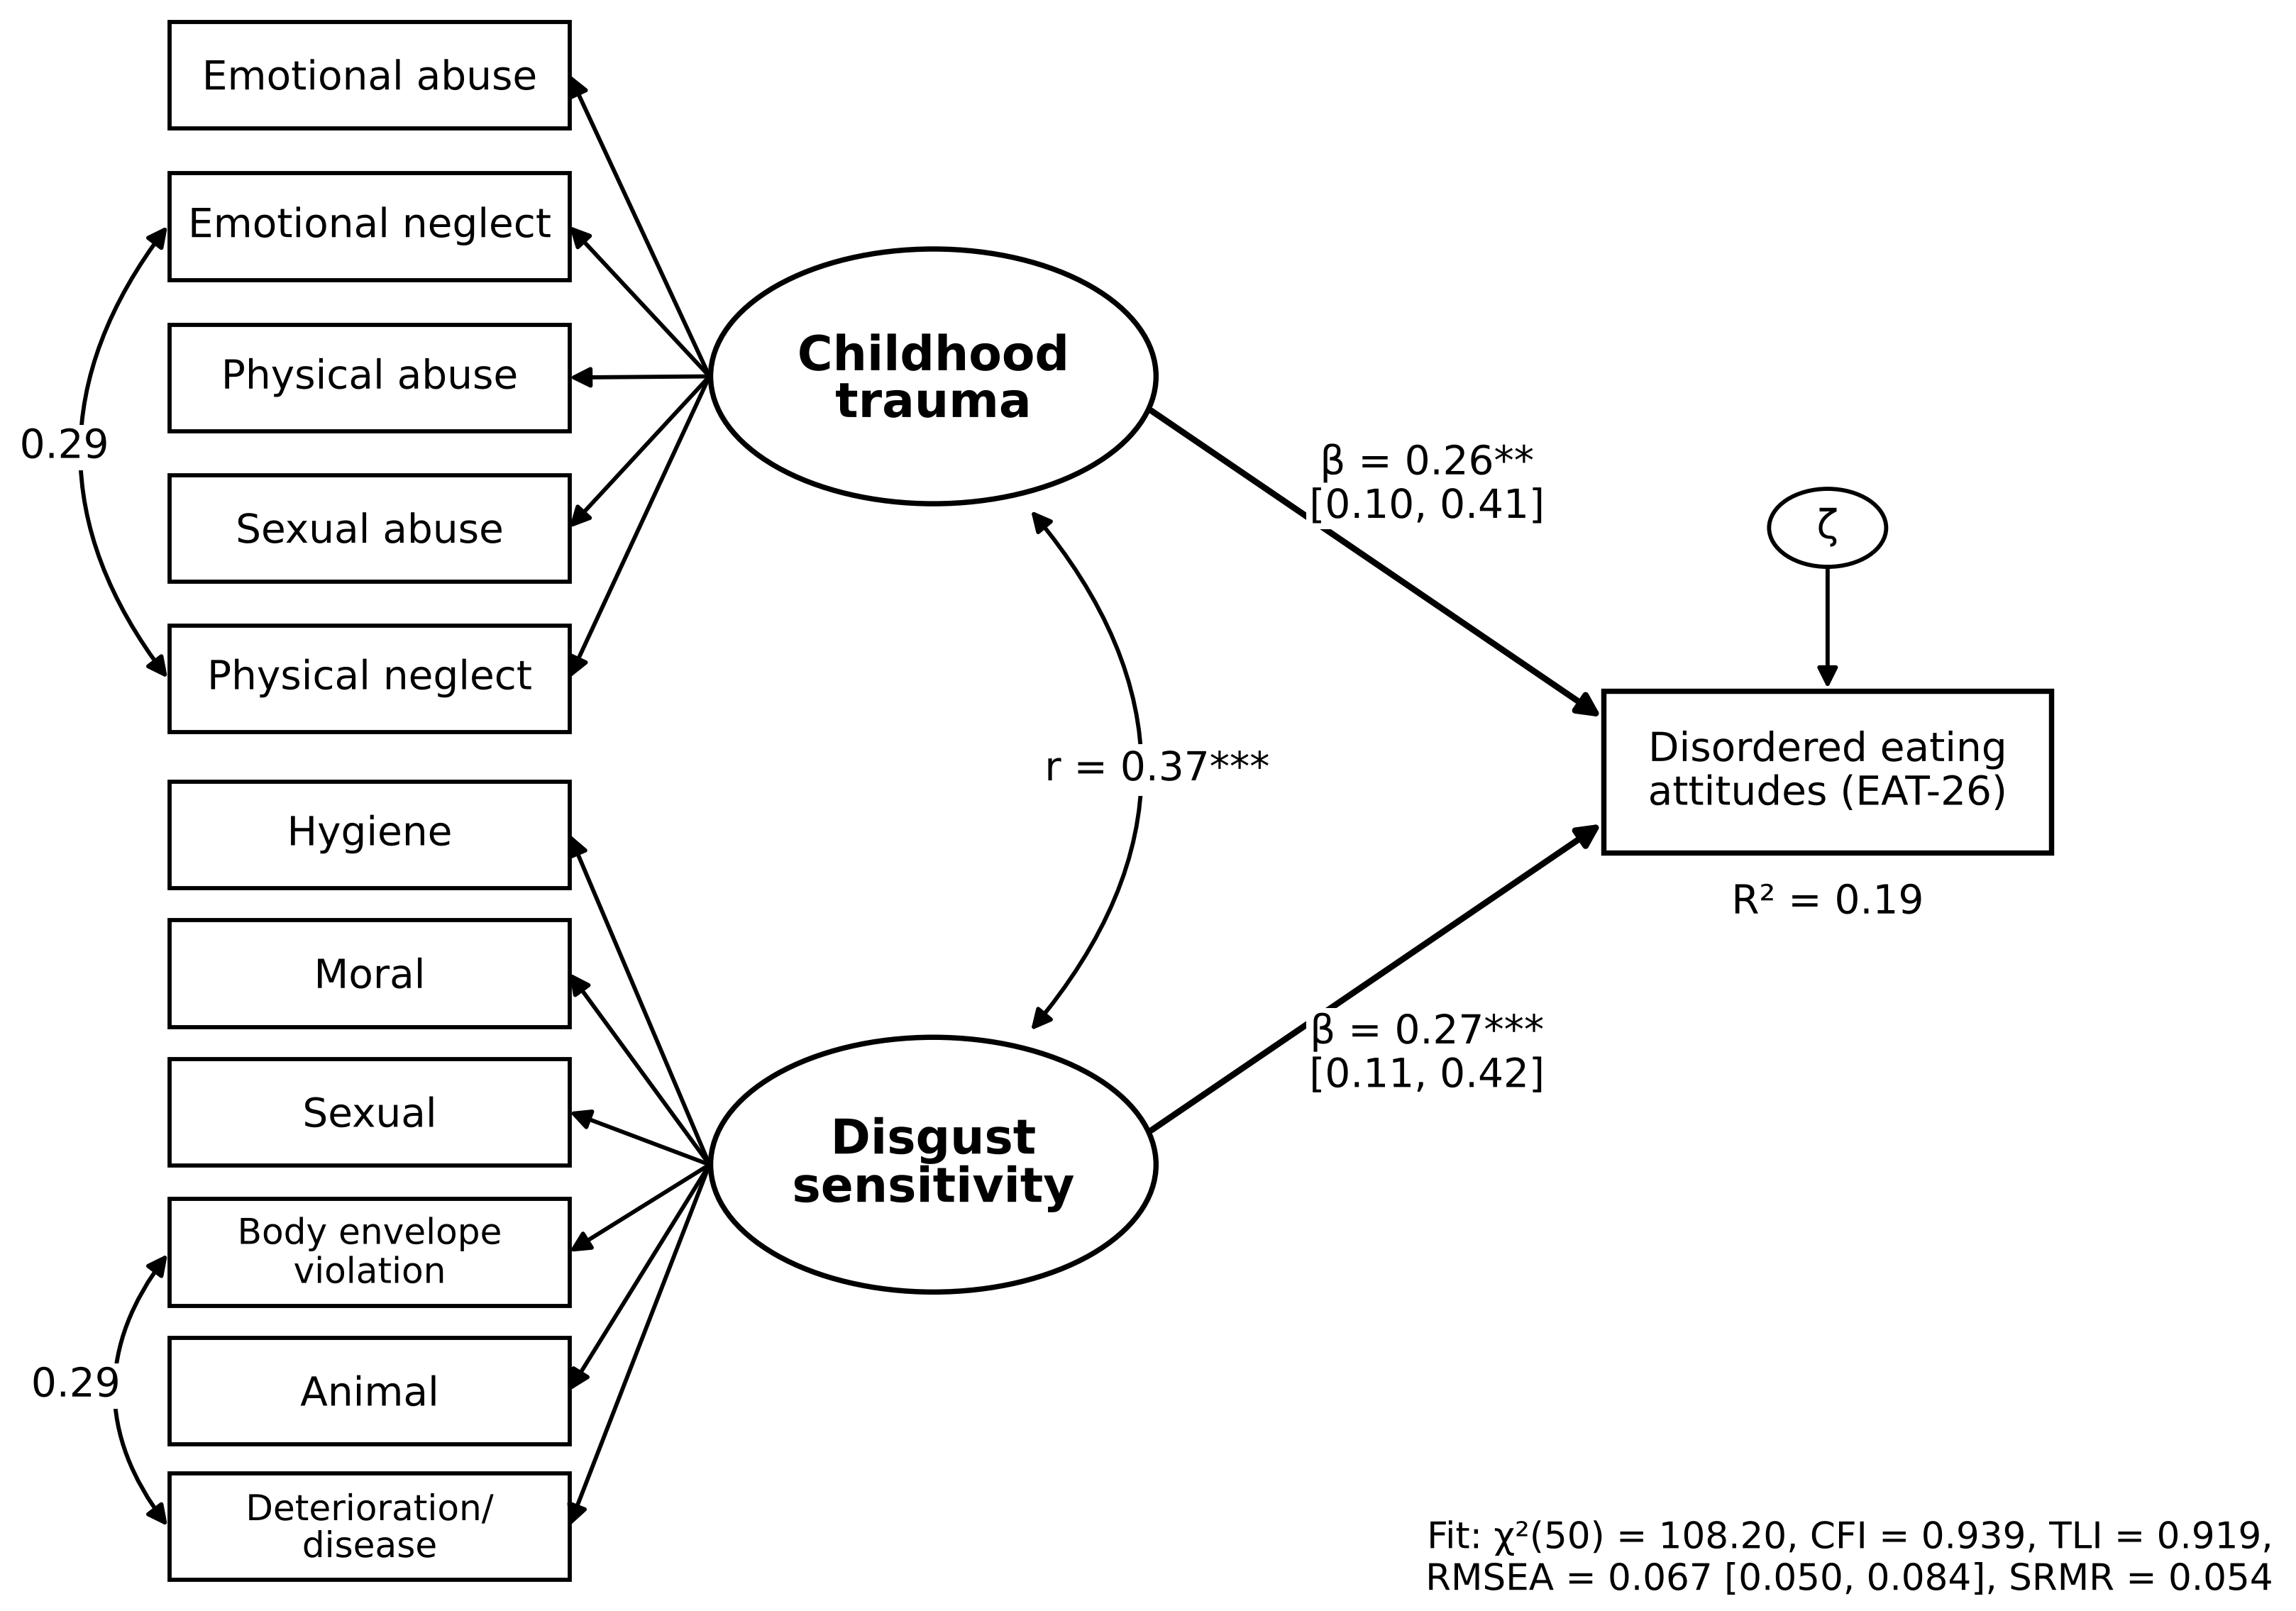

Disclaimer/Publisher’s Note: The statements, opinions and data contained in all publications are solely those of the individual author(s) and contributor(s) and not of MDPI and/or the editor(s). MDPI and/or the editor(s) disclaim responsibility for any injury to people or property resulting from any ideas, methods, instructions or products referred to in the content. |
© 2026 by the authors. Licensee MDPI, Basel, Switzerland. This article is an open access article distributed under the terms and conditions of the Creative Commons Attribution (CC BY) license.