


Abstract
Background/Objectives: Movement behaviors compete for a finite daily time budget. This study examined associations between 24-h movement composition and uncorrected visual acuity among Chinese junior high school students and explored model-derived candidate time allocations. Methods: This cross-sectional study included 865 students, split into derivation (n = 433) and internal validation (n = 432) samples. Robust regression modeled standardized log-transformed uncorrected visual acuity using isometric log-ratio (ilr) coordinates. The highest-predicted 5% of candidate compositions defined an exploratory region. Validation retained all 432 students; alternative search settings and bootstrap resampling assessed sensitivity. Results: The three ilr coordinates were jointly associated with the outcome (Wald χ2 = 28.433, df = 3, p < 0.001). Among 7488 candidates, 375 were selected. Marginal ranges were 190–360 min/day for light-intensity physical activity, 60–80 for moderate-to-vigorous physical activity, 510–800 for sedentary behavior, and 310–490 for sleep. Two validation participants fell within all four ranges. Each additional marginal range met was associated with a 0.053-point higher visual acuity score (95% confidence interval: 0.005–0.100; p = 0.031). The corresponding confidence intervals included zero with a 5-min grid and alternative selection fractions. Conclusions: These findings provide preliminary evidence to inform research on daily activity patterns and their associations with uncorrected visual acuity among Chinese junior high school students. The candidate allocations remain exploratory and sensitive to analytical settings. Further studies addressing clustering, confounding, and measurement limitations are needed before specific activity or sleep recommendations can be made.
1. Introduction
Myopia in children and adolescents is a continuing public health concern, with implications for visual function across the life course [1]. Junior high school is a period of changing academic demands, daily routines, and opportunities for physical activity. Modifiable behaviors, including physical activity, sedentary behavior, sleep, and outdoor activity, have therefore attracted interest in studies of visual health [2,3,4]. However, these behaviors occur within a shared daily time budget. Their associations with health cannot be fully understood without considering how time is allocated across the day.
The 24-h movement framework integrates light-intensity physical activity (LPA), moderate-to-vigorous physical activity (MVPA), sedentary behavior (SED), and sleep (SLP) [5]. Increasing the time allocated to one behavior necessarily reduces the time available for others. Compositional data analysis addresses this interdependence by expressing the components as log-ratios rather than treating their absolute durations as independent exposures [6]. Research on adherence to integrated movement guidelines has also examined combinations of behaviors. For example, Liang et al. investigated individual and combined associations of meeting sleep, sedentary behavior, and physical activity guidelines with mental health among Chinese university students [7]. Although guideline adherence and continuous time allocation are different analytical questions, both approaches support examining movement behaviors together.
Optimal Time Zone Analysis uses compositional regression predictions to identify candidate time-use combinations within a defined search space [8,9,10]. It addresses how the components can be allocated jointly, conditional on the fitted model and search limits. The candidate region therefore inherits the assumptions of that model. Evaluation in a split sample from the same population can assess internal consistency but cannot establish transferability to other populations.
Applying this framework to visual acuity requires careful definition of both exposures and outcomes. Accelerometer-derived movement intensity does not by itself distinguish outdoor exposure from indoor activity or identify near-work tasks [2,3,4]. Likewise, uncorrected visual acuity is a functional measure and does not establish refractive myopia, which requires appropriate refractive assessment [11]. A time allocation associated with better uncorrected visual acuity should therefore not be interpreted automatically as a myopia-prevention prescription.
Associations with individual behaviors do not establish how their relative allocation across a 24-h day relates to uncorrected visual acuity. This study therefore had two exploratory objectives among Chinese students in grades 7 and 8: first, to examine associations between movement composition and uncorrected visual acuity and derive candidate allocations with higher predicted acuity and, second, to examine whether the number of resulting marginal ranges met was associated with acuity in the randomly allocated internal validation sample. Accelerometer measurements, sleep records, and school visual acuity assessments were combined to provide preliminary evidence on daily activity patterns and generate hypotheses for further research rather than establish behavioral recommendations.
2. Materials and Methods
2.1. Participants and Procedure
This school-based cross-sectional study recruited students from 34 classes in eight schools across seven cities in Shandong, Hubei, Henan, and Guizhou provinces, China. Regional economic development and educational resources informed the sampling framework, and classes in grades 7 and 8 were sampled within participating schools. Participant recruitment and data collection began in December 2024, after ethics approval on 15 December 2024, and continued until mid-October 2025.
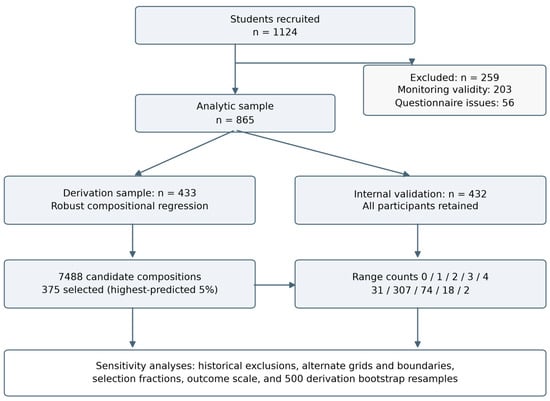
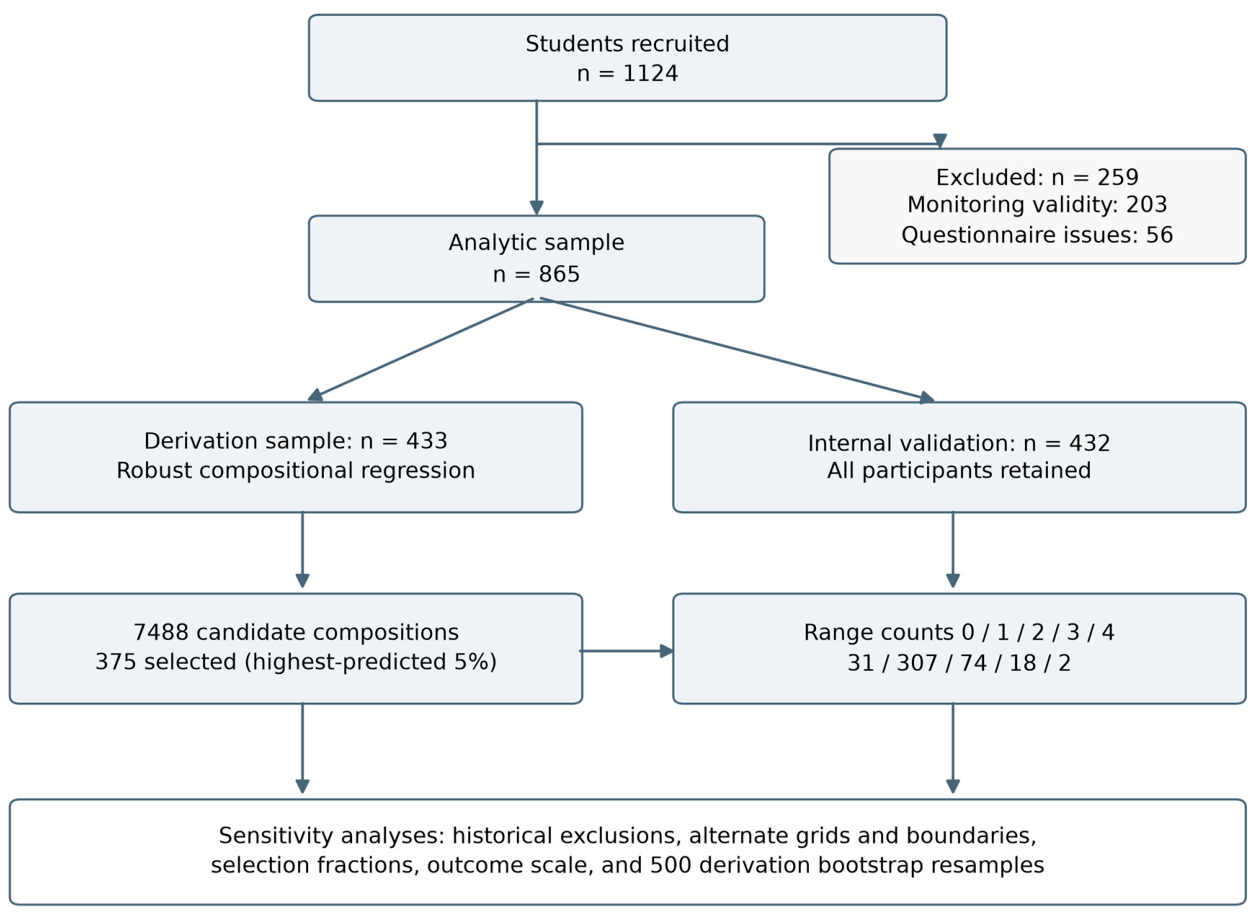
Of 1124 students recruited, 203 were excluded because their movement-behavior data did not meet the validity criteria, including cases with missing sleep information, and 56 were excluded because of incomplete or patterned questionnaire responses. The analytic sample comprised 865 students (76.96% of those recruited). Participants were randomly divided into two approximately equal groups: a derivation sample (n = 433) and an internal validation sample (n = 432). These existing assignments were retained for reanalysis. The original randomization implementation, seed, and stratification records were unavailable for this revision. The sample formation and subsequent analytical pathways are shown in Figure 1.
Figure 1.
Participant flow and analytical samples. The 203 monitoring-validity exclusions included students with missing sleep information. The supplied derivation and validation allocations were preserved. All 432 validation participants were retained for the primary association analysis, including the two participants within all four newly derived marginal ranges. The historical 413-participant subset was examined only in sensitivity analyses. Bootstrap resampling evaluated derivation-region variability and did not account for school or class clustering.
The original report stated a G*Power 3.1.9.7 calculation using an effect size of f2 = 0.15, α = 0.05, and statistical power of 0.90, yielding a minimum sample size of 108. The original calculation record was unavailable for this revision, so the test family, predictor count, and effect-size rationale could not be verified. This calculation does not establish power for the clustered, split-sample analyses.
The study was covered by approval from the Ethics Committee (Human Research Subcommittee) of Central China Normal University (CCNU-IRB-202412012b; 15 December 2024). Written informed consent was obtained from parents or legal guardians, and agreement to participate was obtained from the students. The approved protocol included visual acuity among the health outcomes assessed.
2.2. Measures
2.2.1. Sociodemographic Characteristics
The questionnaire recorded sex, age, provincial-capital status, parental education, and family economic circumstances. Sex was coded as male (1) or female (2). The field labelled grade contained ages of 12 or 13 years and was analyzed as age. City type was coded as provincial capital (1) or non-provincial capital (2). Recorded parental education was classified as junior high school or below (1; reference), senior high school or technical secondary school (2), and university education or above (3). Family economic circumstances were represented by a study-defined parental occupation indicator: code 1 (better) was applied if at least one parent belonged to occupational categories 5–8, and code 2 (poorer) otherwise. These categories comprised commercial/service workers (5), public-institution and related personnel, including school staff (6), professional/technical personnel (7), and leaders of government agencies, military units, companies, or public institutions (8). The indicator did not directly measure household income. School and class identifiers were unavailable.
2.2.2. Movement Behaviors and Sleep
Waking movement behaviors were measured using ActiGraph wGT3X-BT triaxial accelerometers (ActiGraph LLC, Pensacola, FL, USA). Acceleration was sampled at 30 Hz and processed in 10-s epochs using ActiLife 6.5, which exported daily activity-duration summaries. Participants were instructed to wear the device above the iliac crest for seven consecutive days, comprising five weekdays and two weekend days, with at least 8 h of wear each day. Devices were removed for nighttime sleep and water-based activities, including bathing and swimming. Monitoring was scheduled more than one month away from midterm and final examinations and avoided school sports events and periods of rain, snow, or high temperatures. Researchers checked device wear at school daily. The 24-h composition combined accelerometry-derived waking behaviors with sleep estimates rather than continuous overnight device wear.
The ActiLife daily reports provided durations (min/day) for sedentary, light-, moderate-, and vigorous-intensity activity. Activity intensity was classified using the study’s stated cut-points: 0–99 counts/min for SED, 100–2799 for LPA, 2800–3999 for moderate activity, and at least 4000 for vigorous activity. The thresholds of at least 2800 counts/min for MVPA and at least 4000 counts/min for vigorous activity followed Zhu et al. [12]. SED and LPA corresponded to the sedentary and light output categories, and MVPA was defined as the combined moderate- and vigorous-intensity duration. Participant-level daily-average durations were used in the reanalysis. Original ActiLife configuration files were unavailable for this revision, precluding independent verification of the processing implementation, axis, filter, or non-wear settings. Complete machine-readable daily exports and wear records were also unavailable, so compliance with the seven-day, at-least-8-h/day protocol could not be independently reassessed.
Each morning, participants recorded the preceding night’s sleep onset and morning wake times. The diary-reported interval was compared with the overnight gap in the accelerometer wear record exported using ActiLife 6.5. If the diary interval fully covered this gap, the diary duration was used; otherwise, the gap duration was used to estimate SLP. Students with missing sleep information were included among the 203 monitoring-validity exclusions and were not part of the 865-participant analytical sample. This comparison was a consistency check rather than independent validation of sleep. The four durations were proportionally closed to 1440 min/day by dividing each component by their sum and multiplying by 1440. Proportional closure preserves estimated ratios while rescaling all four components; error in one component may therefore affect every closed duration. It does not recover unobserved waking activity or verify sleep.
2.2.3. Uncorrected Visual Acuity
Uncorrected visual acuity data were obtained from the participating schools’ physical fitness assessments conducted during the same school term. The interval between visual acuity testing and activity monitoring was less than three months for all participants. Trained personnel used a standard logarithmic visual acuity chart at a distance of 5.0 m, testing the right eye followed by the left eye with the chart positioned at eye level. Chart setup, lighting, examiner training, and corrective-lens handling followed the standard school physical fitness assessment procedures across participating schools. The specific procedural standard/version, chart manufacturer/model, illumination measurements, and detailed testing records were unavailable for independent verification.
Visual acuity was recorded using five-point logarithmic notation. The score, L, equals five minus the base-10 logarithm of the minimum angle of resolution in minutes of arc; higher values indicate better uncorrected visual acuity. The arithmetic mean of the left- and right-eye scores was used as a participant-level outcome. This provided one outcome per student for analysis with participant-level movement compositions and covariates. Averaging continuous paired-eye outcomes is an established summary approach, although eye-specific information is lost [13]. This summary does not describe interocular differences or constitute a binocular acuity measurement. Refractive myopia and myopia progression were not outcomes of this analysis.
2.3. Statistical Analysis
2.3.1. Descriptive and Compositional Analyses
Analyses used R 4.5.2, compositions 2.0-9, and robustbase 0.99-6. Continuous variables are summarized as means and standard deviations (SDs), and categorical variables as counts and percentages. Split-sample descriptions used Welch t-tests and Pearson chi-squared tests. These comparisons describe the allocated samples and do not establish equivalence. There were no missing values in the variables included in the analytical dataset. All inferential results are exploratory. Nominal two-sided p-values and 95% confidence intervals (CIs) are reported; a Holm adjustment is also shown for the three individual ilr tests.
The four-part composition was transformed using compositions::ilr in the component order LPA, MVPA, SED, and SLP [6]. In the derivation sample, the natural logarithm of the mean of the two monocular visual acuity scores was centered and scaled using that sample’s mean and SD. Robust regression used robustbase::lmrob with the KS2014 control setting, the SMDM estimation chain, and the lqq score function [14]. For the reanalysis, robust fitting was used to limit sensitivity to influential residuals; it does not correct clustering or establish correct model specification. The model included all three ilr coordinates, sex, age, provincial-capital status, parental education indicators, and the occupation-based economic indicator. A Wald test jointly assessed the three ilr coefficients. Separate nested robust Wald tests assessed three squared ilr terms and a full second-order extension containing the three squares and three pairwise ilr products. Neither comparison established improved fit; the linear ilr model was used for the primary search. Complete main-model coefficients are provided in Appendix B. An ilr coefficient represents a relative allocation contrast and is not an independent effect per additional minute of one behavior. Residual-versus-fitted, normal Q–Q, scale-location, and robustness-weight plots were inspected; aggregate diagnostic summaries are provided in Supplementary File S9 and Figure S1.
For the reconstructed derivation model, the mean and SD of log visual acuity were 1.527269505 and 0.070696130, respectively. The ilr coordinates were defined as follows:
2.3.2. Identification of Candidate Time Allocations
Using Optimal Time Zone Analysis [8,9,10], candidates were enumerated in 10-min increments with LPA 160–360, MVPA 10–80, SED 300–800, and SLP 310–800 min/day; only compositions summing to 1440 min were retained. These previously specified bounds were kept for reconstruction of the primary search. Their original stated derivation from means and three SDs could not be verified from the aggregate file, so they were treated as search constraints rather than empirically established physiological limits. The same component order and ilr basis were used in model fitting and candidate prediction.
Predictions were evaluated with non-compositional model terms fixed at their derivation-sample means. Because the model contained no composition-by-covariate interactions, this choice changed the prediction constant but not candidate ranking. Candidates at or above the type-7 empirical 95th percentile were selected, consistent with a highest-predicted 5% ranking rule [9]. The minimum and maximum of each selected component defined its marginal range. The component-wise geometric means were closed to 1440 min to summarize the compositional center; this summary need not be a grid point. Exponentiating predictions after reversing standardization gives a log-scale location summary, not an estimated arithmetic conditional mean of visual acuity.
The marginal ranges describe the selected joint region and are not confidence intervals or clinical cutoffs. A composition within all four marginal ranges need not belong to the selected joint region. Search sensitivity analyses used a 5-min grid, the highest-predicted 2.5% and 10%, LPA and MVPA upper limits extended to 480 and 140 min/day separately and together, and SLP lower limits raised to 480 or 540 min/day. These were explicit exploratory changes to constraints, not newly established recommendation thresholds. Five hundred individual-case bootstrap resamples of the 433 derivation participants refitted the model and repeated the fixed-grid 5% search. Only converged fits with finite coefficients and predictions were summarized. Sampling percentiles of centers and bounds and Jaccard overlap with the primary region described variability; they did not account for school clustering or define recommended-time CIs.
2.3.3. Exploratory Assessment in the Internal Validation Sample
For all 432 validation participants, inclusive membership in each newly derived marginal range was coded as zero or one and summed to a zero-to-four count. Component membership, full membership, and visual acuity in every count group were described, including sparse groups. Membership refers to these model-derived intervals and should not be equated with adherence to established movement guidelines.
The primary validation model used ordinary least squares to regress the untransformed visual acuity score on the continuous range count, adjusting for sex, age, provincial-capital status, parental education categories, and the occupation-based economic indicator. Conventional t-based CIs were reported, conditional on the model assumptions. Secondary analyses used categorical counts, numeric education codes as a sensitivity analysis imposing equal spacing between categories, and HC1 and HC3 covariance estimates for the count coefficient [15]. Cook’s distance was used as a diagnostic and did not lead to exclusions from the primary analysis. Sensitivity analyses omitted observations with finite distances exceeding 4/432; separate comparisons restored the 14 historical influence exclusions, the five historical four-range participants, or both. Earlier reported marginal ranges were evaluated in the full sample to distinguish range reconstruction from exclusions. No school- or class-adjusted covariance estimate was possible because the identifiers were unavailable. Complete categorical-count and primary validation coefficients are provided in Supplementary Files S6 and S7, with influence and education-coding sensitivity estimates in S10.
2.3.4. Manuscript and Figure Preparation
OpenAI Codex (GPT-6; September–November 2026) assisted with language revision, manuscript organization, visualization code, and statistical reanalysis code. De-identified participant-level data and archived analysis files were supplied during the October reanalysis. Statistical calculations were executed locally in R. The main figures were generated using Python 3.12 with Matplotlib 3.11.2, and supplementary diagnostic plots were generated using R 4.5.2. All authors have reviewed and approved the revised manuscript and take full responsibility for its content.
3. Results
3.1. Sample Characteristics
The sample included 865 students with a mean age of 12.49 ± 0.50 years; 413 were recorded as boys (47.75%) and 452 as girls (52.25%). Mean daily durations were 164.54 ± 79.16 min for LPA, 42.93 ± 29.30 for MVPA, 656.58 ± 123.97 for SED, and 575.95 ± 91.48 for SLP. Mean uncorrected visual acuity was 4.602 ± 0.324. Continuous and categorical sample characteristics are shown in Table 1.
Table 1.
Characteristics of the overall, derivation, and internal validation samples.
3.2. Associations Between Movement Composition and Visual Acuity
The three ilr coordinates were jointly associated with standardized log-transformed visual acuity (Wald χ2 = 28.433, df = 3, p < 0.001). Coefficients were 0.202 (95% CI: −0.119–0.523; p = 0.216) for ilr1, −0.277 (−0.532 to −0.021; p = 0.034) for ilr2, and −0.508 (−0.924 to −0.093; p = 0.017) for ilr3. Holm-adjusted p-values for these three tests were 0.216, 0.068, and 0.050, respectively. Adding only squared coordinates did not establish improved fit (robust Wald χ2 = 1.860, df = 3, p = 0.602); adding all six second-order terms likewise did not (χ2 = 10.140, df = 6, p = 0.119). These comparisons do not exclude other forms of nonlinearity. Coefficients from a robust model of the untransformed visual acuity score had the same signs. Complete main-model results are presented in Table A2. The package-defined, consistency-corrected robust R2 was 0.139 (adjusted 0.121), with a robust residual scale of 0.971 on the standardized log-acuity scale. The minimum robustness weight was 0.348; two weights were below 0.5, and none were zero. Residual plots showed tail asymmetry and variation in spread (Supplementary File S9 and Figure S1), so these diagnostics do not establish that all model assumptions are satisfied.
3.3. Candidate Allocations and Marginal-Range Membership
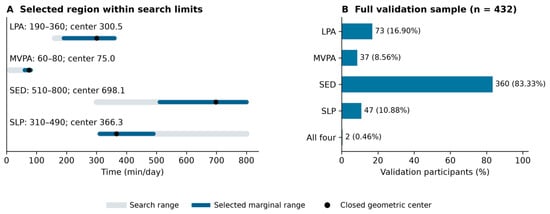
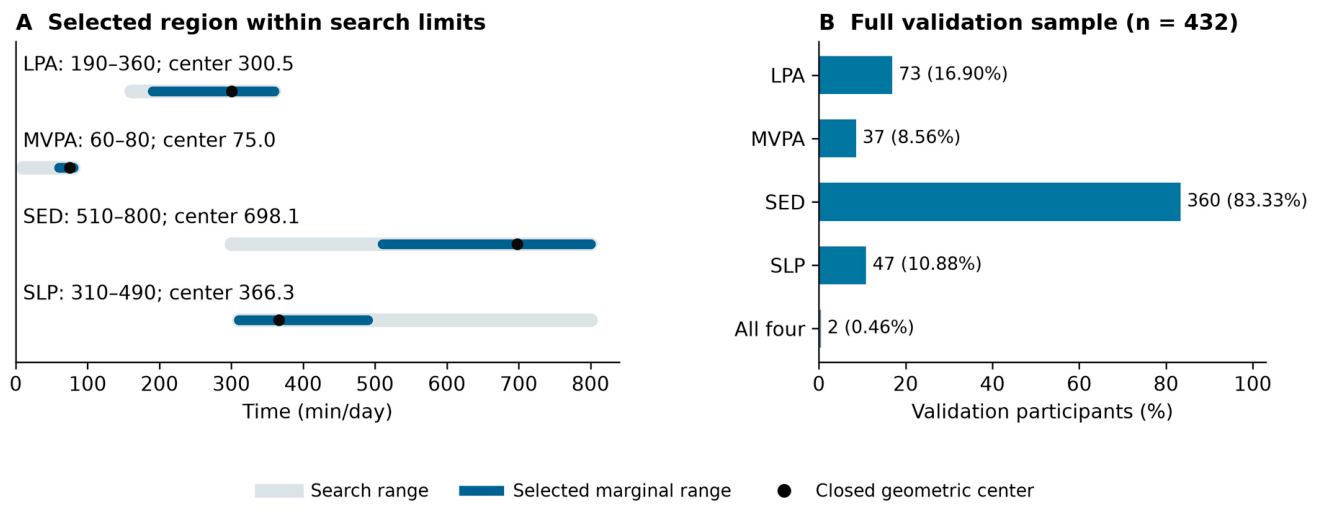
The reproducible search selected 375 of 7488 candidate compositions. Closed geometric centers (marginal ranges) were 300.54 (190–360) min/day for LPA, 74.99 (60–80) for MVPA, 698.12 (510–800) for SED, and 366.35 (310–490) for SLP (Figure 2A). The centers sum to 1440 min before rounding. The selected region touched the LPA, MVPA, and SED upper search limits and the SLP lower limit. Ten illustrative candidate compositions are shown in Table A1. The complete candidate grid, search-region summaries, and validation sensitivity results are provided in Supplementary Files S1–S3.
Figure 2.
Reconstructed candidate region and marginal-range membership. (A) Gray segments show search constraints, blue segments show marginal ranges of the 375 selected compositions, and black points show closed geometric centers. Ranges are not confidence intervals; the center is a compositional summary and need not be a selected grid point. (B) Membership counts and percentages use all 432 validation participants. Full marginal membership need not imply membership in the selected joint region, and none of these ranges is a health recommendation. LPA, light-intensity physical activity; MVPA, moderate-to-vigorous physical activity; SED, sedentary behavior; SLP, sleep.
In all 432 validation participants, 73 (16.90%) were within the LPA range, 37 (8.56%) within the MVPA range, 360 (83.33%) within the SED range, and 47 (10.88%) within the SLP range. Two (0.46%) were within all four ranges (Figure 2B). These are membership proportions, not measures of recommended-behavior adherence.
3.4. Number of Ranges Met and Visual Acuity
All 432 validation participants were analyzed: 31 met zero ranges, 307 one, 74 two, 18 three, and two all four (Table 2). The adjusted difference in the untransformed visual acuity score per additional range was 0.053 (95% CI: 0.005–0.100; p = 0.031). Supplementary count-effect intervals were 0.008–0.097 with HC1 (p = 0.020) and 0.007–0.098 with HC3 (p = 0.023); neither addressed clustering. Numeric education coding gave a similar coefficient. A categorical count model did not establish better fit than the linear count model (classical nested F-test p = 0.738), but the groups meeting three and four ranges contained only 18 and two participants, respectively, limiting assessment of the association at higher counts. Applying the earlier reported ranges to all 432 participants gave 0.023 (95% CI: −0.015 to 0.061; p = 0.232). For those ranges, the historical 413-person subset gave 0.051 (0.011–0.091; p = 0.012), rather than the previously reported 0.054. The earlier coefficient was not retained as the primary estimate. The complete-sample validation regression had an OLS R2 of 0.074 (adjusted 0.058) and an in-sample root mean squared error of 0.313 acuity-score units; these describe within-sample fit rather than external predictive performance. Validation residual plots also showed asymmetry and uneven spread; the maximum Cook’s distance was 0.0282, with five values exceeding 4/432. All observations were retained in the primary analysis (Supplementary File S9 and Figure S1). Influence and education-coding sensitivity estimates are provided in Supplementary File S10.
Table 2.
Uncorrected visual acuity by the number of reconstructed marginal ranges met in the complete validation sample.
4. Discussion
This study found an association between 24-h movement composition and uncorrected visual acuity in the derivation sample. Reconstruction using a common ilr basis changed the candidate ranges. A positive association with marginal-range count was observed in the complete validation sample under the reconstructed 10-min, highest-5% definition, whereas the corresponding confidence intervals included zero with a 5-min grid and alternative selection fractions. The earlier range definition was not associated with acuity at the nominal 0.05 level in the full validation sample. The findings therefore support an exploratory compositional association, with substantial uncertainty about specific candidate allocations.
4.1. Interpretation in Relation to Previous Research
The study extends an integrated movement perspective to a visual function outcome. Liang et al. examined combinations of adherence to established adult movement guidelines in relation to mental health [7], whereas the present study used continuous compositions to derive candidate ranges for a younger population. Consequently, the absolute durations and membership proportions are not directly comparable between the studies. Dumuid et al. derived different time-use regions for fitness and adiposity and considered their overlap [9]. This outcome dependence supports evaluating visual function separately while also showing why the present candidate region cannot be treated as an optimum for overall health.
The reconstructed MVPA center was 74.99 min/day, but the 80-min upper marginal limit was also the search constraint. Extending the MVPA upper limit to 140 min/day shifted its candidate center to 129.74 min/day; this reflects sensitivity to the search space, not evidence of an upper threshold for visual benefit. The LPA range also reached its 360-min search limit, and expanding that limit changed its center. These outcome-specific predictions cannot replace the World Health Organization’s recommendation for children and adolescents to average at least 60 min/day of mainly aerobic MVPA across the week [16].
Ding et al.’s meta-analysis linked physical activity, near work, and screen time to myopia while concluding that evidence for sleep duration remained inconclusive [2]. Wu et al. evaluated an outdoor-recess intervention using cycloplegic refraction and axial length [4]. These findings concern activity settings and refractive outcomes that differ from those measured here. Accelerometer-derived SED cannot be equated with near work, and MVPA cannot be equated with outdoor activity [2,3,4,17]. LPA duration also does not reveal whether movement interrupts prolonged sedentary bouts. The present analysis therefore cannot determine whether light exposure, visual task demands, or sedentary breaks explain the observed associations.
The reconstructed SLP center was 366.35 min/day (approximately 6 h 6 min), and its marginal range extended down to the 310-min search boundary. These values are incompatible with treating the output as a healthy sleep prescription. The American Academy of Sleep Medicine recommends 9–12 h per 24 h for children aged 6–12 years and 8–10 h for adolescents aged 13–18 years [18]. Raising the SLP search lower limit to 480 or 540 min/day changed the selected region; the corresponding count-effect CIs included zero. The boundary-seeking result may reflect model specification, constrained search, residual confounding, and sleep measurement error. It does not establish that reducing sleep improves visual function.
Marginal-range membership differs from membership in the selected joint region. A count treats each marginal condition as equally informative even though their widths, prevalences, and dependencies differ. The upper count groups were small, and lack of evidence against a linear count model does not verify a linear or causal gradient. Keeping all validation participants avoids the previous group-size exclusion, but cannot remove same-school dependence, omitted confounding, or uncertainty in the derivation region.
4.2. Strengths and Practical Implications
The study included students from multiple provinces and schools and combined device-based measurement of waking activity with sleep records and school visual acuity assessments. Compositional analysis acknowledged the relative nature of daily time allocation. The split sample permitted an initial assessment within the same source population, but did not test transferability to schools outside the study.
The findings provide preliminary evidence to inform research on daily activity patterns in junior high school students, particularly the joint allocation of physical activity, sedentary behavior, and sleep in relation to uncorrected visual acuity. Direct evidence is limited to the Chinese junior high school students studied, and applicability to other ages and populations requires evaluation. The results may inform subsequent feasibility and longitudinal studies. School health promotion should continue to follow established guidance on physical activity, sleep, outdoor opportunities, and appropriate near-work habits [16,18,19]; the candidate allocations do not justify prescribing specific school timetables or individual activity targets.
4.3. Limitations and Future Research
The cross-sectional design does not establish temporal order or causality; visual status may also influence activity choices. Uncorrected visual acuity cannot replace refractive examination or axial-length measurement, and averaging the two eyes may obscure interocular differences. Activity and visual acuity were not measured simultaneously, and an interval of less than three months could still introduce exposure–outcome mismatch. Repeated, synchronized movement and ophthalmic assessments would strengthen future research. Only the participant-level mean acuity score was available for reanalysis; eye-specific scores and individual assessment dates were unavailable. Although the schools followed standardized assessment procedures, the limited detailed testing documentation described in Section 2.2.3 restricts independent assessment of measurement consistency.
Exposure estimates depended on wear completeness, intensity classification, and sleep assignment. The diary interval was used when it fully covered the overnight wear-record gap; otherwise, the gap was used. Such gaps may include wakefulness, and closure to 1440 min cannot repair non-wear error. Complete daily exports, wear records, and individual sleep logs were unavailable for re-evaluation, so compliance with the seven-day, at-least-8-h/day protocol, diary–record concordance, and alternative valid-day or sleep rules could not be reassessed. SLP exceeded 12 h in 45 students, 14 h in 11, and 16 h in six; these values were flagged for source-record checking rather than automatically excluded. Device light-channel readings had been recorded, but devices were worn beneath clothing, and the suitability of these readings as an ambient-light exposure measure has not been established. They were not included in the current models. Data on outdoor duration, near work, screen time, and parental myopia were not collected, leaving residual confounding. The occupation-based economic indicator may imperfectly represent family financial circumstances. School and class identifiers were absent, preventing multilevel analysis, school-level resampling, or cluster-adjusted standard errors. Cluster-adjusted inference requires the corresponding cluster assignments [20]. Robust regression, HC1, and HC3 do not resolve this limitation. Unmodeled within-school or within-class dependence may cause the reported intervals to understate uncertainty and may affect nominal significance. Provincial-capital status does not identify individual schools, classes, or cities.
Candidate allocations were sensitive to the 10-min grid, selection fraction, and search bounds. Of 500 individual bootstrap attempts, 498 converged and two failed. The median Jaccard overlap with the primary 375-composition region was 0.689 (sampling 2.5th–97.5th percentiles: 0.038–0.923), and selected regions frequently reached search boundaries. This does not support a unique or precisely determined optimum. The CIs for validation count effects are conditional on each derived range definition; they do not propagate uncertainty from region construction. The internal split came from the same schools and is not external validation. Independent studies with identified school clusters, synchronized eye-specific assessments, and documented device processing are needed before intervention studies can test causal effects.
5. Conclusions
In this sample of Chinese junior high school students, 24-h movement composition was associated with uncorrected visual acuity. The positive marginal-range-count association under the primary definition was sensitive to analytical settings and search constraints. These findings provide preliminary evidence to inform research on daily activity patterns in junior high school students, particularly the relative allocation of physical activity, sedentary behavior, and sleep. Direct evidence is limited to the population and age group studied. The candidate allocations remain exploratory and do not establish activity, sleep, or myopia-prevention targets. Independent longitudinal and intervention studies addressing measurement quality, confounding, and school clustering are needed before specific recommendations can be made.
Supplementary Materials
The following supporting information can be downloaded at: https://www.mdpi.com/article/10.3390/healthcare14223932/s1, Supplementary Materials contain the candidate grid (S1), search-region summaries (S2), search-setting validation estimates (S3), bootstrap region summaries (S4) and boundary contacts (S5), categorical-count models (S6), the complete primary validation model (S7), the raw-score derivation sensitivity model (S8), aggregate model diagnostics (S9), influence and coding sensitivities (S10), and diagnostic plots in Figure S1.
Author Contributions
Conceptualization, X.L.; methodology, X.L.; investigation, J.S.; formal analysis, J.S.; writing—original draft preparation, J.S.; writing—review and editing, C.L.; visualization, Y.W.; funding acquisition, C.L. All authors have read and agreed to the published version of the manuscript.
Funding
This research was supported by the Fundamental Research Funds for the Central Universities at Central China Normal University through the 2025 General Seed Cultivation Project (grant number CCNU25ZZ114).
Institutional Review Board Statement
The study was conducted in accordance with the Declaration of Helsinki and was approved by the Ethics Committee (Human Research Subcommittee) of Central China Normal University (approval number: CCNU-IRB-202412012b; approval date: 15 December 2024).
Informed Consent Statement
The informed consent form was distributed to the parents or legal guardians of all participating students. Written informed consent was obtained from each student’s parent or legal guardian before participation in the study. Agreement to participate was obtained from the students.
Data Availability Statement
Participant-level data are not publicly available to protect the confidentiality of the minor participants. De-identified data supporting the findings are available from the corresponding author upon reasonable request, subject to the applicable ethical approval and privacy requirements.
Acknowledgments
OpenAI Codex (GPT-6) was used as described in Section 2.3.4.
Conflicts of Interest
The authors declare no conflicts of interest.
Abbreviations
The following abbreviations are used in this manuscript:
| CI | Confidence interval |
| ilr | Isometric log-ratio |
| LPA | Light-intensity physical activity |
| MVPA | Moderate-to-vigorous physical activity |
| SD | Standard deviation |
| SED | Sedentary behavior |
| SLP | Sleep |
Appendix A. Candidate Compositions
Table A1.
Ten illustrative candidate 24-h compositions within the reconstructed selected region.
Appendix B. Complete Derivation Model
Table A2.
Robust regression of standardized log-transformed uncorrected visual acuity of 433 derivation participants.
Appendix C. Validation Sensitivity Analyses
Table A3.
Range–count associations using alternative search settings in all 432 validation participants.
Table A4.
Influence of the historical exclusions under the earlier range definition.
Appendix D. Bootstrap Region Variability
Table A5.
Closed geometric centers across 498 successful individual bootstrap resamples.
References
- Liang, J.; Pu, Y.; Chen, J.; Liu, M.; Ouyang, B.; Jin, Z.; Ge, W.; Wu, Z.; Yang, X.; Qin, C.; et al. Global prevalence, trend and projection of myopia in children and adolescents from 1990 to 2050: A comprehensive systematic review and meta-analysis. Br. J. Ophthalmol. 2025, 109, 362–371. [Google Scholar] [CrossRef] [Scilit] [PubMed]
- Ding, H.; Jiang, L.; Lin, X.; Ye, C.; Chun, B. Association of physical activity, sedentary behaviour, sleep and myopia in children and adolescents: A systematic review and dose-response meta-analysis. BMC Public Health 2025, 25, 1231. [Google Scholar] [CrossRef] [Scilit] [PubMed]
- Dirani, M.; Tong, L.; Gazzard, G.; Zhang, X.; Chia, A.; Young, T.L.; Rose, K.A.; Mitchell, P.; Saw, S.-M. Outdoor activity and myopia in Singapore teenage children. Br. J. Ophthalmol. 2009, 93, 997–1000. [Google Scholar] [CrossRef] [Scilit] [PubMed]
- Wu, P.-C.; Tsai, C.-L.; Wu, H.-L.; Yang, Y.-H.; Kuo, H.-K. Outdoor activity during class recess reduces myopia onset and progression in school children. Ophthalmology 2013, 120, 1080–1085. [Google Scholar] [CrossRef] [Scilit] [PubMed]
- Chaput, J.-P.; Carson, V.; Gray, C.E.; Tremblay, M.S. Importance of all movement behaviors in a 24 hour period for overall health. Int. J. Environ. Res. Public Health 2014, 11, 12575–12581. [Google Scholar] [CrossRef] [Scilit] [PubMed]
- Chastin, S.F.M.; Palarea-Albaladejo, J.; Dontje, M.L.; Skelton, D.A. Combined effects of time spent in physical activity, sedentary behaviors and sleep on obesity and cardio-metabolic health markers: A novel compositional data analysis approach. PLoS ONE 2015, 10, e0139984. [Google Scholar] [CrossRef] [Scilit] [PubMed]
- Liang, K.; de Lucena Martins, C.M.; Chen, S.-T.; Clark, C.C.T.; Duncan, M.J.; Bu, H.; Huang, L.; Chi, X. Sleep as a priority: 24-hour movement guidelines and mental health of Chinese college students during the COVID-19 pandemic. Healthcare 2021, 9, 1166. [Google Scholar] [CrossRef] [Scilit] [PubMed]
- Dumuid, D.; Olds, T.; Lange, K.; Edwards, B.; Lycett, K.; Burgner, D.P.; Simm, P.; Dwyer, T.; Le, H.; Wake, M. Goldilocks Days: Optimising children’s time use for health and well-being. J. Epidemiol. Community Health 2022, 76, 301–308. [Google Scholar] [CrossRef] [Scilit] [PubMed]
- Dumuid, D.; Wake, M.; Burgner, D.; Tremblay, M.S.; Okely, A.D.; Edwards, B.; Dwyer, T.; Olds, T. Balancing time use for children’s fitness and adiposity: Evidence to inform 24-hour guidelines for sleep, sedentary time and physical activity. PLoS ONE 2021, 16, e0245501. [Google Scholar] [CrossRef] [Scilit] [PubMed]
- Song, Y.; Qi, Y.; Tan, S.; Li, K.; Lu, D.; Xu, C. A study on activity behavior referrals for teenagers’ “Golden Day”: Based on method analysis of optimal component time zone. J. Phys. Educ. 2025, 32, 129–136. Available online: https://tyxk.scnu.edu.cn/a/20250718/5442.html (accessed on 24 October 2026). (In Chinese)
- Flitcroft, D.I.; He, M.; Jonas, J.B.; Jong, M.; Naidoo, K.; Ohno-Matsui, K.; Rahi, J.; Resnikoff, S.; Vitale, S.; Yannuzzi, L. IMI—Defining and classifying myopia: A proposed set of standards for clinical and epidemiologic studies. Investig. Ophthalmol. Vis. Sci. 2019, 60, M20–M30. [Google Scholar] [CrossRef] [Scilit] [PubMed]
- Zhu, Z.; Chen, P.; Zhuang, J. Intensity classification accuracy of accelerometer-measured physical activities in Chinese children and youth. Res. Q. Exerc. Sport 2013, 84, S4–S11. [Google Scholar] [CrossRef] [Scilit] [PubMed]
- Ying, G.-S.; Maguire, M.G.; Glynn, R.; Rosner, B. Tutorial on biostatistics: Linear regression analysis of continuous correlated eye data. Ophthalmic Epidemiol. 2017, 24, 130–140. [Google Scholar] [CrossRef] [Scilit] [PubMed]
- Koller, M.; Stahel, W.A. Nonsingular subsampling for regression S estimators with categorical predictors. Comput. Stat. 2017, 32, 631–646. [Google Scholar] [CrossRef] [Scilit]
- Fox, J. car: Heteroscedasticity-Corrected Covariance Matrices. R Package Documentation. Available online: https://cran.r-project.org/web/packages/car/refman/car.html#hccm (accessed on 26 October 2026).
- World Health Organization. WHO Guidelines on Physical Activity and Sedentary Behaviour; World Health Organization: Geneva, Switzerland, 2020; Available online: https://www.who.int/publications/i/item/9789240015128 (accessed on 26 September 2026).
- Saw, S.-M.; Chua, W.-H.; Hong, C.-Y.; Wu, H.-M.; Chan, W.-Y.; Chia, K.-S.; Stone, R.A.; Tan, D. Nearwork in early-onset myopia. Investig. Ophthalmol. Vis. Sci. 2002, 43, 332–339. Available online: https://pubmed.ncbi.nlm.nih.gov/11818374/ (accessed on 25 August 2026). [PubMed]
- Paruthi, S.; Brooks, L.J.; D’Ambrosio, C.; Hall, W.A.; Kotagal, S.; Lloyd, R.M.; Malow, B.A.; Maski, K.; Nichols, C.; Quan, S.F.; et al. Recommended amount of sleep for pediatric populations: A consensus statement of the American Academy of Sleep Medicine. J. Clin. Sleep Med. 2016, 12, 785–786. [Google Scholar] [CrossRef] [Scilit] [PubMed]
- General Office of the National Health Commission of the People’s Republic of China. Ten Key Messages on Myopia Prevention and Control Among Children and Adolescents. 2023. Available online: https://www.nhc.gov.cn/fys/c100078/202307/a210193cfd774009a1db0399d713fec9.shtml (accessed on 26 September 2026). (In Chinese)
- Cameron, A.C.; Miller, D.L. A practitioner’s guide to cluster-robust inference. J. Hum. Resour. 2015, 50, 317–372. [Google Scholar] [CrossRef] [Scilit]

Disclaimer/Publisher’s Note: The statements, opinions and data contained in all publications are solely those of the individual author(s) and contributor(s) and not of MDPI and/or the editor(s). MDPI and/or the editor(s) disclaim responsibility for any injury to people or property resulting from any ideas, methods, instructions or products referred to in the content. |
© 2026 by the authors. Licensee MDPI, Basel, Switzerland. This article is an open access article distributed under the terms and conditions of the Creative Commons Attribution (CC BY) license.