


Abstract
As digital payment infrastructures expand, the incidence of card-not-present fraud has become a major source of operational and financial risk for banks, payment processors, and merchants. In response, financial institutions increasingly rely on data-driven decision systems, yet fraudsters continuously adapt their strategies to evade conventional rule-based controls. A promising way to strengthen risk management is to model transactional data so as to uncover non-trivial, high-dimensional patterns characteristic of fraudulent behavior and to embed these models into real-time decision pipelines. In this work, we develop and compare a suite of learning-based fraud detectors, including a convolutional neural network and several machine learning classifiers, within a unified quantitative risk-management framework. The problem is formulated as a supervised classification task within a quantitative risk management framework, where the cost of missed fraud is particularly critical. The mathematical contribution is methodological rather than architectural: we design a leakage-safe and prevalence-faithful evaluation protocol for extremely imbalanced binary classification, combine cross-validated hyperparameter optimization with risk-aligned model selection based on metrics such as recall and Matthews correlation coefficient, and quantify uncertainty by bootstrap confidence intervals and paired McNemar tests. In addition, we connect statistical evaluation with deployment-time decisioning through a decision-theoretic, cost-sensitive threshold rule, showing how institution-specific false-positive and false-negative costs determine the operating point of the classifier. Because fraudulent transactions constitute only a small proportion of the total volume, we employ resampling strategies to mitigate severe class imbalance and systematically calibrate the models via cross-validated hyperparameter optimization. The empirical analysis on real transaction data shows that carefully tuned deep and ensemble methods can achieve strong fraud-detection performance, while the proposed framework clarifies which performance differences are statistically meaningful and which operating points are most suitable under institution-specific false-positive and false-negative costs.
Keywords:
optimization; credit card fraud detection; imbalanced classification; hyperparameter optimization; financial engineering; quantitative risk management MSC:
62P05; 91G70; 68T07
JEL Classification:
C45; G21; G32
1. Introduction
The banking and financial markets are highly competitive, with banks competing not only with one another but also with other financial institutions such as insurance companies and pension funds. In this environment, the development of new technologies for credit and deposit lines, credit card operations and modeling, portfolio management, and the analysis of financial and insurance risk is of paramount importance. Addressing these challenges effectively requires sophisticated quantitative tools and highly skilled specialists in financial mathematics and risk management.
In recent years, there has been a substantial increase in the number of credit card users [1], with statistics indicating 1.06 billion credit cards in use in the United States and 2.8 billion globally. On average, Americans hold four credit cards, while in the European Union the number of cards per person ranges from 0.8 to 3.9, according to a report by the European Central Bank. As the use of credit cards expands, the volume of applications and transactions grows accordingly. Processing such volumes manually is both time-consuming and prone to error. By leveraging historical data and advanced modeling techniques, it is possible to construct decision support systems that can efficiently assess creditworthiness and identify anomalous transactional behavior.
As the adoption of credit cards continues to surge, a parallel challenge emerges in the form of credit card fraud. Financial losses due to fraudulent activities are escalating, posing a significant source of operational and financial risk for both institutions and their customers. In 2021 alone, credit card fraud resulted in global losses exceeding $32 billion [2]. The increasing sophistication of fraudsters, combined with the sheer volume and velocity of transactions, renders traditional rule-based detection methods inadequate. Consequently, there is a pressing need for innovative, reliable, and robust solutions that harness the potential of deep learning and machine learning. Such methods can process large-scale transactional data and uncover subtle, high-dimensional patterns and irregularities, thereby improving both the accuracy and timeliness of fraud detection. Accordingly, the main objective of this comparative study is to develop and rigorously evaluate a set of deep and machine learning models—including a convolutional neural network and several state-of-the-art classifiers—for credit card fraud detection on highly imbalanced transactional data, with particular emphasis on minimizing missed frauds and assessing their suitability for deployment in real-time risk management systems.
Credit Card Fraud
Credit card fraud occurs when an unauthorized person uses a credit card or card information for personal gain without the knowledge or consent of the legitimate cardholder. The simplest form involves the physical theft of a card, which may be used at point-of-sale terminals or ATMs. More sophisticated schemes include the use of fake or counterfeit cards, often produced by skimming or cloning genuine card data.
Fraud can also be perpetrated entirely online. One example is so-called triangulation fraud, in which a fraudulent website advertises heavily discounted goods. Customers place orders and provide their personal card details, believing they are dealing with a legitimate merchant. The fraudsters then use the stolen card data to purchase the goods at regular prices from legitimate vendors, as well as additional items that can be resold. The original customers receive their orders and may remain unaware that their card has been misused.
Another well-known technique is phishing, which aims to obtain sensitive information such as usernames, passwords, and card details, typically through deceptive emails or websites that mimic trusted institutions. Once the credentials are harvested, they can be used directly or resold on illicit markets.
Credit card fraud detection [3] is therefore one of the most actively researched problems in fraud analytics [4,5,6]. It is well known that a large number of transactions associated with a given card must often be examined before fraudulent behavior can be reliably identified [4]. In practice, each transaction is added to a pool of historical operations, and the entire set is analyzed using statistical or machine learning techniques to detect patterns indicative of fraud [7].
In this work, we formulate credit card fraud detection as a supervised binary classification problem on transactional data. We apply standard preprocessing procedures to the dataset, including handling missing values where necessary, encoding categorical variables, and scaling numerical features. On top of this preprocessed data, we train a convolutional neural network with several configurations of hidden layers, together with a collection of widely used machine learning classifiers, in order to construct an ensemble of competitive models. The models are tuned and compared using appropriate performance metrics to enhance their discriminative power, particularly with respect to the minority (fraudulent) class. Finally, we evaluate the models by training them on a balanced subset of the data and assessing their effectiveness on a held-out test set, focusing on measures that are critical from a risk management perspective, such as recall, precision, F1-score, and the rate of false negatives.
Despite the remarkable volume of studies that benchmark fraud detectors on the widely used ULB/Kaggle credit-card dataset [8], recent surveys emphasize that published results are often difficult to compare because they rely on heterogeneous experimental protocols (e.g., different resampling strategies, train/test splitting practices, and hyperparameter-tuning procedures) and frequently prioritize overall accuracy, which can be misleading under extreme class imbalance [9,10]. This creates a research gap between “high reported scores” and evidence that is transparent, auditable, and directly actionable for risk management, where the dominant concern is typically the cost of missed fraud (false negatives) rather than marginal gains in aggregate accuracy [3,11]. The contribution of the current study is therefore not the introduction of yet another classifier for the same benchmark, but the construction of a consistent and reproducible comparative framework that (i) evaluates a regularized CNN alongside a broad family of classical and ensemble learners under a unified pipeline, (ii) performs systematic cross-validated hyperparameter optimization on the training data only to reduce selection bias and overfitting risk, and (iii) reports a risk-aligned set of metrics (including MCC and class-specific error rates) together with operating-point performance under realistic prevalence. Importantly, this controlled protocol reveals that some gains reported under balanced evaluation do not persist under true-prevalence testing, and it clarifies which methods are preferable under different false-positive budgets and operational constraints. Moreover, the framework is not purely descriptive: it is connected to decision theory through the explicit derivation of a cost-sensitive operating threshold, thereby linking model comparison, confusion-matrix metrics, and institution-specific risk preferences within a single mathematical formulation. All data splits, preprocessing steps, and hyperparameter-search settings are specified to support exact replication. In this way, the contribution complements prior model-specific studies by providing an end-to-end, methodologically transparent benchmark that clarifies which performance gains persist under controlled evaluation and which trade-offs remain when models are considered for operational deployment in banking systems [1,12].
Recent model-centric contributions propose specialized detectors—for example, hybrid CNN–LSTM architectures with attention [13], continuous-coupled neural networks [14], distribution-preserving resampling combined with sequence models [15], or boosted-tree variants tailored for extreme imbalance [16]. In contrast, our paper does not claim a new detection architecture or a new resampling/boosting mechanism; instead, it contributes a leakage-safe and prevalence-faithful evaluation framework in which such algorithmic advances can be assessed against strong classical baselines under identical splitting, tuning, and thresholding protocols. This positioning helps disentangle genuine modeling improvements from protocol-driven effects (e.g., resampling, split design, and operating-point selection), thereby improving comparability and actionability for deployment.
The remainder of the paper is organized as follows. In the next section, we describe in detail the dataset and the algorithms employed in the study. Section 3 introduces the evaluation metrics used to quantify model performance and presents the numerical results, while additional implementation details and optimal parameter settings are reported in the Appendix A, Appendix B, Appendix C, Appendix D, Appendix E, Appendix F and Appendix G. Section 4 provides a thorough discussion of the empirical findings, highlighting the trade-offs between different models and their implications for credit card fraud risk management, discussing the limitations of the work, and outlining possible directions for future research. The paper concludes in Section 5 with a summary of the main contributions and insights.
2. Materials and Methods
In this section, we begin with providing a data overview, where the presampling procedure is described. Then, the two types of algorithms used—the neural network and the machine learning techniques are thoroughly explained.
2.1. Data Overview
2.1.1. Handling Imbalanced Datasets
Imbalanced Learning is a type of machine learning used to manage classification problems where there is a significant difference in the number of examples representing different classes. This could be complex because most learning algorithms are not designed to deal with such an imbalance and may be biased toward the majority class. This could result in the minority class not being well-modeled by the final system [17,18,19]. There are various solutions to address imbalanced data. One approach is to employ resampling methods [20,21], which modify the dataset before training the algorithm. This can be done by either removing samples of the majority class (undersampling techniques), adding more instances of the minority class (oversampling techniques), or combining both [19,22,23].
There are two main ways to balance a dataset skewed towards one class: oversampling and undersampling. The choice depends on the characteristics of the dataset. Oversampling is typically more effective when there are few samples from the minority class, while undersampling is more suited for large datasets [19]. Oversampling involves duplicating samples from the minority class. Undersampling is a method of reducing the imbalance ratio by removing samples from the majority class. This can be done randomly, but more advanced techniques involve removing samples from overlapping regions or replacing subsets of samples with their centroids. Both approaches have their advantages and disadvantages [19]. Oversampling can improve classification performance but may lead to overfitting. Undersampling can speed up training time but may discard valuable samples [12].Undersampling is a commonly employed strategy in the reported studies [24], and under certain conditions performs well [25]. There are also advanced undersampling strategies, which target removing records over overlapping regions, for example, Tomek Links [26] and Edited Nearest Neighbors (ENN) [27].
2.1.2. Data
The dataset used in this study is taken from [8] and contains credit card transactions conducted by European cardholders in September 2013. It comprises 284,807 transactions, of which 492 are labeled as fraud, i.e., the fraud class represents only 0.172% of all observations. The extreme class imbalance makes this benchmark particularly suitable for evaluating fraud detection models under realistic operating conditions, and this is one of the reasons why it is heavily used in the literature.
All input attributes are numerical. Due to confidentiality constraints, the original explanatory variables are not provided; instead, the features V1, V2, …, V28 are anonymized via a principal component analysis (PCA) transformation. The two features not transformed by PCA are ‘Time’ and ‘Amount’. The variable ‘Time’ denotes the elapsed time in seconds since the first transaction in the dataset, while ‘Amount’ represents the transaction value and can be interpreted as a proxy for example-dependent misclassification cost in cost-sensitive settings [28]. The response variable ‘Class’ equals 1 for fraudulent transactions and 0 otherwise [8]. In the original data, the non-fraud and fraud subsets have shapes (284,315, 31) and (492, 31), respectively.
Before model development, we apply a leakage-safe preprocessing and evaluation protocol. The dataset is first split into disjoint training and test subsets using a stratified 80/20 partition, preserving the original class proportions. All data-dependent transformations are fitted exclusively on the training subset; in particular, StandardScaler [29] is fit on the training data and then applied to both training and test subsets using the learned parameters. To mitigate class imbalance during model fitting, we apply random undersampling only to the training data, retaining a controlled subset of the majority class (i.e., partial undersampling 1:20 rather than full 1:1 balancing). We empirically chose the ratio as a balance between performance and computational effort (Figure A1). We also empirically examined that the undersampling refinements [26,27] have no effect in our case, so we do not apply them (Figure A2). The models are tuned via average_precision on the resampled training set [30]. The test subset is never resampled and is used solely for the final hold-out evaluation, ensuring that the reported performance reflects deployment on a naturally imbalanced stream of transactions. This workflow follows the best practices for avoiding information leakage in supervised learning.
2.1.3. Implementation Details and Reproducibility
- Software and versions
- Python 3.9.7, scikit-learn, imbalanced-learn, XGBoost, TensorFlow/ Keras versions;
- Random seeds
- One global seed (=42) is used for split, resampling, and model initialization;
- Split
- Stratified random 80/20 holdout via StratifiedShuffleSplit;
- Resampling
- RandomUnderSampler (sampling_strategy = 1/20, random_state = 42, replacement = False);
- Hyperparameter grids
- Inspired from [31], adjusted to log-spaced ranges;
- Grid-search
- GridSearchCV with cv = 5, scoring = average_precision, n_jobs = −1; total fits = |grid| × cv;
- CNN convergence
- EarlyStopping (monitor = val_loss, patience = 30, restore_best_weights = True) + ModelCheckpoint (monitor = val_loss);
- Optimizer
- Adam (learning_rate = );
- Hardware
- CPU Intel® Core™ i9-12900, 2.4 GHz; RAM 128 GB, 4000 MT/s; GPU Intel® UHD Graphics 770.
2.2. Deep Learning
2.2.1. CNN-Based Fraud Detection
Deep learning is a subtype of machine learning that uses algorithms to model high-level concepts in data. Deep learning automatically extracts relevant features from the data and performs “end-to-end learning” from the raw data to complete a task, such as classification. Most deep learning methods rely on neural networks. This is the reason why deep learning models are often called deep neural networks. The ‘deep’ part of a neural network refers to the number of hidden layers it has. Traditional neural networks (which have only 1–2 hidden layers) are shallow, while deep networks can have plenty of hidden layers. Deep learning models are trained using large, labeled data sets. The neural network architectures used in deep learning allow the models to learn features directly from the data without requiring manual feature extraction.
A convolutional neural network (CNN) is one of the most popular types of deep neural networks. A CNN convolves learned features with input data using convolutional layers and works by extracting features directly from data. The relevant characteristics are not pretrained; they are retained while the network trains on a collection of labeled data sets. The automated feature extraction process used in deep learning models makes them much more accurate for predictive tasks such as credit card transaction classification.
Convolutional neural networks are designed to detect specific patterns or shapes in small patches of data and to reduce the amount of spatial information that needs to be processed when dealing with large data sets. They accomplish this by replacing the regular fully connected layer with a layer of convolutional filters that performs a convolution operation over the input neurons. The convolution operation is like sliding a filter over an input, computing the weighted sum of the input elements using the filter weights, and applying an activation function to produce an output similar to a typical neuron. The convolution operation can be seen as a filter that scans the input from left to right and top to bottom to identify a specific pattern. The model learns the weights of the filters. Having multiple filters allows for capturing various patterns that are useful for reducing the loss of the task at hand. The pooling layers can be used to aggregate the feature maps into smaller maps, either to summarize the information in the final layers or to save memory in the intermediate layers [12].
It is found that the artificial neural networks do well with this type of fraud detection [1,32,33]. In this work, we employ a one-dimensional convolutional neural network (1D-CNN), following the architecture in [34], because it combines representation learning with parameter sharing, which provides an effective inductive bias and helps regularization on limited minority-class data. We have performed a benchmark test with a multilayer perceptron (MLP); see Appendix C for comparison.
Unlike images or signals, the transaction vector does not possess a natural spatial topology. In this study we employ a one-dimensional CNN as a compact, parameter-sharing alternative to a fully connected front-end. A Conv1D layer applies the same small set of filters across the feature index, which could be viewed as a constrained linear transformation (equivalent to multiplication by a Toeplitz-structured matrix in the linear case), thereby reducing the number of free parameters and providing an inductive bias that often improves generalization under severe class imbalance. We emphasize that the input index is not interpreted as time; the reshaping from (n, 30) to (n, 30, 1) is solely the tensor format required by Conv1D implementations. The canonical feature order (Time, V1–V28, ‘Amount’) is kept fixed across all methods; V1–V28 are PCA components and ‘Time’ and ‘Amount’ are not PCA-transformed.
To prevent information leakage, the train-test split is performed first using a stratified hold-out partition, and all data-dependent transformations are fitted on the training subset only and then applied to validation/test data. Class imbalance is addressed only during model fitting by resampling the training subset (the test subset is kept untouched to reflect the original operating conditions). For comparison, we have also implemented a chronological 4:1 split in order to assess temporal degradation (Appendix D).
2.2.2. Architecture and Training
The adopted CNN consists of three Conv1D blocks with ReLU activation, interleaved with dropout and batch normalization, followed by max pooling, flattening, and two dense layers with a sigmoid output (Table 1). We use He-normal initialization and regularization on both kernel and bias terms [35]. The network is optimized with Adam [36] and binary cross-entropy loss [37]. To stabilize training and mitigate overfitting, we employ early stopping based on the validation loss and keep the best weights via checkpointing. Example learning curves are provided in Figure 1. At inference time, the sigmoid output is interpreted as a fraud probability and a default threshold of 0.5 is used to obtain class labels.
Table 1.
CNN architecture and training setup.
Figure 1.
Model loss at the train and validation phases.
2.3. Machine Learning
Machine learning is a subfield of computer science dedicated to developing algorithms that allow computational systems to autonomously identify patterns and improve performance from data, thereby bypassing the need for task-specific, explicit programming. Nowadays, machine learning is being used in many different areas [38,39], including credit card fraud detection [12].
It is a contemporary technology that replaces traditional methods and can process large datasets that are difficult for humans to access immediately. Machine learning techniques can be broadly categorized as supervised or unsupervised learning. Detecting fraud can be accomplished using any method, but the choice often depends on the available datasets.
Supervised learning involves providing a model or algorithm with example inputs and their corresponding desired outputs. The algorithm then identifies patterns and connections between the input and output data with the objective of learning a general rule that can map inputs to outputs. The training process continues until the model achieves a satisfactory level of accuracy on the training data. With supervised learning, anomalies can be identified based on previous examples. Various supervised methods have been used in the past few decades to detect credit card fraud.
Logistic regression (LR) is a linear probabilistic classifier that models the log-odds of the positive class as a weighted sum of the input features and returns class probabilities via a sigmoid link. Class labels are obtained by applying a decision threshold (often 0.5 by default), which can be tuned to control the false-negative/false-positive trade-off in imbalanced fraud detection. Due to its simple structure, LR is fast, interpretable via its coefficients, and commonly used as a strong baseline, often with regularization to improve generalization.
The k-Nearest Neighbors (kNN) method is an instance-based classifier that assigns a label to a new transaction by majority vote among its k closest training samples under a chosen distance metric. In practice, the Minkowski metric is widely used, where yields the Manhattan distance and the Euclidean distance. Since distances are sensitive to feature scales, standardization is typically required, and the choice of k controls the bias–variance trade-off and robustness to noise.
Support vector machines (SVMs) construct a decision boundary by maximizing the margin between the two classes; the resulting classifier depends only on a subset of training points, the support vectors. For non-linearly separable data, kernel functions implicitly map inputs to a higher-dimensional space where a separating hyperplane can be found. The main hyperparameters (e.g., the penalty C and kernel parameters such as γ for RBF kernels) regulate the margin–misclassification trade-off and strongly affect generalization.
The Naïve Bayes classifier applies Bayes’ rule to estimate the posterior probability of each class, assuming conditional independence of features given the class label. Although this assumption is rarely true, Naïve Bayes often performs competitively as a lightweight baseline, especially when the signal is spread across many weakly informative features. In this study, we use Gaussian Naïve Bayes, which models each feature (per class) by a normal distribution and yields efficient training and prediction.
The decision tree classifier partitions the feature space through a sequence of impurity-reducing splits (e.g., based on Gini index or entropy), producing a set of human-readable if–then rules. Its main advantage is interpretability and the ability to capture non-linear interactions without feature engineering. However, deep trees can overfit; therefore, depth, minimum leaf sizes, and pruning (e.g., cost-complexity pruning viaccp_alpha) are typically used to control complexity and improve generalization.
eXtreme Gradient Boosting (XGBoost) is a gradient-boosted decision tree framework that builds an ensemble sequentially, where each new tree corrects the errors of the previous model. It is designed for efficiency and scalability and incorporates explicit regularization to mitigate overfitting. Optimization relies on gradient information (and commonly second-order approximations), which often yields strong performance on structured/tabular data and makes XGBoost a standard benchmark for fraud detection.
Random forest is an ensemble of decision trees trained on bootstrap samples of the data, with additional randomness introduced by considering only a subset of features at each split. Aggregating many de-correlated trees reduces variance and typically improves robustness compared with a single tree. Random forests are effective on heterogeneous tabular data, provide probabilistic outputs and feature-importance measures, and serve as a reliable non-linear baseline in imbalanced classification settings.
Extra Trees (Extremely Randomized Trees) are a tree-ensemble method related to random forests, but with stronger randomization in the splitting process. In particular, split thresholds are drawn at random (rather than optimized exhaustively), which increases diversity among trees and can reduce variance and training time. As with random forests, predictions are aggregated across trees; in practice, Extra Trees can offer competitive accuracy with improved stability, though the added randomness may increase bias depending on the dataset.
3. Results
Various classification metrics can be used to evaluate how well a model is performing. These metrics consider the discrete nature of the output classes and provide a way to compare them. Each metric has its strengths and weaknesses, so it is essential to choose the most appropriate for the task at hand [40].
The models used in this study are measured via the following scores, together with their 95% bootstrap confidence intervals (2000 resamples): Accuracy, Precision, Recall, F1-score [41]; Matthews Correlation Coefficient (MCC) [11]. The results are displayed by means of confusion matrix [42].
Please note that, in our case [8], the negatives are the legitimate ones, and the positive ones are the fraudulent transactions.
The algorithms used in the fitting procedure differ across models, but all experiments follow a common, leakage-safe workflow. First, the data are split into training and test subsets in a 4:1 ratio using a stratified random hold-out partition (fixed random_state) so that the test set preserves the original fraud prevalence. All data-dependent transformations are then fitted on the training subset only. In particular, the ‘Amount’ feature is standardized (zero mean, unit variance) using StandardScaler fitted on the training data and subsequently applied to the test data.
Class imbalance is handled only during model fitting on the training subset, during which we apply RandomUnderSampler with a fixed random_state and a target ratio of approximately 1:20 (minority:majority), either within each cross-validation fold or prior to refitting the final model on the full training set. Hyperparameters are selected via cross-validated search on the training data only, after which the best configuration is refitted on the (training-only) resampled data and evaluated once on the untouched test set. All classical ML models were tuned using average_precision on the resampled training set, and evaluated on an untouched stratified hold-out test set. All splits, seeds, and hyperparameter grids are specified to enable exact replication.
During the hyperparameter tuning process, each influential hyperparameter is thoroughly tested with a range of plausible values [31], employing a grid search. The optimal values identified through this process are detailed in Table 2, Table 3 and Table 4 and Table A4, Table A5, Table A6, Table A7, Table A8 and Table A9/Figure 2, Figure 3 and Figure 4. Hyperparameters are tuned via grid search with 5-fold cross-validation on the training subset only. For each candidate configuration, we report the cross-validated mean score. The final reported test-set metrics are computed once, using the best cross-validated configuration refit on the full training subset, and the hold-out test set is never used during model selection.
Table 2.
Performance metrics of the CNN model on the imbalanced hold-out test set (95% bootstrap CI, 2000 resamples).
Table 3.
Performance metrics and optimal hyperparameters of the XGBoost model.
Table 4.
Performance metrics and optimal hyperparameters of the ET model.
Figure 2.
CNN PR and ROC curves.
Figure 3.
XGBoost PR and ROC curves.
Figure 4.
ET PR and ROC curves.
If there are plenty of hyperparameters to tune, the total number of combinations could get quite large. For instance, the LR has the least number of combinations: 340, while it is the XGBoost which has the greatest number of combinations: 95,536. The latter means that 476,280 folds must be computed. Although the overall tuning time depends on the number of evaluated configurations, the cross-validation scheme, and the computational environment, a modern computer could cope with the task within a couple of minutes. Of course, the training time should be interpreted qualitatively rather than as a universal constant.
What is more, the graphs depicted in Figure A5 offer a comprehensive visual representation of the other models’ performance metrics. These figures provide an intuitive understanding of each model’s effectiveness and reliability in different scenarios, allowing for a more nuanced comparison across the various approaches we explored.
It is important to note that while achieving high accuracy is desirable, the balance between sensitivity (true positive rate) and specificity (true negative rate) is paramount, especially in fraud detection. Overfitting can often lead to a high sensitivity but at the cost of reduced specificity, leading to a large number of false positives, which is undesirable in practical applications. Therefore, our analysis pays particular attention to the balance between these metrics, ensuring that the models are not only accurate but also practical and applicable in real-world scenarios.
In Figure 5, the results from McNemar’s test are presented.
Figure 5.
McNemar tables.
4. Discussion
4.1. Review and Comparison of the Results
As mentioned earlier, there is a substantial body of work dedicated to credit card fraud identification. Numerous attempts to recognize fraudulent behavior using neural networks have been reported [43]. Several recent surveys provide broad overviews and comparative analyses of machine learning and deep learning approaches to credit card fraud detection [44,45,46,47,48] as well as other applications [49]. In particular, ref. [9] reviews credit card fraud detection in the context of disruptive technologies and emphasizes the importance of handling class imbalance, incorporating cost-sensitive learning and using a rich set of evaluation metrics, while [10] systematically surveys machine learning methods and highlights the roles of feature engineering, temporal modeling and operational constraints.
A variety of deep and hybrid models have been proposed in recent years. A hybrid technique, combining supervised and unsupervised learning, is suggested in [1]; the authors use unsupervised outlier scores at varying granularity levels. In [32], artificial neural networks and machine learning algorithms are employed to differentiate between fraudulent and legitimate transactions. The study [50] considers a hybrid resampling method and an LSTM ensemble classifier. The authors of [51] propose an artificial neural network featuring a multilayer perceptron, while [52] compares a multilayer perceptron to other machine learning techniques. The performance of the TabBERT neural network is explored in [53]. In [54], an ensemble deep learning model combined with a novel ANN-based voting mechanism is studied. An extensive exploration of different deep learning approaches is reported in [55], where a Gated Recurrent Units (GRU) architecture is found to perform best. More recently, Wu et al. [14] proposed a continuous-coupled neural network architecture for credit card fraud detection, demonstrating improved performance on benchmark datasets, while Akour et al. [13] introduced a hybrid CNN–LSTM model with an attention mechanism that effectively captures both local patterns and temporal dependencies in transaction sequences.
Beyond recurrent and convolutional architectures, transformer-based models have recently become competitive baselines for tabular learning. TabTransformer [56] uses self-attention to construct contextual embeddings for categorical fields, improving robustness and offering a degree of interpretability, while FT-Transformer [57] provides a streamlined transformer adaptation that often narrows the performance gap between deep models and gradient-boosted decision trees under controlled protocols. These approaches are particularly relevant for real-world fraud settings with heterogeneous features (e.g., merchant identifiers, MCC codes, device fingerprints), where attention can capture cross-feature interactions without manual feature crosses. In [8] benchmark used here, most predictors are anonymized PCA components, which limits conclusions about the benefits of contextual categorical embeddings; nevertheless, incorporating tabular transformers into the unified evaluation pipeline is a natural extension. Because payment-fraud data are rarely shareable across institutions due to regulatory and confidentiality constraints, federated learning (FL) has emerged as a practical paradigm for collaborative model training without centralizing raw transactions. The standard FedAvg approach [58] and subsequent surveys [59] highlight how FL can learn shared models under non-IID, imbalanced data while controlling communication and privacy risks. Recent fraud-oriented work further develops privacy-preserving and scalable FL protocols (e.g., Starlit [60]) and integrates FL with graph-based representations for cross-entity signals (e.g., FinGraphFL [61]). While the present study focuses on an auditable single-dataset benchmark, these results motivate extending the same leakage-safe and risk-aligned evaluation protocol to multi-party FL settings when suitable datasets and governance constraints permit. Finally, graph neural networks (GNNs) explicitly model relationships between cardholders, merchants, devices and transactions and have been shown to improve detection when relational structure is available. Representative directions include camouflage-resistant aggregation [62] and consistency-aware neighbor modeling [63], complementing more recent domain-specific encoder–decoder GNN designs [64]. Since [8] does not provide explicit entity links; our experiments cannot exploit relational edges. However, GNN-based fraud detection remains an important parallel line of work and a promising direction for future cross-dataset validation.
Comparisons between deep and machine learning methods on common datasets are also frequently performed. For example, ref. [65] uses the same dataset as in the present study [8], but without balancing it, and again finds that the deep learning approach outperforms its machine learning counterparts. In [66], two oversampling techniques are applied to [8] in the context of a variety of machine learning and deep reinforcement learning algorithms; the deep learning model there performs ineffectively, illustrating that deep architectures are not universally superior and that their success depends on data representation and training protocol. In [67], machine learning methods are compared with three deep learning approaches under undersampling of [8]; it is found that the deep learning models perform better than their machine learning counterparts when sufficient data are available, but their accuracy deteriorates on small samples.
Besides the choice of a “superior” algorithm, other components of the fraud identification pipeline are equally important. Considerable attention has been devoted to preprocessing, representation learning and sampling. A two-stage framework consisting of a deep autoencoder and a supervised classifier is proposed in [68]. Feature extraction and data sampling techniques are systematically analyzed in [69], where random undersampling combined with a convolutional autoencoder yields the best results. A novel neural-network-based method relying on representation learning is suggested in [33]. The authors of [70] propose uncertainty quantification approaches coupled with point forecasts to mitigate model biases. In [71], an unsupervised attentional anomaly detection network using autoencoders with feature attention and generative adversarial networks is used to separate fraudulent from legitimate transactions in massive datasets. Recent work has further extended these ideas. Yousefimehr and Ghatee [15] introduce a distribution-preserving resampling method combined with a LightGBM–LSTM architecture for sequence-wise fraud detection, showing that carefully designed resampling can significantly improve F1-scores while preserving the underlying distribution. Zhao et al. [16] propose an improved LightGBM tailored for extremely imbalanced data and demonstrate its effectiveness on credit card fraud detection, complementing earlier gradient-boosting approaches.
Graph-based and interpretable architectures have also gained traction. Cherif et al. [64] propose an encoder–decoder graph neural network that models relationships among cardholders, merchants and transactions, achieving competitive results and highlighting the importance of relational information. Baisholan et al. [28] present FraudX AI, an interpretable machine learning framework that combines an ensemble of classifiers with explanation tools, showing that it is possible to achieve high performance on imbalanced fraud data while maintaining a level of interpretability acceptable for practitioners.
Against this backdrop, the comparative results on the common validation set suggest that the CNN, XGBoost and ET methods provide the strongest overall performance when both minority-class detection and false-alarm control are considered jointly. Numerically, the Extra Trees classifier yields the best values for accuracy (), fraud-class precision (), F1-score (), and Matthews correlation coefficient (), while matching the recall () achieved by XGBoost and the CNN (Table 2, Table 3 and Table 4). XGBoost performs very similarly, with accuracy of , precision of , F1-score of , and MCC of . The CNN remains competitive in terms of fraud detection sensitivity since it reaches the same recall (). Conversely, simpler baselines (e.g., LR, DT, NB) can reach competitive recall but at a further loss in precision and overall balance (MCC), underscoring that no single model dominates all criteria simultaneously. Overall, compared with our previous studies [40,72] and with metrics reported in related work on the same benchmark [8,13,14,32,50,51,55], the CNN results demonstrate superior performance; however, we emphasize that published scores are often not directly comparable due to differences in splitting, resampling, tuning and thresholding protocols. These findings, therefore, support a risk-management interpretation in which model choice and operating threshold should be guided by institutional constraints (e.g., acceptable false-positive budget versus tolerance for missed fraud), rather than by a single aggregate metric.
The literature on credit card fraud detection using classical machine learning is equally rich. Reviews and position papers can be found in [44,45,47,48,73], while a dedicated survey of machine learning methods is provided in [10]. Different subsets of the algorithms logistic regression, k-nearest neighbors, support vector machines, Naïve Bayes, decision trees and random forests have been applied in [74,75,76,77,78,79,80,81,82,83], some of which compare their results with neural network approaches. Gradient-boosting frameworks such as XGBoost and LightGBM are employed in [84], and their performance has been further refined in recent contributions [16]. Interestingly, ref. [85] finds that, under certain conditions, linear regression can produce more accurate results than an artificial neural network, while [86] demonstrates the advantage of the Light Gradient Booster algorithm. The FraudX AI framework of [28] shows that well-designed ensembles, augmented with interpretability techniques, can provide both strong performance and actionable explanations for investigators.
On the common highly imbalanced validation set, all models achieve near-perfect accuracy (≈0.996–0.999), making precision, recall, F1-score, and MCC more informative for comparative assessment. Among the remaining classical models, kNN is the closest competitor in terms of balanced performance (MCC ), whereas NB illustrates the typical class-imbalance trade-off, attaining acceptable recall at the cost of very low precision and, hence, a large number of false positives (Appendix E). It is also worth noting that the RF model attains the highest recall among all tested methods (; Table A9), indicating the strongest ability to recover fraudulent transactions. However, this gain is accompanied by only moderate precision () and a lower MCC () than those of XGBoost and Extra Trees, which suggests that RF is attractive when minimizing missed frauds is the dominant objective, but less favorable when a more balanced trade-off between fraud capture and false-alarm control is required. Importantly, the McNemar tests (Figure 5) show that the differences between models are not merely artifacts of aggregate metric values, but are also reflected in their paired error patterns. In particular, the CNN significantly outperforms XGBoost in paired decisions (CNN-only correct: 30 vs. XGB-only correct: 14; ). By contrast, the comparison between the CNN and Extra Trees is much less conclusive: although the discordant counts again favor the CNN (30 vs. 16), the corresponding McNemar p-value of is slightly above the conventional threshold. This indicates that, under the present split, the null hypothesis of equal marginal error rates cannot be rejected at the 5% significance level. Accordingly, the CNN–ET difference should be interpreted as borderline or suggestive rather than statistically confirmed, implying that the two models remain very close in terms of paired classification behavior. Overall, the results point to an operational trade-off: if minimizing false alarms and analyst workload is paramount, a model with stronger precision/MCC characteristics may be preferable; if minimizing missed fraud cases is the dominant objective, ensemble tree methods may still be attractive, while threshold tuning or model combination remains a practical way to satisfy institution-specific constraints on false-positive and false-negative rates.
4.2. Implications, Limitations and Future Research
This paper contributes to the domain of credit card fraud detection by providing a systematic comparative analysis of several deep learning and machine learning methodologies within a unified experimental framework. At the heart of the study is the development and evaluation of a CNN-based model and a range of classical classifiers, all tailored to identify and predict fraudulent credit card transactions under severe class imbalance. By focusing explicitly on metrics such as recall, precision, average_precision, F1-score, specificity and the Matthews correlation coefficient, the analysis offers a nuanced view of how different models behave under conditions representative of real-world digital payment environments.
A key contribution is the combined use of resampling techniques and hyperparameter optimization to mitigate imbalanced data and improve model calibration. We employ random undersampling to rebalance the dataset and systematically tune the hyperparameters of each classifier using GridSearchCV, ensuring that the models operate close to their performance potential without being overly biased toward the majority (legitimate) class. For the CNN architecture, the use of regularization, batch normalization and a Flatten layer to vectorize intermediate feature maps stabilizes the learning process and helps to avoid overfitting, which translates into improved detection performance for the minority class. The resulting models are evaluated through confusion matrices and comprehensive classification reports, demonstrating that the proposed approach not only achieves high overall accuracy but also maintains a favorable balance between false positives and false negatives, a property that is crucial for operational deployment in fraud risk management systems.
From a risk management standpoint, our empirical findings underscore the importance of prioritizing false negatives over small gains in global accuracy. Missed fraudulent transactions may incur substantial direct losses and downstream costs, whereas a manageable number of false positives can be handled through manual or semi-automated investigation processes. The CNN model in our study is well suited for settings where institutions are willing to accept a slightly higher volume of alerts in order to substantially reduce the number of missed frauds. Conversely, when investigation capacity is limited or customer friction must be minimized, some of the classical models may be attractive due to their lower false positive rates and greater interpretability. This observation aligns with recent work on interpretable and cost-aware models such as FraudX AI [28], which explicitly balances performance with explainability and operational constraints.
Although the dataset [8] is a widely used benchmark that enables direct comparison with a large body of prior work, it represents a single region and a short historical window. Consequently, the absolute performance levels and model rankings reported here should be interpreted as specific to this benchmark and not automatically extrapolated to other geographies, card products, merchant ecosystems, or more recent periods where fraud tactics may differ. On the other hand, public, labeled, real-world payment-fraud datasets are scarce due to privacy and confidentiality constraints, which limits cross-dataset validation in open research [87]. As future work, we plan to extend the same leakage-safe, risk-aligned evaluation pipeline to additional datasets and to more recent or longitudinal data when available, in order to assess external validity and robustness under evolving fraud patterns [88].
At the same time, the study has several limitations that point to directions for future research. First, all experiments are conducted on a single benchmark dataset [8]. While this dataset is widely used and facilitates comparison with existing work, it does not capture the full heterogeneity of transaction streams across different institutions, regions and time periods. Second, the analysis is static and does not explicitly address concept drift or the evolution of fraud strategies. Third, our handling of class imbalance is restricted to random undersampling, whereas more sophisticated techniques—such as distribution-preserving resampling [15], improved boosting methods for extremely imbalanced data [16], or sequence-wise resampling integrated with temporal models [15]—may further enhance robustness. Finally, we do not explicitly model graph-structured relationships between cardholders, merchants and devices, even though recent work on encoder–decoder graph neural networks [64] and continuous-coupled neural networks [14] indicates that exploiting relational and temporal structure can yield additional gains.
From a deployment perspective, the proposed models could be integrated into a bank’s transaction-processing pipeline as a low-latency scoring service (e.g., a microservice invoked at authorization time), with decision thresholds configured to match institution-specific risk appetite and investigation capacity. Beyond resampling during model fitting, operational deployment typically requires cost-sensitive decisioning: if the estimated fraud probability is and the institution specifies misclassification costs (false alert) and (missed fraud), then (under calibrated probabilities and zero cost for correct decisions) the minimum-expected-cost rule flags a transaction as fraud whenever
In practice, can be selected on a validation set either by minimizing expected cost over a grid of thresholds or by enforcing operational constraints (e.g., a maximum false-positive rate/alerts per day) and reporting the resulting recall and precision. Cost sensitivity can also be incorporated during training via class- or sample-weighted objectives (e.g., weighted cross-entropy for neural models) to reflect the typically higher cost of false negatives. For illustration, if the cost of a missed fraud is assumed to be ten times the cost of a false alert, i.e., , then the cost-optimal threshold becomes
Thus, any transaction with estimated fraud probability above about would be flagged. If missed fraud is considered one hundred times more costly than a false alert, i.e., , then
so the system would flag transactions already at a predicted fraud probability of about . These cases illustrate how stronger emphasis on avoiding false negatives leads to a substantially lower operating threshold, increasing recall at the expense of a higher false-positive burden.
From a licensing standpoint, the software stack used in our experiments is compatible with commercial use under permissive open-source terms, although a standard legal/compliance review is required in regulated environments. In terms of processing cost, tree-based ensembles are typically attractive for production due to fast CPU inference and straightforward scaling, whereas deep models may require additional optimization (batching/quantization) or hardware acceleration to meet strict throughput constraints. Finally, explainability and governance are central in contemporary banking: model-risk-management guidance emphasizes documentation, validation, and ongoing monitoring, which motivates pairing high-performing models with transparent reporting and audit trails. To support operational explainability (e.g., analyst triage and reason codes), post hoc explanation methods such as SHAP or LIME can be used to attribute each alert to the most influential features, enabling more interpretable decision support without changing the underlying predictive model.
In terms of future research, several directions appear promising. One pragmatic avenue is to enrich the available data and feature space, for example, by incorporating more detailed behavioral, temporal and network-based features; experience in machine learning suggests that, beyond a certain point, more informative data can lead to greater performance improvements than increasingly complex algorithms. Another direction is to explore fundamentally different modeling paradigms. In particular, we intend to calibrate a genetic algorithm-based model for fraud detection. The existing literature on genetic algorithms in this context is relatively scarce: ref. [89] outlines the basic principles of a genetic algorithm for detecting credit card fraud; in [90], a genetic algorithm is used to improve an existing fraud-detection solution by considering variable misclassification costs linked to the available credit limit; ref. [91] extends this work by combining genetic algorithms with a scatter search; and [92] employs a purely genetic approach to generate critical value sets for classification. Extending such ideas to modern datasets and integrating genetic algorithms with deep or ensemble learning—for instance, for feature selection, rule extraction or hyperparameter optimization—represents a natural next step.
More broadly, techniques such as hybrid CNN–LSTM models with attention [13], interpretable ensembles [28], and graph-based architectures [64] suggest that future fraud detection systems may combine transaction-level classifiers of the type studied here with relational, temporal and cost-sensitive components in an integrated framework. Coupled with institution-specific cost models and risk thresholds, such systems have the potential to provide flexible and effective tools for managing payment card fraud risk in increasingly complex financial ecosystems.
5. Conclusions
In the rapidly evolving landscape of digital payments, the battle against fraudulent activities remains a central challenge for financial institutions. The surge in payment card fraud, in particular, underscores the need for detection mechanisms that are not only accurate, but also scalable, robust and suitable for real-time deployment. In this study, we have developed and comparatively evaluated a set of advanced models—including a convolutional neural network and several widely used machine learning classifiers—for credit card fraud detection on a highly imbalanced transactional dataset.
The empirical results indicate that no single method emerges as an unequivocal overall winner. Rather, three models—the proposed CNN, XGBoost, and Extra Trees classifier—consistently stand out as the strongest performers across the main evaluation metrics. All three achieve high fraud-detection capability, while differing only moderately in the balance between false negatives and false positives. In particular, the tree-based ensemble methods tend to provide slightly stronger aggregate performance in terms of precision, F1-score, and MCC, whereas the CNN remains fully competitive and attains comparable sensitivity to fraudulent transactions. From a risk-management perspective, this is important, since missed fraudulent operations may lead to direct financial losses and reputational damage, while excessive false alarms increase analyst workload and operational cost. Therefore, the results confirm that model selection should be guided not by a single metric, but by the institution’s specific priorities, including tolerance for missed fraud, acceptable alert volume, and available investigation capacity. In practical deployment, this also suggests that a portfolio or ensemble of the best-performing models may be preferable to reliance on a single classifier.
A key element of our approach is the explicit treatment of severe class imbalance and careful model calibration. By applying random undersampling and tuning the hyperparameters of all classifiers via cross-validated grid search, we ensure that the models are not unduly biased toward the majority class. For the CNN architecture, the use of regularization, batch normalization and an appropriate feature-vectorization layer contributes to stable training and mitigates overfitting. The resulting models provide competitive or superior performance compared with several reported benchmarks on the same dataset, placing our approach among the top tier of current results for transaction-level credit card fraud detection.
Nevertheless, the study has limitations that point to directions for future work. The experiments rely on a single benchmark dataset and a static setting, without explicitly modeling concept drift or changes in fraud patterns over time. More sophisticated imbalance-handling strategies, cost-sensitive learning and models that exploit temporal and relational structure (for example, graph-based and sequence-based architectures) could further enhance robustness and applicability. In addition, the calibration of institution-specific cost functions—relating false positives and false negatives to monetary losses and operational constraints—would enable a more direct integration of such models into quantitative risk management frameworks.
Future research will therefore focus on two complementary directions. On the one hand, we plan to investigate genetic algorithm-based approaches, both as standalone classifiers and as meta-heuristics for feature selection, rule extraction and hyperparameter optimization, building on the relatively scarce but promising literature on evolutionary methods for fraud detection. On the other hand, we envisage extending the present framework to richer data sources and more complex model classes, including hybrid deep architectures and interpretable ensembles, in order to better capture the multifaceted nature of fraudulent behavior.
In conclusion, this work demonstrates that carefully designed and calibrated deep and machine learning models can substantially improve the detection of payment card fraud, especially when evaluated through metrics that reflect real-world risk management priorities. Continued collaboration between researchers, financial institutions and technology providers will be essential to translating such methodological advances into operational systems that enhance the security, resilience and trustworthiness of modern financial ecosystems.
Author Contributions
Conceptualization, S.G., M.M. and V.M.; methodology, S.G. and M.M.; software, S.G. and M.M.; validation, S.G. and M.M.; formal analysis, S.G. and M.M.; investigation, S.G., M.M. and V.M.; resources, M.M.; data curation, M.M.; writing—original draft, S.G. and M.M.; writing—review and editing, S.G., M.M., V.M. and V.T.; visualization, S.G. and M.M.; supervision, S.G. and V.M.; project administration, S.G. and V.T.; funding acquisition, S.G. and V.T. All authors have read and agreed to the published version of the manuscript.
Funding
This study was supported by the European Union–NextGenerationEU, through the National Recovery and Resilience Plan of the Republic of Bulgaria, project No. BG-RRP-2.013-0001. Venelin Todorov was partially supported by the Centre of Excellence in Informatics and ICT under the Grant No. BG16RFPR002-1.014-0018, financed by the Research, Innovation and Digitalization for Smart Transformation Programme 2021–2027 and co-financed by the European Union, and by BNSF under Project KP-06-N82/4 “Artificial intelligence for investigation and modeling of real processes”.
Data Availability Statement
The original contributions presented in this study are included in the article. Further inquiries can be directed to the corresponding author.
Acknowledgments
The authors are grateful to the anonymous referees for the useful suggestions and comments, which have significantly contributed to the improvement of the quality of the paper.
Conflicts of Interest
The authors declare no conflicts of interest. The funders had no role in the design of the study; in the collection, analyses, or interpretation of data; in the writing of the manuscript; or in the decision to publish the results.
Abbreviations
The following abbreviations are used in this manuscript:
| Adam | Adaptive moment estimation |
| ANN | Artificial neural network |
| CM | Confusion matrix |
| CNN | Convolutional neural network |
| DT | Decision tree |
| ET | Extra trees (extremely randomized trees) |
| FN | False negatives |
| FL | Federated learning |
| FP | False positives |
| GNN | Graph neural network |
| GRU | Gated recurrent units |
| kNN | k-Nearest neighbors |
| LSTM | Long short-term memory |
| LR | Logistic regression |
| MCC | Matthews correlation coefficient |
| MLP | Multilayer perceptron |
| NB | Naïve Bayes |
| NN | Neural network |
| PR | Precision–recall |
| RF | Random forest |
| ROC | Receiver operating characteristic |
| SVM | Support vector machines |
| TN | True negatives |
| TP | True positives |
| XGBoost | eXtreme gradient boosting |
Appendix A. Undersampling Splitting Ratios
The purpose of this appendix is to illustrate the sensitivity of the proposed workflow to the choice of the undersampling ratio applied to the majority class during model fitting. As expected, overly aggressive undersampling may simplify the classification task on the resampled training subset, but at the cost of discarding a substantial amount of potentially informative legitimate transactions. Conversely, very mild undersampling preserves more majority-class structure, yet may not sufficiently alleviate the extreme class imbalance. The results in Figure A1 indicate that the selected 1:20 ratio provides a reasonable compromise between predictive performance and computational efficiency, preserving strong fraud-detection capability while keeping the training set size manageable. For this reason, this ratio was adopted in the main experiments.
Figure A1.
Confusion matrices of CNN with undersampling splitting ratio: 1:5 (top left); 1:10 (top right); 1:20 (bottom left); 1:50 (bottom right).
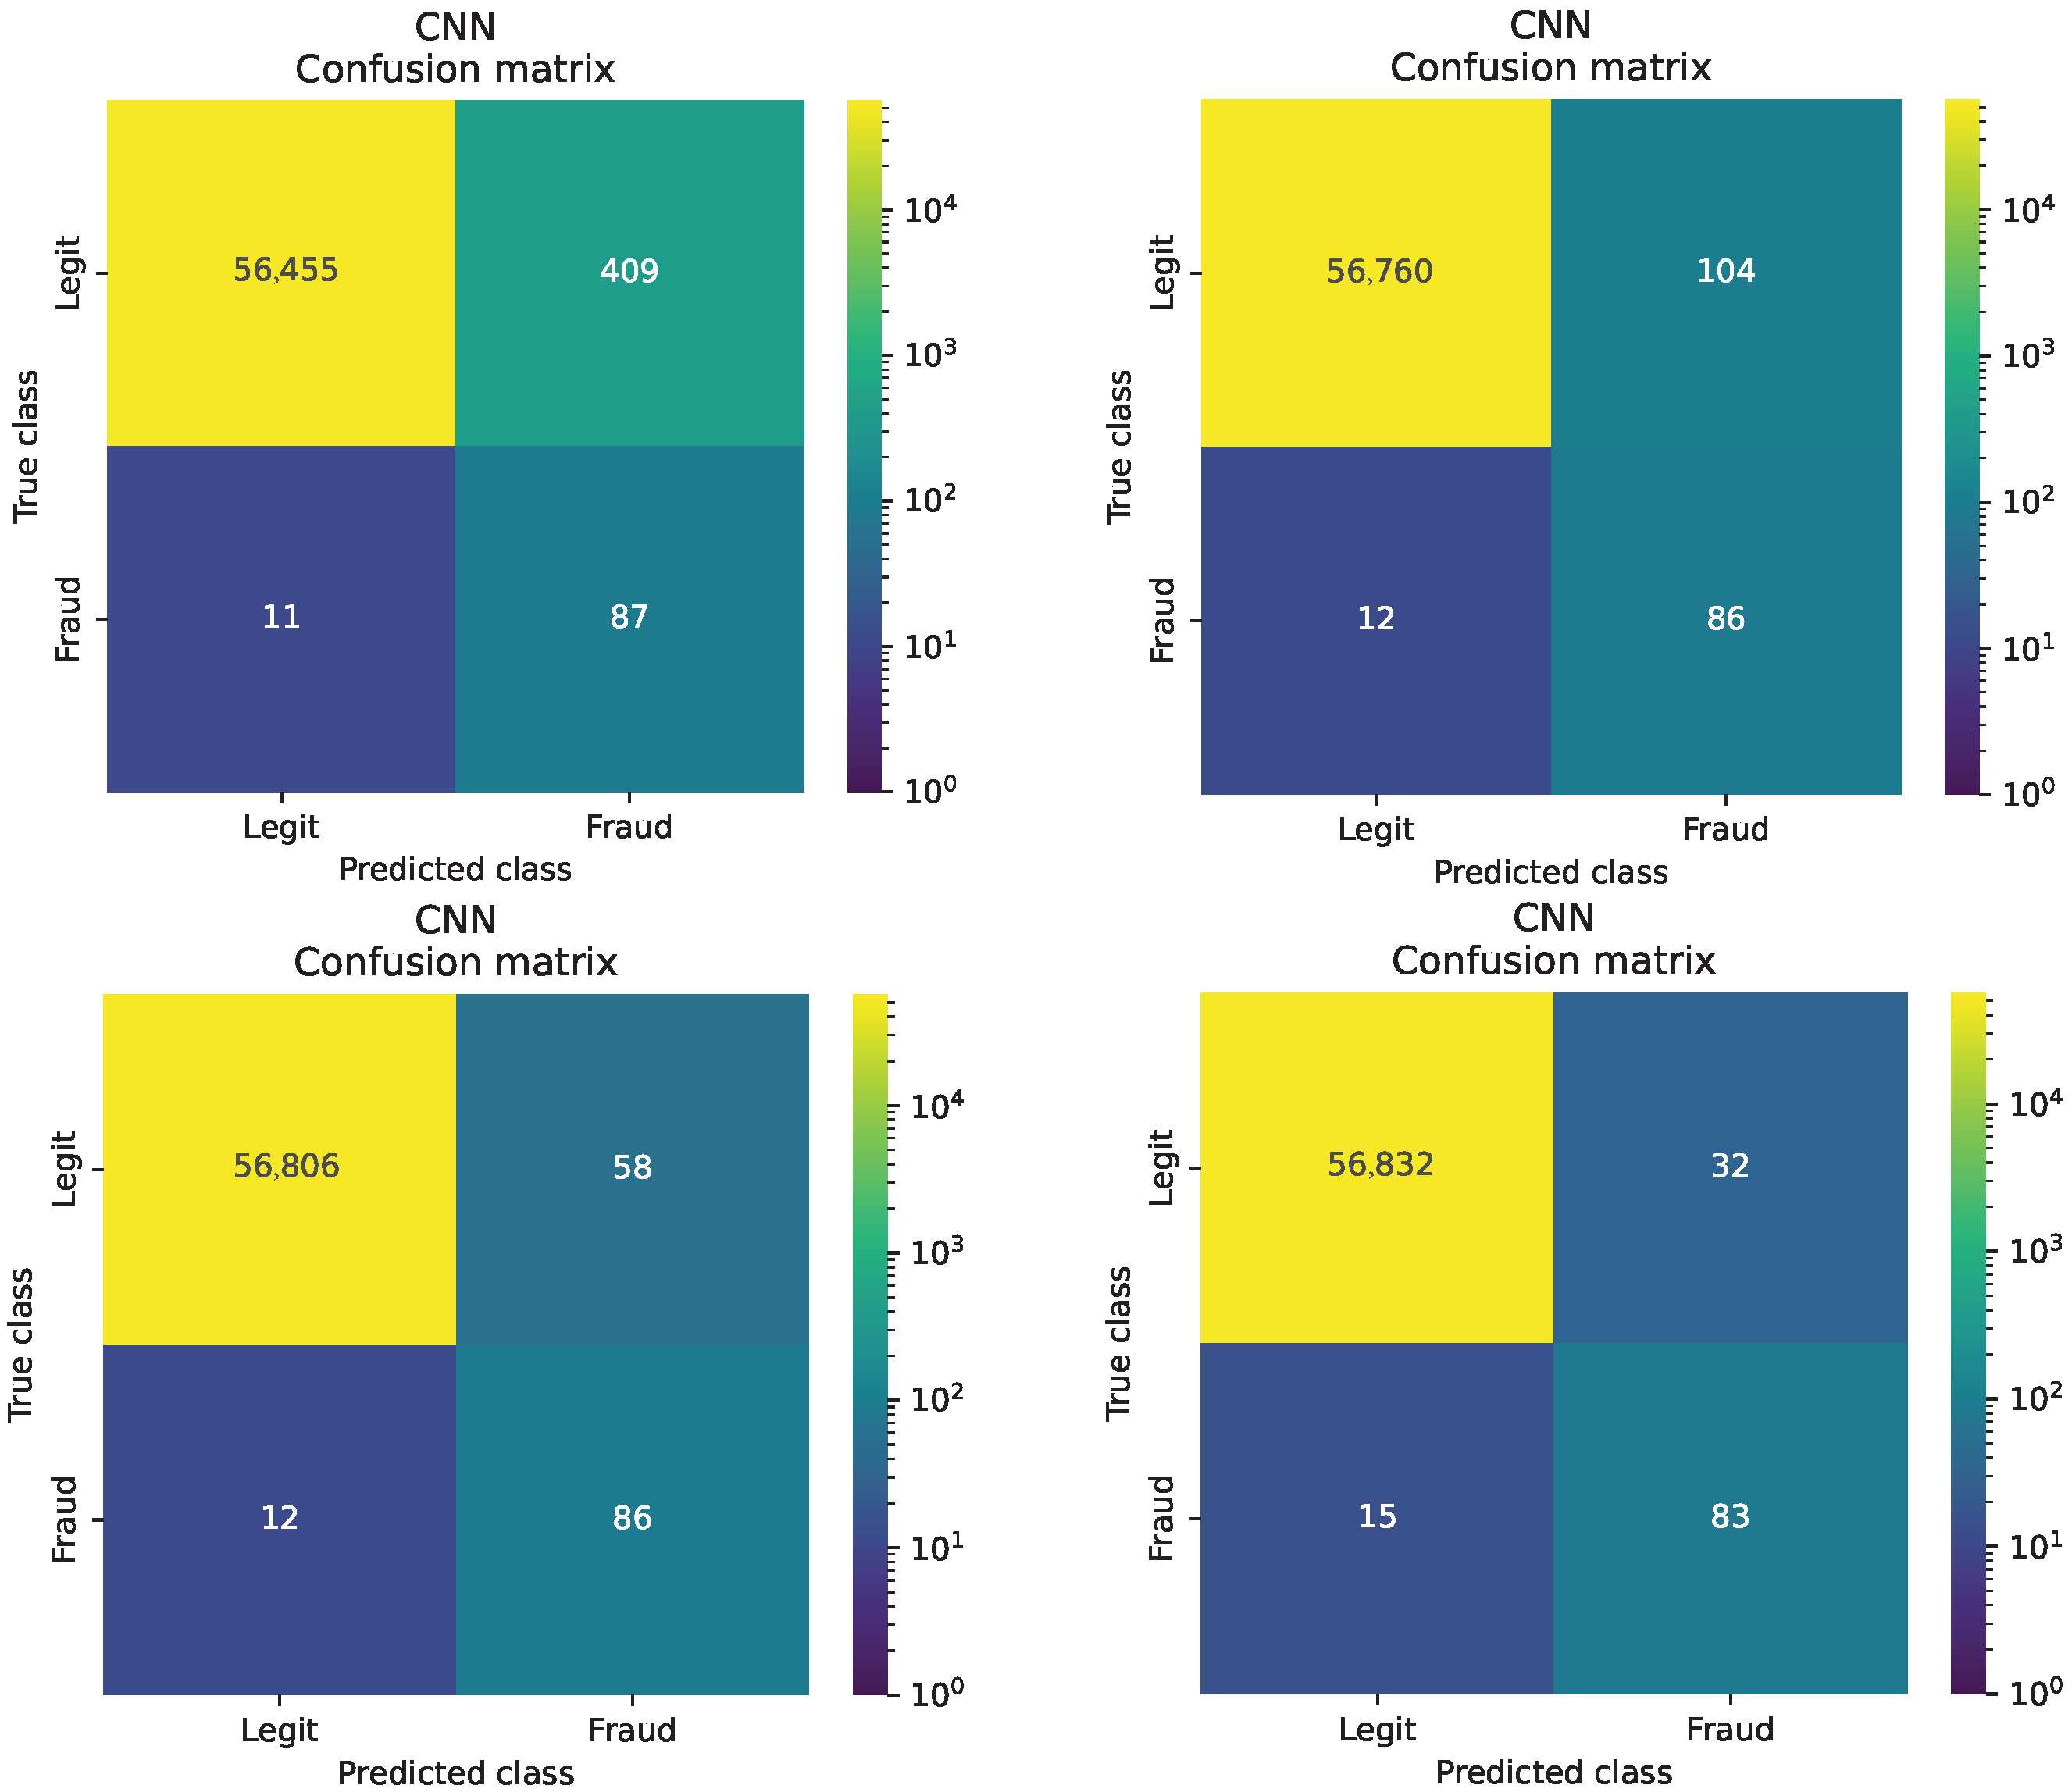
Table A1.
Postresampling train test size and class distributions for different undersampling split rates.
Appendix B. Undersampling Refinement Strategies
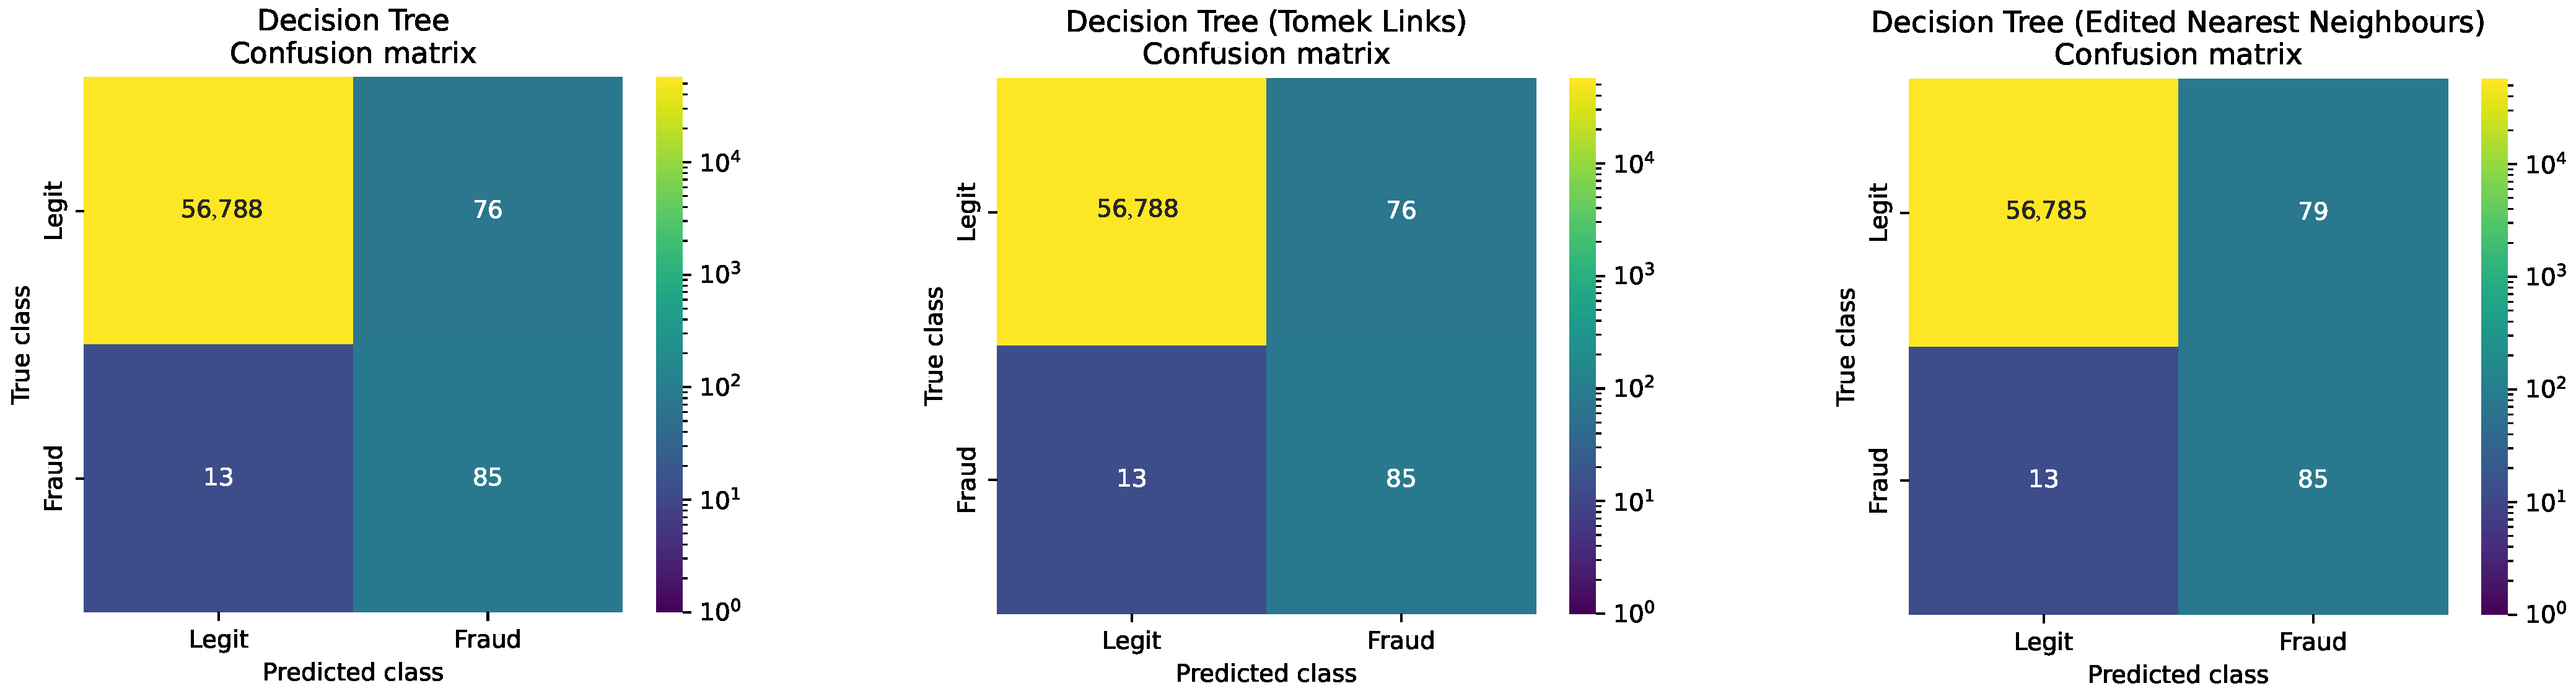
In addition to plain random undersampling, we also examined whether refinement strategies designed to remove borderline or noisy majority-class observations could further improve performance. In principle, such methods may enhance class separability by eliminating ambiguous legitimate samples located near the decision boundary. However, the results in Figure A2 show that, for the present dataset and evaluation protocol, these refinements do not yield a meaningful advantage over simple random undersampling. This suggests that the dominant issue is the global class imbalance itself rather than the precise local structure of majority-class overlap. Therefore, we retained the simpler random undersampling strategy in the final workflow, since it is easier to reproduce and does not sacrifice empirical performance.
Figure A2.
Decision Tree CM: no refinement (left); Tomek Links (center); Edited Nearest Neighbors (right).
Appendix C. Multilayer Perceptron Benchmarking
As a deep tabular benchmark, we additionally implemented a multilayer perceptron (MLP) trained under the same protocol as the CNN, using identical train/validation/test splits, scaling, resampling strategy, optimizer, early stopping criterion, batch size, and maximum number of epochs; only the network architecture was changed from convolutional to fully connected layers.
Table A2.
Performance metrics of the MLP model on the imbalanced hold-out test set (95% bootstrap CI, 2000 resamples).
Figure A3.
Confusion matrix of MLP.
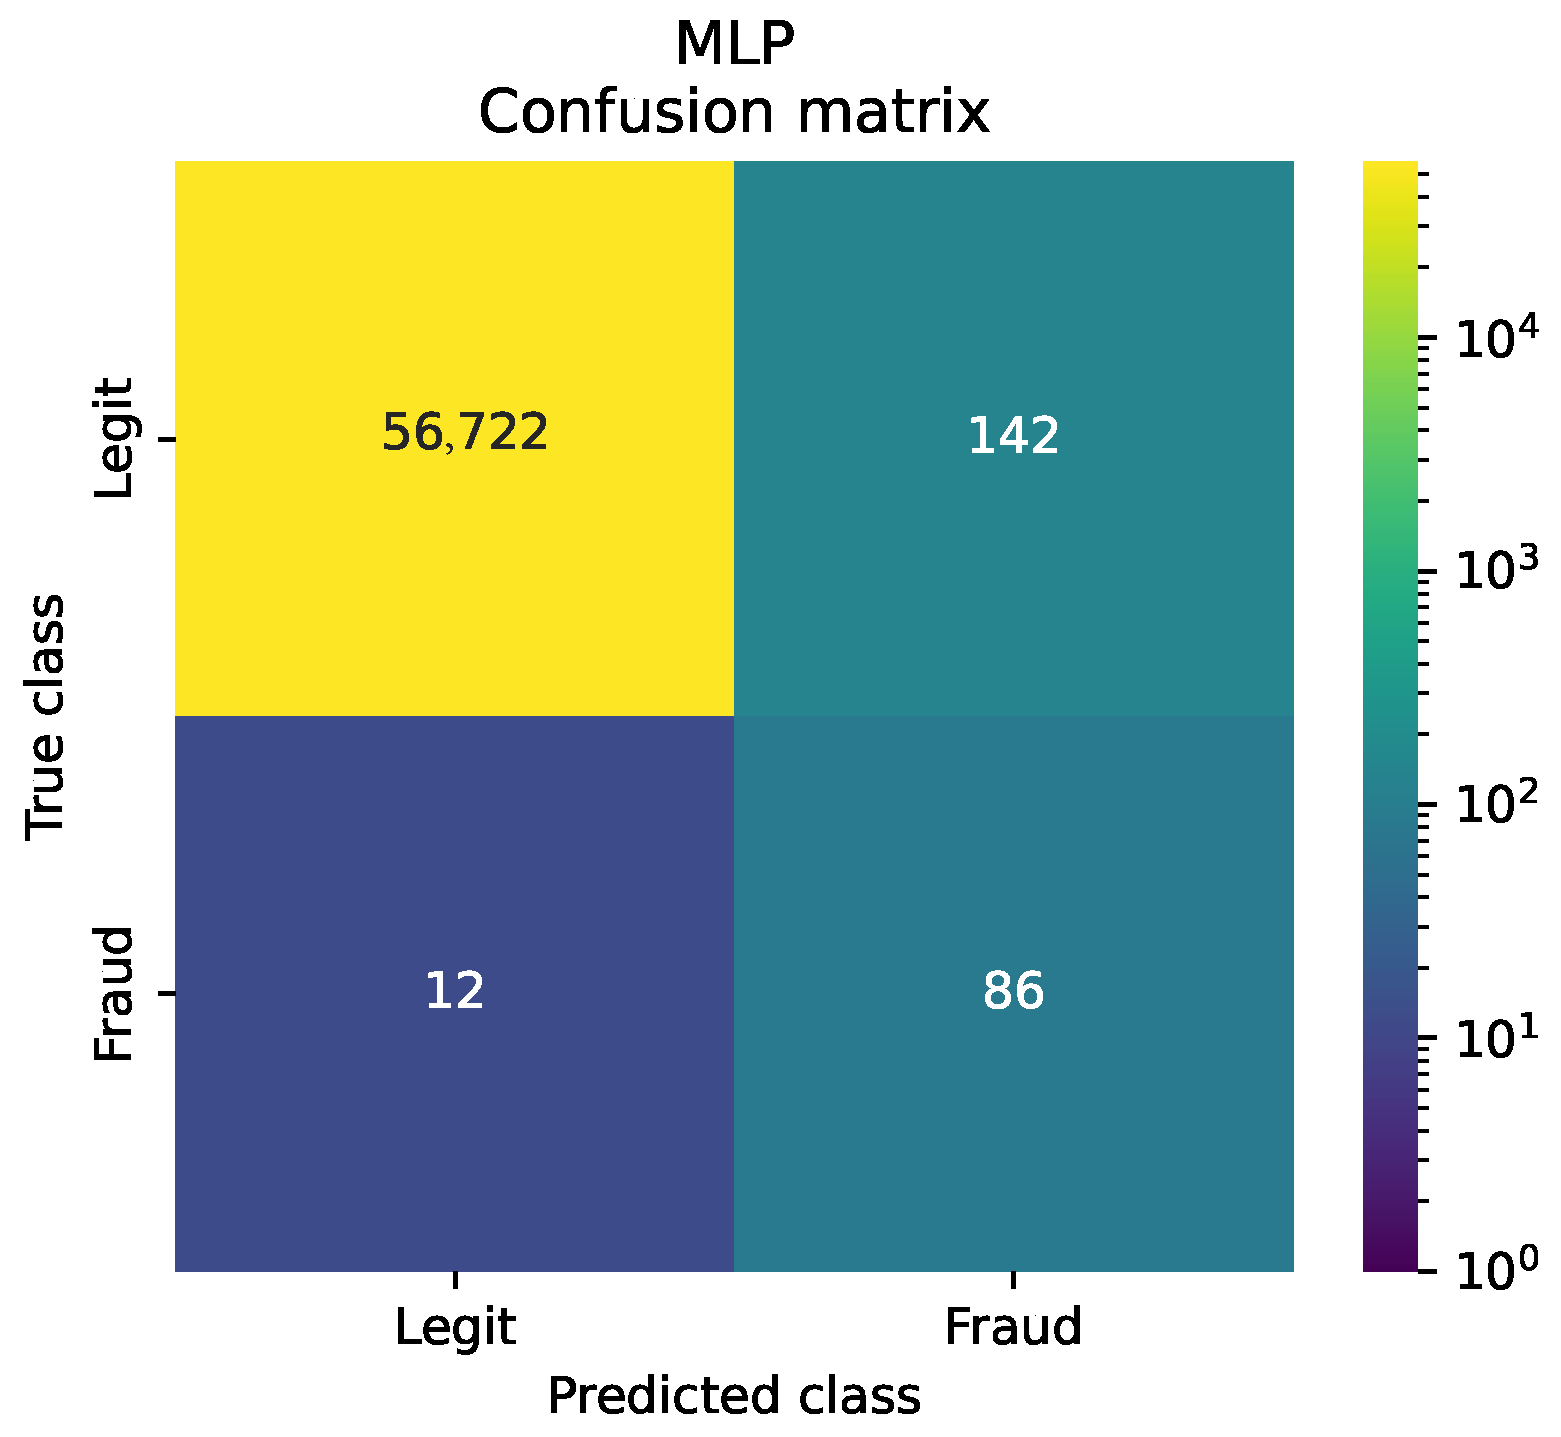
The CNN substantially outperforms the MLP while preserving the same fraud-class recall (). Hence, the advantage of the CNN does not stem from detecting more fraudulent transactions, but from producing considerably fewer false alarms, as reflected in its much higher precision ( vs. ). This improvement propagates to the composite measures, yielding clearly stronger F1-score ( vs. ) and MCC ( vs. ), together with slightly higher overall accuracy. Therefore, the CNN is preferable to the MLP because it achieves the same fraud-capture capability with a substantially better balance between false positives and false negatives, making it more attractive for practical deployment where analyst workload and alert quality are important.
The reason for that might stem from the fact that CNN could learn local interaction patterns among neighboring transformed features, whereas the MLP treats the input more uniformly through dense connections. Even on tabular data, this inductive bias may help the CNN extract more discriminative structures and thus improve class separation.
Appendix D. Chronological Splitting
To assess temporal generalization, we additionally adopted a chronological holdout protocol in which transactions were first ordered by the Time attribute, the earliest 80% were used for model development, and the most recent 20% were reserved for testing. The development block was then split chronologically into training and validation subsets, while scaling and resampling were applied exclusively to the training portion to avoid temporal leakage.
Figure A4.
Confusion matrix of CNN (Temporal Spliting).
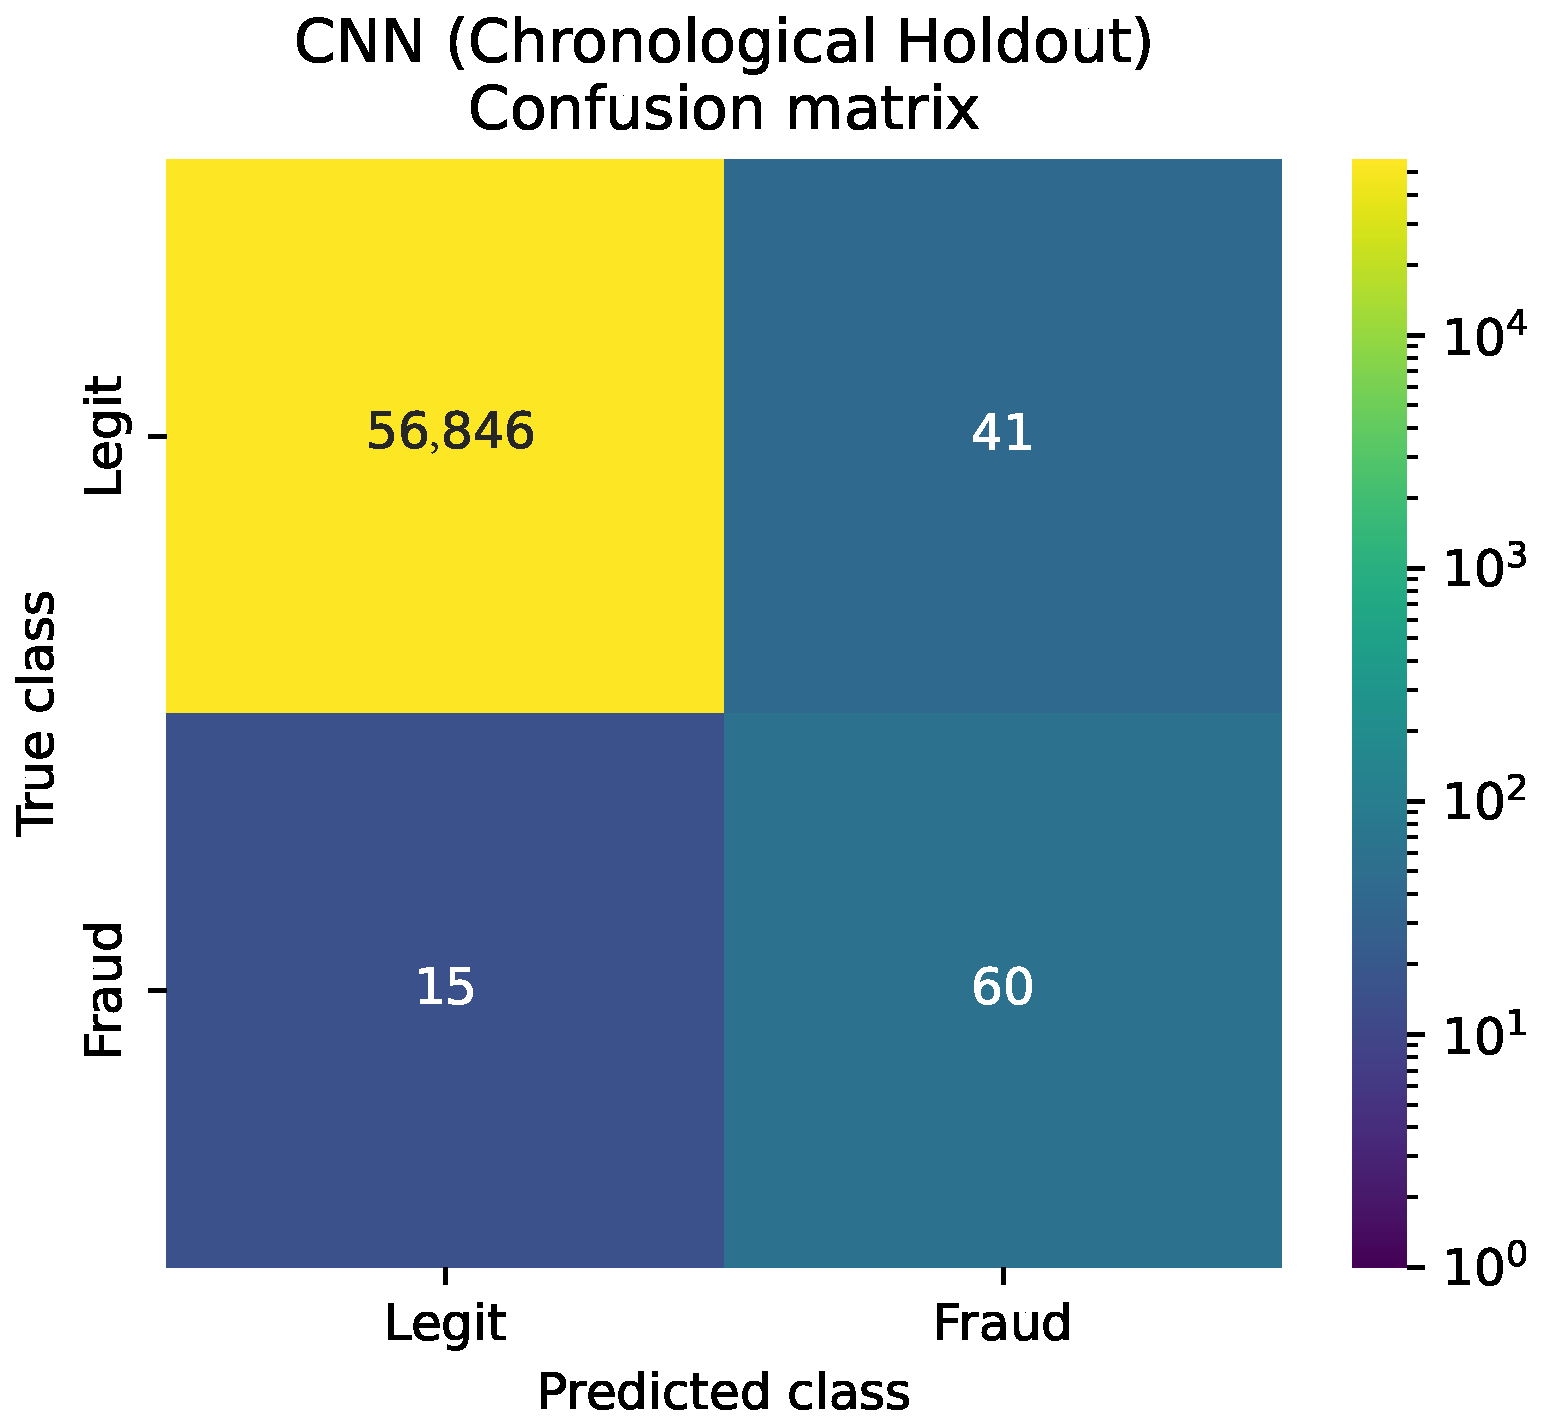
Table A3.
Performance metrics of the CNN model with temporal splitting on the imbalanced hold-out test set (95% bootstrap CI, 2000 resamples).
Compared with the random split, the chronological holdout yields a slightly different performance profile for the CNN. Accuracy remains essentially unchanged and even increases marginally from to , while precision is almost identical ( vs. ). The main difference appears in recall, which decreases from under the random split to under the chronological protocol. As a consequence, the F1-score also declines from to , and MCC decreases from to . This suggests that the chronological evaluation is more demanding, likely because it better reflects temporal variation and distribution shift between earlier and later transactions. In other words, the random split may provide a slightly more optimistic estimate of fraud-detection performance, whereas the chronological holdout offers a more deployment-oriented assessment of temporal generalization. Nevertheless, the CNN remains competitive under both protocols, with particularly stable precision, indicating that the main degradation under the time-aware setting is due to an increase in missed fraud cases rather than a deterioration in false-alarm control.
Both evaluation protocols provide useful and complementary perspectives on model performance. The random stratified split offers a controlled and statistically stable benchmark for comparing classifiers under preserved class proportions, whereas the chronological holdout provides a more deployment-oriented view of temporal generalization and potential distribution shift. In our experiments, the chronological split leaves precision nearly unchanged but leads to a moderate decrease in recall, F1-score, and MCC, suggesting that temporal evaluation is somewhat more demanding. At the same time, the overall ranking remains broadly consistent, and the CNN stays competitive under both protocols. For the remainder of the study, we retain the random stratified sampling as the main experimental protocol, since it ensures a uniform and reproducible basis for comparative analysis across all methods, while the chronological split is best interpreted as a complementary robustness check.
Appendix E. Parameter Settings
This appendix reports the optimal hyperparameter settings selected for each classifier under the common tuning protocol. Several general patterns can be observed. First, the selected configurations tend to favor moderate model complexity rather than extreme flexibility, which is consistent with the need to control overfitting under severe class imbalance. Second, although the algorithms differ substantially in form, the tuning results show that competitive fraud detection can be achieved with relatively parsimonious parameter choices when the preprocessing, scaling, and resampling pipeline is fixed. Finally, reporting these settings explicitly is important for reproducibility, since even small changes in hyperparameters may alter the balance between false positives and false negatives in highly imbalanced problems.
Table A4.
Parameter settings of DT model (Figure A6).
Table A5.
Parameter settings of NB model.
Table A6.
Parameter settings of LR model.
Table A7.
Parameter settings of kNN model.
Table A8.
Parameter settings of SVM model.
Table A9.
Parameter settings of RF model.
Appendix F. Confusion Matrices
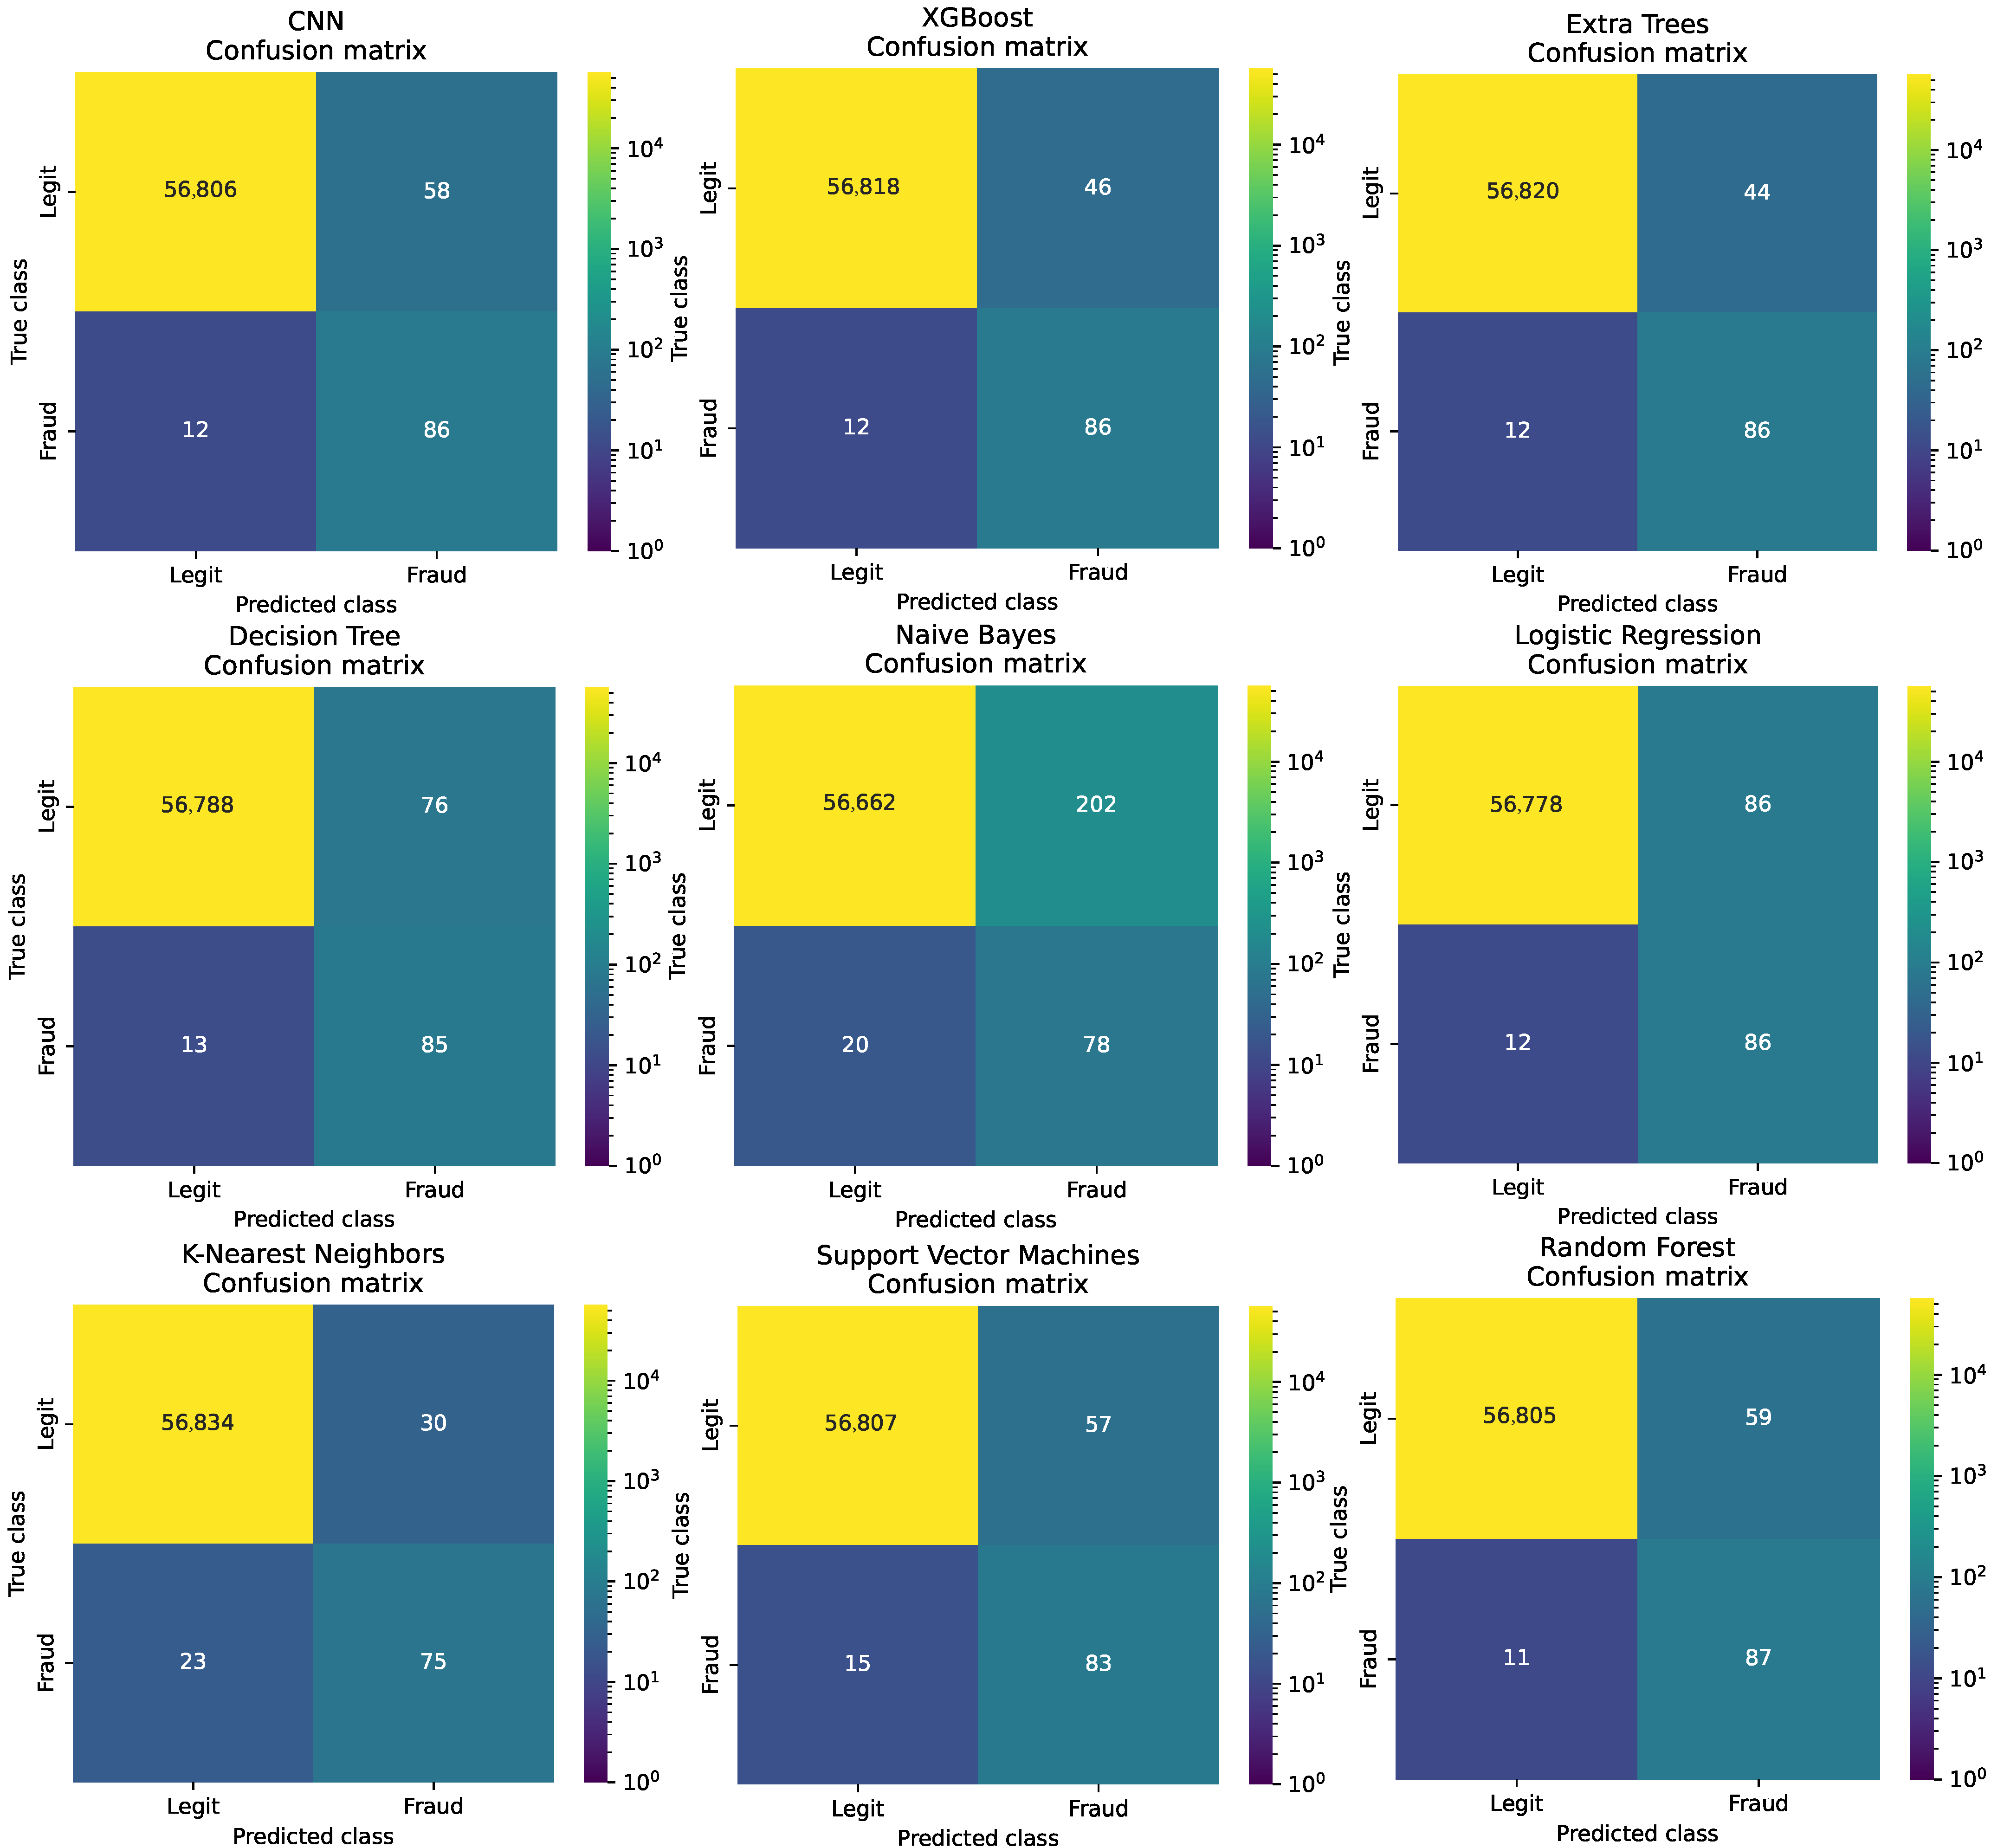
The confusion matrices provide a more operational view of model behavior than aggregate metrics alone. Because the test set is highly imbalanced, all methods correctly classify the vast majority of legitimate transactions, and the main differences arise in the number of false positives and false negatives. In this sense, the matrices clarify the practical trade-off between fraud capture and alert burden: models with stronger recall miss fewer fraud cases, whereas models with stronger precision produce fewer unnecessary alerts. The matrices also confirm that the best-performing methods are those that maintain a favorable balance between these two error types, rather than merely maximizing overall accuracy, which is less informative in the present setting.
Figure A5.
Confusion Matrices.
Appendix G. Decision Tree
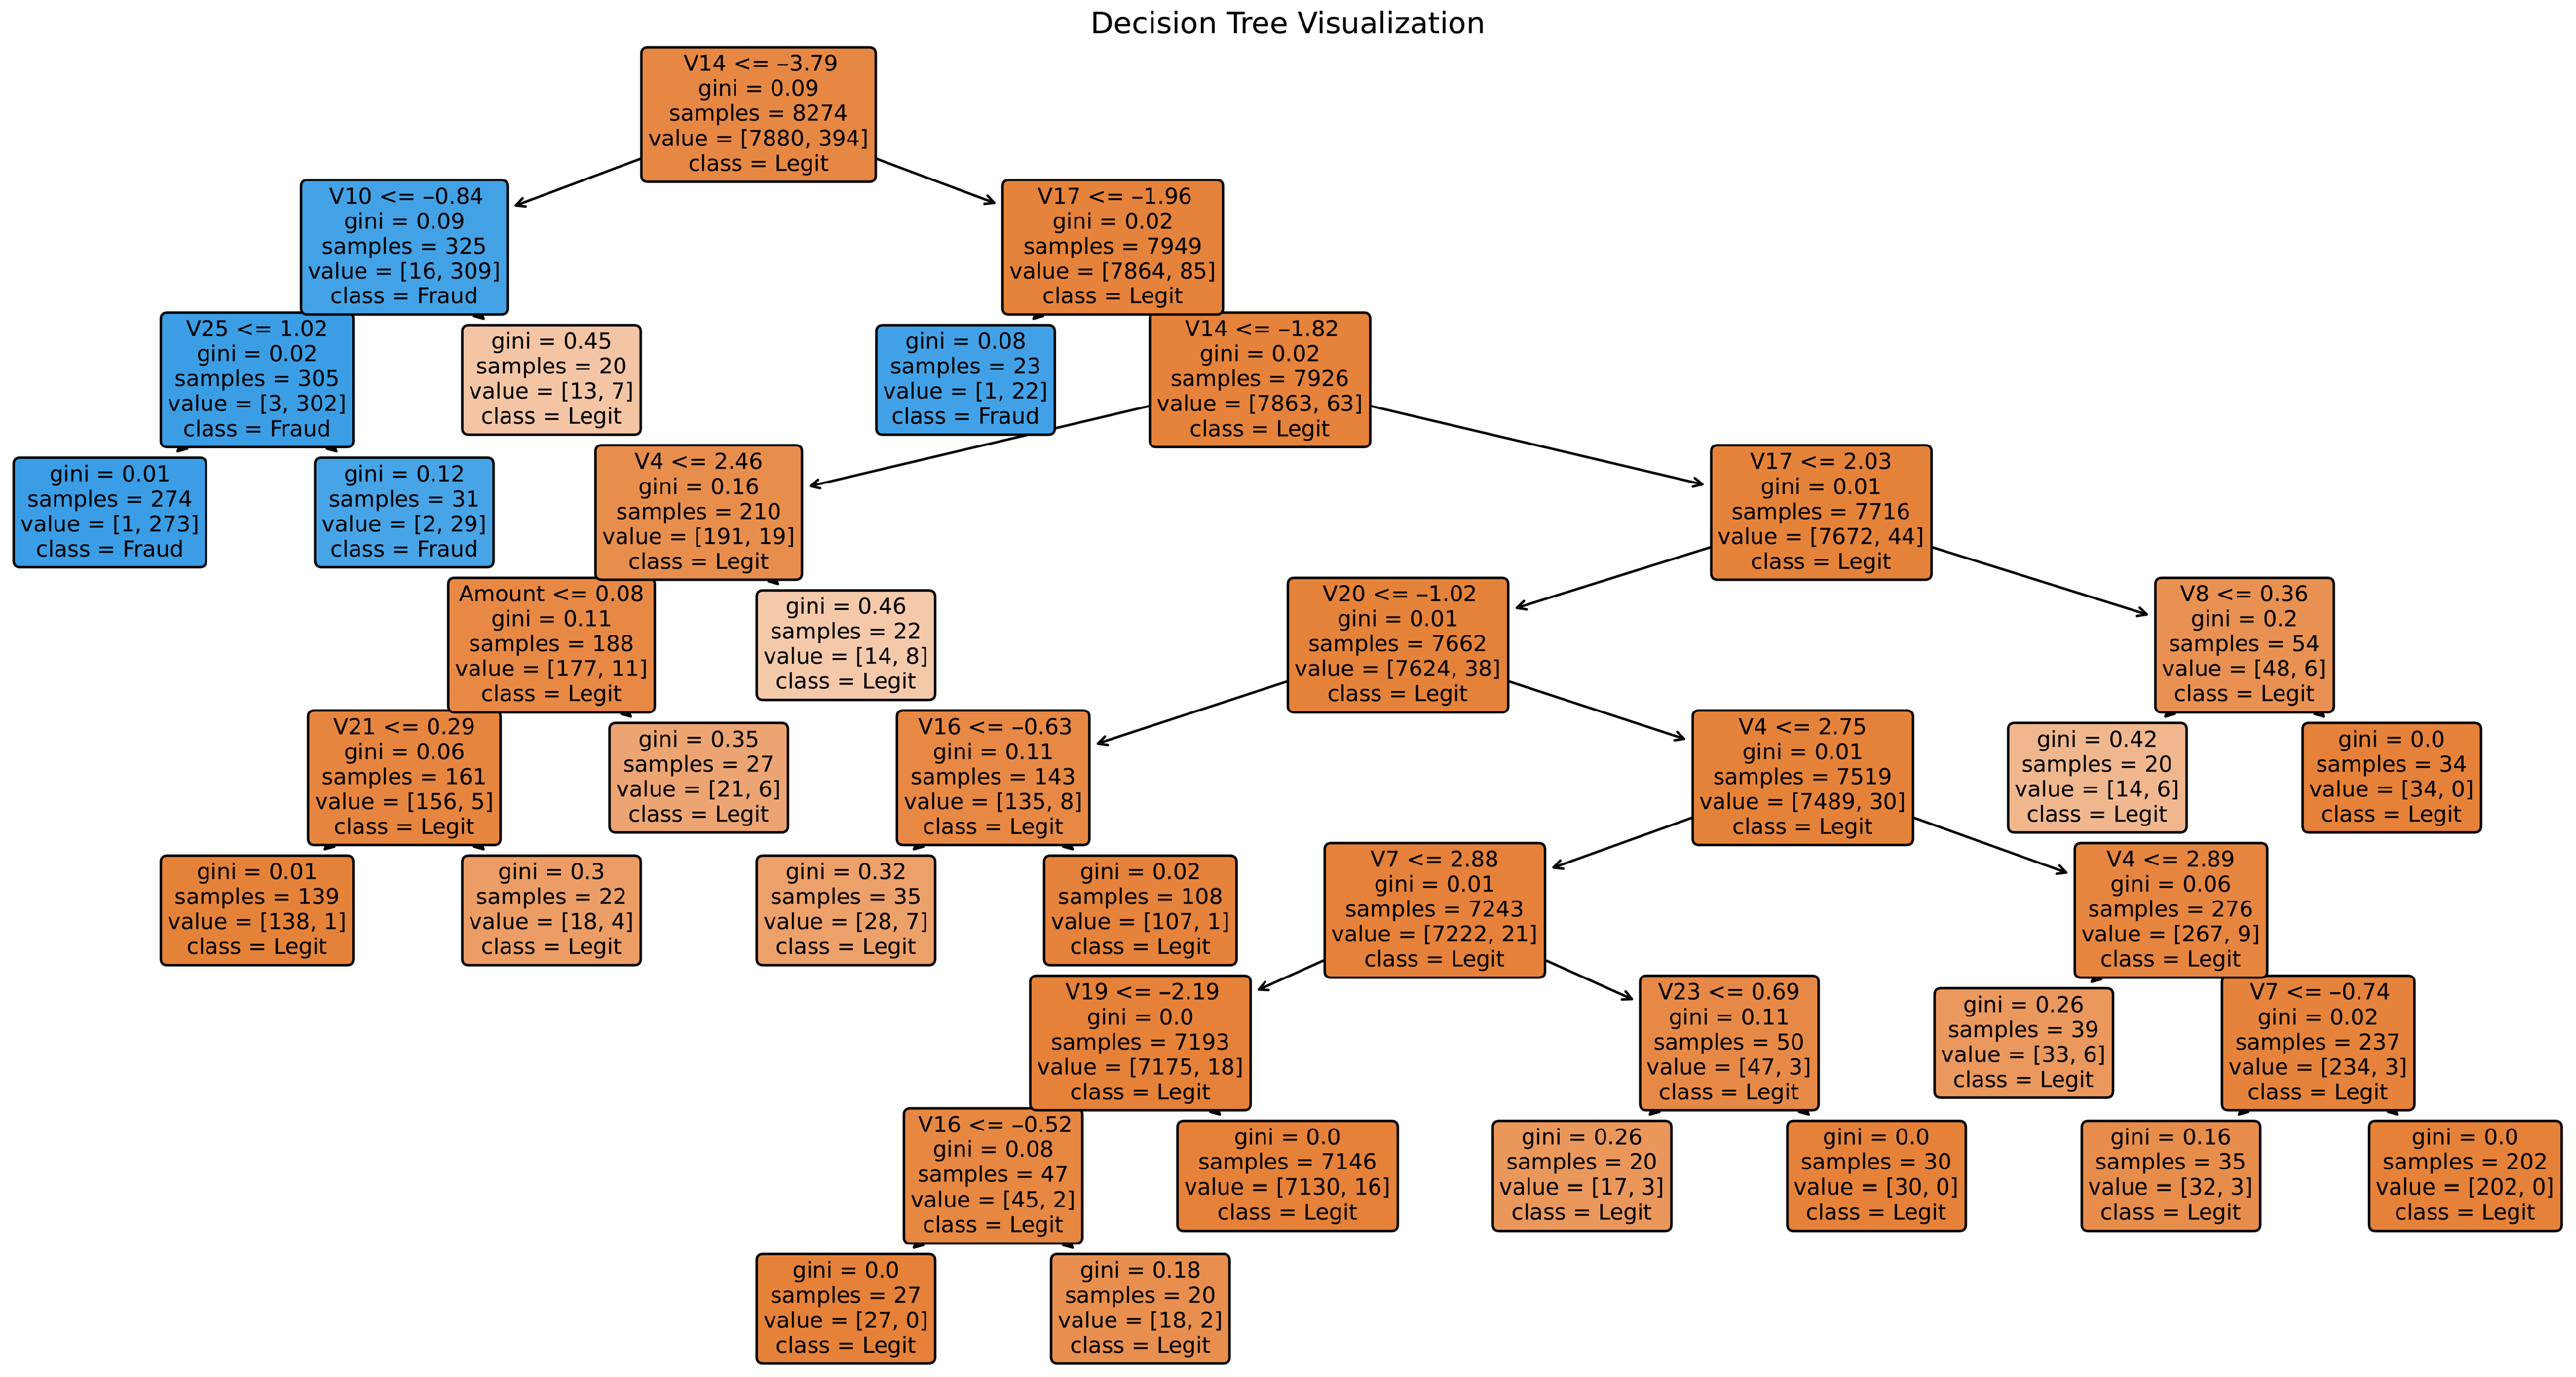
The decision-tree visualization (Figure A6) offers an interpretable complement to the more complex ensemble and neural-network models. The displayed tree shows that the classifier relies on a relatively small number of sequential splitting rules involving several transformed variables and, in some branches, the transaction amount. This transparency is a practical advantage of decision trees, since it allows the reader to inspect directly which feature thresholds contribute to the final classification.
Figure A6.
Decision tree visualization.
References
- Carcillo, F.; Le Borgne, Y.-A.; Caelen, O.; Kessaci, Y.; Oblé, F.; Bontempi, G. Combining unsupervised and supervised learning in credit card fraud detection. Inf. Sci. 2021, 557, 317–331. [Google Scholar] [CrossRef] [Scilit]
- The Nilson Report. Payment Card Fraud Losses Reach $32.34 Billion. 2022. Available online: https://finance.yahoo.com/news/payment-card-fraud-losses-reach-190800163.html (accessed on 6 April 2026).
- Pozzolo, A.D.; Caelen, O.; Le Borgne, Y.-A.; Waterschoot, S.; Bontempi, G. Learned lessons in credit card fraud detection from a practitioner perspective. Expert Syst. Appl. 2014, 41, 4915–4928. [Google Scholar] [CrossRef] [Scilit]
- Bolton, R.J.; Hand, D.J. Unsupervised profiling methods for fraud detection. In Credit Scoring and Credit Control VII; Technical Report; Department of Mathematics, Imperial College London: London, UK, 2001; pp. 235–255. Available online: https://api.semanticscholar.org/CorpusID:14365948 (accessed on 21 April 2026).
- Brause, R.; Langsdorf, T.; Hepp, M. Neural data mining for credit card fraud detection. In Proceedings of the 1999 IEEE International Conference on Tools with Artificial Intelligence, Chicago, IL, USA, 9–11 November 1999; IEEE: New York, NY, USA, 1999; pp. 103–106. [Google Scholar]
- Chan, P.; Fan, W.; Prodromidis, A.; Stolfo, S. Distributed data mining in credit card fraud detection. IEEE Intell. Syst. Appl. 1999, 14, 67–74. [Google Scholar] [CrossRef] [Scilit]
- Whitrow, C.; Hand, D.J.; Juszczak, P.; Weston, D.; Adams, N.M. Transaction aggregation as a strategy for credit card fraud detection. Data Min. Knowl. Discov. 2009, 18, 30–55. [Google Scholar] [CrossRef] [Scilit]
- Kaggle. Credit Card Fraud Detection. Anonymized Credit Card Transactions Labeled as Fraudulent or Genuine. Available online: https://www.kaggle.com/mlg-ulb/creditcardfraud/home (accessed on 8 December 2025).
- Cherif, A.; Badhib, A.; Ammar, H.; Alshehri, S.; Kalkatawi, M.; Imine, A. Credit card fraud detection in the era of disruptive technologies: A systematic review. J. King Saud Univ. Comput. Inf. Sci. 2023, 35, 145–174. [Google Scholar] [CrossRef] [Scilit]
- Dastidar, K.G.; Caelen, O.; Granitzer, M. Machine learning methods for credit card fraud detection: A survey. IEEE Access 2024, 12, 158939–158965. [Google Scholar] [CrossRef] [Scilit]
- Chicco, D.; Jurman, G. The advantages of the Matthews correlation coefficient (MCC) over F1 score and accuracy in binary classification evaluation. BMC Genom. 2020, 21, 6. [Google Scholar] [CrossRef] [Scilit] [PubMed]
- Le Borgne, Y.-A.; Siblini, W.; Lebichot, B.; Bontempi, G. Reproducible Machine Learning for Credit Card Fraud Detection–Practical Handbook; Université Libre de Bruxelles: Brussels, Belgium, 2022; Available online: https://fraud-detection-handbook.github.io/fraud-detection-handbook/ (accessed on 18 February 2026).
- Akour, I.; Mohamed, N.; Salloum, S. Hybrid CNN–LSTM with Attention Mechanism for Robust Credit Card Fraud Detection. IEEE Access 2025, 13, 114056–114068. [Google Scholar] [CrossRef] [Scilit]
- Wu, Y.; Wang, L.; Li, H.; Liu, J. A deep learning method of credit card fraud detection based on continuous-coupled neural networks. Mathematics 2025, 13, 819. [Google Scholar] [CrossRef] [Scilit]
- Yousefimehr, B.; Ghatee, M. A distribution-preserving method for resampling combined with LightGBM–LSTM for sequence-wise fraud detection in credit card transactions. Expert Syst. Appl. 2025, 262, 125661. [Google Scholar] [CrossRef] [Scilit]
- Zhao, X.; Liu, Y.; Zhao, Q. Improved LightGBM for extremely imbalanced data and application to credit card fraud detection. IEEE Access 2024, 12, 159316–159335. [Google Scholar] [CrossRef] [Scilit]
- Chawla, N.V. Data mining for imbalanced datasets: An overview. In Data Mining and Knowledge Discovery Handbook; Maimon, O., Rokach, L., Eds.; Springer: Boston, MA, USA, 2010; pp. 875–886. [Google Scholar]
- Chawla, N.V.; Japkowicz, N.; Kotcz, A. Special issue on learning from imbalanced data sets. ACM SIGKDD Explor. Newsl. 2004, 6, 1–6. [Google Scholar] [CrossRef] [Scilit]
- Fernández, A.; García, S.; Galar, M.; Prati, R.C.; Krawczyk, B.; Herrera, F. Learning from Imbalanced Data Sets; Springer: Cham, Switzerland, 2018. [Google Scholar]
- Hordi, N.F.; Yuhaniz, S.S.; Azmi, N.F.M.; Shamsuddin, S.M. Handling class imbalance in credit card fraud using resampling methods. Int. J. Adv. Comput. Sci. Appl. 2018, 9, 390–396. [Google Scholar] [CrossRef] [Scilit]
- Mrozek, P.; Panneerselvam, J.; Bagdasar, O. Efficient resampling for fraud detection during anonymised credit card transactions with unbalanced datasets. In Proceedings of the UCC 2020; IEEE: New York, NY, USA, 2022; pp. 426–433. [Google Scholar]
- Alamri, M.; Ykhlef, M. Survey of credit card anomaly and fraud detection using sampling techniques. Electronics 2022, 11, 4003. [Google Scholar] [CrossRef] [Scilit]
- Pozzolo, A.D. Adaptive Machine Learning for Credit Card Fraud Detection. Ph.D. Thesis, Université libre de Bruxelles, Brussels, Belgium, 2015. [Google Scholar]
- Khan, M.J.; Ullah, S.I. Addressing class imbalance in credit card fraud detection: A hybrid deep learning approach. Int. J. Innov. Sci. Technol. 2025, 7, 603–622. [Google Scholar] [CrossRef] [Scilit]
- Pozzolo, A.D.; Caelen, O.; Bontempi, G. When is undersampling effective in unbalanced classification tasks? In Machine Learning and Knowledge Discovery in Databases. ECML PKDD 2015; Appice, A., Rodrigues, P., Santos Costa, V., Soares, C., Gama, J., Jorge, A., Eds.; Lecture Notes in Computer Science; Springer: Cham, Switzerland, 2015; Volume 9284, pp. 200–215. [Google Scholar]
- Tomek, I. Two modifications of CNN. IEEE Trans. Syst. Man Cybern. 1976, SMC-6, 769–772. [Google Scholar]
- Wilson, D.L. Asymptotic properties of nearest neighbor rules using edited data. IEEE Trans. Syst. Man Cybern. 1972, SMC-2, 408–421. [Google Scholar] [CrossRef] [Scilit]
- Baisholan, N.; Dietz, J.E.; Gnatyuk, S.; Turdalyuly, M.; Matson, E.T.; Baisholanova, K. FraudX AI: An interpretable machine learning framework for credit card fraud detection on imbalanced datasets. Computers 2025, 14, 120. [Google Scholar] [CrossRef] [Scilit]
- Pedregosa, F.; Varoquaux, G.; Gramfort, A.; Michel, V.; Thirion, B.; Grisel, O.; Blondel, M.; Prettenhofer, P.; Weiss, R.; Dubourg, V.; et al. Scikit-Learn: Machine Learning in Python. J. Mach. Learn. Res. 2011, 12, 2825–2830. [Google Scholar]
- Sujon, K.M.; Hassan, R.; Choi, K.; Samad, M.A. Accuracy, precision, recall, f1-score, or MCC? Empirical evidence from advanced statistics, ML, and XAI for evaluating business predictive models. J. Big Data 2025, 12, 268. [Google Scholar] [CrossRef] [Scilit]
- Brownlee, J. Tune Hyperparameters for Classification Machine Learning Algorithms. Available online: https://machinelearningmastery.com/hyperparameters-for-classification-machine-learning-algorithms/ (accessed on 8 December 2025).
- Asha, R.B.; Suresh Kumar, K.R. Credit card fraud detection using artificial neural network. Glob. Transit. Proc. 2021, 2, 35–41. [Google Scholar]
- Van Belle, R.; Baesens, B.; De Weerdt, J. CATCHM: A novel network-based credit card fraud detection method using node representation learning. Decis. Support Syst. 2023, 164, 113866. [Google Scholar] [CrossRef] [Scilit]
- Markova, M. A comparison of deep neural network and convolutional neural network for credit card fraud detection. In New Trends in the Applications of Differential Equations in Sciences; Slavova, A., Ed.; Springer Proceedings in Mathematics & Statistics; Springer: Cham, Switzerland, 2025; Volume 488, pp. 405–418. [Google Scholar]
- Vasilev, I.; Slater, D.; Spacagna, G.; Roelants, P.; Zocca, V. Python Deep Learning; Packt Publishing: Birmingham, UK, 2019. [Google Scholar]
- Kingma, D.P.; Ba, J. Adam: A method for stochastic optimization. arXiv 2017, arXiv:1412.6980. [Google Scholar] [CrossRef] [Scilit]
- Nayak, S.; Kumar, N.; Choudhury, B.B. Scaled conjugate gradient backpropagation algorithm for selection of industrial robots. Int. J. Comput. Appl. 2017, 7, 92–101. [Google Scholar] [CrossRef] [Scilit]
- Hastie, T.; Tibshirani, R.; Friedman, J. The Elements of Statistical Learning: Data Mining, Inference, and Prediction, 2nd ed.; Springer: New York, NY, USA, 2009. [Google Scholar]
- James, G.; Witten, D.; Hastie, T.; Tibshirani, R. An Introduction to Statistical Learning: With Applications in R, 2nd ed.; Springer: New York, NY, USA, 2021. [Google Scholar]
- Georgieva, S.; Markova, M.; Pavlov, V. Using neural network for credit card fraud detection. AIP Conf. Proc. 2019, 2159, 030013. [Google Scholar] [CrossRef] [Scilit]
- Sokolova, M.; Lapalme, G. A systematic analysis of performance measures for classification tasks. Inf. Process. Manag. 2009, 45, 427–437. [Google Scholar] [CrossRef] [Scilit]
- Fawcett, T. An introduction to ROC analysis. Pattern Recognit. Lett. 2006, 27, 861–874. [Google Scholar] [CrossRef] [Scilit]
- Lebichot, B.; Le Borgne, Y.-A.; He-Guelton, L.; Oblé, F.; Bontempi, G. Deep-Learning Domain Adaptation Techniques for Credit Card Fraud Detection. In INNSBDDL 2019; Springer: Cham, Switzerland, 2020; pp. 78–88. [Google Scholar]
- Alhazmi, A.H.; Aljehane, N. A Survey of Credit Card Fraud Detection Use Machine Learning. In 2020 International Conference on Computing and Information Technology (ICCIT-1441); IEEE: New York, NY, USA, 2020; pp. 137–142. [Google Scholar]
- Ali, A.; Abd Razak, S.; Othman, S.H.; Eisa, T.A.E.; Al-Dhaqm, A.; Nasser, M.; Elhassan, T.; Elshafie, H.; Saif, A. Financial fraud detection based on machine learning: A systematic literature review. Appl. Sci. 2022, 12, 9637. [Google Scholar] [CrossRef] [Scilit]
- Alwan, R.H.; Hamad, M.M.; Dawood, O.A. A comprehensive survey of fraud detection methods in credit card based on data mining techniques. AIP Conf. Proc. 2022, 2400, 020006. [Google Scholar] [CrossRef] [Scilit]
- Shirgave, S.K.; Awati, C.J.; More, R.; Patil, S.S. A review on credit card fraud detection using machine learning. Int. J. Sci. Technol. Res. 2019, 8, 1217–1220. [Google Scholar]
- Uchhana, N.; Ranjan, R.; Sharma, S.; Agrawal, D.; Punde, A. Literature review of different machine learning algorithms for credit card fraud detection. Int. J. Innov. Technol. Explor. Eng. 2021, 10, 101–108. [Google Scholar] [CrossRef] [Scilit]
- Kumari, S.; Khare, V.; Arora, P. Optimizing seizure detection: A comparative study of SVM, CNN, and RNN-LSTM. Int. J. Comput. Methods Exp. Meas. 2025, 12, 369–378. [Google Scholar]
- Esenogho, E.; Mienye, I.D.; Swart, T.G.; Aruleba, K.; Obaido, G. A neural network ensemble with feature engineering for improved credit card fraud detection. IEEE Access 2022, 10, 16400–16407. [Google Scholar] [CrossRef] [Scilit]
- Kasasbeh, B.; Aldabaybah, B.; Ahmad, H. Multilayer perceptron artificial neural networks-based model for credit card fraud detection. Indones. J. Electr. Eng. Comput. Sci. 2022, 26, 362–373. [Google Scholar] [CrossRef] [Scilit]
- Varmedja, D.; Karanovic, M.; Sladojevic, S.; Arsenovic, M.; Anderla, A. Credit card fraud detection: Machine learning methods. In Proceedings of the 2019 18th International Symposium INFOTEH-JAHORINA (INFOTEH), East Sarajevo, Bosnia and Herzegovina, 20–22 March 2019; IEEE: New York, NY, USA, 2019; pp. 1–5. [Google Scholar]
- Hewapathirana, I.; Kekayan, N.; Diyasena, D. A systematic investigation on the effectiveness of the TabBERT model for credit card fraud detection. In Proceedings of the SCSE 2022, Colombo, Sri Lanka, 1 September 2022; IEEE: New York, NY, USA, 2022; pp. 96–101. [Google Scholar]
- Forough, J.; Momtazi, S. Ensemble of deep sequential models for credit card fraud detection. Appl. Soft Comput. 2021, 99, 106883. [Google Scholar] [CrossRef] [Scilit]
- Saloni; Rout, M. Analysis and comparison of credit card fraud detection using machine learning. In Artificial Intelligence and Machine Learning in Business Management; Panda, S.K., Mishra, V., Balamurali, R., Elngar, A.A., Eds.; CRC Press: Boca Raton, FL, USA, 2022; pp. 81–93. [Google Scholar]
- Huang, X.; Khetan, A.; Cvitkovic, M.; Karnin, Z. TabTransformer: Tabular Data Modeling Using Contextual Embeddings. arXiv 2020, arXiv:2012.06678. [Google Scholar] [CrossRef] [Scilit]
- Gorishniy, Y.; Rubachev, I.; Khrulkov, V.; Babenko, A. Revisiting Deep Learning Models for Tabular Data. Adv. Neural Inf. Process. Syst. 2021, 34, 18932–18943. [Google Scholar]
- McMahan, H.B.; Moore, E.; Ramage, D.; Hampson, S.; Agüera y Arcas, B. Communication-Efficient Learning of Deep Networks from Decentralized Data. In Proceedings of the 20th International Conference on Artificial Intelligence and Statistics (AISTATS 2017); JMLR W&CP: Fort Lauderale, FL, USA, 2017; Volume 54, pp. 1273–1282. Available online: https://arxiv.org/pdf/1602.05629v4 (accessed on 6 April 2026).
- Li, T.; Sahu, A.K.; Talwalkar, A.; Smith, V. Federated Learning: Challenges, Methods, and Future Directions. IEEE Signal Process. Mag. 2020, 37, 50–60. [Google Scholar] [CrossRef] [Scilit]
- Abadi, A.; Doyle, B.; Gini, F.; Guinamard, K.; Murakonda, S.K.; Liddell, J.; Mellor, P.; Murdoch, S.J.; Naseri, M.; Page, H.; et al. Starlit: Privacy-Preserving Federated Learning to Enhance Financial Fraud Detection. IACR Cryptol. ePrint Arch. 2024, 2024/090. [Google Scholar]
- Xia, Z.; Saha, S.C. FinGraphFL: Financial Graph-Based Federated Learning for Enhanced Credit Card Fraud Detection. Mathematics 2025, 13, 1396. [Google Scholar]
- Dou, Y.; Liu, Z.; Sun, L.; Deng, Y.; Peng, H.; Yu, P.S. Enhancing Graph Neural Network-based Fraud Detectors against Camouflaged Fraudsters. arXiv 2020, arXiv:2008.08692. [Google Scholar] [CrossRef] [Scilit]
- Liu, Z.; Dou, Y.; Yu, P.S.; Deng, Y.; Peng, H. Alleviating the Inconsistency Problem of Applying Graph Neural Network to Fraud Detection. arXiv 2020, arXiv:2005.00625. [Google Scholar] [CrossRef] [Scilit]
- Cherif, A.; Ammar, H.; Kalkatawi, M.; Alshehri, S.; Imine, A. Encoder–decoder graph neural network for credit card fraud detection. J. King Saud Univ. Comput. Inf. Sci. 2024, 36, 102003. [Google Scholar]
- Hemdan, E.E.-D.; Manjaiah, D.F. Anomaly credit card fraud detection using deep learning. In Deep Learning in Data Analytics; Acharjya, D.P., Mitra, A., Zaman, N., Eds.; Springer: Cham, Switzerland, 2022; pp. 207–217. [Google Scholar]
- Dang, T.K.; Tran, T.C.; Tuan, L.M.; Tiep, M.V. Machine learning based on resampling approaches and deep reinforcement learning for credit card fraud detection systems. Appl. Sci. 2021, 11, 10004. [Google Scholar] [CrossRef] [Scilit]
- Alarfaj, F.K.; Malik, I.; Khan, H.U.; Almusallam, N.; Ramzan, M.; Ahmed, M. Credit card fraud detection using state-of-the-art machine learning and deep learning algorithms. IEEE Access 2022, 10, 39700–39715. [Google Scholar]
- Fanai, H.; Abbasimehr, H. A novel combined approach based on deep autoencoder and deep classifiers for credit card fraud detection. Expert Syst. Appl. 2023, 217, 119562. [Google Scholar] [CrossRef] [Scilit]
- Salekshahrezaee, Z.; Leevy, J.L.; Khoshgoftaar, T.M. The effect of feature extraction and data sampling on credit card fraud detection. J. Big Data 2023, 10, 6. [Google Scholar] [CrossRef] [Scilit]
- Habibpour, M.; Gharoun, H.; Mehdipour, M.; Tajally, A.; Asgharnezhad, H.; Shamsi, A.; Khosravi, A.; Nahavandi, S. Uncertainty-aware credit card fraud detection using deep learning. Eng. Appl. Artif. Intell. 2023, 123, 106248. [Google Scholar] [CrossRef] [Scilit]
- Jiang, S.; Dong, R.; Wang, J.; Xia, M. Credit card fraud detection based on unsupervised attentional anomaly detection network. Systems 2023, 11, 305. [Google Scholar] [CrossRef] [Scilit]
- Markova, M. Credit card approval model: An application of deep neural networks. AIP Conf. Proc. 2021, 2321, 030023. [Google Scholar] [CrossRef] [Scilit]
- Mienye, I.D.; Jere, N. Deep learning for credit card fraud detection: A review of algorithms, challenges, and solutions. IEEE Access 2024, 12, 96893–96910. [Google Scholar] [CrossRef] [Scilit]
- Mittal, S.; Tyagi, S. Performance evaluation of machine learning algorithms for credit card fraud detection. In Proceedings of the Confluence 2019, Noida, India, 10–11 January 2019; IEEE: New York, NY, USA, 2019; pp. 320–324. [Google Scholar]
- Poojitha, S.; Malathi, K. An innovative method to enhance the accuracy of credit card fraud detection using logistic regression algorithm by comparing random forest algorithm. ECS Trans. 2022, 107, 14205–14218. [Google Scholar] [CrossRef] [Scilit]
- Thennakoon, A.; Bhagyani, C.; Premadasa, S.; Mihiranga, S.; Kuruwitaarachchi, N. Real-time credit card fraud detection using machine learning. In Proceedings of the Confluence 2019, Noida, India, 10–11 January 2019; IEEE: New York, NY, USA, 2019; pp. 488–493. [Google Scholar]
- Tiwari, P.; Mehta, S.; Sakhuja, N.; Kumar, J.; Singh, A.K. Credit card fraud detection using machine learning: A study. arXiv 2021, arXiv:2108.10005. [Google Scholar] [CrossRef] [Scilit]
- Trivedi, N.K.; Simaiya, S.; Lilhore, U.K.; Sharma, S.K. An efficient credit card fraud detection model based on machine learning methods. Int. J. Adv. Sci. Technol. 2020, 29, 3414–3424. [Google Scholar]
- Azhan, M.; Meraj, S. Credit card fraud detection using machine learning and deep learning techniques. In Proceedings of the ICISS, Thoothukudi, India, 3–5 December 2020; IEEE: New York, NY, USA, 2020; pp. 514–518. [Google Scholar]
- Baig, M.S.S.A.; Jaisharma, K. Comparison of novel optimized random forest technique and logistic regression for credit card fraud detection with improved precision. J. Pharm. Negat. Results 2022, 13, 723–727. [Google Scholar]
- Dornadula, V.N.; Geetha, S. Credit card fraud detection using machine learning algorithms. Procedia Comput. Sci. 2019, 165, 631–641. [Google Scholar] [CrossRef] [Scilit]
- Itoo, F.; Meenakshi; Singh, S. Comparison and analysis of logistic regression, Naïve Bayes and KNN machine learning algorithms for credit card fraud detection. Int. J. Inf. Technol. 2021, 13, 1503–1511. [Google Scholar] [CrossRef] [Scilit]
- Krishna, M.V.; Praveenchandar, J. Comparative analysis of credit card fraud detection using logistic regression with random forest towards an increase in accuracy of prediction. In Proceedings of the ICECAA 2022, Tamilnadu, India, 13–15 October 2022; IEEE: New York, NY, USA, 2022; pp. 1097–1101. [Google Scholar]
- Kolodiziev, O.; Mints, A.; Sidelov, P.; Pleskun, I.; Lozynska, O. Automatic machine learning algorithms for fraud detection in digital payment systems. East.-Eur. J. Enterp. Technol. 2020, 5, 14–26. [Google Scholar] [CrossRef] [Scilit]
- Mahalaxmi, K.V.K.; Rekha, K.S. Comparison of logistic regression and artificial neural network for modelling credit card data set with the identification of precise fraudulent. In Proceedings of the ICBATS 2022, Dubai, United Arab Emirates, 16–17 February 2022; IEEE: New York, NY, USA, 2022; pp. 1–5. [Google Scholar]
- Raghavendra, R.P.; Sivanesh, K.A. A fraudulent transaction prediction in credit card by using novel LGBA over LR algorithms. Adv. Parallel Comput. 2022, 41, 515–521. [Google Scholar]
- Kennedy, R.K.L.; Villanustre, F.; Khoshgoftaar, T.M. Unsupervised feature selection and class labeling for credit card fraud. J. Big Data 2025, 12, 111. [Google Scholar] [CrossRef] [Scilit]
- Mienye, I.D.; Esenogho, E.; Modisane, C. Detecting imbalanced credit card fraud via hybrid graph attention and variational autoencoder ensembles. AppliedMath 2025, 5, 131. [Google Scholar] [CrossRef] [Scilit]
- Vats, S.; Dubey, S.K.; Pandey, N.K. Genetic algorithms for credit card fraud detection. In Proceedings of the 2013 International Conference on Education and Educational Technologies (ICEET 2013), Rhodes Island, Greece, 16–19 July 2013; pp. 42–53. Available online: https://www.researchgate.net/publication/339915930 (accessed on 21 April 2026).
- Özçelik, M.H.; Duman, E.; Işık, M.; Çevik, T. Improving a credit card fraud detection system using genetic algorithm. In Proceedings of the ICNIT 2010, Manila, Philippines, 11–13 June 2010; IEEE: New York, NY, USA, 2010; pp. 436–440. [Google Scholar]
- Duman, E.; Özçelik, M.H. Detecting credit card fraud by genetic algorithm and scatter search. Expert Syst. Appl. 2011, 38, 13057–13063. [Google Scholar] [CrossRef] [Scilit]
- Ramakalyani, K.; Umadevi, D. Fraud detection of credit card payment system by genetic algorithm. Int. J. Sci. Eng. Res. 2012, 3, 1–6. [Google Scholar]
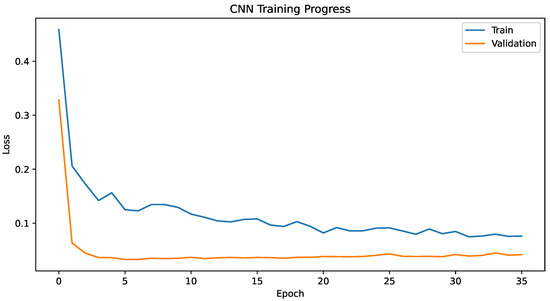
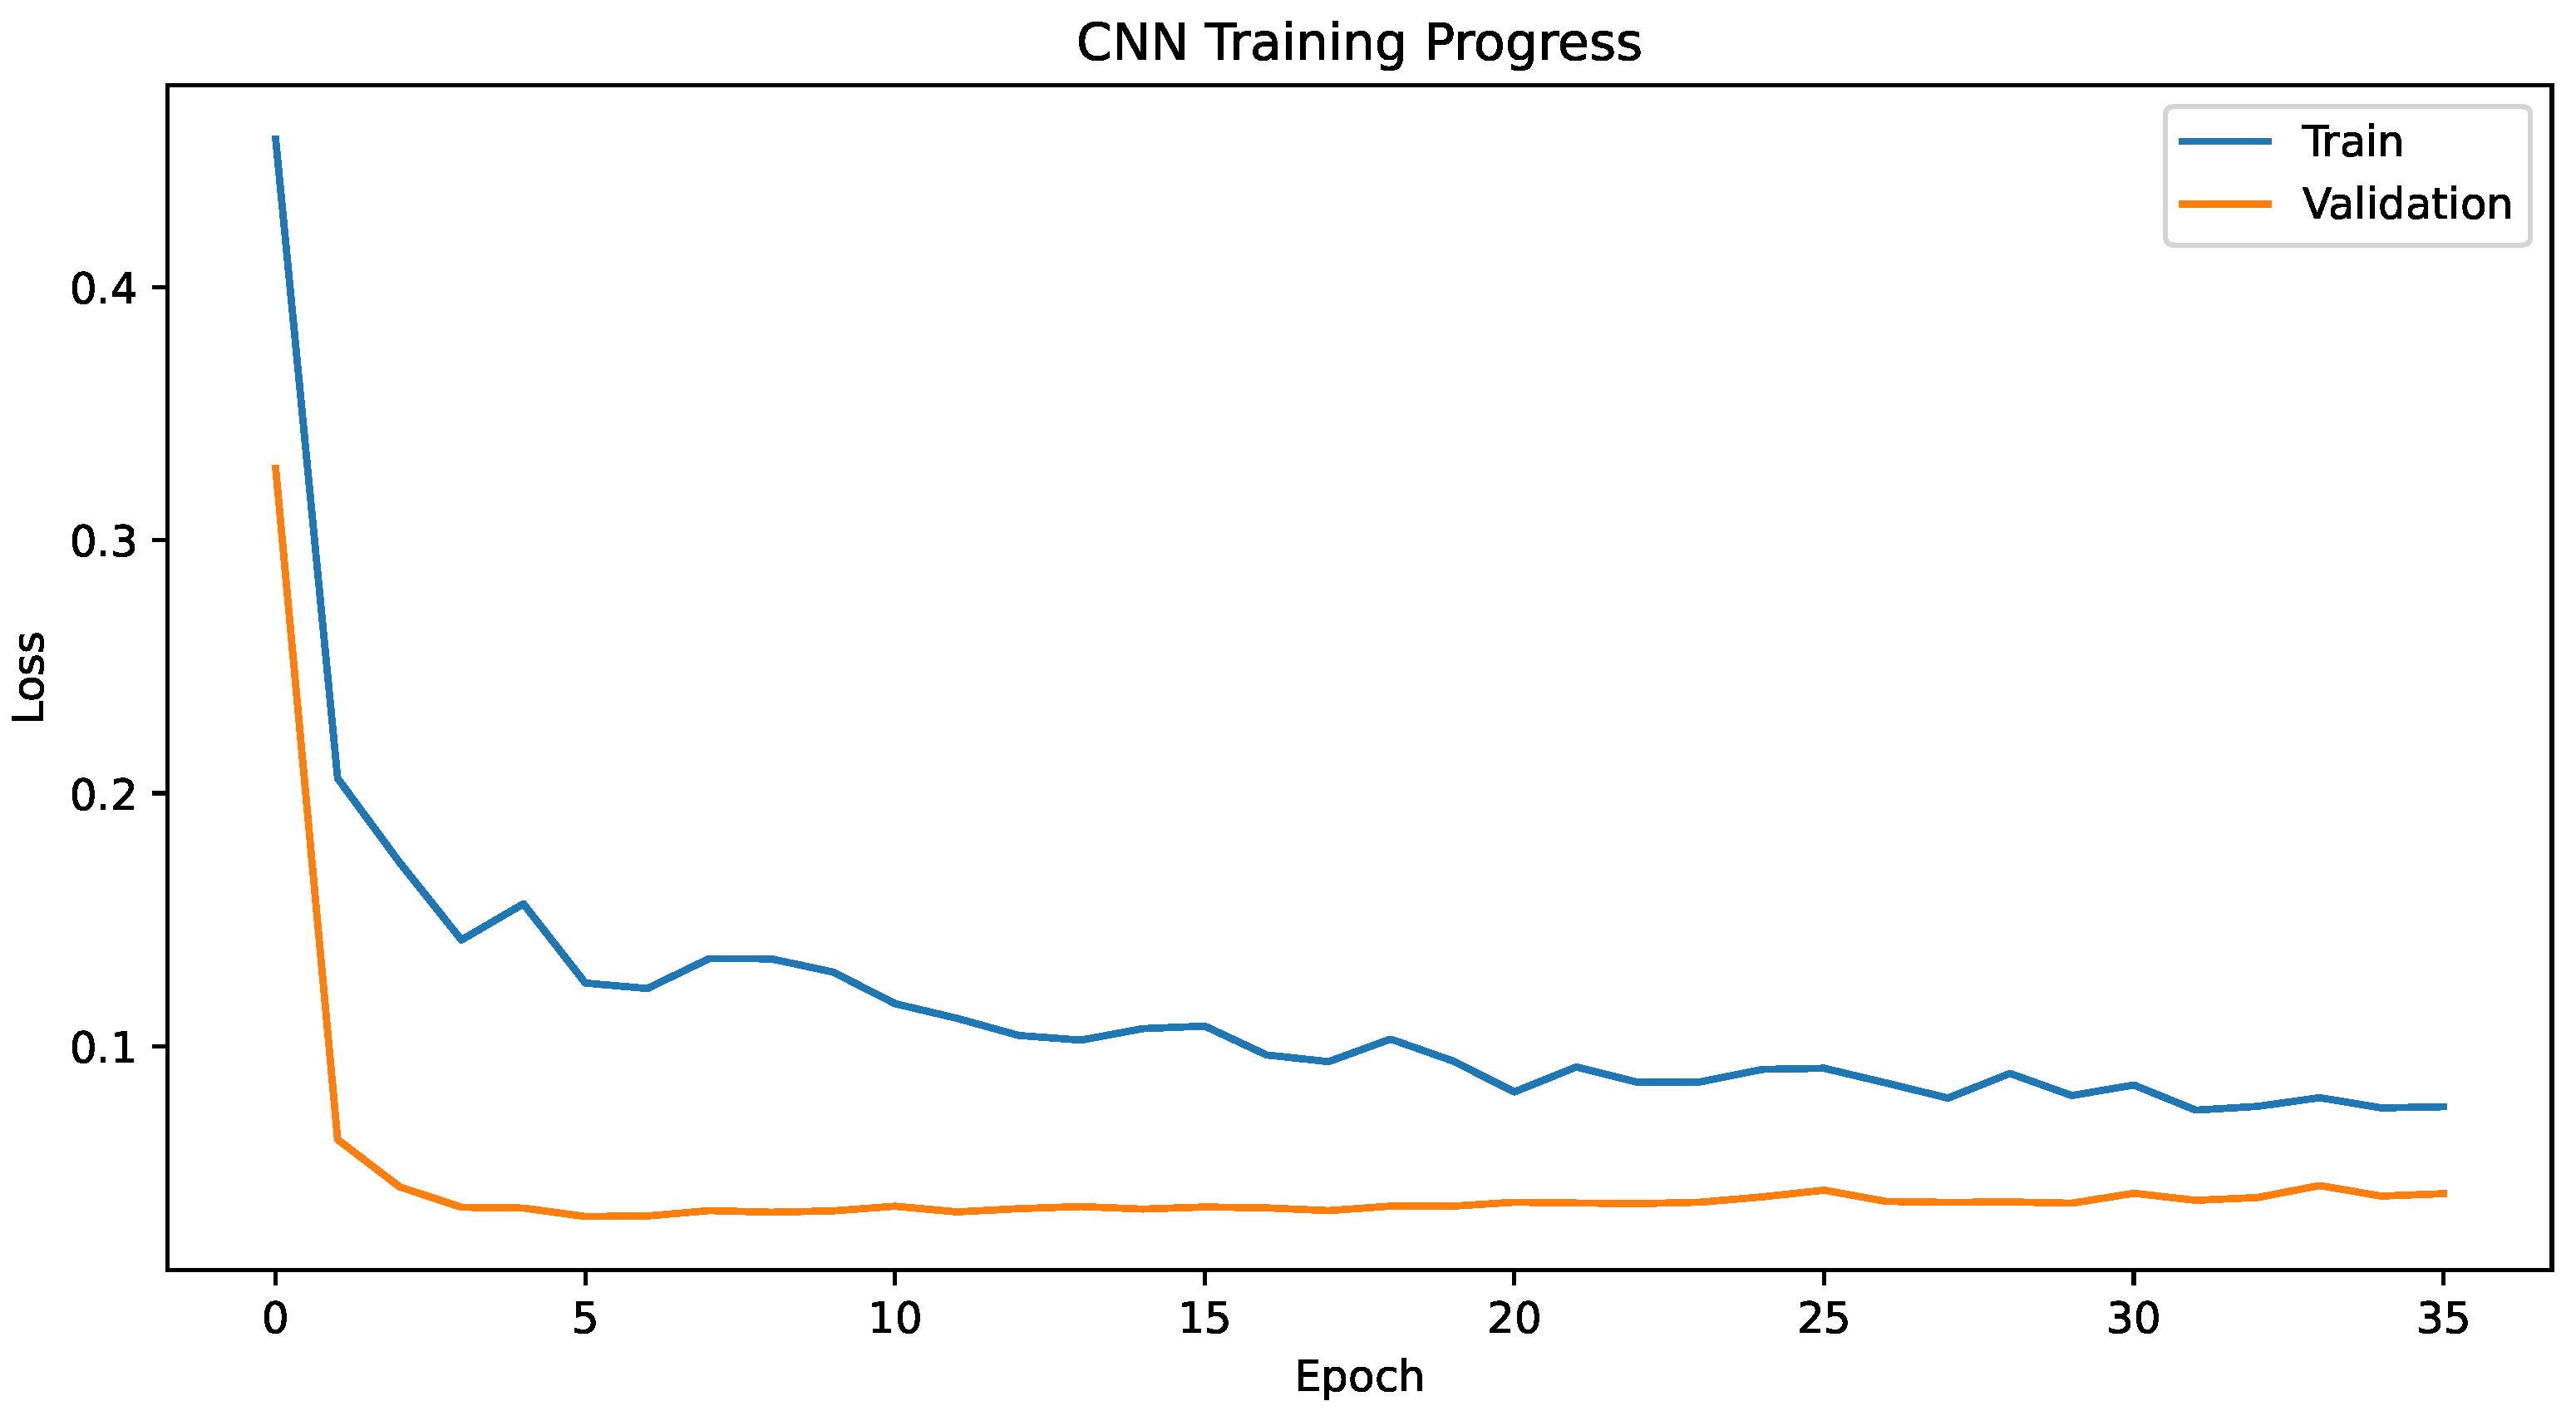
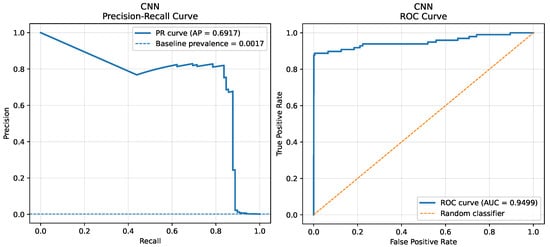
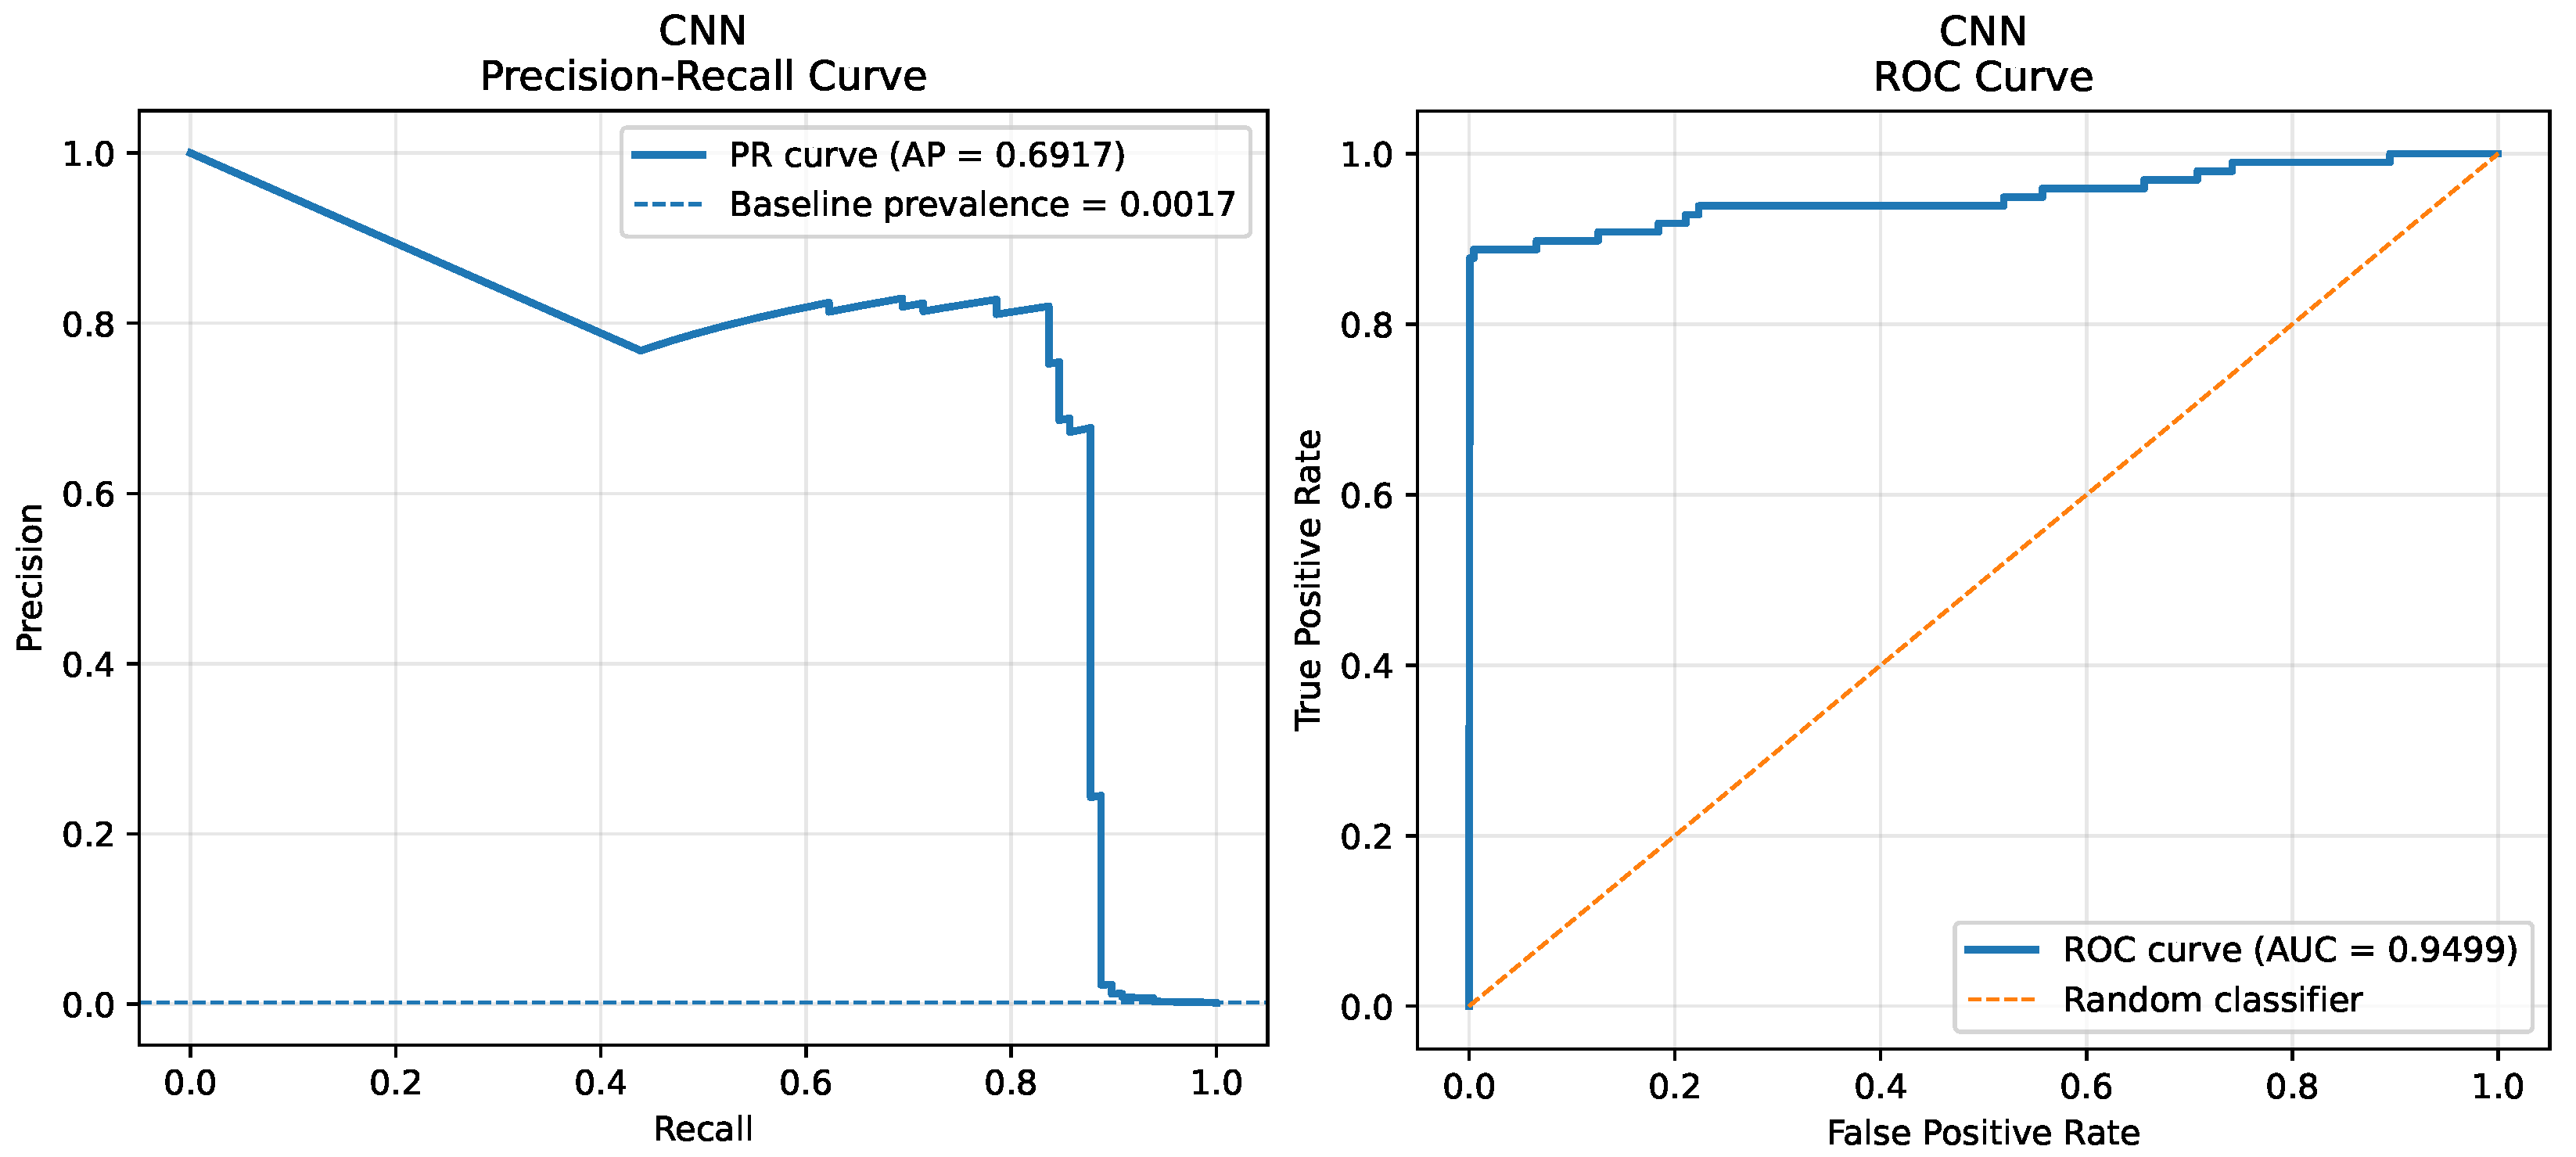
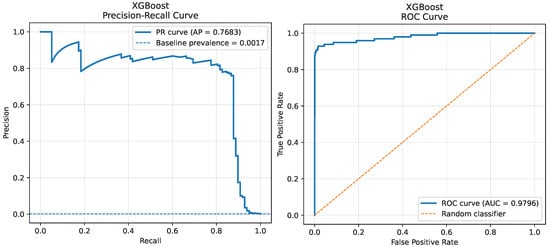
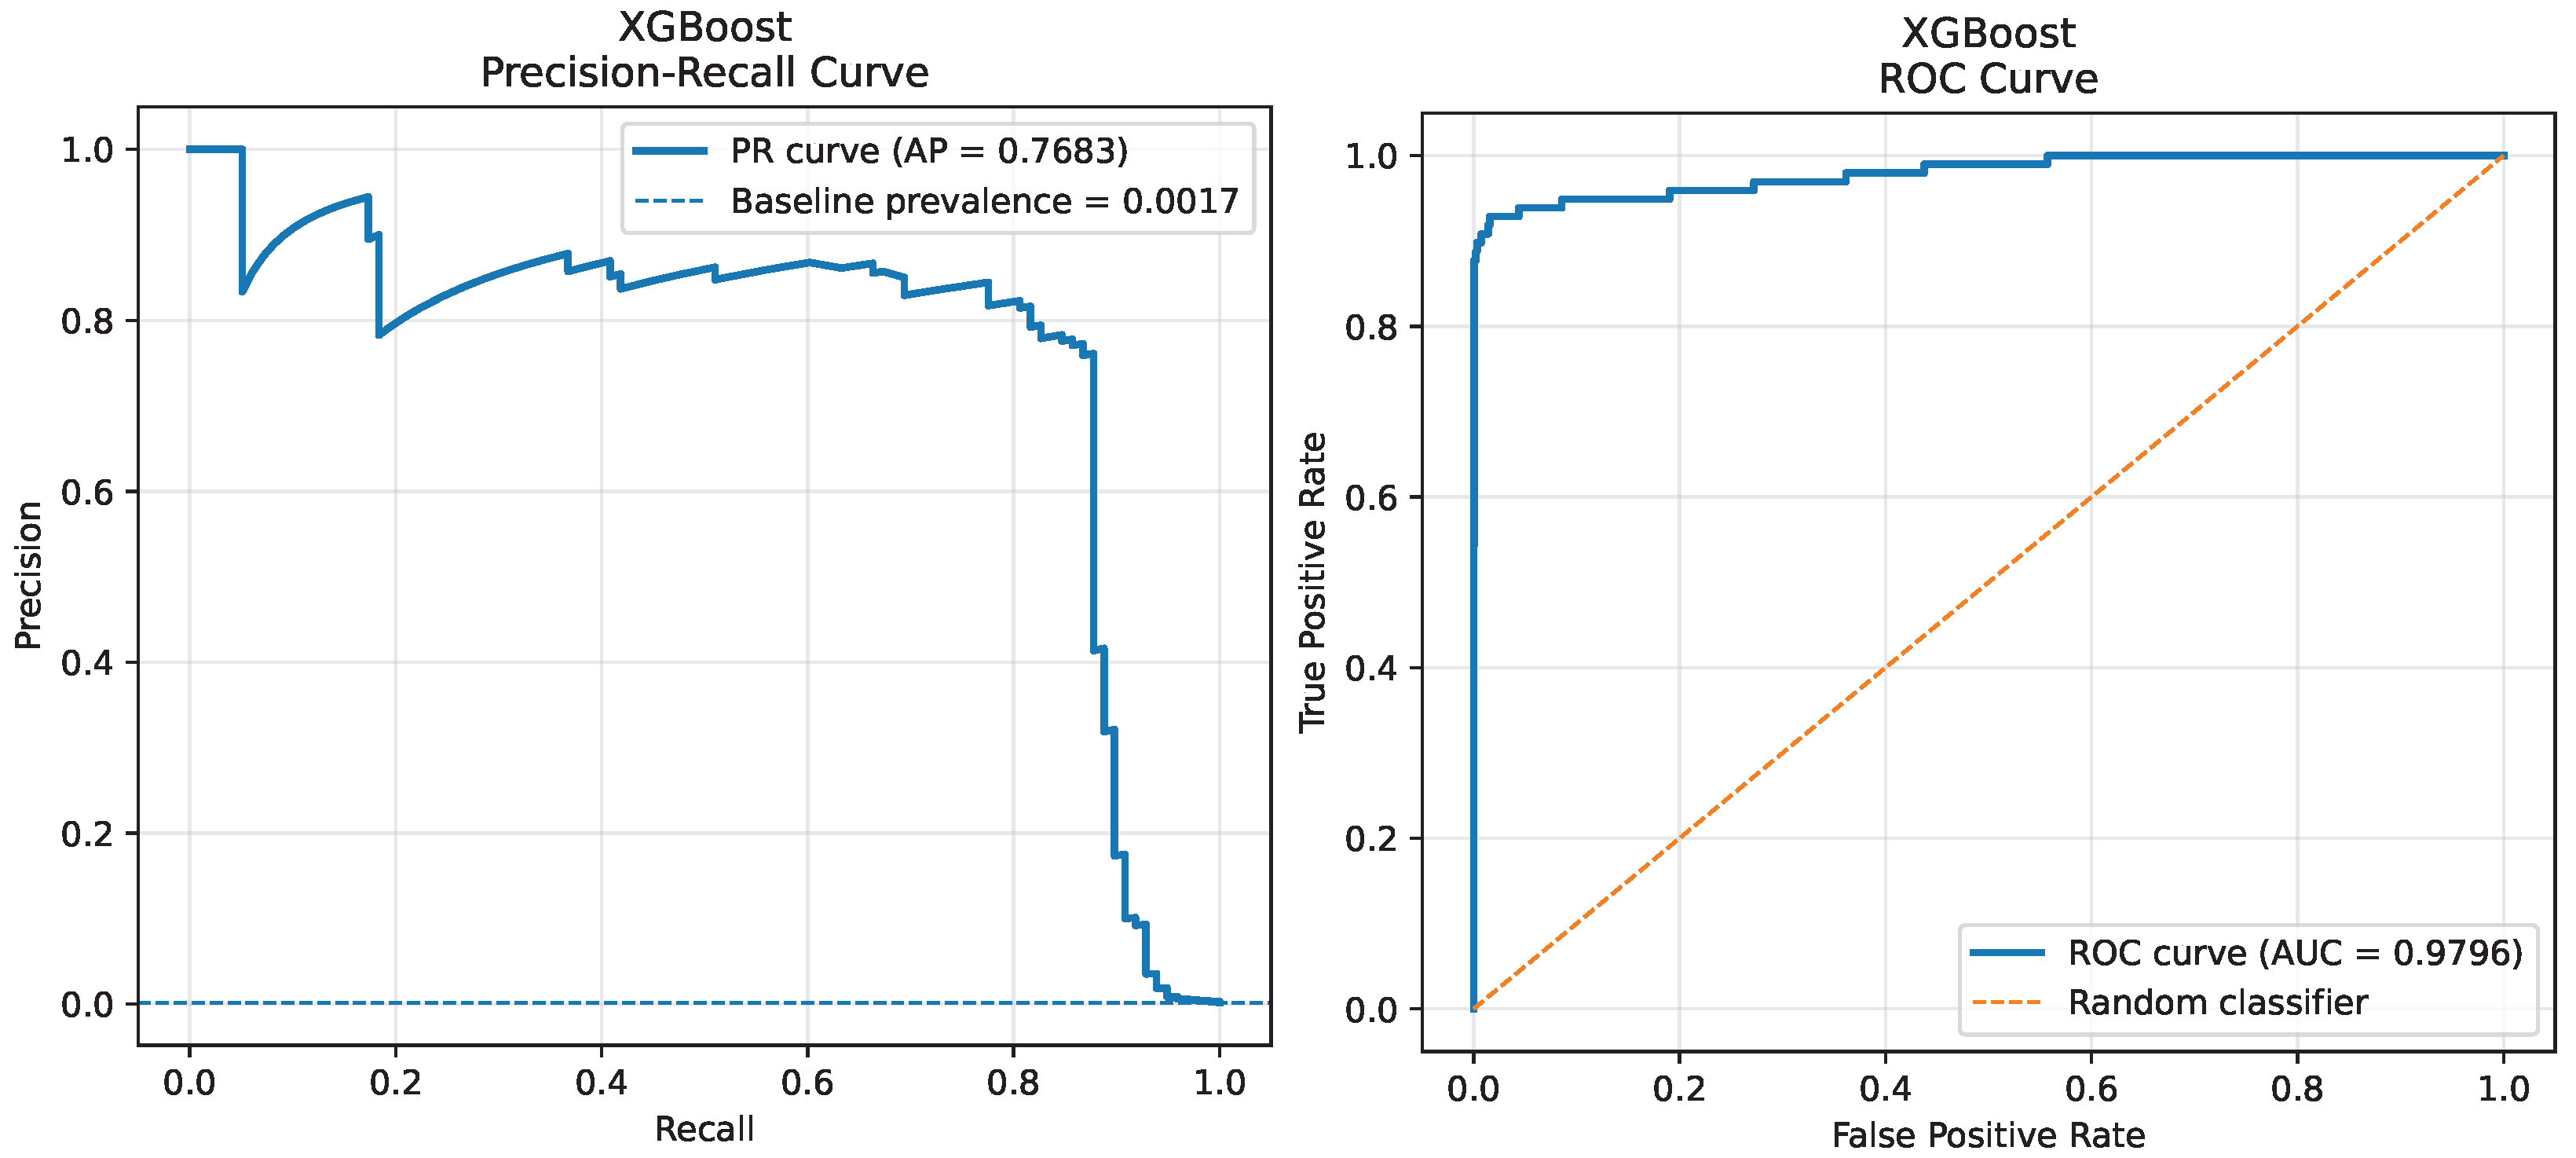
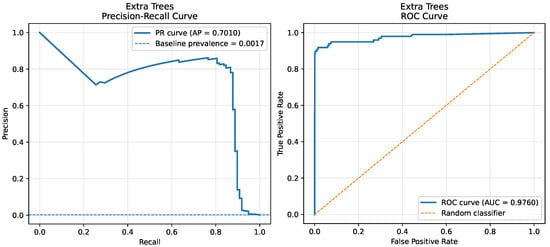
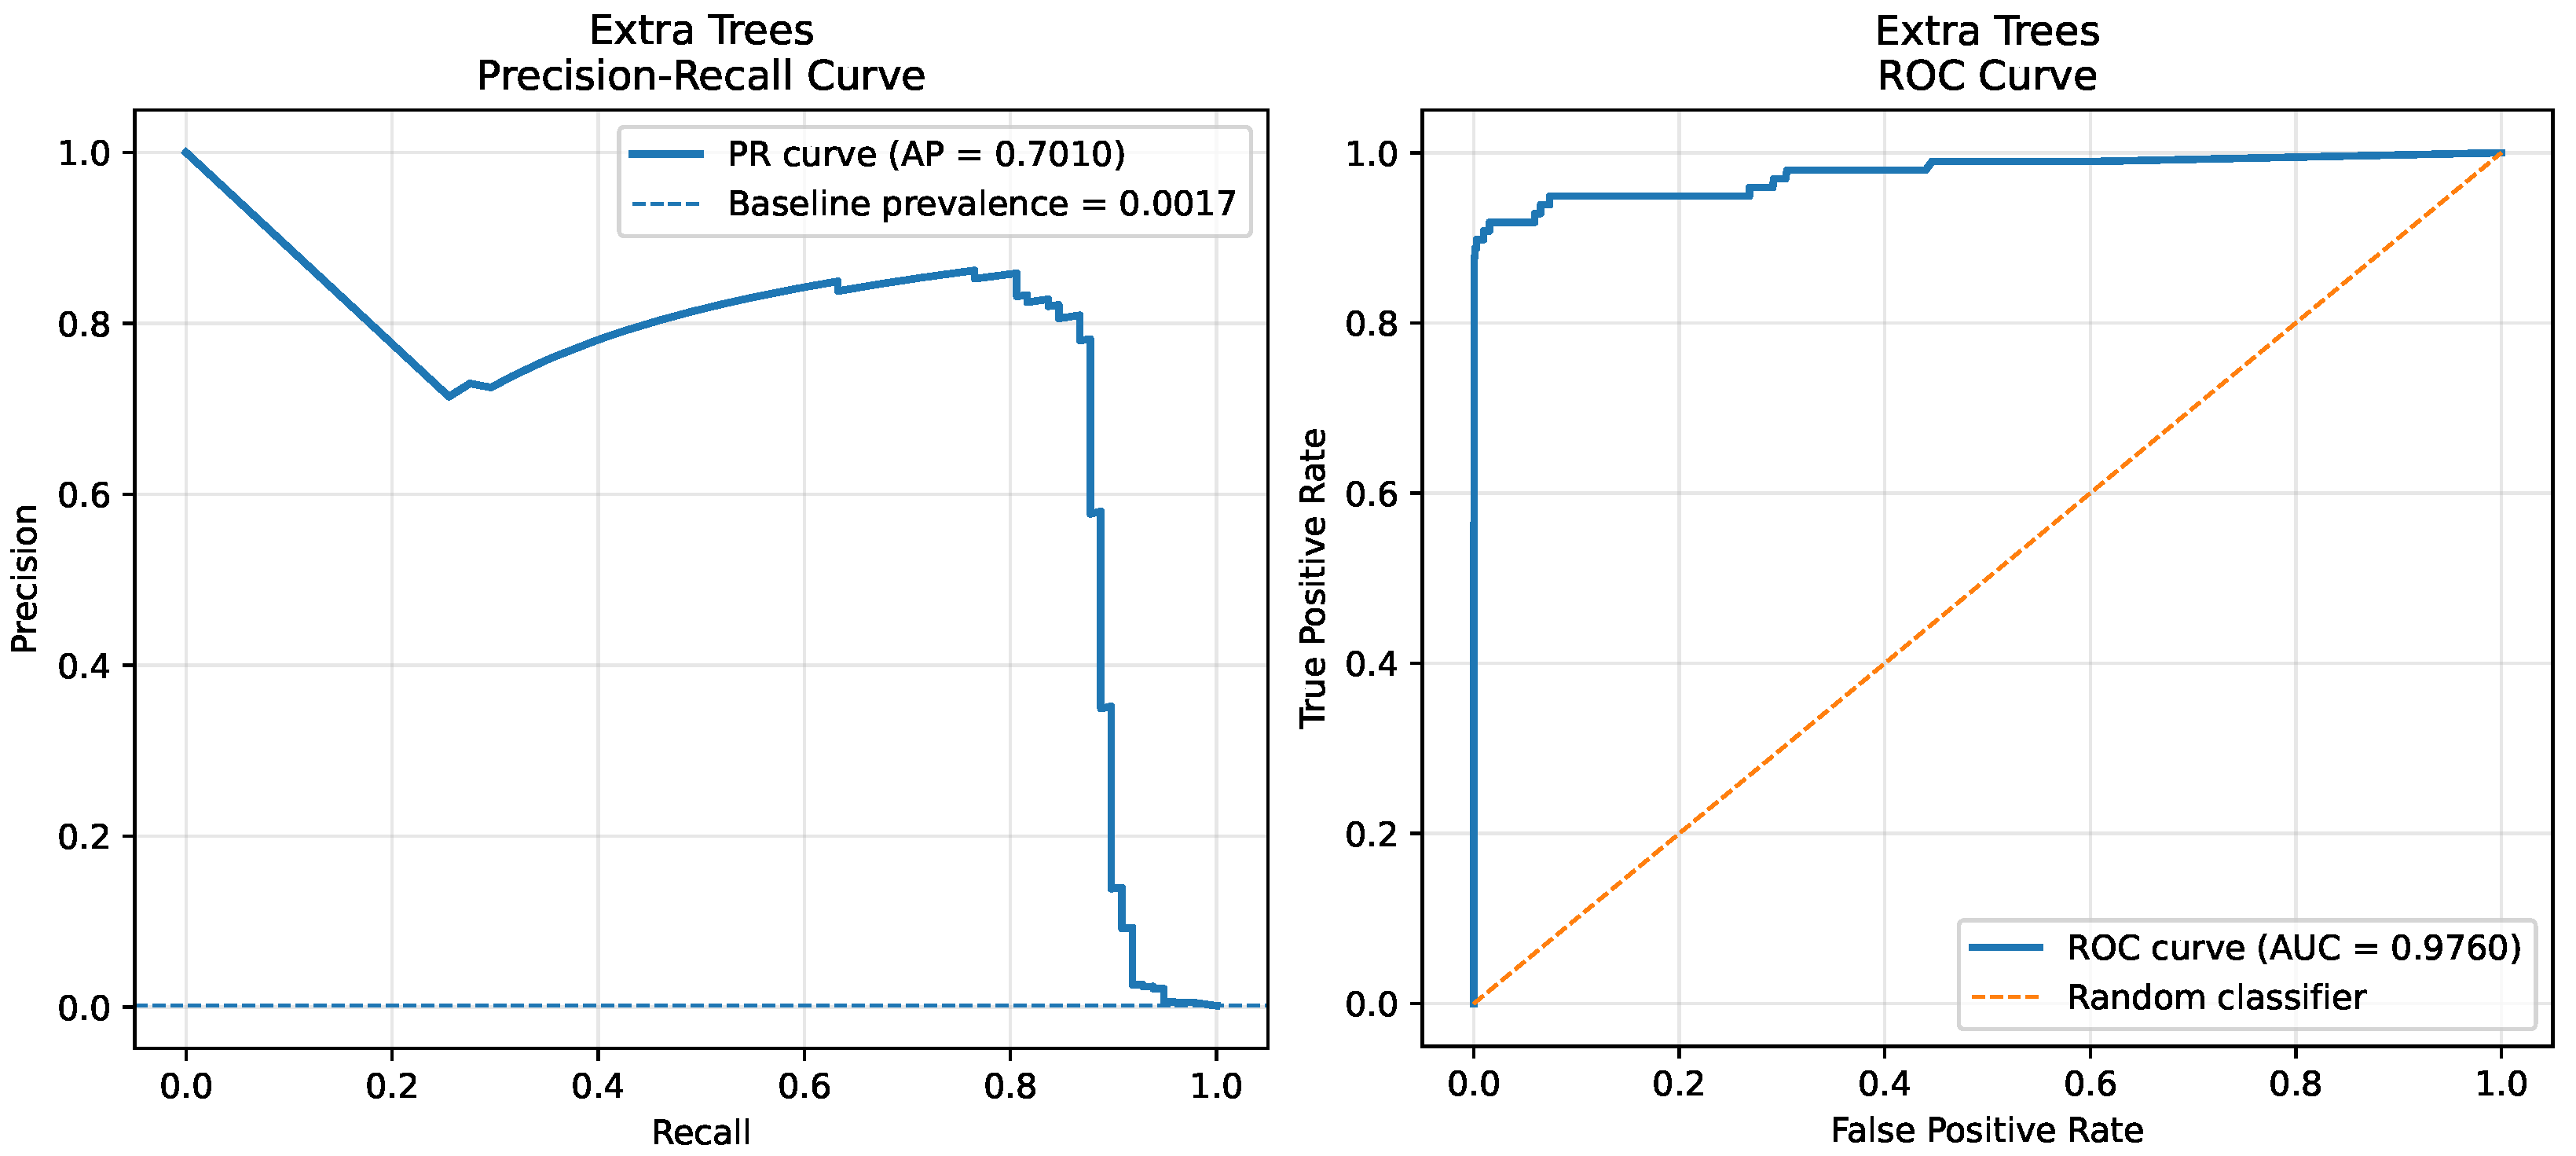
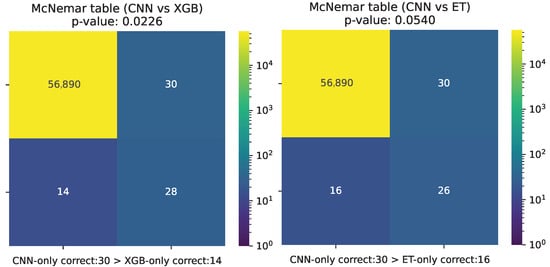
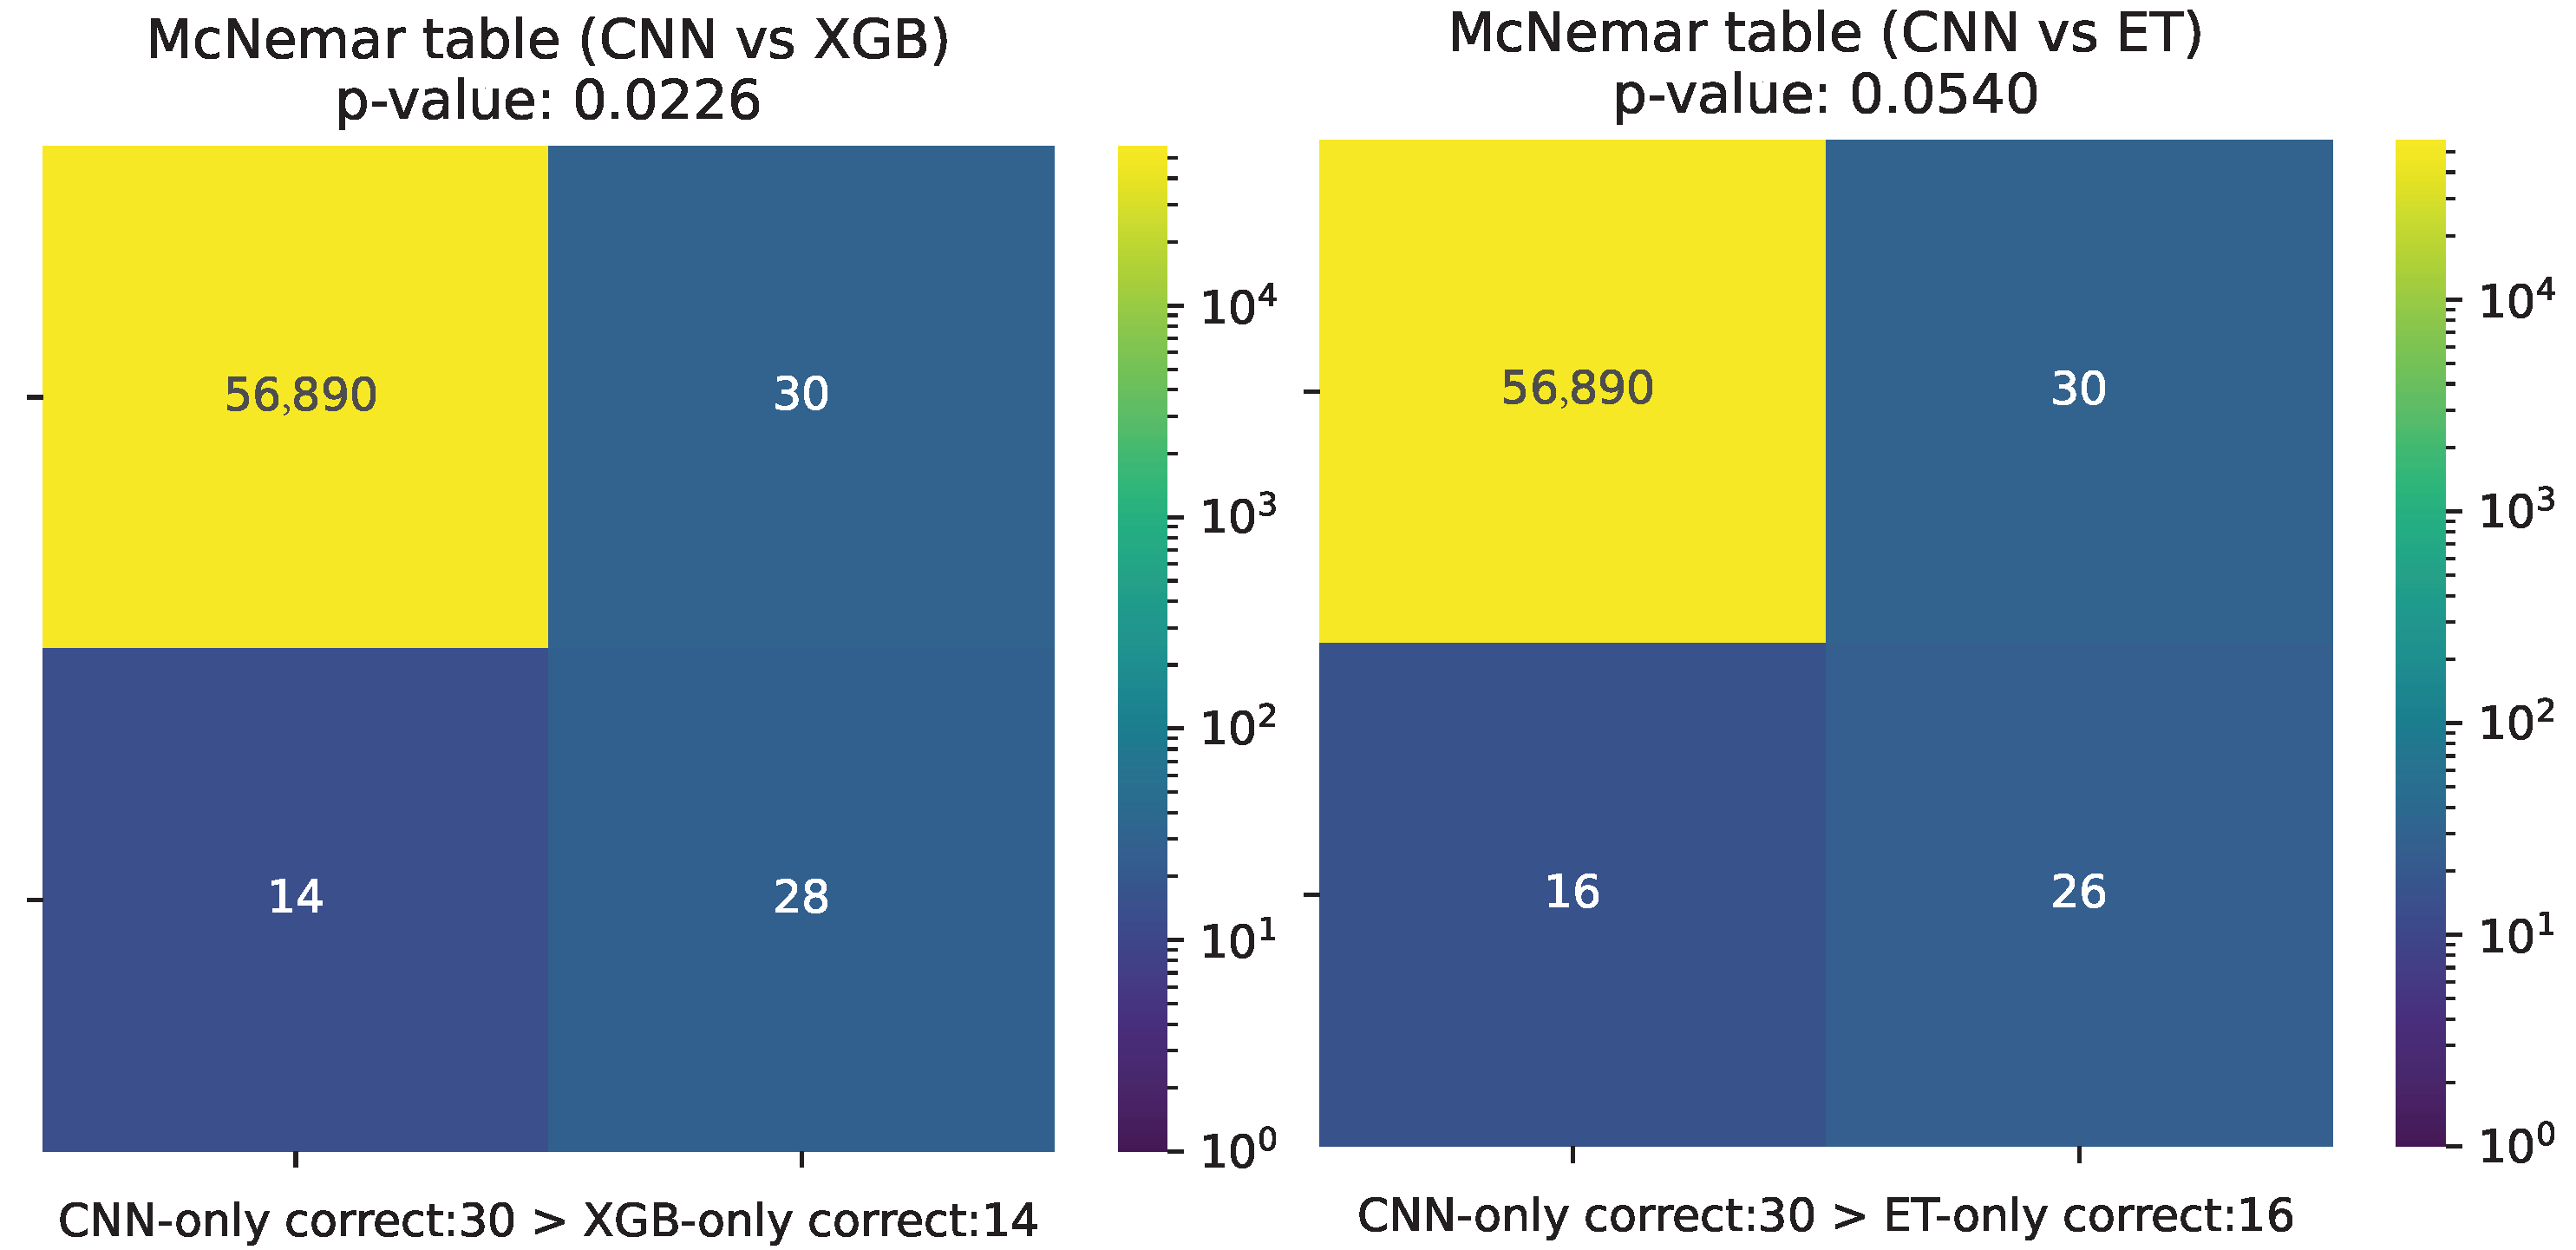

Disclaimer/Publisher’s Note: The statements, opinions and data contained in all publications are solely those of the individual author(s) and contributor(s) and not of MDPI and/or the editor(s). MDPI and/or the editor(s) disclaim responsibility for any injury to people or property resulting from any ideas, methods, instructions or products referred to in the content. |
© 2026 by the authors. Licensee MDPI, Basel, Switzerland. This article is an open access article distributed under the terms and conditions of the Creative Commons Attribution (CC BY) license.