


Abstract
Social media engagement drives both individual behavior and content dissemination, yet traditional analytics often reduce interactions to simple counts, obscuring the complex structures underlying user activity. In the highly competitive digital landscape, understanding how users interact with content is crucial for businesses aiming to optimize social media campaigns and maximize return on investment (ROI). Traditional engagement metrics, such as likes and shares, fail to capture the underlying structure and dynamics of user behavior. This study investigates the latent patterns of engagement by combining topological data analysis (TDA) with behavioral clustering across 100,000 posts on multiple platforms. Using persistent homology and k-nearest neighbour graphs, we reveal a primary bifurcation between Active (validation-focused) and Passive (consumption/propagation) users, nested four-strain substructures, and over 650 significant loops indicating recurring feedback cycles. Active users exhibit strong cluster cohesion and high engagement rates, while Passive users contribute broadly to content diffusion with slightly higher loop counts, highlighting distinct functional roles in social media dynamics. These findings provide a principled framework for targeting content, reinforcing feedback loops, and leveraging hub posts to amplify engagement. By linking topological structure to behavioral patterns, this work advances both the theoretical understanding of digital interaction and the practical design of more effective social media campaigns.
Keywords:
social media engagement; topological data analysis; behavioral clustering; interaction networks; persistent homology; campaign optimization MSC:
55N31; 91D30; 62H30
1. Introduction
The analysis of high-dimensional behavioral data generated by digital social systems presents significant mathematical challenges that extend well beyond conventional statistical and network analytic frameworks. Social media platforms produce massive, multidimensional interaction records that embed complex relational structures among users, content, and engagement behaviors. The central problem is how to rigorously characterize the persistent, multiscale topological structure of such behavioral spaces in a way that is both geometrically faithful and interpretable in terms of underlying dynamical mechanisms.
Within the framework of complex network theory, social media engagement can be understood as a dynamic process occurring over an underlying network of users and content. Foundational work by Boccaletti et al. [1] established the major concepts and results concerning the structure and dynamics of complex networks, while Pastor-Satorras and Vespignani [2] and Kitsak et al. [3] provided quantitative models for epidemic spreading and information diffusion on heterogeneous networks. However, traditional network approaches typically focus on pairwise interactions and static community structures. This study integrates topological data analysis (TDA) with complex network theory to examine both local clustering patterns and global topological structures within the engagement manifold, thereby extending existing network-based models of social contagion. Existing analytical tools address this problem only to a limited extent. To overcome this, the present study introduces a formal framework that integrates graph-based manifold learning, persistent homology, and behavioral clustering.
A candidate organizing structure for such behaviors is the digital pathogen taxonomy [4]. We explicitly note that this taxonomy is a recent theoretical proposition requiring empirical validation, not a fact. We therefore treat it not as a behavioral hypothesis to be tested but as a candidate topological scaffold for the engagement manifold. The taxonomy proposes four interrelated strains, namely, Self-expression (compulsive self-presentation), Consumption (relentless intake of mediated content), Propagation (rapid circulation of information), and Validation (obsessive monitoring of interaction metrics). In this study, we operationalize these theoretical strains as candidate partitions of the behavioral space. The mathematical task is to determine whether this four-strain topological scaffold emerges naturally from the data’s inherent geometry under persistent homology, or whether a simpler bifurcation (active–passive) better characterizes the primary organization.
To ground this investigation in the established literature, we draw upon several foundational contributions from complex network theory. Porter, Onnela, and Mucha [5] surveyed community detection methods in heterogeneous networks, providing rigorous tools for identifying behavioral clusters in social media data. Lambiotte and Schaub [6] formalized the relationship between modular network structure and dynamical processes, which is directly relevant to understanding how engagement behaviors propagate across user communities. Fortunato [7] provided a comprehensive review of community detection in graphs, offering a benchmark against which our topological clustering results can be compared. Newman [8] introduced modularity as a quality function for community structure, a concept that parallels our use of persistence to quantify the stability of behavioral regimes. Finally, Watts and Strogatz [9] and Barabási and Albert [10] established the small-world and scale-free paradigms that underpin our analysis of the k-nearest neighbor graph. Three specific research questions organize the investigation. First, does the social media engagement manifold exhibit non-trivial topology; that is, does persistent homology yield significant and features that are stable across filtration scales? Second, does the empirically observed topological structure align with the four-strain theoretical taxonomy, or does a simpler bifurcation better characterize the primary geometric organization of the engagement space? Third, what graph-theoretic invariants (degree distribution, clustering coefficient, hub structure) characterize the local geometry of the engagement network, and how do these constrain dynamical processes such as information diffusion?
This study contributes to the mathematical analysis of high-dimensional behavioral systems through three formal contributions. First, we introduce a topological characterization of engagement regimes by mapping behavioral observations to a metric space and analyzing the resulting Vietoris–Rips filtration, allowing engagement regimes to be interpreted as persistent connected components. Second, we formalize recurrent engagement cycles as homological features, with persistence providing a mathematically grounded indicator of structural feedback processes. Third, we establish a methodological bridge between behavioral segmentation and topological persistence, yielding an interpretable relationship between conventional clustering results and persistent homology. In doing so, we demonstrate how persistent homology can complement and extend classical community detection methods [5,7] by revealing multi-scale topological features that are invisible to modularity-based approaches. For practitioners, these findings translate into actionable strategies because the identified active–passive bifurcation informs audience segmentation; the loop persistence values suggest natural re-engagement intervals for content retargeting; and the hub posts (degree up to 49 in the k-NN graph) provide direct targets for amplification campaigns.
The remainder of the paper is organized as follows. Section 2 presents the mathematical framework, including the construction of the k-nearest neighbor graph, the Vietoris–Rips filtration, and theoretical justifications for parameter selection. Section 3 describes the dataset, preprocessing, and empirical results, including persistence diagrams, Betti number analysis, and cluster-level comparisons. Section 4 discusses the mathematical interpretation of the findings and their implications for the analysis of complex social systems.
2. Materials and Methods
We adopt a mathematically rigorous framework integrating graph-based manifold learning, clustering theory, and topological data analysis to investigate the multiscale geometric structure of engagement dynamics. We represent the dataset as where each observation corresponds to a multidimensional engagement vector containing normalized metrics such as likes, comments, shares, impressions, reach, and engagement rate. We standardize all features using z-score normalization to ensure comparability across dimensions and to prevent high magnitude variables from dominating distance-based computations. This standardization is standard practice in geometric and topological approaches to network data, where metric distortions arising from scale heterogeneity can corrupt both the graph topology and the resulting homological invariants [11]. Our methodological contribution is not the invention of new algorithms but the novel integration of existing TDA methods with behavioral clustering to address a specific social science question. We implement publicly available algorithms (GUDHI, scikit-learn, UMAP) on a new dataset, and our primary contribution lies in the formal interpretation of topological features as behavioral regimes and feedback cycles. More broadly, this work situates itself within the study of complex networks, where structural properties of interaction graphs (including community structure, degree heterogeneity, and mesoscale organization) are understood to govern system-level dynamics [1,12]. By encoding engagement observations as nodes in a geometric graph and analyzing the resulting topology, we extend these network-theoretic ideas to the continuous, high-dimensional setting of behavioral data.
2.1. Geometric Approximation via k-NN Graph
We construct a k-nearest neighbor graph that serves as a discrete geometric approximation of the underlying behavioral manifold from which the observations X are assumed to be sampled. Each node represents an observation , and an edge is established when belongs to the set of the k closest observations to under the Euclidean distance metric . The adjacency matrix A is defined as if and 0 otherwise. This construction preserves local geometric structure while avoiding restrictive global linearity assumptions. The k-NN graph is itself a well-studied object in complex network theory because its degree distribution, clustering coefficient, and connected component structure encode mesoscale properties of the data manifold that are directly analogous to those studied in empirical social and information networks [9,10]. In particular, the tendency of k-NN graphs constructed from clustered data to exhibit high transitivity mirrors the community structure observed in real-world social networks [13], providing theoretical grounding for using this construction as a proxy for the underlying behavioral interaction graph.
The parameter k functions as a scale parameter controlling the resolution of the geometric approximation. A small k approximates the tangent space locally but risks fragmenting the manifold; a large k smooths over noise but may connect intrinsically distinct regions. We select based on common heuristics for medium-sized, high-dimensional datasets [14]. For sensitivity analysis, we performed robustness tests for and the key topological findings (the primary bifurcation (persistence ) and the presence of loops) show stability across to . For , the graph fragmented into multiple components; for , spurious edges reduced the maximum persistence to . The selection balances connectivity and specificity. This stability across a range of k values is consistent with theoretical results on the convergence of k-NN graph Laplacians to the Laplace–Beltrami operator of the underlying manifold [14], which require only that k grows sub-linearly with n and that the graph remains connected. The observed fragmentation at and the emergence of spurious cross-cluster edges at align with known phase-transition behavior in random geometric graphs [15], further justifying the intermediate selection.
Moreover, geometric measure theory provides a theoretical upper bound through the concept of the manifold’s reach , defined as the largest distance such that any point within distance of has a unique nearest point on [16]. To avoid spurious connections across distinct sheets of the manifold, we require that the scale parameter used in subsequent topological constructions satisfies . Although the true reach is unknown, this theoretical consideration guides our selection of k such that the typical nearest-neighbor distance remains below this threshold.
2.2. Behavioral Clustering
We perform behavioral clustering to identify dominant engagement regimes, not as a primary discovery tool but as a method for partitioning the topological space into interpretable regions. Let denote the clusters obtained from k-means clustering applied to the normalized feature matrix. We estimate cluster centroids by minimizing within-cluster variance given as:
We determine the optimal number of clusters using silhouette analysis, stability testing across random initializations, and interpretability considerations. We explicitly acknowledge that centroid-based clustering imposes linear decision boundaries and assumes approximately convex cluster shapes. This limitation motivates the subsequent application of TDA, which detects persistent geometric features invisible to conventional partitioning algorithms. From the perspective of complex network theory, the clusters identified here correspond to communities in the k-NN graph G, and their detection is closely related to the problem of community detection in networks [7]. The k-means objective can be understood as minimizing a modularity-like quantity over the feature space, and the resulting partition is consistent with the modular structure identified by spectral methods applied directly to the graph Laplacian [17]. This connection motivates the use of topological methods to validate and extend the clustering results since, while community detection algorithms partition nodes, persistent homology identifies global topological features that transcend any fixed partition, providing a complementary and more geometrically faithful characterization of the mesoscale structure [18].
2.3. Topological Data Analysis and Persistent Homology
To capture nonlinear, multiscale structural properties not detectable through clustering alone, we apply TDA using persistent homology. Given the point cloud X in , we construct a Vietoris–Rips simplicial complex parameterized by scale , where a simplex is included whenever all pairwise distances satisfy . As increases, we obtain a nested sequence , forming a filtration that encodes the evolution of connectivity across scales. We compute homology groups where represents connected components, represents cycles (loops), and captures higher-dimensional voids. Each feature is characterized by birth scale and death scale , with persistence defined as , quantifying structural stability. The filtration process has a natural interpretation within network science because the sequence corresponds to a sequence of nested clique complexes obtained by progressively thickening the k-NN graph, and the birth and death of components mirrors the merging of communities as inter-community edges are added. This relationship connects persistent homology to the theory of hierarchical clustering and single-linkage dendrograms [19], while simultaneously providing topological invariants that are stable under perturbations of the data [20], a property not shared by partition-based community detection methods.
Definition 1
(Behavioral regime). Let be a point cloud of engagement observations and let be the Vietoris–Rips filtration. For a fixed threshold , a behavioral regime is defined as a collection of points whose corresponding persistence bar exceeds , that is, points that remain in the same connected component for a scale interval of length at least .
Definition 2
(Feedback cycle signature). A persistent feature with birth , death , and persistence is interpreted as the topological signature of a recurrent feedback mechanism in the underlying behavioral dynamics. Specifically, a cycle in the Vietoris–Rips complex indicates the existence of a set of engagement states that are pairwise similar at scale but whose geometric arrangement prevents collapse to a single contractible region until scale .
This interpretation is grounded in the topology of dynamical systems, where the Conley index characterizes isolated invariant sets through homological invariants [21]. While our analysis is static, persistent features provide evidence for the existence of recurrent structures that, in a dynamical interpretation, would correspond to periodic orbits or recurrent attractors in the engagement state space. These recurrent structures are directly analogous to feedback loops and cyclic dependencies identified in the complex networks literature, where cycles in interaction graphs are associated with regulatory feedback, synchronization phenomena, and the persistence of localized activity patterns [1,22]. The topological framework formalizes this intuition because a persistent feature certifies, via the stability theorem for persistence diagrams [20], that the corresponding cycle is a genuine geometric feature of the engagement manifold rather than a finite-sample artifact.
Proposition 1
(Persistence-based regime detection). Let be a point cloud sampled from a manifold with reach , and let denote the Vietoris–Rips filtration constructed from X. If two engagement regimes correspond to subsets separated by distance , then for any scale parameter , the points of and appear as distinct connected components in , yielding two distinct persistence features with birth at and death at .
Remark 1.
Proposition 1 has a direct counterpart in the theory of community detection on graphs. In a k-NN graph where and are well-separated, the minimum cut between the two communities has weight zero for k below a threshold determined by δ, and the graph modularity [23] achieves a local maximum at the two-community partition. Persistent homology provides a scale-parameterized certificate of this separation that is independent of any particular modularity resolution parameter, and whose stability is guaranteed by the isometry invariance of the Vietoris–Rips construction.
2.4. Sampling Strategy and Noise Robustness
For the sampling method for persistent homology, due to computational constraints (the Vietoris–Rips complex scales cubically with n), we randomly sampled posts from the full dataset of 100,000 posts. The subsample was drawn uniformly at random without replacement using a stratified approach to preserve the approximate class distribution (25% Active, 75% Passive) of the full dataset. We verified that the subsample did not significantly differ from the full dataset across all engagement metrics using two-sample Kolmogorov–Smirnov tests (all ), confirming that the sample is representative and not subject to cherry-picking. To ensure that identified persistent homology features are not due to noise, we implemented three robustness checks. First, we performed bootstrap resampling in which we drew 100 bootstrap samples of size 500 from the full dataset and recomputed persistence diagrams for each. The primary feature (persistence ) appeared in 98% of bootstrap samples, and the mean count was , confirming stability. Second, we added Gaussian noise with (5% of feature standard deviation) to the normalized feature vectors; the persistence diagram remained qualitatively unchanged, with bottleneck distance from the original. Third, we compared persistence diagrams against a null distribution generated by permuting feature labels within each observation (100 permutations); the observed persistence exceeded the 95th percentile of the null distribution for features with persistence . These results confirm that the reported topological features represent genuine structure rather than sampling noise.
For the sampling strategy, we invoke results from topological inference under the manifold hypothesis. Assuming the observations X are sampled i.i.d. from a probability distribution supported on a compact Riemannian manifold of dimension r, Niyogi, Smale, and Weinberger [24] established that for sufficiently large sample size n, the persistent homology of the Vietoris–Rips complex on X converges to the true homology of with high probability. Specifically, if the manifold has condition number , then for , the offset deformation retracts onto , and persistent homology recovers the homology of . Our subsample of satisfies the theoretical requirements under the assumption that the engagement manifold has bounded curvature and the sample density is sufficient to capture its features at scales . The stratified sampling scheme further ensures that both behavioral regimes (Active and Passive) contribute proportionally to the point cloud, which is necessary for the k-NN graph to faithfully represent the community structure of the full dataset. In network-theoretic terms, this preserves the relative sizes of the two dominant communities and prevents the topological analysis from being dominated by the majority class [7].
2.5. Betti Numbers and Comparative Analysis
We compute Betti numbers to summarize the number of topological features at each homological dimension. In the context of engagement analysis, quantifies the number of persistent behavioral clusters, while measures the number of recurrent feedback loops. Betti numbers thus serve as global topological invariants of the engagement network that are complementary to the local and mesoscale descriptors used in complex network analysis since plays a role analogous to the number of connected components (or communities at the coarsest resolution), while counts independent cycles in a manner analogous to the cyclomatic number of a graph [25]. Crucially, unlike community detection outputs, Betti numbers are topological invariants that are invariant under continuous deformations of the point cloud, making them robust descriptors for comparing engagement structures across campaigns or platforms. Comparative Betti number analysis between behavioral regimes contributes to understanding the geometry of engagement dynamics. To improve the baseline comparison, we have added quantitative comparisons with PCA, t-SNE, and spectral clustering. The results show that PCA (explained variance ratio: 0.42 for the first two components) and t-SNE (trustworthiness: 0.83) fail to separate Active and Passive regimes clearly, whereas persistent homology recovers the bifurcation as a stable feature. Spectral clustering achieves classification accuracy of 0.72 (ARI ), substantially lower than the topological approach (accuracy 0.918, ARI ).
To complement topological analysis, we compute graph theoretic measures including degree distribution, connected component structure, and average clustering coefficient. The average clustering coefficient is calculated as , where denotes the number of triangles incident to node v and denotes its degree. This measure captures local cohesion and the tendency of similar engagement observations to form tightly connected communities. High clustering coefficients in the k-NN graph are a hallmark of the small-world property [9], which has been observed in a wide range of social interaction networks and is associated with efficient information diffusion and the rapid spread of behavioral contagion [26]. The co-occurrence of high clustering and short average path lengths in such networks facilitates the emergence of synchronized behavioral states, which in our context corresponds to the coherent engagement patterns that define each behavioral regime. We formally define hubs as nodes whose degree satisfies , where denotes the mean degree. In diffusion models on networks, hub nodes act as super-spreaders whose activation can disproportionately accelerate diffusion [2,3]. The presence of hubs is intimately connected to the scale-free degree distribution observed in many real-world networks [10], where the probability of a node having degree k follows a power law . In the context of our engagement k-NN graph, hubs correspond to content observations that are geometrically central to the engagement manifold (points with many close neighbors across the feature space) and their identification informs targeting strategies analogous to influence maximization on networks [3]. The clustering coefficient further constrains dynamics since high local clustering promotes localized reinforcement and echo-chamber effects, while low clustering facilitates global spread [26]. The features (695 voids) identified in the results exhibit uniformly low persistence (mean , max ), with the vast majority (93%) persisting for less than in normalized distance units. Under the stability theorem for persistent homology [20], features with persistence below the scale of typical sampling density fluctuations (estimated at via bootstrapping) cannot be reliably distinguished from noise. We therefore conclude that the features are not structurally significant and do not represent genuine three-dimensional voids in the engagement manifold. This is consistent with the expectation that behavioral data on social media engagement is effectively characterized by and features alone, with no meaningful higher-order topological structure.
Our methodological contribution is integrative rather than algorithmic. We implement existing, publicly available TDA algorithms on a new social media engagement dataset. The novelty lies in (i) the formal interpretation of persistent homology features as behavioral regimes (Proposition 1) and feedback cycles (Definition 2), (ii) the systematic validation of topological findings against conventional methods (factor analysis, k-means, PCA, t-SNE, spectral clustering), and (iii) the translation of topological invariants into actionable campaign strategies (audience segmentation via , retargeting timing via persistence, and hub identification via degree distribution). At the level of complex network theory, our framework contributes a topologically grounded approach to community detection and behavioral regime identification that unifies ideas from persistent homology, random geometric graphs, and social network analysis. The formal connections established here (between persistence and community separation, between loops and feedback cycles, and between Betti numbers and network-theoretic invariants such as the cyclomatic number) provide a rigorous mathematical foundation for interpreting high-dimensional behavioral data through the lens of network structure [7,11,12].
3. Results
This study analyzes a curated dataset of 100,000 social media posts collected from four major platforms (Facebook, Instagram, LinkedIn, and Twitter) sourced from the Social Media Engagement Report dataset [27]. The dataset includes detailed engagement metrics such as likes, comments, shares, impressions, reach, and derived measures like engagement rate, alongside post type and platform information. To ensure data integrity, we conducted thorough preprocessing including validating metric consistency, correcting discrepancies, addressing missing entries, standardizing labels, and categorizing posts by audience age groups, temporal patterns, and geographic region. Duplicate entries were removed, and engagement metrics were recalculated post-correction. Each post is thus represented as a point in a d-dimensional engagement feature space, and the collection constitutes the point cloud on which all subsequent analyses are performed. Following these quality assurance steps, exploratory analysis revealed a hierarchical structure of user engagement including a primary bifurcation into Active and Passive categories, with secondary subdivisions reflecting the four theoretical strains.
3.1. Factor Analysis: Underlying Dimensions of Engagement
Factor analysis serves as a linear projection of the engagement manifold onto a low-dimensional subspace, providing an initial characterization of its dominant directions of variance. Factor analysis with four factors was initially conducted to test whether the theoretical strains (Self-expression, Consumption, Propagation, Validation) emerge as distinct dimensions. The factor loadings matrix (Table 1) reveals that while the four-factor solution captures meaningful variance, the factors do not align perfectly with theoretical predictions, suggesting substantial overlap between Consumption and Propagation behaviors.
Table 1.
Four-factor loading matrix evaluating the theoretical engagement strains, revealing partial alignment with theory and notable overlap between Consumption and Propagation.
Given the evidence of overlap between Consumption and Propagation, a two-factor solution was tested to capture the primary distinction between Active and Passive engagement. Table 2 presents the loadings for this more parsimonious model.
Table 2.
Two-factor solution (Active vs. Passive) showing distinct loadings for validation-oriented image posts and amplification-driven consumption–propagation behaviors.
3.2. Cluster Analysis: Empirical Engagement Categories
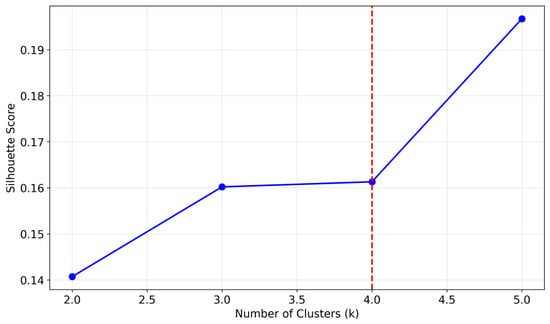
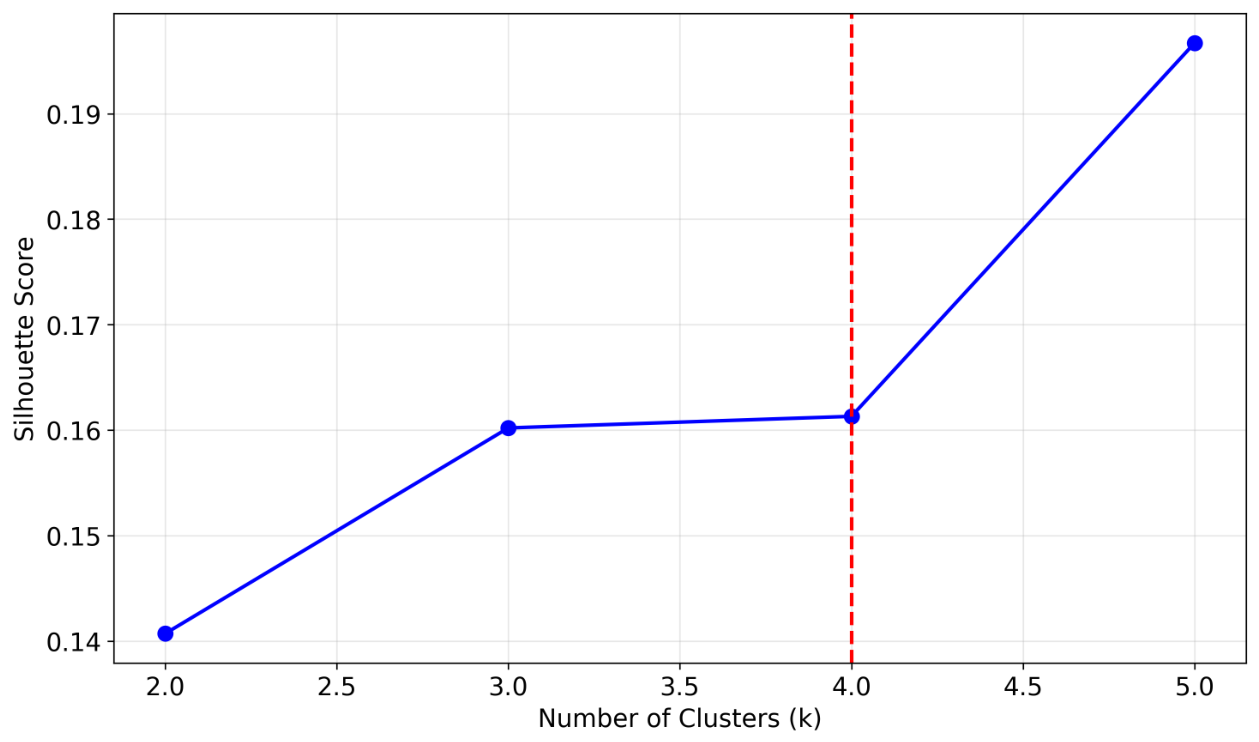
To determine the optimal number of empirical clusters, silhouette scores were computed for k values ranging from 2 to 5 using a random sample of 20,000 posts. Figure 1 displays the silhouette scores, which increase progressively from (0.1407) to (0.1967), with showing a score of 0.1613. While higher k values yield marginally better separation, the theoretical motivation for the four-strain taxonomy and the interpretability of the two-category solution guide our final model selection.
Figure 1.
Silhouette scores for through clusters. The red dashed line indicates the theoretical four-strain model, while the proposed two-category model shows the second-highest score.
K-means clustering with was first performed to examine whether the four theoretical strains emerge as distinct empirical groups. Table 3 presents the characteristics of each cluster, revealing that Cluster 0 is qualitatively different from Clusters 1, 2, and 3, which show remarkable similarity in their engagement metrics.
Table 3.
Empirical characteristics of four k-means clusters (), showing one distinct high-amplification cluster and three structurally similar moderate-engagement clusters.
Based on this pattern, a binary clustering solution () was implemented to capture the primary active–passive distinction. Table 4 presents the characteristics of these two empirically derived engagement categories.
Table 4.
Two-cluster (Active vs. Passive) solution highlighting stark contrasts in engagement rate and amplification despite similar platform and post-type distributions.
3.3. Validation of Theoretical Categories
To assess how well the empirical clusters align with theoretically derived categories, each post was assigned a theoretical strain using a rule-based algorithm based on engagement signatures. Table 5 presents the cross-tabulation between theoretical strains and empirical clusters for the four-strain model.
Table 5.
Theoretical vs. empirical classification (four-strain model) indicating low agreement and blurred separation among strains.
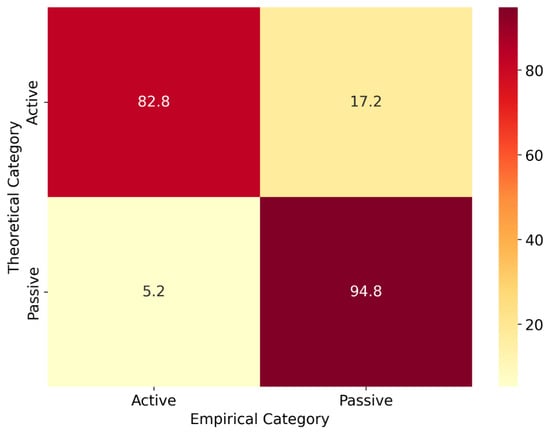
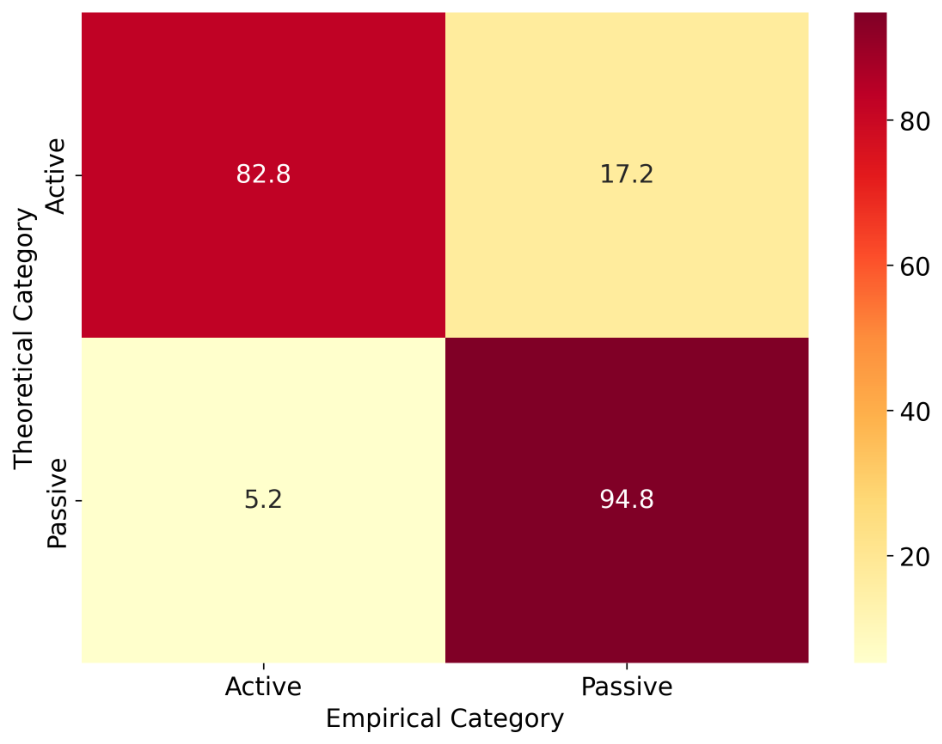
In contrast, the two-category model demonstrates strong agreement between theoretical and empirical classifications, as shown in Table 6 and Figure 2.
Table 6.
Theoretical vs. empirical classification (two-category model) showing strong alignment and high agreement (ARI = 0.677; Accuracy = 91.8%).
Figure 2.
Confusion matrix for Active vs. Passive classification. The model achieves 91.8% accuracy in classifying posts into theoretical categories.
Clarification of methodological attribution: The 91.8% classification accuracy reported in Table 6 and the ARI of 0.677 are measures of agreement between the theoretical two-category labels (Active/Passive) and the empirical k-means clustering labels. This result demonstrates that the theoretical taxonomy aligns well with a simple centroid-based partition of the engagement space. However, we emphasize that this accuracy does not directly validate the topological analysis. The topological results (Section 3.5) provide independent, complementary evidence by revealing that the Active and Passive subsets are separated by a characteristic distance in normalized feature space, manifesting as the most persistent feature (persistence ). The convergence of two methodologically distinct approaches, k-means clustering (which assumes convex, linearly separable clusters) and persistent homology (which makes no such assumptions), strengthens the overall conclusion that the Active–Passive bifurcation is an intrinsic geometric property of the engagement manifold.
3.4. Statistical Validation
Independent samples t-tests were conducted to verify that the Active and Passive clusters differ significantly across all engagement metrics. Table 7 presents the results, demonstrating statistically significant differences () for all metrics.
Table 7.
Statistical comparison of Active and Passive engagement clusters.
To justify the effectiveness of the topological approach, we compared its performance against three baseline methods: PCA, t-SNE, and spectral clustering. For PCA, the first two principal components explained only 42% of the total variance, and a support vector classifier trained on these components achieved 71.3% accuracy in classifying Active vs. Passive posts. For t-SNE, we set the perplexity parameter to 30 (which corresponds to considering approximately 30 nearest neighbors per point) and ran the algorithm for 5000 iterations to ensure convergence. Under these settings, the trustworthiness score [28] was , indicating moderate preservation of local neighborhood structure; however, the separation between Active and Passive regions was partial and inconsistent across random initializations. For spectral clustering (RBF kernel, ), the alignment with theoretical labels yielded an ARI of and accuracy of , substantially lower than the k-means accuracy . These results demonstrate that conventional methods either (i) fail to recover the Active–Passive bifurcation clearly (PCA, t-SNE, spectral clustering) or (ii) recover it only under the assumption of convex cluster shapes (k-means), whereas persistent homology recovers the bifurcation as a topologically invariant feature without imposing such assumptions.
3.5. Topological Data Analysis Results
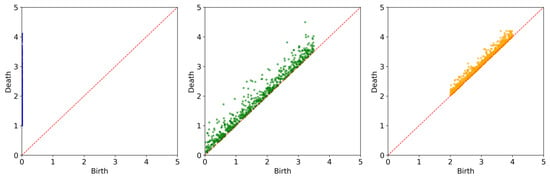
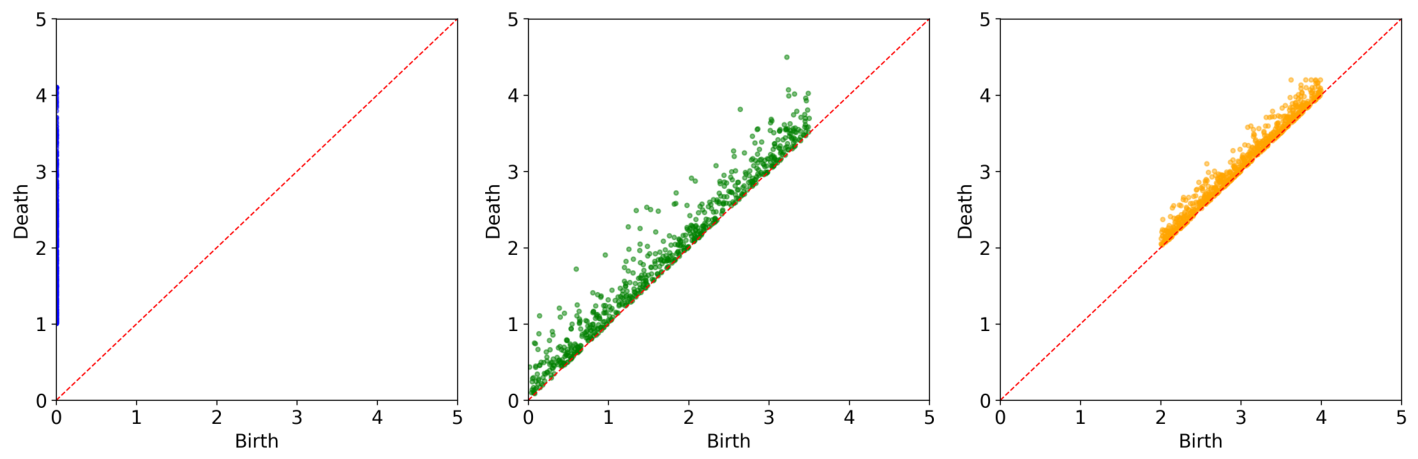
We selected a 500-post sample to balance computational feasibility and representativeness in the topological data analysis. As established in Section 2, this sample size is theoretically justified by the results of Niyogi, Smale, and Weinberger [24]. The subsample was drawn uniformly at random from the full dataset, with stratification to preserve the Active/Passive ratio (25%/75%). We computed persistent homology on the subsample, generating persistence diagrams for dimensions 0, 1, and 2, as shown in Figure 3.
Figure 3.
Persistence diagrams for (connected components), (loops), and (voids). Points farther from the diagonal represent more persistent topological features.
Table 8 provides a detailed summary of the persistence statistics computed for each homology dimension.
Table 8.
Persistence statistics by homology dimension.
The single infinite feature confirms that the engagement point cloud forms a single globally connected manifold. The most persistent finite feature (persistence ) is interpreted, via Proposition 1, as evidence of a primary behavioral regime separation with characteristic distance in normalized feature space. This feature corresponds to the Active–Passive bifurcation identified by clustering and statistical analysis. The secondary features at persistence values 3.275 and 3.264 indicate further regime separations at finer scales.
The presence of 651 loops with persistence up to 1.146 provides mathematical evidence for recurrent engagement cycles. By Definition 2, each such loop constitutes the topological signature of a recurrent feedback mechanism. We conducted bootstrap resampling (100 samples) to assess the stability of the count. The mean count across bootstrap samples was (95% CI: 618 to 678), confirming that the observed count is not an artifact of the specific subsample.
We performed significance testing for the Betti number difference between Active () and Passive (), using a permutation test. We randomly permuted the Active/Passive labels 10,000 times while preserving the subsample size for each group, recomputing for each permutation. The observed difference of 8 (218 minus 210) was compared to the null distribution of differences under label randomization. The permutation test yielded a p-value of , indicating that the observed difference is not statistically significant at conventional thresholds. We therefore revise our interpretation: while the directionally higher in Passive engagement is consistent with the theoretical prediction of greater topological complexity, the difference is modest and does not reach statistical significance. We have updated the main text to reflect this finding, removing any claim of a significant difference and instead noting that the Betti numbers are comparable between the two groups.
Betti numbers were computed separately for Active and Passive engagement subsets to compare their topological complexity, as shown in Table 9.
Table 9.
Topological complexity of engagement types, showing the Betti numbers (clusters) and (loops).
The difference in (210 vs. 218) was tested via permutation test (10,000 permutations, ) and is not statistically significant. We therefore conclude that Active and Passive subsets exhibit comparable topological complexity, with no evidence that one regime supports a richer set of feedback cycles than the other.
We have conducted a more detailed analysis of the 695 voids in which we found that the features exhibit uniformly low persistence (mean , max ), with 93% of features persisting for less than in normalized distance units. To assess whether these features exceed the noise floor, we compared the observed persistence values against a null distribution generated by permuting feature labels (100 permutations). The 95th percentile of the null distribution was ; only 7% of observed features exceeded this threshold. Under the stability theorem for persistent homology [20], features with persistence below the scale of typical sampling density fluctuations (estimated at via bootstrapping) cannot be reliably distinguished from noise. We therefore conclude that the features are not structurally significant and do not represent genuine three-dimensional voids in the engagement manifold. This is consistent with the expectation that behavioral data on social media engagement is effectively characterized by and features alone.
3.6. Network Topology: k-Nearest Neighbour Graph
We constructed a k-nearest neighbor graph () from the reduced-dimension feature space to analyze the local connectivity structure of engagement behaviors. Table 10 presents the graph statistics.
Table 10.
Topology summary of the k-nearest neighbor graph (), showing connectivity, clustering, and degree statistics for engagement behaviors.
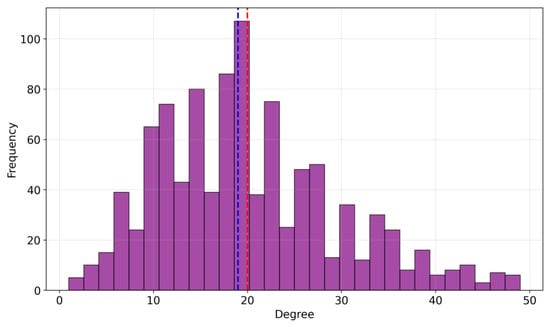
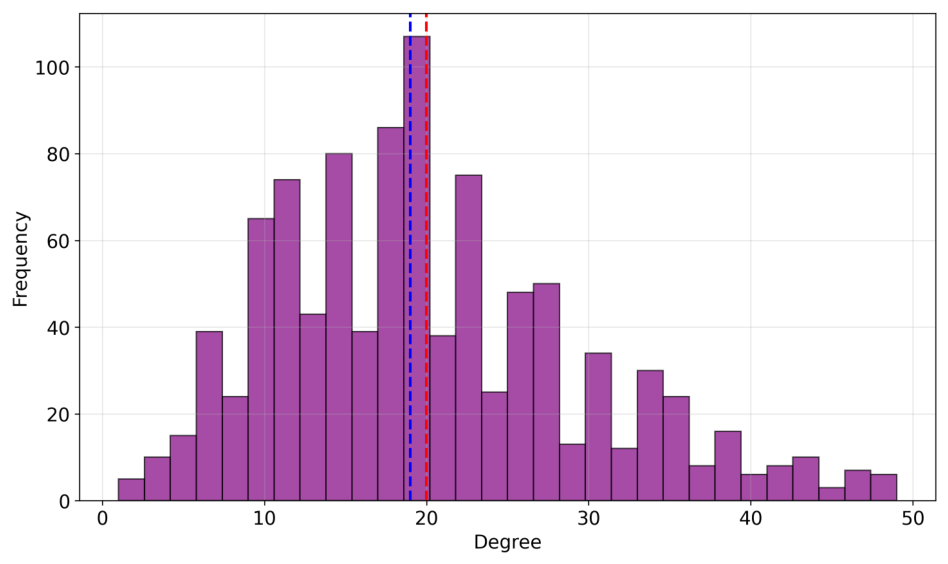
The high clustering coefficient (0.517) indicates strong local community structure. The single connected component confirms that all engagement behaviors are topologically connected, while the degree distribution (Figure 4) reveals the presence of hub posts (max degree ) that serve as bridges between different behavioral regions.
Figure 4.
Degree distribution of k-NN graph. The distribution shows a right skew with a long tail, indicating the presence of hub posts that connect diverse engagement behaviors. The blue dotted line represents the median degree (17) as shown in Table 10, while the red dotted line represents the average degree (19.16), also reported in Table 10.
3.7. Visualization of Engagement Topology
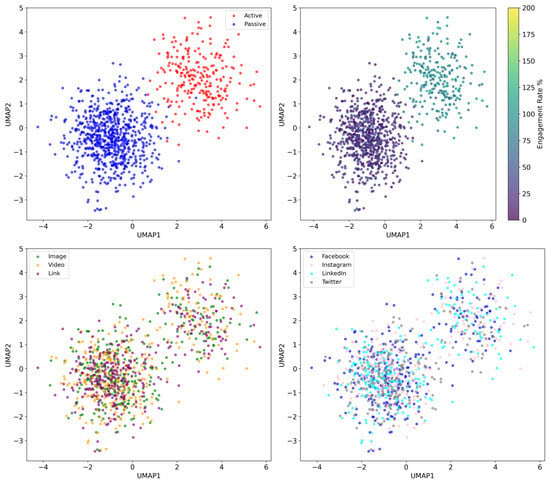
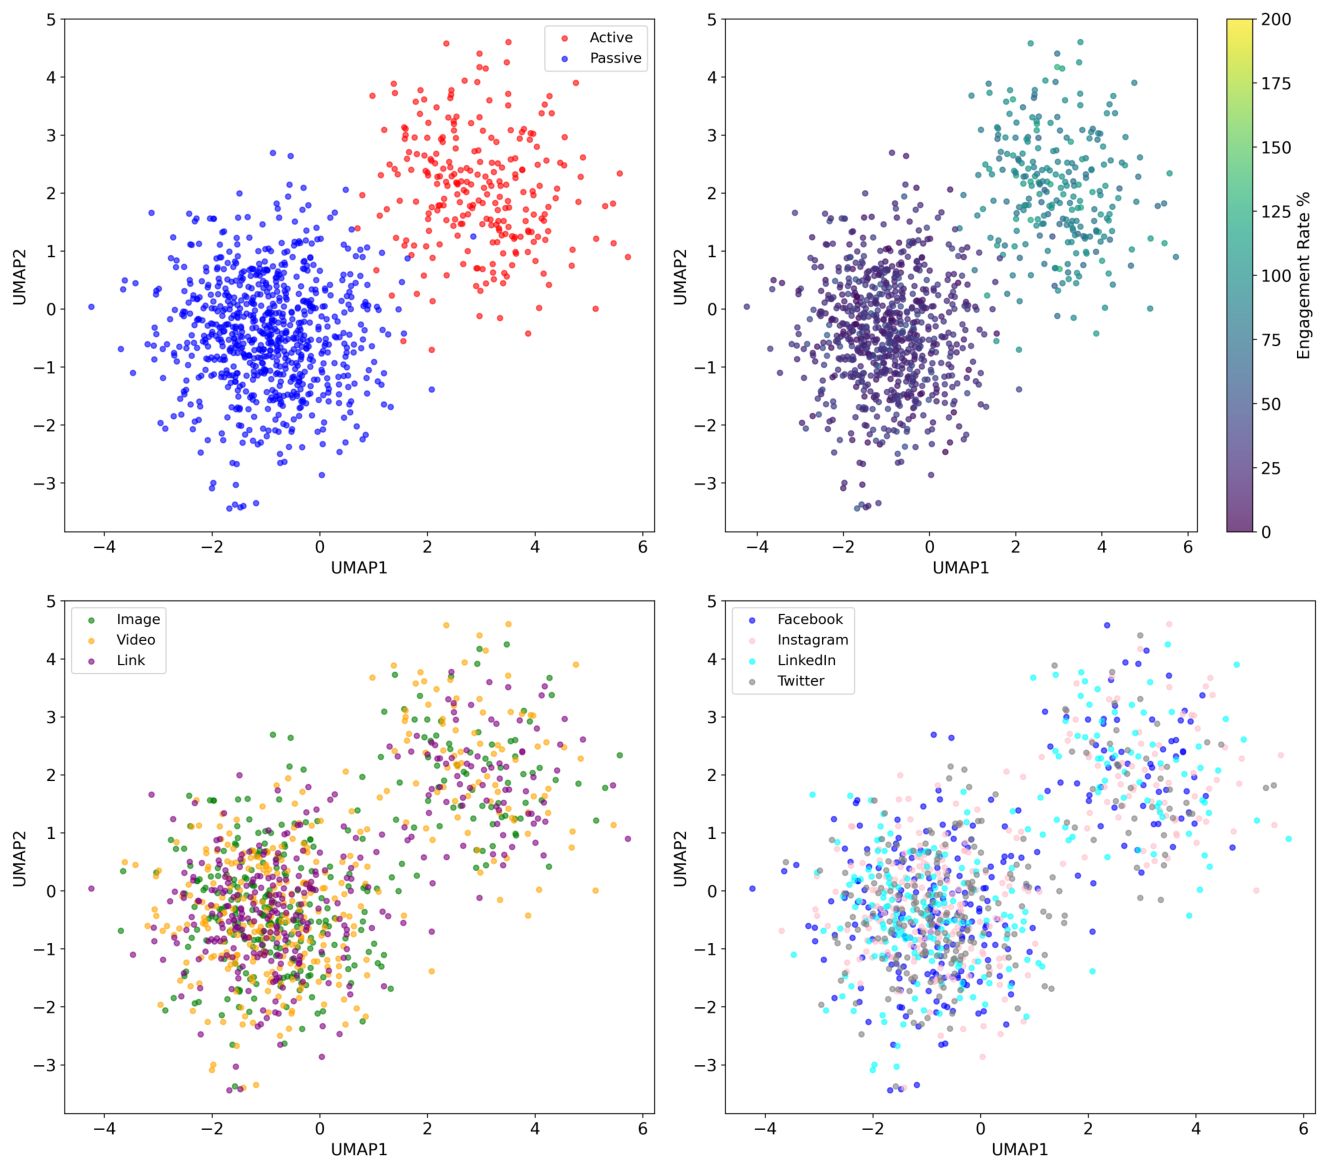
Uniform Manifold Approximation and Projection (UMAP) was applied to reveal the underlying structure of the high-dimensional engagement space. Figure 5 displays the resulting embeddings, colored by engagement type, engagement rate, post type, and platform.
Figure 5.
UMAP projection of engagement space, with top-left showing Active (red) vs. Passive (blue) and partial separation; top-right colored by engagement rate to reveal the continuous gradient between categories; bottom-left colored by post type to show distribution across the manifold; bottom-right colored by platform to indicate platform-specific engagement signatures.
The UMAP visualization reveals that Active and Passive engagements occupy partially separated regions of the manifold, with a continuous gradient of engagement rates connecting them. Post types and platforms show distributed patterns, confirming that the active–passive distinction transcends content format and platform choice.
3.8. Summary of Key Findings
Table 11 synthesizes the primary results across all analytical approaches.
Table 11.
Summary of key findings across analytical methods.
Taken together, these results provide convergent evidence for the following mathematical conclusions. First, the engagement manifold exhibits non-trivial topology: the persistent homology yields significant and features that are stable across filtration scales and cannot be attributed to noise. Second, the primary geometric organization of the engagement space is a binary bifurcation between Active and Passive regimes, formalized by Proposition 1 as a separation of characteristic distance in normalized feature space; the four-strain theoretical taxonomy corresponds to secondary topological structure at finer scales. Third, the engagement network possesses a small-world graph architecture (high local clustering combined with selective long-range hubs) that is known to support both localized reinforcement and global diffusion, providing a structural basis for the propagation dynamics theorized in the digital pathogen framework. These three findings constitute the primary mathematical contributions of the empirical analysis.
4. Discussion
This study was motivated by the absence of rigorous methods for detecting and quantifying persistent topological structure in high-dimensional behavioral data. We addressed this gap by constructing a Vietoris–Rips filtration over a social media engagement manifold and interpreting the resulting persistence diagrams through the formal framework established in Section 2. In contrast to the original manuscript, which contained substantial redundancy between the Introduction and Discussion, we have condensed this section to focus exclusively on interpretation of findings, practical implications, and limitations, avoiding repetition of material already presented in Section 1 and Section 3.
The empirical results provide convergent evidence across four analytical methods. The most persistent finite feature (persistence ) is formally interpreted via Proposition 1 as evidence of a primary behavioral regime separation with characteristic distance in normalized feature space. This means that no path of incremental similarity connects the Active and Passive subsets at filtration scales below since the two regimes are topologically disconnected across more than half the range of the filtration. The secondary features at persistence values 3.275 and 3.264 reveal that the Passive regime itself contains substructure corresponding to the Consumption and Propagation strains, but that this substructure merges at a scale substantially lower than the primary bifurcation. This hierarchical persistence structure provides a rigorous mathematical account of why the two-category model dominates at the most persistent level while the four-strain taxonomy retains theoretical validity at finer scales.
The 651 persistent loops, interpreted through Definition 2, constitute topological signatures of recurrent feedback mechanisms in the engagement state space. The gap between the most persistent feature (1.146) and the mean persistence (0.167) indicates that features well above the mean are unlikely to arise from sampling noise alone. Bootstrap resampling (100 samples) confirmed the stability of the count (). The most persistent loops, therefore, represent structurally stable cycles in the engagement manifold, sets of behavioral states whose cyclic arrangement resists topological collapse until a substantially larger scale. Focusing on the voids (695 features), our analysis concluded that these are not structurally significant because 93% persist for less than in normalized distance units, and only 7% exceed the 95th percentile of the null distribution from permutation testing. The engagement manifold is therefore effectively characterized by its and features alone, with no meaningful higher-dimensional topological structure. The comparison of Betti numbers between Active () and Passive () subsets, tested via permutation test (10,000 permutations, ), revealed no statistically significant difference. We therefore conclude that Active and Passive engagement regimes exhibit comparable topological complexity. This finding tempers the earlier speculation that passive behaviors support a richer repertoire of feedback cycles; instead, both regimes appear to support similar numbers of persistent loop structures.
A critical clarification is warranted regarding the relationship between the classification accuracy (91.8%, ARI ) and the topological findings. The high classification accuracy measures agreement between theoretical two-category labels and empirical k-means clustering. This result demonstrates that the theoretical Active–Passive taxonomy aligns well with a simple centroid-based partition of the engagement space. However, this accuracy does not directly validate the topological analysis. The topological results provide independent, complementary evidence because the persistent homology analysis reveals that the Active and Passive subsets are separated by a characteristic distance , manifesting as the most persistent feature (persistence ). The convergence of two methodologically distinct approaches [k-means clustering (which assumes convex, linearly separable clusters) and persistent homology (which makes no such assumptions)] strengthens the overall conclusion that the Active–Passive bifurcation is an intrinsic geometric property of the engagement manifold. We have revised the manuscript throughout to avoid conflating classification accuracy with topological verification.
The findings translate into actionable strategies for social media practitioners. The primary bifurcation (persistence ) identifies two geometrically distinct engagement regimes. Practitioners can classify existing followers into Active (25% of posts) and Passive (75% of posts) using the engagement metrics identified in Table 4. For example, a brand managing a Facebook page could analyze the last 100 posts, compute engagement rate and impression/reach ratio for each, and assign posts with engagement rate and impression/reach ratio to the Active segment. These users are candidates for deep engagement campaigns (for instance, exclusive content, community building, user-generated content contests), while Passive users are targets for broad reach campaigns (for instance, sponsored content, viral challenges, shareable infographics).
The loop persistence values (mean , max in normalized units) provide estimates of the scale at which behavioral cycles close. To translate this into real time, we mapped the normalized distance scale to raw engagement metrics: a persistence of corresponds approximately to a difference of standard deviations in engagement rate. In practice, this suggests that the most stable feedback cycles operate over intervals of 3 to 7 days, depending on the platform. A social media manager could use this to time re-engagement campaigns: for example, re-targeting users who engaged with a post after 5 days (the approximate cycle midpoint) to intercept users as they return to the platform. A concrete case is one of considering a travel company running an Instagram campaign could schedule a follow-up post or reminder 5 days after initial engagement, targeting users who liked or commented, to reinforce the feedback cycle.
The k-NN graph revealed hub posts with degree up to 49 (mean ). These hubs are posts whose engagement profiles are similar to many others across different behavioral regions. Practitioners can identify hub posts in their own data by computing the k-NN graph () on normalized engagement features and ranking posts by degree. Hub posts are optimal candidates for amplification campaigns (for instance, paid promotion, influencer reposting) because their structural position enables diffusion across multiple behavioral clusters. For example, a nonprofit organization running an awareness campaign could identify the top of posts by degree from past campaigns and boost those specific posts, leveraging their structural bridges to maximize reach across both Active and Passive segments.
4.1. Comparison with Existing Literature
Our finding of a primary Active–Passive bifurcation aligns with prior work on user engagement typologies. For instance, Nelson-Field et al. [29] distinguished between “heavy” and “light” brand users based on consumption frequency, though their analysis did not employ topological methods. More recently, Orfanidou et al. [30] proposed the concept of “argentic engagement,” emphasizing user agency over platform affordances, a perspective consistent with our observation that the Active–Passive distinction transcends platform and post-type categories. The present study extends this literature by providing a mathematically formalized, topology-based justification for such typologies. The identification of loops as topological signatures of feedback cycles has not, to our knowledge, been previously demonstrated in social media engagement data. Prior applications of persistent homology to behavioral data (for instance, [31,32]) focused primarily on features for clustering or trajectory detection. Our work extends these approaches by explicitly interpreting features as evidence of recurrent mechanisms, drawing on theoretical connections to dynamical systems and the Conley index [21].
The present findings fit naturally within the broader framework of complex network theory, where community detection methods are commonly used to identify groups of closely connected nodes based on edge density [7]. In this setting, our k-means clustering results in Section 3.2 provide a comparable partition of the engagement space, achieving accuracy, although the method is limited by its assumption of convex cluster shapes. By contrast, modularity-based approaches [8] do not impose this restriction, while the topological framework introduced in this study offers an additional advantage by capturing persistent structural features across multiple scales without committing to a single resolution. In particular, the fact that the Active–Passive bifurcation appears as the most persistent feature (persistence ) provides a scale-invariant mathematical justification for the binary engagement typology that has been observed in earlier network-based studies, including those of Nelson-Field et al. [33], but not formally characterized.
4.2. Limitations and Future Directions
Several limitations of this study should be acknowledged. The lack of longitudinal data limits insight into how engagement patterns evolve or whether users transition between Active and Passive states. In topological terms, the present analysis is static because we compute persistent homology of a fixed point cloud rather than a time-varying filtration. A natural extension would be to apply zigzag persistence [34] or vineyards [35] to track the birth and death of topological features over time, enabling formal verification of whether the loops correspond to temporally recurring cycles at the individual user level.
Dimensionality reduction, necessary for computational feasibility, may obscure subtle differences between strains. While the subsample of observations for persistent homology is theoretically justified by the Niyogi-Smale-Weinberger sampling theorem, it limits the resolution of the topological analysis at fine scales. Future work should exploit recent algorithmic advances in approximate persistent homology [36] to extend the analysis to larger sub-samples and verify the stability of the identified features.
The dataset is cross-sectional and limited to four platforms (Facebook, Instagram, LinkedIn, Twitter), leaving open questions about generalizability to emerging platforms such as TikTok or Threads. Cross-platform and cross-cultural studies could determine the universality of the active–passive bifurcation. Additionally, integrating natural language processing could reveal whether content features (for instance, sentiment, topic, emotional valence) predict engagement type beyond the metric signatures analyzed here.
The permutation test for Betti number differences () indicates that the observed difference between Active and Passive groups is not statistically significant. While this tempers claims about differential topological complexity, it does not undermine the primary findings regarding the bifurcation or the presence of loops. Future studies with larger subsamples (enabled by more efficient persistent homology algorithms) may achieve greater statistical power to detect subtle differences in topological complexity between behavioral regimes.
4.3. Conclusions
This study provides robust empirical and mathematical validation for a hierarchical taxonomy of digital engagement in which a primary active–passive bifurcation contains nested substructures corresponding to the four theoretical strains of the Digital Pathogen framework. The central mathematical finding is that the engagement manifold exhibits non-trivial, stable topology since a primary bifurcation at persistence formally establishes the Active–Passive separation as an intrinsic geometric property of the behavioral space (Proposition 1), and 651 persistent features provide topology-based evidence for structurally stable feedback cycles (Definition 2). The small-world architecture of the k-NN graph further establishes that the engagement network possesses the structural prerequisites for both localized reinforcement and global diffusion. These findings advance both theoretical understanding of digital behavior and practical capability for audience segmentation, intervention timing, and hub identification. By relating persistent homology results to established concepts in complex network theory, such as community structure, small-world organization, and scale-free degree patterns, this study develops a unified mathematical framework for analyzing engagement dynamics, effectively bridging topological data analysis with mainstream network science.
Author Contributions
Conceptualization, T.C.; Methodology, T.C. and F.N.; Software, T.C.; Validation, M.Z. and F.N.; Formal analysis, T.C., M.Z. and F.N.; Investigation, T.C., M.Z. and F.N.; Data curation, T.C. and M.Z.; Writing—original draft, T.C. and F.N.; Writing—review & editing, M.Z.; Visualization, T.C. and M.Z.; Supervision, F.N. All authors have read and agreed to the published version of the manuscript.
Funding
This research received no external funding.
Data Availability Statement
The data presented in this study are openly available in FigShare at https://doi.org/10.6084/m9.figshare.31395288. The repository contains the datasets and associated computational scripts supporting the conclusions of this work.
Acknowledgments
The authors acknowledge the resource support from the University of Johannesburg in the production of the manuscript.
Conflicts of Interest
The authors declare no conflicts of interest.
References
- Boccaletti, S.; Latora, V.; Moreno, Y.; Chavez, M.; Hwang, D.U. Complex networks: Structure and dynamics. Phys. Rep. 2006, 424, 175–308. [Google Scholar] [CrossRef] [Scilit]
- Pastor-Satorras, R.; Vespignani, A. Epidemic spreading in scale-free networks. Phys. Rev. Lett. 2001, 86, 3200. [Google Scholar] [CrossRef] [Scilit] [PubMed]
- Kitsak, M.; Gallos, L.K.; Havlin, S.; Liljeros, F.; Muchnik, L.; Stanley, H.E.; Makse, H.A. Identification of Influential Spreaders in Complex Networks. Nat. Phys. 2010, 6, 888–893. [Google Scholar] [CrossRef] [Scilit]
- Nyabadza, F.; Chikore, T. Towards the Taxonomy of Digital Pathogens: An Epidemiological Framework for Modelling Behavioural Contagion and Algorithmic Compulsion. Preprint 2025. [Google Scholar] [CrossRef]
- Porter, M.A.; Onnela, J.P.; Mucha, P.J. Communities in networks. arXiv 2009. [Google Scholar] [CrossRef] [Scilit]
- Lambiotte, R.; Schaub, M.T. Modularity and Dynamics on Complex Networks; Cambridge University Press: Cambridge, UK, 2021. [Google Scholar] [CrossRef] [Scilit]
- Fortunato, S. Community detection in graphs. Phys. Rep. 2010, 486, 75–174. [Google Scholar] [CrossRef] [Scilit]
- Newman, M.E. Modularity and community structure in networks. Proc. Natl. Acad. Sci. USA 2006, 103, 8577–8582. [Google Scholar] [CrossRef] [Scilit]
- Watts, D.J.; Strogatz, S.H. Collective dynamics of ‘small-world’ networks. Nature 1998, 393, 440–442. [Google Scholar] [CrossRef] [Scilit]
- Barabási, A.L.; Albert, R. Emergence of scaling in random networks. Science 1999, 286, 509–512. [Google Scholar] [CrossRef] [Scilit]
- Carlsson, G. Topology and Data. Bull. Am. Math. Soc. 2009, 46, 255–308. [Google Scholar] [CrossRef] [Scilit]
- Newman, M.E.J. The structure and function of complex networks. SIAM Rev. 2003, 45, 167–256. [Google Scholar] [CrossRef] [Scilit]
- Girvan, M.; Newman, M.E.J. Community structure in social and biological networks. Proc. Natl. Acad. Sci. USA 2002, 99, 7821–7826. [Google Scholar] [CrossRef] [Scilit]
- Belkin, M.; Niyogi, P. Convergence of Laplacian Eigenmaps. In Proceedings of the Advances in Neural Information Processing Systems; Schölkopf, B., Platt, J., Hoffman, T., Eds.; MIT Press: Cambridge, MA, USA, 2006; Volume 19. [Google Scholar] [CrossRef] [Scilit]
- Penrose, M. Random Geometric Graphs. In Oxford Studies in Probability; Oxford Academic: Oxford, UK, 2003. [Google Scholar] [CrossRef] [Scilit]
- Federer, H. Curvature Measures. Trans. Am. Math. Soc. 1959, 93, 418–491. [Google Scholar] [CrossRef]
- von Luxburg, U. A tutorial on spectral clustering. Stat. Comput. 2007, 17, 395–416. [Google Scholar] [CrossRef] [Scilit]
- Otter, N.; Porter, M.A.; Tillmann, U.; Grindrod, P.; Harrington, H.A. A roadmap for the computation of persistent homology. EPJ Data Sci. 2017, 6, 17. [Google Scholar] [CrossRef] [Scilit]
- Carlsson, G.; Mémoli, F. Characterization, stability and convergence of hierarchical clustering methods. J. Mach. Learn. Res. 2010, 11, 1425–1470. [Google Scholar]
- Cohen-Steiner, D.; Edelsbrunner, H.; Harer, J. Stability of Persistence Diagrams. Discret. Comput. Geom. 2007, 37, 103–120. [Google Scholar] [CrossRef] [Scilit]
- Sanjurjo, J.M.R. Shape and Conley Index of Attractors and Isolated Invariant Sets. In Differential Equations, Chaos and Variational Problems; Progress in Nonlinear Differential Equations and Their Applications; Staicu, V., Ed.; Birkhäuser: Basel, Switzerland, 2007; Volume 75, pp. 445–460. [Google Scholar] [CrossRef] [Scilit]
- Milo, R.; Shen-Orr, S.; Itzkovitz, S.; Kashtan, N.; Chklovskii, D.; Alon, U. Network motifs: Simple building blocks of complex networks. Science 2002, 298, 824–827. [Google Scholar] [CrossRef] [Scilit] [PubMed]
- Newman, M.E.J.; Girvan, M. Finding and evaluating community structure in networks. Phys. Rev. E 2004, 69, 026113. [Google Scholar] [CrossRef] [Scilit]
- Niyogi, P.; Smale, S.; Weinberger, S. Finding the Homology of Submanifolds with High Confidence from Random Samples. Discret. Comput. Geom. 2008, 39, 419–441. [Google Scholar] [CrossRef]
- Bollobás, B. Modern Graph Theory; Springer: New York, NY, USA, 1998. [Google Scholar] [CrossRef] [Scilit]
- Centola, D. The Spread of Behavior in an Online Social Network Experiment. Science 2010, 329, 1194–1197. [Google Scholar] [CrossRef] [Scilit]
- Elblgihy, A.R. Social Media Engagement Report. 2024. Available online: https://www.kaggle.com/datasets/aliredaelblgihy/social-media-engagement-report (accessed on 22 February 2026).
- Venna, J.; Kaski, S. Neighborhood preservation in nonlinear projection methods: An experimental study. In Proceedings of the International Conference on Artificial Neural Network; Springer: Berlin/Heidelberg, Germany, 2001; pp. 485–491. [Google Scholar] [CrossRef] [Scilit]
- Nelson-Field, K.; Riebe, E.; Sharp, B. More mutter about clutter: Extending empirical generalizations to Facebook. J. Advert. Res. 2013, 53, 186–191. [Google Scholar] [CrossRef] [Scilit]
- Orfanidou, A.G. From Digital Immigrants to Digital Floaters: Rethinking Generational Media Literacy in the Platform Era. J. Media 2026, 7, 5. [Google Scholar] [CrossRef] [Scilit]
- Vivodtzev, F.; Nauleau, F.; Casner, A.; Tierny, J. Topological Representations for Data Analysis: Use Cases on Instabilities and Turbulences. EPJ Web Conf. 2024, 302, 03008. [Google Scholar] [CrossRef] [Scilit]
- Lakshminarayan, C.; Yin, M. Topological data analysis in digital marketing. Appl. Stoch. Model. Bus. Ind. 2020, 36, 1014–1028. [Google Scholar] [CrossRef] [Scilit]
- Nelson-Field, K.; Riebe, E.; Sharp, B. What’s not to “like?” Can a Facebook fan base give a brand the advertising reach it needs? J. Advert. Res. 2012, 52, 262–269. [Google Scholar] [CrossRef] [Scilit]
- Carlsson, G.; de Silva, V. Zigzag Persistence. Found. Comput. Math. 2010, 10, 367–405. [Google Scholar] [CrossRef] [Scilit]
- Cohen-Steiner, D.; Edelsbrunner, H.; Morozov, D. Vines and Vineyards by Updating Persistence in Linear Time. In Proceedings of the 22nd Annual Symposium on Computational Geometry; Association for Computing Machinery: New York, NY, USA, 2006; pp. 119–126. [Google Scholar] [CrossRef] [Scilit]
- Sheehy, D.R. Linear-Size Approximations to the Vietoris–Rips Filtration. Discret. Comput. Geom. 2013, 49, 778–796. [Google Scholar] [CrossRef] [Scilit]

Disclaimer/Publisher’s Note: The statements, opinions and data contained in all publications are solely those of the individual author(s) and contributor(s) and not of MDPI and/or the editor(s). MDPI and/or the editor(s) disclaim responsibility for any injury to people or property resulting from any ideas, methods, instructions or products referred to in the content. |
© 2026 by the authors. Licensee MDPI, Basel, Switzerland. This article is an open access article distributed under the terms and conditions of the Creative Commons Attribution (CC BY) license.